. 2020 Mar 25;9:e52786. doi: 10.7554/eLife.52786

Figure 1. The fungal bioluminescence pathway creates auto-luminescence when transiently or stably expressed.

(A) Schematic of the chemical reactions driving the generation of auto-luminescence in planta. Caffeic acid produced by the phenylpropanoid biosynthesis pathway is converted to Hispidin by Hisps once it is post-translationally activated by NPGA. Hispidin is then converted to 3-Hydroxyhispidin, the luciferin molecule, by H3H. Finally, the luciferase Luz oxidizes 3-Hydroxyhispidin to a high energy intermediate which degrades into Caffeylpyruvic acid, producing light. CPH can turn Caffeylpyruvic acid back into Caffeic acid, closing the cycle. (B) An image in the dark with an eight minute exposure of a N. benthamiana leaf infiltrated with the FBP demonstrating auto-luminescence in the infiltrated zone. (C) An image in the light of the same leaf with the infiltrated zone marked with a black outline. (D) Bar plots representing background subtracted luminescence from N. benthamiana leaves infiltrated with either a functional FBP (yellow) or a broken control (gray) missing the luciferase, Luz, three days after infiltration (n = 12, p=0.0002 based on a T-test). Black bars represent standard deviation. (E) Bar plots representing background subtracted luminescence seven days after infiltration from N. benthamiana leaves infiltrated with FBPs that either have (pink) or do not have (gray) the CPH-based recycling pathway (n = 12, p=0.05 based on a T-test). Black bars represent standard deviation. (F, G) Bright field image (F) and luminescence signal (G) captured with a CCD camera of transgenic N. benthamiana plants with a stable integration of the FBP (FBP-6) into the genome. Warmer colors correspond to higher luminescence in accordance with the lookup table.

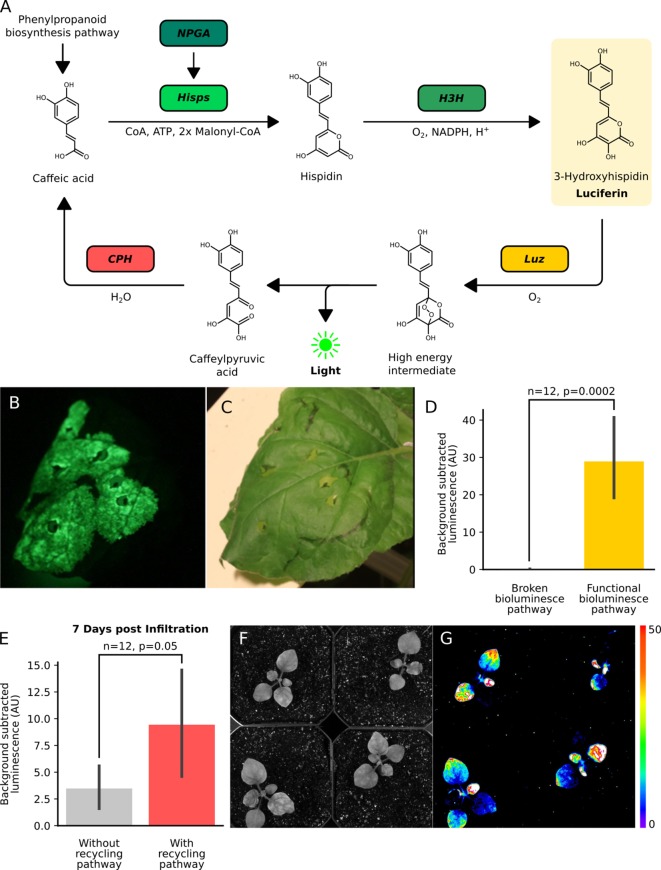
Figure 1—source data 1. Raw data for Figure 1—figure supplements 1 and 2.
Figure 1—source data 2. Raw data for Figure 1—figure supplements 1 and 2.
Figure 1—source data 3. Raw data for Figure 1—figure supplement 3.

Figure 1.

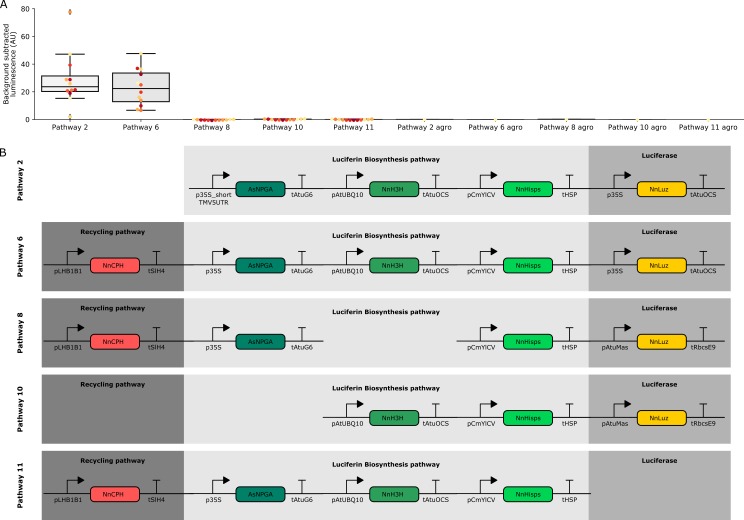
Figure 1—figure supplement 1. Characterization of luminescence from transient expression of different FBP pathway variants.

Figure 1—figure supplement 1.

(A) Box plots summarizing luminescence recorded from N. benthamiana leaves infiltrated with FBPs three days after infiltration. Each dot represents a reading from a different infiltrated leaf. The bars labeled agro are readings from confluent cultures of agrobacterium strains used to deliver the respective FBP. Pathway two is a functional pathway without CPH and pathway six is a functional pathway with CPH. Pathways 8,10 and 11 are all negative controls missing pathway enzymes. (B) Schematics of the expression cassettes assembled for each of the pathways characterized.
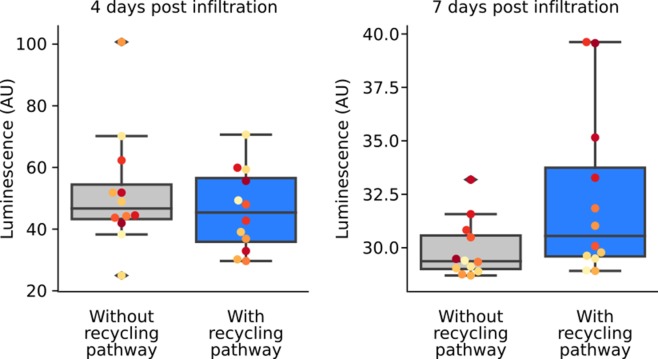
Figure 1—figure supplement 2. Inclusion of a caffeic acid recycling pathway in the FBP prolongs luminescence signal.

Figure 1—figure supplement 2.

Box plots representing luminescence from N. benthamiana leaves infiltrated an FBP that either with (blue) or without (gray) the CPH-based recycling pathway. Each dot represents a reading from a different infiltrated leaf. Data is from four days and seven days after infiltration.
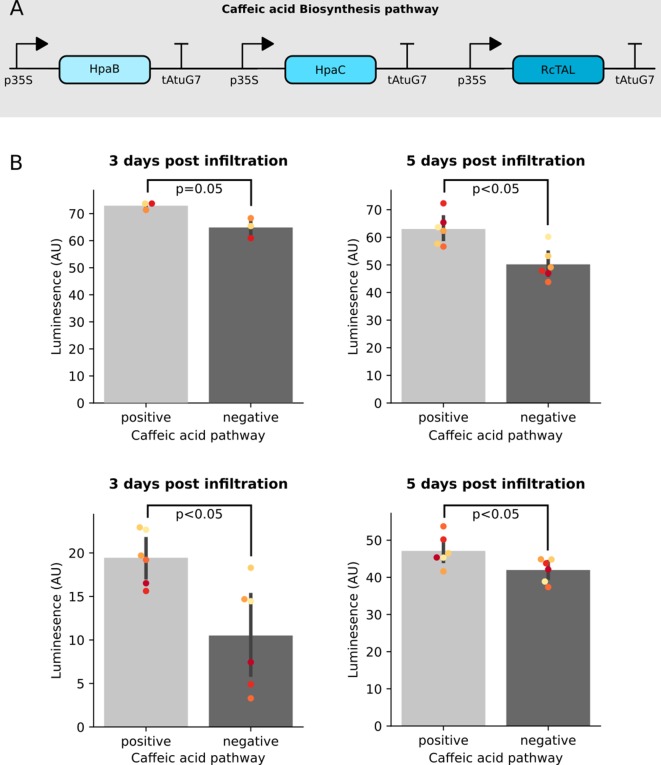
Figure 1—figure supplement 3. Co-expression of the Caffeic acid biosynthesis pathway with the FBP increases luminescence signal.

Figure 1—figure supplement 3.

(A) A schematic of the three enzyme pathway built and transiently expressed in an FBP6 stable transgenic line to enable biosynthesis of Caffeic acid from tyrosine. (B) Bar plots summarizing luminescence data from leaves of a transgenic line of N. benthamiana stably expressing FBP6 and infiltrated with agrobacterium to deliver either the caffeic acid biosynthesis pathway, or a control T-DNA. Each plot represents data collected from an independent biological replicate, where one side of the leaf was infiltrated with the caffeic acid pathway and the other was infiltrated with the control. The black bars represent standard deviation and the dots represent technical replicates. All p values were calculated using a T-test.
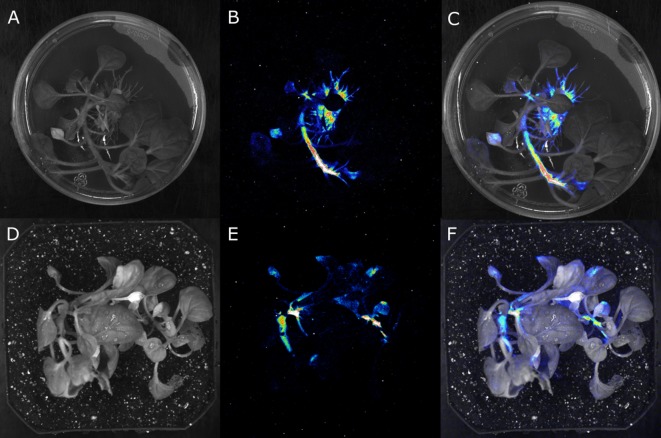
Figure 1—figure supplement 4. Stable integration of the FBP into the genome results in the creation of auto-luminescent plants.

Figure 1—figure supplement 4.

(A–F) Luminescence signal captured with a CCD camera (B,E), a bright field image of the same plant (A,D), and the two superimposed on each other (C,F), of a transgenic N. benthamiana plant with a stably integrated FBP on rooting media (A,B,C) and in soil (D,E,F). Warmer colors correspond to higher luminescence.