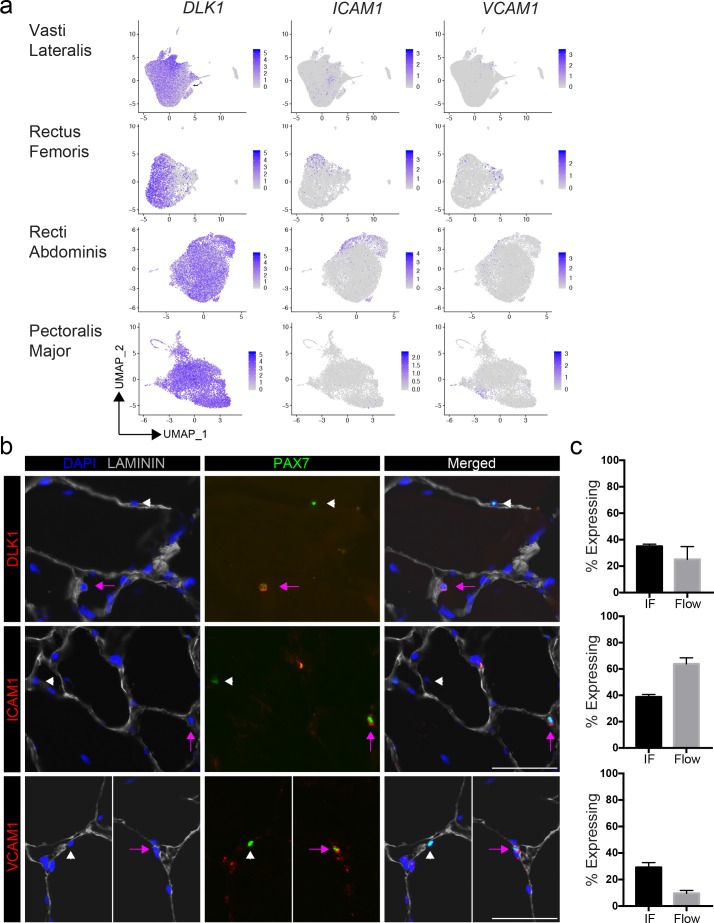
Figure 2. Validation of satellite cell clusters.
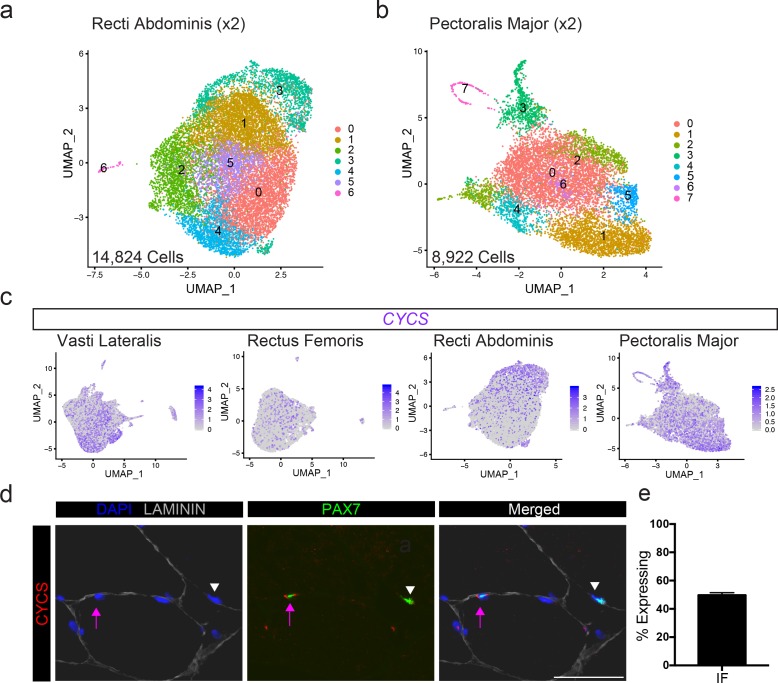
(a) Feature plots displaying localized gene expression for the genes DLK1, ICAM1, and VCAM1 within the 2D UMAP space of the eight combined vasti, the rectus femoris, the two combined rectus abdominis and the two combined pectoralis majors as shown in Figure 1b and Figure 1—figure supplement 2b, Figure 2—figure supplement 1a,b. Each dot represents a single cell. Deeper purple coloration represents increased expression. (b) Immunofluorescence staining of human satellite cells for validation markers within sections of human muscle. Pink arrows denote human satellite cells that are positive for the marker (scale, 50 µm). White arrowheads mark satellite cells that are negative for expression of the marker. (n = 3, biological replicates). (c) Bar plot displaying the quantification of DLK1, ICAM1, and VCAM1 expression of human satellite cells with both immunofluorescence staining and flow cytometry. (n = 3, biological replicates). Data presented as mean ± SEM.


