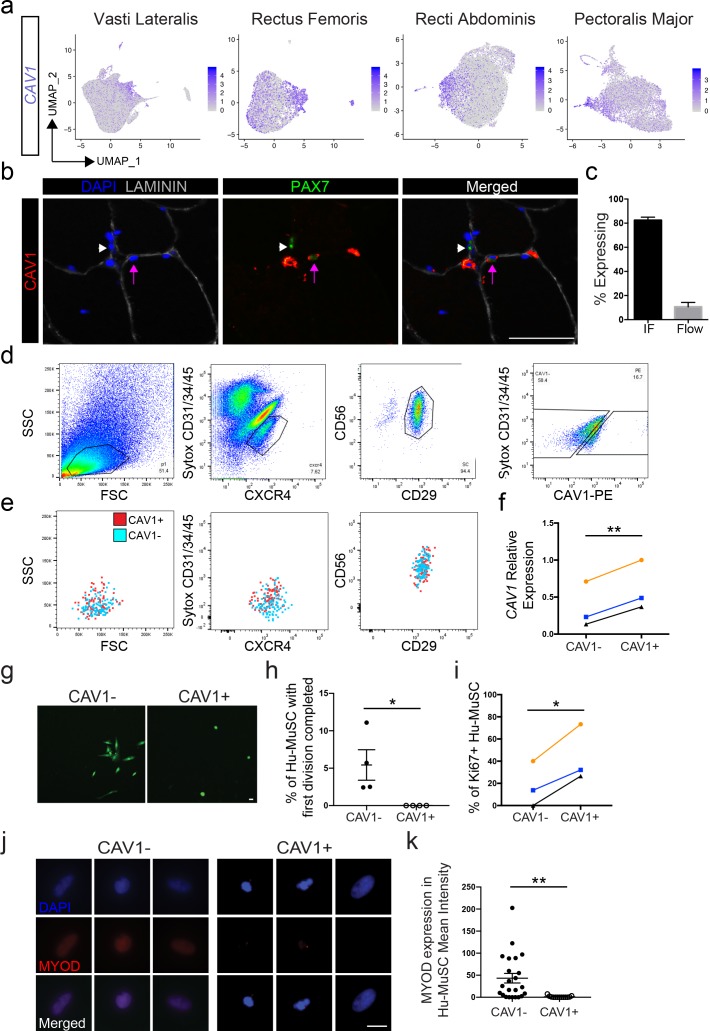
Figure 5. CAV1 high expressing human satellite cell phenotypes.
(a) Feature plots displaying localized CAV1 gene expression within the 2D UMAP space as shown in Figure 1b. Each dot represents a single cell. Deeper purple coloration represents increased expression. (b) Immunofluorescence staining of human satellite cells for CAV1 within sections of human muscle. Lavender arrows denote human satellite cells that are positive for the marker (scale, 50 µm). White arrowheads mark satellite cells that are negative for expression of the marker. (n = 3, biological replicates). (c) Bar plot displaying the quantification CAV1 expression of PAX7+ human satellite cells with both immunofluorescence staining and flow cytometry. (n ≥ 3, biological replicates). Data presented as mean ± SEM. (d) Representative flow cytometry profiles from the isolation of CXCR4/CD29/CD56 human satellite cells based on expression of CAV1. (e) Representative back-gating of CAV1+ (red) and CAV1- (blue) cells, demonstrating overlap of profiles within prior gates. (n = 3, biological replicates). (f). CAV1 gene expression in sorted CAV1- and CAV1+l satellite cells (n = 3, biological replicates) *p<0.05. (g) Morphology of sorted CAV1- and CAV1+ satellite cells stained with CellTracker Green 4.6 days after isolation (scale, 20µm). (h) Timelapse analysis to assess time to first division. Quantification of the percentage of cells dividing in the first 6 days after isolation (n = 4, biological replicates, *p<0.05, mean ± SEM). (i) Percentage of cells expressing Ki67 3 days after isolation (n = 3, biological replicates, *p<0.05). (j) Immunnofluorescence staining of MYOD 3 days after isolation (scale, 10 µm). (k) Quantification of MYOD expression at day 3 in vitro (n = 4, biological replicates, **p<0.01, mean ± SEM). Comparisons of CAV1+ and CAV1- satellite cells are from the same donor in each individual experiment.


