

Abstract
Objective
To investigate the pattern of progression of neurologic impairment in Friedreich ataxia (FRDA) and identify patients with fast disease progression as detected by clinical rating scales.
Methods
Clinical, demographic, and genetic data were analyzed from 54 patients with FRDA included at the Brussels site of the European Friedreich's Ataxia Consortium for Translational Studies, with an average prospective follow-up of 4 years.
Results
Afferent ataxia predated other features of FRDA, followed by cerebellar ataxia and pyramidal weakness. The Scale for the Assessment and Rating of Ataxia (SARA) best detected progression in ambulatory patients and in the first 20 years of disease duration but did not effectively capture progression in advanced disease. Dysarthria, sitting, and upper limb coordination items kept worsening after loss of ambulation. Eighty percent of patients needing support to walk lost ambulation within 2 years. Age at onset had a strong influence on progression of neurologic and functional deficits, which was maximal in patients with symptom onset before age 8 years. All these patients became unable to walk by 15 years after onset, significantly earlier than patients with later onset. Progression in the previous 1 or 2 years was not predictive of progression in the subsequent year.
Conclusions
The SARA is a sensitive outcome measure in ambulatory patients with FRDA and has an excellent correlation with functional capabilities. Ambulatory patients with onset before age 8 years showed the fastest measurable worsening. Loss of ambulation in high-risk patients is a disease milestone that should be considered as an end point in clinical trials.
Friedreich ataxia (FRDA) is an autosomal recessive multisystem disorder characterized by neurologic impairment, hypertrophic cardiomyopathy, skeletal abnormalities, and carbohydrate intolerance. Most patients are homozygous for the hyperexpansion of a guanosine-adenosine-adenosine (GAA) repeat in the first intron of the Frataxin (FXN) gene,1 which triggers the formation of repressive chromatin inhibiting FXN messenger RNA transcription.2 Longer repeats lead to more severe repression of frataxin expression, such that most residual FXN in patients with FRDA derives from the allele with the shorter GAA repeat (GAA1). Patients with earlier onset and more severe disease usually have longer GAA1.3,4 FXN is needed for synthesis of iron-sulfur clusters in mitochondria.5 Its deficiency leads to mitochondrial dysfunction, oxidative stress, and altered iron metabolism,6 all potential therapeutic targets. New therapeutic strategies aim to restore FXN levels by upregulating the endogenous gene or by protein or gene replacement therapy. As these approaches move to clinical development, trial design becomes a critical issue. FRDA is a rare disease, so clinical trials can only enroll a limited number of patients. The need for efficient design is compounded by the number of treatments entering the clinical arena, inevitably competing for these patients. Two aspects are critical: (1) identifying the patient population in which disease progression can best be detected and (2) selecting the most sensitive and robust outcome measures, including clinical assessments, patient-reported outcomes (PROs), and biomarkers.
FRDA neuropathology is characterized by marked differences in the vulnerability of neuronal systems and in the timing when they become affected.7 Clinically, this translates into different timing and progression rate of proprioceptive,8 cerebellar,9 and pyramidal10 signs and symptoms, affecting the sensitivity of rating scales and the choice of appropriate clinical outcomes at different disease stages.
The International Cooperative Ataxia Rating Scale11 was initially used to quantify the severity of FRDA neurologic symptoms in natural history studies and clinical trials, but current studies use the Friedreich Ataxia Rating Scale (FARS)8 or the Scale for the Assessment and Rating of Ataxia (SARA).12 The FARS was conceived as a FRDA-specific scale capturing the various neurologic features of the disease, including sensory loss, weakness, and amyotrophy, in addition to ataxia. It also includes an assessment of activities of daily living (ADL), a general staging of disease progression, and several quantitative performance measures. More recently, the modified FARS (mFARS), which dropped nonataxia items, has been accepted by the US Food and Drugs Administration as outcome measure in an FRDA clinical trial. The SARA was instead developed to quantify ataxia in a variety of clinical situations, without attempting to capture the complexity of a specific condition.13 It has a lower number of items than the mFARS (8 vs 18), so its administration is faster, and patients are less fatigued. Training is also easier, a plus in multicentric studies. The Inventory of Non-Ataxic Signs (INAS) was developed along with the SARA to provide a reliable descriptive of neurologic comorbidities in patients with ataxia.14
Of the 2 ongoing collaborative prospective natural history studies in FRDA, the European Friedreich's Ataxia Consortium for Translational Studies (EFACTS) uses the SARA, whereas the Friedreich's Ataxia–Clinical Outcome Measures Study (FA-COMS) in the United States, Canada, and Australia uses the FARS. The FA-COMS published prospective data on a cohort of 812 patients with FRDA, 234 with up to year-5 follow-up.15 The average annual increase in the mFARS score was ∼2 points. Lower baseline FARS scores predicted faster progression, whereas the repeat length of GAA1 only showed a marginal trend with FARS-based measures. Individuals who were aged <16 years at baseline has the fastest FARS deterioration. The EFACTS published a cross-sectional analysis of its core cohort of 600 patients in 201516 and the 2-year prospective follow-up of 471 patients from the same cohort in 2016.17 In the prospective study, younger age at onset was associated with faster SARA deterioration, but the effect was minor (−0.02 points per year of age at onset), and the average rate was not different in patients with typical onset before age 25 years (0.75 points per year, 95% confidence interval [CI] 0.62–0.88) and those with later onset (0.86 points per year, 95% CI, 0.57–1.16). Deterioration in SARA slowed after 24 years of disease duration and was faster with lower SARA score at baseline.
Although both the FA-COMS and the EFACTS found that earlier age at onset results in faster worsening, the detected effects were of relatively limited size. Neither study compared progression of different age at onset groups vs disease duration. Power calculations from both the FA-COMS and the EFACTS were based on average progression rates and concluded that a 2-year study is needed to detect 50% slowing of disease progression with a manageable sample size of around 100 patients.
The published FA-COMS and EFACTS, while offering a highly valuable overview of FRDA progression, have 2 important limitations. The first is the lack of detail in defining the pattern of neurologic deterioration, and the second is the lack of the clear definition of a rapidly progressing patient group that may provide maximum power for a clinical trial.
The present study analyzes a single EFACTS site cohort of 54 patients with FRDA with the aim of characterizing the pattern of disease progression and identifying the most rapidly progressing subset of patients. Its findings are expected to orient a more detailed analysis in the overall EFACTS and FA-COMS cohorts, eventually to be used to improve the design of future clinical trials in FRDA.
Methods
Between 2010 and 2019, the Brussels EFACTS site has included 54 patients in the natural history study. The study was approved and is monitored by the institution's ethics committee. Patients provided written informed consent for annual clinical assessments, repeated genetic testing, and blood and urine sampling for biomarker studies. Clinical data were recorded in the EFACTS clinical database; genetic testing was performed at the Brussels site, as for the entire EFACTS cohort, confirming the molecular diagnosis of FRDA and determining GAA repeat sizes. Data are available from 263 annual visits, corresponding to an average follow-up of almost 4 years (range: baseline only to 8 years). Almost all visits were performed by the same examiner (M.P.).
Data from the Brussels cohort were extracted from the EFACTS database as of October 25, 2019. The open source software Jamovi (jamovi.org) was used for most statistical analyses; the G*Power package was used for power calculations. Graphs were drawn using Microsoft Excel or Jamovi. p Values are corrected for multiple comparisons when needed. CIs are indicated when appropriate.
Data availability
Data tables not allowing patient identification are available on request.
Results
Patients
The 54 patients were equally distributed by sex (27 men and 27 women). Age at baseline visit ranged from 7 to 69 years (mean = 24.9, SD = 13.3). Age at symptom onset ranged from 3 to 60 years (mean = 13.6, SD = 9.7). Seventeen patients had onset before age 8 years, 20 patients between age 8 and 14 years, and 17 patients at age 15 years or after. Disease duration ranged from 3 to 42 years (mean = 16.9, SD = 9.0). Data from the first 20 years of disease progression were available from 15 patients with onset before age 8 years, 17 patients with onset between age 8 and 14 years, and 17 patients with onset at age 15 years or after. GAA repeat sizes were available for 49 patients (mean GAA1 = 649, SD = 226), of these 29 had GAA1 > 600 and 20 had GAA1 ≤ 600.
Items driving SARA progression
Although all SARA items are tightly correlated, as previously reported13 and confirmed in this study sample by principal component analysis (single major component explaining 66.8% of variance), SARA progression is clearly driven by different items at different stages of FRDA. The gait and the stance items, whose maximum scores account for about 1/3 of the maximum total SARA score (14/40), are responsible for half of the SARA score progression until patients remain ambulatory, i.e., to an overall score of 23–27, when they reach their maximum (figure 1, A and B). Although all recently diagnosed patients show some gait abnormality, some patients with a total SARA score <10 have a normal stance score, i.e., they can stand in tandem position with eyes open for 10 seconds. The SARA does not test stance with eyes closed, but data from the FA-COMS18 and personal observation show that almost all patients even shortly after diagnosis are unable to stand with feet close together and eyes closed, i.e., they have a positive Romberg sign. The only SARA item performed without visual control, the heel-to-shin slide, is also uniformly abnormal even in recently diagnosed patients with SARA <10 (figure 1C) and rapidly progresses reaching its maximal score when ambulation is lost. The sitting item (figure 1D) is often initially normal, in some cases up to a total SARA score of 20, and then it progresses linearly. It is one of the items contributing to SARA progression in advanced disease after loss of ambulation, reflecting worsening cerebellar ataxia and truncal weakness in advanced disease. Dysarthria and upper limb cerebellar ataxia (speech, finger chase, and nose-to-finger items, figure 1, E–G) may also be initially absent and show most progression after loss of ambulation. The SARA upper limb coordination items assess spatial irregularities, i.e., dysmetria and tremor, which are not prominent in FRDA,19 so they rapidly move from low to maximum score when the movement becomes impossible because of very severe ataxia and weakness. The alternating upper limb movement (diadochokinesia) item becomes severely abnormal relatively early (figure 1H), due to slowing more than irregularity of movement. Slowing of repetitive movements is a common finding in patients with FRDA and is considered to be a consequence of pyramidal degeneration.20
Figure 1. SARA items vs total SARA score.

Scatterplots of scores of each SARA item vs total SARA scores (n = 251), showing fitted Loess regression lines with confidence bands. (A) Gait; (B) stance; (C) heel-to-shin slide; (D) sitting; (E) finger chase; (F) finger-to-nose; (G) speech; (H) alternate hand movements (diadochokinesis). SARA = Scale for the Assessment and Rating of Ataxia.
Effect of disease duration on SARA progression
As in the overall EFACTS cohort, disease progression showed considerable slowing after 20–25 years17 (figure 2A), with an average yearly SARA progression of 0.92 points in the first 25 years and of 0.30 points afterward. For this reason, further analyses focused on the first 20 years of disease progression.
Figure 2. SARA scores vs disease duration in patients with different onset age.

(A) Scatterplot of SARA scores (n = 252) vs disease duration in the Brussels European Friedreich Ataxia Consortium for Translational Study patients (n = 54). Linear regression lines are shown for disease duration <25 years and ≥25 years. (B) Scatterplots of SARA scores vs disease duration in patients with age at onset at <8 years (SARA scores n = 84), between 8 and 14 years (SARA scores n = 75), and ≥15 years (SARA scores n = 92), showing fitted linear regression lines with confidence bands. (C) p Values of comparisons of linear regression slopes between pairs of age at onset groups. AO = age at onset; SARA = Scale for the Assessment and Rating of Ataxia.
Effect of age at symptom onset and of GAA1 on SARA progression
Patients with earlier onset have faster progression. The limited size of the Brussels cohort did not allow a detailed analysis with a small age window, but the effect is very clear just by stratifying patients in 3 groups based on age at onset. In the first 20 years after onset, patients with onset age <8 years (n = 15, 84 yearly visits) progressed most rapidly at an estimated linear rate of 1.90 ± 0.186 (slope ± standard error) SARA points per year vs 1.33 ± 0.157 points for the group with onset between age 8 and 14 years (n = 17, 75 yearly visits) and 0.71 ± 0.168 points for those with onset at age ≥15 years (n = 17, 92 yearly visits), all differences being statistically significant (figure 2, B and C).
The GAA1 repeat length also correlated with the SARA progression rate (figure 3A). However, as previously observed, GAA1 only accounted for less than half of the variability in age at onset (R2 = 0.345, p < 0.001, figure 3B), so its effect was less marked and could only be detected by stratifying patients in 2 groups using a cutoff of 600 GAA triplets (123 yearly visits for GAA1 > 600; 71 yearly visits for GAA1 ≤ 600).
Figure 3. SARA scores vs disease duration in patients with different GAA1.
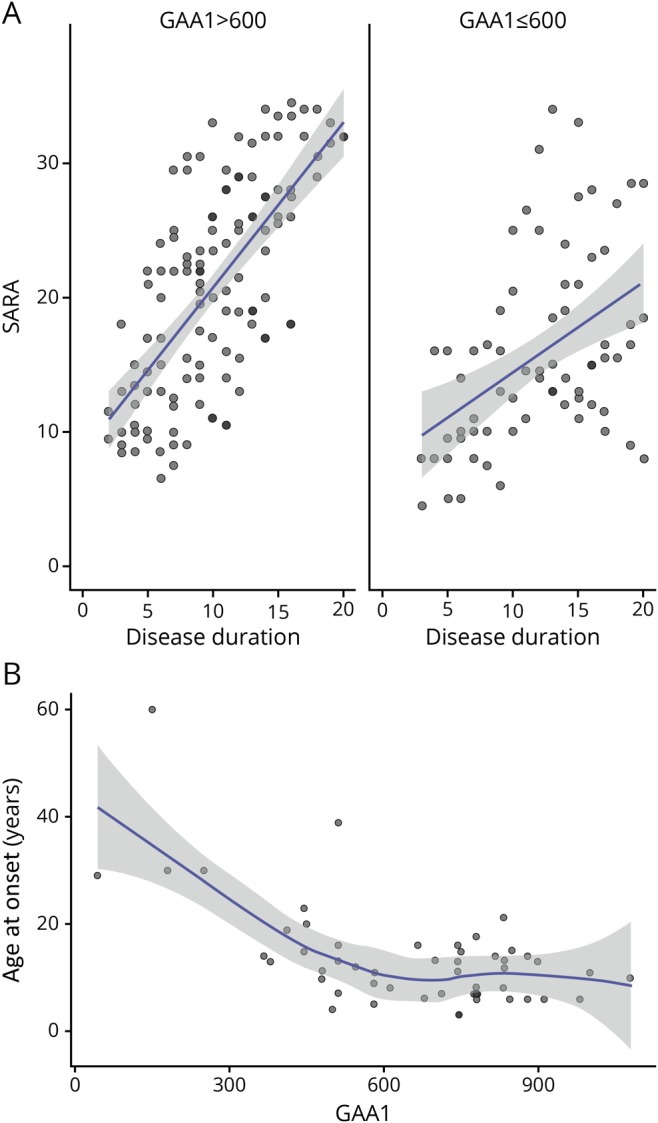
(A) Scatterplots of SARA scores vs disease duration in patients with GAA1 repeat length >600 (SARA scores n = 123) and ≤600 (SARA scores n = 80), showing fitted linear regression lines with confidence bands. (B) Scatterplot of GAA1 repeat lengths vs age at onset in Brussels European Friedreich Ataxia Consortium for Translational Study patients (n = 51), showing fitted Loess regression line with confidence band. SARA = Scale for the Assessment and Rating of Ataxia.
Loss of ambulation
More rapid progression in patients with earlier onset translated into shorter time to loss of ambulation (p < 0.001). This occurred at an average total SARA score of 25. Survival analysis showed that patients with onset age <8 years reached a SARA score of 25 after a median time of 14 years, and all of them reached this score by 15 years (figure 4). The median time to SARA 25 was 17 years in patients with onset age between 8 and 14 years and >20 years in those with onset age ≥15 years, with no overlap of CIs (figure 4). The need for occasional (SARA gait score 5) or constant (SARA gait score 6) support was a strong predictor of loss of ambulation within 2 years, occurring in 80% of patients. Conversely, no patient with a SARA gait score ≤4 lost the ability to walk in the following 2 years. Of notice, a score of 5 was recorded in few patients, indicating that occasional support is only needed for a short time before the need for constant support. The stance item (p < 0.001) and the total SARA score (p = 0.002) showed the best correlation with the gait item, so they were also good predictors of loss of ambulation.
Figure 4. Survival analysis of loss of ambulation in the first 20 years after onset.

Kaplan-Meier plot with confidence intervals of loss of ambulation over the first 20 years of disease duration in patients with age at onset at <8 years, between 8 and 14 years, and ≥15 years. SARA = Scale for the Assessment and Rating of Ataxia.
Loss of ambulation was primarily due to ataxia rather than weakness. Despite the presence of extensor plantar responses at baseline in 50/54 patients (92.5%), weakness of the lower limbs was absent or minimal in ambulatory patients, whereas it rapidly became prominent 1 year after loss of ambulation, with an increase in the total lower limb weakness INAS score from 0.41 ± 0.90 to 3.97 ± 1.90 (p < 0.001).
ADL score progression
The FARS ADL score is a relevant measure of patients' functional capacities in everyday life, previously shown to have good sensitivity to disease progression in the overall EFACTS.16,17 In the EFACTS, the ADL scale is administered through a structured interview conducted by the investigator, involving the patient and caregiver(s), rather than as a purely PRO as in the FA-COMS, which modifies its psychometric properties. In the Brussels cohort, the ADL and SARA scores were tightly correlated (R2 = 0.82, p < 0.001, figure 5A). Thus, a similar effect of age at onset was observed for ADL progression (figure 5B) as for SARA, although it was less marked, being only detected when comparing patients with onset before age 8 years with those with onset at age 8 years or later, and only marginally significant (p = 0.049).
Figure 5. ADL vs SARA scores and disease duration.

(A) Scatterplot of ADL vs SARA scores (n = 255) in Brussels European Friedreich Ataxia Consortium for Translational Study patients, showing fitted linear regression line with confidence band. (B) Scatterplots of ADL scores vs disease duration in patients with age at onset at <8 years (ADL scores n = 72) and ≥8 years (ADL scores n = 137), showing fitted linear regression lines with confidence bands. ADL = activities of daily living; SARA = Scale for the Assessment and Rating of Ataxia.
Effect of previous scores on SARA progression
As reported for the overall EFACTS cohort,17 a lower SARA score in the previous visit predicted a faster progression rate. A sharp slowing of progression rate occurred at loss of ambulation (SARA gait item ≥7), with a significant difference in SARA progression between ambulatory and nonambulatory patients when all 1-year changes are compared and regardless of the age at onset group (1.62 points/y vs 0.34 points/y, p = 0.004). As presented above, SARA progression in nonambulatory patients can only be driven by a limited subset of items, limiting the sensitivity of the scale and reducing the signal-to-noise ratio.
Of interest, in the present study, SARA progression in the previous year or 2 years was not predictive of similar progression at the following visit. This finding reflects the expected regression to the mean occurring in repeated assessments of a noisy measure. Therefore, selection of rapidly progressing patients cannot be based on this criterion.
Power calculations
Including ambulatory patients with onset before age 8 years would need a sample size of 97 to detect 50% slowing in SARA progression over 1 year at 90% power by the t test, assuming a 2-sided criterion for detection that allows for a maximum type I error rate of α = 0.05. Just selecting for ambulatory patients (SARA < 25) with a disease duration of <25 years, who progressed an average of 1.60 SARA points/year (CI, 1.19–2.01), would increase the sample size to 193. In comparison, a 1-year trial with unselected patients as calculated in the overall EFACTS cohort would require 548 patients.17 These calculations are based on the assumption of identical progression in a clinical trial vs natural history study and do not keep into account the placebo effect shown to occur in FRDA trials,21 so they have to be taken as indicative and likely overestimating the needed sample size, particularly if more powerful statistics that make use of repeated measures are used.
Discussion
Taken together, the results of the present study delineate a pattern of progression of neurologic impairment in FRDA. They confirm that afferent ataxia predates cerebellar ataxia and pyramidal weakness. Symptom onset corresponds to the appearance of cerebellar ataxia, affecting gait before stance, speech, and limb coordination. Pyramidal involvement is initially manifest only as extensor plantar responses, then as slowing of rapid alternating movements, affecting the diadochokinesia SARA item. Pyramidal weakness eventually becomes prominent, mostly after loss of ambulation. It affects the trunk and limbs, contributing to the progression of the sitting, limb coordination, and possibly speech items in patients who are dependent on a wheelchair.
The SARA efficiently captures progression up to a score of about 25 when ambulation is lost. More sensitive measures of neurologic functions that keep worsening in wheelchair-bound patients are needed. These include speech,22 swallowing,23 vision, hearing, and upper limb coordination. The Composite Cerebellar Functional Severity score,24 assessing upper limb coordination under visual control in 2 timed functional tests, may be more sensitive to progression in nonambulatory patients. Serious Games, another upper limb coordination test reflecting cerebellar function, is also more sensitive in this group.25 Additional upper limb function tests using computer-assisted analyses, particularly in the context of ADL, are the object of ongoing studies.
The tight correlation between the SARA and ADL scores, already detected in the overall EFACTS cohort,16,17 was not surprising, as several items measure the same function in both scales. However, the ADL scale directly assesses how everyday life activities are affected, providing a sort of validation of the clinical relevance of the corresponding SARA items. Furthermore, the ADL scale includes some functions not scored in the SARA, such as swallowing and urinary disturbances. These observations support the use of the ADL scale as a coprimary or secondary outcome in clinical trials in FRDA, as it is clinically meaningful and sufficiently sensitive to progression.
One of the goals of the present study was to tentatively identify a subgroup of patients with faster progression that may be selected for inclusion in initial therapeutic trials to maximize the sensitivity and minimize the sample size. Unfortunately, the simple assessment of the SARA progression rate in the previous 1 or 2 years could not be used for this purpose. Although this approach is effective in more rapidly progressing diseases such as amyotrophic lateral sclerosis, in FRDA, the noise of the measure masks any real difference in the progression rate so that regression to the mean is what mostly predicts the subsequent SARA score. The average yearly increase in the SARA score was higher in ambulatory patients, possibly because a ceiling effect is reached for the SARA when gait and stance scores, which account for >1/3 of the total score, are maximal. Significant slowing of SARA progression also occurred 20–25 years after symptom onset, as in the overall EFACTS cohort.16,17 This may be the consequence of the fact that at this time, essentially all patients are wheelchair bound, except those with particularly slow progression. Age at onset turned out to be the major determinant of the SARA progression rate in the first 20 years of disease, with those with onset at <8 years showing significantly more rapid worsening. As expected, the ADL score also worsened more rapidly in the same group. Of interest, the GAA1 repeat length was less a good predictor of the progression rate than age at onset, possibly because the latter reflects the combination of all factors that modify disease severity, of which GAA1 is only one. Such a strong effect of onset age was not clearly observed in the published overall analyses of the EFACTS natural history study.16,17 A possible explanation is in the age composition of the core EFACTS cohort, which included almost only adults. In that cohort, the early-onset (age ≤14 years) group at baseline had an average disease duration of 17 years, with a minimum of 10 years.16 Therefore, there were very few ambulatory patients with very early onset (age <8 years), the vast majority of whom have <13 years of disease duration, as indicated by survival analysis of loss of ambulation (figure 5).
Combining all observations, maximal sensitivity to progression is found in ambulatory patients with onset before age 8 years, all of whom have <20 years of disease duration. In addition to SARA and ADL progression, loss of ambulation can be a relevant outcome for clinical trials in this high-risk patient group. Loss of ambulation is a major milestone in FRDA natural history, whose impact on patients' lives cannot be overstated. It can be predicted to occur within 2 years with 80% probability in patients who need even intermittent support for walking (SARA gait item score ≥5). Even more rapid progression can be expected in the age at onset at <8 years, as shown by survival analysis.
All the observations made in this small patient series need to be corroborated and refined in the overall EFACTS and possibly FA-COMS cohorts. As no site effect was detected in the overall analysis of the EFACTS cohort,16,17 the findings of the present study are likely to predict results in these larger groups. Furthermore, although the EFACTS and the FA-COMS use different rating scales, these are tightly correlated, so overall analyses can be performed. In this regard, a recent analysis of the FA-COMS cohort reached very similar conclusions to the present study, showing that patients with earlier symptom onset also had faster progression and earlier loss of ambulation, which was heralded by inability to stand without support.26
The gained knowledge about FRDA natural history would allow us to greatly improve the follow-up of these patients and trial design, at a time when multiple highly promising treatments are likely to come into the clinical arena.
Glossary
- ADL
activities of daily living
- ALS
amyotrophic lateral sclerosis
- CI
confidence interval
- EFACTS
European Friedreich's Ataxia Consortium for Translational Studies
- FARS
Friedreich Ataxia Rating Scale
- FRDA
Friedreich ataxia
- INAS
Inventory of Non-Ataxic Signs
- mFARS
modified FARS
- SARA
Scale for the Assessment and Rating of Ataxia
- PRO
patient-reported outcome
Author contributions
M. Pandolfo: design or conceptualization of the study, clinical evaluation, analysis and interpretation of the data, and writing the manuscript.
Study funding
The EFACTS study has been funded by the European Union 7th Framework Programme from 2010 until 2015, by the charity Euroataxia from 2015 until 2018, and by Voyager Therapeutics from 2015 to present.
Disclosure
M. Pandolfo has received consulting fees from ApoPharma, BioMarin, Minoryx, and Voyager Therapeutics and royalties from Athena Diagnostics. He serves as Deputy Editor of Neurology: Genetics. Go to Neurology.org/NG for full disclosures.
References
- 1.Campuzano V, Montermini L, Moltò MD, et al. Friedreich's ataxia: autosomal recessive disease caused by an intronic GAA triplet repeat expansion. Science 1996;271:1423–1427. [DOI] [PubMed] [Google Scholar]
- 2.Gottesfeld JM. Molecular mechanisms and therapeutics for the GAA·TTC expansion disease Friedreich ataxia. Neurotherapeutics 2019;16:1–18. [DOI] [PMC free article] [PubMed] [Google Scholar]
- 3.Montermini L, Richter A, Morgan K, et al. Phenotypic variability in Friedreich ataxia: role of the associated GAA triplet repeat expansion. Ann Neurol 1997;41:675–682. [DOI] [PubMed] [Google Scholar]
- 4.Dürr A, Cossée M, Agid Y, et al. Clinical and genetic abnormalities in patients with Friedreich's ataxia. N Engl J Med 1996;335:1169–1175. [DOI] [PubMed] [Google Scholar]
- 5.Patra S, Barondeau DP. Mechanism of activation of the human cysteine desulfurase complex by frataxin. Proc Natl Acad Sci U S A 2019;116:19421–19430. [DOI] [PMC free article] [PubMed] [Google Scholar]
- 6.Martelli A, Puccio H. Dysregulation of cellular iron metabolism in Friedreich ataxia: from primary iron-sulfur cluster deficit to mitochondrial iron accumulation. Front Pharmacol 2014;5:130. [DOI] [PMC free article] [PubMed] [Google Scholar]
- 7.Koeppen AH, Mazurkiewicz JE. Friedreich ataxia: neuropathology revised. J Neuropathol Exp Neurol 2013;72:78–90. [DOI] [PMC free article] [PubMed] [Google Scholar]
- 8.Subramony S, May W, Lynch D, et al. Measuring Friedreich ataxia: interrater reliability of a neurologic rating scale. Neurology 2005;64:1261–1262. [DOI] [PubMed] [Google Scholar]
- 9.Koeppen AH, Davis AN, Morral JA. The cerebellar component of Friedreich's ataxia. Acta Neuropathol 2011;122:323–330. [DOI] [PMC free article] [PubMed] [Google Scholar]
- 10.Storey E, Tuck K, Hester R, Hughes A, Churchyard A. Inter-rater reliability of the International Cooperative Ataxia Rating Scale (ICARS). Movement Disord 2004;19:190–192. [DOI] [PubMed] [Google Scholar]
- 11.Trouillas P, Takayanagi T, Hallett M, et al. International Cooperative Ataxia Rating Scale for pharmacological assessment of the cerebellar syndrome. The Ataxia Neuropharmacology Committee of the World Federation of Neurology. J Neurol Sci 1997;145:205–211. [DOI] [PubMed] [Google Scholar]
- 12.Vasco G, Gazzellini S, Petrarca M, et al. Functional and gait assessment in children and adolescents affected by Friedreich's ataxia: a one-year longitudinal study. PLoS One 2016;11:e0162463. [DOI] [PMC free article] [PubMed] [Google Scholar]
- 13.Schmitz-Hübsch T, du Montcel TS, Baliko L, et al. Scale for the assessment and rating of ataxia: development of a new clinical scale. Neurology 2006;66:1717–1720. [DOI] [PubMed] [Google Scholar]
- 14.Schmitz-Hübsch T, Coudert M, Bauer P, et al. Spinocerebellar ataxia types 1, 2, 3, and 6: disease severity and nonataxia symptoms.. Neurology 2008;71:982–989. [DOI] [PubMed] [Google Scholar]
- 15.Patel M, Isaacs CJ, Seyer L, et al. Progression of Friedreich ataxia: quantitative characterization over 5 years. Ann Clin Transl Neur 2016;3:684–694. [DOI] [PMC free article] [PubMed] [Google Scholar]
- 16.Reetz K, Dogan I, Costa AS, et al. Biological and clinical characteristics of the European Friedreich's Ataxia Consortium for Translational Studies (EFACTS) cohort: a cross-sectional analysis of baseline data. Lancet Neurol 2015;14:174–182. [DOI] [PubMed] [Google Scholar]
- 17.Reetz K, Dogan I, Hilgers RD, et al. Progression characteristics of the European Friedreich's Ataxia Consortium for Translational Studies (EFACTS): a 2 year cohort study. Lancet Neurol 2016;15:1346–1354. [DOI] [PubMed] [Google Scholar]
- 18.Rummey C, Corben LA, Delatycki MB, et al. Psychometric properties of the Friedreich Ataxia Rating Scale. Neurol Genet 2019;5:371. [DOI] [PMC free article] [PubMed] [Google Scholar]
- 19.Corti M, Casamento-Moran A, Delmas S, et al. Temporal but not spatial dysmetria relates to disease severity in FA. J Neurophysiol 2020;123:718–725. [DOI] [PMC free article] [PubMed] [Google Scholar]
- 20.Marty B, Naeije G, Bourguignon M, et al. Evidence for genetically determined degeneration of proprioceptive tracts in Friedreich ataxia. Neurology 2019;93:e116–e124. [DOI] [PubMed] [Google Scholar]
- 21.Pandolfo M, Arpa J, Delatycki MB, et al. Deferiprone in Friedreich ataxia: a 6-month randomized controlled trial. Ann Neurol 2014;76:509–521. [DOI] [PubMed] [Google Scholar]
- 22.Vogel AP, Wardrop MI, Folker JE, et al. Voice in Friedreich ataxia. J Voice 2017;31:243.e9–243.e19. [DOI] [PubMed] [Google Scholar]
- 23.Keage M, Delatycki MB, Dyer J, Corben LA, Vogel AP. Changes detected in swallowing function in Friedreich ataxia over 12 months. Neuromuscular Disord 2019;29:786–793. [DOI] [PubMed] [Google Scholar]
- 24.Melac A, Mariotti C, Pierucci A, et al. Friedreich and dominant ataxias: quantitative differences in cerebellar dysfunction measurements. J Neurol Neurosurg Psychiatry 2018;89:559. [DOI] [PubMed] [Google Scholar]
- 25.Bonnechère B, Jansen B, Haack I, et al. Automated functional upper limb evaluation of patients with Friedreich ataxia using serious games rehabilitation exercises. J Neuroeng Rehabil 2018;15:589. [DOI] [PMC free article] [PubMed] [Google Scholar]
- 26.Rummey C, Farmer JM, Lynch DR. Predictors of loss of ambulation in Friedreich's ataxia. EClinicalMedicine 2020;18:100213. [DOI] [PMC free article] [PubMed] [Google Scholar]
Associated Data
This section collects any data citations, data availability statements, or supplementary materials included in this article.
Data Availability Statement
Data tables not allowing patient identification are available on request.