Objectives:
Wideband acoustic immittance (WAI) noninvasively assesses middle ear function by measuring the sound conduction over a range of audible frequencies. Although several studies have shown the potential of WAI for detecting the presence of middle ear effusions (MEEs), determining the effects of MEE type and amount on WAI in vivo has been challenging due to the anatomical location of middle ear cavity. The purpose of this study is to correlate WAI measurements with physical characteristics of the middle ear and MEEs determined by optical coherence tomography (OCT), a noninvasive optical imaging technique.
Design:
Sixteen pediatric subjects (average age of 7 ± 4 years) were recruited from the primary care clinic at Carle Foundation Hospital (Urbana, IL). A total of 22 ears (normal: 15 ears, otitis media with effusion: 6 ears, and acute otitis media: 1 ear, based on physician’s diagnosis) were examined via standard otoscopy, tympanometry, OCT imaging, and WAI measurements in a busy, community-based clinical setting. Cross-sectional OCT images were analyzed to quantitatively assess the presence, type (relative turbidity based on the amount of scattering), and amount (relative fluid level) of MEEs. These OCT metrics were utilized to categorize subject ears into no MEE (control), biofilm without a MEE, serous-scant, serous-severe, mucoid-scant, and mucoid-severe MEE groups. The absorbance levels in each group were statistically evaluated at α = 0.05.
Results:
The absorbance of the control group showed a similar trend when compared with a pediatric normative dataset, and the presence of an MEE generally decreased the power absorbance. The mucoid MEE group showed significantly less power absorbance from 2.74 to 4.73 kHz (p < 0.05) when compared with the serous MEE group, possibly due to the greater mass impeding the middle ear system. Similarly, the greater amount of middle ear fluid contributed to the lower power absorbance from 1.92 to 2.37 kHz (p< 0.05), when compared with smaller amounts of fluid. As expected, the MEEs with scant fluid only significantly affected the power absorbance at frequencies greater than 4.85 kHz. A large variance in the power absorbance was observed between 2 and 5 kHz, suggesting the dependence on both the type and amount of MEE.
Conclusions:
Physical characteristics of the middle ear and MEEs quantified from noninvasive OCT images can be helpful to understand abnormal WAI measurements. Mucoid MEEs decrease the power absorbance more than serous MEEs, and the greater amounts of MEE decreases the power absorbance, especially at higher (>2 kHz) frequencies. As both the type and amount of MEE can significantly affect WAI measurements, further investigations to correlate acoustic measurements with physical characteristics of middle ear conditions in vivo is needed.
Keywords: Imaging, Middle ear effusion, Otitis media, Optical coherence tomography, Wideband acoustic immittance
INTRODUCTION
Otitis media (OM) is a prevalent middle ear infection caused by bacteria or viruses. OM is one of the most common diagnoses in pediatrics and otolaryngology due to the immature Eustachian tube and immune system of children (Teele et al. 1989; Monasta et al. 2012), and the financial and societal burden related to OM remains substantial (Tong et al. 2018). OM is characterized by a middle ear effusion (MEE), fluid accumulation in a normally air-filled middle ear cavity. The most common complication of OM is conductive hearing loss (CHL) from persistent MEEs, which may lead to speech and language development delays in early childhood (Qureishi et al. 2014). Treatment options include watchful waiting, antibiotic prescription, and surgical removal of MEEs via myringotomy, an incision in the tympanic membrane (TM). However, the recurrence of MEEs is as high as 40%, depending on age (Casselbrant & Mandel 1999). Thus, it is critical for clinicians to accurately diagnose and monitor OM as well as to evaluate middle ear function.
The recommended diagnostic method by the American Academy of Otolaryngology is pneumatic otoscopy (Lieberthal et al. 2013; Rosenfeld et al. 2016), which allows for surface visualization of TM (im)mobility when both positive and negative pressure is applied to the sealed ear canal. Decreased TM mobility and an altered resting position of the TM (bulging or retracted) may indicate the presence of a MEE and the type of OM (mainly acute OM [AOM] or OM with effusion [OME]). However, diagnosis and interpretation vary, largely based on physician expertise, resulting in an overall accuracy of 40 to 70% (Blomgren & Pitkäranta 2003; Pichichero 2003; Pichichero & Poole 2005). Furthermore, in practice, it is more common to perform standard otoscopy alone, as the standard otoscope is readily available and the results are easier to interpret compared with pneumatic otoscopy (Watson et al. 1999; Jones & Kaleida 2003; Cullas Ilarslan et al. 2018). However, standard otoscopy may be sufficient for the diagnosis of OM only when the signs of a MEE are obvious (Sassen et al. 1994).
To provide more objective and quantitative diagnostic information, conventional tympanometry can be used to acoustically determine the presence of a MEE (Palmu et al. 1999; Onusko 2004; Harris et al. 2005). Tympanometry sends a single frequency (typically 226 or 1000 Hz, depending on age) sound wave into the sealed ear canal, and measures the magnitude of the admittance by monitoring the change in sound pressure level of the probe tone as the ear-canal pressure is varied, thereby generating a tympanogram. The peak, sharpness, and width of a tympanogram trace can identify the presence of a MEE, with a sensitivity and specificity of around 80%, comparable to or slightly lower than that of correctly performed pneumatic otoscopy (Nozza et al. 1994). However, tympanometry is capable of measuring only middle ear transmission properties at a single low frequency. In addition, it is often difficult to properly or sufficiently pressure-seal the ear canal, the presence of earwax can cause measurement artifacts, and no visual information is provided, requiring additional otoscopy. Furthermore, CHL cannot be thoroughly assessed from standard tympanometry (Haggard 2009), because the acoustic response at one frequency cannot detect subtle changes experienced in middle ear disorders. Thus, although tympanometry provides a quantitative measure of middle ear function, tympanometry alone is not a reliable diagnostic tool to detect MEEs or assess hearing function.
Wideband Acoustic Immittance
To evaluate middle ear function and potential hearing loss, an ear canal–based reflectance measurement, also known as wideband acoustic immittance (WAI), utilizes a range of audible frequencies (in this study from 0.2 to 6 kHz) with a calibrated probe. WAI can be considered as extending the capabilities of tympanometry, as it collects reflected sound waves from a wide range of frequencies. WAI collects reflected signals from the middle ear to noninvasively compute physical quantities, including but not limited to reflectance, admittance, impedance, power absorbance, and power reflectance. In this article, WAI refers to the collective acoustic reflectance measures, as the terms are interrelated (Feeney et al. 2013; Rosowski et al. 2014). To date, WAI measurements in both pediatric and adult populations have shown that WAI is a promising noninvasive method to assess and diagnose various middle ear disorders, including OME, otosclerosis, extreme middle ear pressure (MEP), TM perforation, ossicular discontinuity, developmental changes, acoustic reflex, CHL, and others (Feeney et al. 2003; Allen et al. 2005; Feeney & Sanford 2005; Shahnaz et al. 2009; Beers et al. 2010; Keefe et al. 2012; Voss et al. 2012; Robinson et al. 2016).
The presence of MEEs generally results in reduced power absorbance across all frequencies (Beers et al. 2010; Ellison et al. 2012; Keefe et al. 2012). However, the effect of different presentations of MEEs has not yet been thoroughly investigated in vivo. It is largely because numerous variables can affect these measurements in practice, such as the presence of a MEE, a thickening of the TM that may be related to the infectious process or the presence of a biofilm on the TM, the volume of the middle ear cavity, MEP, amount of MEE, viscosity of the MEE, TM thickness, instrumentation, gender, age, and even ethnicity (Feeney et al. 2003; Beers et al. 2010; Ellison et al. 2012; Nguyen et al. 2013; Shahnaz et al. 2013). The effects of these variables on WAI in vivo are largely unknown because noninvasively acquiring physical characteristics of the middle ear and MEEs is nearly impossible with current diagnostic tools.
To address the limitation of defining middle ear conditions, many studies have performed the WAI measurements on cadaveric ears to control the amount of MEE (Voss et al. 2012) and the viscosity of the MEE (Ravicz et al. 2004), and on human subjects performing the Valsalva maneuver to vary MEP (Robinson et al. 2016). In vivo ear studies have measured WAI quantities before myringotomy to surgically verify the presence of MEEs (Ellison et al. 2012). However, the stricter inclusion criteria for myringotomy and tympanostomy tube insertion limited the subject pool to those with severe and/or recurrent OM for those studies. Although some studies have correlated WAI measurements with a physician’s diagnosis (Beers et al. 2010), TM mobility from pneumatic otoscopy (Ellison et al. 2012), or tympanometry (Sanford & Brockett 2014), the physical characteristics of MEEs, such as the presence, amount, and type, were still qualitatively determined or unknown from otoscopy-based methods. To the best of our knowledge, there is currently no in vivo, noninvasive study investigating the effect of the amount and type of MEE on WAI measurements. If the state of the middle ear cavity and the physical characteristics of MEEs can be quantitatively defined in vivo, WAI measurements can be more effectively understood in relation to various middle ear pathologies.
Optical Coherence Tomography
Optical coherence tomography (OCT), developed in the early 1990s (Huang et al. 1991), is a noninvasive imaging technique that utilizes near-infrared light. As an optical analogue to ultrasound imaging, OCT creates high-resolution cross-sectional images by measuring back-scattered light from the tissue. The contrast in OCT images originates from the differences in refractive indices, enabling the visualization of different layers and contents inside the tissue. Unlike ultrasound imaging, OCT does not require a conductive medium (e.g., coupling gel), enabling more convenient and efficient in vivo imaging. OCT has been intensively utilized and commercialized in ophthalmology to visualize sublayers of the cornea and retina and is being actively investigated in oncology, dermatology, cardiology, and others (Vignali et al. 2014; Wang et al. 2017; Welzel 2001).
OCT imaging of the human middle ear started in the early 2000s when it was first used to visualize the TM and middle ear cavity ex vivo (Pitris et al. 2001). To further examine the capability of OCT as a diagnostic tool, a portable and hand-held OCT system was integrated with an otoscope to quantify the presence of MEEs, middle ear biofilms, and the thickness of the TM in the exam room and the operating room (Nguyen et al. 2013; Hubler et al. 2015; MacDougall et al. 2015; Monroy et al. 2015, 2018). These studies have shown that OCT can quantitatively characterize middle ear conditions for both adult and pediatric subjects, and noninvasively provide helpful diagnostic criteria for differentiating types and stages of OM (Monroy et al. 2015; Tan et al. 2018). Furthermore, functional measurements have been possible with OCT, including quantifying TM displacements with pneumatic pressure inputs (Shelton et al. 2017; Won et al. 2018), assessing TM vibrational patterns with sound (Chang et al. 2013; MacDougall et al. 2016), and estimating MEE viscosity (Monroy et al. 2017a).
Currently, OCT for clinical middle ear imaging is still far from broad clinical use, and its diagnostic performance (accuracy, sensitivity, and specificity) has not been validated with larger patient trials. However, one study with 20 patients showed higher diagnostic sensitivity (83%) and specificity (98%) in diagnosing chronic OM, compared with standard otoscopy (74% sensitivity and 60% specificity) (Nguyen et al. 2012). Furthermore, one study with 34 pediatric subjects (Monroy et al. 2015) and another study with 39 subjects (Cho et al. 2015) both suggested that the TM thickness precisely measured with OCT is a promising metric to differentiate AOM from chronic OM. A recent surgical follow-up study also demonstrated that OCT can detect the clearance of biofilms as well as the presence of biofilms and MEEs, which correlated well with clinical findings from otologists (Monroy et al. 2017b). Furthermore, several review articles suggest that OCT middle ear imaging has advantages over other diagnostic imaging tools, such as magnetic resonance imaging, computed tomography, and ultrasound, due to noninvasiveness, high speed, and high resolution, extending the diagnostic capabilities in otology (MacDougall et al. 2015; Ramier et al. 2018; Tan et al. 2018).
In this study, OCT is used to classify the condition of middle ear into various types and stages of OM to help better understand abnormal WAI measurements in the presence of MEEs. More specifically, OCT was employed to quantitatively determine the physical characteristics of MEEs, including the presence, type (relative turbidity), and amount (relative fluid level) of MEEs. These characteristics of MEEs were used to categorize the subjects, and then statistically correlate these findings with their corresponding absorbance levels to determine the effect of MEEs on WAI measurements.
MATERIALS AND METHODS
Study Protocol
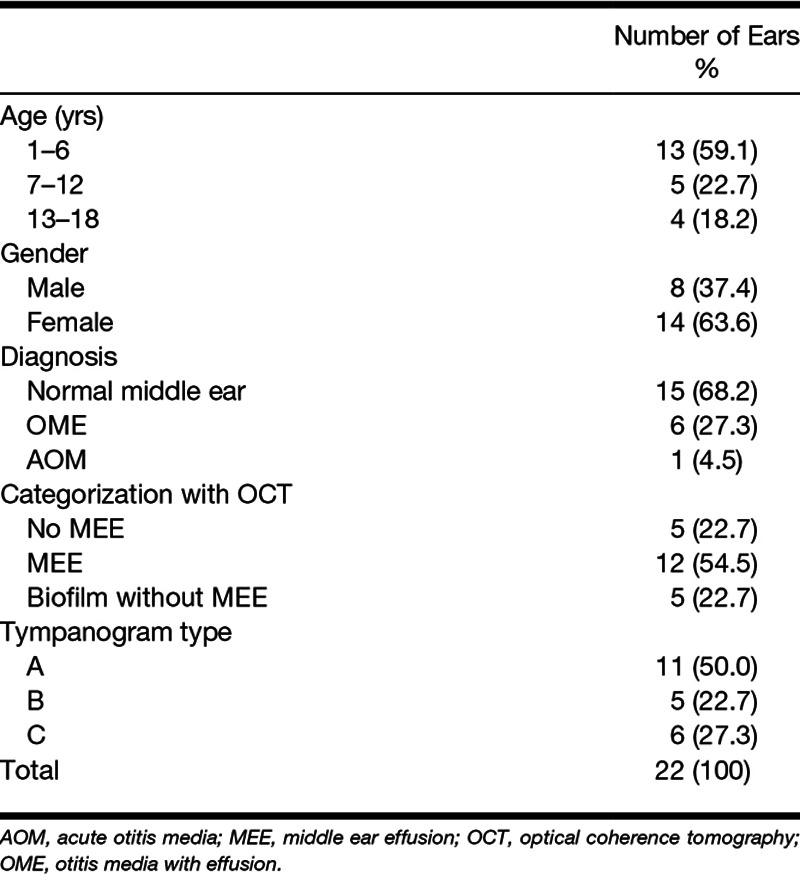
The study was performed under a protocol approved by the Institutional Review Boards (IRBs) at both the University of Illinois at Urbana-Champaign (Urbana, IL) and Carle Foundation Hospital (Urbana, IL). Outpatients visiting the primary care clinic at Carle Foundation Hospital were randomly recruited from November 2016 to April 2017. Subjects were first examined by their pediatricians. The subjects with an existing tympanostomy tube, otitis externa, or perforated TM were not considered for the study. There was no restriction on gender, race, or ethnicity. A total of 16 pediatric outpatients (average and SD of 7 ± 4 years) were examined for the study. Once informed consent and assent were acquired, standard otoscopy, 226 Hz tympanometry (TM286 AutoTymp, Welch-Allyn, Skaneateles Falls, NY), WAI measurements (HearID, Mimosa Acoustic, Champaign, IL), and OCT imaging (in the order of the tests) were performed in a typical examination room during the regular, busy clinical setting. All measurements required less than 5 min for each ear. Out of 32 ears from 16 pediatric outpatients, 10 ears were excluded for the analysis due to unstable and noisy absorbance measurements (n = 7), severe cerumen blocking the ear canal and/or eardrum (n = 1), or an acutely angled, tortuous, and long ear canal (n = 2). The study was considered minimal risk as the optical power of the OCT system on the TM (<~3 mW) was well within the American National Standards Institute laser safety standard. Deidentified physician notes from the examinations were collected after data analysis and correlated to the results. See Table 1 for the detailed subject summary.
TABLE 1.
Subject summary
WAI Measurements
A commercial WAI system (HearID, version 5.1, Mimosa Acoustic, Champaign, IL) was used to collect the data from 248 frequencies over a range from 0.2 to 6 kHz, at 23 Hz intervals. The standard calibration method using a four-cavity device was performed before the measurements to convert Thevenin parameters, source pressure, and impedance in the ear canal (Allen et al. 1986). For this study, absorbance level, Abs, was primarily analyzed, and is defined in terms of the pressure reflectance R as
| (1) |
where f is frequency in Hz, andis the power reflectance computed as the square of the magnitude of the pressure reflectance. The measurements were repeated when there was an uncertainty in the measurements, specifically when the impedance suggested significant air leak or when the measurements were noisy (Groon et al. 2015). Any measurement with an absorbance level greater than 1, excessive noise at low frequencies, or an unstable impedance phase (Henriksen 2008; Rosowski et al. 2012) was considered as an unreliable measurement, and was not included for further analysis.
Optical Coherence Tomography System
A custom-built hand-held OCT system was utilized for this study to capture images of the middle ear cavity, as shown in Figure 1. The system used a superluminescent diode as the light source with a center wavelength of 830 nm and a bandwidth of 135 nm. The light reflected from the tissue was detected to generate a depth-resolved cross-sectional image. Axial (depth) and lateral resolutions were determined to be 2.4 μm and 15 µm in air, respectively. One cross-sectional image (B-scan) had an imaging depth and lateral scanning distance of around 2 to 3 mm and 3 to 4 mm, respectively. Each B-scan consisted of 1000 line-scans (A-scan), collected at a rate of approximately 30 B-scans per second. The OCT system simultaneously displayed OCT B-scans as well as the color video surface image of the TM, as in standard video otoscopy, both in real-time on a monitor. The surface visualization allowed users to target OCT scan beams near the light reflex on the TM for measurement consistency between subjects. A total of 200+ B-scans were acquired from each ear to provide multiple 2-dimensional views of the middle ear near the light reflex. Any B-scans with motion artifacts were discarded, although motion artifacts rarely occurred during imaging due to the high speed of OCT compared with the rate of body drift and hand-held probe motion. The hand-held OCT probe utilized a standard disposable otoscope speculum (Welch-Allyn, Skaneateles Falls, NY) that was interchanged between subjects. More details on the system instrumentation and specifications have been discussed in previous publications (Hubler et al. 2015; Monroy et al. 2015).
Fig. 1.
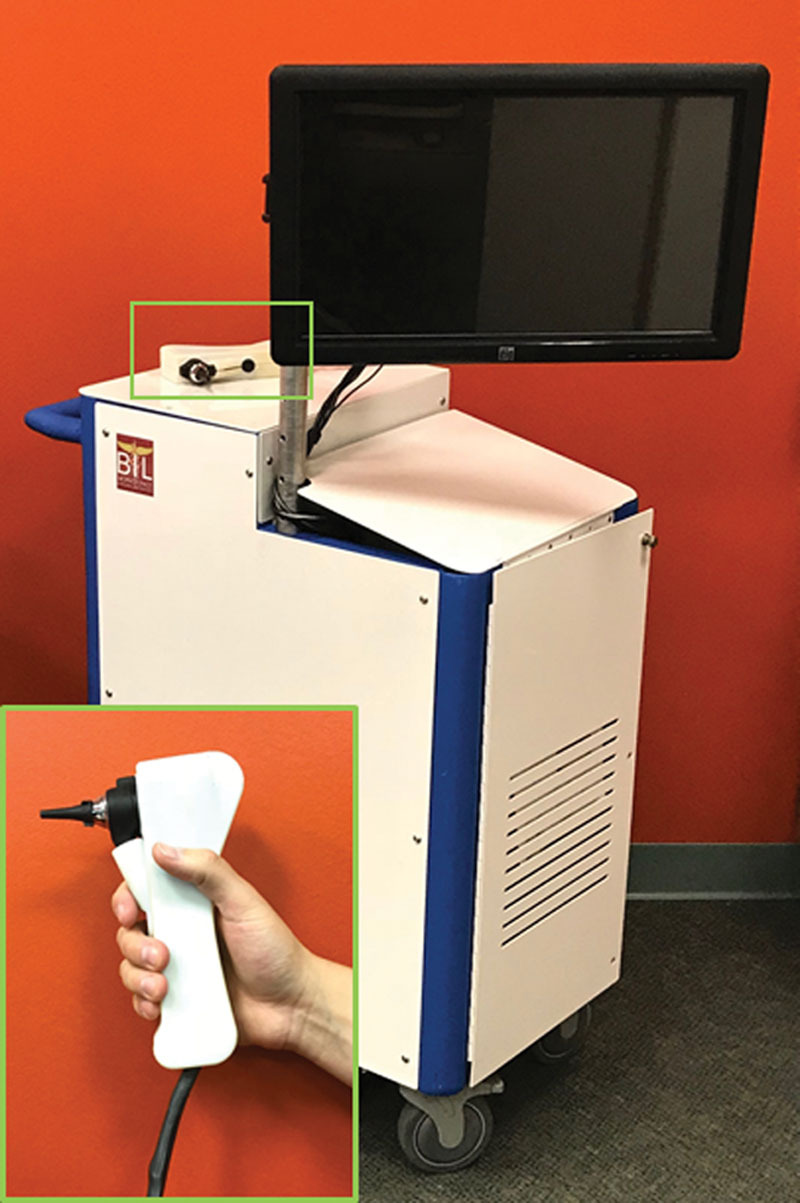
Portable, hand-held, optical coherence tomography (OCT) system. Hand-held probe (green box and inset) of the custom-built portable OCT system resembles a standard otoscope. The head of a standard otoscope is integrated to utilize a disposable ear speculum.
Physician’s Diagnosis
All ears (number of ears, n = 22) were diagnosed by pediatricians before all measurements:
Normal middle ear group (n = 15)
OME group (n = 6)
AOM group (n = 1).
Each physician diagnosis was made based on standard otoscopy, physical examination, and patient history (Casey & Pichichero 2015; Rosenfeld et al. 2016). Clinically normal ears were recruited from the outpatients visiting the Pediatrics Clinic for non–ear-related issues. The ears in the normal group showed a clear and transparent TM without signs of MEEs, while the ears in the OM group presented opaque TMs with signs of MEEs, and ears with AOM had bulging TMs with signs of acute inflammation according to the guideline at the time of the clinic visit (Lieberthal et al. 2013; Rosenfeld et al. 2016).
Subject Categorization With OCT
To study the effect of physical MEE characteristics on WAI measurements, different categories were established based on OCT images. The primary metrics established for OCT images included the presence, type, and amount of MEE, and the presence of any middle ear biofilm. The first category divided all ears based on the presence of a MEE and/or biofilm. The second category divided the OCT-identified MEE group from the first category into serous and mucoid groups using an estimated optical attenuation coefficient extracted from the OCT A-scans. The third category divided the OCT-identified MEE group from the first category into scant and severe MEE amount groups by analyzing consecutive OCT images. Finally, the last category incorporated both metrics used in the second and third categories, and therefore established four groups: serous-scant, serous-severe, mucoid-scant, and mucoid-severe MEE groups. The subject categorizations are graphically summarized in Figure 2. The criteria for each category are described herein.
Fig. 2.

Graphical representation of subject categorization with OCT images. A total of 22 subject ears were categorized based on the presence, relative turbidity, and fluid level of MEEs determined from OCT images. The ears without OCT-identified MEEs were defined to be the control group, and four categories were established. AOM indicates acute otitis media; MEE, middle ear effusion; OCT, optical coherence tomography; OME, otitis media with effusion.
Category 1: Three subject groups were defined based on the presence of a MEE by OCT:
Control group, no MEE identified by OCT (n = 5)
MEE group, MEEs identified by OCT (n = 12)
Biofilm group, biofilms without MEEs identified by OCT (n = 5).
Figure 3 shows representative OCT images of a normal middle ear, an ear with a MEE, and an ear with a biofilm, but without a MEE. The normal TM in Figure 3A shows a thin, smooth structure, with no optical signals in the middle ear cavity. The presence of MEEs in OCT images can be determined when additional optical scattering signals from the MEE are visualized in the middle ear cavity, as in Figure 3B. In Figure 3C, a thin middle ear biofilm structure with an inconsistent thickness is affixed to the inner surface of the TM, but without the presence of scattering features from a MEE in the middle ear cavity. In general, biofilms tend to exhibit a stronger (brighter) OCT signal than the TM, and frequently appear as a distinct, additional, and layered structure affixed to the TM, based on OCT A-scan profiles (Guder et al. 2015; Nguyen et al. 2010, 2012). Nonetheless, in this study, the presence of MEEs and/or biofilm has not been biologically confirmed via invasive sampling as in the study from Monroy et al. (2018). Subjects in this study were outpatients who did not undergo any surgical procedure at the time of the visit.
Fig. 3.

OCT images of a normal middle ear compared with an ear with a MEE and biofilm. Representative cross-sectional OCT images with an inset surface otoscopy TM image of a (A) normal subject, (B) subject with a MEE, and (C) subject with middle ear biofilm without a MEE are shown. The white dotted lines in the inset images indicate the OCT scanning regions. In (B), scattering from the MEE (red arrows) is visualized, and a middle ear biofilm (blue arrows) is shown in (C). Scale bars represent 200 µm. MEE indicates middle ear effusion; TM, tympanic membrane; OCT, optical coherence tomography.
To further characterize MEEs, OCT images were used to assess the type (relative turbidity based on the amount of scattering) of MEE. In previous studies, we observed that more serous MEEs can be noted by lower-brightness signals in OCT due to the lower amount of optical scattering and greater light-absorbing water content (Fig. 4A), whereas more viscous MEEs are visualized by brighter backscattering signals from the denser, tissue-like clusters of proteins, cells, cell debris, and bacteria that reflect/backscatter a greater amount of light (Fig. 4B) (Monroy et al. 2015, 2017a). In addition, the optical scattering profiles in Figure 4 suggest that serous MEEs show spiky and fluctuating decaying trends, whereas mucoid MEEs exhibit more continuous and exponentially decaying trends. To quantify this difference between serous and mucoid MEEs, the attenuation coefficients in each depth-scan (A-scan) of the OCT images were estimated based on (Vermeer et al. 2013):
Fig. 4.
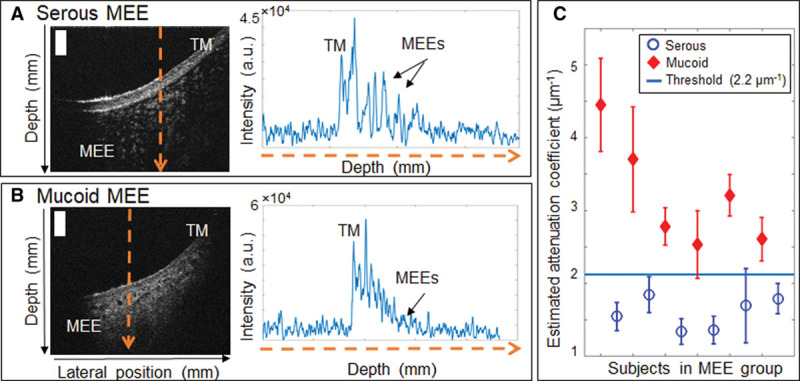
Determining type of MEE using estimated attenuation coefficients from OCT. Representative OCT cross-sectional images and A-scans of (A) subject with a serous MEE, and (B) subject with a mucoid MEE. (C), Estimated attenuation coefficients of the subjects in the MEE group with an experimentally determined attenuation coefficient threshold (2.2 µm−1). Scale bars represent 200 µm. a.u. indicates arbitrary units; MEE, middle ear effusion; TM, tympanic membrane.
 |
(2) |
where µ is an attenuation coefficient in µm−1, I is the OCT signal intensity in arbitrary units, and i is an index for depth in pixels. Attenuation coefficients are often calculated from OCT images to examine tissue properties based on how the OCT signals decay with increasing depth. A greater attenuation coefficient indicates a higher attenuation from scattering (Vermeer et al. 2013), implying thicker and denser MEEs in this study. The average attenuation coefficient over 100 pixels along the depth was calculated for each A-scan. Figure 4C shows the distribution of estimated attenuation coefficients for the subjects with MEEs. An experimentally determined threshold attenuation coefficient of 2.2 µm−1 was used to differentiate serous and mucoid MEEs for category 2. The threshold is an arbitrary value that separates the data into two groups with t test statistical significance (p < 0.05).
Category 2: The OCT-identified MEE group (n = 12) from category 1 was further categorized based on the attenuation coefficients estimated from the OCT images:
Serous MEE group (n = 6)
Mucoid MEE group (n = 6).
Because the OCT beam is very narrow (20 to 30 µm), and can be scanned in real-time, OCT acquires images over multiple spatial regions around the light reflex. Thus, by acquiring many different views near the anterior-inferior TM quadrant, the amount of the MEE can be estimated by analyzing consecutive spatially off-set OCT B-scans. Figure 5 illustrates the variation in the presence of the MEE within the different B-scans from 2 subjects. In Figure 5A, optical scattering from the MEE is visualized only in a portion (yellow arrows) of the OCT image, whereas the MEE in Figure 5B is visualized throughout the entire scanning region (white arrows) between multiple images. Here, the amount of the MEE may represent the fluid level in the middle ear cavity. The fluid level is critical in hearing, as several studies indicate that the volume of a MEE relative to the middle ear cavity largely affects WAI measurements (Sanford & Brockett 2014; Voss et al. 2012). For this study, when the presence of a MEE is visualized to a greater depth in the middle ear cavity from more than 50% of the OCT B-scans acquired, the ear was defined as having a “severe amount of MEE.” On the other hand, if the presence of a MEE is only partially visualized in the middle ear cavity from only a few (<25%) OCT B-scans, the ear was defined as having a “scant amount of MEE.”
Fig. 5.
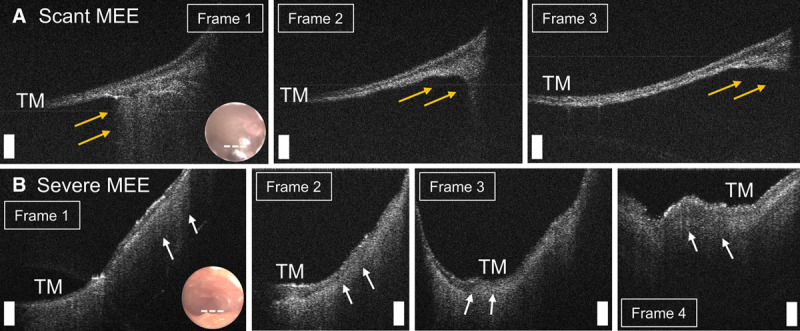
Determining amount of MEE using consecutive spatially off-set OCT B-scans. Representative OCT cross-sectional images of (A) subject with a scant MEE, and (B) subject with a severe MEE. Scale bars represent 200 µm. In (A), a MEE is partially visualized (yellow arrows) in only a few images. In (B), a MEE (white arrows) is visualized throughout the scanning region between multiple images. MEE indicates middle ear effusion; OCT, optical coherence tomography; TM, tympanic membrane.
Category 3: OCT-identified MEE group (n = 12) from category 1 was again divided based on the amount of MEE from the consecutive OCT images:
Scant MEE group (n = 8)
Severe MEE group (n = 4).
Category 4: The middle ear conditions can be dependent on both the type and amount of MEE. To consider both effects separately, the MEE group from category 1 was divided into four groups based on both the type and amount of MEE from categories 2 and 3:
Serous-scant MEE group (n = 4)
Serous-severe MEE group (n = 2)
Mucoid-scant MEE group (n = 4)
Mucoid-severe MEE group (n = 2).
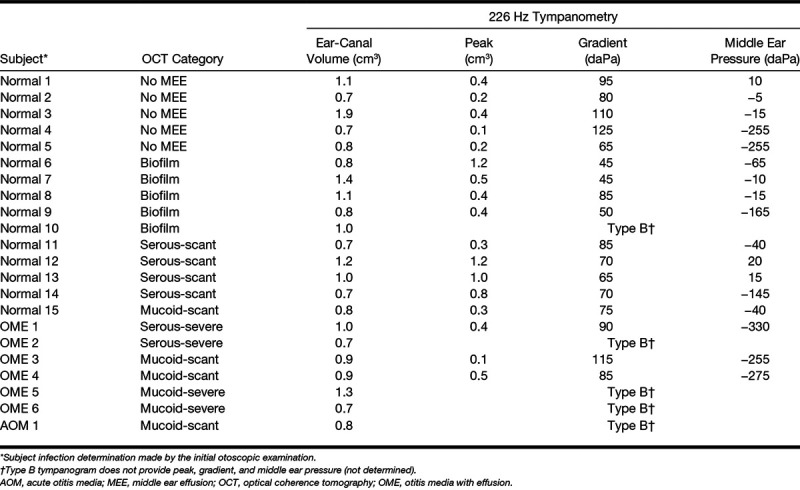
The OCT-based subject categorizations (category 4), physician diagnosis, and tympanometry measurements are tabulated in Table 2.
TABLE 2.
OCT-tympanometry data summary
Statistical Analysis
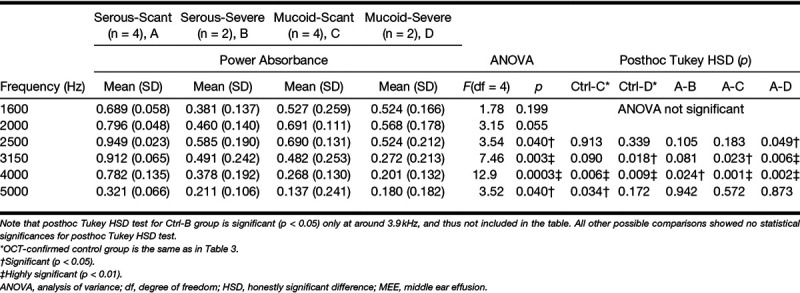
For the statistical comparison of the absorbance levels, the control group in category 1 was used as the control (normal) middle ear condition. A one-way analysis of variance (ANOVA) and posthoc Tukey honestly significant difference (HSD) test were performed for all individual 248 frequencies, from 211 to 6 kHz, on each category using MATLAB. The α level was set at 0.05 for all statistical methods. In addition, descriptive statistics of absorbance (mean and SD) at 1/3 octave bands center frequencies (1.6, 2.0, 2.5, 3.15, 4.0, 5.0 kHz) along with ANOVA and posthoc Tukey HSD test results are tabulated in Tables 3–5.
TABLE 3.
Summarized statistical analysis at 1/3 octave bands center frequency: effect of relative MEE turbidity on absorbance (category 2)
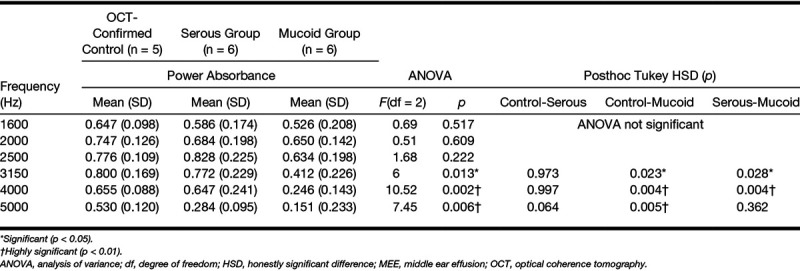
TABLE 5.
Summarized statistical analysis at 1/3 octave bands center frequency: effect of relative MEE turbidity and amount on absorbance (category 4)
RESULTS
In this study, an otoscope-integrated OCT system was employed to capture high-resolution, depth-resolved, and cross-sectional images of the middle ear cavity in vivo. OCT metrics quantitatively determined the presence, type, and amount of MEEs, which were used to categorize the subject ears (n = 22). For each category, absorbance levels between subgroups were statistically correlated to investigate the altered levels due to different MEE presentations.
Control Group: Category 1
Figure 6 compares the power absorbance levels measured for the study based on physician’s diagnosis and category 1. Due to the small number in the diagnosis-based normal group (n = 15) and the OCT-identified control group (n = 5), a normative (n = 144) pediatric absorbance measurement from Beers et al. (2010) was included. Beers et al. measured the energy reflectance from 144 ears (78 subjects; average age of 6.15 years), and the normal middle ear condition was primarily determined by a screening criterion from the American Speech-Language-Hearing Association (ASHA) (1997). According to Figure 6, the average absorbance of the OCT-identified control group (n = 5) in this study was close to the normative dataset. There were four ears diagnosed as normal, but MEEs were identified by OCT (black dash dot line in Fig. 6). Three of the four ears showed the absorbance peak between 0.8 and 2 kHz. In addition, the average absorbance of the biofilm group (n = 5) showed a reverse (decreasing) slope occurred between 0.5 and 2 kHz, as supported by a previous study (Nguyen et al. 2013), but not every measurement had a positive slope followed by a reverse slope. The difference might be from small subject numbers, different structures, and amounts of biofilms between subjects, and also from a much younger (pediatric) age than the study with adults (older than 25 years) from Nguyen et al. (2013).
Fig. 6.
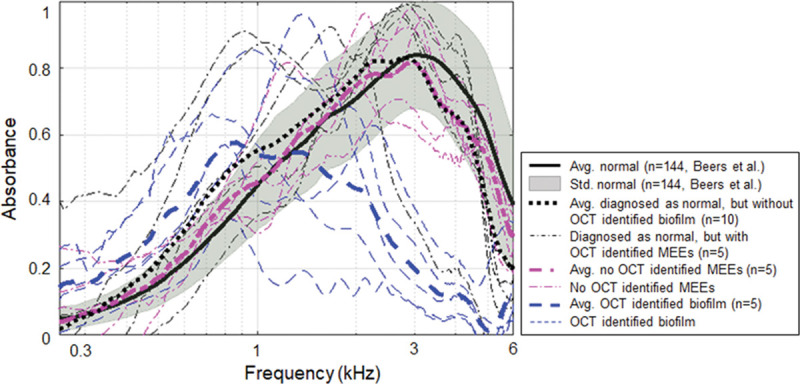
Power absorbance curves of normal subjects compared with subjects with MEEs. Plot of power absorbance levels of normative pediatric datasets from Beers et al. (2010), compared with the average power absorbance levels of the diagnosis-based normal group, no OCT-identified MEE group, and the biofilm group (category 1). Normative datasets were used with permission from Ear Hear, 2010;31, 221–233. MEE indicates middle ear effusion; OCT, optical coherence tomography.
Effect of Relative MEE Turbidity: Category 2
Figure 7 illustrates the effect of MEE type on absorbance measurements (A) and admittance phase in degrees (B). Category 2 divided the subjects into serous (n = 6) and mucoid (n = 6) MEE groups using the estimated attenuation coefficient from OCT images. Representative OCT images from the serous and mucoid groups of MEEs are shown in Figure 4A, B. In general, the absorbance of the mucoid MEE group was less than that of the serous group. The absorbance of these groups was statistically different from 2.72 to 6 kHz (p < 0.05), as determined by ANOVA. To compare multiple groups and determine the frequency range that the difference occurred, a posthoc Tukey HSD test was performed. Note that the analysis is done for all 248 frequencies, but only statistical results (ANOVA, posthoc Tukey, and descriptive statistics) for the 1/3 octave band center frequencies are shown in Table 3. A posthoc Tukey HSD test showed that the absorbance of the mucoid group was significantly less than the control group from 2.90 to 6 kHz (p < 0.05). However, the absorbance of serous MEEs was significantly different from the control group only at frequencies greater than 5.09 kHz. This indicates that mucoid MEEs may decrease power absorbance more than serous MEEs. In addition, the absorbance level of mucoid MEEs was statistically less than that of serous MEEs from 2.74 to 4.73 kHz (p < 0.05). However, note that this result is not consistent with a previous study, which showed that the viscosity of MEEs does not have a significant effect on hearing measurements in cadaveric ears (Ravicz et al. 2004). The admittance phase among the normal, the serous, and the mucoid group was statistically different from 2.3 to 2.9 kHz and 5.0 to 6.0 kHz (p < 0.05) determined from ANOVA. A posthoc Tukey HSD test indicated that the phase of the serous group and the control group was not statistically different. However, the phase of the mucoid group was significantly less than that of the serous and the control group from 2.3 to 2.9 kHz and from 5.0 to 6 kHz (p < 0.05).
Fig. 7.
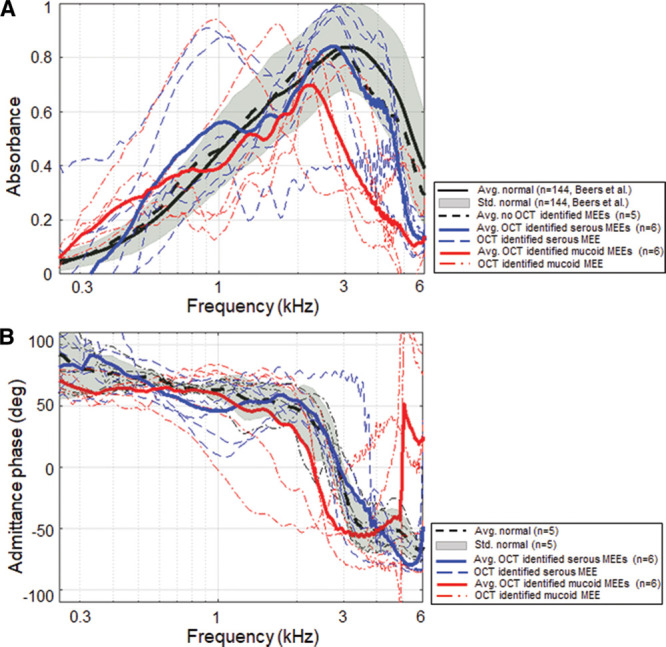
Effect of relative MEE viscosity on power absorbance measurements. Comparison of power absorbance levels (A) and the admittance phase (B) for the control, serous, and mucoid MEE groups (category 2). MEE indicates middle ear effusion; OCT, optical coherence tomography.
Effect of Relative MEE Amount: Category 3
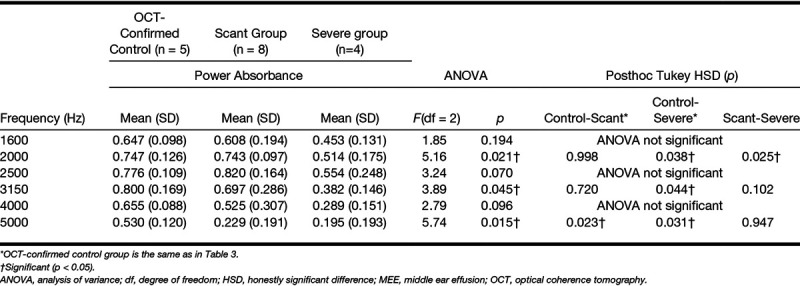
Figure 8 illustrates the effect of the amount of MEE on absorbance measurements (A) and admittance phase in degrees (B). Category 3 defined the groups of scant amount (n = 8) and severe amount (n = 4) of MEE based on the consecutive OCT B-scans. Representative OCT images from the scant and severe amount groups of MEEs are shown in Figure 5A, B. Again, the analysis is done for all individual 248 frequencies, but statistical results (ANOVA, posthoc Tukey, and descriptive statistics) at 1/3 octave band center frequencies are shown in Table 4. The absorbance of these groups was statistically different from 1.73 to 2.34 kHz, from 2.91 to 3.30 kHz, and from 4.71 to 6 kHz, as determined by ANOVA. As expected, a posthoc Tukey HSD revealed that the power absorbance of the severe amount group was significantly less than that of the control group from 1.76 to 2.09 kHz, from 2.95 to 3.50 kHz, from 3.75 to 3.94 kHz, and from 4.73 to 6 kHz (all p < 0.05), likely due to the greater mass impeding the middle ear system. However, the scant amount group was statistically different from the control group only at frequencies greater than 4.85 kHz. This indeed agrees with previous cadaveric studies that a small amount of MEE relative to the volume of the middle ear cavity has a minimal effect on WAI measurements (Voss et al. 2012). When comparisons are made between the scant and severe amount groups, the absorbance of the severe amount group was significantly less than that of the scant group between 1.92 and 2.37 kHz (p < 0.05). This implies that the greater amount of MEE may decrease the power absorbance more at frequencies around 2 kHz. However, the admittance phase between the control, the scant, and the severe group was not statistically significant from ANOVA.
Fig. 8.
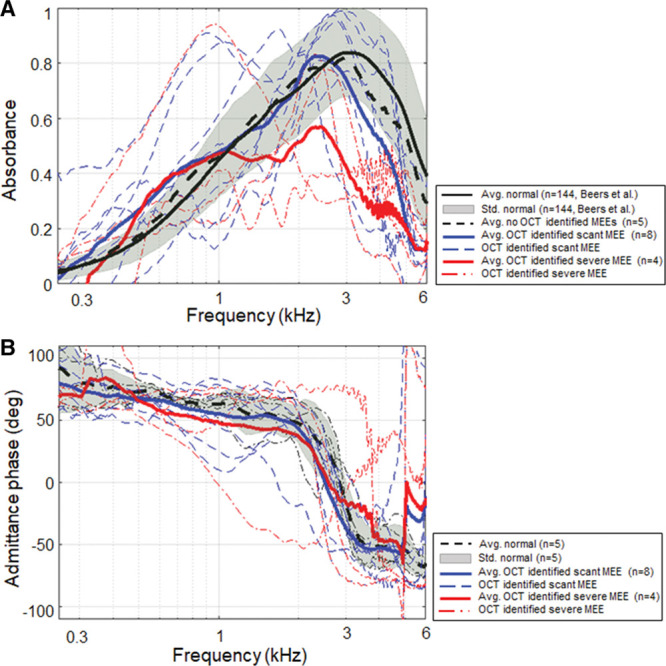
Effect of relative MEE fluid level on power absorbance measurements. Comparison of power absorbance levels (A) and the admittance phase (B) for the control, scant, and severe MEE groups (category 3). MEE indicates middle ear effusion; OCT, optical coherence tomography.
TABLE 4.
Summarized statistical analysis at 1/3 octave bands center frequency: effect of relative MEE amount on absorbance (category 3)
Effect of Relative MEE Turbidity and Amount: Category 4
It is intuitive that ears within the serous MEE group can have different amounts of middle ear fluid and vice versa. To further understand the effect of the type and amount independently, category 4 divided the subjects into four groups (serous-scant [n = 4], mucoid-scant [n = 4], serous-severe [n = 2], and mucoid-severe [n = 2] MEE groups). Statistical comparisons between the groups were performed (shown in Fig. 9) to determine if absorbance measurements can uniquely define each group. As a result, the absorbance of these 5 groups (1 control group and 4 MEE groups) was statistically different at around 1.9 kHz and from 2.48 to 6 kHz, as determined by ANOVA. A posthoc Tukey HSD test revealed that the absorbance of the mucoid-severe group was significantly less than that of the control group from 2.77 to 4.66 kHz (p < 0.05), and less than the serous-scant group from 2.51 to 4.64 kHz (p < 0.05). Similarly, the absorbance of mucoid-scant group was less than that of the control group from 3.68 to 5.25 kHz (p < 0.05), and less than the serous-scant group from 2.65 to 4.71 kHz (p < 0.05). In addition, the absorbance of serous-severe group was less than that of the serous-scant group from 3.75 to 4.41 kHz (p < 0.05), but less than that of the control group at around 3.9 kHz. Other possible correlations between groups showed no statistical differences. Statistical results (ANOVA, post hoc Tukey, and descriptive statistics) at 1/3 octave band center frequencies for category 4 are shown in Table 5. However, it is important to note that this exploratory study is conducted with a limited number of subjects, and the comparison of 5 different groups (control and 4 MEE groups) using category 4 is statistically underpowered.
Fig. 9.
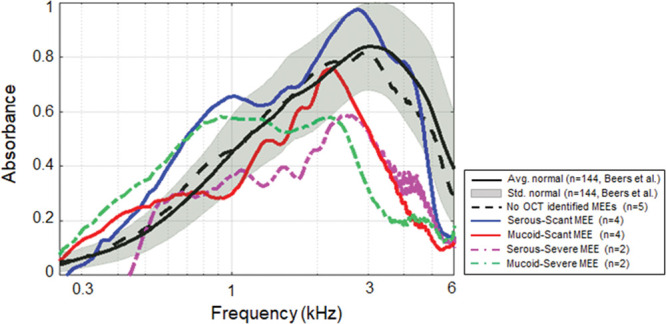
Effects of different types and amounts of MEE on power absorbance curves. Comparison of the average power absorbance curves for the control group and four different subgroups of subjects with MEEs (category 4). MEE indicates middle ear effusion.
In general, the serous-scant group showed similar power absorbance levels as the control group, whereas the severe group showed a decreased and flatter shape of the power absorbance curve. The four groups were more uniquely distributed at around 1.9 and 4.1 kHz. This result again agrees with other studies that indicated a large variation at higher frequency (Beers et al. 2010; Ellison et al. 2012; Sanford & Brockett 2014), and suggests that this variation indeed depends on the type and amount of MEE. In addition, the similar trends were observed between the mucoid-scant and serous-severe groups, and between the mucoid-severe and serous-severe groups, based on the p values. This may indicate that these groups have a similar effect on mass and stiffness of the middle ear system.
DISCUSSION
Because WAI measurements can noninvasively provide functional acoustic measurements over a wide range of frequencies, many investigations have correlated abnormal WAI measurements with pathological conditions of the middle ear to determine existing relationships. However, noninvasively accessing the physical characteristics of the middle ear and any MEE has been challenging due to the limitations of current middle ear diagnostic tools. For instance, to examine the effect of MEEs on WAI for in vivo human ears, the presence of a MEE may need to be confirmed by myringotomy (gold standard) and visual inspection, and the extracted MEE may be analyzed after the surgery. This process, however, is not only invasive and time consuming but also limits the subjects to more severe stages of OM. For this study, the effects of the types and amounts of MEEs on WAI measurements were investigated by correlating power absorbance levels with physical characteristics of MEEs determined noninvasively from OCT images.
Performance of OCT in Describing Middle Ear Space
It is worthwhile to first discuss the sensitivity of OCT in determining middle ear conditions. For this study, in vivo subject categorization with OCT images was compared with physician diagnosis and tympanometry. Overall, the physician diagnosis and tympanograms agreed well with OCT images for the more severe stages of OM. However, some inconsistencies among physician diagnosis, tympanometry, and OCT images were observed for the early stages of OM. For example, while a total of 7 ears were diagnosed with OM by primary care physicians, 12 ears (an increase of 71%) were identified with MEEs from OCT images, highlighting a potentially greater sensitivity of OCT for detecting the presence of a MEE, compared with otoscopy. In terms of tympanometry, 5 (42%) of 12 ears with OCT-identified MEEs showed a “type A” tympanogram, due to the low specificity of tympanometry and its tendency to underestimate the presence of a MEE. On the other hand, 4 (80%) of 5 ears with “type B” tympanograms did show MEEs in OCT, emphasizing the high sensitivity of tympanometry. One remaining ear with a “type B” tympanogram contained a middle ear biofilm. Furthermore, 5 (33%) of 15 ears diagnosed as normal showed biofilms in OCT, and another 5 (33%) showed scant MEEs in OCT. The OCT abnormalities may indicate the presence of latent localized TM thickenings in normal ears, and it may be a result of previous ear infections. Nonetheless, these inconsistencies suggest that a more accurate diagnostic tool is needed to more precisely define middle ear pathologies. The detailed comparison of tympanometry, physician diagnoses from otoscopy, and OCT findings is also included in Table 2.
Effect of MEEs
Although several studies have suggested a common profile of ears with any type of MEE in WAI measurements, an appreciable amount of variability is still observed among ears, especially at mid-to-high frequencies (Beers et al. 2010; Ellison et al. 2012; Feeney et al. 2003; Sanford & Brockett 2014; Voss et al. 2012). The possible reasons for this large variability mainly include the amount and type of MEE as well as the relative volume of the middle ear cavity. According to Figure 9, the large variation between the four groups in category 4 occurred between 2 and 5 kHz, and the statistical analysis suggested that this variation may depend on both the type and amount of MEE. A narrow, high absorbance peak of the serous-scant group is similar to some of the findings from Sanford and Brockett (2014), where they defined “sOME” (suspected otitis media with effusion) to represent loosely defined OME group (Sanford & Brockett 2014). They noted a narrow absorbance peak at approximately 4 kHz, but with varying magnitude across subjects. We believe that this narrow peak absorbance at 3 to 4 kHz may be inversely related to the amount of MEEs. However, the average trend of the OCT-identified MEE groups from this study did not show the same pattern as in previous studies (Ellison et al. 2012; Sanford & Brockett 2014), likely because subjects with a wide range of ages (1.3 to 15 years) and subjects with various types and stages of OM were included. Thus, a more narrowly defined inclusion criteria for middle ear conditions and ages with a greater number of subjects is necessary for further validation and investigation.
This preliminary study also focused on understanding power absorbance measurements of pediatric subjects with varying stages of OM. The subjects were pediatric outpatients from a primary care clinic, including normal subjects, subjects with early stages of OM, recurrent OM, and advanced stages of OM, who could potentially be referred to specialists. The serous-scant group of category 4 may best represent an early stage of OM. All subjects in this group were indeed diagnosed as having a normal middle ear by their primary care physicians and were found to have a “type A” tympanogram; however, MEEs were identified in their OCT images. Thus, it was not surprising that there was no statistically significant difference in power absorbance levels between the control group from category 1 and this group. This also suggests that the power absorbance is not sensitive enough to detect small amounts of fluid in a MEE. On the other hand, the mucoid-severe and the serous-severe groups of category 4 may best represent a more advanced stage of OM. They showed the greatest statistical differences between all other groups and showed the most deviated and flat trend of power absorbance compared with the control group, as expected.
Study Limitations
While this early exploratory study examined the effect of MEEs on WAI measurements with a novel imaging system that noninvasively characterized the middle ear state, there were several limitations. First, this study is conducted with a limited number of subjects. The possibility of significant type II errors in hypothesis testing implies that there may exist statistical differences at more frequencies. The appropriate sample number to have a statistical power of 0.8 depends on the frequency, because some frequencies are more sensitive with the presence of MEEs than other frequencies. The number also depends on which groups to compare, as comparing the control group with the serous-scant MEE group may need a greater sample number than comparing with the mucoid-severe MEE group, due to the smaller mean difference. For example, the sample number of greater than 12 and 14 is necessary to compare the control group with the serous-scant MEE group with a statistical power of 0.8 at 2 and 4 kHz, respectively. The larger datasets are required to determine the precise diagnostic value of sound absorbance spectrum in describing different middle ear conditions.
Second, the age range (1.3 to 15 years) of the subjects was large and possibly contributed to some of the variability in the WAI measurements. Third, the measurements were all performed in a typical examination room during a short period of time to ensure the clinic schedule was not disturbed. However, the examination room was not noise-free, which may have induced subtle background noise in the WAI measurements. Next, WAI measurements were not repeated in all subjects due to time constraints. However, WAI measurements were repeated when an air-leak was indicated. Because of these factors, datasets with greater air-leak artifacts and noise were not included in the analysis. In addition, the statistical significance was observed only at higher frequencies (>1 kHz), where the effect of an air-leak is less significant compared with lower frequencies (Groon et al. 2015).
Finally, the MEP of subjects was not utilized to categorize the ears, as “type B” tympanograms cannot determine the MEP. In addition, there were some disagreements among physician diagnosis, OCT categories, and tympanometry, as shown in Table 2, which required more subgroups with the MEP to understand the effect of MEP and MEEs on the sound absorbance. Although it is clinically normal to have slightly negative MEP, several studies have discussed the effects of negative MEP on WAI measurements, and showed that the effects are dominant around 1 to 2 kHz (Voss et al. 2012, Shaver & Sun 2013, Robinson et al. 2016). This present study has not found strong statistical significance with MEE categories around 1 to 2 kHz, and the variations from the MEP could be one reason, with the small sample size being another reason. However, Robinson et al. (2016) also showed that the effects of MEP on the sound absorbance are indeed minor, unless the pressure is very extreme as −400 daPa (Robinson et al. 2016). For a future study, a greater number of subjects with more narrowly defined middle ear pathologies will be necessary to study the effects of MEP along with the presence of MEEs.
In terms of imaging limitations, because OCT images were only acquired near the light reflex area with an imaging depth of a few millimeters, OCT cross-sectional images may not represent the conditions throughout the entire middle ear cavity. For example, if a small amount of MEE were present deeper or lower in the middle ear cavity, OCT would not be able to detect the presence of MEE. However, as all subjects were asked to sit during the measurements, we believe that scanning around the light reflex region, typically located on the bottom of the TM, was a consistent and sufficient way to visualize MEE accumulation. Furthermore, OCT can distinguish between MEE in contact with the TM from MEE not in contact with the TM, if the MEE is within the imaging depth of OCT. In the future, with an additional 3D scanning mechanism to scan the entire TM, the effect of the percentage of the TM contacted by fluid on hearing levels can be investigated in vivo, as Ravicz et al. (2004) previously showed with a human cadaver temporal bone (Ravicz et al. 2004).
CONCLUSIONS
By using OCT as a depth-resolved imaging technique for the middle ear, this preliminary study has noninvasively correlated power absorbance levels with the presence, type, and amount of MEE. The power absorbance levels of mucoid MEEs were statistically less than that of serous MEEs from 2.74 to 4.74 kHz (p < 0.05). Furthermore, the power absorbance of the severe amount MEEs was statistically less than that of the scant amount from 1.92 to 3.27 kHz (p < 0.05). The correlations between the four subgroups in category 4 indicate that the large variance of the WAI measurements in the 2 to 5 kHz range may depend on the type and amount of the MEE. In addition, the serous-scant MEE group showed no statistical significance from the control group, suggesting that perhaps power absorbance alone is not sensitive enough to detect early stages of OM. As OCT can provide a higher sensitivity by noninvasively detecting and assessing MEEs, studying abnormal WAI measurements in conjunction with OCT may be a beneficial way to better understand the complex acoustic responses of the middle ear.
ACKNOWLEDGMENTS
The authors thank Paula Bradley, Alexandra Almasov, and Deveine Toney from the Carle Research Office at Carle Foundation Hospital, Urbana, IL, for their help with IRB protocol management, and subject consenting and assenting. The authors acknowledge Dr. Ada C. K. Sum, Dr. Neena Tripathy, and Dr. Stephanie A. Schroeder from the Department of Pediatrics at Carle Foundation Hospital for their help in subject recruitment. The authors also thank the nursing staff in the Department of Pediatrics at Carle Foundation Hospital for their clinical assistance. Finally, the authors acknowledge Dr. Navid Shahnaz for providing pediatric normative wideband reflectance datasets published in Beers et al. (2010).
Footnotes
This research was funded in part by a Bioengineering Research Partnership grant from the National Institute for Biomedical Imaging and Bioengineering at the National Institutes of Health (R01 EB013723, S.A.B.).
J.W. designed experiments, collected and analyzed data, and drafted the paper; G.L.M. designed experiments, collected data, and edited the paper; P.-C.H. collected data and edited the paper; M.C.H., M.A.N., and R.G.P. collected data and reviewed and edited the paper; E.J.C. and R.B. generated and managed IRB protocol and edited the paper; S.A.B. designed experiments, analyzed data, reviewed and edited the paper, and obtained funding for the study.
S.A.B. is a co-founder and Chief Medical Officer of PhotoniCare, Inc.. M.A.N. has equity interest in and serves on the clinical advisory board of PhotoniCare, Inc.
References
- Allen J. B., Hall J. L., Hubbard A. Allen J. B., Hall J. L., Hubbard A. E., et al. Measurement of eardrum acoustic impedance. In Peripheral Auditory Mechanisms. (1986). Berlin, Heidelberg: Springer, [Google Scholar]
- Allen J. B., Jeng P. S., Levitt H. Evaluation of human middle ear function via an acoustic power assessment. J Rehabil Res Dev, (2005). 42(4 Suppl 2), 63–78. [DOI] [PubMed] [Google Scholar]
- American Speech-Language-Hearing Association (ASHA). (Guideline for Audiologic Screening (pp. (1997). Rockville, MD: ASHA; 39–1). [Google Scholar]
- Beers A. N., Shahnaz N., Westerberg B. D., et al. Wideband reflectance in normal Caucasian and Chinese school-aged children and in children with otitis media with effusion. Ear Hear, (2010). 31, 221–233. [DOI] [PubMed] [Google Scholar]
- Blomgren K., Pitkäranta A. Is it possible to diagnose acute otitis media accurately in primary health care? Fam Pract, (2003). 20, 524–527. [DOI] [PubMed] [Google Scholar]
- Casey J. R., Pichichero M. E. (2015). Acute otitis media: Update 2015. Retrieved July 24, 2017 from http://contemporarypediatrics.modernmedicine.com/contemporary-pediatrics/news/acute-otitis-media-update-2015.
- Casselbrant M., Mandel E. M. Rosenfeld R. M., Bluestone C. D. Evidence-Based Otitis Media (pp. (1999). Epidemiology. In Shelton, CT: PMPH-USA; 117–136.). [Google Scholar]
- Chang E. W., Cheng J. T., Röösli C., et al. Simultaneous 3D imaging of sound-induced motions of the tympanic membrane and middle ear ossicles. Hear Res, (2013). 304, 49–56. [DOI] [PMC free article] [PubMed] [Google Scholar]
- Cho N. H., Lee S. H., Jung W., et al. Optical coherence tomography for the diagnosis and evaluation of human otitis media. J Korean Med Sci, (2015). 30, 328–335. [DOI] [PMC free article] [PubMed] [Google Scholar]
- Cullas Ilarslan N. E., Gunay F., Topcu S., et al. Evaluation of clinical approaches and physician adherence to guidelines for otitis media with effusion. Int J Pediatr Otorhinolaryngol, (2018). 112, 97–103. [DOI] [PubMed] [Google Scholar]
- Ellison J. C., Gorga M., Cohn E., et al. Wideband acoustic transfer functions predict middle-ear effusion. Laryngoscope, (2012). 122, 887–894. [DOI] [PMC free article] [PubMed] [Google Scholar]
- Feeney M. P., Sanford C. A. Detection of the acoustic stapedius reflex in infants using wideband energy reflectance and admittance. J Am Acad Audiol, (2005). 16, 278–290. [DOI] [PubMed] [Google Scholar]
- Feeney M. P., Grant I. L., Marryott L. P. Wideband energy reflectance measurements in adults with middle-ear disorders. J Speech Lang Hear Res, (2003). 46, 901–911. [DOI] [PubMed] [Google Scholar]
- Feeney M. P., Hunter L. L., Kei J., et al. Consensus statement: Eriksholm workshop on wideband absorbance measures of the middle ear. Ear Hear, (2013). 34(Suppl 1), 78–79. [DOI] [PubMed] [Google Scholar]
- Groon K. A., Rasetshwane D. M., Kopun J. G., et al. Air-leak effects on ear-canal acoustic absorbance. Ear Hear, (2015). 36, 155–163. [DOI] [PMC free article] [PubMed] [Google Scholar]
- Guder E., Lankenau E., Fleischhauer F., et al. Microanatomy of the tympanic membrane in chronic myringitis obtained with optical coherence tomography. Eur Arch Otorhinolaryngol, (2015). 272, 3217–3223. [DOI] [PubMed] [Google Scholar]
- Haggard M; MRC Multi-centre Otitis Media Study Group. (Air-conduction estimated from tympanometry (ACET): 2. The use of hearing level-ACET discrepancy (HAD) to determine appropriate use of bone-conduction tests in identifying permanent and mixed impairments. Int J Pediatr Otorhinolaryngol, (2009). 73, 43–55. [DOI] [PubMed] [Google Scholar]
- Harris P. K., Hutchinson K. M., Moravec J. The use of tympanometry and pneumatic otoscopy for predicting middle ear disease. Am J Audiol, (2005). 14, 3–13. [DOI] [PubMed] [Google Scholar]
- Henriksen V. Using impedance measurements to detect and quantify the effect of air leaks on the attenuation of earplugs. J Acoust Soc Am, (2008). 124, 510–522. [DOI] [PubMed] [Google Scholar]
- Huang D., Swanson E. A., Lin C. P., et al. Optical coherence tomography. Science, (1991). 254, 1178–1181. [DOI] [PMC free article] [PubMed] [Google Scholar]
- Hubler Z., Shemonski N. D., Shelton R. L., et al. Real-time automated thickness measurement of the in vivo human tympanic membrane using optical coherence tomography. Quant Imaging Med Surg, (2015). 5, 69–77. [DOI] [PMC free article] [PubMed] [Google Scholar]
- Jones W. S., Kaleida P. H. How helpful is pneumatic otoscopy in improving diagnostic accuracy? Pediatrics, (2003). 112(3 Pt 1), 510–513. [DOI] [PubMed] [Google Scholar]
- Keefe D. H., Sanford C. A., Ellison J. C., et al. Wideband aural acoustic absorbance predicts conductive hearing loss in children. Int J Audiol, (2012). 51, 880–891. [DOI] [PMC free article] [PubMed] [Google Scholar]
- Lieberthal A. S., Carroll A. E., Chonmaitree T., et al. The diagnosis and management of acute otitis media. Pediatrics, (2013). 131, e964–e999. [DOI] [PubMed] [Google Scholar]
- MacDougall D., Rainsbury J., Brown J., et al. Optical coherence tomography system requirements for clinical diagnostic middle ear imaging. J Biomed Opt, (2015). 20, 56008. [DOI] [PubMed] [Google Scholar]
- MacDougall D., Farrell J., Brown J., et al. Long-range, wide-field swept-source optical coherence tomography with GPU accelerated digital lock-in Doppler vibrography for real-time, in vivo middle ear diagnostics. Biomed Opt Express, (2016). 7, 4621–4635. [DOI] [PMC free article] [PubMed] [Google Scholar]
- Monasta L., Ronfani L., Marchetti F., et al. Burden of disease caused by otitis media: Systematic review and global estimates. PLoS One, (2012). 7, e36226. [DOI] [PMC free article] [PubMed] [Google Scholar]
- Monroy G. L., Shelton R. L., Nolan R. M., et al. Noninvasive depth-resolved optical measurements of the tympanic membrane and middle ear for differentiating otitis media. Laryngoscope, (2015). 125, E276–E282. [DOI] [PMC free article] [PubMed] [Google Scholar]
- Monroy G. L., Pande P., Shelton R. L., et al. Non-invasive optical assessment of viscosity of middle ear effusions in otitis media. J Biophotonics, 2017a). 10, 394–403. [DOI] [PMC free article] [PubMed] [Google Scholar]
- Monroy G. L., Won J., Spillman D. R., et al. Clinical translation of handheld optical coherence tomography: Practical considerations and recent advancements. J Biomed Opt, 2017b). 22, 1. [DOI] [PMC free article] [PubMed] [Google Scholar]
- Monroy G. L., Hong W., Khampang P., et al. Direct analysis of pathogenic structures affixed to the tympanic membrane during chronic otitis media. Otolaryngol Head Neck Surg, (2018). 159, 117–126. [DOI] [PMC free article] [PubMed] [Google Scholar]
- Nguyen C. T., Tu H., Chaney E. J., et al. Non-invasive optical interferometry for the assessment of biofilm growth in the middle ear. Biomed Opt Express, (2010). 1, 1104–1116. [DOI] [PMC free article] [PubMed] [Google Scholar]
- Nguyen C. T., Jung W., Kim J., et al. Noninvasive in vivo optical detection of biofilm in the human middle ear. Proc Natl Acad Sci U S A, (2012). 109, 9529–9534. [DOI] [PMC free article] [PubMed] [Google Scholar]
- Nguyen C. T., Robinson S. R., Jung W., et al. Investigation of bacterial biofilm in the human middle ear using optical coherence tomography and acoustic measurements. Hear Res, (2013). 301, 193–200. [DOI] [PMC free article] [PubMed] [Google Scholar]
- Nozza R. J., Bluestone C. D., Kardatzke D., et al. Identification of middle ear effusion by aural acoustic admittance and otoscopy. Ear Hear, (1994). 15, 310–323. [DOI] [PubMed] [Google Scholar]
- Onusko E. Tympanometry. Am Fam Physician, (2004). 70, 1713–1720. [PubMed] [Google Scholar]
- Palmu A., Puhakka H., Rahko T., et al. Diagnostic value of tympanometry in infants in clinical practice. Int J Pediatr Otorhinolaryngol, (1999). 49, 207–213. [DOI] [PubMed] [Google Scholar]
- Pichichero M. E. Diagnostic accuracy of otitis media and tympanocentesis skills assessment among pediatricians. Eur J Clin Microbiol Infect Dis, (2003). 22, 519–524. [DOI] [PubMed] [Google Scholar]
- Pichichero M. E., Poole M. D. Comparison of performance by otolaryngologists, pediatricians, and general practitioners on an otoendoscopic diagnostic video examination. Int J Pediatr Otorhinolaryngol, (2005). 69, 361–366. [DOI] [PubMed] [Google Scholar]
- Pitris C., Saunders K. T., Fujimoto J. G., et al. High-resolution imaging of the middle ear with optical coherence tomography: A feasibility study. Arch Otolaryngol Head Neck Surg, (2001). 127, 637–642. [DOI] [PubMed] [Google Scholar]
- Qureishi A., Lee Y., Belfield K., et al. Update on otitis media - prevention and treatment. Infect Drug Resist, (2014). 7, 15–24. [DOI] [PMC free article] [PubMed] [Google Scholar]
- Ramier A., Rosowski J. J., Yun S. Optical coherence tomography for imaging the middle and inner ears: A technical review. AIP Conference Proceedings, (2018). 1965. [Google Scholar]
- Ravicz M. E., Rosowski J. J., Merchant S. N. Mechanisms of hearing loss resulting from middle-ear fluid. Hear Res, (2004). 195, 103–130. [DOI] [PubMed] [Google Scholar]
- Robinson S. R., Thompson S., Allen J. B. Effects of negative middle ear pressure on wideband acoustic immittance in normal-hearing adults. Ear Hear, (2016). 37, 452–464. [DOI] [PubMed] [Google Scholar]
- Rosenfeld R. M., Shin J. J., Schwartz S. R., et al. Clinical practice guideline: Otitis media with effusion (update). Otolaryngol Head Neck Surg, (2016). 154(1 Suppl), S1–S41. [DOI] [PubMed] [Google Scholar]
- Rosowski J. J., Stenfelt S., Lilly D. An overview of wideband immittance measurements techniques and terminology: You say absorbance, I say reflectance. Ear Hear, (2014). 34, 9S–16S. [DOI] [PMC free article] [PubMed] [Google Scholar]
- Rosowski J. J., Nakajima H. H., Hamade M. A., et al. Ear-canal reflectance, umbo velocity, and tympanometry in normal-hearing adults. Ear Hear, (2012). 33, 19–34. [DOI] [PMC free article] [PubMed] [Google Scholar]
- Sanford C. A., Brockett J. E. Characteristics of wideband acoustic immittance in patients with middle-ear dysfunction. J Am Acad Audiol, (2014). 25, 425–440. [DOI] [PubMed] [Google Scholar]
- Sassen M. L., van Aarem A., Grote J. J. Validity of tympanometry in the diagnosis of middle ear effusion. Clin Otolaryngol Allied Sci, (1994). 19, 185–189. [DOI] [PubMed] [Google Scholar]
- Shahnaz N., Feeney M. P., Schairer K. S. Wideband acoustic immittance normative data: Ethnicity, gender, aging, and instrumentation. Ear Hear, (2013). 34(Suppl 1), 27–35. [DOI] [PubMed] [Google Scholar]
- Shahnaz N., Bork K., Polka L., et al. Energy reflectance and tympanometry in normal and otosclerotic ears. Ear Hear, (2009). 30, 219–233. [DOI] [PubMed] [Google Scholar]
- Shaver M. D., Sun X. M. Wideband energy reflectance measurements: Effects of negative middle ear pressure and application of a pressure compensation procedure. J Acoust Soc Am, (2013). 134, 332–341. [DOI] [PubMed] [Google Scholar]
- Shelton R. L., Nolan R. M., Monroy G. L., et al. Quantitative pneumatic otoscopy using a light-based ranging technique. J Assoc Res Otolaryngol, (2017). 18, 555–568. [DOI] [PMC free article] [PubMed] [Google Scholar]
- Tan H. E. I., Santa Maria P. L., Wijesinghe P., et al. Optical coherence tomography of the tympanic membrane and middle ear: A review. Otolaryngol Head Neck Surg, (2018). 159, 424–438. [DOI] [PubMed] [Google Scholar]
- Teele D. W., Klein J. O., Rosner B. Epidemiology of otitis media during the first seven years of life in children in greater Boston: A prospective, cohort study. J Infect Dis, (1989). 160, 83–94. [DOI] [PubMed] [Google Scholar]
- Tong S., Amand C., Kieffer A., et al. Trends in healthcare utilization and costs associated with pneumonia in the United States during 2008-2014. BMC Health Serv Res, (2018). 18, 715. [DOI] [PMC free article] [PubMed] [Google Scholar]
- Vermeer K. A., Mo J., Weda J. J., et al. Depth-resolved model-based reconstruction of attenuation coefficients in optical coherence tomography. Biomed Opt Express, (2013). 5, 322–337. [DOI] [PMC free article] [PubMed] [Google Scholar]
- Vignali L., Solinas E., Emanuele E. Research and clinical applications of optical coherence tomography in invasive cardiology: A review. Curr Cardiol Rev, (2014). 10, 369–376. [DOI] [PMC free article] [PubMed] [Google Scholar]
- Voss S. E., Merchant G. R., Horton N. J. Effects of middle-ear disorders on power reflectance measured in cadaveric ear canals. Ear Hear, (2012). 33, 195–208. [DOI] [PMC free article] [PubMed] [Google Scholar]
- Wang J., Xu Y., Boppart S. A. Review of optical coherence tomography in oncology. J Biomed Opt, (2017). 22, 1–23. [DOI] [PMC free article] [PubMed] [Google Scholar]
- Watson R. L., Dowell S. F., Jayaraman M., et al. Antimicrobial use for pediatric upper respiratory infections: Reported practice, actual practice, and parent beliefs. Pediatrics, (1999). 104, 1251–1257. [DOI] [PubMed] [Google Scholar]
- Welzel J. Optical coherence tomography in dermatology: A review. Skin Res Technol, (2001). 7, 1–9. [DOI] [PubMed] [Google Scholar]
- Won J., Monroy G. L., Huang P. C., et al. Pneumatic low-coherence interferometry otoscope to quantify tympanic membrane mobility and middle ear pressure. Biomed Opt Express, (2018). 9, 397–409. [DOI] [PMC free article] [PubMed] [Google Scholar]


