Abstract
Background
We explored the role of MACC1-AS1 in hepatocellular carcinoma (HCC).
Material/Methods
Measurement of preoperative plasma levels of MACC1-AS1 was performed by qPCR, and the comparison between the HCC and Control group was performed by unpaired t test. The overexpression of TGF-β1 in SNU-182 and SNU-398 cells was confirmed by qPCR.
Results
MACC1-AS1 was overexpressed in HCC patients. In comparison to pretreatment level, distant recurrence (DR) was accompanied by increased levels of MACC1-AS1 in plasma, but this phenomenon was not observed in cases of local recurrence (LR) or non-recurrence (NR). In HCC cells, MACC1-AS1 positively regulated the expression of TGF-β1. MACC1-AS1 overexpression resulted in increased invasion and migration rates of HCC cells, while siRNA silencing resulted in reduced rates. Moreover, TGF-β1 overexpression reduced the effects of MACC1-AS1 siRNA silencing.
Conclusions
MACC1-AS1 is involved in the distant recurrence of HCC, and its actions are possibly mediated by TGF-β1.
MeSH Keywords: Accommodation, Ocular; Carcinoma, Hepatocellular; Recurrence
Background
According to the latest GLOBOCAN statistics, there were 841 080 new cases (4.7% of all cases) of liver cancer, causing 781 631 deaths (8.2% of all cancer deaths) [1]. No decreasing trend was observed in liver cancer [2,3] and almost all HCC patients will eventually die of this disease. Hepatocellular carcinoma (HCC) accounts for most cases of liver cancer [4]. Clinical treatment of HCC is challenged by the high prevalence of cancer metastasis by the time of initial diagnosis [5]. HCC at early stages may be treated with resection of the primary tumor, but recurrence is common and survival is poor [6,7].
TGF-β signaling plays essential roles in cancer metastasis, mainly by inducing epithelial-to-mesenchymal transition (EMT) [8]. Therefore, inactivation of TGF-β signaling is a promising therapeutic approach for cancer treatment [9,10]. In effect, specific miRNAs, such as miR-663, target TGF-β1 to play tumor-suppressive roles [11]. Long (>200 nt) non-coding RNAs (lncRNAs) may sponge miRNAs and inhibit their functions [12]. MACC1-AS1 is an oncogenic lncRNA in gastric cancer [13,14]. Our study observed that MACC1-AS1 can bind miR-663. We therefore investigated the interactions between MACC1-AS1 and miR-663 in HCC and explored the effects on TGF-β1 expression.
Material and Methods
HCC patients
This study was approved by the review board of the Ethics Committee of Qingdao Sixth People’s Hospital of Shandong Province. This study enrolled 80 HCC patients (47 males and 33 females; 37 to 67 years, 51.6±6.6 years) from among the 227 HCC cases admitted to the Qingdao Sixth People’s Hospital of Shandong Province from April 2011 to April 2014. Inclusion criteria: 1) new cases of HCC; 2) stage I and II cases suitable for surgical resection. Exclusion criteria: 1) recurrent cases; 2) therapies were initiated; 3) multiple clinical disorders were diagnosed. We also enrolled 80 healthy volunteers (47 males and 33 females; 36 to 66 years, 51.3±6.4 years) from among visitors to the physiological healthy center of the hospital. All participants were informed of the details of experimental design and potential publication of the data. All participants (80 HCC patients and 80 healthy volunteers) signed informed consent.
Treatment, follow-up and plasma samples
All patients received surgical resection of the primary tumor. According to patients’ conditions, chemotherapy and radiotherapy were also performed. From the day of admission (before therapies), all patients were monitored for 5 years to record disease recurrence. Blood was extracted at 4 timepoints: 1) on the day of admission (both patients and healthy volunteers); 2) 3 months after surgical resection (only patients); 3) diagnosis of recurrence; 4) end of follow-up, if recurrence did not occur (only patients). Blood samples were centrifuged in EDTA tubes for 15 min at 1200 g to separate plasma.
Cells and transfections
SNU-182 and SNU-398 human HCC cell lines (ATCC, USA) were used. FBS was mixed with RPMI 1640 medium with a ratio of 1: 9 to prepare cell culture medium. Cells were cultivated at 37°C. PcDNA 3.1 vectors expressing MACC1-AS1 or TGF-β1, as well as negative control (NC) siRNA and MACC1-AS1 siRNA, were from Sangon (Shanghai, China). Cells were harvested at 70–80% confluence. Cells were counted, and lipofectamine 2000 (Invitrogen, USA) was used to transfect vectors (10 mM, the NC group was empty vector) or siRNAs (45 nM, the NC group was NC siRNA) into 2×10⁶ cells. In all transfections, control (C) cells were untransfected cells. Cells were collected 24 h later for subsequent studies.
ELISA
Levels of TGF-β1 in cell culture medium were measured by performing ELISA at 24 h after transfection. We used the Human TGF-β1 Quantikine ELISA Kit (DB100B, R&D Systems). Levels of TGF-β1 are expressed as ng/ml.
RNA extractions and qPCR
Total RNAs in 0.3 ml of each sample and 3×10⁴ cells of each transfection group were isolated using Trizol reagent (Invitrogen, USA). DNase I was used to treat RNA samples for 80 min at 37°C to remove genomic DNA. Tetro Reverse Transcriptase (Bioline) was used to perform all transfections. Power SYBR® Green PCR Master Mix (Applied Biosystems) was used to carry out all qPCR assays. With GAPDH as endogenous control, expression levels of MACC1-AS1 or TGF-β1 mRNA were measured. All qPCR reactions were performed in 3 replicates. The 2−ΔΔCT method was used to normalize gene expression levels. Primer sequences used in qPCR are listed in Table 1.
Table 1.
Primers used for qPCR.
| Genes | Forward (5′-3) | Reverse (5′-3) |
|---|---|---|
| MACC1AS1 | GCCAGTCAGAAAATGAGGAA | CCAGTTGGGTGAACAGGAC |
| TGF-β1 | AAGAAGTCACCCGCGTGCTA | TGTGTGATGTCTTTGGTTTTGTC |
| GAPDH | CTGCACCACCAACTGCTTA | CAGAGGTGCCATCCAGAGT |
Protein extractions and Western blot
Total proteins in 3×10⁴ cells of each transfection group were isolated by RIPA solution (Sangon). BCA assay (Sangon) was performed to quantify protein samples. After proteins were denatured at 95°C for 10 min, proteins were separated by performing electrophoresis (12% SDS-PAGE gel). PVDF membrane was used to transfer proteins and 5% non-fat milk (PBS) was used for blocking. After that, membranes were first incubated with anti-GAPDH (1: 1000, ab37168, Abcam) and anti-TGF-β1 (1: 1000, ab92486, Abcam) rabbit primary antibodies for 18 h at 4°C. Following that, IgG-HRP (1: 1500, MBS435036, MyBioSource) goat secondary antibody was used to further incubation for 2 h at 24°C. Finally, ECL (Sigma-Aldrich, USA) was used for signal production and all data were normalized using Image J v1.48 software.
Transwell assays
Single-cell suspensions were prepared by mixing 3×10⁴ cells of each transfection group (collected at 24 h after transfection) with 1 ml serum-free RPMI medium. Transwell assays were performed. Matrigel (356234, Millipore, USA)-coated and -uncoated membranes were used for invasion and migration assays, respectively. Briefly, 3000 cells in 0.1 ml medium were transferred to the upper chamber, while medium containing 20% FBS was used to fill the lower chamber. Cells were cultivated under the aforementioned conditions for 12 h, followed by crystal violet (0.5%, Sigma-Aldrich, USA) staining of the membranes in the dark for 20 min. Invading and migrating cells were counted under an optical microscope.
Statistical analysis
Data from 3 biological replicates were used to calculate means. The unpaired t test was used to compare 2 groups. ANOVA Tukey’s test was used to compare multiple groups. Exploration of the difference between pre- and postoperative levels was conducted by paired t test. The diagnostic analysis was evaluated by ROC curve. P<0.05 was statistically significant.
Results
Upregulation of plasma MACC1-AS1 showed diagnostic potentials for HCC
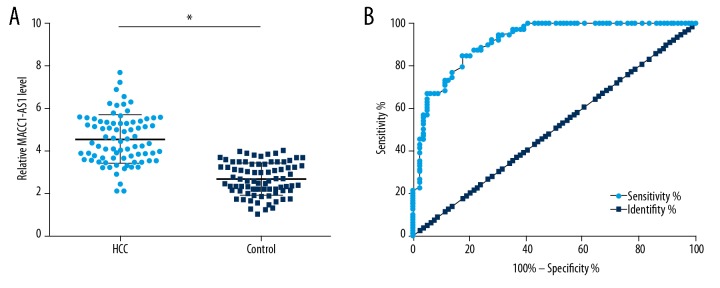
Measurement of preoperative plasma levels of MACC1-AS1 was performed by qPCR, and the comparison between HCC and Control group was performed by unpaired t test. Compared to the control group, significantly higher plasma levels of MACC1-AS1 were observed in the HCC group (Figure 1A, p<0.05). ROC curve analysis was performed to analyze the diagnostic potentials of plasma MACC1-AS1 for HCC. In the ROC curve, true-negative cases were healthy controls, and true-positive cases were HCC patients. The area under the curve >0.65 indicates diagnostic potentials. As shown in Figure 1B, the AUC was 0.91 (95% confidence interval: 0.87–0.96; standard error: 0.022).
Figure 1.
Upregulation of plasma MACC1-AS1 showed diagnostic potentials for HCC. Measurement of preoperative plasma levels of MACC1-AS1 was performed by qPCR and the comparison between HCC and Control group was performed by unpaired t test (A). ROC curve as calculated to analyze the diagnostic potentials of plasma MACC1-AS1 for HCC. In ROC curve, true-negative cases were healthy controls and true-positive cases were HCC patients (B). Mean values of 3 replicates are presented, * p<0.05.
Plasma MACC1-AS1 levels decreased in HCC patients after surgery
Measurement of postoperative plasma levels of MACC1-AS1 was also performed by qPCR and the comparisons between pre- and postoperative levels were performed by paired t test. Compared to preoperative levels, significantly lower postoperative plasma levels of MACC1-AS1 were observed (Figure 2, p<0.05).
Figure 2.
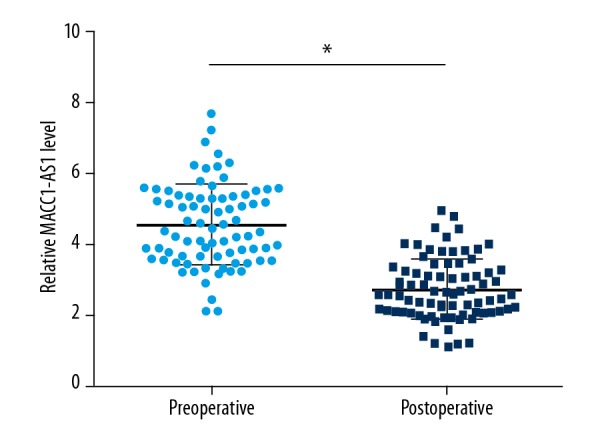
Plasma MACC1-AS1 levels decreased in HCC patients after surgery. Measurement of postoperative plasma levels of MACC1-AS1 was also performed by qPCR and the comparison between pre- and postoperative levels was performed by paired t test. Mean values of 3 replicates are presented, * p<0.05.
Plasma MACC1-AS1 levels increased only in patients with distant recurrence (DR)
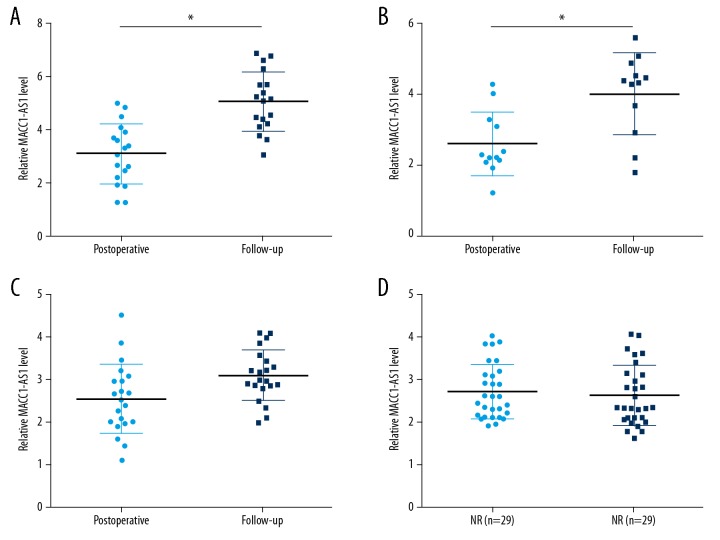
During follow-up, DR, local recurrence (LR), DR+LR, and non-recurrence (NR) were observed in 18, 21, 12, and 29 cases, respectively. Measurement of plasma levels of MACC1-AS1 during follow-up was also performed by qPCR. Compared to postoperative levels, significantly increased plasma levels of MACC1-AS1 were observed in the DR group (Figure 3A, p<0.05) and DR+LR group (Figure 3B, p<0.05), but not in the LR (Figure 3C) and NR group (Figure 3D).
Figure 3.
Plasma MACC1-AS1 levels increased only in patients with distant recurrence (DR) during follow-up. During follow-up, DR, LR, DR+LR, and NR were observed in 18, 21, 12, and 29 cases, respectively. Measurement of plasma levels of MACC1-AS1 during follow-up was also performed by qPCR. Compared to postoperative levels, significantly increased plasma levels of MACC1-AS1 were observed in the DR group (A) and DR+LR group (B), but not in the LR (C) and NR group (D). Mean values of 3 replicates are presented, * p<0.05.
MACC1-AS1 positively regulated TGF-β1 in SNU-182 cells
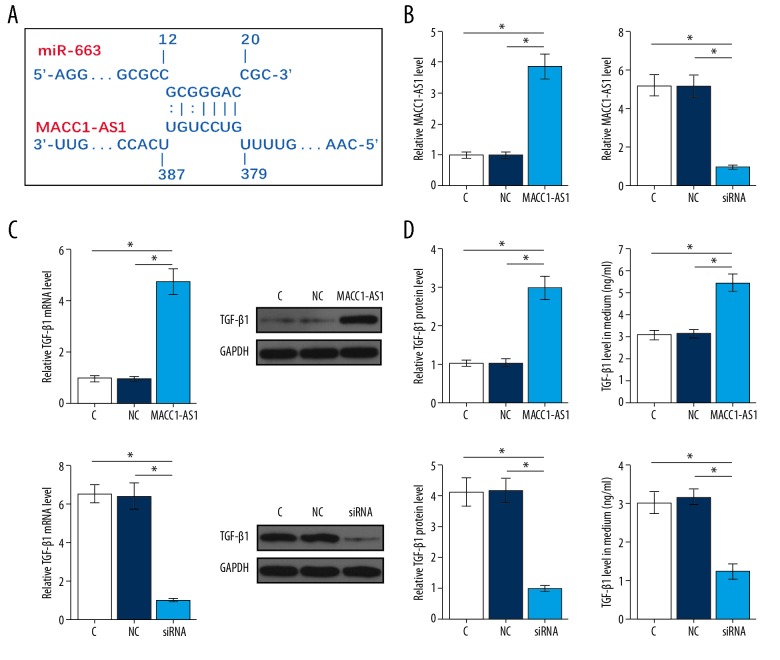
Although MACC1-AS1 is a relatively short lncRNA (639 nt), RNA-RNA interaction performed using IntaRNA (http://rna.informatik.uni-freiburg.de/IntaRNA/Input.jsp) showed that MACC1-AS1 can bind miR-663 (Figure 4A), which can target TGF-β1. SNU-182 cells were transfected with either MACC1-AS1 expression vector or siRNA. Transfections were confirmed at 24 h after transfection (Figure 4B, p<0.05). In addition, increased and decreased expression levels of TGF-β1 were observed in HCC cells with MACC1-AS1 overexpression and siRNA silencing, respectively (Figure 4C, p<0.05). Secretion of TGF-β1 from SNU-182 cells was analyzed by ELISA. Similarly, increased and decreased secretion of TGF-β1 were observed from HCC cells with MACC1-AS1 overexpression and siRNA silencing, respectively (Figure 4D, p<0.05).
Figure 4.
MACC1-AS1 positively regulated TGF-β1 in SNU-182 cells. RNA-RNA interaction performed using IntaRNA (http://rna.informatik.uni-freiburg.de/IntaRNA/Input.jsp) showed that MACC1-AS1 can bind miR-663 (A), which can target TGF-β1. MACC1-AS1 expression vector and siRNA were transfected into SNU-182 cells, and transfections were confirmed by RT-qPCR (B). The effects of MACC1-AS1 overexpression and siRNA silencing on the expression of TGF-β1 at mRNA and protein levels were analyzed by qPCR and Western blot, respectively (C). The effects of MACC1-AS1 overexpression and siRNA silencing on the secretion of TGF-β1 from SNU-182 cells were analyzed by ELISA (D). Mean values of 3 replicates were presented, * p<0.05.
MACC1-AS1 positively regulated SNU-182 and SNU-398 cell invasion and migration through TGF-β1
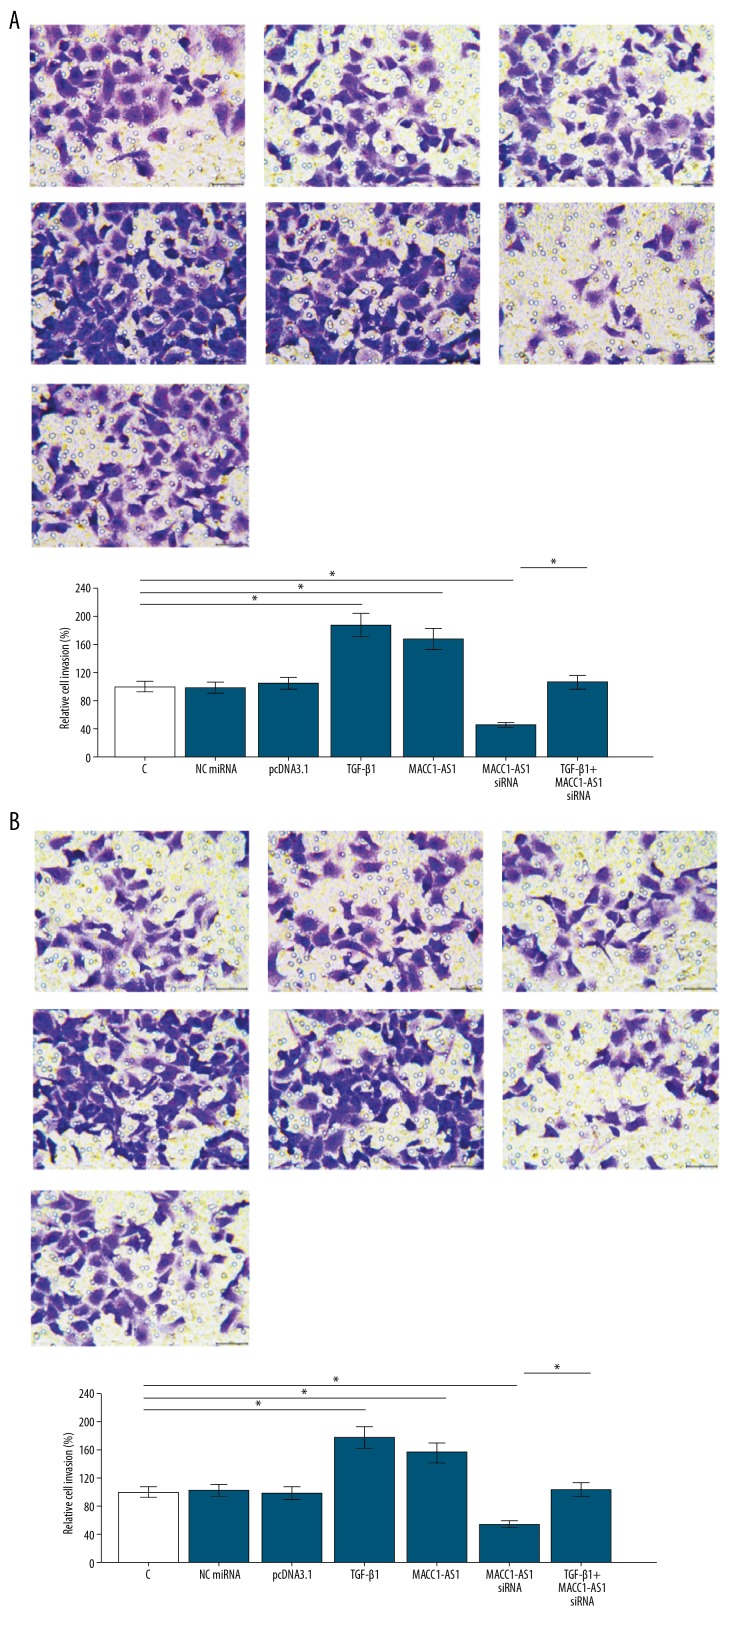
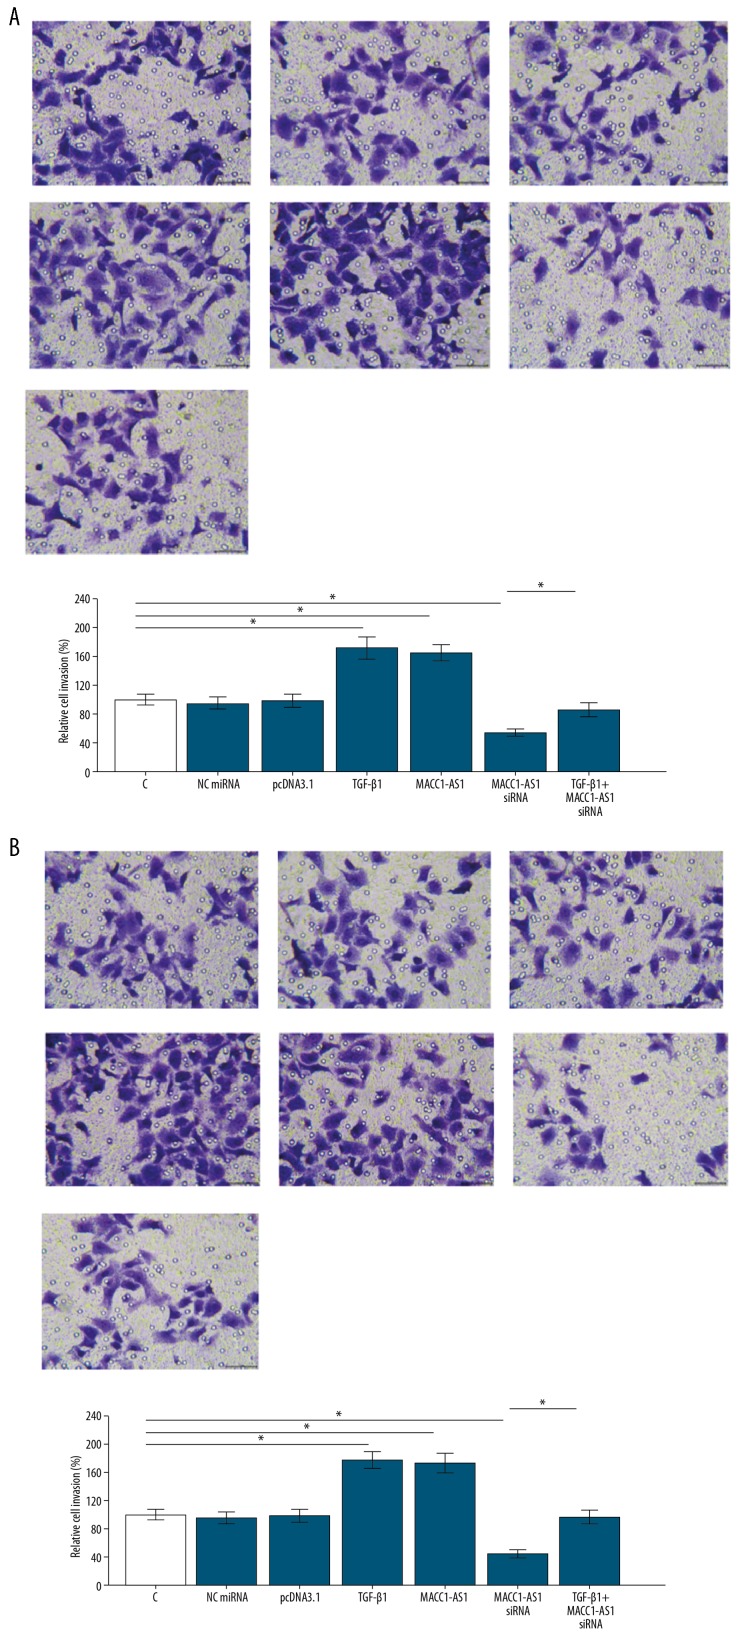
The overexpression of TGF-β1 in SNU-182 and SNU-398 cells was confirmed by qPCR (Supplementary Figure 1). Transwell assays were performed to analyze the effects of transfections on cell invasion (Figure 5A) and migration (Figure 5B) of SNU-182 cells. Compared to the NC and C groups, MACC1-AS1 positively affected the invasion and migration rates of SNU-182 cells. Moreover, TGF-β1 overexpression reduced the effects of MACC1-AS1 siRNA silencing (Figure 5, p<0.05). To further confirm the roles of MACC1-AS1 in HCC, the SNU-398 cell line was used to repeat Transwell assays. Similarly, compared to the NC and C groups, MACC1-AS1 overexpression increased invasion and migration, while siRNA silencing resulted in the decreased invasion (Figure 6A) and migration (Figure 6B) rates of SNU-398 cells. Moreover, TGF-β1 overexpression reduced the effects of MACC1-AS1 siRNA silencing (p<0.05).
Figure 5.
MACC1-AS1 positively regulated SNU-182 cell invasion and migration through TGF-β1. Transwell assays were carried out to analyze cell invasion (A) and migration (B) of SNU-182 cells. Mean values of 3 replicates were presented, * p<0.05.
Figure 6.
MACC1-AS1 positively regulated SNU-398 cell invasion and migration through TGF-β1. Transwell assays were carried out to analyze cell invasion (A) and migration (B) of SNU-398 cells. Mean values of 3 replicates are presented, * p<0.05.
Discussion
This study mainly investigated the involvement of MACC1-AS1 in HCC. We found that levels of MACC1-AS1 in plasma increased in HCC and predicted the post-surgical recurrence of DR. We found that the actions of MACC1-AS1 in HCC can be mediated by the upregulation of TGF-β1.
Early diagnosis of cancer is always critical because no curative therapeutic approaches have been developed for cancers at advanced stages [15]. The expression pattern and functions of cellular MACC1-AS1 have only been investigated in gastric cancer [13,14]. It has been reported that MACC1-AS1 is upregulated in gastric cancer and regulates cancer cell metabolic plasticity and stemness through interactions with AMPK/Lin28 signaling [13,14]. This study is the first to show the upregulation of MACC1-AS1 in plasma of HCC patients. In addition, the increased levels of MACC1-AS1 distinguished early-stage (stage I and II) HCC patients from healthy controls, indicating the early diagnostic potentials of MACC1-AS1 for HCC. We measured plasma levels of MACC1-AS1 because we aimed to test the predictive values of MACC1-AS1 for HCC. Compared to liver tissues, plasma samples are easier to obtain because liver biopsy cannot be performed in all patients. Nevertheless, more studies are needed to further evaluate the sensitivity and specificity.
Our study showed that MACC1-AS1 levels in plasma decreased after surgical resection. Therefore, HCC tumors may be the main source of MACC1-AS1 in blood. In addition, during follow-up, plasma levels of MACC1-AS1 only significantly increased in HCC patients with DR, indicating the involvement of MACC1-AS1 in DR. Activation of TGF-β signaling promotes tumor metastasis in many types of cancers, including HCC [16], and activation of TGF-β signaling has also been proven to participate in cancer recurrence [17]. In this study we showed that MACC1-AS1 can positively regulate TGF-β1 expression to promote HCC cell invasion and migration, thereby promoting postoperative DR. It is known that lncRNAs can sponge miRNAs to attenuate silencing of their downstream genes [12], and that miR-663 can directly target TGF-β1. We found that miR-663 can bind MACC1-AS1. Therefore, MACC1-AS1 may sponge miR-663 to upregulate TGF-β1. In effect, the role of lncRNAs as miRNA sponges has been reported in many types of cancers, including HCC [18,19]. For instance, lncRNA H19 sponges multiple tumor-suppressive miRNAs in colorectal cancer to induce epithelial-to-mesenchymal transition [18]. In HCC, lncRNA CCAT1 sponges let-7 to promote cancer progression [19]. However, few studies have reported the function of an lncRNA that can upregulate TGF-βs by sponging miRNAs. Most studies focused on effector lncRNA downstream of TGF-β signaling [9,10]. Studies on lncRNA-miRNA interactions will open a new area for cancer research and clinical treatment.
It is worth noting that the binding of MACCA-AS1 and miR-663 was inferred from an online RNA-RNA prediction program, which lacks of experimental basis and needs to be confirmed by further experiments. MACCA-AS1 is not liver-specific [13,14]. Our study only showed that altered level of MACC1-AS1 in plasma can be used to predict HCC, and we failed to include non-cancerous cells as negative control. Our future studies will try to have this control.
Conclusions
MACC1-AS1 was upregulated in HCC and can sponge miR-663 to upregulate TGF-β1, thereby promoting cell invasion and migration and participating in postoperative DR.
Supplementary Data
Confirmation of TGF-β1 overexpression in SNU-182 and SNU-398 cells (* p<0.05).
Footnotes
Conflict of interests
None.
Source of support: Departmental sources
References
- 1.Bray F, Ferlay J, Soerjomataram I, et al. Global cancer statistics 2018: GLOBOCAN estimates of incidence and mortality worldwide for 36 cancers in 185 countries. Cancer J Clin. 2018;68(6):394–424. doi: 10.3322/caac.21492. [DOI] [PubMed] [Google Scholar]
- 2.Rahib L, Smith BD, Aizenberg R, et al. Projecting cancer incidence and deaths to 2030: The unexpected burden of thyroid, liver, and pancreas cancers in the United States. Cancer Res. 2014;74(11):2913–21. doi: 10.1158/0008-5472.CAN-14-0155. [DOI] [PubMed] [Google Scholar]
- 3.Ferlay J, Soerjomataram I, Dikshit R, et al. Cancer incidence and mortality worldwide: Sources, methods and major patterns in GLOBOCAN 2012. Int J Cancer. 2015;136(5):E359–86. doi: 10.1002/ijc.29210. [DOI] [PubMed] [Google Scholar]
- 4.Bruix J, Reig M, Sherman M. Evidence-based diagnosis, staging, and treatment of patients with hepatocellular carcinoma. Gastroenterology. 2016;150(4):835–53. doi: 10.1053/j.gastro.2015.12.041. [DOI] [PubMed] [Google Scholar]
- 5.Giannelli G, Koudelkova P, Dituri F, et al. Role of epithelial to mesenchymal transition in hepatocellular carcinoma. J Hepatol. 2016;65(4):798–808. doi: 10.1016/j.jhep.2016.05.007. [DOI] [PubMed] [Google Scholar]
- 6.Liu PH, Hsu CY, Hsia CY, et al. Surgical resection versus radiofrequency ablation for single hepatocellular carcinoma ≤2 cm in a propensity score model. Ann Surg. 2016;263(3):538–45. doi: 10.1097/SLA.0000000000001178. [DOI] [PubMed] [Google Scholar]
- 7.Chan AWH, Chan SL, Wong GLH, et al. Prognostic nutritional index (PNI) predicts tumor recurrence of very early/early stage hepatocellular carcinoma after surgical resection. Ann Surg Oncol. 2015;22(13):4138–48. doi: 10.1245/s10434-015-4516-1. [DOI] [PubMed] [Google Scholar]
- 8.Zoni E, van der Pluijm G, Gray PC, et al. Epithelial plasticity in cancer: Unmasking a microRNA network for TGF-β-, Notch-, and Wnt-mediated EMT. J Oncol. 2015;2015 doi: 10.1155/2015/198967. 198967. [DOI] [PMC free article] [PubMed] [Google Scholar]
- 9.Colak S, ten Dijke P. Targeting TGF-β signaling in cancer. Trends Cancer. 2017;3(1):56–71. doi: 10.1016/j.trecan.2016.11.008. [DOI] [PubMed] [Google Scholar]
- 10.Syed V. TGF-β signaling in cancer. J Cell Biochem. 2016;117(6):1279–87. doi: 10.1002/jcb.25496. [DOI] [PubMed] [Google Scholar]
- 11.Li Q, Cheng Q, Chen Z, et al. MicroRNA-663 inhibits the proliferation, migration and invasion of glioblastoma cells via targeting TGF-β1. Oncol Rep. 2016;35(2):1125–34. doi: 10.3892/or.2015.4432. [DOI] [PubMed] [Google Scholar]
- 12.Militello G, Weirick T, John D, et al. Screening and validation of lncRNAs and circRNAs as miRNA sponges. Brief Bioinform. 2016;18(5):780–88. doi: 10.1093/bib/bbw053. [DOI] [PubMed] [Google Scholar]
- 13.Zhao Y, Liu Y, Lin L, et al. The lncRNA MACC1-AS1 promotes gastric cancer cell metabolic plasticity via AMPK/Lin28 mediated mRNA stability of MACC1. Mol Cancer. 2018;17(1):69. doi: 10.1186/s12943-018-0820-2. [DOI] [PMC free article] [PubMed] [Google Scholar]
- 14.He W, Liang B, Wang C, et al. MSC-regulated lncRNA MACC1-AS1 promotes stemness and chemoresistance through fatty acid oxidation in gastric cancer. Oncogene. 2019;38(23):4637–54. doi: 10.1038/s41388-019-0747-0. [DOI] [PMC free article] [PubMed] [Google Scholar]
- 15.Tsuchiya N, Sawada Y, Endo I, et al. Biomarkers for the early diagnosis of hepatocellular carcinoma. World J Gastroenterol. 2015;21(37):10573–83. doi: 10.3748/wjg.v21.i37.10573. [DOI] [PMC free article] [PubMed] [Google Scholar]
- 16.Fabregat I, Moreno-Càceres J, Sánchez A, et al. TGF-β signalling and liver disease. FEBS J. 2016;283(12):2219–32. doi: 10.1111/febs.13665. [DOI] [PubMed] [Google Scholar]
- 17.Chang JC. Cancer stem cells: Role in tumor growth, recurrence, metastasis, and treatment resistance. Medicine (Baltimore) 2016;95(1 Suppl 1):S20–25. doi: 10.1097/MD.0000000000004766. [DOI] [PMC free article] [PubMed] [Google Scholar]
- 18.Liang WC, Fu WM, Wong CW, et al. The lncRNA H19 promotes epithelial to mesenchymal transition by functioning as miRNA sponges in colorectal cancer. Oncotarget. 2015;6(26):22513–25. doi: 10.18632/oncotarget.4154. [DOI] [PMC free article] [PubMed] [Google Scholar]
- 19.Deng L, Yang SB, Xu FF, et al. Long noncoding RNA CCAT1 promotes hepatocellular carcinoma progression by functioning as let-7 sponge. J Exp Clin Cancer Res. 2015;34(1):18. doi: 10.1186/s13046-015-0136-7. [DOI] [PMC free article] [PubMed] [Google Scholar]
Associated Data
This section collects any data citations, data availability statements, or supplementary materials included in this article.
Supplementary Materials
Confirmation of TGF-β1 overexpression in SNU-182 and SNU-398 cells (* p<0.05).


