

Summary
Background
There are no longitudinal data on the changes in hematologic, hepatic, and renal function findings in patients with Middle East respiratory syndrome coronavirus (MERS‐CoV) infection.
Methods
This is a retrospective cohort study of 16 MERS‐CoV patients, to describe the hematological, hepatic, and renal findings of patients with MERS‐CoV.
Results
During the 21 days of observation, there was no significant change in the hepatic panel or creatinine tests. There was a significant increase in the mean ± SD of the white blood cell count from 8.3 ± 4.6 to 14.53 ± 7 (P value = 0.001) and an increase in mean ± SD of the absolute neutrophil count from 6.33 ± 4.2 to 12 ± 5.5 (P value = 0.015). Leukocytosis was observed in 31% (5/16) of the patients on day 1 and in 80% (4/5) on day 21. Transient leukopenia developed in 6% (1/16) of the patients on day 1 and in 13% (1/8) on day 8. None of the patients had neutropenia. Lymphopenia was a prominent feature with a rate of 44% (7/16) of the patients on day 1 and 60% (3/5) on day 21. Lymphocytosis was not a feature of MERS‐CoV infection. Thrombocytopenia developed in 31% (5/16) of the patients on day 1 and 40% (2/5) on day 21. Thrombocytosis was not a prominent feature and was observed in 6% (1/16) of the patients on day 1 and 17% (1/6) on day 9.
Conclusions
Patients with MERS‐CoV infection showed variable hematologic parameters over time. Lymphocytosis and neutropenia were not features of MERS‐CoV infection.
Keywords: Middle East respiratory syndrome, hematologic changes, biochemical characteristics
Introduction
The Middle East respiratory syndrome coronavirus (MERS‐CoV) infection was first reported in Saudi Arabia in 2012 1. The World Health Organization (WHO) had reported as of July 6, 2016 a total of 1782 cases including 634 deaths in 26 countries worldwide 2. MERS‐CoV infection was associated with a high case fatality rate (CFR) and subsequently the CFR decreased as more patients had a milder form of the disease 3. Although many studies evaluated the clinical characteristics of MERS‐CoV patients, none of them addressed the temporal changes in hematologic, hepatic or creatinine values 4, 5, 6, 7. Acute renal injury was described in 92% of critically ill patients 5. However, many MERS patients had preexisting chronic renal disease 4, 8, 9. In this study, we evaluated the temporal progression and changes in hematologic, hepatic, and renal function in a cohort of patients over 21 days of hospitalization.
Methods
In this study, we analyzed hematologic, hepatic, and creatinine changes over time in a cohort of 16 admitted patients with MERS‐CoV infection. All patients tested positive for MERS‐CoV using real‐time polymerase chain reaction (RT‐PCR) 4. Day one is the first day of admission, and subsequent days after admission were based on this calculation. Laboratory data were collected for 21 days after admission. This time limit was determined based on the fact that most patients were discharged or were deceased after the defined time interval.
The definition of leukopenia was a leukocyte count <4.0 × 10⁹ cells/L, lymphopenia as a lymphocyte count <1.0 × 10⁹ cells/L, thrombocytopenia as a platelet count <150 × 109 cells/L, and elevations of aspartate aminotransferase (AST) and alanine aminotransferase (ALT) levels were defined as twice the upper reference limit (34 and 55 U/L, respectively) 5. Elevated lactate dehydrogenase (LDH) was considered as a value significantly elevated above the upper normal level of 280 U/L for the purposes of this study.
We collected daily laboratory data and calculated the mean ± standard deviation (SD) for any given parameter. We also calculated the number and percentage of patients who had abnormal laboratory data as defined below. The study was approved by the Institution Review Board (IRB) of Johns Hopkins Aramco Healthcare.
Statistical analysis
The Kendall–Mann test was obtained using SPSS (SPSS for Windows, version 11; SPSS Inc., Chicago, IL, USA; 2002) for the time trend of the individual patient to test for a monotonic trend of the different laboratory variables. To compare the mean of the laboratory values of all patients over time, we used paired t‐test for analysis of variance (anova) test using spss (SPSS for Windows, version 11; SPSS Inc.). In each test, a significant result was considered present when the P value was <0.05.
Results
The serum creatinine for individual patients did not show a significant trend over time using the Kendall–Mann test, except for three patients. The baseline mean serum creatinine ± SD was 4.1 (± 4.2) mg/dL indicating the presence of renal impairment prior to admission in those patients (Table 1). However, the mean serum creatinine of all patients did not change over time.
Table 1.
Creatinine changes over 21 days
| Day | Number of patients | Mean | SD |
|---|---|---|---|
| 1 | 16 | 4.1 | 4.2 |
| 2 | 11 | 4.1 | 3.7 |
| 3 | 14 | 3.1 | 2.7 |
| 4 | 11 | 3.7 | 3.4 |
| 5 | 10 | 4.2 | 3.8 |
| 6 | 11 | 4.7 | 4.2 |
| 7 | 7 | 5.9 | 4.1 |
| 8 | 8 | 5.4 | 4.7 |
| 9 | 6 | 3.4 | 2.8 |
| 10 | 8 | 2.3 | 2.2 |
| 12 | 9 | 2.6 | 2.1 |
| 14 | 10 | 2.5 | 2.0 |
| 17 | 6 | 2.3 | 1.5 |
| 21 | 5 | 3.8 | 2.1 |
This article is being made freely available through PubMed Central as part of the COVID-19 public health emergency response. It can be used for unrestricted research re-use and analysis in any form or by any means with acknowledgement of the original source, for the duration of the public health emergency.
The hepatic function test results for individual patients did not show a significant trend over time using the Kendall–Mann test. The mean ± SD of alkaline phosphatase was 101 ± 34.3 U/L; AST 43.1 ± 25.9 U/L; and LDH 847.7 ± 462.4 U/L. There was no significant change in mean hepatic function tests for all patients over the study period (Table 2). However, there was an increase in these tests at day 21 due to a single patient who developed shock liver.
Table 2.
Liver function tests and changes over time in patients with Middle East respiratory syndrome coronavirus infection
| Day | Number of patients | Alkaline phosphatase | Alanine aminotransferase | Aspartate aminotransferase | Lactate dehydrogenase | Bilirubin | ||||||
|---|---|---|---|---|---|---|---|---|---|---|---|---|
| Mean | SD | Mean | SD | Mean | SD | Mean | SD | Number of patients | Mean | SD | ||
| 1 | 10 | 101 | 34.3 | 43.1 | 25.9 | 56.0 | 40.9 | 847.7 | 462.4 | 1 | 10 | 0 |
| 2 | 6 | 114.5 | 102.3 | 37.5 | 7.2 | 53.5 | 8.4 | 728.7 | 217 | 4 | 11.3 | 2.2 |
| 3 | 4 | 138 | 107.5 | 52.5 | 29.6 | 70.8 | 41.5 | 959 | 508 | 1 | 14 | 0 |
| 4 | 3 | 165.3 | 147.8 | 41.3 | 24.6 | 70.3 | 58.5 | 858.7 | 522.4 | 1 | 12 | 0 |
| 5 | 2 | 54.5 | 27.6 | 28.5 | 0.7 | 22.0 | 8.5 | 730.5 | 111 | 11 | 2.7 | 6.1 |
| 6 | 2 | 105 | 22.6 | 141 | 163 | 310.5 | 422.1 | 578 | 43.8 | 2 | 19 | 2.8 |
| 8 | 1 | 35 | 0 | 22 | 0 | 22.0 | 0 | 802 | 0 | 1 | 7 | 0 |
| 9 | 1 | 40 | 0 | 23 | 0 | 24.0 | 0 | 947 | 0 | 1 | 0.5 | 0.1 |
| 10 | 2 | 59 | 25.5 | 34.5 | 17.7 | 55.5 | 43.1 | 1112 | 14.1 | 6 | 21 | 0 |
| 12 | 2 | 53 | 15.6 | 37 | 25.5 | 40.5 | 29 | 836.5 | 20.5 | 1 | 0.5 | 0.2 |
| 14 | 3 | 64 | 12.1 | 37 | 12.5 | 47.0 | 35.2 | 1029.7 | 262.7 | 1 | 6 | 0 |
| 17 | 1 | 165 | 0 | 36 | 0 | 92.0 | 0 | 2360 | 0 | 3 | 10.6 | 3.7 |
| 21 | 4 | 257.3 | 160.8 | 476 | 793 | 661.0 | 1214.3 | 1825.8 | 1544 | |||
This article is being made freely available through PubMed Central as part of the COVID-19 public health emergency response. It can be used for unrestricted research re-use and analysis in any form or by any means with acknowledgement of the original source, for the duration of the public health emergency.
During the 21 days of observation, three patients had a significant increase in white blood cell (WBC) count using the Kendall–Mann test (P = 0.04). There was a significant increase in the mean ± SD of the WBC count from 8.3 ± 4.6 to 14.5 ± 7 × 10⁹ cells/L (P value = 0.001) (Figure 1). Leukocytosis was observed in 31% (5/16) of patients on day 1 and in 80% (4/5) on day 21. Transient leukopenia developed in 6% (1/16) of the patients on day 1 and in 13% (1/8) on day 8. None of the patients had leukopenia after day 8 (Table 3).
Figure 1.
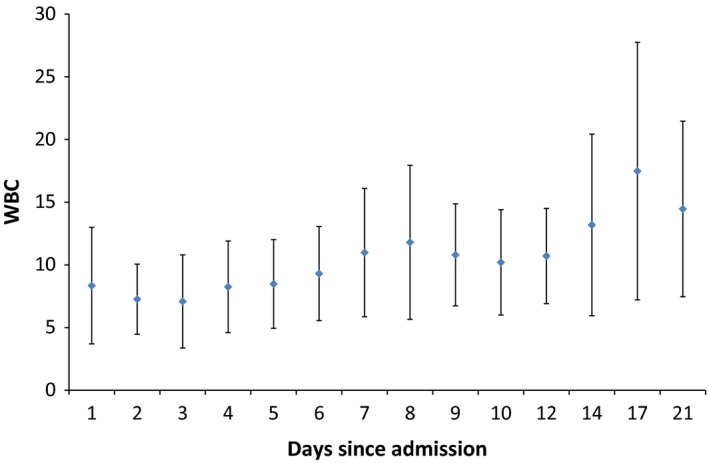
An error bar indicating the mean ± standard deviation of daily white blood cell count (×109/L). [Colour figure can be viewed at http://wileyonlinelibrary.com].
Table 3.
Number and percentage of patients with specified hematologic changes over time in patients with Middle East respiratory syndrome coronavirus infection
| Number of | White blood cell count, n (%) | Platelet count, n (%) | Absolute neutrophil count, n (%) | Absolute lymphocyte count, n (%) | |||||
|---|---|---|---|---|---|---|---|---|---|
| Days | Patients | Leukopenia | Leukocytosis | Thrombocytopenia | Thrombocytosis | Neutrophilia | Neutropenia | Lymphopenia | Lymphocytosis |
| 1 | 16 | 1 (6) | 5 (31) | 5 (31) | 1 (6) | 1 (6) | 0 (0) | 7 (44) | 0 (0) |
| 2 | 11 | 2 (18) | 1 (9) | 3 (27) | 1 (9) | 1 (9) | 0 (0) | 6 (55) | 0 (0) |
| 3 | 13 | 2 (15) | 2 (15) | 3 (23) | 1 (8) | 1 (8) | 0 (0) | 7 (54) | 0 (0) |
| 4 | 12 | 1 (8) | 3 (25) | 2 (17) | 1 (8) | 2 (17) | 0 (0) | 6 (50) | 0 (0) |
| 5 | 11 | 1 (9) | 3 (27) | 1 (9) | 1 (9) | 1 (9) | 0 (0) | 5 (45) | 1 (9) |
| 6 | 11 | 1 (9) | 4 (36) | 1 (9) | 1 (9) | 1 (9) | 0 (0) | 6 (55) | 1 (9) |
| 7 | 7 | 1 (14) | 3 (43) | 0 (0) | 1 (14) | 2 (29) | 0 (0) | 5 (71) | 0 (0) |
| 8 | 8 | 1 (13) | 5 (63) | 0 (0) | 1 (13) | 2 (25) | 0 (0) | 5 (63) | 0 (0) |
| 9 | 6 | 0 (0) | 3 (50) | 0 (0) | 1 (17) | 1 (17) | 0 (0) | 3 (50) | 0 (0) |
| 10 | 8 | 0 (0) | 3 (38) | 1 (13) | 1 (13) | 1 (13) | 0 (0) | 4 (50) | 0 (0) |
| 12 | 10 | 0 (0) | 6 (60) | 1 (10) | 1 (10) | 0 (0) | 0 (0) | 7 (70) | 0 (0) |
| 14 | 8 | 0 (0) | 5 (63) | 2 (25) | 0 (0) | 4 (50) | 0 (0) | 6 (75) | 1 (9) |
| 17 | 6 | 0 (0) | 4 (67) | 1 (17) | 0 (0) | 4 (67) | 0 (0) | 4 (67) | 0 (0) |
| 21 | 5 | 0 (0) | 4 (80) | 2 (40) | 0 (0) | 2 (40) | 0 (0) | 3 (60) | 0 (0) |
This article is being made freely available through PubMed Central as part of the COVID-19 public health emergency response. It can be used for unrestricted research re-use and analysis in any form or by any means with acknowledgement of the original source, for the duration of the public health emergency.
There was a significant increase in the mean ± SD of the absolute neutrophil count from 6.3 ± 4.2 to 12 ± 5.5 × 10⁹ cells/L (P value = 0.015) (Figure 2), and five patients had a significant correlation of the trend of absolute neutrophil count over time (P value = 0.02; Kendall–Mann test). Over the course of the observation, neutrophilia was observed in 6% (1/16) of the patients on day 1 and in 25% (2/8) on day 8. None of the patients had neutropenia during the hospitalization.
Figure 2.
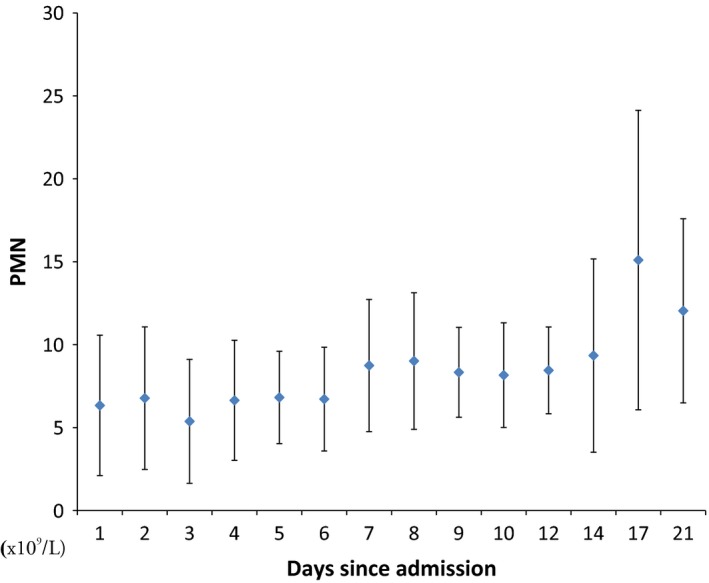
An error bar indicating the mean ± standard deviation indicating daily absolute neutrophil (PMN) count (×109/L). [Colour figure can be viewed at http://wileyonlinelibrary.com].
The mean ± SD of the absolute lymphocyte count showed no significant change over time for the entire group of patients (P = 0.78) (Figure 3). Three patients had a significant correlation in the trend of lymphocyte count over time (P value = 0.01; Kendall–Mann test). Over the study period, lymphopenia was a prominent feature with a rate of 44% (7/16) of the patients on day 1 and 60% (3/5) on day 21. Lymphocytosis was not a feature of MERS‐CoV infection (Table 3).
Figure 3.
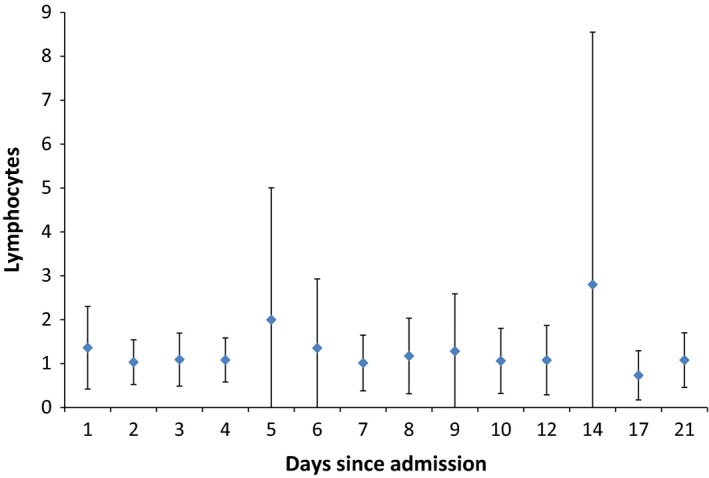
An error bar indicating the mean ± standard deviation indicating daily absolute lymphocyte count (×109/L). [Colour figure can be viewed at http://wileyonlinelibrary.com].
The mean ± SD of platelet count showed no significant change over time for the whole group of patients (P = 0.49) (Figure 4). Nine patients had a significant correlation in the trend of platelet count over time (P value < 0.05; Kendall–Mann test). Thrombocytopenia developed in 31% (5/16) of the patients on day 1 and 40% (2/5) on day 21. Thrombocytosis was not a prominent feature and was observed in 6% (1/16) of the patients on day 1 and 17% (1/6) on day 9.
Figure 4.
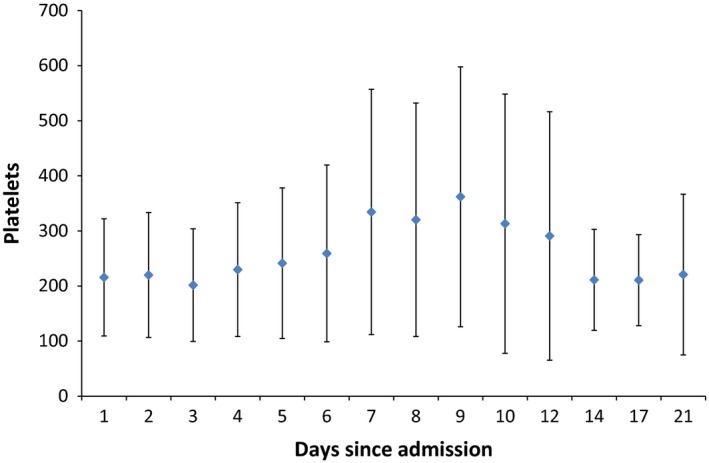
An error bar indicating the mean ± standard deviation indicating daily platelet count (×109/L). [Colour figure can be viewed at http://wileyonlinelibrary.com].
Discussion
In this study, we evaluated longitudinal trends of laboratory parameters in patients with MERS‐CoV infection. Acute kidney injury is one of the complications or preexisting conditions of MERS‐CoV infection. The initially described hospital outbreak occurred in a hemodialysis unit among patients with chronic renal failure 8. Similarly, the majority of the patients in this cohort had preexisting renal insufficiency. In a cohort of intensive care unit (ICU) patients, renal replacement therapy was initiated in 58% of patients compared with 5% of severe acute respiratory syndrome (SARS) patients 5. Acute renal injury may be caused directly by MERS‐CoV as summarized in 12 cases 10. Renal epithelial cells were more likely to produce infectious MERS‐CoV progeny than bronchial epithelial cells 10. However, MERS‐CoV was detected infrequently in urine 11.
Lymphopenia was a prominent feature with a rate of 44–60%, and lymphocytosis was not a feature of MERS‐CoV infection. It was stated that patients with MERS‐CoV infection typically have lymphopenia 1, 4, 8, 9, 12, 13, 14. Of ICU patients with MERS‐CoV infection, nine of 12 patients (75%) had lymphopenia on day 1, and 11 (92%) during the ICU stay 5. In one study of 47 cases, lymphopenia was an initial feature of 34% compared with lymphocytosis in 11% 9. However, lymphopenia was not a feature of the disease when comparing MERS‐CoV patients and those without MERS 4. Previously reported lymphocyte count ranges were as follows: 1.55 4, 0.9 (range 0.3–2.7) 5, 0.9 (range 0.6–1.2) 7, 0.9 (range 0.5–6.9) 6.
It was reported that 91% of 47 MERS‐CoV cases had normal neutrophil counts on admission 9. The current study showed a normal neutrophil count with a significant increase in the mean (±SD) count over time. In a case–control study, there was no difference in neutrophil count between MERS cases and other patients with community acquired respiratory infection 4. In the current study, transient leukopenia developed in 9–18% of the patients until day 8 of observation, and 9–80% of the patients had leukocytosis until day 21. The increase in the WBC count over time is probably a reflection of the development of sepsis or superimposed bacterial infections.
Thrombocytopenia developed in 31% of patients on day 1 and 40% of patients on day 21 and thrombocytosis was not a prominent feature in the current study. Variable degrees of thrombocytopenia were inconsistently reported in previous studies 15. In critically ill ICU MERS‐CoV patients, thrombocytopenia was noted in two patients on day 1 and in seven patients (58%) during the ICU stay 5. In the first reported hospital outbreak in Al‐Hasa, four patients had low platelet counts (110 × 109/L to 122 × 109/L) and only one patient had a high platelet count (468 × 109/L) 8. In a study of 47 MERS‐CoV cases, thrombocytopenia developed initially in 36% of cases 9. Thrombocytopenia is a nonspecific finding in many viral infections such as SARS 16, 17. In SARS cases, thrombocytopenia developed initially and was then followed by reactive thrombocytosis 16. Reactive thrombocytosis was only seen in 6–17% of the patients in the current study.
Elevated levels of LDH, AST, and ALT were found in 49%, 15–53%, and 11–18% of patients with MERS‐CoV 4, 8, 9. We observed no significant trend over time in hepatic panels. There was a general elevation in LDH from the first day of observation with no significant increase over time. In comparison, patients with SARS showed elevation of LDH in 50–70% of cases 18, 19, 20. Elevated LDH could be a marker of severe pneumonia and was associated with death in patients with Legionella pneumophilia 21. LDH is also a surrogate marker for steroid therapy in pediatric Mycoplasma pneumoniae pneumonia 22 and it is a predictor of refractory M. pneumoniae pneumonia 23. To our knowledge, LDH was not examined systematically in admitted patients with MERS‐CoV infection. Although more MERS‐CoV patients had elevated LDH (47%) vs. other causes of pneumonia (29%), the difference was not statistically different 4. The utility of this marker for the prediction of MERS‐CoV pneumonia progression and therapy requires further studies.
In conclusion, MERS‐CoV infection was associated with variable hematologic parameters over time including significant leukocytosis and neutrophilia. Lymphocytosis and neutropenia were not common features of MERS‐CoV infection. The utility of LDH as a marker for the prediction of MERS‐CoV pneumonia progression and therapy requires further studies.
Funding
None of the authors have received funding for their contributions.
Conflict of Interest
The authors declare no conflict of interest.
References
- 1. Zaki AM, van Boheemen S, Bestebroer TM, Osterhaus ADME, Fouchier RAM. Isolation of a novel coronavirus from a man with pneumonia in Saudi Arabia. N Engl J Med 2012;367:1814–20. [DOI] [PubMed] [Google Scholar]
- 2. World Health Organization . Middle East respiratory syndrome coronavirus (MERS‐CoV) ‐ Saudi Arabia. Disease outbreak news, 6 July 2016. Available at: http://www.who.int/csr/don/06-july-2016-mers-saudiarabia/en/. Accessed October 10, 2016. [Google Scholar]
- 3. Al‐Tawfiq JA, Memish ZA. Middle East respiratory syndrome coronavirus: transmission and phylogenetic evolution. Trends Microbiol 2014;22:573–9. [DOI] [PMC free article] [PubMed] [Google Scholar]
- 4. Al‐Tawfiq JA, Hinedi K, Ghandour J, Khairalla H, Musleh S, Ujayli A, Memish ZA. Middle East Respiratory Syndrome‐Coronavirus (MERS‐CoV): a case–control study of hospitalized patients. Clin Infect Dis 2014;59:160–5. [DOI] [PMC free article] [PubMed] [Google Scholar]
- 5. Arabi YM, Arifi AA, Balkhy HH, Najm H, Aldawood AS, Ghabashi A, Hawa H, Alothman A, Khaldi A, Al Raiy B. Clinical course and outcomes of critically ill patients with Middle East respiratory syndrome coronavirus infection. Ann Intern Med 2014;160:389–97. [DOI] [PubMed] [Google Scholar]
- 6. Shalhoub S, Farahat F, Al‐Jiffri A, Simhairi R, Shamma O, Siddiqi N, Mushtaq A. IFN‐α2a or IFN‐β1a in combination with ribavirin to treat Middle East respiratory syndrome coronavirus pneumonia: a retrospective study. J Antimicrob Chemother 2015;70:2129–32. [DOI] [PMC free article] [PubMed] [Google Scholar]
- 7. Saad M, Omrani AS, Baig K, Bahloul A, Elzein F, Matin MA, Selim MA, Al Mutairi M, Al Nakhli D, Al Aidaroos AY, Al Sherbeeni N, Al‐Khashan HI, Memish ZA, Albarrak AM. Clinical aspects and outcomes of 70 patients with Middle East respiratory syndrome coronavirus infection: a single‐center experience in Saudi Arabia. Int J Infect Dis 2014;29:301–6. [DOI] [PMC free article] [PubMed] [Google Scholar]
- 8. Assiri A, McGeer A, Perl TM, Price CS, Al Rabeeah AA, Cummings DA, Alabdullatif ZN, Assad M, Almulhim A, Makhdoom H, Madani H, Alhakeem R, Al‐Tawfiq JA, Cotten M, Watson SJ, Kellam P, Zumla AI, Memish ZA, KSA MERS‐CoV Investigation Team . Hospital outbreak of Middle East respiratory syndrome coronavirus. N Engl J Med 2013;369:407–16. [DOI] [PMC free article] [PubMed] [Google Scholar]
- 9. Assiri A, Al‐Tawfiq JA, Al‐Rabeeah AA, Al‐Rabiah FA, Al‐Hajjar S, Al‐Barrak A, Flemban H, Al‐Nassir WN, Balkhy HH, Al‐Hakeem RF, Makhdoom HQ, Zumla AI, Memish ZA. Epidemiological, demographic, and clinical characteristics of 47 cases of Middle East respiratory syndrome coronavirus disease from Saudi Arabia: a descriptive study. Lancet Infect Dis 2013;13:752–61. [DOI] [PMC free article] [PubMed] [Google Scholar]
- 10. Eckerle I, Müller MA, Kallies S, Gotthardt DN, Drosten C. In‐vitro renal epithelial cell infection reveals a viral kidney tropism as a potential mechanism for acute renal failure during Middle East Respiratory Syndrome (MERS) Coronavirus infection. Virol J 2013;10:359. [DOI] [PMC free article] [PubMed] [Google Scholar]
- 11. Corman VM, Albarrak AM, Omrani AS, Albarrak MM, Farah ME, Almasri M, Muth D, Sieberg A, Meyer B, Assiri AM, Binger T, Steinhagen K, Lattwein E, Al‐Tawfiq J, Müller MA, Drosten C, Memish ZA. Viral shedding and antibody response in 37 patients with Middle East respiratory syndrome coronavirus infection. Clin Infect Dis 2016;62:477–83. [DOI] [PMC free article] [PubMed] [Google Scholar]
- 12. Hijawi B, Abdallat M, Sayaydeh A, Alqasrawi S, Haddadin A, Jaarour N, Alsheikh S, Alsanouri T. Novel coronavirus infections in Jordan, April 2012: epidemiological findings from a retrospective investigation. East Mediterr Health J 2013;19(Suppl. 1):S12–8. [PubMed] [Google Scholar]
- 13. Guery B, Poissy J, el Mansouf L, Séjourné C, Ettahar N, Lemaire X, Vuotto F, Goffard A, Behillil S, Enouf V, Caro V, Mailles A, Che D, Manuguerra JC, Mathieu D, Fontanet A, van der Werf S, MERS‐CoV study group . Clinical features and viral diagnosis of two cases of infection with Middle East Respiratory Syndrome coronavirus: a report of nosocomial transmission. Lancet 2013;381:2265–72. [DOI] [PMC free article] [PubMed] [Google Scholar]
- 14. Memish ZA, Zumla AI, Al‐Hakeem RF, Al‐Rabeeah AA, Stephens GM. Family cluster of Middle East respiratory syndrome coronavirus infections. N Engl J Med 2013;368:2487–94. [DOI] [PubMed] [Google Scholar]
- 15. Al‐Tawfiq JA, Memish ZA. Managing MERS‐CoV in the healthcare setting. Hosp Pract (1995) 2015;43:158–63. [DOI] [PubMed] [Google Scholar]
- 16. Wong RSM, Wu A, To KF, Lee N, Lam CWK, Wong CK, Chan PK, Ng MH, Yu LM, Hui DS, Tam JS, Cheng G, Sung JJ. Haematological manifestations in patients with severe acute respiratory syndrome: retrospective analysis. BMJ 2003;326:1358–62. [DOI] [PMC free article] [PubMed] [Google Scholar]
- 17. Zucker‐Franklin D. The effect of viral infections on platelets and megakaryocytes. Semin Hematol 1994;31:329–37. [PubMed] [Google Scholar]
- 18. Leung GM, Hedley AJ, Ho L‐M, Chau P, Wong IOL, Thach TQ, Ghani AC, Donnelly CA, Fraser C, Riley S, Ferguson NM, Anderson RM, Tsang T, Leung PY, Wong V, Chan JC, Tsui E, Lo SV, Lam TH. The epidemiology of severe acute respiratory syndrome in the 2003 Hong Kong epidemic: an analysis of all 1755 patients. Ann Intern Med 2004;141:662–73. [DOI] [PubMed] [Google Scholar]
- 19. Hui DSC, Chan PKS. Severe acute respiratory syndrome and coronavirus. Infect Dis Clin North Am 2010;24:619–38. [DOI] [PMC free article] [PubMed] [Google Scholar]
- 20. Fan CK, Yieh KM, Peng MY, Lin JC, Wang NC, Chang FY. Clinical and laboratory features in the early stage of severe acute respiratory syndrome. J Microbiol Immunol Infect 2006;39:45–53. [PubMed] [Google Scholar]
- 21. Regueiro‐Mira MV, Pita‐Fernández S, Pértega‐Díaz S, López‐Calviño B, Seoane‐Pillado T, Fernández‐Albalat‐Ruiz M. Prognostic factors in adult patients hospitalized for pneumonia caused by Legionella pneumophila . Rev Chil Infectol 2015;32:435–44. [DOI] [PubMed] [Google Scholar]
- 22. Kawamata R, Yokoyama K, Sato M, Goto M, Nozaki Y, Takagi T, Kumagai H, Yamagata T. Utility of serum ferritin and lactate dehydrogenase as surrogate markers for steroid therapy for Mycoplasma pneumoniae pneumonia. J Infect Chemother 2015;21:783–9. [DOI] [PubMed] [Google Scholar]
- 23. Lu A, Wang C, Zhang X, Wang L, Qian L. Lactate dehydrogenase as a biomarker for prediction of refractory Mycoplasma pneumoniae pneumonia in children . Respir Care 2015;60:1469–75. [DOI] [PubMed] [Google Scholar]