

Abstract
Objectives/Hypothesis:
To measure the populations of 36 fungi in the homes and sinuses of chronic rhinosinusitis (CRS) and non‐CRS patients.
Study Design:
Single‐blind cross‐sectional study.
Methods:
Populations of 36 fungi were measured in sinus samples and in the home vacuum cleaner dust of CRS (n = 73) and non‐CRS patients (n = 16) using quantitative polymerase chain reaction. Etest strips containing amphotericin B, anidulafungin, caspofungin, fluconazole, and voriconazole were used to test the susceptibility of seven potentially relevant fungi.
Results:
Seven fungi (Alternaria alternata, Cladosporium cladosporioides types 1 and 2, Cladosporium herbarum, Penicillium brevicompactum, Penicillium crustosum, and Penicillium chrysogenum type 2) were discovered at very high concentrations in some CRS patients. In vitro antifungal susceptibility testing of these seven fungi demonstrated species specific sensitivities. Four CRS patients with marked elevations of fungal populations in their sinus samples underwent endoscopic sinus surgery. After surgical treatment, the fungal populations were reduced by several orders of magnitude.
Conclusions:
Seven fungi were found in very high concentrations in the sinuses of some CRS patients. Not one of the five common antifungal agents could control all seven of these fungi based on in vitro tests.
Keywords: Chronic rhinosinusitis, fungi, antifungal agents, Level of Evidence: 2b
INTRODUCTION
Chronic rhinosinusitis (CRS) is one of the most common diseases of adults in the United States, resulting in 18 to 22 million office visits to physicians each year.1, 2 Currently, the etiology of CRS remains elusive, limiting treatment options for patients. The role of fungi in CRS remains controversial.3, 4, 5 Many differences in experimental details have added to this controversy, including multiple methods of sample collection,6 anatomical differences in sampling locations,7, 8 varying antifungal agents tested, and variable methods for administration and concentrations of antifungal agents.9, 10, 11 One observation most researchers agree on is that fungi can be cultured from nasal samples of most people, ill or not.12 But culturing does not provide quantitative information about the population of each fungus.
Researchers at the US Environmental Protection Agency developed a DNA‐based method of fungal analysis that is both specific and quantitative.13 This method was used to quantify the populations of 36 common14 and widespread fungi in the sinus and patients' home dust samples. Of the 36 fungi, there are 26 group 1 fungi that indicate water damage and 10 group 2 species that are often found in homes even without water damage, which primarily come from outdoors.15
Home‐exposure estimates to fungi were based on a scale called the Environmental Relative Moldiness Index (ERMI), which uses a mathematical formula to convert the concentrations of the 36 fungi into a single number, its ERMI value. This ERMI value describes the water damage and fungal growth in homes based on a comparison with a random national sampling of homes.15
The aim of this study was to measure and compare the quantity of 36 fungi in patients' sinuses and vacuum cleaner bag dust samples from the homes of these same individuals. In addition, the antifungal susceptibility of seven potentially relevant fungi was evaluated using Etest antifungal strips.
MATERIALS AND METHODS
The protocol for the study was approved by the Committee on Human Research. Patients were recruited for the study during routine care appointments in an outpatient clinical practice devoted to rhinology and general otolaryngology. Subjects were recruited for the study in two broad groups: patients with CRS and control subjects without CRS. Patients with CRS had a history of chronic sinusitis symptoms for >3 months. All patients had nasal endoscopic evidence of CRS or nasal polyposis on physical examination. All patients with sinusitis had evidence of CRS on computed tomography examination. Patients, therefore, met criteria for defining the diagnosis of chromic rhinosinusitis based on 2007 American Academy of Otolaryngology–Head and Neck Surgery published guidelines as well as other consensus recommendations.16, 17 Control subjects were undergoing nasal endoscopy as part of a general otolaryngology examination and had no complaints pertaining to acute rhinosinusitis or CRS. All patients in the control group had other clinical complaints that warranted fiberoptic examination of the nose and throat. Their nasal endoscopy showed no evidence of sinus disease. Four of the patients who underwent surgery for their CRS volunteered to have their sinuses resampled about 6 months to 2 years after their first sampling.
Patients were given 0.5% phenylephrine aerosolized spray and 21% tetracaine aerosolized spray to allow comfort during the initial endoscopic examination. Interdental brushes (Acclean; Henry Schein Inc., Melville, NY) were steam sterilized and used for specimen collection. Brush samples were collected by any of the three physicians listed as the first three authors. A 30° Hopkins rod attached to a camera and light source were used to guide the brush into the middle meatus under direct visualization. After swabbing the middle meatus mucosa and removing mucous from this area, the brush was placed in a 2 mL conical bottom, screw cap tube (PGC Scientifics, Gaithersburg, MD). The specimen was then refrigerated and transported to the laboratory on ice packs.
Patients were asked to submit their vacuum cleaner bag or vacuum cleaner contents in a Ziploc bag. Each patient confirmed that the vacuum cleaner had only been used in their home. These samples representing the home environment were also transported to the laboratory for analysis.
Extraction and Purification of Fungal DNA from Brush and Vacuum Bag Dust Samples
Once the brush samples were received in the laboratory, 0.3 g of 0.7 mm zirconia/silica beads (GeneRite, North Brunswick, NJ) was added to each tube. The dust retrieved from the patient's vacuum cleaner was sieved through a 300‐μm‐pore size nylon mesh screen (Gilson, Lewis Center, OH). A total of 5 mg of sieved dust was placed into a sterile 2‐mL screw‐capped extraction tube loaded with 0.3 g of 0.7 mm zirconia/silica beads. Each brush or dust sample was spiked with 1 × 10⁶ conidia of Geotrichum candidum as an external reference. Each extraction tube was shaken in the bead beater (Biospec Products, Bartlesville, OK) for 1 minute and the DNA purified using the DNA‐EZ extraction kit (GeneRite).
Fungal Analysis
Methods and assays have been reported previously for performing quantitative polymerase chain reaction (QPCR).18, 19 Briefly, the standard reaction assays contained 12.5 μL of Universal Master Mix (Applied Biosystems Inc., Foster City, CA), 1 μL of a mixture of forward and reverse primers at 25 μM each, 2.5 μL of a 400 nM TaqMan probe (Applied Biosystems Inc.), 2.5 μL of 2 mg/mL fraction V bovine serum albumin (Sigma Chemical, St. Louis, MO), and 2.5 μl of DNA‐free water (Cepheid, Sunnyvale, CA). To this mix was added 5 μL of the DNA extract from the sample. All primer and probe sequences used in the assays as well as known species comprising the assay groups are at the website: http://www.epa.gov/nerlcwww/moldtech.htm. Primers and probes were synthesized commercially (Applied Biosystems Inc.).
Reactions were performed with thermal cycling conditions consisting of 2 minutes at 50°C, 10 minutes at 95°C, followed by 40 cycles of 15 seconds at 95°C for template denaturation, and 1 minute at 60°C for probe and primer annealing and primer extension. The cycle threshold determinations were automatically performed by the instrument using default parameters. Assays for each target species and the internal reference (G candidum) were performed in separate tubes of the 96‐well plate format.
Antifungal Susceptibility Testing
Antifungal susceptibility of Penicillium brevicompactum, Penicillium crustosum, Penicillium chrysogenum type 2, Alternaria alternata, Cladosporium cladosporioides types 1 and 2, and Cladosporium herbarum was evaluated using Etest strips (Biomerieux, Marcy l'Etoile, France) according the manufacturer's instructions. Conidial suspensions were prepared in sterile distilled water and adjusted to 1 × 10⁶ conidia/mL. A total of 1 mL of the conidia suspension was then spread evenly onto the surface of a 150‐mm plate of RPMI (Roswell Park Memorial Institute) 1640 with 3‐(N‐morpholino)propanesulfonic acid (MOPS) and 2% glucose (Remel, Lenexa, KS), using a glass spreader and aseptic techniques. The inoculated surface was allowed to dry completely before Etest strips containing amphotericin B, anidulafungin, caspofungin, fluconazole, and voriconazole were applied.
The plates were then incubated at 30°C for 72 hours or until a confluent lawn of growth was clearly visible, before being photographed. The minimum inhibitory concentrations were read as the lowest drug concentrations at which the border of the elliptical inhibition zone intercepted the scale on the Etest antifungal strip. The analysis was performed in triplicate.
RESULTS
The average ERMI value from the CRS patients' homes was not significantly different from the average ERMI value found in the non‐CRS patient's homes (4.0 and 5.0, respectively) (data not shown). The rate of detection of only four species (C cladosporioides types 1 and 2, C herbarum, and Aureobasidium pullulans) were significantly correlated (by Fischer exact test) in the home dust and brush samples (Table I). However, many (13 of the 36) fungi were either never detected or only detected once in the brush samples. For the rest of the fungi, the rates of detection were very similar for brush samples from CRS and non‐CRS patients (Table I).
Table I.
Detection Rate of 36 Fungi in All Dust or All Nasal Brush Samples
| Fungi | All Dust, % Detected | All Brush, % Detected | Fisher Exact Test P Values* | CRS Brush, % Detected | Non‐CRS Brush, % Detected | Fisher Exact Test P Values* |
|---|---|---|---|---|---|---|
| Group 1 | ||||||
| Aspergillus flavus | 52 | 1 | 0 | 6 | ||
| Aspergillus fumigatus | 87 | 7 | 6 | 6 | <.05 | |
| Aspergillus niger | 98 | 9 | 8 | 6 | <.05 | |
| Aspergillus ochraceus | 32 | 3 | 0 | 13 | ||
| Aspergillus penicillioides | 99 | 33 | 34 | 25 | <.05 | |
| Aspergillus restrictus | 41 | 0 | 0 | 0 | ||
| Aspergillus sclerotiorum | 10 | 0 | 0 | 0 | ||
| Aspergillus sydowii | 38 | 6 | 3 | 19 | ||
| Aspergillus unquis | 12 | 0 | 0 | 0 | ||
| Aspergillus versicolor | 78 | 0 | 0 | 0 | ||
| Aureobasidium pullulans | 99 | 50 | <.05 | 42 | 69 | <.05 |
| Chaetomium globosum | 54 | 1 | 1 | 0 | ||
| Cladosporium sphaerospermum | 94 | 13 | 10 | 19 | <.05 | |
| Eurotium amstelodami | 97 | 24 | 14 | 56 | ||
| Paecilomyces variotii | 64 | 2 | 1 | 0 | ||
| Penicillium brevicompactum | 99 | 20 | 21 | 6 | <.05 | |
| Penicillium corylophilum | 71 | 1 | 1 | 0 | ||
| Penicillium crustosum | 79 | 7 | 6 | 19 | ||
| Penicillium purpurogenum | 48 | 1 | 1 | 0 | ||
| Penicillium spinulosum | 62 | 3 | 4 | 0 | ||
| Penicillium variabile | 70 | 10 | 7 | 19 | <.05 | |
| Scopulariopsis brevicaulis | 47 | 1 | 1 | 0 | ||
| Scopulariopsis chartarum | 73 | 1 | 8 | 0 | ||
| Stachybotrys chartarum | 76 | 0 | 0 | 0 | ||
| Trichoderma viride | 63 | 0 | 0 | 0 | ||
| Wallemia sebi | 93 | 8 | 6 | 13 | <.05 | |
| Group 2 | ||||||
| Acremonium strictum | 53 | 2 | 1 | 6 | ||
| Alternaria alternata | 98 | 19 | 12 | 44 | ||
| Aspergillus ustus | 58 | 0 | 0 | 0 | ||
| Cladosporium cladosporioides 1 | 100 | 88 | <.05 | 81 | 100 | <.05 |
| Cladosporium cladosporioides 2 | 100 | 52 | <.05 | 42 | 75 | <.05 |
| Cladosporium herbarum | 100 | 48 | <.05 | 37 | 69 | <.05 |
| Epicoccum nigrum | 99 | 18 | 14 | 19 | <.05 | |
| Mucor group | 96 | 9 | 8 | 6 | <.05 | |
| Penicillium chrysogenum type 2 | 97 | 17 | 16 | 13 | <.05 | |
| Rhizopus stolonifer | 78 | 7 | 7 | 6 | <.05 |
The rate of detection of each fungus in the CRS and non‐CRS brush samples is given.
P values are for any significant association of the specific mold in the dust and brush samples.
CRS = chronic rhinosinusitis.
Wilcoxon rank sum analysis of the average concentrations of each of the fungi in CRS versus non‐CRS bush samples suggested that two species, A alternata and C cladosporioides type 2, were in statistically higher concentrations (P < .05). However, these differences were not significantly different when a Holmes test was applied to correct for multiple comparisons.
Five additional fungi had concentration averages in CRS patients' brush samples from 100 to 10,000 times higher than the average in the non‐CRS brush samples (Table II). Based on the finding that specific fungi occurred at much higher concentrations in some CRS patients, the CRS patients were subdivided into two categories. Patients with one or more of these seven fungi at 1,000 times the concentration of the average non‐CRS patient's brush sample were placed in a category called high‐fungal CRS (n = 16), while the remaining patients were designated low‐fungal CRS (n = 57).
Table II.
Average Concentration of Each Fungus in Brush Samples From Chronic Rhinosinusitis Patients and Non‐Chronic Rhinosinusitis Patients Compared Using Wilcoxon Rank Sum Test
| CRS All, n = 73 | Non‐CRS All, n = 16 | Wilcoxon Rank Sum P Values* | High‐Fungal CRS, n = 16 | Low‐Fungal CRS, n = 57 | Wilcoxon Rank Sum P Values* | |
|---|---|---|---|---|---|---|
| Group 1 | A | B | C | D | ||
| Aspergillus flavus | 0 | 0 | NS | 0 | 0 | NS |
| Aspergillus fumigatus | 3 | 1 | NS | 0 | 4 | NS |
| Aspergillus niger | 16 | 0 | NS | 10 | 17 | NS |
| Aspergillus ochraceus | 0 | 3 | NS | 0 | 0 | NS |
| Aspergillus penicillioides | 3 | 1 | NS | 3 | 4 | NS |
| Aspergillus restrictus | 0 | 0 | NS | 0 | 0 | NS |
| Aspergillus sclerotiorum | 0 | 0 | NS | 0 | 0 | NS |
| Aspergillus sydowii | 0 | 3 | NS | 1 | 0 | NS |
| Aspergillus unquis | 0 | 0 | NS | 0 | 0 | NS |
| Aspergillus versicolor | 0 | 0 | NS | 0 | 0 | NS |
| Aureobasidium pullulans | 48 | 39 | NS | 16 | 56 | NS |
| Chaetomium globosum | 0 | 0 | NS | 0 | 0 | NS |
| Cladosporium sphaerospermum | 1 | 1 | NS | 0 | 1 | NS |
| Eurotium amstelodami | 0 | 1 | NS | 0 | 1 | NS |
| Paecilomyces variotii | 0 | 0 | NS | 0 | 0 | NS |
| Penicillium brevicompactum | 118,839 | 1 | NS | 578,117 | 60 | .0064 |
| Penicillium corylophilum | 0 | 0 | NS | 1 | 0 | NS |
| Penicillium crustosum | 424,001 | 37 | NS | 2,063,471 | 0 | <.001 |
| Penicillium purpurogenum | 0 | 0 | NS | 0 | 0 | NS |
| Penicillium spinulosum | 2 | 0 | NS | 8 | 0 | NS |
| Penicillium variabile | 5 | 6 | NS | 19 | 1 | NS |
| Scopulariopsis brevicaulis | 0 | 0 | NS | 0 | 0 | NS |
| Scopulariopsis chartarum | 1 | 0 | NS | 0 | 1 | NS |
| Stachybotrys chartarum | 0 | 0 | NS | 0 | 0 | NS |
| Trichoderma viride | 0 | 0 | NS | 0 | 0 | NS |
| Wallemia sebi | 2 | 4 | NS | 0 | 3 | NS |
| Group 2 | ||||||
| Acremonium strictum | 0 | 0 | NS | 0 | 0 | NS |
| Alternaria alternata | 298 | 2 | .006 | 1,451 | 0 | .007 |
| Aspergillus ustus | 0 | 0 | NS | 0 | 0 | NS |
| Cladosporium cladosporioides 1 | 167,060 | 54 | NS | 812,810 | 55 | <.001 |
| Cladosporium cladosporioides 2 | 74,803 | 10 | .039 | 363,987 | 14 | .003 |
| Cladosporium herbarum | 296,923 | 78 | NS | 1,444,891 | 34 | <.001 |
| Epicoccum nigrum | 83 | 1 | NS | 404 | 0 | NS |
| Mucor group | 1 | 0 | NS | 1 | 0 | NS |
| Penicillium chrysogenum 2 | 589,283 | 2 | NS | 2,867,839 | 1 | <.001 |
| Rhizopus stolonifer | 0 | 0 | NS | 1 | 0 | NS |
P values listed are based on pairwise comparisons. Based on the Holmes test, only those P values < .001 are statistically significant at an experiment‐wise α error rate of .05.
CRS = chronic rhinosinusitis; NS = not significant.
Wilcoxon rank sum analysis of the average concentrations of each of the fungi showed that these seven fungi were in significantly higher concentrations (P < .05) in high‐fungal CRS versus low‐CRS brush samples (Table III). However, only four fungi (P crustosum, P chrysogenum type 2, C cladosporioides type 1, and C herbarum) were significantly different when a Holmes correction was applied to adjust for multiple comparisons.
Table III.
Comparison of Average Species Concentrations in Dust Samples
| Non‐CRS Dust, Average | CRS Dust All, Average | CRS High Only, Average | CRS Not High, Average | |
|---|---|---|---|---|
| Group 1 | ||||
| Fungal ID\Sample ID | ||||
| Aspergillus flavus | 4 | 2 | 2 | 2 |
| Aspergillus fumigatus | 14 | 45 | 19 | 50 |
| Aspergillus niger | 106 | 102 | 134 | 92 |
| Aspergillus ochraceus | 7 | 10 | 3 | 12 |
| Aspergillus penicillioides | 13 | 123 | 26 | 143 |
| Aspergillus restrictus | 125 | 251 | 36 | 298 |
| Aspergillus sclerotiorum | 1 | 1 | 3 | 0 |
| Aspergillus sydowii | 11 | 8 | 1 | 10 |
| Aspergillus unquis | 0 | 75 | 1 | 90 |
| Aspergillus versicolor | 2 | 15 | 11 | 16 |
| Aureobasidium pullulans | 46,355 | 13,813 | 27,698 | 10,077 |
| Chaetomium globosum | 6 | 39 | 172 | 5 |
| Cladosporium sphaerospermum | 87 | 51 | 44 | 51 |
| Eurotium amstelodami | 38 | 24 | 31 | 22 |
| Paecilomyces variotii | 4 | 8 | 4 | 8 |
| Penicillium brevicompactum | 374 | 551 | 752 | 486 |
| Penicillium corylophilum | 16 | 23 | 14 | 25 |
| Penicilliumcrustosum | 58 | 186 | 89 | 203 |
| Penicillium purpurogenum | 9 | 51 | 2 | 62 |
| Penicillium spinulosum | 2 | 7 | 4 | 8 |
| Penicillium variabile | 17 | 271 | 21 | 323 |
| Scopulariopsis brevicaulis | 3 | 3 | 1 | 3 |
| Scopulariopsis chartarum | 9 | 5 | 9 | 4 |
| Stachybotrys chartarum | 28 | 8 | 7 | 8 |
| Trichoderma viride | 18 | 9 | 17 | 6 |
| Wallemia sebi | 978 | 241 | 59 | 278 |
| Group 2 | ||||
| Acremonium strictum | 3 | 3 | 5 | 2 |
| Alternaria alternata | 252 | 158 | 298 | 123 |
| Aspergillus ustus | 21 | 23 | 6 | 27 |
| Cladosporium cladosporioides 1 | 10,833 | 4,322 | 6,492 | 3,833 |
| Cladosporium cladosporioides 2 | 285 | 262 | 258 | 266 |
| Cladosporium herbarum | 5,453 | 2,248 | 4,406 | 1,725 |
| Epicoccum nigrum | 1,111 | 854 | 662 | 887 |
| Mucor group | 349 | 169 | 112 | 177 |
| Penicillium chrysogenum 2 | 192 | 304 | 372 | 281 |
| Rhizopus stolonifer | 395 | 100 | 17 | 117 |
CRS = chronic rhinosinusitis.
Four of the high‐fungal CRS patients underwent surgery during the study period. All four surgical cases were revision sinus surgical procedures for patients who had many years of chronic sinusitis signs and symptoms refractory to saline irrigation, antibiotic therapy, and topical and oral corticosteroid treatment. This small cohort had multiple years of sinus treatment and yet persisted in having chronic rhinosinusitis. Postoperative brush samples were obtained, and the follow‐up sample showed much lower fungal concentrations for the species that had previously been high (Table IV). However, not all fungi were eliminated after surgery. In fact, some species not previously detected were now detected at low concentrations. For example, Wallemia sebi was detected in CRS patient 2, Aspegillus niger in CRS patient 3, and Paecilomyces variotii in CRS patient 4 (Table lV).
Table IV.
Results of the Initial and Repeat Nasal Brush Sampling of Four Volunteer High‐Fungal Chronic Rhinosinusitis Category Patients
| Sample Dates | ||||||||
|---|---|---|---|---|---|---|---|---|
| Oct 1, 2007 | Jun 29, 2009 | Jun 30, 2008 | Jun 8, 2009 | Dec 8, 2008 | June 1, 2009 | Dec 19, 2008 | Jun 8, 2009 | |
| 1A | 1B | 2A | 2B | 3A | 3B | 4A | 4B | |
| Group 1 | ||||||||
| Aspergillus flavus | ND | ND | ND | ND | ND | ND | ND | ND |
| Aspergillus fumigatus | ND | ND | ND | ND | ND | ND | ND | ND |
| Aspergillus niger | ND | ND | ND | ND | ND | 5 | ND | ND |
| Aspergillus ochraceus | ND | ND | ND | 7 | ND | ND | ND | ND |
| Aspergillus penicillioides | 9 | ND | ND | ND | ND | ND | 3 | ND |
| Aspergillus restrictus | ND | ND | ND | ND | ND | ND | ND | ND |
| Aspergillus sclerotiorum | ND | ND | ND | ND | ND | ND | ND | ND |
| Aspergillus sydowii | ND | ND | 11 | ND | ND | ND | ND | ND |
| Aspergillus unquis | ND | ND | ND | ND | ND | ND | ND | ND |
| Aspergillus versicolor | ND | ND | ND | ND | ND | ND | ND | ND |
| Aureobasidium pullulans | 8 | ND | 170 | ND | ND | 340 | 5 | ND |
| Chaetomium globosum | ND | ND | ND | ND | ND | ND | ND | ND |
| Cladosporium sphaerospermum | ND | ND | ND | 12 | ND | ND | 1 | ND |
| Eurotium amstelodami | 1 | ND | ND | ND | ND | 22 | 2 | 15 |
| Paecilomyces variotii | ND | ND | ND | ND | ND | ND | ND | 8 |
| Penicillium brevicompactum | ND | ND | ND | ND | 120 | 21 | 71,000 | ND |
| Penicillium corylophilum | ND | ND | ND | ND | ND | ND | ND | ND |
| Penicillium crustosum | ND | ND | ND | ND | 4,900,000 | ND | 59 | ND |
| Penicillium purpurogenum | ND | ND | ND | ND | 2 | ND | ND | ND |
| Penicillium spinulosum | ND | ND | ND | ND | ND | ND | ND | ND |
| Penicillium variabile | ND | ND | ND | ND | ND | ND | ND | ND |
| Scopulariopsis brevicaulis | ND | ND | ND | ND | ND | ND | ND | ND |
| Scopulariopsis chartarum | 6 | ND | ND | ND | ND | ND | ND | ND |
| Stachybotrys chartarum | ND | ND | ND | ND | ND | ND | ND | ND |
| Trichoderma viride | ND | ND | ND | ND | ND | ND | ND | ND |
| Wallemia sebi | ND | ND | ND | 27 | ND | ND | 2 | ND |
| Group 2 | ||||||||
| Acremonium strictum | ND | ND | ND | ND | 2 | ND | ND | ND |
| Alternaria alternata | 6 | ND | ND | ND | ND | ND | 21,000 | 28 |
| Aspergillus ustus | ND | ND | ND | ND | ND | ND | ND | ND |
| Cladosporium cladosporioides 1 | 580 | 44 | 170 | 94 | 610,000 | ND | 1,200,000 | 1,600 |
| Cladosporium cladosporioides 2 | 24,000 | 17 | ND | 12 | 4,000 | ND | 33,000 | 68 |
| Cladosporium herbarum | 57,000 | 46 | 1,700,000 | 190 | 92,000 | 100 | 1,100,000 | 2,000 |
| Epicoccum nigrum | 4 | ND | ND | 1 | ND | ND | 650 | 17 |
| Mucor Group | 17 | ND | ND | 1 | ND | ND | ND | 8 |
| Penicillium chrysogenum type 2 | ND | ND | 14 | ND | 260 | ND | 2 | ND |
| Rhizopus stolonifer | ND | ND | ND | ND | ND | ND | 10 | ND |
ND = not detected.
Antifungal susceptibility testing was performed on the seven fungi of interest (A alternata, C cladosporioides types 1 and 2, C herbarum, P brevicompactum, P crustosum, and P chrysogenum type 2) using Etest strips containing a concentration gradient of amphotericin B, anidulafungin, caspofungin, fluconazole, and voriconazole. Results are shown in Figure 1.
Figure 1.
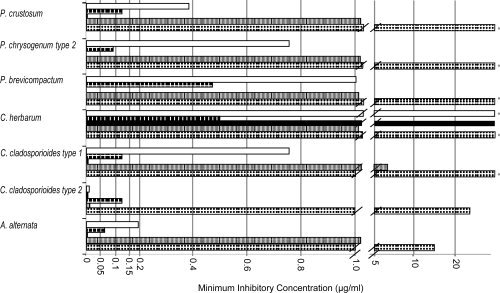
The minimum inhibitory concentrations (on the Etest antifungal strip for amphotericin B (open bar or first bar), anidulafungin (dark hatch or second bar), caspofungin (black or third bar), fluconazole (gray or forth bar), and voriconazole (dotted or fifth bar) against seven fungi associated with some cases of chronic rhinosinusitis. The asterisk indicates the fungus was unaffected at the highest agent concentration on the Etest strip (i.e., for amphotericin B, anidulafungin, and caspofungin 32 μg/mL; and for fluconazole and voriconazole 255 μg/mL.
Amphotericin B was very effective against C cladosporioides type 2 but less effective against the other fungi and not effective against C herbarum. Anidulafungin was very effective against all of the fungi expect C herbarum, which was unaffected. Caspofungin was moderately effective against all of the fungi. Fluconazole had no effect against most of these fungi and only moderate effect against C cladosporioides type 2 and A alternata. Voriconazole was very effective against C cladosporioides type 2 but only moderately effective against the other fungi tested.
DISCUSSION
The fungal exposures, based on ERMI values in the homes, were very similar for both CRS and non‐CRS patients. In addition, the average concentration of many species was similar in the dust samples from CRS and non‐CRS patients. Taken together, these results suggest that the exposures to these 36 fungi appear to have been similar in the home environment. However, differences based on exposures in other environments cannot be ruled out.
The rate of detection of each of the 36 fungi in the dust samples was generally higher than the rate of detection in the brush samples (Table I). There are many possible reasons for differences in detection rates. These differences might have been a function of the sample type itself (i.e., brush vs. 5 mg of dust). Variations in inhalation or clearance rates might have created these differences. Our hypothesis is that the differences might rest with the ability of some species to colonize the sinuses of some people.
In 16 of 73 CRS patients (22%), one or more of seven fungi were detected at very high concentrations relative to the other samples. This finding suggested that the population of CRS patients may be divided into two subgroups, high‐ or low‐fungal CRS patients.
If the concentration of one or more of these seven species was at least 1,000‐fold greater than in the non‐CRS patients, then that CRS patient was placed into the high‐fungal CRS category. The disproportionately high concentrations of certain fungi in a subpopulation of CRS patients' sinus samples supports the hypothesis that specific fungi have the ability to grow or amplify in the sinuses of susceptible people. Surgical alteration of the sinus environment of the four high‐fungal CRS patients may explain the reduction in the fungal populations.
Many of these seven fungi are generated from outdoor sources like plants and soil (therefore called group 2), and avoidance would be nearly impossible. Therefore, treatment with antifungal agents might be an alternative approach to controlling fungal growth for some CRS patients.
Previous studies using antifungal agents in the treatment of CRS have reported some beneficial effects20 and others little to none.3, 9, 11, 21, 22 Our data provide possible explanations regarding the variable results of clinical trials evaluating antifungal agents. If only some cases of CRS were associated with fungi, then any benefits to that fraction might have been lost in the larger population of CRS patients. It is also possible that the antifungal treatment regime used in these trials was inadequate to control the fungal growth. If these fungi are not invasive or disseminating in the tissues, such as typical fungal pathogens (e.g., Aspergillus fumigatus), then amplification in sinuses as colonizers may present a more difficult target to penetrate with antifungal agents.
No antifungal agent tested in vitro was able to suppress the growth of all of these potentially relevant fungi. Amphotericn B, which has been used in many of the clinical trials against CRS,10, 20, 23 had no measurable effect on the growth of C herbarum. Fluconozole was generally the least effective of the agents in inhibiting growth.
Published clinical trials also failed to monitor the treatment to determine if the concentrations of fungi in the sinuses were controlled. Our results suggest that future clinical trials should screen for high‐fungal CRS patients and combine multiple antifungal agents with an evaluation as to whether the treatment actually reduced the fungal populations.
This study has a number of limitations. First, only 36 fungi were monitored, and there are perhaps hundreds of other potentially relevant fungi. Additional microorganisms, most prominently bacteria, and immune dysfunction have also been implicated in the etiology of CRS. Our study did not evaluate either of these factors. Finally, our data led to the division of CRS patients into high‐ and low‐fungal categories, which diminished the power of the statistical analysis. When the results were corrected for multiple comparisons, some of the species data failed statistical significance. However, the results do provide guidance for future studies.
CONCLUSION
Identification of the pathophysiology of CRS may be complicated by the presence of multiple and distinct etiologies. If fungi are involved in some cases, QPCR analysis may be helpful in identifying the role of specific fungi in a portion of CRS patients. Our results also suggest a more targeted approach to treatment of selected patients with multiple antifungal agents might be desirable.
Acknowledgements
The authors would like to thank Wendy Ma, BA, for her coordination of this study and for helping to retain and report data.
The MSQPCR technology was patented (no. 6,387,652) by the US Environmental Protection Agency (EPA), and commercial applications can result in royalties paid to the EPA. The EPA, through its Office of Research and Development, partially funded and collaborated in the research described here. It has been subjected to the Agency's peer review and has been approved as an EPA publication. Mention of trade names or commercial products does not constitute endorsement or recommendation by the EPA for use.
The authors have no other funding, financial relationships, or conflicts of interest to disclose.
BIBLIOGRAPHY
- 1. Benson V, Marano M. Current Estimates from the National Health Interview Survey, 1995. Hyattsville, MD: National Center for Health Statistics, 1998, Series 10, No. 199. [PubMed] [Google Scholar]
- 2. Benninger MS, Ferguson BJ, Hadley JA, et al. Adult chronic rhinosinusitis: definitions, diagnosis, epidemiology, and pathophysiology. Otolaryngol Head Neck Surg 2003; 129 ( suppl): S1–S32. [DOI] [PubMed] [Google Scholar]
- 3. Rank MA, Adolphson CR, Kita H. Antifungal therapy for chronic rhinosinusitis: the controversy persists. Curr Opin Allergy Clin Immunol 2009; 9: 67–72. [DOI] [PMC free article] [PubMed] [Google Scholar]
- 4. Ponikau JU, Sherris DA, Kern EB. Immunologic response to fungus is not universally associated with chronic rhinosinusitis. Otolaryngol Head Neck Surg 2010; 143: 607–610. [DOI] [PubMed] [Google Scholar]
- 5. Orlandi RR, Marple BF. The role of fungus in chronic rhinosinusitis. Otolaryngol Clin North Am 2010; 43: 531–537. [DOI] [PubMed] [Google Scholar]
- 6. Ragab A, Clement P, Vincken W. Bacterial cultures of the middle meatus and bronchoalveolar lavage in chronic rhinosinusitis. ORL J Otorhinolaryngol Relat Spec 2007; 69: 85–91. [DOI] [PubMed] [Google Scholar]
- 7. Ponikau JU, Sherris DA, Kern EB, et al. The diagnosis and incidence of allergic fungal sinusitis. Mayo Clin Proc 1999; 74: 877–884. [DOI] [PubMed] [Google Scholar]
- 8. Murr AH, Goldberg AN, Vesper SJ. Fungal speciation using quantitative polymerase chain reaction (QPCR) in patients with and without chronic rhinosinusitis. Laryngoscope 2006; 116: 1342–1348. [DOI] [PMC free article] [PubMed] [Google Scholar]
- 9. Ebbens FA, Scadding GK, Badia L, et al. Amphotericin B nasal lavages: not a solution for patients with chronic rhinosinusitis. J Allergy Clin Immunol 2006; 118: 1149–1156. [DOI] [PubMed] [Google Scholar]
- 10. Kern EB, Sherris D, Stergiou AM, et al. Diagnosis and treatment of chronic rhinosinusitis: focus on intranasal Amphotericin B. Ther Clin Risk Manag 2007; 3: 319–325. [DOI] [PMC free article] [PubMed] [Google Scholar]
- 11. Shirazi MA, Stankiewicz JA, Kammeyer P. Activity of nasal amphotericin B irrigation against fungal organisms in vitro. Am J Rhinol 2007; 21: 145–148. [DOI] [PubMed] [Google Scholar]
- 12. Lackner A, Stammberger H, Buzina W, et al. Fungi: a normal content of human nasal mucus. Am J Rhinol 2005; 19: 125–129. [PubMed] [Google Scholar]
- 13. Haugland R, Vesper S. Identification and quantification of specific fungi and bacteria. US patent 6,387,652. May 14, 2002.
- 14. Vesper S, Wakefield J, Ashley P, et al. Geographic distribution of Environmental Relative Moldiness Index (ERMI) molds in U.S. homes. J Environ Public Health 2011; 2011: 242457. [DOI] [PMC free article] [PubMed] [Google Scholar]
- 15. Vesper SJ, McKinstry C, Haugland RA, et al. Development of an environmental relative moldiness index for homes in the U.S. J Occu Environ Med 2007; 49: 829–833. [DOI] [PubMed] [Google Scholar]
- 16. Rosenfeld RM, Andes D, Bhattacharyya N, Cheung D, et al. Clinical practice guideline: adult sinusitis. Otolaryngol Head Neck Surg 2007; 137 ( 3 suppl): S1–S31. [DOI] [PubMed] [Google Scholar]
- 17. Meltzer EO, Hamilos DL, Hadley JA, et al. Rhinosinusitis: establishing definitions for clinical research and patient care. J Allergy Clin Immunol 2004; 114( 6 suppl): 155–212. [DOI] [PMC free article] [PubMed] [Google Scholar]
- 18. Haugland RA, Brinkman NE, Vesper SJ. Evaluation of rapid DNA extraction methods for the quantitative detection of fungal cells using real time PCR analysis. J Microbiol Meth 2002; 50: 319–323. [DOI] [PubMed] [Google Scholar]
- 19. Haugland RA, Varma M, Wymer LJ, Vesper SJ. Quantitative PCR of selected Aspergillus, Penicillium and Paecilomyces species. Sys App Micro 2004; 27: 198–210. [DOI] [PubMed] [Google Scholar]
- 20. Ponikau JU, Sherris DA, Weaver A, Kita H. Treatment of chronic rhinosinusitis with intranasal amphotericin B: a randomized, placebo‐controlled, double‐blind pilot trial. J Allergy Clin Immunol 2005; 115: 125–131. [DOI] [PubMed] [Google Scholar]
- 21. Stankiewicz JA, Musgrave BK, Scianna JM. Nasal amphotericin irrigation in chronic rhinosinusitis. Curr Opin Otolaryngol Head Neck Surg 2008; 16: 44–46. [DOI] [PubMed] [Google Scholar]
- 22. Bhattacharyya N. Antimicrobial therapy in chronic rhinosinusitis. Curr Allergy Asthma Rep 2009; 9: 221–226. [DOI] [PubMed] [Google Scholar]
- 23. Lal D, Stankiewicz JA. Antifungal treatment and chronic rhinosinusitis. Curr Allergy Asthma Rep 2009; 9: 227–231. [DOI] [PubMed] [Google Scholar]