

Abstract
Interferon‐induced transmembrane protein 3 (IFITM3) ıplays a crucial role in the antiviral responses of Type I interferons (IFNs). The role of IFITM3 in the central nervous system (CNS) is, however, largely unknown, despite the fact that its expression is increased in the brains of patients with neurologic and neuropsychiatric diseases. Here, we show the role of IFITM3 in long‐lasting neuronal impairments in mice following polyriboinosinic‐polyribocytidylic acid (polyI:C, a synthetic double‐stranded RNA)‐induced immune challenge during the early stages of development. We found that the induction of IFITM3 expression in the brain of mice treated with polyI:C was observed only in astrocytes. Cultured astrocytes were activated by polyI:C treatment, leading to an increase in the mRNA levels of inflammatory cytokines as well as Ifitm3. When cultured neurons were treated with the conditioned medium of polyI:C‐treated astrocytes (polyI:C‐ACM), neurite development was impaired. These polyI:C‐ACM‐induced neurodevelopmental abnormalities were alleviated by ifitm3−/− astrocyte‐conditioned medium. Furthermore, decreases of MAP2 expression, spine density, and dendrite complexity in the frontal cortex as well as memory impairment were evident in polyI:C‐treated wild‐type mice, but such neuronal impairments were not observed in ifitm3−/− mice. We also found that IFITM3 proteins were localized to the early endosomes of astrocytes following polyI:C treatment and reduced endocytic activity. These findings suggest that the induction of IFITM3 expression in astrocytes by the activation of the innate immune system during the early stages of development has non‐cell autonomous effects that affect subsequent neurodevelopment, leading to neuropathological impairments and brain dysfunction, by impairing endocytosis in astrocytes. GLIA 2013
Keywords: IFITM3, astrocytes, neurodevelopment, polyI:C, neuron‐glia interaction
INTRODUCTION
Recent studies have demonstrated a crucial role of interferon‐induced transmembrane protein 3 (IFITM3) in the antiviral responses of type I interferons (IFNs) in vitro and in vivo (Brass et al.,2009; Everitt et al.,2012; Schoggins etal.,2011). Thus, IFITM3 restricts the morbidity and mortality associated with influenza (Everitt et al.,2012) and mediates cellular resistance to influenza A H1N1 virus (Brass et al.,2009; Everitt etal.,2012; Huang et al.,2011; Lu et al.,2011; Schoggins et al.,2011), dengue virus (Brass etal.,2009), SARS coronavirus (Lu et al.,2011), and human immunodeficiency virus 1 (Schoggins et al.,2011; Yount et al.,2010). The role of IFITM3 in the central nervous system (CNS) is largely unknown, although its increased expression has been demonstrated in the brains of patients with neurologic and neuropsychiatric diseases such as schizophrenia (Arion et al.,2007), autism (Garbett etal.,2008), bipolar disorder (Iwamoto et al.,2004), and Alzheimer's disease (Ricciarelli et al.,2004). Conversely, we previously demonstrated that neonatal treatment of mice with polyriboinosinic‐polyribocytidylic acid (polyI:C, an inducer of innate immune responses via toll‐like receptor 3) caused a significant increase in IFITM3 mRNA levels in the hippocampus, which resulted in long‐lasting brain dysfunction, including cognitive and emotional impairments as well as a deficit in depolarization‐evoked glutamate release in the hippocampus in adulthood (Ibi et al.,2009).
In the present study, we investigated the role of IFITM3 in long‐lasting neuronal impairments following polyI:C‐induced immune challenge during the early stages of development. We demonstrated, for the first time, that the expression of IFITM3 in the early endosomes of astrocytes following an immune challenge impairs endocytic activity, leading to the disruption of the neurotrophic effects of astrocytes and the consequent neurodevelopmental and cognitive abnormalities in mice. Accordingly, astroglial IFITM3 may contribute to neuronal impairments that could be induced by immune inflammatory reactions in the immature brain (Hagberg et al.,2012; Mwaniki et al.,2012), even though it mediates cellular resistance to various viruses in the lungs and other peripheral organs (Brass et al.,2009; Everitt et al.,2012; Huang et al.,2011; Lu et al.,2011; Schoggins et al.,2011; Yount et al.,2010).
MATERIALS AND METHODS
Animals
ICR and C57BL/6J mice were obtained from Japan SLC Inc. (Hamamatsu, Japan). Homozygous ifitm3−/− mice were generated and characterized as described previously (Lange et al.,2008). Littermates (wild‐type [wt, C57BL/6J] and ifitm3−/−), which were generated by cross‐breeding ifitm3+/− mice, were used for the experiments. IFITM3 expression was not observed in various organs of ifitm3−/− mice (Brass et al.,2009; Everitt et al.,2012; Lange etal.,2008) or in cultured astrocytes collected from ifitm3−/− mice (Fig. 4I). They were housed under a standard 12‐h light/dark cycle (lights on at 0900) at a constant temperature (23 ± 1°C) with free access to food and water throughout the experiments.
Figure 4.
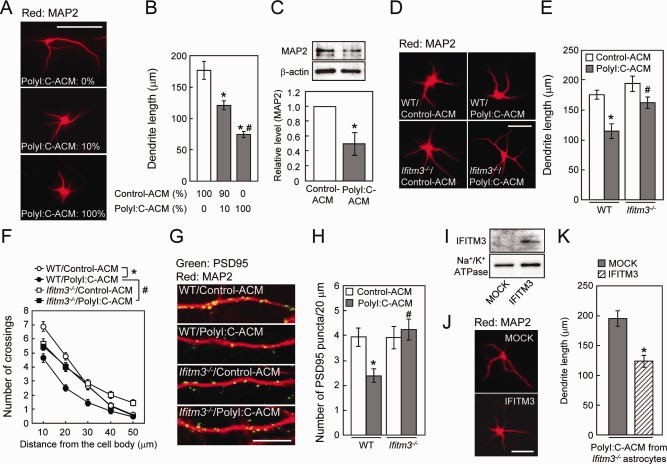
Role of IFITM3 in the polyI:C‐ACM‐induced defect of dendrite and spine formation in vitro. (A) Representative images of MAP2‐positive dendrites of primary cultured neurons incubated with the indicated doses of polyI:C‐ACM. Scale bar: 100 µm. (B) MAP2‐positive dendrite length. Values are the means ± SEM (n = 27–31). *P < 0.05 versus control‐ACM, # P < 0.05 versus 10% polyI:C‐ACM. (C) MAP2 protein levels in primary cultured neurons incubated with polyI:C‐ACM at a dose of 100%. Values are the means ± SEM of three independent experiments. *P < 0.05 versus control‐ACM. (D) Representative images of MAP2‐positive dendrites of primary cultured neurons incubated with control‐ or polyI:C‐ACM from wt or ifitm3−/− astrocytes. Scale bar: 100 µm. (E, F) MAP2‐positive dendrite length (E) and Sholl analysis of dendrite (F). Values are the means ± SEM of three independent experiments (n = 44–49). Dendrite length: polyI:C‐ACM (F (1,178) = 18.73, P < 0.0001), genotype (F (1,178) = 9.60, P < 0.01), interaction (F (1,178) = 1.81, P = 0.18). Dendrite complexity: polyI:C‐ACM (F (1,178) = 24.18, P < 0.001), genotype (F (1,178) = 5.29, P < 0.05), interaction (F (1,178) = 6.56, P < 0.05). *P < 0.05 versus wt/control‐ACM, # P < 0.05 versus wt/polyI:C‐ACM. (G) Representative images of PSD95 puncta (green) and MAP2 (red) of the hippocampal neurons on DIV7. Scale bar: 10 µm. (H) Number of spines on neurons (PSD95 puncta per 20 µm along dendrites). Values are the means ± SEM of three independent experiments (n = 17–20). Number of PSD95 puncta: polyI:C‐ACM (F (1,72) = 2.48, P = 0.12), genotype (F (1,72) = 5.35, P < 0.05), interaction (F (1,72) = 5.65, P < 0.05). *P < 0.05 versus wt/control‐ACM, # P < 0.05 versus wt/polyI:C‐ACM. (I) IFITM3 protein expression in ifitm3−/− astrocytes at 48 h after the transfection. (J) Representative images of MAP2‐positive dendrites of cultured neurons incubated with polyI:C‐ACM from ifitm3−/− astrocytes transfected with either mock or myc‐IFITM3. Scale bar: 100 µm. (K) MAP2‐positive dendrite length. Values are the means ± SEM (n = 22–28) of two independent experiments. *P < 0.05 versus polyI:C‐ACM from ifitm3−/− astrocytes transfected with mock‐control.
The animals were handled in accordance with the guidelines established by the Institutional Animal Care and Use Committee of Nagoya University, the Guiding Principles for the Care and Use of Laboratory Animals approved by the Japanese Pharmacological Society, and the National Institutes of Health Guide for the Care and Use of Laboratory Animals.
Neonatal PolyI:C Treatment
For postnatal polyI:C‐treatment, pregnant females were monitored for the parturition date, which was taken as postnatal day (PD) 0. All litters were randomly divided into two groups: vehicle‐ and polyI:C‐treated. The mice were treated with a daily subcutaneous injection of either pyrogen‐free saline or 5 mg/kg polyI:C (Sigma‐Aldrich, St. Louis, MO) between PD2 and PD6. The animals were weaned at PD21, and divided along gender lines at PD28 (Ibi et al.,2009).
Immunohistochemistry
Neonatal male and female mice were deeply anesthetized with diethyl ether at 24 h after the final polyI:C treatment on PD7 and perfused transcardially with saline, followed by 4% paraformaldehyde in 0.1 M phosphate‐buffered saline (PBS, pH 7.4). Their brains were removed, post‐fixed in the same fixative, and then cryoprotected. Ten micrometer‐thick coronal brain sections were cut on a cryostat and mounted on slides. The sections were denatured in a microwave oven in 0.01 M citrate buffer (pH 6.0). After blocking with 5% donkey and 5% goat serum/PBS for 60 min, mouse anti‐neuronal nuclei (NeuN, neuronal marker, 1:200; Millipore, Billerica, MA), mouse anti‐glial fibrillary acidic protein (GFAP, astroglial marker, 1:1,000; Sigma‐Aldrich), rat anti‐CD11b (microglial marker, 1:100; Serotec, Oxford, UK), and rabbit anti‐IFITM3 antibodies (1:100; Abcam, Cambridge, UK) diluted in PBS containing 0.1% Triton X‐100 and 1% donkey and 1% goat serum were applied to the sections, which were then incubated overnight at 4°C. After washing in PBS, goat anti‐mouse Alexa Fluor (AF) 568 and anti‐rabbit AF488 antibodies (1:1,000; Invitrogen, Eugene, OR) were added to the sections for 2 h at room temperature. The samples were observed using a confocal‐laser scanning microscope (LSM 510 Axio Imager; Zeiss, Jene, Germany).
Western Blotting
Membranous fractions were isolated for western blotting of IFITM3. The hippocampus was removed quickly after decapitation and homogenized in ice‐cold buffer A (20 mM Tris‐HCl (pH 7.5), 2 mM EDTA, 0.5 mM EGTA, and 0.32 M sucrose, and protease inhibitor cocktail [Sigma‐Aldrich]). The homogenate was centrifuged at 700g for 10 min, and the supernatant was ultracentrifuged at 100,000g for 30 min at 4°C. The resulting supernatant was retained as the cytosolic fraction. The pellets were washed with buffer B (buffer A without sucrose) and homogenized in buffer B with 1% Triton X‐100. After incubation for 45 min, the soluble fractions were obtained by ultracentrifugation at 100,000g for 30 min and then retained as the membranous fractions for western blotting of IFITM3.
For western blotting of microtubule‐associated protein 2 (MAP2), brain samples and primary cultured neurons at a high density (1.75 × 10⁶ cells/well in a 6‐well plate) were homogenized at 4°C in lysis buffer (20 mM Tris‐HCl [pH 7.4], 150 mM NaCl, 50 mM NaF, 2 mM EDTA, 1% Nonidet P‐40, 1 mM sodium orthovanadate, 0.1% SDS, 1% sodium deoxycholate, and protease inhibitor cocktail [Sigma‐Aldrich]). The homogenate was centrifuged at 13,000g for 20 min and the resulting supernatant was retained for western blotting.
The protein concentration was determined using a DC Protein Assay Kit (Bio‐Rad Laboratories, Hercules, CA), and protein was boiled in sample buffer (0.0625 M Tris‐HCl [pH 6.8], 2% SDS, 5% sucrose, 0.002% bromophenol blue, and 5% 2‐mercaptoethanol), applied to a SDS‐polyacrylamide gel, and subsequently transferred to a polyvinylidene difluoride membrane (Millipore). The membrane was blocked with 3% bovine serum albumin (BSA) or skim milk in Tris‐buffered saline‐Tween 20 (TBS‐T: 10 mM Tris‐HCl [pH 7.5], 100 mM NaCl, and 1% Tween‐20), and incubated with rabbit anti‐IFITM3 (1:500; IMGENEX, San Diego, CA), rabbit anti‐MAP2 (dendritic marker, 1:5,000; Millipore), mouse anti‐Na+/K+ ATPase antibodies (membrane marker, 1:500; Millipore), rabbit anti‐early endosomal antigen 1 (EEA1) (1:1,000; GeneTex, Irvine, CA), and goat anti‐β‐actin antibodies (1:1,000; Santa Cruz Biotechnology, Santa Cruz, CA) at 4°C overnight. After incubation with a horseradish peroxidase‐conjugated anti‐rabbit, goat or mouse IgG antibody (1:1000; KPL, Gaithersburg, MD) for 2 h, the immune complex was detected using ECL Plus western blotting detection reagents (GE Healthcare, Chalfont St. Giles, Buckinghamshire, UK). The intensity of the bands on the membranes was analyzed by densitometry (Atto Instruments, Tokyo, Japan).
Astrocyte Culture and PolyI:C Treatment
Astrocytes were isolated from the cortices and hippocampi of PD1–2 mice (ICR or C57BL/6J) as previously reported (Fernandez et al.,2007). Briefly, tissue was passed through a 70 µm pore nylon mesh and dissociated with 3 mg/mL dispase (Roche Diagnostics GmbH, Mannheim, Germany) and 4 µg/mL DNase (Roche Diagnostics GmbH). Cells were cultured in Dulbecco's Modified Eagle's Medium (DMEM; Sigma‐Aldrich) containing 10% (v/v) fetal bovine serum (FBS) in 75 cm2 tissue culture flasks, split once upon confluence, and plated in 6‐ or 24‐well plastic tissue culture plates. The secondary cultures were grown to confluence in all experiments.
The DMEM was replaced with Neurobasal Medium (Invitrogen) supplemented with B‐27 (Invitrogen) at 4 days before treatment with polyI:C (Sigma‐Aldrich), IFN‐β; (PBL InterferonSource, Piscataway, NJ), or vehicle, and then renewed with the same medium at 24 h before treatment. Astrocytes were cultured for an additional 24 h in the presence or absence of polyI:C (10 µg/mL) in Neurobasal Medium supplemented with B‐27, and then the medium was used as astrocyte‐conditioned medium (ACM). PolyI:C‐ACM refers to the ACM prepared from polyI:C‐treated astrocytes. Control‐ACM refers to the ACM prepared from vehicle‐treated astrocytes.
For astrocytes isolated from wt or ifitm3−/− mice, primary astrocytes were used in all experiments, as described previously (Chou etal.,2008). More than 95% of these cells were GFAP‐positive, and they were negative for tau/MAP2 and CD11b.
Primary Culture of Hippocampal Neurons and ACM Treatment
Primary cultured hippocampal neurons were prepared from ICR or C57BL/6J mice on gestational day 16, as described previously (Fath et al.,2009). Briefly, embryo hippocampi were digested with 0.25% trypsin and 0.01% DNase for 10 min at 37°C and mechanically dissociated by gentle pipetting. Neurons were seeded on poly‐d‐lysine‐coated coverslips, and cultured in Neurobasal Medium with B‐27 and 1 mM glutamine on DIV0. The Neurobasal Medium was replaced with polyI:C‐ACM or control‐ACM on DIV2. The effects of polyI:C‐ACM or polyI:C on cell viability, dendrite (MAP2 immunoreactivity) and spine [postsynaptic density 95 (PSD95) immunoreactivity] formation, total neurite length, and gene expression levels were assayed on DIV3 or 7. When the neurons were cultured for 7 days, 1.0 µM cytosine β‐d‐arabinofuranoside (Ara‐C) was added to the culture medium on DIV2. In the present study, our preparations were ≥99% pure for neurons, as demonstrated by anti‐tau or MAP2 immunostaining.
Immunocytochemistry
The cells were fixed with 4% paraformaldehyde in 0.1 M PBS for 20 min and then permeabilized with 0.1% Triton X‐100 for an additional 10 min. After incubation in blocking solution (1% goat and 1% donkey serum/PBS) for 30 min, mouse anti‐GFAP (1:500; Sigma‐Aldrich), rabbit anti‐IFITM3 (1:100; Abcam), mouse anti‐tau (axonal marker, 1:500; Santa Cruz Biotechnology), rabbit anti‐MAP2 (1:1,000; Millipore), mouse anti‐PSD95 (1:500; Thermo Scientific, Rockford, IL), rat antilysosomal‐associated membrane protein 1 (LAMP1) (lysosome marker, 1:200; Serotec), mouse anti‐EEA1 (early endosome marker, 1:1,000; Abcam), rabbit anti‐EEA1 (1:250; GeneTex), mouse anti‐mannose 6 phosphate receptor (M‐6‐PR) (late endosome marker, 1:100; Abcam), and mouse anti‐myc (1:2,000; Cell Signaling Technology, Danvers, MA) antibodies diluted in blocking solution were applied to the cells, which were then incubated overnight at 4°C. After washing in PBS, secondary antibodies were applied as described in Immunohistochemistry. Cultured cells were observed under a microscope (Axio Imager; Zeiss, Jene, Germany) and photographed using a digital camera (AxioCam MRc5; Zeiss). Confocal images of cultured cells were obtained using a Nikon confocal razor microscope (A1Rsi; Nikon, Tokyo, Japan).
Neurite Elongation and Dendritic Development Assays
In the neurite elongation assay, the neurons were plated at a low density (1.0 × 10⁴ cells/well in a 24‐well plate). Axons were identified by double immunostaining with anti‐tau (axonal marker) and anti‐MAP2 (dendritic marker) antibodies according to a previous study (Inagaki et al.,2001). Only MAP2‐negative neurites that showed typical axonal morphology were counted as axons. MAP2‐positive neurites were counted as dendrites. In all experiments, neurons that clearly had tau‐ or MAP2‐positive neurites were selected randomly for images. All neurites were traced using Neurolucida software (MicroBrightField, Williston, VT) and neurite length was calculated using Neuroexplorer (MicroBrightField). Sholl analysis for dendrite complexity (Ge et al.,2006) was carried out by counting the number of dendrites that crossed a series of concentric circles at 10 µm intervals from the cell soma using Neuroexplorer.
PSD95‐immunoreactive puncta along the dendrites in each photomicrograph were counted manually and normalized by dendrite length (Maezawa and Jin,2010). For statistical analysis of the number of PSD95‐immunoreactive puncta, a dendritic shaft within 100 µm from the cell soma of the largest dendrite was analyzed.
ELISA
To determine the levels of secreted IFN‐β in ACM, a commercial ELISA kit was used according to the manufacturer's instructions (R&D Systems).
Knockdown of ifitm3 and eea1 in Astrocytes by Small Interfering RNA Treatment
Astrocytes isolated from ICR mice were plated onto 6‐well plates and cultured in DMEM with 10% FBS, which was replaced with Neurobasal Medium containing B‐27 at 4 days before transfection with siRNA for ifitm3 using Lipofectamine RNAiMAX Transfection Reagent (Invitrogen) according to the manufacturer's instructions. We obtained the siRNA for SCr (sense: AACGCAAUAACCGAUUAACdTdT, antisense: GUUAAUCGGUUAUUGCGUUdTdT) and ifitm3 (sense: CCAAACUACGAAAGAAUCAdTdT, antisense: UGAUUCUUUCGUAGUUUGGdTdT) from KOKEN (Tokyo, Japan), and stealth siRNA against eea1 (#1 sense: CCACUGAAUUACAACAUCAGUUAGA, #1 antisense: UCUAACUGAUGUUGUAAUUCAGUGG; #2 sense: GGAAGAGAAGCGGAAGGAAGAGUUU, #2 antisense: AAACUCUUCCUUCCGCUUCUCUUCC) and stealth RNAi negative control (control siRNA) from Invitrogen. The silencing effect of siRNA for ifitm3 or eea1 was evaluated by RT‐PCR or Western blotting at 3 or 2 days after transfection, respectively (Supp. Info. Figs. 3A and 4A).
MTT Assay
Cell viability was analyzed using the 3‐(4,5‐dimethylthiazol‐2‐yl)‐2,5‐diphenyl tetrazolium bromide (MTT; Wako, Osaka, Japan) assay. The cells were plated at a density of 3.0 × 10⁴ cells/well in a 96‐well plate. MTT solution (5 mg/mL) of a 10th of the medium was added to each well followed by incubation for 3 h at 37°C. The formazan crystals that formed were dissolved in DMSO and the absorbance was measured on a Bio‐Rad Model 680 microplate reader using a test wavelength of 570 nm and a reference wavelength of 655 nm. The reduction in MTT activity was expressed as a percentage of control.
Total RNA Isolation and Real‐Time RT‐PCR
Cultured cells were collected using trypsin/EDTA at the indicated time points after polyI:C treatment in the presence or absence of a neutralizing IFN‐β antibody (PBL InterferonSource). Total RNA was isolated using the RNeasy Mini Kit (Qiagen, Hilden, Germany) and converted into complementary DNA (cDNA) using the SuperScript III First‐Strand Synthesis System for RT‐PCR (Invitrogen). mRNA expression levels were quantified using a 7300 Real‐Time PCR System (Applied Biosystems, Foster City, CA). Quantitative real‐time PCR was performed in a volume of 25 µL with 500 ng cDNA and 500 nM primers in Power SYBR Green Master Mix (Applied Biosystems). The primers are described in Table 1, and β‐actin was used as an internal control.
Table 1.
Primers for Immune Inflammation‐Related Genes and Other Genes
| Target gene | Forward | Reverse |
|---|---|---|
| IFITM3 | GCCTATGCCTACTCCGTGAAGT | GCCTGGGCTCCAGTCACAT |
| TLR3 | TCATTTTCGTTATCACACACCATTT | TGAACTGCGTGATGTACCTTGAA |
| MDA‐5 | ATGAAACCAGAGGAGTATGCACATAA | TGCTTTGCAATGCTTCTTTTGA |
| RIG‐I | GCGTGCTACACAGCTGACATTC | AGCGTCTCCAAGGACAGTGTAGT |
| IFN‐β | AGCTCCAAGAAAGGACGAACAT | GCCCTGTAGGTGAGGTTGATCT |
| β‐Actin | CGATGCCCTGAGGCTCTTT | TGGATGCCACAGGATTCCA |
IFITM3, interferon‐induced transmembrane protein 3; TLR3, toll‐like receptor 3; MDA‐5, melanoma differentiation associated protein‐5; RIG‐I, retinoic acid‐inducible gene‐I; IFN‐β, interferon‐β.
Alternatively, 1.0 µg of total RNA was converted to cDNA using the RT2 First Strand Kit (SABiosciences, Frederick, MD) according to the manufacturer's protocol. The cDNA was diluted with distilled water to a volume of 100 µL. One microliter was used for each primer set in pathway‐specific RT2 Profiler PCR Arrays (Qiagen) according to the manufacturer's protocol. Mouse Common Cytokine PCR Array (catalog number PAMM‐021A) plates were used for the analysis.
Golgi Staining
Golgi staining was performed using the FD Rapid Golgi Stain Kit according to the manufacturer's protocol (FD NeuroTechnologies, Ellicott City, MD) and a previous report (Uchida et al.,2011). The brains were then sectioned using a cryostat at a thickness of 60 μm. Bright‐field microscopic (Keyence, Osaka, Japan) images (at 100 × magnification) of pyramidal neurons located in layer II/III of the frontal cortex were obtained. Only fully impregnated neurons displaying dendritic trees without obvious truncations and isolated from neighboring impregnated neurons were retained for analysis. Quantification of spine density was limited to dendrites at 50 to 200 μm from the soma. Spine density is expressed as the number of spines per 10 µm of dendrite length (Uchida et al.,2011). To examine the dendritic complexity of pyramidal neurons located in layer II/III of the frontal cortex, Sholl analysis was performed as described in Dendritic development assays in vitro.
Novel Object Recognition Test
A novel object recognition test was carried out at 12 weeks, as described previously (Ibi et al.,2009; Nagai et al.,2007). The male and female mice were individually habituated to an open box (30 × 30 × 35 cm high) for 3 days. During the training session, two novel objects were placed in the open field and the animals were allowed to explore the objects for 10 min under moderate light conditions (10 lux). The time spent exploring each object was recorded. During the retention sessions, the animals were placed in the same box at 24 h after the training session, one of the familiar objects used during training was replaced by a novel object, and the mice were allowed to explore freely for 5 min. The preference index in the retention session, i.e., the ratio of the time spent exploring the novel object over the total time spent exploring both objects, was used to measure cognitive function. In the training session, the preference index was calculated as the ratio of time spent exploring the object that was replaced by a novel object in the retention session to the total exploration time. The explorative behavior in both sessions was recorded on video for subsequent blind scoring.
Plasmid and Transfection
The cDNA for mouse Ifitm3 was generated by PCR from cDNA derived from mouse brain using specific primers (forward primer; GGGATCCTATGAACCACACTTCTCAAGCCT, reverse primer; GGAATTCTTATTAAGTGTGAAGGTTTTGAGCGT), and ligated into the cloning site of the expression vector pCMV‐Tag 3A (Agilent Technologies, Santa Clara, CA). The HA‐RalA expression vector was a gift from Dr. Takaya Satoh.
Astrocytes isolated from ifitm3−/− mice were plated in 6‐well plastic culture plates and cultured as described in astrocyte culture. Each well was transfected with 2 µg of DNA using the Lipofectamine LTX (Invitrogen) 24 h before exposure to polyI:C. Forty‐eight hours after transfection, polyI:C‐ACM was collected from ifitm3−/− astrocytes transfected with either mock or myc‐IFITM3. COS7 cells were plated at 1.0 to 2.0 × 10⁵ cells/well on glass coverslips in 6‐well plastic culture plates. The following day, each well was transfected with 1 µg of DNA using the FuGENE6 transfection reagent (Roche Diagnostics GmbH) and Opti‐MEM (Invitrogen). Forty‐eight hours after transfection, the cells were fixed, stained, and imaged as described in Immunocytochemistry.
Measurement of Endocytosis and Recycling Activity
COS7 cells or astrocytes were preincubated for 80 min AF555‐Tf or 120 min AF555‐EGF in serum‐free DMEM at 37°C and then incubated with AF555‐labeled probes (Invitrogen) for 10 min (AF555‐Tf, 50 µg/mL) or 15 min (AF555‐EGF, 50 ng/mL). External AF555‐labeled probes were removed by washing with ice‐cold PBS, whereas bound AF555‐labeled probes were removed by an acid wash in PBS (pH 5.0) followed by a wash with PBS (pH 7.0) (Padron et al.,2006), and then stained and observed. For the Tf recycling studies, the cells were incubated with AF555‐Tf (50 µg/mL) at 37°C for 60 min, washed with ice‐cold PBS (pH 5.0), and washed with PBS (pH 7.0). The cells were then incubated in serum‐free DMEM containing holo‐transferrin (500 µg/mL, Sigma‐Aldrich), deferoxamine (200 µg/mL, Sigma‐Aldrich), and BSA (0.2%, Sigma‐Aldrich) at 37°C for 30 min or 60 min, and the remaining AF555 signals within the cells were determined (Padron et al.,2006). To quantify the intensity of the AF555 signals, the mean intensity of each individual cell was measured with MetaMorph software (Molecular Devices, Sunnyvale, CA) and then averaged across different cells as described previously (Abe etal.,2008). The background signal in non‐cell areas was subtracted. For comparison, the fluorescent intensity of MOCK‐ and IFITM3‐transfected COS7 cells was normalized to the control COS7 cells.
Immunoprecipitation
Coimmunoprecipitation experiments were performed using a Pierce Crosslink Immunoprecipitation Kit (Pierce, Rockford, IL) according to the manufacturer's instructions. Briefly, COS7 cells were cotransfected with HA‐RalA and myc‐IFITM3, and the cells were lysed using the IP lysis/wash buffer provided in the kit. The brains were collected from neonatal mice at 24 h after the final polyI:C treatment on PD7 and homogenized with lysis buffer (40 mM Tris‐HCl [pH 7.4], 2 mM EDTA, 100 mM NaCl, and 0.5% Triton X‐100, and protease inhibitor cocktail [Sigma‐Aldrich]). Lysate protein (1000 mg) collected from COS7 cells and neonatal mouse brain was added to Protein A/G Plus Agarose cross‐linked to rabbit anti‐HA (Sigma‐Aldrich), rabbit anti‐ATP6V0B (Abgent, San Diego, CA), mouse anti‐kinesin heavy chain (Millipore), rabbit anti‐visfatin (Bethyl Laboratories, Montgomery, TX), normal rabbit IgG, or normal mouse IgG (Santa Cruz Biotechnology), and incubated overnight at 4°C. After elution, the samples were analyzed with western blotting as described above.
Statistical Analysis
Data are expressed as the mean ± SEM. Differences between two groups were analyzed with the two‐tailed Student's t‐test. Multiple group comparisons were made with one‐way analysis of variance (ANOVA) or two‐way ANOVA, followed by Bonferroni's test when the F ratios were significant (P < 0.05).
RESULTS
PolyI:C Treatment Increases the Expression Levels of IFITM3 in Astrocytes via IFN‐β Signaling
IFITM3 protein levels in the hippocampus were significantly increased, at least up to 72 h after the final polyI:C treatment (Fig. 1A), but there was no significant difference in adulthood (vehicle: 1.0 ± 0.1, polyI:C: 1.2 ± 0.1; P = 0.21). Double immunostaining for IFITM3 with glial fibrillary acidic protein (GFAP, astroglial marker; Fig. 1B), neuronal nuclei (NeuN, mature neuronal marker; Fig. 1C), or CD11b (Fig. 1D) revealed that IFITM3 immunoreactivity colocalized to GFAP‐positive astrocytes, but not NeuN‐positive neurons or CD11b‐positive microglia, suggesting that astrocytes express IFITM3 following polyI:C treatment.
Figure 1.
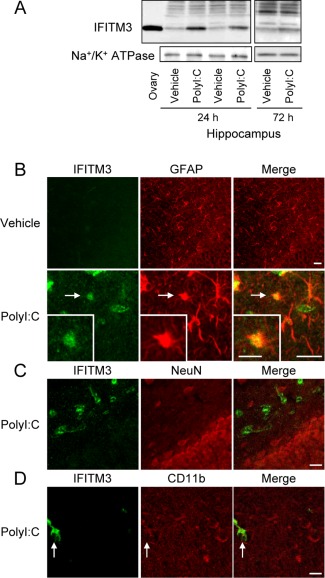
IFITM3 proteins are expressed predominantly in astrocytes, but not neurons and microglia, in vivo. (A) Hippocampal IFITM3 protein levels at 24 h and 72 h after the final polyI:C treatment in neonatal mice. An ovary sample was loaded as a positive control. (B–D) Neonatal polyI:C treatment increases IFITM3‐like immunoreactivity in astrocytes. Double immunostaining for IFITM3 (green in left panels: B–D), GFAP (red in middle panels: B), NeuN (C), and CD11b (D), in the hippocampus at 24 h after the final polyI:C treatment of neonatal mice. Scale bar: 20 µm (inset, 10 μm).
Next, we examined the effect of polyI:C (10 µg/mL) treatment on the expression levels of IFITM3 mRNA in vitro (Fig. 2A). Interestingly, the basal expression levels of IFITM3 mRNA in primary cultured neurons were 100‐fold less than in astrocytes, and the induction of IFITM3 mRNA was observed in cultured astrocytes, but not neurons (Fig. 2A). Similar changes in basal and polyI:C‐induced overexpression were observed in the mRNA levels of toll‐like receptor 3 (TLR3) and other double‐stranded RNA (dsRNA) sensors (Kawai and Akira2010), e.g., retinoic acid‐inducible gene‐I (RIG‐I) and melanoma differentiation associated protein‐5 (MDA‐5) (Fig. 2A).
Figure 2.
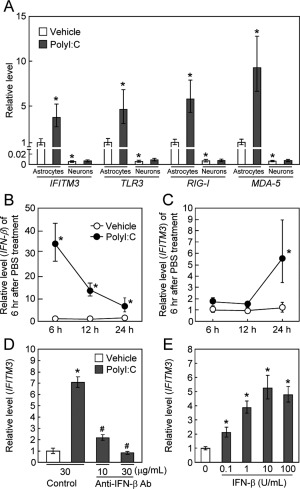
PolyI:C treatment increases IFITM3 expression levels in astrocytes via IFN‐β signaling. (A) PolyI:C treatment (10 µg/mL) increased the expression levels of IFITM3, TLR3, RIG‐I, and MDA‐5 mRNA in cultured astrocytes, but not in primary cultured neurons. Values are the means ± SEM (n = 4). IFITM3: polyI:C (F (1,10) = 8.52, P < 0.05), cell type (F (1,10) = 477.83, P < 0.0001), interaction (F (1,10) = 4.26, P = 0.067). TLR3: polyI:C (F (1,10) = 6.69, P < 0.001), cell type (F (1,10) = 358.82, P < 0.0001), interaction (F (1,10) = 3.45, P = 0.093). RIG‐I: polyI:C (F (1,10) = 6.24, P < 0.05), cell type (F (1,10) = 348.17, P < 0.0001), interaction (F (1,10) = 7.00, P < 0.05). MDA‐5: polyI:C (F (1,10) = 18.47, P < 0.01), cell type (F (1,10) = 493.17, P < 0.0001), interaction (F (1,10) = 14.32, P < 0.01). *P < 0.05 versus corresponding vehicle‐treated control astrocytes. (B, C) Time‐course changes in IFN‐β (B) and IFITM3 (C) mRNA levels after polyI:C treatment in cultured astrocytes. Values are the means ± SEM (n = 3–4). (B) IFN‐β: polyI:C (F (1,13) = 201.74, P < 0.001), time (F (2,13) = 2.85, P = 0.094), interaction (F (2,13) = 3.99, P < 0.05). (C) IFITM3; polyI:C (F (1,12) = 31.41, P < 0.001), time (F (2,12) = 10.54, P < 0.01), interaction (F2,12 = 5.38, P < 0.05). * P < 0.05 versus corresponding vehicle‐treated control astrocytes. (D) Inhibition of polyI:C‐induced IFITM3 expression by treatment with a neutralizing IFN‐β antibody. Astrocytes were cotreated for 24 h with polyI:C and a neutralizing IFN‐β antibody. Values are the means ± SEM (n = 3–4). IFITM3: F (3,10) = 57.55, P < 0.001. *P < 0.05 versus vehicle‐treated control astrocytes cotreated with control IgG. # P < 0.05 versus polyI:C‐treated astrocytes cotreated with control IgG. (E) Induction of IFITM3 mRNA by IFN‐β in cultured astrocytes. Astrocytes were cultured for 24 h with IFN‐β. Values are the means ± SEM (n = 3). IFITM3: F(4,10) = 30.86, P < 0.001. *P < 0.05 versus vehicle‐treated control astrocytes.
As polyI:C is known to induce IFNs in various systems (Kawai and Akira,2010), we measured IFN‐β expression levels in astrocytes after polyI:C treatment. IFN‐β mRNA levels in cultured astrocytes were significantly increased to >30‐fold of control at 6 h after polyI:C treatment and then decreased (Fig. 2B). In contrast, an increase in IFITM3 mRNA was first observed at 24 h after polyI:C treatment compared with vehicle‐treated astrocytes (Fig. 2C). Twenty‐four hours after polyI:C treatment, IFN‐β protein levels in the culture medium of astrocytes were significantly increased compared to the control group (vehicle: no detection, polyI:C: 420.4 ± 78.0 pg/mL). When IFN‐β was neutralized by an anti‐IFN‐β antibody, the polyI:C‐induced expression of IFITM3 mRNA was completely abolished, while control IgG had no such effect (Fig. 2D). Conversely, treatment with recombinant IFN‐β protein significantly increased IFITM3 mRNA levels in cultured astrocytes in a dose‐dependent manner (Fig. 2E). These results suggest that IFN‐β is involved in the induction of IFITM3 following polyI:C treatment in astrocytes in an autocrine and paracrine manner.
Role of IFITM3 in the PolyI:C‐Induced Impairment of Neurodevelopment of Cultured Neurons
To investigate the possible contribution of IFITM3 in polyI:C‐induced neuronal impairments, we first studied the effect of polyI:C‐ACM on neurodevelopment in vitro. PolyI:C‐ACM significantly inhibited neurite elongation compared with control‐ACM derived from vehicle‐treated astrocytes (Fig. 3A,B) without affecting viability (Fig. 3C). In contrast, the direct addition of polyI:C (10 µg/mL) into the culture medium of primary cultured neurons on days in vitro 2 (DIV2) had no effect on their neurite elongation (Supp. Info. Fig. 1A,B, vehicle: 65.0 ± 5.72 μm, polyI:C: 57.3 ± 5.82 μm; P = 0.35) or viability (Supp. Info. Fig. 1C, 94.8 ± 2.9% of vehicle‐treated control; P = 0.38).
Figure 3.
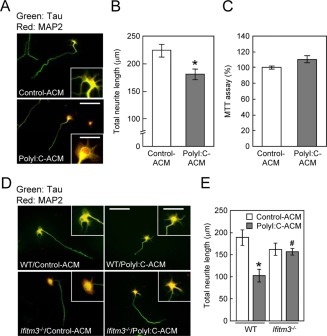
Effect of polyI:C‐ACM on cell viability or neurite elongation of cultured neurons. (A) Immunocytochemical images of primary neurons cultured for 24 h from DIV2 with control‐ or polyI:C‐ACM derived from ICR mice. Neurons were fixed and stained with tau (green: axonal marker) and MAP2 (red: dendritic marker) antibodies at 24 h after treatment with control‐ or polyI:C‐ACM. Scale bar: 200 µm (inset, 75 μm). (B) Total neurite length of each neuron. Values are the means ± SEM of three independent experiments (n = 72–75). *P < 0.05 versus control‐ACM. (C) Cell viability of primary cultured neurons was assayed at 24 h after polyI:C‐ACM treatment by MTT assays. Values are the means ± SEM (n = 5). (D) Immunocytochemical images of neurons cultured with control‐ or polyI:C‐ACM derived from wt (C57BL/6J) or ifitm3 −/− astrocytes. Scale bar: 200 µm (inset, 100 μm). (E) Total neurite length of each neuron. Values are the means ± SEM of three independent experiments (n = 25) [polyI:C‐ACM (F (1,90) = 9.86, P < 0.001), genotype (F (1,90) = 0.05, P = 0.82), interaction (F (1,90) = 0.075, P = 0.78)]. *P < 0.05 versus wt/control‐ACM, # P < 0.05 versus wt/polyI:C‐ACM.
To examine whether IFITM3 is involved in the polyI:C‐ACM‐induced inhibition of neurite elongation, we prepared polyI:C‐ACM from astrocytes derived from ifitm3‐null mutant (ifitm3−/−) or wild‐type [wt, C57BL/6J] mice. Primary cultured neurons on DIV2 from wt mice were cultured for 24 h in polyI:C‐ACM. The polyI:C‐ACM‐induced inhibition of total neurite elongation was markedly attenuated when the astrocytes were prepared from ifitm3−/− mice, although the effect of control‐ACM from ifitm3−/− mice was indistinguishable from that of wt mice (Fig. 3D,E).
To analyze the effect of polyI:C‐ACM on dendritic development, the length and complexity of the MAP2‐positive dendrites of cultured neurons were measured at 5 days after ACM treatment on DIV7. Dendrite length and MAP2 protein levels of cultured neurons were significantly reduced when they were cultured for 5 days in polyI:C‐ACM (Fig. 4A–C). The inhibitory effects of polyI:C‐ACM on dendrite length (Fig. 4A,B) and complexity (Supp. Info. Fig. 2A) were dose‐dependent. The effects of control‐ACM from ifitm3−/− astrocytes on MAP2‐positive dendrite length and the complexity of cultured neurons were indistinguishable from those of wt astrocytes; further, the inhibitory effects of polyI:C‐ACM on dendrite length (Fig. 4D,E) and complexity (Fig. 4F) were not evident when polyI:C‐ACM was prepared from ifitm3−/− astrocytes. We also examined the effect of polyI:C‐ACM on spine formation in vitro by measuring the number of PSD95‐immunoreactive puncta on MAP2‐positive dendrites, which represents the postsynaptic density of excitatory synapses. A significant decrease in PSD95‐immunoreactive puncta was observed when neurons were cultured for 5 days in polyI:C‐ACM. This inhibitory effect of polyI:C‐ACM on spine formation in vitro was abolished when polyI:C‐ACM was prepared from ifitm3−/− astrocytes. There was no significant difference in the number of PSD95‐positive puncta on neurons cultured in control‐ACM derived from wt and ifitm3−/− astrocytes (Fig. 4G,H). Furthermore, we examined the effect of polyI:C‐ACM from ifitm3−/− astrocytes that had previously transfected with myc‐tagged IFITM3 (myc‐IFITM3) on neurodevelopment in vitro (Fig. 4I–K). PolyI:C‐ACM from ifitm3−/− astrocytes expressing myc‐IFITM3 significantly reduced dendritic length (Fig. 4J,K) and complexity (Supp. Info. Fig. 2B) of cultured neurons compared with that from ifitm3−/− astrocytes transfected with mock control. Alternatively, when IFITM3 gene expression in astrocytes was acutely knocked down in vitro using small interfering RNA (siRNA) for ifitm3, the inhibitory effects of polyI:C‐ACM on neurodevelopment in vitro, i.e., the decrease in total neurite elongation and dendrite length of cultured neurons, were significantly attenuated (Supp. Info. Fig. 3B–E).
These findings suggest that polyI:C‐ACM contains humoral factors derived from polyI:C‐treated astrocytes that impair the neurodevelopment of neurons in vitro, in which astroglial IFITM3 plays an indispensable role.
Role of IFITM3 in the Neuropathological and Behavioral Abnormalities of PolyI:C‐Treated Mice
We then investigated the role of IFITM3 in the brain dysfunction of polyI:C‐treated mice. The protein levels of MAP2 in the frontal cortex of wt C57BL6J mice treated with polyI:C were significantly decreased on PD7 and PD14 as compared to the levels in vehicle‐treated control mice (Fig. 5A), but these differences disappeared in adulthood (Fig. 5A). The decrease of MAP2 levels on PD14 in the frontal cortex induced by neonatal polyI:C treatment was completely attenuated in ifitm3−/− mice, although there was no apparent difference in MAP2 levels in the frontal cortex between vehicle‐treated wt and vehicle‐treated ifitm3−/− mice on PD14 (Fig. 5B).
Figure 5.
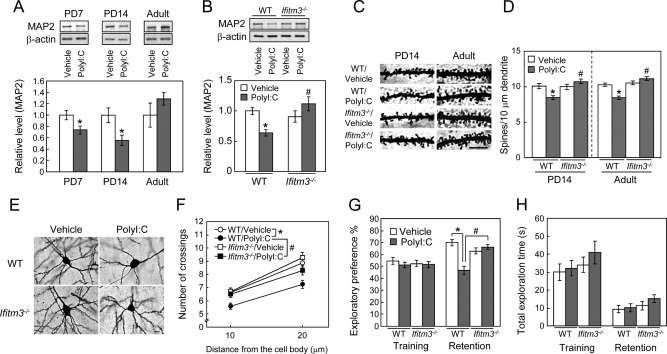
Role of IFITM3 in the polyI:C‐induced neurodevelopmental impairments in the frontal cortex. (A) Time‐course changes in MAP2 protein levels in the frontal cortex of mice. Values are the means ± SEM (n = 3–5). *P < 0.05 versus vehicle‐treated control mice. (B) MAP2 expression in the frontal cortex of vehicle‐ or polyI:C‐treated wt or ifitm3−/− mice on PD14. Values are the means ± SEM (n = 9–17). MAP2: polyI:C (F (1,44) = 0.73, P = 0.40), genotype (F (1,44) = 4.70, P < 0.05), interaction (F (1,44) = 10.11, P < 0.01). * P < 0.05 versus vehicle‐treated wt mice, # P < 0.05 versus polyI:C‐treated wt mice. (C) Representative images of the spines of cortical pyramidal neurons (Golgi staining). Scale bar: 10 µm. (D) Quantitative analysis of spine density of the cortical pyramidal neurons. PD14; n = 25–30 neurons from three to four mice [polyI:C (F (1,104) = 1.80, P = 0.183), genotype (F (1,104) = 9.960, P < 0.01), interaction (F (1,104) = 12.179, P < 0.001)]. Adult; n = 32–44 from three to four mice [polyI:C (F (1,148) = 5.64, P < 0.0001), genotype (F (1,148) = 34.10, P < 0.05), interaction (F (1,148) = 22.74, P < 0.0001)]. * P < 0.05 versus vehicle‐treated wt mice, # P < 0.05 versus polyI:C‐treated wt mice. (E, F) Sholl analysis of dendrite complexity of cortical pyramidal neurons in adult mice. (E) Representative images of cortical pyramidal neurons. Scale bar: 10 µm. (F) Quantitative analysis of dendrite complexity. Mean intersections of cortical dendrites with a 10 μm concentric circle. n = 30–44 neurons from three to four mice [polyI:C (F (1,130) = 15.08, P < 0.001), genotype (F (1,130) = 5.79, P < 0.05), interaction (F (1,130) = 1.68, P = 0.20)]. * P < 0.05 versus vehicle‐treated wt mice, # P < 0.05 versus polyI:C‐treated wt mice. (G, H) Role of IFITM3 in the polyI:C‐induced cognitive impairment of mice in adulthood. (G) Exploratory preference. (H) Total exploration time. Values are the means ± SEM (n = 8–11). Exploratory preference (%) in the retention session: polyI:C (F (1,34) = 5.12, P < 0.05), genotype (F (1,34) = 13.02, P < 0.01), interaction (F (1,34) = 23.11, P < 0.0001). *P < 0.05 versus vehicle‐treated wt mice, # P < 0.05 versus polyI:C‐treated wt mice.
To further analyze dendritic development in vivo, we conducted Golgi staining and quantified spine density and dendrite complexity of pyramidal neurons located in layer II/III of the frontal cortex of mice. Neonatal polyI:C treatment significantly decreased the spine density of pyramidal neurons at both stages, i.e., on PD14 and in adulthood (Fig. 5C,D). Dendrite complexity of pyramidal neurons was also reduced by polyI:C treatment (Fig. 5E,F). The reduction of spine density and dendrite complexity induced by neonatal polyI:C treatment were attenuated in ifitm3−/− mice, although there were no apparent differences between vehicle‐treated wt and ifitm3−/− mice (Fig. 5C–F). Accordingly, although the change in MAP2 levels in the frontal cortex was transient, neonatal immune activation by polyI:C treatment in mice resulted in a persistent abnormality in the morphology of cortical neurons. These neuropathological phenotypes in polyI:C‐treated adult mice are consistent with those observed in neurologic and neuropsychiatric diseases (Law et al.,2004; Penzes etal.,2011).
To investigate the role of IFITM3 in the behavioral abnormalities of polyI:C‐treated adult mice, we compared object recognition memory between polyI:C‐treated wt and ifitm3−/− mice. In the retention session, which was carried out at 24 h after the training session, a marked decrease in the exploratory preference for novel objects was evident in polyI:C‐treated wt mice compared with vehicle‐treated wt mice. This impairment of object recognition memory was not observed in polyI:C‐treated ifitm3−/− mice; thus, polyI:C‐treated ifitm3−/− mice exhibited a preference for novel objects in the retention session, as did vehicle‐treated ifitm3−/− mice (Fig. 5G). There was no significant difference in the total time taken to explore two objects during the retention sessions among the four groups (Fig. 5H). These results suggest that neonatal IFITM3 expression in astrocytes plays a crucial role in polyI:C‐induced neurodevelopmental and cognitive impairments in adulthood.
Localized Expression of IFITM3 in the Early Endosomes of Astrocytes
As an initial step to clarify the pathophysiological role of IFITM3 in astrocytes, we investigated its subcellular localization. IFITM3 in polyI:C‐treated astrocytes (Fig. 6A) and COS7 cells transfected with myc‐IFITM3 (Fig. 6D,E) colocalized exclusively with early endosomal antigen 1 (EEA1, an established early endosome marker) (Grant and Donaldson2009; Leonard etal.,2008; Sigismund etal.,2008). IFITM3 immunoreactivity in polyI:C‐treated cultured astrocytes was not observed in other organelles, e.g., late endosomes (Fig. 6B) and lysosomes (Fig. 6C).
Figure 6.
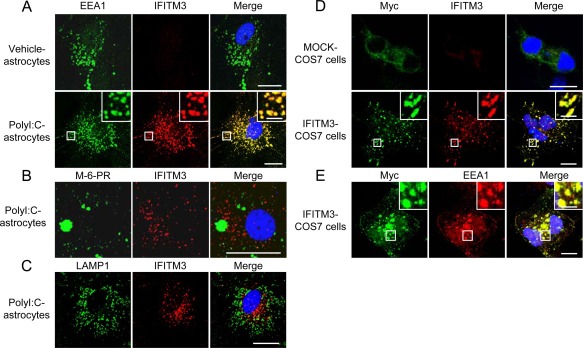
Localization of IFITM3 in cultured astrocytes and COS7 cells. (A–C) Immunostaining for cellular markers (EEA1: early endosomes, M‐6‐PR: late endosome, LAMP1: lysosome) and IFITM3 in cultured astrocytes. Immunostaining for EEA1, M‐6‐PR, LAMP1 (green in left panels, A‐C) and IFITM3 (red in middle panels, A–C) in cultured astrocytes. Scale bar: 20 µm (inset, 5 μm). (D and E) Immunostaining for Myc (green in left panels: D and E), IFITM3 (red in middle panels: D), and EEA1 (red in middle panel: E) in MOCK‐ and IFITM3‐transfected COS7 cells. Scale bar: 10 µm (inset, 2.5 μm).
Because of the selective localization of IFITM3 in the early endosomes of astrocytes, we speculated that IFITM3 may modulate their function, i.e., endocytosis. Endocytosis consists of two different systems, namely, clathrin‐dependent and ‐independent (Leonard et al.,2008). Accordingly, we analyzed the uptake of Alexa Fluor 555‐labeled transferrin (AF555‐Tf) and Alexa Fluor 555‐labeled epidermal growth factor (AF555‐EGF) as a measure of clathrin‐dependent and ‐independent endocytosis, respectively. Knockdown of eea1, necessary for endosomal trafficking, in cultured astrocytes markedly reduced the endocytic activity of AF555‐EGF (Supp. Info. Fig. 4B,C), which is consistent with the effect of eea1 knockdown in COS7 cells (Leonard et al.,2008).
The uptake of AF555‐Tf (Fig. 7A) and AF555‐EGF (Fig. 7B) in IFITM3‐transfected COS7 cells was significantly reduced compared with their uptake in control and MOCK‐transfected COS7 cells (Fig. 7C). In contrast, IFITM3 overexpression in COS7 cells had no effect on AF555‐Tf recycling (Fig. 7D), which also agrees with the effect of eea1 knockdown in COS7 cells (Leonard etal.,2008). To confirm the effect of IFITM3 on endocytosis in cultured astrocytes, AF555‐Tf and AF555‐EGF uptake was measured in polyI:C‐treated wt and ifitm3−/− astrocytes. PolyI:C treatment markedly reduced AF555‐Tf and AF555‐EGF uptake in wt astrocytes (Fig. 8A,B). The reduction of AF555‐EGF uptake was completely abolished in ifitm3−/− astrocytes, while AF555‐Tf uptake was partially reversed in ifitm3−/− astrocytes (Fig. 8A,B). The latter phenomena may be explained by the observation that dsRNA suppresses clathrin‐dependent endocytosis (DeWitte‐Orr et al.,2010). Finally, to ascertain whether AF555‐EGF uptake is mediated by clathrin‐independent endocytosis under our experimental conditions (Leonard et al.,2008; Sigismund et al.,2008), we measured its uptake in the presence of chlorpromazine (CPM), an inhibitor of clathrin‐dependent endocytosis. The reduction of AF555‐EGF uptake in IFITM3‐transfected COS7 cells and polyI:C‐treated astrocytes was not influenced by CPM treatment (Fig. 8A,B).
Figure 7.
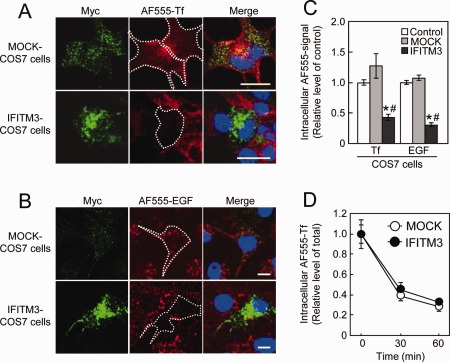
Endocytic activity in IFITM3‐transfected COS7 cells. MOCK‐ or IFITM3‐transfected COS7 cells were incubated with (A) AF555‐Tf (50 µg/mL) for 10 min or (B) AF555‐EGF (50 ng/mL) for 15 min. Scale bar: 20 µm. (C) Quantitative analysis of AF555‐labeled probes uptake in COS7 cells transfected with IFITM3. Values are the means ± SEM of two independent experiments (AF555‐Tf: n = 20–83, AF555‐EGF: n = 83–139). AF555‐Tf (F (2,121) = 13.65, P < 0.001) and AF555‐EGF (F (2,267) = 86.26, P < 0.0001). *P < 0.05 versus control COS7 cells, # P < 0.05 versus MOCK‐transfected COS7 cells. (D) Time‐course of AF555‐Tf recycling in COS7 cells transfected with IFITM3. Values are the means ± SEM of two independent experiments (n = 50–82).
Figure 8.
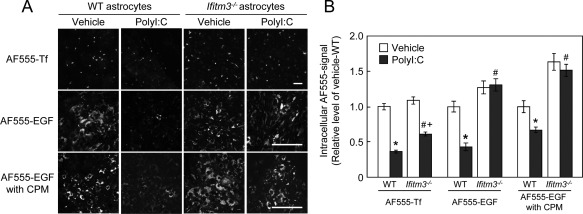
Effect of IFITM3 expression on endocytic activity in cultured astrocytes. (A) WT or ifitm3−/− astrocytes treated with polyI:C were incubated with AF555‐Tf for 10 min or AF555‐EGF for 15 min in the presence or absence of CPM. Cultured astrocytes were treated with CPM (Sigma‐Aldrich, 10 µg/mL) for 60 min and then incubated with AF555‐EGF. Scale bar: 100 µm. (B) Quantitative analysis of AF555‐Tf and AF555‐EGF uptake in wt and ifitm3−/− astrocytes treated with polyI:C. Values are the means ± SEM of 2–3 independent experiments (n = 40–120). AF555‐Tf: polyI:C (F (1,416) = 256.07, P < 0.0001), genotype (F (1,416) = 19.93, P < 0.0001), interaction (F (1,416) = 3.78, P = 0.053). AF555‐EGF: polyI:C (F (1,155) = 11.21, P < 0.01), genotype (F (1,155) = 52.72, P < 0.0001), interaction (F (1,155) = 14.8, P < 0.01). AF555‐EGF with CPM: polyI:C (F (1,205) = 6.85, P < 0.01), genotype (F (1,205) = 73.99, P < 0.0001), interaction (F (1,205) = 1.48, P = 0.23). *P < 0.05 versus vehicle‐treated wt control astrocytes, # P < 0.05 versus polyI:C‐treated wt astrocytes, + P < 0.05 versus vehicle‐treated ifitm3−/− astrocytes.
DISCUSSION
IFITM proteins belong to a protein domain superfamily consisting of over 30 proteins. They possess two transmembrane domains and an intervening highly conserved intracellular loop (pfam04505, CD225, interferon‐induced transmembrane protein) with both amino‐ and carboxy‐domains being luminal (Brass et al.,2009; Tanaka et al.,2005). A recent study, however, suggest that both amino‐ and carboxy‐domains of IFITM3 face the cytoplasm (Yount et al.,2012). IFITM1, 2, and 3 are expressed in a wide range of tissues, whereas IFITM5 expression appears to be limited to bone (Moffatt et al.,2008). Mouse IFITM3, which is expressed in primordial germ cells, had been implicated in germ cell development, but Lange et al. (2008) demonstrated that the deletion of Ifitm3 had no detectable effects on the development of germ line or on the generation, suggesting that Ifitm3 is not essential for germ cell development. Meanwhile, recent studies demonstrated that IFITM3 contributed to antiviral responses of the type I IFNs (Brass et al.,2009; Everitt et al.,2012; Schoggins et al.,2011).
Short and long dsRNAs are recognized selectively by RIG‐I and MDA‐5, respectively (Kato et al.,2008; Wilkins and Gale,2010). Further, polyI:C is known to activate RIG‐I and MDA5 signaling differently depending on its length (de Rivero Vaccari etal.,2012; Kato et al.,2008; Wilkins and Gale,2010). A recent report demonstrated that both DIG‐I and MDA5 levels were elevated in astrocytes exposed to long dsRNA (more than approximately 2 kbp), but not short dsRNAs (de Rivero Vaccari et al.,2012), which is consistent with the present study (Fig. 2A). These results suggest that the polyI:C used in the present study may behave like a long dsRNA under our experimental conditions.
In this study, we demonstrated that astroglial IFITM3 protein was localized to the early endosomes and disrupted clathrin‐dependent and ‐independent endocytic activity. To clarify the molecular mechanism by which IFITM3 regulates endosomal function, we examined the protein‐protein interactions of IFITM3 with reported partners, such as visfatin (Zhang et al.,2008), and ATP6V0B (Wee et al.,2012), as well as with other modulators of endocytic activity, such as kinesin (Soldati and Schliwa,2006), and the small GTPase RalA (Feig,2003), using an immunoprecipitation assay. The apparent interactions of these molecules, however, were not observed in brain extracts from polyI:C‐treated neonatal mice (Supp. Info. Fig. 5A–C) and in COS7 cells co‐transfected HA‐tagged human RalA (HA‐RalA) and myc‐IFITM3 (Supp. Info. Fig. 5D). Alternatively, as demonstrated by a recent study, S‐palmitoylation and ubiquitination of IFITM3 may play a role in the regulation of endosomal function in astrocytes (Yount et al.,2012, 2010).
We conducted the PCR‐array analysis to explore the changes in expression levels of cytokines 24 h after polyI:C treatment in cultured astrocytes. The results revealed that among genes whose expression ratio in polyI:C‐treated astrocytes was significantly altered by more than fourfold from the level in vehicle‐treated control astrocytes, fourteen genes were significantly increased and one gene was decreased in polyI:C‐treated astrocytes compared to those in vehicle‐treated astrocytes (Supp. Info. Fig. 6). Genes that showed an increased expression by polyI:C treatment include interleukin‐12β (IL‐12β), interleukin 1 family, member 6 (IL‐1f6), interleukin‐1α (IL‐1α), colony stimulating factor 2 (CSF2), interleukin‐1β (IL‐1β), interleukin‐27 (IL‐27), interleukin‐19 (IL‐19), tumor necrosis factor (ligand) superfamily, member 10 (Tnfsf10), interferon‐β1 (IFN‐β1), tumor necrosis factor (TNF), tumor necrosis factor (ligand) superfamily, member 11 (Tnfsf11), growth differentiation factor 5 (GDF5), tumor necrosis factor (ligand) superfamily, member 8 (Tnfsf8) and interleukin‐21 (IL‐21), whereas the decrease was observed in interleukin‐4 (IL‐4). Inflammatory cytokines induced by polyI:C treatment in astrocytes may be potential candidates of the humoral factors derived from polyI:C‐treated astrocytes; for instance, TNF‐α, IL‐1β and IFN‐β are known to inhibit neurite outgrowth (Gilmore et al.,2004; Neumann et al.,2002; Wellen et al.,2009), whereas IL‐4 is reported to have neurotrophic actions (Brodie etal.,1998); thus, thedecrease of IL‐4 expression by polyI:C may lead to the impaired maturation of cultured neurons. We confirmed the increases in protein levels of TNF‐α, IL‐1β and IFN‐β in polyI:C‐ACM, but there were no significant differences in the protein levels of these cytokines in polyI:C‐ACM between wt and ifitm3−/− astrocytes. It is unlikely, therefore, that these cytokines including TNF‐α, IL‐1β and IFN‐β play major roles in polyI:C‐induced IFITM3‐mediated impairment of neurite outgrowth and spine formation in vitro.
Alternatively, changes in neurotrophic factors, such as brain‐derived neurotrophic factor (BDNF), may participate in the effect of humoral factors derived from polyI:C‐treated astrocytes (Deverman and Patterson,2009; Farina et al.,2007; Kranjac et al.,2012). Glutamate is another possible candidate since it is reported that polyI:C treatment reduces the expression of glutamate‐aspartate transporter in astrocytes (Scumpia et al.,2005), which may result in the increase of extracellular glutamate levels, leading to the inhibition of neurite outgrowth and spine formation (Maezawa and Jin,2010).
Previous studies demonstrated that inhibitors of endocytosis affected the levels of extracellular humoral factors in vitro (De Filippi et al.,2007; Marina‐Garcia et al.,2009; Rozenova et al.,2010). Knockdown of caveolin‐1 in astrocytes also reduces endocytosis, resulting in the disruption of neuron‐glia interactions (Bento‐Abreu et al.,2009). Accordingly, it is suggested that the reduction of endocytic activity in astrocytes caused by IFITM3 overexpression after polyI:C treatment may affect the composition of the extracellular humoral factors of astrocytes, e.g., neurotrophic factors, cytokines, and gliotransmitters, leading to neurodevelopmental abnormalities via the disruption of neuron‐glia interactions (Fig. 9). Secretome analysis of polyI:C‐ACM is currently being performed in our laboratory to identify the humoral factors that may be responsible for the neuronal impairments.
Figure 9.
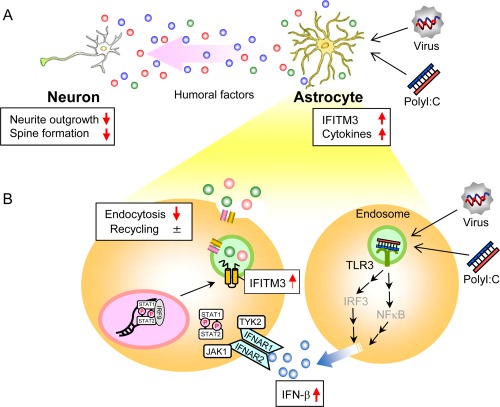
Proposed model for neurodevelopmental impairments after polyI:C treatment. (A) The impairment of neuron‐glia interactions via the abnormalities of humoral factors caused by polyI:C‐treated astrocytes. The expression levels of IFITM3 as well as various inflammatory cytokines are increased in polyI:C‐treated astrocytes. The abnormalities of humoral factors caused by polyI:C‐treated astrocytes impair neurite outgrowth and spine formation of neurons, in which IFITM3 plays an indispensable role. (B) PolyI:C induces IFN‐β expression in astrocytes; subsequently, the IFN‐β released by polyI:C‐treated astrocytes induces IFITM3 expression in an autocrine and/or paracrine manner. IFITM3 protein localizes to the early endosomes and reduces the endocytic activity of astrocytes, which may change the composition of the extracellular humoral factors, resulting in the neurodevelopmental abnormalities observed in polyI:C‐treated mice.
The present findings, together with previous reports (Brass et al.,2009; Everitt et al.,2012; Huang et al.,2011; Lu etal.,2011; Schoggins etal.,2011; Yount et al.,2010), suggest that IFITM3 is something of a double‐edged sword that could impair brain function and development in the immature brain, while it also mediates cellular resistance to many pathogenic viruses in peripheral organs. The induction of IFITM3 expression in astrocytes by the activation of the innate immune system during the early stages of development has noncell autonomous effects that affect subsequent neurodevelopment, leading to neuropathological impairments and brain dysfunction, by impairing endocytosis in astrocytes.
Supporting information
Supporting Information Figure 1. Effect of the direct addiction of polyI:C (10 μg/mL) into the culture medium of primary cultured neurons on neurite elongation and viability. (A) Representative images of tau‐positive neurites of primary cultured neurons treated with polyI:C. Scale bar: 100 μm. (B) Tau‐positive neurite length. Values are the means ± s.e.m. (n=57‐64). p=0.35. (C) Cell viability of primary cultured neurons incubated with polyI:C. Values are the means ± s.e.m. (n=12). p=0.38.
Supporting Information Figure 2. Sholl analysis of dendrite complexity of primary cultured neurons. (A) Effect of polyI:C‐ACM on dendritic complexity of cultured neuons. Values are the means ± s.e.m. (n=27−31). *p<0.05 vs. control‐ACM, #p<0.05 vs. 10% polyI:C‐ACM. (B) Effect of polyI:C‐ACM from ifitm3‐/‐ astrocytes transfected with IFITM3 on dendritic complexity of cultured neuons. Values are the means ± s.e.m. (n=22−28) of 2 independent experiments. *p<0.05 vs. polyI:C‐ACM from ifitm3‐/‐ astrocytes transfected with mock‐control.
Supporting Information Figure 3. Effect of ifitm3 knockdown on the polyI:C‐ACM‐induced neurodevelopmental abnormalities of primary cultured neurons from ICR mice. (A) Validation of the efficacy of ifitm3 siRNA in astrocytes. Astrocytes were pretreated for 48 h with ifitm3 siRNA, and then exposed to polyI:C (10 μg/mL) for 24 h. Values are the means ± s.e.m. (n=6) [polyI:C (F1,20=37.73, p<0.001), siRNA (F1,20=21.19, p<0.001), interaction (F1,20=0.08, p=0.78)]. *p<0.05 vs. vehicle‐treated astrocytes pretreated with SCr, #p<0.05 vs. polyI:C‐treated astrocytes pretreated with SCr. (B) Immunocytochemical images of primary hippocampal neurons cultured with control‐ or polyI:C‐ACM for 24 h from DIV2, for which astrocytes were pretreated with ifitm3 siRNA or SCr and then exposed to polyI:C, as described in (A). Neurons were stained with tau (green) and MAP2 (red) antibodies. (C) Total neurite length of each neuron. Values are the means ± s.e.m. of 3 independent experiments (n=81−87) [polyI:C‐ACM (F1,334=157.63, p<0.0001), siRNA (F1,334=6.18, p<0.05), interaction (F1,334=20.76, p<0.0001)]. *p<0.05 vs. SCr/control‐ACM, #p<0.05 vs. SCr/polyI:C‐ACM. (D) Immunocytochemical images of neurons cultured with control‐ or polyI:C‐ACM for 5 days from DIV2, for which astrocytes were pretreated with ifitm3 siRNA or SCr and then exposed to polyI:C, as described in (A). Neurons were stained with MAP2 (red) antibodies at 5 days after treatment with control‐ or polyI:C‐ACM on DIV7. Scale bar: 100 μm. (E) MAP2‐positive dendrite length. Values are the means ± s.e.m. of 3 independent experiments (n=61−64) [polyI:C‐ACM (F1,245=51.72, p<0.0001), siRNA (F1,245=16.026, p<0.0001), interaction (F1,245=6.66, p<0.05)]. *p<0.05 vs. SCr/contro‐ACM, #p<0.05 vs. SCr/polyI:C‐ACM.
Supporting Information Figure 4. Effect of eea1 knockdown on endocytic activity in cultured astrocytes. (A) Validation of the efficacy of eea1 siRNA in astrocytes. (B) Astrocytes were treated for 48 h with eea1 siRNA, and then incubated with AF555‐EGF for 15 min. Scale bar: 20 μm. (C) Quantitative analysis of AF555‐EGF uptake in astrocytes treated with siRNA for eea1. Values are the means ± s.e.m. (n=43−50). AF555‐EGF: F2,145=38.39, p<0.0001. *p<0.05 vs. astrocytes treated with control siRNA.
Supporting Information Figure 5. Assay of the protein‐protein interactions of IFITM3 with other proteins. Immunoprecipitation of (A) visfatin, (B) ATP6V0B, and (C) kinesin in neonatal mouse brain, and (D) the small GTPase RalA in COS7 cells co‐transfected with HA‐RalA and myc‐IFITM3.
Supporting Information Figure 6. Changes in cytokine mRNA levels of cultured astrocytes treated with polyI:C (PCR‐array analysis). The genes that showed increased expression following polyI:C treatment include IL‐12β, interleukin 1 family, member 6 (IL‐1f6), IL‐1a, colony stimulating factor 2 (CSF2), IL‐1β, IL‐27, IL‐19, tumor necrosis factor (ligand) superfamily, member 10 (Tnfsf10), IFN‐β1, TNF, Tnfsf11, growth differentiation factor 5 (GDF5), Tnfsf8, and IL‐21, whereas a decrease was observed for IL‐4. Values are the means ± s.e.m. of 3 independent experiments (n=3).
Acknowledgments
The authors thank Drs. N. Ogiso, Y. Ohya, and K. Yano, Division for Research of Laboratory Animals, Nagoya University for their technical assistance.
References
- Abe N, Inoue T, Galvez T, Klein L, Meyer T. Dissecting the role of PtdIns(4,5)P2 in endocytosis and recycling of the transferrin receptor. J Cell Sci 2008;121:1488–1494. [DOI] [PMC free article] [PubMed] [Google Scholar]
- Arion D, Unger T, Lewis DA, Levitt P, Mirnics K. Molecular evidence for increased expression of genes related to immune and chaperone function in the prefrontal cortex in schizophrenia. Biol Psychiatry 2007;62:711–721. [DOI] [PMC free article] [PubMed] [Google Scholar]
- Bento‐Abreu A, Velasco A, Polo‐Hernandez E, Lillo C, Kozyraki R, Tabernero A, Medina JM. Albumin endocytosis via megalin in astrocytes is caveola‐ and Dab‐1 dependent and is required for the synthesis of the neurotrophic factor oleic acid. J Neurochem 2009;111:49–60. [DOI] [PubMed] [Google Scholar]
- Brass AL, Huang IC, Benita Y, John SP, Krishnan MN, Feeley EM, Ryan BJ, Weyer JL, vander Weyden L , Fikrig E, Adams DJ, Xavier RJ, Farzan M, Elledge SJ. The IFITM proteins mediate cellular resistance to influenza A H1N1 virus, West Nile virus, and dengue virus. Cell 2009;139:1243–1254. [DOI] [PMC free article] [PubMed] [Google Scholar]
- Brodie C, Goldreich N, Haiman T, Kazimirsky G. Functional IL‐4 receptors on mouse astrocytes: IL‐4 inhibits astrocyte activation and induces NGF secretion. J Neuroimmunol 1998;81:20–30. [DOI] [PubMed] [Google Scholar]
- Chou SY, Weng JY, Lai HL, Liao F, Sun SH, Tu PH, Dickson DW, Chern Y. Expanded‐polyglutamine huntingtin protein suppresses the secretion and production of a chemokine (CCL5/RANTES) by astrocytes. J Neurosci 2008;28:3277–3290. [DOI] [PMC free article] [PubMed] [Google Scholar]
- De Filippi L, Fournier M, Cameroni E, Linder P, De Virgilio C, Foti M, Deloche O. Membrane stress is coupled to a rapid translational control of gene expression in chlorpromazine‐treated cells. Curr Genet 2007;52:171–185. [DOI] [PubMed] [Google Scholar]
- de Rivero Vaccari JP , Minkiewicz J, Wang X, De Rivero Vaccari JC, German R, Marcillo AE, Dietrich WD, Keane RW. Astrogliosis involves activation of retinoic acid‐inducible gene‐like signaling in the innate immune response after spinal cord injury. Glia 2012;60:414–421. [DOI] [PMC free article] [PubMed] [Google Scholar]
- Deverman BE, Patterson PH. Cytokines and CNS development. Neuron 2009;64:61–78. [DOI] [PubMed] [Google Scholar]
- DeWitte‐Orr SJ, Collins SE, Bauer CM, Bowdish DM, Mossman KL. An accessory to the 'Trinity': SR‐As are essential pathogen sensors of extracellular dsRNA, mediating entry and leading to subsequent type I IFN responses. PLoS Pathog 2010;6:e1000829. [DOI] [PMC free article] [PubMed] [Google Scholar]
- Everitt AR, Clare S, Pertel T, John SP, Wash RS, Smith SE, Chin CR, Feeley EM, Sims JS, Adams DJ, Wise HM, Kane L, Goulding D, Digard P, Anttila V, Baillie JK, Walsh TS, Hume DA, Palotie A, Xue Y, Colonna V, Tyler‐Smith C, Dunning J, Gordon SB, GenISIS I, MOSAIC I, Smyth RL, Openshaw PJ, Dougan G, Brass AL, Kellam P. IFITM3 restricts the morbidity and mortality associated with influenza. Nature 2012;484:519–523. [DOI] [PMC free article] [PubMed] [Google Scholar]
- Farina C, Aloisi F, Meinl E. Astrocytes are active players in cerebral innate immunity. Trends Immunol 2007;28:138–145. [DOI] [PubMed] [Google Scholar]
- Fath T, Ke YD, Gunning P, Gotz J, Ittner LM. Primary support cultures of hippocampal and substantia nigra neurons. Nat Protoc 2009;4:78–85. [DOI] [PubMed] [Google Scholar]
- Feig LA. Ral‐GTPases: Approaching their 15 minutes of fame. Trends Cell Biol 2003;13:419–425. [DOI] [PubMed] [Google Scholar]
- Fernandez AM, Fernandez S, Carrero P, Garcia‐Garcia M, Torres‐Aleman I. Calcineurin in reactive astrocytes plays a key role in the interplay between proinflammatory and anti‐inflammatory signals. J Neurosci 2007;27:8745–8756. [DOI] [PMC free article] [PubMed] [Google Scholar]
- Garbett K, Ebert PJ, Mitchell A, Lintas C, Manzi B, Mirnics K, Persico AM. Immune transcriptome alterations in the temporal cortex of subjects with autism. Neurobiol Dis 2008;30:303–311. [DOI] [PMC free article] [PubMed] [Google Scholar]
- Ge S, Goh EL, Sailor KA, Kitabatake Y, Ming GL, Song H. GABA regulates synaptic integration of newly generated neurons in the adult brain. Nature 2006;439:589–593. [DOI] [PMC free article] [PubMed] [Google Scholar]
- Gilmore JH, Fredrik Jarskog L, Vadlamudi S, Lauder JM. Prenatal infection and risk for schizophrenia: IL‐1beta, IL‐6, and TNFalpha inhibit cortical neuron dendrite development. Neuropsychopharmacology 2004;29:1221–1229. [DOI] [PubMed] [Google Scholar]
- Grant BD, Donaldson JG. Pathways and mechanisms of endocytic recycling. Nat Rev Mol Cell Biol 2009;10:597–608. [DOI] [PMC free article] [PubMed] [Google Scholar]
- Hagberg H, Gressens P, Mallard C. Inflammation during fetal and neonatal life: Implications for neurologic and neuropsychiatric disease in children and adults. Ann Neurol 2012;71:444–457. [DOI] [PubMed] [Google Scholar]
- Huang IC, Bailey CC, Weyer JL, Radoshitzky SR, Becker MM, Chiang JJ, Brass AL, Ahmed AA, Chi X, Dong L, Longobardi LE, Boltz D, Kuhn JH, Elledge SJ, Bavari S, Denison MR, Choe H, Farzan M. Distinct patterns of IFITM‐mediated restriction of filoviruses, SARS coronavirus, and influenza A virus. PLoS Pathog 2011;7:e1001258. [DOI] [PMC free article] [PubMed] [Google Scholar]
- Ibi D, Nagai T, Kitahara Y, Mizoguchi H, Koike H, Shiraki A, Takuma K, Kamei H, Noda Y, Nitta A, Nabeshima T, Yoneda Y, Yamada K. Neonatal polyI:C treatment in mice results in schizophrenia‐like behavioral and neurochemical abnormalities in adulthood. Neurosci Res 2009;64:297–305. [DOI] [PubMed] [Google Scholar]
- Inagaki N, Chihara K, Arimura N, Menager C, Kawano Y, Matsuo N, Nishimura T, Amano M, Kaibuchi K. CRMP‐2 induces axons in cultured hippocampal neurons. Nat Neurosci 2001;4:781–782. [DOI] [PubMed] [Google Scholar]
- Iwamoto K, Kakiuchi C, Bundo M, Ikeda K, Kato T. Molecular characterization of bipolar disorder by comparing gene expression profiles of postmortem brains of major mental disorders. Mol Psychiatry 2004;9:406–416. [DOI] [PubMed] [Google Scholar]
- Kato H, Takeuchi O, Mikamo‐Satoh E, Hirai R, Kawai T, Matsushita K, Hiiragi A, Dermody TS, Fujita T, Akira S. Length‐dependent recognition of double‐stranded ribonucleic acids by retinoic acid‐inducible gene‐I and melanoma differentiation‐associated gene 5. J Exp Med 2008;205:1601–1610. [DOI] [PMC free article] [PubMed] [Google Scholar]
- Kawai T, Akira S. The role of pattern‐recognition receptors in innate immunity: update on Toll‐like receptors. Nat Immunol 2010;11:373–384. [DOI] [PubMed] [Google Scholar]
- Kranjac D, McLinden KA, Koster KM, Kaldenbach DL, Chumley MJ, Boehm GW. Peripheral administration of poly I:C disrupts contextual fear memory consolidation and BDNF expression in mice. Behav Brain Res 2012;228:452–457. [DOI] [PubMed] [Google Scholar]
- Lange UC, Adams DJ, Lee C, Barton S, Schneider R, Bradley A, Surani MA. Normal germ line establishment in mice carrying a deletion of the Ifitm/Fragilis gene family cluster. Mol Cell Biol 2008;28:4688–4696. [DOI] [PMC free article] [PubMed] [Google Scholar]
- Law AJ, Weickert CS, Hyde TM, Kleinman JE, Harrison PJ. Reduced spinophilin but not microtubule‐associated protein 2 expression in the hippocampal formation in schizophrenia and mood disorders: molecular evidence for a pathology of dendritic spines. Am J Psychiatry 2004;161:1848–1855. [DOI] [PubMed] [Google Scholar]
- Leonard D, Hayakawa A, Lawe D, Lambright D, Bellve KD, Standley C, Lifshitz LM, Fogarty KE, Corvera S. Sorting of EGF and transferrin at the plasma membrane and by cargo‐specific signaling to EEA1‐enriched endosomes. J Cell Sci 2008;121:3445–3458. [DOI] [PMC free article] [PubMed] [Google Scholar]
- Lu J, Pan Q, Rong L, He W, Liu SL, Liang C. The IFITM proteins inhibit HIV‐1 infection. J Virol 2011;85:2126–2137. [DOI] [PMC free article] [PubMed] [Google Scholar]
- Maezawa I, Jin LW. Rett syndrome microglia damage dendrites and synapses by the elevated release of glutamate. J Neurosci 2010;30:5346–5356. [DOI] [PMC free article] [PubMed] [Google Scholar]
- Marina‐Garcia N, Franchi L, Kim YG, Hu Y, Smith DE, Boons GJ, Nunez G. Clathrin‐ and dynamin‐dependent endocytic pathway regulates muramyl dipeptide internalization and NOD2 activation. J Immunol 2009;182:4321–4327. [DOI] [PMC free article] [PubMed] [Google Scholar]
- Moffatt P, Gaumond MH, Salois P, Sellin K, Bessette MC, Godin E, de Oliveira PT, Atkins GJ, Nanci A, Thomas G. Bril: a novel bone‐specific modulator of mineralization. J Bone Miner Res 2008;23:1497–1508. [DOI] [PubMed] [Google Scholar]
- Mwaniki MK, Atieno M, Lawn JE, Newton CR. Long‐term neurodevelopmental outcomes after intrauterine and neonatal insults: A systematic review. Lancet 2012;379:445–452. [DOI] [PMC free article] [PubMed] [Google Scholar]
- Nagai T, Takuma K, Kamei H, Ito Y, Nakamichi N, Ibi D, Nakanishi Y, Murai M, Mizoguchi H, Nabeshima T, Yamada K. Dopamine D1 receptors regulate protein synthesis‐dependent long‐term recognition memory via extracellular signal‐regulated kinase 1/2 in the prefrontal cortex. Learn Mem 2007;14:117–125. [DOI] [PMC free article] [PubMed] [Google Scholar]
- Neumann H, Schweigreiter R, Yamashita T, Rosenkranz K, Wekerle H, Barde YA. Tumor necrosis factor inhibits neurite outgrowth and branching of hippocampal neurons by a rho‐dependent mechanism. J Neurosci 2002;22:854–862. [DOI] [PMC free article] [PubMed] [Google Scholar]
- Padron D, Tall RD, Roth MG. Phospholipase D2 is required for efficient endocytic recycling of transferrin receptors. Mol Biol Cell 2006;17:598–606. [DOI] [PMC free article] [PubMed] [Google Scholar]
- Penzes P, Cahill ME, Jones KA, VanLeeuwen JE, Woolfrey KM. Dendritic spine pathology in neuropsychiatric disorders. Nat Neurosci 2011;14:285–293. [DOI] [PMC free article] [PubMed] [Google Scholar]
- Ricciarelli R, d'Abramo C, Massone S, Marinari U, Pronzato M, Tabaton M. Microarray analysis in Alzheimer's disease and normal aging. IUBMB Life 2004;56:349–354. [DOI] [PubMed] [Google Scholar]
- Rozenova KA, Deevska GM, Karakashian AA, Nikolova‐Karakashian MN. Studies on the role of acid sphingomyelinase and ceramide in the regulation of tumor necrosis factor alpha (TNFalpha)‐converting enzyme activity and TNFalpha secretion in macrophages. J Biol Chem 2010;285:21103–21113. [DOI] [PMC free article] [PubMed] [Google Scholar]
- Schoggins JW, Wilson SJ, Panis M, Murphy MY, Jones CT, Bieniasz P, Rice CM. A diverse range of gene products are effectors of the type I interferon antiviral response. Nature 2011;472:481–485. [DOI] [PMC free article] [PubMed] [Google Scholar]
- Scumpia PO, Kelly KM, Reeves WH, Stevens BR. Double‐stranded RNA signals antiviral and inflammatory programs and dysfunctional glutamate transport in TLR3‐expressing astrocytes. Glia 2005;52:153–162. [DOI] [PubMed] [Google Scholar]
- Sigismund S, Argenzio E, Tosoni D, Cavallaro E, Polo S, Di Fiore PP. Clathrin‐mediated internalization is essential for sustained EGFR signaling but dispensable for degradation. Dev Cell 2008;15:209–219. [DOI] [PubMed] [Google Scholar]
- Soldati T, Schliwa M. Powering membrane traffic in endocytosis and recycling. Nat Rev Mol Cell Biol 2006;7:897–908. [DOI] [PubMed] [Google Scholar]
- Tanaka SS, Yamaguchi YL, Tsoi B, Lickert H, Tam PP. IFITM/Mil/fragilis family proteins IFITM1 and IFITM3 play distinct roles in mouse primordial germ cell homing and repulsion. Dev Cell 2005;9:745–756. [DOI] [PubMed] [Google Scholar]
- Uchida S, Hara K, Kobayashi A, Fujimoto M, Otsuki K, Yamagata H, Hobara T, Abe N, Higuchi F, Shibata T, Hasegawa S, Kida S, Nakai A, Watanabe Y. Impaired hippocampal spinogenesis and neurogenesis and altered affective behavior in mice lacking heat shock factor 1. Proc Natl Acad Sci USA 2011;108:1681–1686. [DOI] [PMC free article] [PubMed] [Google Scholar]
- Wee YS, Roundy KM, Weis JJ, Weis JH. Interferon‐inducible transmembrane proteins of the innate immune response act as membrane organizers by influencing clathrin and v‐ATPase localization and function. Innate Immun 2012;18:834–845. [DOI] [PubMed] [Google Scholar]
- Wellen J, Walter J, Jangouk P, Hartung HP, Dihne M. Neural precursor cells as a novel target for interferon‐beta. Neuropharmacology 2009;56:386–398. [DOI] [PubMed] [Google Scholar]
- Wilkins C, Gale M Jr. Recognition of viruses by cytoplasmic sensors. Curr Opin Immunol 2010;22:41–47. [DOI] [PMC free article] [PubMed] [Google Scholar]
- Yount JS, Karssemeijer RA, Hang HC. S‐palmitoylation and ubiquitination differentially regulate interferon‐induced transmembrane protein 3 (IFITM3)‐mediated resistance to influenza virus. J Biol Chem 2012;287:19631–19641. [DOI] [PMC free article] [PubMed] [Google Scholar]
- Yount JS, Moltedo B, Yang Y‐Y, Charron G, Moran TM, López CB, Hang HC. Palmitoylome profiling reveals S‐palmitoylation–dependent antiviral activity of IFITM3. Nat Chem Biol 2010;6:610–614. [DOI] [PMC free article] [PubMed] [Google Scholar]
- Zhang LQ, Adyshev DM, Singleton P, Li H, Cepeda J, Huang SY, Zou X, Verin AD, Tu J, Garcia JG, Ye SQ. Interactions between PBEF and oxidative stress proteins–A potential new mechanism underlying PBEF in the pathogenesis of acute lung injury. FEBS Lett 2008;582:1802–1808. [DOI] [PMC free article] [PubMed] [Google Scholar]
Associated Data
This section collects any data citations, data availability statements, or supplementary materials included in this article.
Supplementary Materials
Supporting Information Figure 1. Effect of the direct addiction of polyI:C (10 μg/mL) into the culture medium of primary cultured neurons on neurite elongation and viability. (A) Representative images of tau‐positive neurites of primary cultured neurons treated with polyI:C. Scale bar: 100 μm. (B) Tau‐positive neurite length. Values are the means ± s.e.m. (n=57‐64). p=0.35. (C) Cell viability of primary cultured neurons incubated with polyI:C. Values are the means ± s.e.m. (n=12). p=0.38.
Supporting Information Figure 2. Sholl analysis of dendrite complexity of primary cultured neurons. (A) Effect of polyI:C‐ACM on dendritic complexity of cultured neuons. Values are the means ± s.e.m. (n=27−31). *p<0.05 vs. control‐ACM, #p<0.05 vs. 10% polyI:C‐ACM. (B) Effect of polyI:C‐ACM from ifitm3‐/‐ astrocytes transfected with IFITM3 on dendritic complexity of cultured neuons. Values are the means ± s.e.m. (n=22−28) of 2 independent experiments. *p<0.05 vs. polyI:C‐ACM from ifitm3‐/‐ astrocytes transfected with mock‐control.
Supporting Information Figure 3. Effect of ifitm3 knockdown on the polyI:C‐ACM‐induced neurodevelopmental abnormalities of primary cultured neurons from ICR mice. (A) Validation of the efficacy of ifitm3 siRNA in astrocytes. Astrocytes were pretreated for 48 h with ifitm3 siRNA, and then exposed to polyI:C (10 μg/mL) for 24 h. Values are the means ± s.e.m. (n=6) [polyI:C (F1,20=37.73, p<0.001), siRNA (F1,20=21.19, p<0.001), interaction (F1,20=0.08, p=0.78)]. *p<0.05 vs. vehicle‐treated astrocytes pretreated with SCr, #p<0.05 vs. polyI:C‐treated astrocytes pretreated with SCr. (B) Immunocytochemical images of primary hippocampal neurons cultured with control‐ or polyI:C‐ACM for 24 h from DIV2, for which astrocytes were pretreated with ifitm3 siRNA or SCr and then exposed to polyI:C, as described in (A). Neurons were stained with tau (green) and MAP2 (red) antibodies. (C) Total neurite length of each neuron. Values are the means ± s.e.m. of 3 independent experiments (n=81−87) [polyI:C‐ACM (F1,334=157.63, p<0.0001), siRNA (F1,334=6.18, p<0.05), interaction (F1,334=20.76, p<0.0001)]. *p<0.05 vs. SCr/control‐ACM, #p<0.05 vs. SCr/polyI:C‐ACM. (D) Immunocytochemical images of neurons cultured with control‐ or polyI:C‐ACM for 5 days from DIV2, for which astrocytes were pretreated with ifitm3 siRNA or SCr and then exposed to polyI:C, as described in (A). Neurons were stained with MAP2 (red) antibodies at 5 days after treatment with control‐ or polyI:C‐ACM on DIV7. Scale bar: 100 μm. (E) MAP2‐positive dendrite length. Values are the means ± s.e.m. of 3 independent experiments (n=61−64) [polyI:C‐ACM (F1,245=51.72, p<0.0001), siRNA (F1,245=16.026, p<0.0001), interaction (F1,245=6.66, p<0.05)]. *p<0.05 vs. SCr/contro‐ACM, #p<0.05 vs. SCr/polyI:C‐ACM.
Supporting Information Figure 4. Effect of eea1 knockdown on endocytic activity in cultured astrocytes. (A) Validation of the efficacy of eea1 siRNA in astrocytes. (B) Astrocytes were treated for 48 h with eea1 siRNA, and then incubated with AF555‐EGF for 15 min. Scale bar: 20 μm. (C) Quantitative analysis of AF555‐EGF uptake in astrocytes treated with siRNA for eea1. Values are the means ± s.e.m. (n=43−50). AF555‐EGF: F2,145=38.39, p<0.0001. *p<0.05 vs. astrocytes treated with control siRNA.
Supporting Information Figure 5. Assay of the protein‐protein interactions of IFITM3 with other proteins. Immunoprecipitation of (A) visfatin, (B) ATP6V0B, and (C) kinesin in neonatal mouse brain, and (D) the small GTPase RalA in COS7 cells co‐transfected with HA‐RalA and myc‐IFITM3.
Supporting Information Figure 6. Changes in cytokine mRNA levels of cultured astrocytes treated with polyI:C (PCR‐array analysis). The genes that showed increased expression following polyI:C treatment include IL‐12β, interleukin 1 family, member 6 (IL‐1f6), IL‐1a, colony stimulating factor 2 (CSF2), IL‐1β, IL‐27, IL‐19, tumor necrosis factor (ligand) superfamily, member 10 (Tnfsf10), IFN‐β1, TNF, Tnfsf11, growth differentiation factor 5 (GDF5), Tnfsf8, and IL‐21, whereas a decrease was observed for IL‐4. Values are the means ± s.e.m. of 3 independent experiments (n=3).