

Abstract
Glia exhibit differential susceptibility to CD8 T cell mediated effector mechanisms during neurotropic coronavirus infection. In contrast to microglia, oligodendroglia are resistant to CD8 T cell perforin‐mediated viral control in the absence of IFNγ. Kinetic induction of MHC Class I expression by microglia and oligodendroglia in vivo was thus analyzed to assess responses to distinct inflammatory signals. Flow cytometry demonstrated delayed Class I surface expression by oligodendroglia compared with microglia. Distinct kinetics of Class I protein upregulation correlated with cell type specific transcription patterns of genes encoding Class I heavy chains and antigen processing components. Microglia isolated from naïve mice expressed high levels of these mRNAs, whereas they were near detection limits in oligodendroglia; nevertheless, Class I protein was undetectable on both cell types. Infection induced modest mRNA increases in microglia, but dramatic transcriptional upregulation in oligodendroglia coincident with IFNα or IFNγ mRNA increases in infected tissue. Ultimately mRNAs reached similar levels in both cell types at their respective time points of maximal Class I expression. Expression of Class I on microglia, but not oligodendroglia, in infected IFNγ deficient mice supported distinct IFN requirements for Class I presentation. These data suggest an innate immune preparedness of microglia to present antigen and engage CD8 T cells early following infection. The delayed, yet robust, IFNγ dependent capacity of oligodendroglia to express Class I suggests strict control of immune interactions to avoid CD8 T cell recognition and potential presentation of autoantigen to preserve myelin maintenance. © 2008 Wiley‐Liss, Inc.
Keywords: oligodendroglia, microglia, coronavirus, antigen presentation, MHC
INTRODUCTION
In the quiescent central nervous system (CNS), glia express little, if any, detectable major histocompatibility complex (MHC) molecules on their surface until exposed to inflammatory stimuli (Dorries, 2001; Hickey, 2001; Wong et al., 1984). MHC Class I antigen presentation is critical for CD8 T cell mediated control of viral infections, as secretion of anti‐viral cytokines and perforin‐mediated cytolysis require T cell receptor: MHC molecule interactions (Slifka et al., 1999). T cell effector functions are also associated with pathologies and neurological abnormalities (Dorries, 2001; Huseby et al., 2001; Ip et al., 2006). Consequently, T cell interactions with CNS glial cells require stringent regulation to balance the positive aspects of antiviral activity with the potential for detrimental immunopathological damage.
Class I surface expression is regulated at multiple levels including proteolysis, peptide transport, and chaperone‐aided complex assembly. The majority of peptides presented by Class I molecules are derived from proteasomal degradation of ubiquitin‐tagged proteins in the cytoplasm. Proteasomal specificities are conferred by three β subunits localized in the catalytic 20S core complex (Strehl et al., 2005). The constitutive proteolytic subunits involved in homeostatic protein turnover can be replaced by interferon (IFN) inducible proteosomal subunits Type 8, 9 and 10 (PSMB8, PSMB9, PSMB10; also known as LMP7, LMP2, and MECL‐10, respectively) to form the immunoproteasome. Immunoproteosomes release peptides with increased Class I binding affinities (Strehl et al., 2005). Peptides are selectively shuttled from the cytoplasm into the endoplasmic reticulum (ER) by the heterodimeric transporter associated with antigen processing (TAP), formed by the TAP1 and TAP2 subunits (Garbi et al., 2005). In the ER, chaperones aid in assembly of Class I heavy chains, peptides and β2‐microglobulin (β2M) to form a stable complex capable of trafficking to the cell surface (Garbi et al., 2005). The major antigen processing components, immunoproteosomes and TAP are encoded in the MHC Class I locus and are inducible by both IFNα/β and IFNγ (Jamaluddin et al., 2001; Paulsson, 2004).
Consistent with sparse Class I expression, the CNS expresses minimal antigen processing associated proteins compared with peripheral organs and lymphoid tissues (Fruh et al., 1992; Stohwasser et al., 1997). However, inflammatory stimuli rapidly induce Class I expression on microglia in vitro and in vivo, coincident with upregulation of antigen processing components (Bailey et al., 2006; Stohwasser et al., 2000). Similar to microglia, IFNγ stimulates Class I expression on oligodendroglia in vitro and in vivo (Popko and Baerwald, 1999; Sedgwick and Hickey, 1997). By contrast, oligodendroglia specific transgenic expression of Class I heavy chains leads to ER accumulation and severe myelination defects (Baerwald et al., 2000; Power et al., 1996; Turnley et al., 1991). This suggests basal levels of the antigen processing machinery in oligodendroglia are insufficient to deliver peptides for Class I assembly and egress from the ER. The regulation of Class I antigen processing components by oligodendroglia is not only of interest in elucidating their role as targets of anti‐microbial CD8 T cells, but also of self reactive CD8 T cells in autoimmune diseases, such as multiple sclerosis (Huseby et al., 2001; Sun et al., 2001). Stringently regulated Class I expression is also important in prolonging survival of oligodendroglia grafts for therapeutic remyelination approaches (Tepavcevic and Blakemore, 2006).
The present study investigated the regulation of Class I antigen presentation components in oligodendroglia and microglia in a model of neurotropic coronavirus induced encephalomyelitis (Bergmann et al., 2006). The sublethal JHM strain of mouse hepatitis virus (MHV‐JHM) infects astrocytes, microglia and oligodendroglia, spreading rapidly from the brain into the spinal cord (Wang et al., 1992) where it establishes a persistent infection (Marten et al., 2000). Acute viral replication in the CNS is controlled by CD8 T cells, consistent with Class I expression on all glia (Bergmann et al., 2003; Hamo et al., 2007; Ramakrishna et al., 2006; Redwine et al., 2001). Microglia and astrocytes, but not oligodendroglia are susceptible to perforin‐mediated CD8 T cell viral control in the absence of IFNγ. By contrast, IFNγ is required to control virus in oligodendroglia (Gonzalez et al., 2006; Lin et al., 1997; Parra et al., 1999). Whether IFNγ has a direct antiviral effect or enhances Class I antigen presentation by oligodendroglia is unclear. Delayed Class I upregulation on astrocytes compared with microglia in this viral model presents a precedence for differential regulation of Class I antigen presentation (Hamo et al., 2007).
Class I antigen presentation by oligodendroglia and microglia was compared using flow cytometry and gene expression analysis of cells isolated from the CNS of infected mice. Despite undetectable Class I protein naïve microglia expressed significantly higher basal levels of mRNAs encoding Class I antigen presentation components compared with oligodendroglia. Following infection, delayed Class I expression by oligodendroglia compared with microglia correlated with a requirement for IFNγ and de novo transcription of MHC genes required for antigen presentation. By contrast, microglia only moderately upregulated mRNAs encoding antigen presentation machinery, yet expressed MHC Class I protein earlier and independent of IFNγ. These results are the first to demonstrate more stringent regulation of the Class I antigen presentation pathway by oligodendroglia compared with microglia during CNS inflammation.
MATERIALS AND METHODS
Mice, Viruses and Cell Lines
C57BL/6 mice were purchased from the National Cancer Institute (Frederick, MD). Mice expressing green fluorescent protein (GFP) under control of the proteolipid protein (PLP) promoter (PLP‐GFP) (Fuss et al., 2000) were backcrossed six times with C57BL/6 mice prior to use. Mice deficient in IFNγ (IFNγ−/−) on the C57BL/6 background were previously described (Parra et al., 1999). All mice were housed and bred at accredited animal facilities at the Keck School of Medicine, University of Southern California, Los Angeles, CA, or the Cleveland Clinic, Cleveland, OH. Mice, 6–8 weeks of age, were injected intracranially (i.c.) with 30 μL of endotoxin‐free PBS containing 250 plaque forming units of the 2.2v‐1 monoclonal antibody (mAb)‐derived variant of MHV‐JHM (Fleming et al., 1986). All procedures were carried out in compliance with Institutional Animal Care and Use Committee approved protocols. The antigen presentation sufficient human B lymphoblastic cell line C1R‐Ld and the antigen processing deficient cell line T2‐Ld stably transfected with the murine H2‐Ld gene were kindly provided by Peter Creswell, Yale University Medical Center, New Haven, CT (Anderson et al., 1993). T2‐Ld cells have a deletion in the MHC locus comprising Tap1 and Tap2 resulting in intracellular accumulation of unassembled Class I in the ER (Grandea et al., 1995). The T2‐Ld and C1R‐Ld cells and the H‐2d J774A.1 macrophage cell line (American Type Culture Collection, Manassas, VA) were all maintained in Dulbeccos' modifed MEM containing 10% FCS.
Isolation of CNS‐Derived Mononuclear Cells and Flow Cytometry
For phenotypic analysis, brains and spinal cords (n = 3–4 per time point) were digested with a 0.25% trypsin solution and glia enriched by centrifugation at 800g for 30 min at 4°C on 30%/70% Percoll (Pharmacia, Uppsala, Sweden) gradients as previously described (Gonzalez et al., 2005; Hamo et al., 2007). CNS derived cells were stained with anti‐CD45‐APC or PerCP (clone 30‐F11, BD Biosciences, San Jose, CA) and PE conjugated anti‐MHC Class I (clone 28‐14‐8, eBioscience, San Diego, CA) as previously described (Gonzalez et al., 2005; Ramakrishna et al., 2006). Oligodendroglia from PLP‐GFP mice were defined as GFP+CD45− and microglia as CD45lo. Oligodendroglia from IFNγ−/− mice were identified by expression of the O4 surface marker (Fuss et al., 2000; Gonzalez et al., 2005) using biotinylated anti‐O4 mAb, followed by streptavidin‐APC (BD Biosciences) as described (Ramakrishna et al., 2006). Cells were fixed in 2% paraformaldehyde prior to analysis on a FACSCalibur flow cytometer (Becton Dickinson, Mountain View, CA) using Flowjo 7.1 software (Tree Star, Ashland, OR).
For PCR analysis glial cells were released by trypsin digestion of brains or spinal cords from PLP‐GFP mice (n = 6–8 per time point) as described earlier. Following Percoll gradient enrichment, nonspecific antibody binding was blocked with 5% FCS and anti‐FcIII/IIR (clone 2.G42, BD Biosciences) in RPMI supplemented with 25 mM HEPES (pH 7.2). Cells were stained with anti‐CD45 APC and suspended in RPMI 1%FCS at a concentration of 3–5 × 10⁶ cells/mL. GFP+CD45− oligodendroglia and CD45lo microglia were purified using a FACSVantage SE. A minimum of 20,000 cells was collected per sample for detection of rare transcripts.
Intracellular Staining
To detect intracellular Class I heavy chains, brain cells derived from uninfected PLP‐GFP mice or continuous cell lines were incubated with Golgi‐plug (1 μL/mL media; BD Biosciences) in DMEM 10% FCS for 6 h at 37°C. Nonspecific antibody adsorption was blocked by incubation with anti‐FcIII/IIR (2.G42) and 5% serum mixture consisting of equal parts; mouse, human, rat, and rabbit serum. Cells were then incubated with 10 μg anti‐Class I mAb (clone 28‐14‐8) for 30 min at 4°C to block subsequent surface Class I detection. Brain derived cells were stained with anti‐CD45 (APC) to identify microglia. Cells were fixed and permeabilized with Cytofix/Cytoperm reagents (BD Biosciences). Permeabilized cells were treated with anti‐FcIII/IIR and serum to prevent nonspecific antibody binding as described earlier, prior to incubation with anti‐MHC Class I‐PE (clone 28‐14‐8) or anti‐MHC Class I‐PE (H2‐Kk, clone 36‐7‐5) (BD Biosciences) as an isotype control. Cells were analyzed on a FACSCalibur flow cytometer as described above.
RNA Isolation and cDNA Preparation
FACS purified cells were collected by centrifugation (400g for 7 min, 4°C) and lysed by the addition of 0.5 mL Trizol (Invitrogen, Carlsbad, CA). RNA was precipitated in the presence of glycogen (Ambion, Foster City, CA) before resuspension in 4 μL of RNase‐free water. RNA was digested with DNase I (Roche Applied Science, Indianapolis, IN) for 20 min, followed by heat inactivation. RNA was reversed transcribed using AMV Reverse Transcriptase (Promega, Madison, WI) with 1 μg oligo‐dT primers (Promega) in a total volume of 20 μL. cDNA samples were diluted 10‐fold in Tris‐EDTA (pH 8.0). All reactions were carried out in the presence of RNasin (Promega). Spinal cords from individual mice were homogenized in 1 mL of Trizol (Invitrogen) using Tenbroeck tissue homogenizers. RNA integrity was verified by electrophoresis on 1.2% formaldehyde agarose gels. RNA (2 μg) from individual spinal cords was DNase I treated and reverse transcribed as described earlier.
Primer Design and Real‐Time PCR Analysis
Exon junction spanning real‐time PCR primers for the murine (H2b) Psmb5, Psmb8 (Lmp7), Psmb9 (Lmp2), Psmb10 (MECL‐10), Tap1, Tap2, Irf‐1, Irf‐2, Ifng and Gapdh genes were designed by PerlPrimer v1.1.9 (Marshall, 2004). H2‐D1/L and β2M primers were designed using Primer Express (ABI, Foster City, CA). Pan‐IFNα primers were designed using GeneRunner v3.05 (Hastings Software, Hastings‐on‐Hudson, NY) by aligning reference sequences for all IFNα genes. Sequences for all primers are listed in supplementary Table 1.
Quantitative real time PCR was carried out using 5 μL of cDNA and SYBER Green PCR (ABI) in duplicate on an MJ DNA Engine Opticon (Biorad, Hercules, CA). Specificity for each gene was confirmed by examining melting curves. Transcript levels are calculated relative to Gapdh using the formula 2ˆ(Ct Gapdh − Ct Target Gene) × 1000 and compared with peak expression levels for each cell type over the course of infection.
Statistical Analysis
Transcript levels were calculated for naïve glia or untreated J774.1 cells relative to Gapdh for three independent experiments. Significant differences between each group were determined by a two‐tailed distribution analysis of an unpaired Student's t‐test. P values less than 0.05 were considered statistically significant.
RESULTS
Oligodendroglia Exhibit Delayed Class I Expression Compared with Microglia
Spinal cords of uninfected and MHV‐JHM infected PLP‐GFP mice were analyzed by flow cytometry to compare temporal expression of Class I molecules by oligodendroglia and microglia. In naïve mice 25–30% of spinal cord derived cells comprised CD45− GFP+ mature oligodendroglia (Fig. 1A), compared with 5–8% of brain‐derived cells (data not shown). No MHC Class I expression was detected on naïve microglia or oligodendroglia (Fig. 1B). By Day 5 post infection (p.i.), greater than 90% of microglia expressed Class I (Fig. 1B). By stark contrast, only 29% of oligodendroglia expressed Class I. However, Class I expression on oligodendroglia increased rapidly thereafter reaching 96% by Day 7 p.i. The population of Class I expressing microglia and oligodendroglia declined by Day 10 and remained elevated throughout Day 14 p.i. The kinetics of Class I expression on oligodendroglia and microglia in the brain followed similar patterns (data not shown). These data implicated microglia as primary glial targets for CD8 T cells early during infection.
Figure 1.
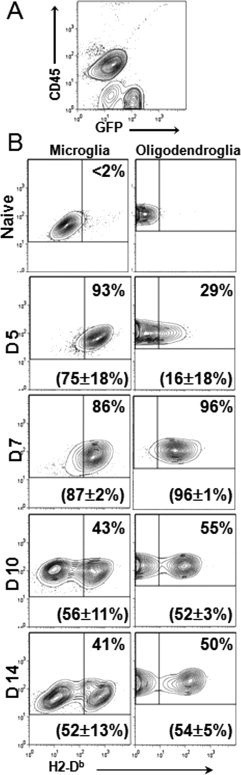
Delayed MHC Class I expression on oligodendroglia compared with microglia during infection. Glial cells from spinal cords of naive or infected PLP‐GFP mice analyzed for CD45 and MHC Class I expression by flow cytometry at the indicated days p.i. (A) Representative contour plot of naïve spinal cord derived cells distinguishing CD45lo microglia and CD45− GFP+ oligodendroglia (B) Kinetics of Class I expression on microglia (left panel) and oligodendroglia (right panel) shown in density plots. Numbers in the upper quadrant represent percentages of glia expressing Class I. Numbers in parentheses are mean percentages of Class I expressing cells with standard deviations derived from two to three separate experiments.
Naïve Glia Express Disparate Levels of mRNA Encoding Class I and Antigen Processing Components
Delayed Class I surface expression by oligodendroglia during viral encephalomyelitis could be due to an initial absence or low abundance of antigen processing components relative to microglia. To assess basal transcript levels of genes required for MHC Class I peptide presentation, oligodendroglia and microglia were FACS purified from spinal cords of naïve mice. Both glial populations expressed similar levels of Gapdh transcripts per cell when compared with J774A.1 macrophages (Fig. 2A). Furthermore, the ratio of Gapdh mRNA levels per number of purified cells was consistent throughout infection (data not shown). These data confirmed Gapdh as a stable reference gene, whose mRNA levels were not affected by alterations in the CNS environment due to inflammation. Although microglia from naïve mice did not express detectable Class I protein, Class I transcripts were expressed at levels similar to J774A.1 macrophages (Fig. 2B), which constitutively express surface Class I molecules. By contrast, oligodendroglia within the naïve CNS expressed 10 times lower levels of these transcripts compared with microglia or J774A.1 cells. Similarly, naïve microglia expressed comparable levels of Tap2 and Psmb8 encoding mRNA as J774A.1 cells, whereas these transcripts were barely detectable in naïve oligodendroglia. The relative levels of β2M, Tap1, and Psmb9 mRNAs were similar to Class I, Tap2, and Psmb8 mRNAs in each glial cell type, respectively (data not shown). Transcripts encoding the constitutive proteasomal subunit Psmb5, not encoded at the MHC locus, were analyzed to evaluate the overall proteasomal degradation capacities in the glial subsets. Basal levels of Psmb5 transcripts were present at similar levels in naïve microglia and oligodendroglia, but levels were reduced compared with J744A.1 cells (Fig. 2B).
Figure 2.
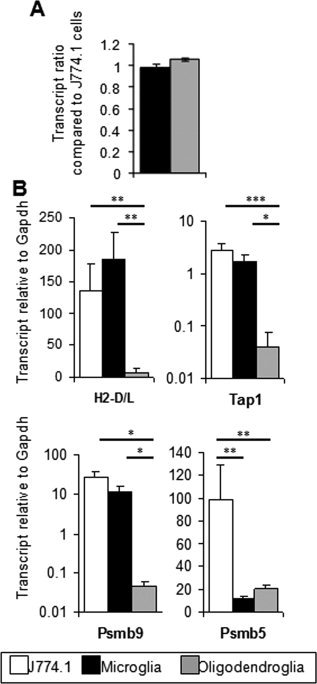
Disparate basal levels of Class I antigen presentation associated transcripts in microglia and oligodendroglia derived from naïve mice. Microglia and oligodendroglia were purified by FACS from spinal cords of naïve mice and mRNA analyzed by real time RT‐PCR. (A) Comparative analysis of transcript levels encoding the housekeeping gene Gapdh. Data are standardized to Gapdh mRNA levels obtained from J774 A.1 cells. (B) Transcript levels encoding Class I (H2‐D/L), antigen processing components (Tap2 and Psmb8) and the constitutive proteasomal subunit Psmb5 in microglia and oligodendroglia compared with J774A.1 cells relative to Gapdh. Values are the average of three independent experiments with the standard deviation. Asterisks denote P values; ***, **, and * indicate P < 0.001, P < 0.005, P < 0.05, respectively.
Naïve Microglia Do Not Express Intracellular Class I Protein
MHC Class I and antigen processing proteins are barely detectable in naïve brains by flow cytometry, Western blot (Fruh et al., 1992) or immunohistochemistry (Fuss et al., 2001). The relative abundance of these transcripts in microglia suggests post‐transcriptional repression of Class I antigen presentation. To confirm a block in translation rather than ER retention of Class I in naïve microglia, intracellular retention of H2‐Db was examined using a Db and Ld cross‐reactive mAb (see Fig. 3). Antigen processing deficient T2‐Ld cells were used as a control for intracellular accumulation of unassembled Class I in the ER and negligible surface staining. J774A.1 cells were used as a positive control for both surface and intracellular Class I expression. Surface staining confirmed undetectable expression of Class I on microglia, sparse expression on T2‐Ld cells and prominent expression on J774A.1 cells (see Fig. 3). Accumulation of intracellular Class I was analyzed following monensin treatment to block the secretory pathway. Detection of surface expression was blocked by pre‐incubation with unlabeled mAb to maintain similar conditions (see Fig. 3). Under these conditions, intracellular Class I remained undetectable in naïve microglia. By contrast T2‐Ld cells exhibited robust intracellular accumulation of Class I molecules. J774A.1 cells also accumulated intracellular Class I, albeit at lower levels compared with T2‐Ld cells. Similar results were obtained in two additional independent experiments in the absence of monensin treatment. These data suggest that the inability of naïve microglia to express Class I complexes (see Fig. 1), despite abundant transcripts encoding all the necessary components (see Fig. 2), is the result of translational repression rather than a post‐translational block.
Figure 3.
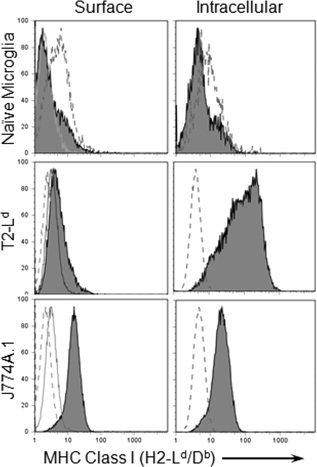
Absence of intracellular Class I expression by naïve microglia. Microglia were analyzed for intracellular accumulation of Class I molecules following monesin treatment for 6 h. Class I expressing J774 A.1 cells and antigen processing defective T2‐Ld cells were included as positive controls. Left column: Histograms depicting surface Class I (anti‐H2‐Ld/Db) expression (shaded lines) compared with isotype control staining (anti‐H2‐Kk) following monesin treatment. Anti‐H2‐Ld/Db antibody blocks Class I detection (solid gray line). Right column: Histograms depicting intracellular Class I (anti‐H2‐Ld/Db) expression (shaded lines) compared with isotype control (anti‐H2‐Kk, dashed line) in permeabilized cells. Unconjugated anti‐H2‐Ld/Db antibody was used to block cell surface detection prior to permeabilization (solid gray line).
Class I Surface Expression Correlates with Upregulation of mRNAs Encoding Class I Antigen Presentation Components
To assess a correlation between Class I surface expression and transcriptional upregulation of genes required for Class I assembly and transport, microglia and oligodendroglia were purified from spinal cords over the course of infection. Microglia exhibited a clear increase in mRNAs encoding Class I, β2M, Tap1 and inducible proteasomal subunits Psmb8 and Psmb9 at Day 5 p.i. (see Fig. 4). The respective mRNA levels dropped thereafter, but remained elevated through Day 10 p.i. Tap2 transcripts did not change more than twofold in microglia throughout infection. Although levels of mRNAs encoding Class I and the antigen processing components were only increased by 5‐ to 10‐fold at their peak relative to naïve microglia, peak mRNA accumulation at Day 5 p.i. coincided with maximal Class I surface expression (Fig. 1B). These data suggest rapid Class I expression by microglia is due to both a release from translational repression and transcriptional activation.
Figure 4.
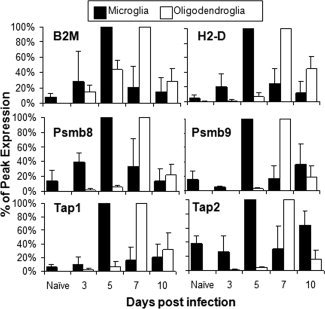
Cell‐type specific regulation of MHC Class I antigen processing genes. Microglia and oligodendroglia were purified by FACS from naïve or infected mice at different days p.i. and the levels of mRNA encoding MHC Class I (H2‐D), β2‐microglobulin (β2M), peptide transporter units (Tap1 and Tap2) and inducible proteasomal subunits (Psmb8 and Psmb9) were calculated relative to Gapdh. Peak transcript levels were set to 100% for each cell type in two independent timecourse studies. Bars represent the average percentage of peak expression for each cell type with standard deviation.
Oligodendroglia exhibited drastically different patterns of mRNA upregulation over the course of infection (see Fig. 4). The first transcriptional increase was observed for β2M mRNA. At Day 3 p.i., β2M mRNA levels were similar to those in naïve microglia. Although β2M mRNA did not peak until Day 7 p.i. in oligodendroglia, maximal levels relative to Gapdh mRNA were similar to those in microglia. Transcripts encoding Class I, Tap1/2 and Psmb8/9 in oligodendroglia were not notably increased until Day 5 p.i. and also peaked at Day 7 p.i. Similar to β2M mRNA, individual transcripts encoding Class I processing components reached comparable maximal levels in both cell types, with the exception of Tap2 mRNA. In two independent experiments peak expression of the respective mRNAs relative to Gapdh differed less than threefold between the two cell types. After Day 7 p.i., all mRNAs declined in oligodendroglia, but remained elevated relative to basal levels through Day 10p.i. (see Fig. 4). Relative to basal levels, virus‐triggered inflammation induced at least 200‐ to 1,000‐ fold overall increases in the mRNA populations in oligodendroglia compared with modest 5‐ to 10‐fold increases in microglia. The most potent increase was observed for Class I mRNA, reaching 1,300‐ and 5,000‐fold values relative to baseline levels in two separate experiments. This dramatic increase in RNA accumulation coincided with expression of Class I molecules on the surface of oligodendroglia (Fig. 1B) and suggests de novo transcriptional activation of genes encoding Class I presentation components. Although the kinetics and magnitude of mRNA induction were vastly different between oligodendroglia and microglia, overall levels of mRNAs encoding Class I and antigen processing components, with the exception of Tap2, were similar at their peak comparing the two cell types.
Cell‐Specific Induction of MHC Class I is Associated with Different IFNs
The strikingly different patterns of Class I antigen processing gene expression in microglia compared with oligodendroglia suggests distinct responsiveness to inflammatory events. Type I and II IFN were investigated as prime candidates promoting expression of MHC genes. IFNα transcripts were detectable at low levels in spinal cords of naïve mice, whereas IFNγ transcripts were undetectable (Fig. 5A). In the majority of infected mice, IFNα transcripts were up regulated approximately 100‐fold at Day 4 p.i. but these levels rapidly declined by Day 6 p.i. (Fig. 5A). IFNγ transcripts were largely undetectable at Days 4 and 5 p.i., but increased dramatically by Days 6 and 7 p.i. Induction of IFNα mRNAs preceded IFNγ mRNA by at least 2 days. By Day 10 p.i. IFNγ transcripts declined markedly and were no longer detectable in the majority of animals by Day 14 p.i.
Figure 5.
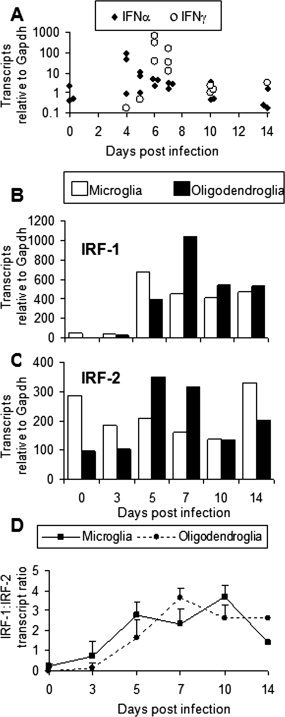
Kinetics of IFN mRNA responses following infection. (A) Spinal cord RNA from individual mice (n = 3) was analyzed for transcript levels of IFNα and IFNγ genes at the indicated time p.i. (B & C) Interferon regulatory factor 1 (IRF‐1) and interferon regulatory factor 2 (IRF‐2) transcript levels relative to Gapdh in purified microglia and oligodendroglia at the indicated time p.i. for one of two experiments. (D) Average and standard deviation of IRF‐1:IRF‐2 ratios in microglia and oligodendroglia from two independent experiments.
To further examine the responsiveness of microglia and oligodendroglia to IFN signaling, transcripts encoding IFN regulatory factor 1 (IRF‐1) and its antagonist, IFN regulatory factor 2 (IRF‐2) were measured in purified glia populations. IRF‐1 is associated with amplifying the effects of initial IFN signaling as well as promoting expression of its antagonist, IRF‐2 (Kroger et al., 2002). IRF‐1 mRNA was detectable in microglia from naïve mice, but near detection limits in oligodendroglia, whereas both naïve glia expressed relatively higher levels of IRF‐2 transcripts. (Figs. 5B,C). Following infection IRF‐1 transcripts increased to peak levels at Days 5 and 7 p.i. in microglia and oligodendroglia, respectively. Whereas the IRF‐1 mRNA increases were ∼10‐fold in microglia and greater than 1,000‐fold in oligodendroglia relative to basal levels, IRF‐2 levels in both cell types only changed two to threefold (Figs. 5B,C). As a result IRF‐1 mRNA increased three to fourfold over IRF‐2 levels in both cell types. Peak increases in IRF‐1 mRNA levels coincided with peak levels of transcripts encoding antigen processing components. These data suggest oligodendroglia preferentially amplify IFNγ mediated signals via the IRF‐1 pathway.
The parallel kinetics of Class I expression on oligodendroglia and induction of IFNγ during infection suggested a direct relationship. To assess if IFNγ is required for Class I expression by oligodendroglia, IFNγ−/− mice were infected with MHV‐JHM. In the absence of IFNγ oligodendroglia did not express Class I on their surface (see Fig. 6). By contrast, microglia were still capable of up regulating Class I as early as Day 5 p.i. (see Fig. 6). Although the percentage of microglia expressing Class I increased to 64% by Day 7 p.i., it declined more rapidly thereafter compared with IFNγ competent mice (see Fig. 1). Concordant results were obtained using IFNγ−/− mice on the BALB/c background, in which infection induced Class I Dd expression on 39%, 90% and 70% of spinal cord microglia at Days 4, 7 and 10 p.i., respectively, but not on oligodendroglia. These data demonstrate that oligodendroglia require IFNγ for Class I expression and support an IFNγ‐independent signal in regulating Class I antigen presentation by microglia (Bergmann et al., 2003).
Figure 6.
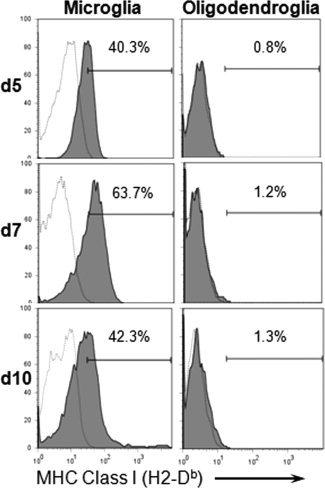
IFNγ dependent Class I expression on oligodendroglia. Glial cells derived from spinal cords of infected IFNγ−/− (H‐2b) mice (pooled from n = 3 per time point) were analyzed for Class I expression by flow cytometry at the indicated days p.i. Cells were gated on CD45lo microglia (left panel) and CD45−O4+ oligodendroglia (right panel). Histograms depict microglia and oligodendroglia expressing Class I (shaded lines); isotype control indicated by thin lines. Numbers represent percentage of glia expressing Class I. Data are from a single experiment.
DISCUSSION
The response of glia to infection, specifically their interaction with infiltrating T cells, determines how T cell effector functions contribute to microbial control and pathogenesis. The present data demonstrate more stringent regulation of Class I expression by oligodendroglia compared with microglia during viral induced inflammation. Rapid Class I expression by microglia suggests they are the initial infected cells that interact with early infiltrating virus specific CD8 T cells to trigger IFNγ secretion. This local IFNγ in turn induces Class I expression by oligodendroglia, which peaks coicident with maximal IFNγ transcript levels and prominent T cell infiltration into spinal cords (Marten et al., 2000). The timing of these interactions is thus critical in establishing a balance between viral spread and CD8 T cell mediated control, as cytolysis is downregulated during the transition to viral persistence (Bergmann et al., 2006) and IFNγ is crucial in controlling MHV‐JHM replication specifically in oligodendroglia (Bergmann et al., 2004; Gonzalez et al., 2006; Parra et al., 1999).
The cell type specific Class I expression patterns were associated with distinct levels of basal transcription of MHC genes, as well as differences in the timing and magnitude of transcriptional upregulation. The high basal levels of Class I transcripts in purified microglia, suggest they are a major source of Class I transcripts previously detected at low levels in the naïve adult brain (Fahrner et al., 1987). Class I expression is predominantly regulated at the transcriptional level with conserved promoter elements determining both tissue specific expression as well as responsiveness to cytokines and hormones (Howcroft and Singer, 2003). Coordinated transcriptional upregulation of MHC genes in both oligodendroglia and microglia is consistent with similarities in their core promoter elements (Arons et al., 2001; Brucet et al., 2004). The Tap1 and Psmb9 genes even share a bi‐directional promoter. IFNα/β and IFNγ directly activate Class I transcription via JAK/STATs or indirectly via IRF‐1 induction, which binds the IFN‐stimulated response element. IRF‐1 also binds the shared promoter of Tap1/Psmb9 to drive transcription (Brucet et al., 2004). The critical role of IRF‐1 in controlling the Class I presentation pathway is demonstrated by low levels of Class I expression in IRF‐1−/− mice (Hobart et al., 1997). Following MHV‐JHM infection, increased IRF‐1 to IRF‐2 mRNA ratios support IRF‐1 as a primary candidate in enhancing transcription of these genes. IFNα mRNA was associated with upregulation of IRF‐1 mRNA and Class I expression by microglia, whereas IFNγ mRNA expression correlated with accumulation of mRNAs encoding IRF‐1 and antigen presentation components in oligodendroglia. IFNγ dependent Class I expression by oligodendroglia, but not microglia, was confirmed by Class I expression patterns in infected IFNγ−/− mice.
The MHV‐JHM model suggests the more rapid Class I upregulation by microglia resides in an inherently increased responsiveness to IFNα/β signaling and earlier transcriptional activation compared with oligodendroglia. Delayed Class I expression by microglia in MHV‐JHM infected mice deficient in IFNα/β signaling, confirm IFNα/β as a primary inducer of early Class I presentation by microglia (Ireland et al., 2008). In addition, the modest increases in mRNAs encoding antigen presentation components in microglia support a partial contribution of translational regulation. Post‐transcriptional repression of MHC genes has been observed in a variety of cancers, yet the mechanisms are unclear (Luo et al., 1995; Ponzoni et al., 1993). Analysis of proteasomes from primary microglia cultures derived from neonatal mice revealed low, yet detectable protein levels of the immunoproteasome subunits PSMB9 and PSMB8 (Stohwasser et al., 2000), which were significantly increased following IFNγ treatment. Although IFNα/β stimulation was not analyzed in the latter studies, the data support constitutive transcription of Class I related genes in naïve microglia. Our data suggest that translational repression of MHC associated transcripts, potentially released by IFNα/β signaling, may constitute a provocative new mechanism regulating MHC Class I expression by microglia.
The modest overall increase of MHC encoded mRNAs in microglia relative to oligodendroglia may reflect cell type specific integration of both IFNα/β and IFNγ signals, or additional responses to other inflammatory mediators in the CNS environment. The fact that microglia strongly upregulate Class II expression in an IFNγ dependent manner (Bergmann et al., 2003), even in the absence of IFNα/β signals (Ireland et al., 2008), suggest that IFNγ responsiveness is not impaired by IFNα/β pre‐conditioning. The apparent lack of additional IFNγ mediated transcription of genes encoding Class I antigen presentation components may be due to saturation at the promoter sites in microglia.
Class I expression by oligodendroglia required IFNγ stimulated de novo transcription. The negligible levels of MHC Class I related transcripts in oligodendroglia derived from the naïve CNS are consistent with active repression of Class I gene transcription by oligodendroglia‐specific DNA binding factors (Mavria et al., 1998). Low mRNA levels and undetectable protein expression were also observed in unstimulated neonatal oligodendroglia cultures (Massa et al., 1993). Although IFNα/β does not appear to play a role in regulating Class I antigen presentation by oligodendroglia, other effects on oligodendroglia biology including induction of antiviral pathways have been demonstrated in the poliovirus model (Delhaye et al., 2006). The delayed, yet prominent increase in Class I related genes may result from synergistic stimulation by IFNγ and TNFα (Agresti et al., 1998). This strict regulation suggests deviation of cellular resources from myelin maintenance to host defense, a notion consistent with IFNγ mediated induction of ER stress in oligodendroglia and perturbation of remyelination (Lin et al., 2006).
Overall the stringent induction of MHC genes by oligodendroglia implies a tendency to avoid CD8 T cell cytolysis and preserve myelin maintenance and neuronal function. Nevertheless, as oligodendroglia are myelin factories, it is feasible to assume they present myelin derived epitopes during inflammation associated with IFNγ secretion. Indeed, MBP specific CD8 T cells can recognize and lyse oligodendroglia in the absence of exogenous peptide in vitro (Huseby et al., 2001). Similarly, CD8 T cell inflammation induced by overexpression of PLP by oligodendroglia is associated with Class I expression on oligodendroglia and CNS damage (Ip et al., 2006). Activation and clonal expansion of CD8 T cells in brain biopsy samples and CSF of multiple sclerosis patients supports a role of local CNS autoantigen presentation (Babbe et al., 2000; Jacobsen et al., 2002; Skulina et al., 2004). Furthermore, although Class I and IRF‐1 was prominently expressed by activated microglia/macrophages in multiple sclerosis lesions, both proteins were also localized to oligodendroglia (Gobin et al., 2001). However, in vivo interactions between CD8 T cells and Class I peptide complexes presented by oligodendroglia have not been formally proven. The potent transcriptional upregulation of Class I antigen presentation components by oligodendroglia presented in this report clearly demonstrates a potential for oligodendroglia to present myelin antigens. However, the exquisite sensitivity of microglia to early inflammatory cytokines implicates these cells as targets for initial CD8 T‐cell interactions.
Supporting information
This article contains supplementary material available via the Internet at http://www.interscience.wiley.com/jpages/0894-1491/suppmat .
Supporting Information file glia20625‐Table_1.doc
Acknowledgements
The authors thank Emanuel Dimacali and the USC Norris Cancer Center Flow Cytometry Core for assistance with flow cytometry. They also thank Maria Ramirez for maintenance of the PLP‐GFP mouse colony.
REFERENCES
- Agresti C,Bernardo A,Del Russo N,Marziali G,Battistini A,Aloisi F,Levi G,Coccia EM.1998.Synergistic stimulation of MHC class I, IRF‐1 gene expression by IFN‐γ and TNF‐α in oligodendrocytes.Eur J Neurosci 10:2975–2983. [DOI] [PubMed] [Google Scholar]
- Anderson KS,Alexander J,Wei M,Cresswell P.1993.Intracellular transport of class I MHC molecules in antigen processing mutant cell lines.J Immunol 151:3407–3419. [PubMed] [Google Scholar]
- Arons E,Kunin V,Schechter C,Ehrlich R.2001.Organization and functional analysis of the mouse transporter associated with antigen processing 2 promoter.J Immunol 166:3942–3951. [DOI] [PubMed] [Google Scholar]
- Babbe H,Roers A,Waisman A,Lassmann H,Goebels N,Hohlfeld R,Friese M,Schroder R,Deckert M,Schmidt S,David R,Rajewsky K.2000.Clonal expansions of CD8(+) T cells dominate the T cell infiltrate in active multiple sclerosis lesions as shown by micromanipulation and single cell polymerase chain reaction.J Exp Med 192:393–404. [DOI] [PMC free article] [PubMed] [Google Scholar]
- Baerwald KD,Corbin JG,Popko B.2000.Major histocompatibility complex heavy chain accumulation in the endoplasmic reticulum of oligodendrocytes results in myelin abnormalities.J Neurosci Res 59:160–169. [PubMed] [Google Scholar]
- Bailey SL,Carpentier PA,McMahon EJ,Begolka WS,Miller SD.2006.Innate and adaptive immune responses of the central nervous system.Crit Rev Immunol 26:149–188. [DOI] [PubMed] [Google Scholar]
- Bergmann CC,Lane TE,Stohlman SA.2006.Coronavirus infection of the central nervous system: Host‐virus stand‐off.Nat Rev Microbiol 4:121–132. [DOI] [PMC free article] [PubMed] [Google Scholar]
- Bergmann CC,Parra B,Hinton DR,Chandran R,Morrison M,Stohlman SA.2003.Perforin‐mediated effector function within the central nervous system requires IFN‐γ‐mediated MHC up‐regulation.J Immunol 170:3204–3213. [DOI] [PubMed] [Google Scholar]
- Bergmann CC,Parra B,Hinton DR,Ramakrishna C,Dowdell KC,Stohlman SA.2004.Perforin and γ interferon‐mediated control of coronavirus central nervous system infection by CD8 T cells in the absence of CD4 T cells.J Virol 78:1739–1750. [DOI] [PMC free article] [PubMed] [Google Scholar]
- Brucet M,Marques L,Sebastian C,Lloberas J,Celada A.2004.Regulation of murine Tap1 and Lmp2 genes in macrophages by interferon γ is mediated by STAT1 and IRF‐1.Genes Immun 5:26–35. [DOI] [PubMed] [Google Scholar]
- Delhaye S,Paul S,Blakqori G,Minet M,Weber F,Staeheli P,Michiels T.2006.Neurons produce type I interferon during viral encephalitis.Proc Natl Acad Sci USA 103:7835–7840. [DOI] [PMC free article] [PubMed] [Google Scholar]
- Dorries R.2001.The role of T‐cell‐mediated mechanisms in virus infections of the nervous system.Curr Top Microbiol Immunol 253:219–245. [DOI] [PubMed] [Google Scholar]
- Fahrner K,Hogan BL,Flavell RA.1987.Transcription of H‐2 and Qa genes in embryonic and adult mice.Embo J 6:1265–1271. [DOI] [PMC free article] [PubMed] [Google Scholar]
- Fleming JO,Trousdale MD,el‐Zaatari FA,Stohlman SA,Weiner LP.1986.Pathogenicity of antigenic variants of murine coronavirus JHM selected with monoclonal antibodies.J Virol 58:869–875. [DOI] [PMC free article] [PubMed] [Google Scholar]
- Fruh K,Yang Y,Arnold D,Chambers J,Wu L,Waters JB,Spies T,Peterson PA.1992.Alternative exon usage and processing of the major histocompatibility complex‐encoded proteasome subunits.J Biol Chem 267:22131–22140. [PubMed] [Google Scholar]
- Fuss B,Afshari FS,Colello RJ,Macklin WB.2001.Normal CNS myelination in transgenic mice overexpressing MHC class I H‐2L(d) in oligodendrocytes.Mol Cell Neurosci 18:221–234. [DOI] [PubMed] [Google Scholar]
- Fuss B,Mallon B,Phan T,Ohlemeyer C,Kirchhoff F,Nishiyama A,Macklin WB.2000.Purification and analysis of in vivo‐differentiated oligodendrocytes expressing the green fluorescent protein.Dev Biol 218:259–274. [DOI] [PubMed] [Google Scholar]
- Garbi N,Tanaka S,van den Broek M,Momburg F,Hammerling GJ.2005.Accessory molecules in the assembly of major histocompatibility complex class I/peptide complexes: How essential are they for CD8(+) T‐cell immune responses? Immunol Rev 207:77–88. [DOI] [PubMed] [Google Scholar]
- Gobin SJ,Montagne L,Van Zutphen M,Van Der Valk P,Van Den Elsen PJ,De Groot CJ.2001.Upregulation of transcription factors controlling MHC expression in multiple sclerosis lesions.Glia 36:68–77. [DOI] [PubMed] [Google Scholar]
- Gonzalez JM,Bergmann CC,Fuss B,Hinton DR,Kangas C,Macklin WB,Stohlman SA.2005.Expression of a dominant negative IFN‐γ receptor on mouse oligodendrocytes.Glia 51:22–34. [DOI] [PubMed] [Google Scholar]
- Gonzalez JM,Bergmann CC,Ramakrishna C,Hinton DR,Atkinson R,Hoskin J,Macklin WB,Stohlman SA.2006.Inhibition of interferon‐γ signaling in oligodendroglia delays coronavirus clearance without altering demyelination.Am J Pathol 168:796–804. [DOI] [PMC free article] [PubMed] [Google Scholar]
- Grandea AG III,Androlewicz MJ,Athwal RS,Geraghty DE,Spies T.1995.Dependence of peptide binding by MHC class I molecules on their interaction with TAP.Science 270:105–108. [DOI] [PubMed] [Google Scholar]
- Hamo L,Stohlman SA,Otto‐Duessel M,Bergmann CC.2007.Distinct regulation of MHC molecule expression on astrocytes and microglia during viral encephalomyelitis.Glia 55:1169–1177. [DOI] [PMC free article] [PubMed] [Google Scholar]
- Hickey WF.2001.Basic principles of immunological surveillance of the normal central nervous system.Glia 36:118–124. [DOI] [PubMed] [Google Scholar]
- Hobart M,Ramassar V,Goes N,Urmson J,Halloran PF.1997.IFN regulatory factor‐1 plays a central role in the regulation of the expression of class I, II MHC genes in vivo.J Immunol 158:4260–4269. [PubMed] [Google Scholar]
- Howcroft TK,Singer DS.2003.Expression of nonclassical MHC class Ib genes: Comparison of regulatory elements.Immunol Res 27:1–30. [DOI] [PubMed] [Google Scholar]
- Huseby ES,Liggitt D,Brabb T,Schnabel B,Ohlen C,Goverman J.2001.A pathogenic role for myelin‐specific CD8(+) T cells in a model for multiple sclerosis.J Exp Med 194:669–676. [DOI] [PMC free article] [PubMed] [Google Scholar]
- Ip CW,Kroner A,Bendszus M,Leder C,Kobsar I,Fischer S,Wiendl H,Nave KA,Martini R.2006.Immune cells contribute to myelin degeneration and axonopathic changes in mice overexpressing proteolipid protein in oligodendrocytes.J Neurosci 26:8206–8216. [DOI] [PMC free article] [PubMed] [Google Scholar]
- Ireland DD,Stohlman SA,Hinton DR,Atkinson R,Bergmann CC.2008.Type 1 interferons are essential in controlling neurotropic coronavirus infection irrespective of functional CD8 T cells.J Virol 82:300–310. [DOI] [PMC free article] [PubMed] [Google Scholar]
- Jacobsen M,Cepok S,Quak E,Happel M,Gaber R,Ziegler A,Schock S,Oertel WH,Sommer N,Hemmer B.2002.Oligoclonal expansion of memory CD8+ T cells in cerebrospinal fluid from multiple sclerosis patients.Brain 125(Part 3):538–550. [DOI] [PubMed] [Google Scholar]
- Jamaluddin M,Wang S,Garofalo RP,Elliott T,Casola A,Baron S,Brasier AR.2001.IFN‐β mediates coordinate expression of antigen‐processing genes in RSV‐infected pulmonary epithelial cells.Am J Physiol Lung Cell Mol Physiol 280:L248–L257. [DOI] [PubMed] [Google Scholar]
- Kroger A,Koster M,Schroeder K,Hauser H,Mueller PP.2002.Activities of IRF‐1.J Interferon Cytokine Res 22:5–14. [DOI] [PubMed] [Google Scholar]
- Lin MT,Stohlman SA,Hinton DR.1997.Mouse hepatitis virus is cleared from the central nervous systems of mice lacking perforin‐mediated cytolysis.J Virol 71:383–391. [DOI] [PMC free article] [PubMed] [Google Scholar]
- Lin W,Kemper A,Dupree JL,Harding HP,Ron D,Popko B.2006.Interferon‐γ inhibits central nervous system remyelination through a process modulated by endoplasmic reticulum stress.Brain 129(Part 5):1306–1318. [DOI] [PubMed] [Google Scholar]
- Luo H,Sopchak L,Lerman SP,King SR.1995.Selective loss of H‐2Ds antigen on a murine B lymphoma due to a post‐transcriptional block in expression.Mol Immunol 32:1011–1020. [DOI] [PubMed] [Google Scholar]
- Marshall OJ.2004.PerlPrimer: Cross‐platform, graphical primer design for standard, bisulphite and real‐time PCR.Bioinformatics 20:2471–2472. [DOI] [PubMed] [Google Scholar]
- Marten NW,Stohlman SA,Bergmann CC.2000.Role of viral persistence in retaining CD8(+) T cells within the central nervous system.J Virol 74:7903–7910. [DOI] [PMC free article] [PubMed] [Google Scholar]
- Massa PT,Ozato K,McFarlin DE.1993.Cell type‐specific regulation of major histocompatibility complex (MHC) class I gene expression in astrocytes, oligodendrocytes, and neurons.Glia 8:201–207. [DOI] [PubMed] [Google Scholar]
- Mavria G,Hall KT,Jones RA,Blair GE.1998.Transcriptional regulation of MHC class I gene expression in rat oligodendrocytes.Biochem J 330(Part 1):155–161. [DOI] [PMC free article] [PubMed] [Google Scholar]
- Parra B,Hinton DR,Marten NW,Bergmann CC,Lin MT,Yang CS,Stohlman SA.1999.IFN‐γ is required for viral clearance from central nervous system oligodendroglia.J Immunol 162:1641–1647. [PubMed] [Google Scholar]
- Paulsson KM.2004.Evolutionary and functional perspectives of the major histocompatibility complex class I antigen‐processing machinery.Cell Mol Life Sci 61:2446–2460. [DOI] [PMC free article] [PubMed] [Google Scholar]
- Ponzoni M,Guarnaccia F,Corrias MV,Cornaglia‐Ferraris P.1993.Uncoordinate induction and differential regulation of HLA class‐I and class‐II expression by γ‐interferon in differentiating human neuroblastoma cells.Int J Cancer 55:817–823. [DOI] [PubMed] [Google Scholar]
- Popko B,Baerwald KD.1999.Oligodendroglial response to the immune cytokine interferon γ.Neurochem Res 24:331–338. [DOI] [PubMed] [Google Scholar]
- Power C,Kong PA,Trapp BD.1996.Major histocompatibility complex class I expression in oligodendrocytes induces hypomyelination in transgenic mice.J Neurosci Res 44:165–173. [DOI] [PubMed] [Google Scholar]
- Ramakrishna C,Atkinson RA,Stohlman SA,Bergmann CC.2006.Vaccine‐induced memory CD8+ T cells cannot prevent central nervous system virus reactivation.J Immunol 176:3062–3069. [DOI] [PubMed] [Google Scholar]
- Redwine JM,Buchmeier MJ,Evans CF.2001.In vivo expression of major histocompatibility complex molecules on oligodendrocytes and neurons during viral infection.Am J Pathol 159:1219–1224. [DOI] [PMC free article] [PubMed] [Google Scholar]
- Sedgwick J,Hickey W.1997.Antigen presentation in the central nervous system. In: Keane RW,Hickey WF, eds.Immunology of the central nervous system.Oxford:Oxford University Press. pp 394–398. [Google Scholar]
- Skulina C,Schmidt S,Dornmair K,Babbe H,Roers A,Rajewsky K,Wekerle H,Hohlfeld R,Goebels N.2004.Multiple sclerosis: Brain‐infiltrating CD8+ T cells persist as clonal expansions in the cerebrospinal fluid and blood.Proc Natl Acad Sci USA 101:2428–2433. [DOI] [PMC free article] [PubMed] [Google Scholar]
- Slifka MK,Rodriguez F,Whitton JL.1999.Rapid on/off cycling of cytokine production by virus‐specific CD8+ T cells.Nature 401:76–79. [DOI] [PubMed] [Google Scholar]
- Stohwasser R,Giesebrecht J,Kraft R,Muller EC,Hausler KG,Kettenmann H,Hanisch UK,Kloetzel PM.2000.Biochemical analysis of proteasomes from mouse microglia: Induction of immunoproteasomes by interferon‐γ and lipopolysaccharide.Glia 29:355–365. [PubMed] [Google Scholar]
- Stohwasser R,Standera S,Peters I,Kloetzel PM,Groettrup M.1997.Molecular cloning of the mouse proteasome subunits MC14 and MECL‐1: Reciprocally regulated tissue expression of interferon‐γ‐modulated proteasome subunits.Eur J Immunol 27:1182–1187. [DOI] [PubMed] [Google Scholar]
- Strehl B,Seifert U,Kruger E,Heink S,Kuckelkorn U,Kloetzel PM.2005.Interferon‐γ, the functional plasticity of the ubiquitin‐proteasome system, and MHC class I antigen processing.Immunol Rev 207:19–30. [DOI] [PubMed] [Google Scholar]
- Sun D,Whitaker JN,Huang Z,Liu D,Coleclough C,Wekerle H,Raine CS.2001.Myelin antigen‐specific CD8+ T cells are encephalitogenic and produce severe disease in C57BL/6 mice.J Immunol 166:7579–7587. [DOI] [PubMed] [Google Scholar]
- Tepavcevic V,Blakemore WF.2006.Haplotype matching is not an essential requirement to achieve remyelination of demyelinating CNS lesions.Glia 54:880–890. [DOI] [PubMed] [Google Scholar]
- Turnley AM,Morahan G,Okano H,Bernard O,Mikoshiba K,Allison J,Bartlett PF,Miller JF.1991.Dysmyelination in transgenic mice resulting from expression of class I histocompatibility molecules in oligodendrocytes.Nature 353:566–569. [DOI] [PubMed] [Google Scholar]
- Wang FI,Hinton DR,Gilmore W,Trousdale MD,Fleming JO.1992.Sequential infection of glial cells by the murine hepatitis virus JHM strain (MHV‐4) leads to a characteristic distribution of demyelination.Lab Invest 66:744–754. [PubMed] [Google Scholar]
- Wong GHW,Bartlett PF,Clark‐Lewis I,Battye F,Schrader JW.1984.Inducible expression of H‐2 and Ia antigens on brain cells.Nature 310:688–6691. [DOI] [PubMed] [Google Scholar]
Associated Data
This section collects any data citations, data availability statements, or supplementary materials included in this article.
Supplementary Materials
This article contains supplementary material available via the Internet at http://www.interscience.wiley.com/jpages/0894-1491/suppmat .
Supporting Information file glia20625‐Table_1.doc