

Abstract
Infections caused by the Middle East respiratory syndrome coronavirus (MERS‐CoV) are a serious health issue due to their prevalence and associated mortality. However, the transmission routes of the virus remain unclear, and thus, the current recommended control strategies are not evidence based. In this study, we investigated the transmission routes of MERS‐CoV during the first nosocomial outbreak in the Republic of Korea in May 2015 using a multi‐agent modeling framework. We identified seven hypothesized transmission modes based on the three main transmission routes (long‐range airborne, close contact, and fomite). The infection risks for each hypothesis were estimated using the multi‐agent modeling framework. Least‐squares fitting was conducted to compare the distribution of the predicted infection risk in the various scenarios with that of the reported attack rates and to identify the hypotheses with the best fit. In the scenarios in which the index patient was a super‐spreader, our model simulations suggested that MERS‐CoV probably spread via the long‐range airborne route. However, it is possible that the index patient shed an average viral load comparable to the loads reported in the literature, and that transmission occurred via a combined long‐range airborne and close contact route.
Keywords: close contact, Fomite, long‐range airborne, Middle East respiratory syndrome coronavirus, multi‐agent modeling, multi‐route transmission
Practical Implications.
To the best of our knowledge, this study is the first mechanism‐based investigation of the transmission route of MERS‐CoV during the first hospital outbreak in the Republic of Korea. Our findings on the possible roles played by the long‐range airborne and close contact routes suggest the importance of ventilation systems and droplet precautions in healthcare environments. Our study also reveals the importance of obtaining more accurate data on dose–response parameters, the transport of bio‐aerosols in air and on surfaces, and virus survival in air and on surfaces.
1. INTRODUCTION
As a novel human coronavirus with alarming morbidity and mortality,1 the Middle East respiratory syndrome coronavirus (MERS‐CoV) has become a global threat since it was first identified in 2012. By September 2017, over 2000 cases of MERS‐CoV had been reported in 27 countries, leading to at least 722 deaths.2 Although the majority of those cases were distributed on or near the Arabian Peninsula,3 a single imported case in the Republic of Korea led to an unprecedentedly large MERS epidemic between May and July 2015,4 revealing the potential for the global spread of MERS.5
Similar to other coronaviruses, MERS‐CoV is thought to be shed mainly in the respiratory secretions of infected individuals and spread through respiratory activities such as coughing. However, the precise human‐to‐human transmission routes of the virus remain unclear.6 As shown in Figure 1, three major possible transmission routes are known to exist for communicable respiratory infections: the long‐range airborne route, the close contact route, and the fomite route.7, 8, 9 The current dominant view is that MERS‐CoV largely spreads via the respiratory close contact route,10, 11 which is supported by evidence that most of the affected healthcare workers (HCWs) have been nurses who have had prolonged and repeated close contact with MERS‐CoV patients.12 Nevertheless, the possible roles of airborne and fomite transmission cannot be excluded. Research suggests that MERS‐CoV may be spread through long‐range airborne transmission. For example, the viral RNA has been detected on the entrance to air‐ventilating equipment,13 and the virus has been detected in air samples from patients’ rooms, restrooms and common corridors.14 On the other hand, Seo et al13 and Kim et al14 detected MERS‐CoV RNA on objects in MERS patients’ rooms and in elevators, and experiments by van Doremalen et al15 suggest that MERS‐CoV is able to survive on surfaces long enough for further transmission, which increases the likelihood of fomite transmission. Thus, the recommendations of World Health Organization (WHO)10, 16 and Centers for Disease Control and Prevention (CDC)17 on standard precaution, droplet precaution, contact precaution, and airborne precaution remain vague. A better understanding of the exact transmission mode of MERS‐CoV could aid the development and selection of more appropriate and effective intervention methods.
Figure 1.
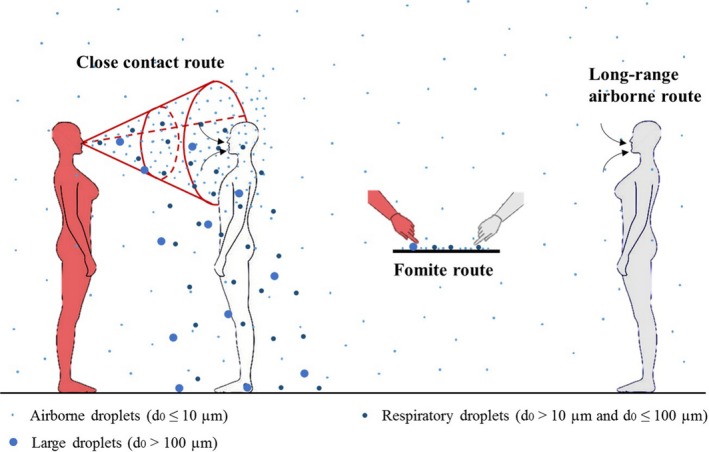
The three major transmission routes: close contact, fomite, and long‐range airborne routes. The person in red is the index patient
Healthcare settings have been investigated as breeding grounds for large MERS outbreaks because many cases of infection have not been recognized and isolated in time.3, 5, 18 Similarly, in the Republic of Korea, almost all cases are suspected to have been hospital acquired, originating from Pyeongtaek St. Mary's Hospital.19 The index patient for the outbreak in this hospital was a 68‐year‐old man who had recently travelled to the Middle East and was hospitalized from 15 to May 17, 2015 with no isolation or protection measures implemented.4 He was thought to have directly infected 26 people, including 11 other patients, 13 visitors or family members, and two HCWs.4 Compared to previous nosocomial outbreaks on or near the Arabian Peninsula, this outbreak was larger20 and the distribution of infection showed a clear spatial pattern, although the sample size was not sufficiently large for this pattern to be statistically significant.
To investigate the probable transmission routes of MERS‐CoV, we carried out a detailed modeling study of the outbreak in Pyeongtaek St. Mary's Hospital. We retrospectively analyzed the spatial pattern of infection and developed a multi‐agent model to simulate the possible spread of the virus from the index patient's ward by air flow, close contact, and surface touching. Table 1 lists the seven hypotheses examined in the study: three for single routes, three for two‐route combinations, and one for a three‐route combination. The dose‐response relationship model was used to calculate the possible infection risk for each hypothesis. A major challenge with this approach is the lack of appropriate input data, such as dose‐response parameters. Hence, a range of such parameters was considered with various value combinations of important parameters. Least‐squares fitting was carried out in 1140 scenarios to compare the distribution of the infection risk with that of the reported attack rates. The results presented below provide probable evidence for the transmission of MERS‐CoV in different scenarios. Our analyses allowed us to retrospectively acquire the largest virus‐containing droplet sizes, dose‐response parameters, and virus loads.
Table 1.
Hypotheses on the transmission modes of MERS‐CoV based on the three basic transmission routes in Figure 1. A transmission mode can be either a single route or combined routes
| Hypothesis | Description |
|---|---|
| 1 [Long air] | Long‐range airborne route |
| 2 [Close] | Close contact route |
| 3 [Fomite] | Fomite route |
| 4 [Long air + Close] | A combination of long‐range airborne and close contact routes |
| 5 [Long air + Fomite] | A combination of long‐range airborne and fomite routes |
| 6 [Close + Fomite] | A combination of close contact and fomite routes |
| 7 [Long air + Close +Fomite] | A combination of long‐range airborne, close contact and fomite routes |
This article is being made freely available through PubMed Central as part of the COVID-19 public health emergency response. It can be used for unrestricted research re-use and analysis in any form or by any means with acknowledgement of the original source, for the duration of the public health emergency.
2. METHODS
2.1. The outbreak
As revealed by Google Maps and verified by our field visits, Pyeongtaek St. Mary's Hospital is located in a rather open area and is much taller than all of the surrounding buildings, except one, as shown in Figure 2. The outbreak occurred on the eighth floor of the hospital, for which the floor plan is shown in Figure 3. The floor plan, excluding the elevators and storerooms, was used as the computational domain. The index patient stayed in the hospital from 15 to 17 May 2015, and thus, this period was taken as the suspected exposure period. The symptoms of the index patient included fever, cough, dyspnoea, and myalgia.21
Figure 2.
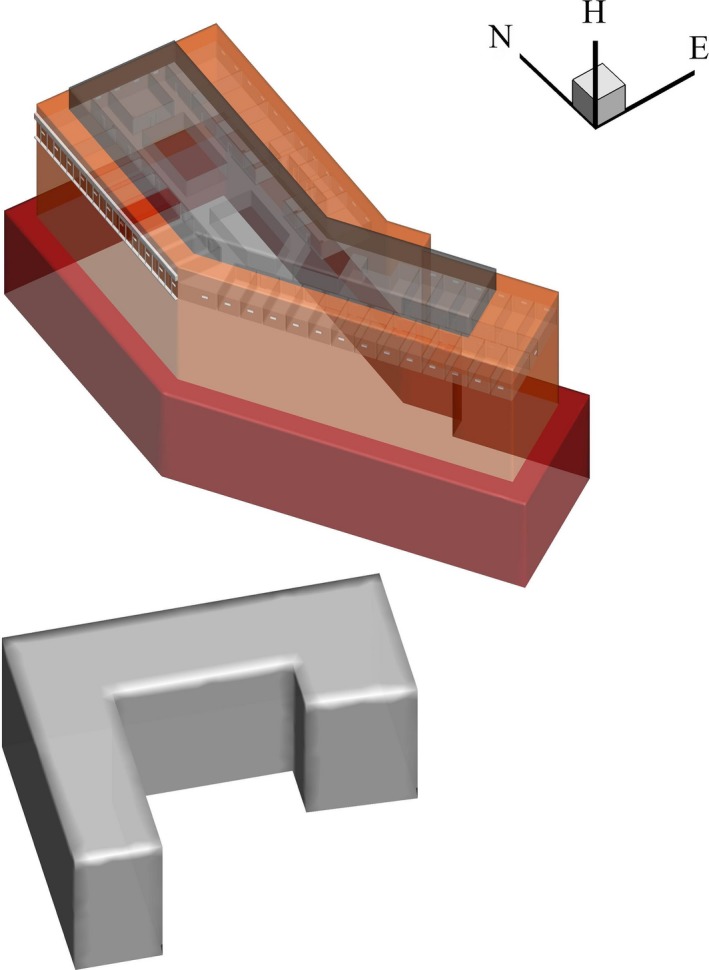
The layout of Pyeongtaek St. Mary's Hospital and a nearby building
Figure 3.
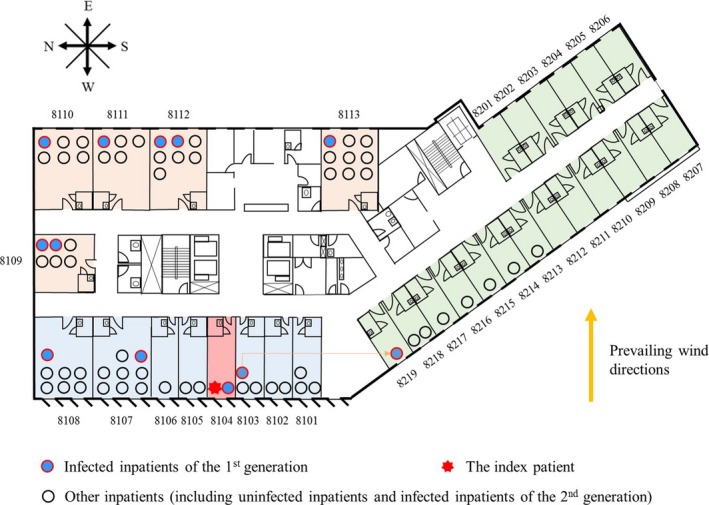
Plan of the eighth floor of Pyeongtaek St. Mary's Hospital. The infected patients of the first generation and other inpatients are marked with solid circles of different colors. The source ward in which the index patient stayed is marked in light red. Adjacent, downstream, and remote wards are colored light blue, light brown, and light green, respectively. Room numbers are marked in black. The prevailing wind direction (westerly) is marked with a yellow arrow
The eighth floor contained one nurses’ station and 32 wards, comprising 19 single rooms (Rooms 8201‐8219), six double rooms (Rooms 8101‐8106), and seven large rooms for five (Room 8109) or seven persons (Rooms 8107 and 8108, and Rooms 8110‐8113). According to the hospital staff, nurses and cleaners visited patients on the floor from Room 8101 in a clockwise direction to Room 8219. A mechanical ventilation system, which included a supply and an exhaust, was installed in all rooms except the index patient's room, Room 8104.22 The mechanical ventilation rate was assumed to be 10 L/s per person. Each room had a separate ceiling fan coil unit to provide cooling and heating, and each toilet had a separate exhaust system. The toilet exhaust air flow rate was assumed to be 6 ACH. There were two small windows (each 35 × 35 cm) in the single rooms and double rooms, four in the large rooms, and 10 in the corridor. The doors and windows in the regular rooms were usually closed. Because there was no ventilation system in the index patient's room, we assumed that the door and windows in this room were slightly (15%) open during the day and completely closed at night.
Figure 3 shows the total numbers of infected patients of the first generation and other inpatients on the eighth floor of Pyeongtaek St. Mary's Hospital. We studied the infection patterns of the inpatients because they stayed on the floor longer and more data are available. During the period in which the index patient was hospitalized, 11 MERS cases of 67 normal patients were reported in the first generation on the eighth floor.4 We assumed that all of the exposure doses received by the first generation of infected patients came from the index patient as a result of his respiratory activities, such as coughing.6 Wards on the floor were categorized by their position in four regions, namely the source ward (Room 8104), adjacent wards (Rooms 8101‐8103 and 8105‐8108), downstream wards (Rooms 8109‐8113), and remote wards (Rooms 8213‐8219). The average attack rate was 0.16. The rate was highest in the source ward (1.00), lower in the downstream and adjacent wards (0.21 and 0.12, respectively), and non‐existent in remote wards (0.00).
2.2. The multi‐agent modeling framework
Because we evaluated the seven hypotheses based on the differences between the attack rate and predicted infection risk in different regions, the spatial distribution characteristics of the different hypotheses were important factors in our study. However, the existing models, such as the discrete‐time Markov chain model8, 23 and the differential equation model,24, 25 are commonly used to estimate overall infection risk, and thus predict uniform distributions. Therefore, we developed a multi‐agent model,26 which enabled us to model the individual heterogeneities caused by the agents’ behavior and geographical environment.27, 28 Figure 4 shows the system architecture of our model. The system is modular based and consists of four basic components: the initialization generator, simulation engine, global database, and data processing module. Appendix S1: Fig. S1 shows the basic procedures included in the program for the model.
Figure 4.

System architecture of the multi‐agent modeling framework
The initialization generator has two branches, namely the geometric generator and agents generator. The geometric generator is used to build the virtual physical environment and produce surfaces. Based on the literature29, 30 and life experience, we identified 20 kinds of representative surface, which were (Appendix S2: Table S1) classified into five groups according to their materials, namely porous surfaces, non‐porous surfaces, toilet surfaces, skin, and mucous membranes, which differ in properties such as virus transfer rates (Appendix S2: Table S2) and virus inactivation rates (Appendix S2: Table S3). The agents generator was used to create representative individuals during the outbreak. Five representative “resident” roles were identified as study objects, that is, inpatients, visitors, family members, nurses, and cleaners. The numbers of agents are shown in Appendix S2: Table S8. Each autonomous agent directly corresponds to one human individual in the real world.
The simulation engine, which comprised behavior models of the representative roles, was used to simulate the behavior of the agents. In the behavior models, rules were set to regulate the time sequences for different types of behavior according to the geometry constraints and agent roles. For example, all the agents need to open the door to the room to enter the corridor, and family members take care of patients while the cleaners do cleaning work. Appendix S2: Tables S6 and S7 show the behavior frequencies and sequences of touching surfaces for the different types of behavior. The multi‐agent model retained the heterogeneity for each agent, so agents with the same role share the same rules but do not act synchronously. In addition, agents were endowed with an implicitly bounded intellect to make the simulations more realistic. For example, patients and family members used the public toilets in the corridor only when the toilets in the room were occupied, which influenced the effect of the public surfaces. During the computational period, as shown in Appendix S1: Fig. S1, in each time step for each agent, the agent first acquired information from the global database and then compared the acquired information with the behavior rules and made a command. According to the command, the agent remained static or performed an action. Finally, information about the agents was sent to the global database, which was updated. The global database recorded the agents’ state information and the contamination states of the surfaces and air in the temporary workspace.
The data processing module was used to process the data from the global database and calculate the infection risk for the three basic transmission routes. The module included six models, namely the multi‐zone model, the long‐range airborne route exposure model, the normal distribution model, the close contact route exposure model, the surface contamination model, and the dose‐response relationship model. Details of the abovementioned mathematical models are provided in Appendix S1.2‐S1.7.
For the long‐range airborne route, computational fluid dynamics (CFD) simulations31, 32, 33 were used to predict the wind pressures for all 48 windows. The multi‐zone model31, 34 MIX (multi‐zone infiltration and exfiltration)35 was applied to calculate the hourly airflow patterns and aerosol concentrations in the 36 zones on the outbreak floor. Furthermore, the long‐range airborne route exposure model25 was used to calculate the exposure doses D a in the respiratory tract of each agent.
For the close contact route, the normal distribution model36, 37 was used to acquire the movement patterns in the corridor and the contact probability of any pair of two agents was derived. Based on a respiratory jet assumption,8, 25, 38 the close contact route exposure model25 was used to calculate the exposure doses from three mechanisms: short‐range airborne transmission (D cs), inhalation of inspirable droplets (D ci), and deposition of large droplets on mucous membranes (D cm).
For the fomite route, the surface contamination model26 was used to calculate the numbers of viruses on the different environmental and human surfaces. The process by which the viruses spread within the surface network was considered to be a discrete‐time non‐homogeneous Markov chain. The transition matrix at a time point corresponded to a touching action and was determined by the properties of the two contacting surfaces in the touching action. Because the virus quantities on the mucous membranes of the susceptible agents transferred via hand contact were regarded as the exposure doses due to the fomite route,8 the surface contamination model was able to directly calculate the exposure doses D f for this route.
A dose‐response relationship model25, 26, 39 was used to compute the infection risk of each agent based on the acquired exposure doses. The parameters used in the models in the data processing module are listed in the tables in Appendix S2. Among these parameters, the largest virus‐containing droplet size (d g, μm), the dose‐response parameters in the respiratory tracts (ηr,/mRNA copy) and on mucous membranes (ηm,/mRNA copy) and the viral load (L 0, mRNA copies/mL) greatly influenced the infection risk.8, 25 Therefore, we fixed the values of the other parameters and mainly considered the influence of the transmission mode and the four parameters (ηr, ηm, d g, L 0) on the infection risk. The infection risk I was calculated as follows:
where c a equals 1 if the long‐range airborne route exists and 0 otherwise, and (c c, c f) are the indicators for close contact and the fomite route, respectively. The exposure doses D a, D cs, D ci, D cm, and, D f are functions of d g and L 0. Because the viral load L 0 was assumed to be the same for each virus‐laden droplet, the exposure doses were proportional to this variable. To reduce the number of variables, we combined ηr, ηm and L 0 as the products ηr L 0 and ηm L 0, which are defined as the dose effects of introducing 1 mL of virus‐laden droplets with a viral load of L 0 to the respiratory tract and mucous membranes, respectively.
2.3. Least‐squares fitting
Based on the above parametric model, we fitted the parameters (ca, cc, cf, ηr L 0, ηm L 0, dg) to the attack rates during the outbreak using a standard approach, namely least‐squares fitting.40 In this approach, the residual sum of squares (RSS) is calculated as a measure of fit, with a small RSS indicating a good fit of the model to the data. Therefore, we formulated the following minimum mean squares error problem:
where N is the number of simulations, n is the number of divided regions, λj is the number of inpatients in the jth region, I i,j is the predicted infection risk in the jth region generated by the ith simulation, and A j is the reported attack rate in the jth region during the outbreak. Because this problem involves the nonlinear function I i,j and integer constraints, it is generally NP hard. Therefore, we applied a greedy search to solve the problem.
In this study, a scenario was defined as a value combination of (ηr L 0, ηm L 0, d g). The ranges of the parameters were investigated, namely the largest virus‐containing droplet size d g (four values; 20, 100, 150 and 200 μm), the products of the viral load and the dose‐response parameters in the respiratory tracts ηr L 0 (21 values, 107‐1012/mL) and on the mucous membranes ηm L 0 (21 values, 104‐109/mL). Because ηr and ηm were assumed to be 10−1 ‐ 101 and 10−4 ‐ 10−2, respectively, the ratio of ηr to ηm was in the range of 101‐105, and thus, the ratio of ηr L 0 to ηm L 0 was also in the range of 101‐105. Excluding several unqualified scenarios, we considered 1140 scenarios and ran the simulations 1000 times for the seven hypotheses in each scenario.
3. SIMULATION RESULTS AND ANALYSES
3.1. Spatial characteristics of the predicted infection risk patterns
Because the agents’ behavior retained partial randomness in our multi‐agent model simulations, the results of the different simulation experiments varied. Therefore, we calculated the average values of the 1000 simulations. The spatial distributions of the average infection risks at the end of the computational period, 24:00 on May 17, 2015, are shown in Figure 5. The values of the four parameters were assumed to vary in a unified manner.
Figure 5.
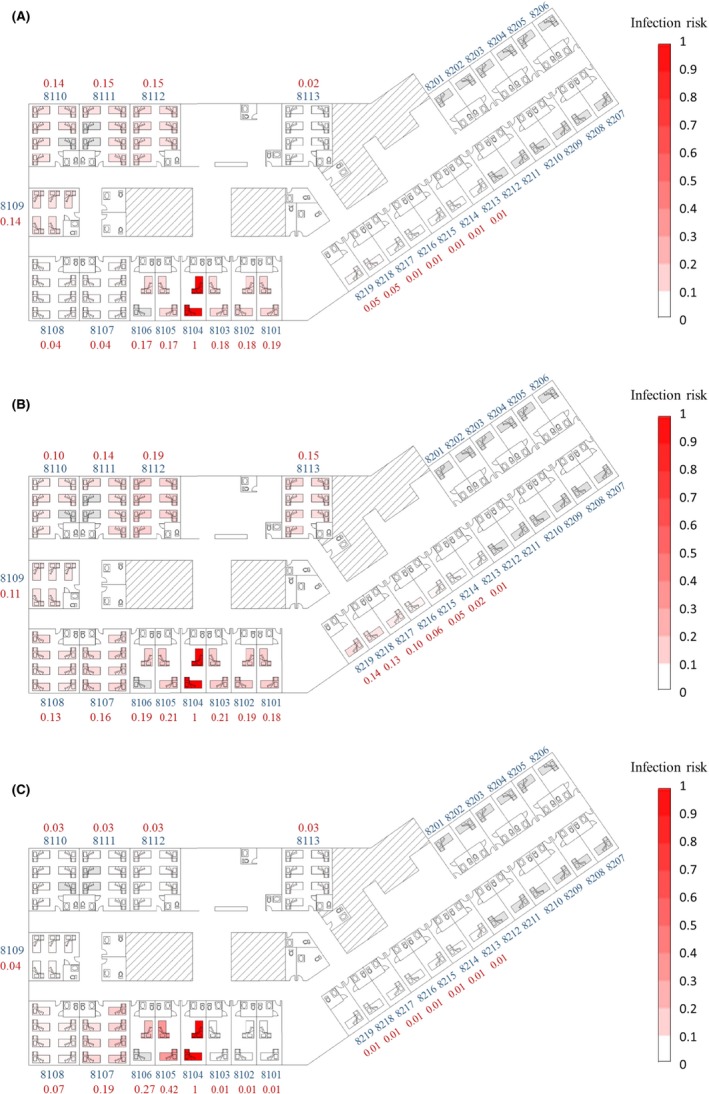
Spatial distribution of the predicted average infection risk (for 1000 simulations) via three transmission routes at 24:00 on May 17, the end of the computational period. A, Long‐range airborne route. B, Close contact route. C, Fomite route. The largest virus‐containing droplet size d g = 100 μm, dose‐response parameters in respiratory tracts ηr = 3.2/mRNA copy and on mucous membranes ηm = 3.2 × 10⁻³/mRNA copy, and the viral load L 0 = 1010 mRNA copies/mL. Room numbers and the average infection risk in the room are marked in blue and red, respectively. Empty beds are marked in gray and occupied beds are red. Different levels of infection risk are represented by the intensity of red shading
For the long‐range airborne route, the infection risk in the downstream wards was expected to be higher than that in the adjacent wards, as a result of the combined effects of the natural ventilation due to wind pressure, thermal buoyancy, and mechanical ventilation. When there was no wind, the wards and the corridor on the eighth floor were in a negative pressure state due to the exhaust fans in the toilets. For the predominant wind directions, namely north‐westerly, westerly, and south‐westerly (Appendix S3: Fig. S4), the wind pressure coefficients on the windows of adjacent wards were mostly positive, whereas those of downstream wards were negative (Appendix S3: Fig. S5), which contributed to larger negative pressures in the downstream wards and smaller negative pressures in the adjacent wards. Therefore, for wards of the same size, more aerosols spread to the downstream wards than to the adjacent wards. However, because the toilet exhaust fans were run at the same ventilation rates for all rooms, the negative pressures in the small rooms were higher than those in the large rooms, and thus, the infection risk in the small rooms in the adjacent wards was higher than that in the large rooms in the downstream wards (Figure 5A). The infection risk was lowest in the remote wards (Figure 5A). The remote wards had at least two zones, Zones 34 and 36, between them and the source ward (Appendix S1: Fig. S2), so the aerosol concentration was further diluted. Furthermore, during the day, the air flow could transport aerosols from Zone 34 to Zone 36 only when the wind was from the northwest (Appendix S3: Fig. S6), which meant that most of the time there were no virus sources for Rooms 8113 and 8201‐8219. Similarly, in the remote areas, the infection risk in Rooms 8213‐8217 was even lower than that in Rooms 8218 and 8219 (Figure 5A).
For the close contact route, with the assumed four parameters, the transmission was very effective compared to the other two routes. Thus, the infection risk for a susceptible person via this route was mainly determined by whether a person met with the index patient. Under the normal distribution assumption, people would be more likely to stay in nearby areas than in remote areas so the index patient and people nearby would share a similarly high chance of appearing in the neighborhood areas and have more opportunities for close contact, resulting in a sequentially decreasing risk of infection in the source, adjacent, downstream, and remote wards (Figure 5B).
For the fomite route, the infection risk was mainly induced by the nurses’ routine rounds and contaminated environmental surfaces. We assumed that the nurses conducted routine rounds five times a day at 07:00, 11:00, 15:00, 18:00, and 21:00 (Appendix S2: Table S6). Because nurses do not always clean their hands after coming into contact with patients41 and handwashing is not always very effective,42 their hands may have played an important role as a mobile medium in transferring viruses from the source to the skin of subsequent patients and the surrounding surfaces. In line with this, the number of viruses spread to patients decreased from Room 8104 (the index patient's room) clockwise to Room 8103, which is consistent with the direction of the nurses’ routine rounds (from Room 8101 clockwise to Room 8219). At other times, the surrounding surfaces acted as temporary sources in spreading viruses to patients, because more viruses naturally die on the skin than on environmental surfaces (Appendix S2: Table S3). In most cases, patients have the same opportunities to come in contact with common surfaces, and thus, these surfaces contribute to a uniform spatial distribution. However, in this outbreak, the environmental surfaces common to all patients were not a significant factor. The private toilets in the rooms were preferentially chosen by patients and family members (an average of 21 times/day for each room), while the common toilets in the corridor were used at a low frequency (an average of 5 times/day for each). Therefore, the overall distribution mostly complied with the direction of the routine round (Figure 5C).
3.2. Predicted infection risk distribution with the best fit
Table 2 shows the scenarios with the best fit (the minimum RSS) for the seven hypotheses. Among the three single‐route hypotheses, the prediction of Hypothesis 1 [Long air] fitted the attack rates best because only the prediction of the long‐range airborne route presented a higher infection risk in the downstream ward than in the adjacent ward (Figure 5A). The fomite route predicted a much higher infection risk in the adjacent ward than in the downstream ward (Figure 5C) so Hypothesis 3 [Fomite] had the worst fit.
Table 2.
Scenarios with the best fit (the minimum RSS) for Hypotheses 1 [Long air], 2 [Close], 3 [Fomite], 4 [Long air + Close], 5 [Long air + Fomite], 6 [Close + Fomite], and 7 [Long air + Close + Fomite]
| Parameter | Reported data | Hypothesis | ||||||
|---|---|---|---|---|---|---|---|---|
| 1 | 2 | 3 | 4 | 5 | 6 | 7 | ||
| Minimum RSS | N.A. | 0.070 | 0.492 | 1.087 | 0.436 | 0.072 | 0.492 | 0.462 |
| d g a (μm) | Unknown | 20 | 20 | 100 | 20 | 50 | 100 | 50 |
| ηr L 0 b (/mL) | Unknown | 1011.25 | 1010.50 | – | 1010.25 | 1010.75 | 108.50 | 109.75 |
| ηm L 0 b (/mL) | Unknown | – | 108.75 | 107.75 | 105.25 | 105.75 | 104.00 | 104.75 |
| Average infection risk | ||||||||
| Source ward | 1.00 | 1.00 | 0.98 | 1.00 | 1.00 | 1.00 | 0.99 | 1.00 |
| Adjacent wards | 0.12 | 0.16 | 0.17 | 0.18 | 0.17 | 0.16 | 0.17 | 0.18 |
| Downstream wards | 0.21 | 0.19 | 0.14 | 0.05 | 0.15 | 0.19 | 0.14 | 0.16 |
| Remote wards | 0.00 | 0.03 | 0.07 | 0.01 | 0.07 | 0.03 | 0.07 | 0.07 |
| Overall | 0.16 | 0.17 | 0.16 | 0.11 | 0.16 | 0.17 | 0.16 | 0.17 |
| Relative contribution | ||||||||
| Long‐range airborne route | Unknown | 100% | 0 | 0 | 17.9% | 99.8% | 0 | 17.2% |
| Close contact route (short‐range airborne) | Unknown | 0 | 0.6% | 0 | 0.5% | 0 | 1.2% | 1.4% |
| Close contact route (inhalation of inspirable droplets) | Unknown | 0 | 54.5% | 0 | 81.6% | 0 | 97.3% | 80.8% |
| Close contact route (large droplets deposition) | Unknown | 0 | 44.9% | 0 | 0 | 0 | 1.4% | 0.6% |
| Fomite route | Unknown | 0 | 0 | 100% | 0 | 0.2% | 0.1% | 0.0% |
d g denotes the largest virus‐containing droplet size.
ηr L 0 and ηm L 0 denote the products of viral load and dose‐response parameters in respiratory tracts and on mucous membranes, respectively.
This article is being made freely available through PubMed Central as part of the COVID-19 public health emergency response. It can be used for unrestricted research re-use and analysis in any form or by any means with acknowledgement of the original source, for the duration of the public health emergency.
Hypotheses 4‐7 involved at least two transmission routes, so they had better fit than Hypothesis 3 [Fomite] and worse fit than Hypothesis 1 [Long air]. For the combined‐route hypotheses, the values of (ηr L 0, ηm L 0, d g) in the scenarios with the best fit were mostly lower than those for the single‐route hypotheses. In these scenarios, the infection risk due to the close contact route was higher than those due to the long‐range airborne and fomite routes, so the close contact routes in Hypotheses 4 [Long air + Close], 6 [Close + Fomite], and 7 [Long air + Close + Fomite] played a predominant role in transmission by contributing at least 82% of the infection risk. Because the prediction of the fomite route deviated greatly from the attack rates, the contributions of this route for Hypotheses 5 [Long air + Fomite], 6 [Close + Fomite], and 7 [Long air + Close + Fomite] were <0.2%.
Figure 6 shows the hypotheses with the best fit (ie, the minimum RSS) in the 1140 scenarios. Five hypotheses had the best fit: Hypotheses 1 [Long air] (red dots), 2 [Close] (orange dots), 4 [Long air + Close] (green dots), 5 [Long air + Fomite] (cyan dots), and 7 [Long air + Close + Fomite] (purple dots). When the largest virus‐containing droplet size d g ranged from 20 to 200 μm, there were always some scenarios in which the fit of all seven hypotheses was not good (tiny dots). In these scenarios, the parameters were relatively small, so all seven hypotheses predicted very low infection risks, which deviated greatly from the reported attack rates. As d g increased, the predicted infection risks became higher and thus the numbers of these kinds of scenarios decreased.
Figure 6.
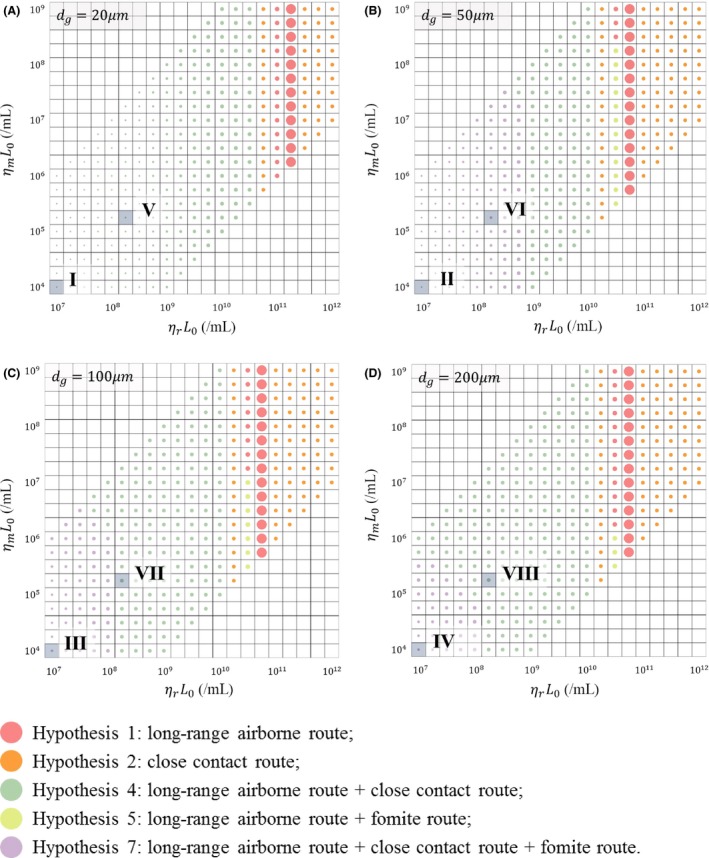
Illustration of the hypotheses with the best fit (the minimum RSS) in the 1140 scenarios, with different values for the largest virus‐containing droplet size d g (20, 50, 100, and 200 μm) and products of viral load and dose‐response parameters in respiratory tracts ηr L 0 (21 values, 107 to 1012/ml) and on mucous membranes ηm L 0 (21 values, 104 to 109/ml). A, d g = 20 μm; B, d g = 50 μm; C, d g = 100 μm; D, d g = 200 μm. The different colored dots represent different hypotheses as shown in the legend. The dot size is inversely proportional to the value of the RSS. The eight more‐likely scenarios in Table 3 are shown with Roman numerals
The scenarios with a d g of 20 μm are shown in Figure 6A. In these scenarios, our assumed d g was smaller than the largest initial diameter for the airborne droplets (30 μm), meaning that all of the virus‐laden bio‐aerosols were airborne droplets and could remain suspended in the air for a long time. Therefore, the viruses on the surfaces mainly originated from the deposition of airborne droplets, which caused negligible infection risk due to the fomite route. In the scenarios in which the products of the viral load and dose‐response parameters in respiratory tracts ηr L 0 were no more than 1010.50/ml, the infection risk caused by any single‐route mode was small, so the probable transmission mode was Hypothesis 4 [Long air + Close] (green dots). In scenarios with ηr L 0 ranging from 1011 to 1011.25/ml, the infection risk caused by any single route was quantitatively comparable with the attack rates, so the probable mode was Hypothesis 1 [Long air] (red dots), which is also qualitatively consistent with the reported attack rates. In the remaining scenarios, the infection risks caused by the combined routes were too large and those caused by the long‐range airborne route were either too large or too small, while those caused by the close contact route were relatively stable, so the probable transmission mode was Hypothesis 2 [Close] (orange dots).
The scenarios with d g values larger than 30 μm are shown in Figure 6B‐D. When the values of the products of viral load and dose‐response parameters in respiratory tracts ηr L 0 and on mucous membranes ηm L 0 were relatively small, the exposure doses due to any single‐route or double‐route mode were low, so only the combination of three routes (purple dots) caused an infection risk quantitatively comparable to the attack rates, although the fit was not good. As d g increased, the infection risks due to the single‐route and double‐route modes increased, and thus, the number of scenarios with the three‐route mode (purple dots) decreased.
4. DISCUSSION
In this study, to evaluate the transmission hypotheses, we estimated the spatial distribution of the infection risk under each hypothesis and then compared these results with the reported outbreak data. Therefore, a good estimation model was needed to reflect the underlying mechanisms of the hypotheses. Nevertheless, the models, such as the discrete‐time Markov chain model8, 23 and the differential equation model,24, 25, 43 were not applicable due to their system‐based feature, which removes the individual heterogeneity of infection risk.28 In fact, the human behavior in those models is merely described by behavioral frequency. However, in practice, human behavior is also dependent on behavioral rules and geometry constraints. For example, when a nurse visits patients during a routine round, although the frequency of interaction is the same for all patients, the amount of virus spread to patients varies with their location, which further influences the infection risk. There are similar issues with the environmental surfaces in the existing models. In particular, because multiple surfaces of the same material8, 23, 25 and even all of the surfaces in a zone24, 43 are regarded as a whole, the viral concentrations on different surfaces are the same, which contributes to a uniform infection risk distribution.
To address the above problems, we used a multi‐agent model26 to analyze the multi‐route transmission. Different from the existing system‐based models, the agent‐based model is able to characterize the diversity of individuals. More specifically, the behavior of individuals is simulated according to behavioral rules and geometry constraints, which take the sequence of human actions into account. Furthermore, the multiple surfaces in our system were identified as different units in contrast to the homogeneous systems in previous works. As shown in Figure 5, our results reflect the individual heterogeneity in the spatial distribution of infection risk, which could not be obtained from other models.
Although the ranges of (ηr L 0, ηm L 0, d g) for the outbreak were uncertain, several more‐likely scenarios were identified based on the literature. So far, no investigations have detected positive viral RNA (RT‐PCR) or cell culture of MERS‐CoV from human saliva, in which droplets larger than 20 μm originate,44 and Lee et al45 suggested that samples from saliva would result in false negatives. However, camel saliva has been found to spread MERS‐CoV to humans,11 and its classification into disorder group C and predicted hard outer shell suggest that MERS‐CoV is likely to be transmitted by saliva.46 Therefore, we investigated the largest virus‐containing droplet size d g in the range from 20 to 200 μm. The range for the viral load was very large, from 102 to 1011 mRNA copies/mL in the respiratory tract, with the average value of viral load during the first week after diagnosis being 5 × 10⁷ mRNA copies/mL in fatal cases and 3.9 × 10⁶ mRNA copies/mL in survivors.47 According to a study by Gryphon Scientific48 based on datasets from animal models of MHV and SARS‐CoV, we estimated the dose‐response parameter of MERS‐CoV on mucous membranes as 3.2 × 10⁻³/mRNA copy. Due to the absence of data, the dose‐response parameter in the respiratory tract was set as 103‐fold higher than that on the mucous membranes, similar to the influenza A virus.24 The eight more‐likely scenarios (Scenarios I‐VIII) based on the above analyses are summarized in Table 3 and are shown in Figure 6 with Roman numerals.
Table 3.
Hypotheses with the best fit (the minimum RSS) in the eight more‐likely scenarios. The eight scenarios are indicated in Figure 6 with Roman numerals. The dose‐response parameter in the respiratory tract ηr is 3.2/mRNA copy, and that on the mucous membranes ηm is 3.2 × 10⁻³/mRNA copy
| Parameter | Reported data | More‐likely scenarios | |||||||
|---|---|---|---|---|---|---|---|---|---|
| I | II | III | IV | V | VI | VII | VIII | ||
| d g a (μm) | Unknown | 20 | 50 | 100 | 200 | 20 | 50 | 100 | 200 |
| L 0 b (mRNA copies/mL) | Unknown | 3.9 × 10⁶ | 5 × 10⁷ | ||||||
| Hypothesis with the minimum RSS | N.A. | 4 | 7 | 7 | 7 | 4 | 7 | 4 | 4 |
| Minimum RSS | N.A. | 2.786 | 2.475 | 1.225 | 1.091 | 2.196 | 0.921 | 0.490 | 0.490 |
| Average infection risk | |||||||||
| Source ward | 1.00 | 0.01 | 0.08 | 0.46 | 0.52 | 0.18 | 0.63 | 0.97 | 0.98 |
| Adjacent wards | 0.12 | 0.00 | 0.01 | 0.08 | 0.08 | 0.02 | 0.09 | 0.16 | 0.16 |
| Downstream wards | 0.21 | 0.00 | 0.01 | 0.07 | 0.07 | 0.02 | 0.08 | 0.14 | 0.14 |
| Remote wards | 0.00 | 0.00 | 0.00 | 0.03 | 0.03 | 0.01 | 0.04 | 0.07 | 0.07 |
| Overall | 0.16 | 0.00 | 0.01 | 0.07 | 0.08 | 0.02 | 0.09 | 0.15 | 0.15 |
| Relative contribution | |||||||||
| Long‐range airborne route | Unknown | 5.7% | 2.0% | 0.3% | 0.3% | 6.3% | 4.2% | 2.4% | 2.3% |
| Close contact route (short‐range airborne) | Unknown | 0.0% | 0.0% | 0.0% | 0.0% | 0.1% | 0.1% | 0.1% | 0.1% |
| Close contact route (inhalation of inspirable droplets) | Unknown | 94.3% | 96.1% | 96.4% | 74.5% | 93.6% | 91.7% | 80.5% | 55.9% |
| Close contact route (large droplets deposition) | Unknown | 0 | 1.8% | 3.2% | 23.9% | 0 | 3.9% | 17.0% | 41.7% |
| Fomite route | Unknown | 0 | 0.1% | 0.1% | 1.3% | 0 | 0.1% | 0 | 0 |
d g denotes the largest virus‐containing droplet size.
L 0 denotes the viral load.
This article is being made freely available through PubMed Central as part of the COVID-19 public health emergency response. It can be used for unrestricted research re-use and analysis in any form or by any means with acknowledgement of the original source, for the duration of the public health emergency.
With a viral load L 0 of 3.9 × 10⁶ mRNA copies/mL (Scenarios I, II, III and IV), none of the hypotheses had good fit (Figure 6 and Table 3), which is not consistent with the index patient surviving this outbreak. However, similar to other large MERS transmission clusters,49, 50 the outbreak in Pyongtaek St. Mary's Hospital may have been caused by a super spreader who had a higher viral load than most MERS patients.51 Considering that there was no ventilation system in the index patient's ward, the MERS‐CoV may have accumulated in the ward, effectively making it a source for a super‐spreading event.52 According to Figure 6, with a viral load L 0 of 5 × 10⁷ mRNA copies/mL (Scenarios V, VI, VII, and VIII), the scenarios with the largest virus‐containing droplet sizes d g of 20 or 50 μm also did not have good fit, so d g was less likely to be in the range of 20‐50 μm, and MERS‐CoV may have existed in saliva as SARS‐CoV does.53 Hence, among Scenarios I‐VIII, only Scenarios VII and VIII had acceptable fit, and the probable hypothesis in these two scenarios is Hypothesis 4 [Long air + Close]. According to Table 3, the contribution made by the long‐range airborne route to the infection risk was low, and that made by the close contact route was predominant, especially by the mechanism of inhalation of inspirable droplets.
If the index patient was a super spreader, the viral loads might be even higher than the average value in fatal cases (5 × 10⁷ mRNA copies/mL). When the two dose‐response parameters were fixed (ηr = 3.2/mRNA copy; ηm = 3.2 × 10⁻³/mRNA copy) and the viral load increased from 106 to 1011 mRNA copies/mL, the overall best fit was achieved with a high viral load (the largest dots: L 0 = 5.6 × 10¹⁰ mRNA copies/mL in Figure 6A; L 0 = 1.8 × 10¹⁰ mRNA copies/mL in Figure 6B‐D), and the corresponding probable hypothesis is Hypothesis 1 [Long air] (Figure 6), because among the three basic routes, only the prediction made by the long‐range airborne route was consistent with the qualitative characteristics of the outbreak data.
This study has some limitations. First, our understanding of the multiple phenomena that govern disease transmission is not complete. For example, in our model and other models,16, 17 it is assumed that transmission is mono‐directional from the hands to the mucous membranes in the eyes, noses, and mouths of susceptible individuals. However, there are limited data on what happens to the particles that have been transferred to the mucous membranes, such as their residence time. Second, due to our limited knowledge of MERS‐CoV, some parameters in the model were not available from the literature, such as the transfer rates between hands and surfaces (Appendix S2: Table S2) and first‐order inactivation rates (Appendix S2: Table S3). These parameters were estimated or surrogated with data on other coronaviruses, influenza viruses, bacteriophages, or even bacteria, which could introduce errors into the results. Third, there is a lack of detailed information on individual behavior during the outbreak, especially that of the index patient. Individual differences in the behavioral modes of the nurses when visiting patients were also not considered in this study. These data are crucial for building multi‐agent models and influence the exposure doses via the three transmission routes. For example, if the index patient walked in the corridor, the duration of that behavior would have influenced the virus source strength of the long‐range airborne and fomite routes, and the frequency of the behavior would have influenced the close contact route. Fourth, our conclusions on the relative importance of the transmission routes may not always be applicable to other MERS outbreaks. For example, the contribution of the long‐range airborne route during this outbreak was magnified because the ventilation system was not installed in the index patient's room. Although the role of the long‐range airborne route may vary during different MERS outbreaks, this study supports the hypothesis of the long‐range airborne transmission of MERS‐CoV with both known data and reasonable assumptions, and highlights the importance of ventilation systems in healthcare environments. Overall, further research on the transmission mechanisms of MERS outbreaks involving laboratory measurements, observations in hospitals, and MERS outbreak analyses is needed to improve our understanding of MERS transmission.
5. CONCLUSIONS
In this study of the first nosocomial MERS outbreak in the Republic of Korea, the scenarios with a super‐spreader or a super‐spreading event corresponded with unusually high viral loads or sources. Our modeling suggested that long‐range airborne transmission of MERS‐CoV was the most credible hypothesis in explaining the observed data. Our long‐range airborne route model predicted the spatial infection pattern well, that is, the downstream wards had a higher infection risk than the adjacent wards. However, in the scenarios in which the index patient shed a more “typical” amount of MERS‐CoV, as parameterized according to available viral load data from the literature, our model showed that the hypothesis combining the close contact and long‐range airborne routes better explained the observed pattern of infection on the eighth floor of Pyongtaek St. Mary's Hospital, with the contribution of the former predominant and that of the latter relatively small. Our multi‐agent multi‐route transmission model and associated approaches can be applied to studies of the transmission in outbreaks of other viruses. However, our study also reveals crucial input data, such as dose‐response parameters and virus inactivation rates on surfaces, need to be obtained.
Supporting information
ACKNOWLEDGEMENTS
This project is supported by two RGC GRF grants (No. 17205014 and No. 17211615) of the Hong Kong SAR Government.
Xiao S, Li Y, Sung M, Wei J, Yang Z. A study of the probable transmission routes of MERS‐CoV during the first hospital outbreak in the Republic of Korea. Indoor Air. 2018;28:51–63. 10.1111/ina.12430
REFERENCES
- 1. de Groot RJ, Baker SC, Baric RS, et al. Middle East respiratory syndrome coronavirus (MERS‐CoV): announcement of the Coronavirus Study Group. J Virol. 2013;87:7790‐7792. [DOI] [PMC free article] [PubMed] [Google Scholar]
- 2. World Health Organization . Middle East respiratory syndrome coronavirus (MERS‐CoV). [WHO website]. September 18, 2017. http://www.who.int/emergencies/mers-cov/en/. Accessed September 18, 2017.
- 3. Oboho IK, Tomczyk SM, Al‐Asmari AM, et al. 2014 MERS‐CoV outbreak in Jeddah: a link to health care facilities. N Engl J Med. 2015;372:846‐854. [DOI] [PMC free article] [PubMed] [Google Scholar]
- 4. Kim KM, Ki M, Cho S, et al. Epidemiologic features of the first MERS outbreak in Korea: focus on Pyeongtaek St. Mary's Hospital. Epidemiol Health. 2015;37:e2015041. [DOI] [PMC free article] [PubMed] [Google Scholar]
- 5. World Health Organization . WHO statement on the tenth meeting of the IHR Emergency Committee regarding MERS. [WHO website]. September 3, 2015. http://www.who.int/mediacentre/news/statements/2015/ihr-emergency-committee-mers/en/. Accessed June 3, 2016.
- 6. Centers for Disease Control and Prevention . Information about Middle East respiratory syndrome (MERS). [CDC website]. December, 2015. http://www.cdc.gov/coronavirus/mers/downloads/factsheet-mers_en.pdf. Accessed June 3, 2016.
- 7. Brankston G, Gitterman L, Hirji Z, et al. Transmission of influenza A in human beings. Lancet Infect Dis. 2007;7:257‐265. [DOI] [PubMed] [Google Scholar]
- 8. Nicas M, Jones RM. Relative contributions of four exposure pathways to influenza infection risk. Risk Anal. 2009;29:1292‐1303. [DOI] [PubMed] [Google Scholar]
- 9. Otter JA, Donskey C, Yezli S, et al. Transmission of SARS and MERS coronaviruses and influenza virus in healthcare settings: the possible role of dry surface contamination. J Hosp Infect. 2016;92:235‐250. [DOI] [PMC free article] [PubMed] [Google Scholar]
- 10. World Health Organization . Summary and risk assessment of current situation in Republic of Korea and China. [WHO website]. June 19, 2015. http://www.who.int/csr/disease/coronavirus_infections/risk-assessment-19june2015/en/. Accessed June 3, 2016.
- 11. Zumla A, Hui DS, Perlman S. Middle East respiratory syndrome. Lancet. 2015;386:995‐1007. [DOI] [PMC free article] [PubMed] [Google Scholar]
- 12. Hijawi B, Abdallat M, Sayaydeh A, et al. Novel coronavirus infections in Jordan, April 2012: epidemiological findings from a retrospective investigation. East Mediterr Health J. 2013;19:S12. [PubMed] [Google Scholar]
- 13. Seo YB, Heo JY, Song MS, et al. Environmental contamination and viral shedding in MERS patients during MERS‐CoV outbreak in South Korea. Clin Infect Dis. 2016;62:755‐760. [DOI] [PMC free article] [PubMed] [Google Scholar]
- 14. Kim SH, Chang SY, Sung M, et al. Extensive viable Middle East respiratory syndrome (MERS) coronavirus contamination in air and surrounding environment in MERS isolation wards. Clin Infect Dis. 2016;63:363‐369. [DOI] [PMC free article] [PubMed] [Google Scholar]
- 15. Van Doremalen N, Bushmaker T, Munster VJ. Stability of Middle East respiratory syndrome coronavirus (MERS‐CoV) under different environmental conditions. Euro Surveill. 2013;18:20590. [DOI] [PubMed] [Google Scholar]
- 16. World Health Organization . Middle East respiratory syndrome coronavirus (MERS‐CoV): update. [WHO website]. April 11, 2014. http://www.who.int/csr/don/2014_04_11_mers/en/. Accessed June 3, 2016.
- 17. Centers for Disease Control and Prevention . Interim infection prevention and control recommendations for hospitalized patients with Middle East respiratory syndrome Coronavirus (MERS‐CoV). [CDC website]. June, 2015. http://www.cdc.gov/coronavirus/mers/infection-prevention-control.html. Accessed June 3, 2016.
- 18. Chowell G, Abdirizak F, Lee S, et al. Transmission characteristics of MERS and SARS in the healthcare setting: a comparative study. BMC Med. 2015;13:1. [DOI] [PMC free article] [PubMed] [Google Scholar]
- 19. Ki M. MERS outbreak in Korea: hospital‐to‐hospital transmission. Epidemiol Health. 2015;2015:37. [DOI] [PMC free article] [PubMed] [Google Scholar]
- 20. World Health Organization . Middle East respiratory syndrome coronavirus (MERS‐CoV): summary of current situation, literature update and risk assessment. [WHO website]. July 7, 2015. http://apps.who.int/iris/bitstream/10665/179184/2/WHO_MERS_RA_15.1_eng.pdf. Accessed June 3, 2016.
- 21. Park YS, Lee C, Kim KM, et al. The first case of the 2015 Korean Middle East respiratory syndrome outbreak. Epidemiol Health. 2015;37:e2015049. [DOI] [PMC free article] [PubMed] [Google Scholar]
- 22. Kim SJ. 30 cases linked to Pyeongtaek St. Mary's Hospital. [The Korea Times website]. June 5, 2015. http://www.koreatimes.co.kr/www/news/nation/2016/11/113_180300.html. Accessed August 5, 2016.
- 23. Nicas M, Sun G. An integrated model of infection risk in a healthcare environment. Risk Anal. 2016;26:1085‐1096. [DOI] [PubMed] [Google Scholar]
- 24. Atkinson MP, Wein LM. Quantifying the routes of transmission for pandemic influenza. Bull Math Biol. 2008;70:820‐867. [DOI] [PubMed] [Google Scholar]
- 25. Gao X. Relative Effectiveness of Ventilation in Community Indoor Environments for Controlling Infection. Hong Kong: HKU Theses Online (HKUTO); 2011. [Google Scholar]
- 26. Xiao S, Li Y, Wong TW, Hui DSC. Role of fomites in SARS transmission during the largest hospital outbreak in Hong Kong. PLoS One. 2017;12:e0181558. [DOI] [PMC free article] [PubMed] [Google Scholar]
- 27. Pan X, Han CS, Dauber K, Law KH. A multi‐agent based framework for the simulation of human and social behaviors during emergency evacuations. AI & Soc. 2007;22:113‐132. [Google Scholar]
- 28. Gilbert GN. Agent‐Based Models. London: Sage; 2007. [Google Scholar]
- 29. Kozier B, Erb GL, Olivieri R. Fundamentals of Nursing, Concepts, Process and Practice. Chesmut Hill, MA: School of Nursing Boston College; 1991. [Google Scholar]
- 30. Huslage K, Rutala WA, Sickbert‐Bennett E, Weber DJ. A quantitative approach to defining ‘high‐touch’ surfaces in hospitals. Infect Control Hosp Epidemiol. 2010;31:850‐853. [DOI] [PubMed] [Google Scholar]
- 31. Li Y, Duan S, Yu I, Wong T. Multi‐zone modeling of probable SARS virus transmission by airflow between flats in Block E, Amoy Gardens. Indoor Air. 2005;15:96‐111. [DOI] [PubMed] [Google Scholar]
- 32. Meselson M, Guillemin J, Hugh‐Jones M, et al. The Sverdlovsk anthrax outbreak of 1979. Science. 1994;266:1202‐1208. [DOI] [PubMed] [Google Scholar]
- 33. Sorensen JH, Jensen CO, Mikkelsen T, et al. Modeling the atmospheric dispersion of foot‐and‐mouth disease virus for emergency preparedness. Phys Chem Earth. 2001;26:93‐97. [Google Scholar]
- 34. Chen C, Zhao B, Yang X, Li Y. Role of two‐way airflow owing to temperature difference in severe acute respiratory syndrome transmission: revisiting the largest nosocomial severe acute respiratory syndrome outbreak in Hong Kong. J R Soc Interface. 2011;8:699‐710. [DOI] [PMC free article] [PubMed] [Google Scholar]
- 35. Li Y, Delsante A, Symons J. Prediction of natural ventilation in buildings with large openings. Build Environ. 2000;35:191‐206. [Google Scholar]
- 36. Brockmann D, Hufnagel L, Geisel T. The scaling laws of human travel. Nature. 2006;439:462‐465. [DOI] [PubMed] [Google Scholar]
- 37. Gonzalez MC, Hidalgo CA, Barabasi AL. Understanding individual human mobility patterns. Nature. 2008;453:779‐782. [DOI] [PubMed] [Google Scholar]
- 38. Xie X, Li Y, Chwang ATY, et al. How far droplets can move in indoor environments: revisiting the wells evaporation–falling curve. Indoor Air. 2007;17:211‐225. [DOI] [PubMed] [Google Scholar]
- 39. Riley E, Murphy G, Riley R. Airborne spread of measles in a suburban elementary school. Am J Epidemiol. 1978;107:421‐432. [DOI] [PubMed] [Google Scholar]
- 40. Draper NR, Smith H, Pownell E. Applied Regression Analysis, vol. 3 New York, NY: Wiley; 1966. [Google Scholar]
- 41. Chau JPC, Thompson DR, Twinn S, et al. An evaluation of hospital hand hygiene practice and glove use in Hong Kong. J Clin Nurs. 2011;20:1319‐1328. [DOI] [PubMed] [Google Scholar]
- 42. Pittet D, Dharan S, Touveneau S, et al. Bacterial contamination of the hands of hospital staff during routine patient care. Arch Intern Med. 1999;159:821‐826. [DOI] [PubMed] [Google Scholar]
- 43. Wein LM, Atkinson MP. Assessing infection control measures for pandemic influenza. Risk Anal. 2009;29:949‐962. [DOI] [PubMed] [Google Scholar]
- 44. Johnson GR, Morawska L, Ristovski ZD, et al. Modality of human expired aerosol size distributions. J Aerosol Sci. 2011;42:839‐851. [Google Scholar]
- 45. Lee JH, Lee CS, Lee HB. An appropriate lower respiratory tract specimen is essential for diagnosis of Middle East respiratory syndrome (MERS). J Korean Med Sci. 2015;30:1207‐1208. [DOI] [PMC free article] [PubMed] [Google Scholar]
- 46. Goh GKM, Dunker AK, Uversky V. Prediction of intrinsic disorder in MERS‐CoV/HCoV‐EMC supports a high oral‐fecal transmission. PLoS Curr. 2013;5:1‐22. [DOI] [PMC free article] [PubMed] [Google Scholar]
- 47. Corman VM, Albarrak AM, Omrani AS, et al. Viral shedding and antibody response in 37 patients with Middle East respiratory syndrome coronavirus infection. Clin Infect Dis. 2016;62:477‐483. [DOI] [PMC free article] [PubMed] [Google Scholar]
- 48. Gryphon Scientific . Supplemental information: dose response parameters for gain of function pathogens. [Gryphon Scientific website]. December, 2015. http://www.gryphonscientific.com/wp-content/uploads/2015/12/Supplemental-Info-Dose-Response.pdf. Assessed on April 13, 2016.
- 49. Al‐Abdallat MM, Payne DC, Alqasrawi S, et al. Hospital‐associated outbreak of Middle East respiratory syndrome coronavirus: a serologic, epidemiologic, and clinical description. Clin Infect Dis. 2014;59:1225‐1233. [DOI] [PMC free article] [PubMed] [Google Scholar]
- 50. Cowling BJ, Park M, Fang VJ, et al. Preliminary epidemiologic assessment of MERS‐CoV outbreak in South Korea, May–June 2015. Euro Surveill. 2015;20:21163. [DOI] [PMC free article] [PubMed] [Google Scholar]
- 51. Wong G, Liu W, Liu Y, et al. MERS, SARS, and Ebola: the role of super‐spreaders in infectious disease. Cell Host Microbe. 2015;18:398‐401. [DOI] [PMC free article] [PubMed] [Google Scholar]
- 52. Li Y, Yu ITS, Xu P, et al. Predicting super spreading events during the 2003 SARS epidemics in Hong Kong and Singapore. Am J Epidemiol. 2004;160:719‐728. [DOI] [PMC free article] [PubMed] [Google Scholar]
- 53. Chan JFW, Lau SKP, To KKW, et al. Middle East respiratory syndrome coronavirus: another zoonotic betacoronavirus causing SARS‐like disease. Clin Microbiol Rev. 2015;28:465‐522. [DOI] [PMC free article] [PubMed] [Google Scholar]
Associated Data
This section collects any data citations, data availability statements, or supplementary materials included in this article.
Supplementary Materials