Abstract
Background:
The HU linearity is an essential parameter in a quantitative imaging and the treatment planning systems of radiotherapy.
Objective:
This study aims to evaluate the linearity of Hounsfield unit (HU) in applying the adaptive iterative dose reduction (AIDR) on CT scanner and its comparison to the filtered back-projection (FBP).
Material and Methods:
In this experimental phantom study, a TOS-phantom was scanned using a Toshiba Alexion 6 CT scanner. The images were reconstructed using the FBP and AIDR. Measurements of HU and noise values were performed on images of the “HU linearity” module of the TOS-phantom. The module had five embedded objects, i.e., air, polypropylene, nylon, acrylic, and Delrin. On each object, a circle area of 4.32 cm2 was drawn and used to measure HU and noise values. The R2 of the relation between mass densities vs. HU values was used to measure HU linearities at four different tube voltages. The Mann-Whitney U test was used to compare unpaired data and p-value < 0.05 was considered statistically significant.
Results:
The AIDR method produced a significant smaller image noise than the FBP method (p-value < 0.05). There were no significant differences in HU values of images reconstructed using FBP and AIDR methods (p-value > 0.05). The HU values acquired by the methods showed the same linearity marked by coinciding linear lines with the same R2 value (> 0.999).
Conclusion:
AIDR methods produce the HU linearity as FBP methods with a smaller image noise level.
Keywords: Tomography Scanners, X-Ray Computed; Radiation Dosage; Phantoms, Imaging; FBP; AIDR; HU Linearity
Introduction
Based on many studies carried out by now, computed tomography (CT) scanner produces higher radiation dose compared to other radiological modalities [ 1 - 3 ], which can increase patient’s probability of acquiring cancer [ 4 ]. Realizing the negative effect of CT dose to patient’s health [ 5 - 7 ] causes the efforts to minimize the risk of cancer by reducing CT dose crucial. One of the efforts to reduce CT dose was conducted by introducing an alternative reconstruction technique [ 8 , 9 ] other than the standard image reconstruction method, such as filtered back projection (FBP) [ 10 ]. The FBP method is a favorable reconstruction method due to its fast reconstruction time. One way to reduce CT dose is decreasing the current tube (mA) [ 11 ], with reducing image quality due to the presence of higher image noise [ 12 ]. Therefore, an alternative image reconstruction algorithm that can produce good image quality for diagnostic purposes but still maintaining a lower dose level is needed.
The iterative reconstruction (IR) technique is an alternative reconstruction technique to reduce radiation doses on a CT scanner [ 13 - 19 ]. The technique produces high-quality images with the use of only a low tube current generating a low radiation dose [ 18 - 26 ]. The main limitation of the IR technique is that it requires a very long reconstruction time [ 20 - 21 ]. However, with the advancement of current computer technology, this problem is no longer a concern and therefore makes many CT centers have implemented the technique in their image reconstruction protocol to reduce radiation doses.
Until now, the IR technique has been widely applied by many CT manufacturers [ 27 ] and is introduced in different names, such as adaptive iterative dose reduction (AIDR) [ 28 ], ASIR [ 29 ], MBIR [ 21 ], VEO [ 30 ], iDose [ 31 ], SAFIRE [ 32 ], ADMIRE [ 33 ]. However, the technique was installed separately on the CT scanner as an additional package. In its development, various modifications of IR software were made by the manufacturers with restricted access to acquire information regarding the software detail algorithms. In general, there are two approaches to evaluate the IR techniques, namely using a statistical approach (Statistical IR) and a modeling approach (Model-based IR) [ 27 ].
Many studies have evaluated the ability of the IR techniques in reducing the dose of up to 60% [ 26 , 34 ] with still maintaining the resulted image quality [ 30 - 34 ]. The HU linearity evaluation is an important parameter to quantitatively investigate the image quality for maintaining the accuracy of the diagnosis process [ 35 ]. Moreover, in the treatment planning systems of radiotherapy, the HU linearity is also as an essential parameter to determine the accuracy of dose planning [ 36 ]. Therefore, this research aims to evaluate HU linearity generated by IR techniques and compared to the those acquired by FBP techniques.
Material and Methods
CT scanner and phantom
In this experimental phantom study, a Toshiba Alexion 6 CT scanner (Toshiba Medical Systems Corporation, Otawara, Tochigi, Japan) (Figure 1 (a)) and a TOS-phantom (Toshiba Medical Systems Corporation, Otawara, Tochigi, Japan) were used to evaluate the linearity of the HU. The phantom was scanned by input parameters of 200 mA tube current, 750 ms rotation time, 39.98 cm field of view, 5 mm slice thickness, and a “large” type filter. The tube voltage was varied using the available four-tube voltages of the CT scanner, namely 80, 100, 120, and 135 kVps. The phantom was scanned by the axial mode. Each image acquired from scanning was reconstructed using the standard FBP method and the iterative method of AIDR with the same kernel convolution of the FC13.
Figure 1.
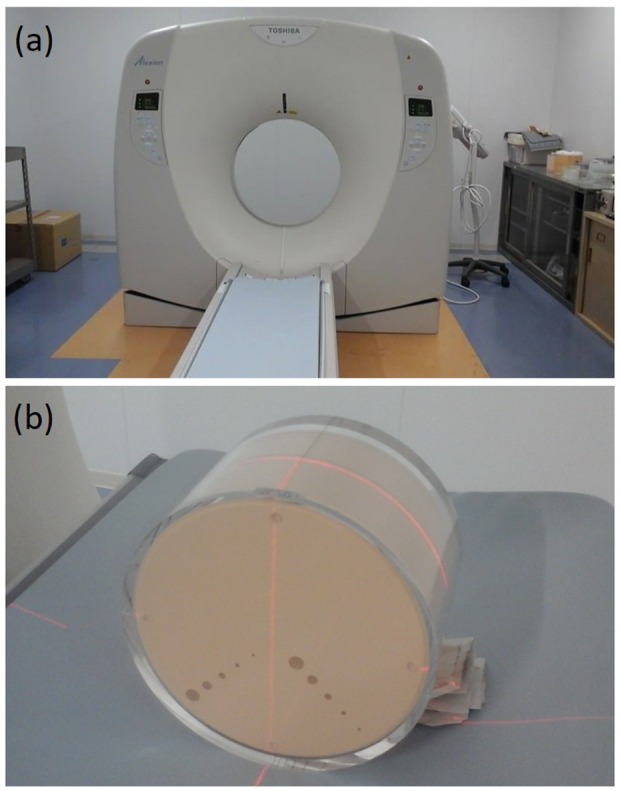
(a) Photograph of Toshiba Alexion 6 CT scanner, and (b) Photograph of the TOS-phantom.
Comparison of HU and noise values
Measurements of HU and noise values were performed on images of the “HU linearity” module of the TOS-phantom, as shown in Figure 2. Measurements of HU and noise values were performed on phantom images reconstructed using both FBP and AIDR methods. In the module of the phantom, five different circle objects were embedded i.e., the air, polypropylene, nylon, acrylic, and Delrin, which has mass density values of 0.00129, 0.92, 1.145, 1.19, and 1.42, respectively. A circle region of interest (ROI) of 4.32 cm2, consisting of 710 pixels, was drawn inside each object region. Labels of 1 to 5 were given to represent the air, polypropylene, nylon, acrylic, and Delrin, respectively. At each ROI, the mean of HU values and noise (standard deviations) both in images reconstructed with FBP and AIDR for all available tube voltage were measured.
Figure 2.
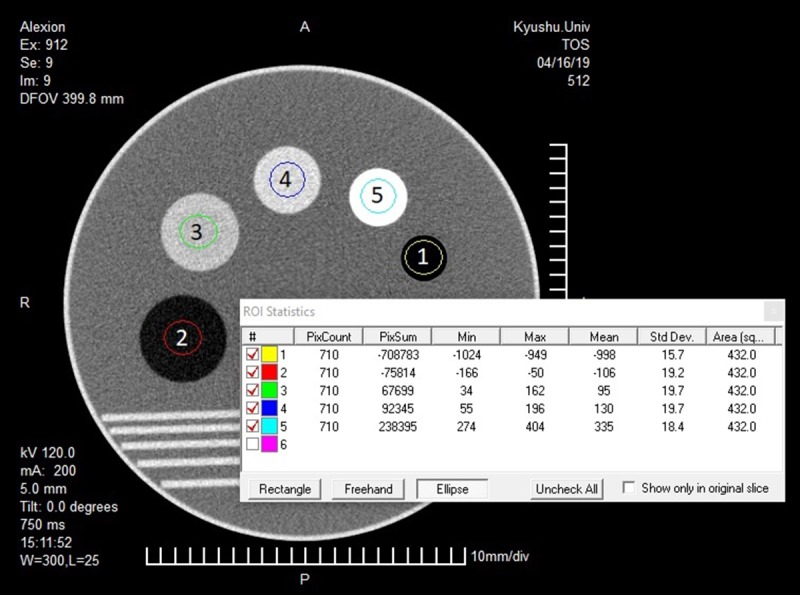
An illustration of a module of the TOS-phantom image that consists of five circle objects. In each object, a circle ROI of 4.32 was drawn. The ROI is labeled with some numbers, as follows: 1 for the air object, 2 for the polypropylene object, 3 for the nylon object, 4 for the acrylic object, and 5 for the Delrin object.
Linearity of HU value was obtained from making a graph between mass densities vs. HU values. The linearity of the HU value was determined by making a linear regression with its R2 indicated the linearity of the value. HU values obtained from the two methods at 120 kVp are compared to the HU value reported in the manual book of the TOS-phantom. A comparison of HU values between the FBP and AIDR methods was conducted for objects and tube voltage variations. Similarly, noise comparison (standard deviation) between FBP and AIDR was also conducted for the same objects and tube voltage. Unpaired comparison between the two methods was statistically performed using the Mann-Whitney U test. A p-value < 0.05 indicated statistically significant difference.
Results
HU values comparison with the TOS-phantom manual book
The manual book of the TOS-phantom reported that the HU value of the air, polypropylene (PP), nylon, acrylic (PMMA), and Delrin objects are -990, -100, 100, 125, and 340 HUs, respectively at a voltage of 120 kVp. For the respected objects, HU values obtained both by FBP and AIDR methods are -1001, -105, 97, 131, and 335 HUs. The comparison of HU values between the reported TOS-phantom manual book and both using FBP and AIDR were not significantly different, with a p-value of 0.84 (> 0.05).
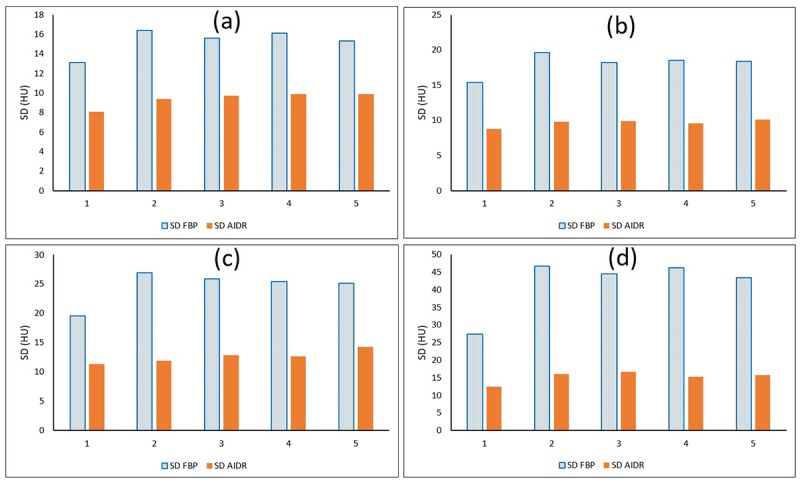
The TOS-phantom images reconstructed using the FPB and AIDR method at 120 kVp are presented in Figure 3. It appears visually that the noise from the FBP is greater than from the AIDR. Numerical evaluation showed that the noises generated by FBP method were 15.4, 19.6, 18.2, 18.5 and 18.4 HUs, and by AIDR method were 8.8, 9.8, 9.9, 9.6 and 10.1 HUs. Significantly different HU values of noise were observed between the two methods (p-value = 0.01).
Figure 3.
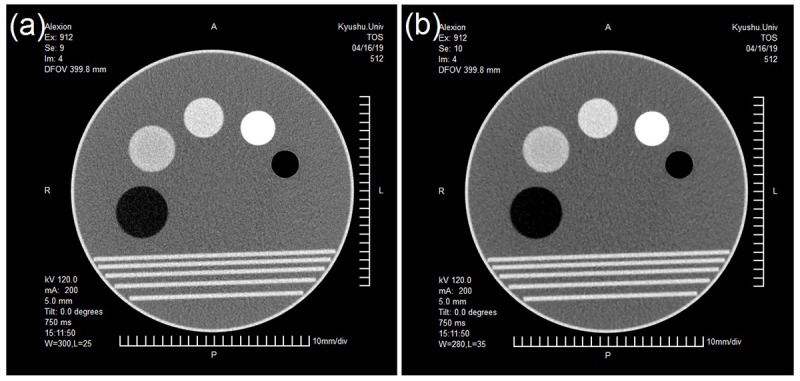
Example images are reconstructed by the FBP method (a) and the AIDR method (b). The images are obtained from the TOS-phantom and scanned at 120 kVp.
Comparison of HU and noise values in FPB and AIDR in object variations
Figure 4 shows the comparisons of HU value generated by FBP and AIDR reconstruction for each object at four different kVps that the HU values generated by the two methods were similar. The HU value similarity occurs at all tube voltages from 80 kVp to 135 kVp. Statistical testing showed that there were no significant differences in HU values between images reconstructed using FBP and AIDR with a p-value of 0.97, 1.00, 0.83, and 0.73 for the respected 135, 120, 100, and 80 kVps.
Figure 4.
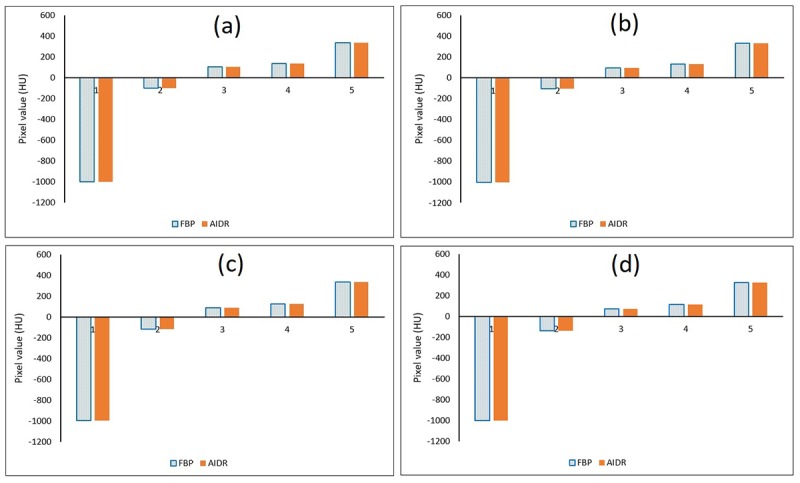
Comparison of HU values between FBP and AIDR methods for object variations at (a) 135 kVp, (b) 120 kVp, (c) 100 kVp, and (d) 80 kVp. Labeled with some numbers are as follows: 1 for the air object, 2 for the polypropylene object, 3 for the nylon object, 4 for the acrylic object, and 5 for the Delrin object.
The comparisons of the quantitative amount of noise between FBP and AIDR for object variations at four different kVps were shown in Figure 5, showing higher noise generated using FBP method than AIDR (p-value = 0.01) on all different voltages. It also appears that the noise in the air object is the lowest compared to other objects.
Figure 5.
Comparison of the amount of noise between FBP and AIDR for object variations at (a) 135 kVp, (b) 120 kVp, (c) 100 kVp, and (d) 80 kVp. Labeled number are as follows: 1 for the air object, 2 for the polypropylene object, 3 for the nylon object, 4 for the acrylic object, and 5 for the Delrin object.
Comparison of HU and noise values in FPB and AIDR in tube voltage variations
The comparisons of the HU values between FBP and AIDR methods for tube voltage variations were shown in Figure 6. No significant difference of HU values of the images was obtained using both FBP and AIDR methods with p-values of 0.97, 0.97, 1.00, 0.86, and 0.77 for the air, polypropylene, nylon, acrylic, and Delrin objects, respectively. The figure also shows that for all objects, the HU values decreases slightly for a lower usage of tube voltage from 135 kVp to 80 kVp.
Figure 6.
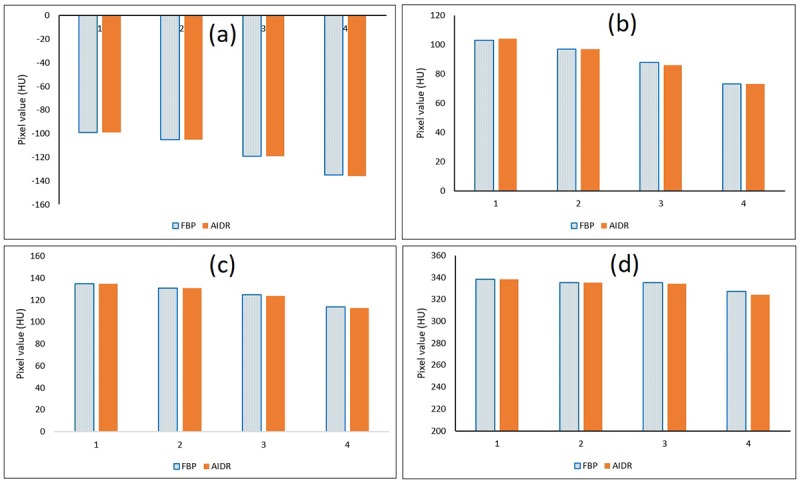
Comparison of HU values of images between FBP and AIDR for voltage variations that 1 is for the voltage of 135 kVp, 2 is for the voltage of 120 kVp, 3 is for the voltage of 100 kVp and 4 is for the voltage of 80 kVp. (a) On polypropylene objects, (b) on nylon objects, (c) on acrylic objects (PMMA), and (d) on Delrin objects.
The comparisons of noise generated by the FBP and the AIDR on different voltage were shown in Figure 7. Again, it is clear that the noise from the FBP is much greater than that from the AIDR with p-values of 0.03, 0.03, 0.06, 0.03, and 0.06 are for the air, polypropylene, nylon, acrylic and Delrin, respectively.
Figure 7.
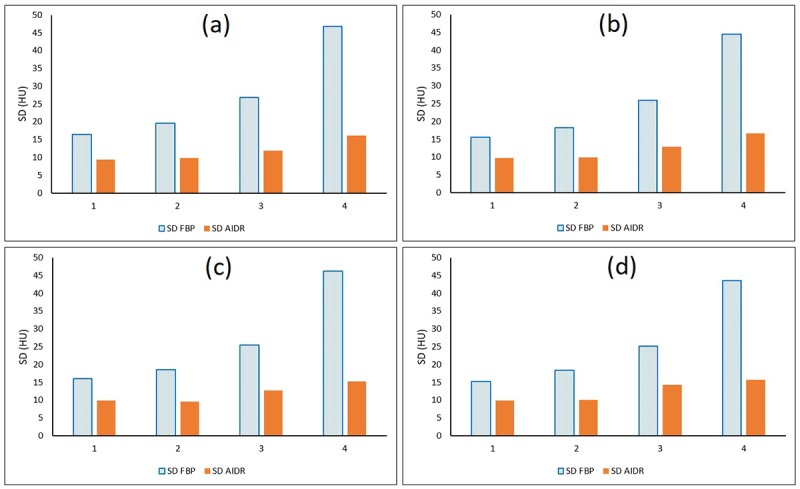
Comparison of the amount of noise of images between FBP and AIDR for voltage variations. 1 shows the voltage of 135 kVp, 2 shows the voltage of 120 kVp, 3 shows the voltage of 100 kVp and 4 shows the voltage of 80 kVp. (a) On polypropylene objects, (b) on nylon objects, (c) on acrylic (PMMA) objects, and (d) on Delrin objects.
Comparison of HU linearity between FBP and AIDR
The comparison of HU linearities between images of the TOS-phantom reconstructed using FBP and AIDR methods are shown in Figure 8. It appears that both methods produce the same linearity marked by coinciding linear lines with the same R2 value. If we compare images with different voltages, the linearity line has a slightly different R2 value. The R2 values are 0.992, 0.994, 0.998 and 1.000 for the tube voltages of 135, 120, 100 and 80 kVps, respectively. This means that tube voltage of 80 kVp has a higher linearity compared to a higher voltage. However, the R2 values obtained from all tube voltages used are still higher than 0.99.
Figure 8.
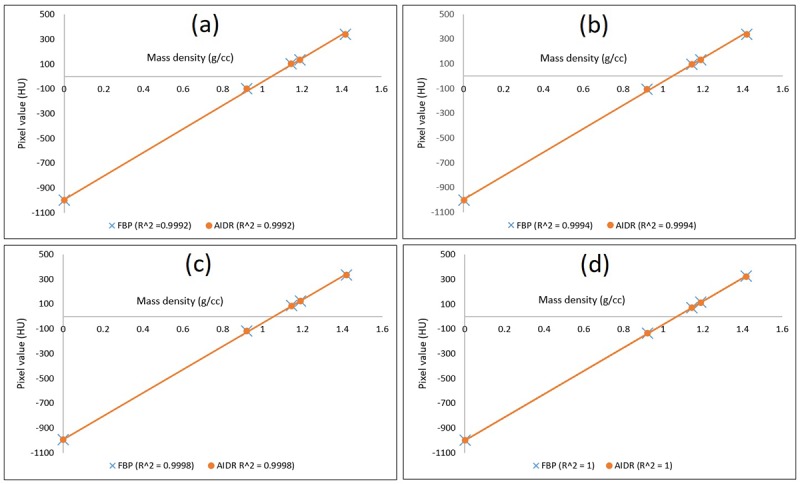
Comparison of HU linearity between FBP and AIDR. (a) At 135 kVp, (b) At 120 kVp, (c) At 100 kVp, and (d) At 80 kVp.
Discussion
This study aims to evaluate the HU linearity of the IR methods, and compare it with the FBP method, which is a standard method of image reconstruction. The evaluation is important because, CT analysis currently begins to use quantitative analysis techniques, where accuracy of HU values and its linearity are considered as main indicators [ 35 ]. In addition, the CT scanner with IR methods is sometime used in treatment planning where HU accuracy also determines the accuracy of dose planning on radiotherapy to produce better therapeutic outcomes [ 36 ]. Although there were several studies evaluating image quality and dose reduction in the IR method [ 19 - 25 ], the linearity evaluation of HU values has never been carried out. As such, this study complements previously reported studies reporting results of IR reconstruction in terms of noise [ 29 ], spatial resolution [ 13 ] and low contrast parameters [ 19 ].
This study revealed that the HU values of TOS-phantom images generated by the IR method did not differ significantly from the standard FBP method. For the five objects in the TOS-phantom, mean difference in HU value between the FBP and IR methods is less than 1 HU and the maximum difference is less than 3 HU. No significant difference of HU value generated by the two methods shows that the IR method can be used for quantitative analysis of images and also in treatment planning systems.
As previously reported by several studies, the IR method can produce images with much smaller noise compared to the FBP method if the input exposure factors are kept constant [ 18 , 20 ] as also reported in this study on all tube voltages used. Therefore, if the noise produced by the IR method is set the same as the FBP method, then the IR method can be carried out at a smaller dose than the FBP [ 21 ].
From all five objects embedded in the TOS-phantom, it was found that the air object produces the smallest noise for its homogeneous properties compared to the other four objects having a slight inhomogeneity in its the constituent materials. This study also showed the effect of reducing the tube voltage (kVp) in reducing the HU values on five different materials in the phantom
This study uses of only one type of IR technique, namely AIDR. Therefore, HU linearity in other IR reconstruction methods such as MBIR, VEO must be evaluated separately. HU linearity evaluation on other IR methods will be conducted in further studies.
Conclusion
In conclusion, the HU values and its linearity generated by the AIDR method are not significantly different from the FBP method as a standard CT image reconstruction with producing smaller image noise values.
Acknowledgement
This work was funded by the Riset Publikasi Internasional Bereputasi Tinggi (RPIBT), Diponegoro University with contract number: 329-116/UN7.P4.3/PP/2019.
Conflict of Interest: None
References
- 1.Coultre R L, Bize J, Champendal M, Wittwer D, Ryckx N, Aroua B, Trueb B, Verdun FR. Exposure of the Swiss Population by Radiodiagnostics: 2013 Review. Radiat Prot Dosimetry. 2016;169(1-4):221–4. doi: 10.1093/rpd/ncv462. [ PMC Free Article ] [DOI] [PMC free article] [PubMed] [Google Scholar]
- 2.Hricak H, Brenner D J, Adelstein S J, Frush D P, Hall E J, Howell R W, et al. Managing radiation use in medical imaging: a multifaceted challenge. Radiology. 2011;258(3):889–905. doi: 10.1148/radiol.10101157. [DOI] [PubMed] [Google Scholar]
- 3.Jones J G A, Mills C N, Mogensen M A, Lee C I. Radiation dose from medical imaging: A primer for emergency physicians. West J Emerg Med. 2012;13(2):202–10. doi: 10.5811/westjem.2011.11.6804. [ PMC Free Article ] [DOI] [PMC free article] [PubMed] [Google Scholar]
- 4.Brenner D J, Elliston C D, Hall E J, Berdon W E. Estimated risks of radiation-induced fatal cancer from pediatric CT. Am J Roentgenol. 2001;176(2):289–96. doi: 10.2214/ajr.176.2.1760289. [DOI] [PubMed] [Google Scholar]
- 5.Anam C, Budi W S, Adi K, Sutanto H, Haryanto F, Mohd Hanafi A, Fujibuchi H, Dougherty G. Assessment of patient dose and noise level of clinical CT images: automated measurements. J Radiol Prot. 2019;39(3):783–93. doi: 10.1088/1361-6498/ab23cc. [DOI] [PubMed] [Google Scholar]
- 6.Hendee W. Risk of medical imaging. Med Phys. 2013;40(4):040401. doi: 10.1118/1.4794923. [DOI] [PubMed] [Google Scholar]
- 7.Anam C, Haryanto F, Widita R, Arief I, Dougherty G. Automated Calculation of Water‐equivalent Diameter (DW) Based on AAPM Task Group 220. J Appl Clin Med Phys. 2016;17(4):320–33. doi: 10.1120/jacmp.v17i4.6171. [ PMC Free Article ] [DOI] [PMC free article] [PubMed] [Google Scholar]
- 8.Baskan O, Erol C, Ozbek H, Paksoy Y. Effect of radiation dose reduction on image quality in adult head CT with noise‐suppressing reconstruction system with a 256 slice MDCT. J Appl Clin Med Phys. 2015;16(3):285–96. doi: 10.1120/jacmp.v16i3.5360. [DOI] [PMC free article] [PubMed] [Google Scholar]
- 9.Costello J E, Cecava N D, Tucker J E, Bau J L. CT radiation dose: Current controversies and dose reduction strategies. AJR Am J Roentgenol. 2013;201(6):1283–90. doi: 10.2214/AJR.12.9720. [DOI] [PubMed] [Google Scholar]
- 10.Anam C, Haryanto F, Widita R, Arif I, Dougherty G. An investigation of spatial resolution and noise in reconstructed CT images using iterative reconstruction (IR) and filtered back-projection (FBP) J. Phys Conf Ser 2019;1127:012016. doi: 10.1088/1742-6596/1127/1/012016. [DOI] [Google Scholar]
- 11.Anam C, Fujibuchi T, Haryanto F, Widita R, Arif I, Dougherty G. An evaluation of computed tomography dose index measurements using a pencil ionisation chamber and small detectors. J Radiol Prot. 2019;39(1):112–124. doi: 10.1088/1361-6498/aaf2b4. [DOI] [PubMed] [Google Scholar]
- 12.Anam C, Haryanto F, Widita R, Arif I. New noise reduction method for reducing CT scan dose: Combining Wiener filtering and edge detection algorithm. AIP Conf Proc. 2015;1677(1):040004. [Google Scholar]
- 13.Hussain F A, Mail N, Shamy A M, Alghamdi S, Saoudi A. A qualitative and quantitative analysis of radiation dose and image quality of computed tomography images using adaptive statistical iterative reconstruction. Journal of Applied Clinical Medical Physic. 2016;17(3):419–432. doi: 10.1120/jacmp.v17i3.5903. [DOI] [PMC free article] [PubMed] [Google Scholar]
- 14.Mathieu K B, Ai H, Fox P S, Godoy M C, Munden R F, De Groot PM, Pan T. Radiation dose reduction for CT lung cancer screening using ASIR and MBIR: a phantom study. J Appl Clin Med Phys. 2014;15(2):271–80. doi: 10.1120/jacmp.v15i2.4515. [ PMC Free Article ] [DOI] [PMC free article] [PubMed] [Google Scholar]
- 15.Dodge C T, Tamm E P, Cody D D, Liu X, Jensen C T, Wei W, Kundra V, John Rong X. Performance evaluation of iterative reconstruction algorithms for achieving CT radiation dose reduction — a phantom study. Journal of Applied Clinical Medical Physic. 2016;17(2):511–31. doi: 10.1120/jacmp.v17i2.5709. [DOI] [PMC free article] [PubMed] [Google Scholar]
- 16.Brady S L, Yee B S, Kaufman R A. Characterization of adaptive statistical iterative reconstruction algorithm for dose reduction in CT: A pediatric oncology perspective. Med Phys. 2012;39(9):5520–31. doi: 10.1118/1.4745563. [DOI] [PubMed] [Google Scholar]
- 17.Katsura M, Matsuda I, Akahane M, Sato J, Akai H, Yasaka K, Kunimatsu A, Ohtomo K. Model-based iterative reconstruction technique for radiation dose reduction in chest CT: comparison with the adaptive statistical iterative reconstruction technique. Eur Radiol. 2012;22(8):1613–23. doi: 10.1007/s00330-012-2452-z. [DOI] [PubMed] [Google Scholar]
- 18.Volders D, Bols A, Haspeslagh M, Coenegrachts K. Model-based iterative reconstruction and adaptive statistical iterative reconstruction techniques in abdominal CT: comparison of image quality in the detection of colorectal liver metastases. Radiology. 2013;269(2):469–74. doi: 10.1148/radiol.13130002. [DOI] [PubMed] [Google Scholar]
- 19.Kondo M, Hatakenaka M, Higuchi K, Fujioka T, Shirasaka T, Nakamura Y, Nakamura K, Yoshiura T, Honda H. Feasibility of low-radiation-dose CT for abdominal examinations with hybrid iterative reconstruction algorithm: low-contrast phantom study. Radiological physics and technology. 2013;6(2):287–92. doi: 10.1007/s12194-012-0197-7. [DOI] [PubMed] [Google Scholar]
- 20.Leipsic J, Labounty T M, Heilbron B, Min J K, Mancini G B, Lin F Y, Taylor C, Dunning A, Earls JP. Estimated radiation dose reduction using adaptive statistical iterative reconstruction in coronary CT angiography: the ERASIR study. AJR Am J Roentgenol. 2010;195(3):655–60. doi: 10.2214/AJR.10.4288. [DOI] [PubMed] [Google Scholar]
- 21.Choo J Y, Goo J M, Lee C H, Park C M, Park S J, Shim M S. Quantitative analysis of emphysema and airway measurements according to iterative reconstruction algorithms: comparison of filtered back projection, adaptive statistical iterative reconstruction and model-based iterative reconstruction. Eur Radiol. 2014;24(4):799–806. doi: 10.1007/s00330-013-3078-5. [DOI] [PubMed] [Google Scholar]
- 22.Pickhardt P J, Lubner M G, Kim D H, Tang J, Ruma J A, Del Rio A M, Chen G H. Abdominal CT with model-based iterative reconstruction (MBIR): initial results of a prospective trial comparing ultralow-dose with standard-dose imaging. AJR Am J Roentgenol. 2012;199(6):1266–74. doi: 10.2214/AJR.12.9382. [ PMC Free Article ] [DOI] [PMC free article] [PubMed] [Google Scholar]
- 23.Desai G S, Uppot R N, Yu E W, Kambadakone A R, Sahani D V. Impact of iterative reconstruction on image quality and radiation dose in multidetector CT of large body size adults. Eur Radiol. 2012;22(8):1631–40. doi: 10.1007/s00330-012-2424-3. [DOI] [PubMed] [Google Scholar]
- 24.Gramer B M, Muenzel D, Leber V, Von Thaden A K, Feussner H, et al. Impact of iterative reconstruction on CNR and SNR in dynamic myocardial perfusion imaging in an animal model. Eur Radiol. 2012;22(12):2654–61. doi: 10.1007/s00330-012-2525-z. [DOI] [PubMed] [Google Scholar]
- 25.Willemink M J, De Jong P A, Leiner T, De Heer L M, Nievelstein R A, Budde R P, Schilham A M. Iterative reconstruction techniques for computed tomography Part 1: technical principles. Eur Radiol. 2013;23(6):1623–31. doi: 10.1007/s00330-012-2765-y. [DOI] [PubMed] [Google Scholar]
- 26.Willemink M J, Leiner T, De Jong P A, De Heer L M, Nievelstein R A, Schilham A M, Budde R P. Iterative reconstruction techniques for computed tomography part 2: initial results in dose reduction and image quality. Eur Radiol. 2013;23(6):1632–42. doi: 10.1007/s00330-012-2764-z. [DOI] [PubMed] [Google Scholar]
- 27.Beister M, Kolditz D, Kalender W A. Iterative reconstruction methods in X-ray CT. Phys Med. 2012;28(2):94–108. doi: 10.1016/j.ejmp.2012.01.003. [DOI] [PubMed] [Google Scholar]
- 28.Kim M, Lee J M, Yoon J H, Son H, Choi J W, Han J K, Choi B I. Adaptive iterative dose reduction algorithm in CT: effect on image quality compared with filtered back projection in body phantoms of different sizes. Korean J Radiol. 2014;15(2):195–204. doi: 10.3348/kjr.2014.15.2.195. [ PMC Free Article ] [DOI] [PMC free article] [PubMed] [Google Scholar]
- 29.Hara A K, Paden R G, Silva A C, Kujak J L, Lawder H J, Pavlicek W. Iterative reconstruction technique for reducing body radiation dose at CT: feasibility study. AJR Am J Roentgenol. 2009;193(3):764–71. doi: 10.2214/AJR.09.2397. [DOI] [PubMed] [Google Scholar]
- 30.Miéville F A, Gudinchet F, Brunelle F, Bochud F O, Verdun F R. Iterative reconstruction methods in two different MDCT scanners: physical metrics and 4-alternative forced-choice detectability experiments--a phantom approach. Phys Med. 2013;29(1):99–110. doi: 10.1016/j.ejmp.2011.12.004. [DOI] [PubMed] [Google Scholar]
- 31.Li H, Dolly S, Chen H C, Anastasio M A, Low D A, Li H H, Michalski J M, Thorstad W L, Gay H, Mutic S. A comparative study based on image quality and clinical task performance for CT reconstruction algorithms in radiotherapy. J Appl Clin Med Phys. 2016;17(4):377–90. doi: 10.1120/jacmp.v17i4.5763. [ PMC Free Article ] [DOI] [PMC free article] [PubMed] [Google Scholar]
- 32.Ghetti C, Palleri F, Serreli G, Ortenzia O, Ruffini L. Physical characterization of a new CT iterative reconstruction method operating in sinogram space. J Appl Clin Med Phys. 2013;14(4):4347. doi: 10.1120/jacmp.v14i4.4347. [ PMC Free Article ] [DOI] [PMC free article] [PubMed] [Google Scholar]
- 33.Ott J G, Ba A, Racine D, Ryckx N, Bochud F O, Alkadhi H, Verdun F R. Patient Exposure Optimisation through Task-Based Assessment of a New Model-Based Iterative Reconstruction Technique. Radiat Prot Dosimetry. 2016;169(1-4):68–72. doi: 10.1093/rpd/ncw019.PubMedPMID:26962148. [DOI] [PMC free article] [PubMed] [Google Scholar]
- 34.Kalender W A. Dose in x-ray computed tomography. Phys Med Biol. 2014;59(3):R129–50. doi: 10.1088/0031-9155/59/3/R129. [DOI] [PubMed] [Google Scholar]
- 35.Lascola K M, O’Brien R T, Wilkins P A, Clark-Price S C, Hartman S K, Mitchell M A. Qualitative and quantitative interpretation of computed tomography of the lungs in healthy neonatal foals. Am J Vet Res. 2013;74(9):1239–46. doi: 10.2460/ajvr.74.9.1239. [DOI] [PubMed] [Google Scholar]
- 36.Yohannes I, Prasetio H, Kallis K, Bert C. Dosimetric accuracy of the cone‐beam CT‐based treatment planning of the Vero system: a phantom study. Journal of applied clinical medical physics. 2016;17(4):106–113. doi: 10.1120/jacmp.v17i4.6194. [DOI] [PMC free article] [PubMed] [Google Scholar]


