

Abstract
Chronic myeloid leukemia (CML) is a myeloproliferative neoplasm, characterized by the occurrence of the t(9;22)(q34;q11) translocation. First-line therapy for CML consists of treatment with imatinib mesylate, which selectively inhibits the BCR-ABL protein by competing for its ATP-binding site. Adenine nucleotide signaling is modulated by the ectonucleotidases and this pathway is related to tumorigenic processes. Considering the relationship between ATP and cancer, we aimed to evaluate the influence of imatinib mesylate on the expressions and functions of the NTPDase and ecto-5′-nucleotidase (CD73) enzymes in imatinib-sensitive and -resistant K-562 cell lines. mRNA analysis showed that K-562 cells express all ENTPDs and NT5E. However, when treated with imatinib mesylate for 24 h, the expression of ENTPD1, -2, -3 and -5 increased, leading to a higher nucleotides hydrolysis rate. HPLC analysis identified increased ATP degradation in cells after 24 h of treatment, with consequent ADP and AMP formation, corroborating the increase in gene and protein expression of ectonucleotidases as observed in previous results. On the other hand, we observed that imatinib-resistant K-562 cells presented a decrease in nucleotide hydrolysis and expressions of ENTPD1 and -5. These results suggest an involvement of imatinib in modulating ectonucleotidases in CML that will need further investigation. Since these ectonucleotidases have important catalytic activities in the tumor microenvironment, their modulation in CML cells may represent an important therapeutic approach to regulate levels of extracellular adenine nucleotides.
Electronic supplementary material
The online version of this article (10.1007/s11302-019-09686-x) contains supplementary material, which is available to authorized users.
Keywords: Chronic myeloid leukemia, Purinergic signaling, Ectonucleotidases, Imatinib mesylate, Resistance
Introduction
Chronic myeloid leukemia (CML) is a myeloproliferative neoplasm, characterized by the clonal expansion of pluripotent hematopoietic stem cells and leading to the accumulation of myeloid cells in the bone marrow and peripheral blood [1]. This disease, in most cases, is characterized by the presence of a specific cytogenetic abnormality, the Philadelphia chromosome (Ph+), resulting from the t(9; 22)(q34; q11) translocation between the ABL oncogene on chromosome 9 and the BCR gene on chromosome 22 [2]. This chromosomal fusion results in an oncoprotein with potentialized and deregulated tyrosine kinase activity, responsible for the differentiation and proliferation of malignant cells [3].
The introduction of tyrosine kinase inhibitors (TKIs) substantially modified the treatment of patients with CML. Imatinib mesylate (Glivec®), the first tyrosine kinase inhibitor approved by the Food and Drug Administration (FDA), is the first line of treatment for CML [4]. It induces hematological remission in 99% of patients and a cytogenetic response in 74% after 12 months of treatment. Imatinib mesylate acts through competition for the ATP-binding site in the tyrosine kinase domain of ABL, inhibiting the ability of this protein to transfer ATP phosphate groups to tyrosine residues of target proteins, which is necessary for signal transduction for cell proliferation and apoptosis [5]. Despite the therapeutic success of target therapy, the occurrence of resistance to imatinib mesylate has led to the development of second- and third-generation TKIs. Several studies are investigating resistance to imatinib, however no specific mechanism has been identified; studies have, thus far, evaluated mutations in the oncoprotein, overexpression of resistance genes and have looked at efflux pumps [6–8] .
Extracellular adenine nucleotides, such as ATP (adenosine 5′-triphosphate) and ADP (adenosine 5′-diphosphate), act as signaling molecules through their binding to P2 purinergic receptors (P2X and P2Y subtypes) [9]. In cancer, adenine nucleotides are associated with several biological processes, such as growth factor production, secretion of inflammatory chemokines, stimulation or inhibition of cell death, cell differentiation, migration and proliferation [10]. The role of nucleotides in the immune system is also under study, where they can act by modulating immunosuppression or immunoactivation [11]. The levels of these nucleotides are modulated by a hydrolysis cascade consisting of several enzymes, called the ectonucleotidases. NTPDases are a family of eight members that have already been cloned and characterized. NTPDase1 (CD39) hydrolyzes ATP and ADP at the same ratio, while NTPDase2 has a higher affinity for ATP. NTPDase3 and -8 have intermediate preference for ATP, causing a slight accumulation of diphosphonucleosides. In contrast, NTPDase5 and -6 present preference for the hydrolysis of nucleoside diphosphates [12], while ecto-5′-nucleotidase (CD73) is responsible for the degradation of AMP to its respective nucleoside, adenosine [13].
A role for purinergic signaling has been reported in several types of cancers, such as in cervical cancer cells, gastric tumors, bladder tumor cells, and thyroid gland tumor, among others [14–17]. In hematologic malignancies, CD39 and CD73 appear to be associated with tumor development in acute lymphocytic leukemia (ALL) and chronic lymphocytic leukemia (CLL). CD73 expression has been evaluated in nucleated bone marrow cells in various subtypes of leukemias, where increased expression of this enzyme was observed in cells of patients with type B ALL. Enzyme expression of CD39 has been associated with the subtype, differentiation, and development of leukemias [18–20].
Considering the importance of purinergic signaling in the development of cancer and the action of imatinib mesylate on the ATP-binding site in Ph+ leukemic cells, the objective of this study was to evaluate the influence of imatinib mesylate treatment on the expression and activity of the NTPDases and CD73 in a human cell line derived from Ph+ CML (K-562). Expressions were compared with those of imatinib-resistant K-562 cells and with peripheral blood mononuclear cells (PBMNCs).
Materials and methods
Cell culture
The human chronic myeloid leukemia cell line, K-562 (Ph+), was obtained from the Rio de Janeiro Cell Bank (Rio de Janeiro, Brazil). Peripheral blood mononuclear fraction cells (PBMNCs) from healthy donators were obtained by centrifuging peripheral blood over a Histopaque®-1077 (Sigma-Aldrich, USA) density gradient and used as control cells [21]. Cells were maintained in RPMI-1640 medium (Sigma-Aldrich, USA), supplemented with 10% fetal bovine serum (Life Technologies, USA), 0.5% penicillin/streptomycin (Sigma-Aldrich, USA) and 1% amphotericin B (Sigma-Aldrich, USA), at 37 °C in an atmosphere of 5% CO2. The development of the imatinib-resistant K-562 cell line (K-562 R) was adapted from methodology described by Wang et al. [22]. K-562 cells were exposed to increasing concentrations of imatinib mesylate, starting with 0.125 μM, which were doubled every 10 days until 10 μM. Every four weeks, the cells were exposed to different concentrations of imatinib mesylate (0-50 μM) for resistance determination. Cell counts were performed on the FACSVerse™ cytometer equipped with a 488 nm laser and flow sensor (BD Biosciences, USA). To maintain resistance, the cells were exposed weekly to 2 μM of imatinib mesylate. This project was approved by Ethics Committee of UFRGS (n.1.979.570). All donators signed informed consent.
Determination of the IC50 of imatinib mesylate
K-562 cells were plated (1 × 10³cells/well) in 96-well plates, and after 24 h they were treated with different concentrations of Imatinib mesylate (0.1–10 μM) for 48 h. Cell counts were performed by flow cytometry (FACSVerse™ Cytometer). The IC50 was determined in 48 h (0.64 μM). Imatinib mesylate was used in all experiments but the work concentration was determined considering the proportion of free base imatinib.
Cell treatments
Cells were seeded in culture flasks (25 cm2), at densities of 1 × 10⁶ cells/flask in a volume of 5 mL of culture medium. After 1 day, cells were treated or not with imatinib mesylate (0.64 μM) for 24 or 48 h as described:
K-562 control group: cells maintained with culture medium only;
K-562 24 h group: cells treated with imatinib mesylate for 24 h;
K-562 48 h group: cells treated with imatinib mesylate for 48 h;
K-562R group: imatinib-resistant cells maintained with culture medium for the previous 3 days.
PBMNCs control group: cells maintained with culture medium only;
PBMNCs 24 h group: cells treated with imatinib mesylate for 24 h;
PBMNCs 48 h group: cells treated with imatinib mesylate for 48 h.
Determination of enzymatic activities
Specific activities of enzymes were determined by the measurement of the release of inorganic phosphate (Pi) using a colorimetric assay [23]. Cells from the treated and control groups were washed three times with the reaction medium. Fifty microliters of cell suspension was added to the reaction medium (final concentration of 4 μg protein/50 μL) containing 120 mM NaCl, 5 mM KCl, 60 mM Glucose, 0.5 mM CaCl2, 50 mM Tris-HCl, pH = 8 (for ATP, ADP and UDP) and 120 mM NaCl, 5 mM KCl, 60 mM Glucose, 1 mM MgCl2, 50 mM Tris-HCl, pH = 8 (for AMP) and preincubated for 10 min at 37 °C. The reaction was started by the addition of ATP, ADP and UDP (final concentration of 3 mM) to determine the activity of the NTPDases, and AMP (final concentration of 3 mM) for the ecto-5′-nucleotidase (CD73) assay. In order to explore which enzymes could be involved in nucleotide hydrolysis, the cells were previously incubated by 30 min in the presence of some ectonucleotidase inhibitors: 6-N,N-diethyl-D-beta-gamma-dibromomethylene adenosine triphosphate - ARL 67156 (0.1 mM) (competitive inhibitor to NTPDases, mainly of NTPDase 1 and 3) and adenosine 5′-(α,β-methylene) diphosphate (APCP) (0.001 mM) (ecto-5′-nucleotidase/CD73 inhibitor). The reaction was stopped after 60 min by the addition of 10% trichloroacetic acid (TCA). Samples were incubated on ice for 10 min prior to the inorganic phosphate (Pi) release assay using malachite green as a colorimetric reagent. To eliminate the non-enzymatic hydrolysis of the substrates, controls were carried out containing only the nucleotides and reaction buffers [24]. Before and after incubations, cell integrity was assessed using the dye exclusion method with trypan blue and no changes in cell viability were observed. The Bradford method was used to determine the amount of protein [25]. Specific activity was expressed as nmol Pi/mg protein/min. The concentration of Pi was quantified at 630 nm using a microplate reader (Spectramax M2e, SoftMaxPro Software Interface 5.4.1, USA).
RT-PCR analysis
Total RNA was isolated from cells using Trizol LS (Life Technologies, USA), according to the manufacturer’s instructions. The cDNA was synthesized with M-MLV reverse transcriptase (Invitrogen, Brazil) from 5 μg of total RNA in a final volume of 25 μL with a random hexamer primer, according to the manufacturer’s instructions. Glyceraldehyde-3-phosphate dehydrogenase (GAPDH) amplification was used as an endogenous control. The PCR contained 1 μL of the RT reaction product (cDNA), 1 μL of each primer pair and 1.25 units of Taq DNA Polymerase (Invitrogen, Brazil) in a final volume of 25 μL. The primers used in this study are described in Table S1. The PCR was run for 35 cycles and the cycling conditions were as follows: 1 min at 95 °C, 1 min at 94 °C, 1 min at annealing temperature, 1 min at 72 °C and a final 10 min extension at 72 °C. The PCR product was analyzed on a 1.5% agarose gel containing GelRed® (Biotium, USA) and visualized under ultraviolet light. Negative controls were performed with distilled water as non-template control and for positive controls cell lines with previously described expression of ENTPs and NT5E were used [14]. The HaCaT cell line was used as the control for ENTPD 1, 3, 6 and NT5E and the SiHa cell line for ENTPD2 and 5. Semi-quantification was performed through ImageJ software and expression by the ratio between marker expression/GAPDH. The equipment used was Verity 96-well Thermall Cycler (Applied Biosystems, USA).
Real-time RT-PCR (RT-qPCR)
Total RNA and cDNA were generated as described in RT-PCR analysis. All SYBR Green I-based real-time PCR mixtures were prepared using the GoTaq® qPCR Master Mix (Promega, USA), following the manufacturer’s recommendation. One microliter of cDNA was diluted to a final volume of 25 μL in the reaction mix using Rotor-Gene Q (Qiagen, Germany). Reaction conditions were; 95 °C for 1 min and 40 cycles of 10 s at 95 °C, 15 s at 60 °C or 63 °C, and 20 s at 72 °C. For the relative quantification (2−ΔΔCT) of ENTPDs and NT5E, real-time PCR were performed in duplicate using GAPDH as the endogenous control.
HPLC analysis
Fifty microliters of cell suspension was added to the reaction medium (final concentration of 4 μg protein/50 μL) and preincubated for 10 min at 37 °C. The reaction was started by the addition of ATP (100 μM). To stop the reaction, the tube was transferred to ice and centrifuged at 4 °C for 30 min at 16,000g. Aliquots of 20 μL were applied to a reverse phase HPLC system using a C18 Shimadzu column (Shimadzu, Japan) with absorbance measured at 250 nm. The mobile phase was 60 mM KH2PO4, 5 mM tetrabutyl ammonium chloride, pH 5.0 in methanol 30%. Retention times were assessed using standard samples of nucleotide and purines and concentrations are expressed as μM of nucleotide (mean ± S.E.).
Flow cytometry
After treatment with imatinib mesylate, 1 × 10⁶ cells were centrifuged for 5 min at 500×g and washed twice with phosphate buffered saline (PBS) plus 1% bovine serum albumin (BSA). The pellets were suspended and incubated for 45 min with primary antibodies (mouse or rabbit polyclonal anti-human antibodies) against NTPDase1 (hN1-8L5), NTPDase2 (hN2-2L5) and NTPDase3 (hN3H10s) (1:200 dilution; http://www.ectonucleotidases-ab.com), followed by incubation with a FITC-conjugated anti-rabbit or Alexa Fluor-conjugated anti-mouse secondary antibody (Life Technologies, USA) for 30 min. These antibodies were obtained from ectonucleotidases-ab, Université Laval, Québec, QC, Canada, and the specificity was previously characterized [26, 27]. For ecto-5′-nucleotidase expression analysis was used 1 μL of mouse anti-human CD73-PE antibody (559257-BD). After incubation, cells were centrifuged and washed twice with PBS. The same number of cells was incubated with secondary antibody as a control. All samples were analyzed using a BD FACSVerse™ cytometer.
Ectonucleotidases gene expression in human CML samples from GEO datasets
Gene expression data of chronic myeloid leukemia (CML) patients were obtained from the public NCBI GEO database GSE97562 (https://www.ncbi.nlm.nih.gov/geo/query/acc.cgi?acc=GSE97562). Progenitor cells isolated by FACS were cultured with or without imatinib for 48 h and evaluated the expression profiling by array as described by Avilés-Vázquez et al. [28]. Five samples from different patients were evaluated.
Statistical analysis
Results were analyzed by one-way analysis of variance (ANOVA), followed by Tukey’s test (GraphPad Prism v5.0 software). Values were considered significant when p < 0.05.
Results
Induction of resistance to imatinib mesylate
Acquired resistance to imatinib mesylate was determined after 6 months of continuous exposure to the drug, as described in material and methods. A dose-response curve was performed with different concentrations of imatinib mesylate (0.1 to 50 μM) and the IC50 was determined for both K-562 sensitive and imatinib-resistant (K-562R) cells. The IC50 of imatinib mesylate was 0.64 ± 0.12 μM and 41.01 ± 2.1 μM in K-562 sensitive and resistant cells, respectively.
The final IC50 for imatinib was 64-fold higher for K-562R than for sensitive K-562 (Fig. 1a). K-562R cells acquired a spheroid morphology and started to grow in clusters after imatinib resistance induction (Fig. 1b). In order to confirm this resistant profile, the expression of differentiation markers, cell surface markers and the expressions of multidrug resistance genes were evaluated (Figure S1).
Fig. 1.

Characterization of resistance to imatinib mesylate. (a) Cell counts were performed by flow cytometry to evaluate treatments with different concentrations (0–50 μM) of imatinib mesylate in K-562 (sensitive) and K-562R (resistant) cells. (b) Comparison of the phenotypic characteristics of K-562 cells and K-562R after long-term exposure to imatinib mesylate. × 200 magnification
The K-562R cell line, presented an increase in the expressions of SOX-2 and Nanog, as described in the literature [29]. We also observed an increased expression of cell surface markers, such as CD44 and CD133, on these cells, which is characteristic of leukemia stem cells [30, 31]. The increased expressions of efflux pump markers, such as ABCB1/MDR1 and ABCG2, suggest the participation in the development of resistance to imatinib [6, 32, 33].
Ectonucleotidase activity
The ability of cells to hydrolyze adenine nucleotides and UDP was determined for the K-562 tumor cell line and compared with that of PBMNCs (Table 1). Results demonstrate a significant increase in the hydrolysis activity of all the nucleotides tested in the tumor cell line, compared with PBMNCs cells. In order to evaluate the influence of imatinib on the hydrolysis of adenine nucleotides and UDP, cells were treated with imatinib mesylate for 24 and 48 h (Table 2). After 24 h of treatment, there was an increase in the hydrolysis of ATP, ADP, AMP and UDP, when compared with K-562 cells without imatinib mesylate. After 48 h of treatment, this activity decreased in relation to the 24-h treatment. The hydrolysis of UDP in 48 h was significantly decreased when compared with the hydrolysis in control K-562.
Table 1.
Specific activities for the hydrolysis of ATP, ADP, AMP and UDP in K-562 cells and peripheral blood mononuclear cells (PBMNCs)
| Cell line | ATP | ADP | AMP | UDP |
|---|---|---|---|---|
| PBMNCs | 25 ± 4 | 21 ± 2 | 5 ± 3 | 12 ± 2 |
| K-562 | 55 ± 1* | 33 ± 5* | 10 ± 4* | 55 ± 4* |
Specific activities are expressed as mean ± S.D. of three different experiments (nmol of Pi liberated/min/mg of protein). Data were compared by ANOVA, followed by Tukey’s test. *p < 0.05 represents statistical significance, when comparing K-562 cells with PMNCs
Table 2.
Specific activities for the hydrolysis of ATP, ADP, AMP and UDP in K-562 cells, K-562 cells after treatment with imatinib mesylate and K-562R
| Cell line | ATP | ADP | AMP | UDP |
|---|---|---|---|---|
| K-562 | 55 ± 1 | 33 ± 5 | 10 ± 4 | 55 ± 4 |
| K-562 24 h | 84 ± 5* | 88 ± 5* | 25 ± 2* | 64 ± 3* |
| K-562 48 h | 60 ± 2 | 51 ± 8 | 19 ± 6* | 20 ± 1* |
| K-562R | 46 ± 2* | 24 ± 5* | 10 ± 2 | 30 ± 1* |
Specific activities are expressed as mean ± S.D. of three different experiments performed in triplicate (nmol of Pi liberated/min/mg of protein). Data were compared by ANOVA, followed by Tukey’s test. *p < 0.05 represents statistical significance, when comparing K-562 treated with imatinib mesylate for 24 h (K-562 24 h), 48 h (K-562 48 h) and imatinib-resistant K-562 (K-562R) to untreated K-562 (K-562)
We also evaluated whether resistance to imatinib could modulate the hydrolysis of nucleotides. Decreases in the hydrolysis of ATP, ADP and UDP were observed in K-562R, when compared with the K-562 cell line. In addition, the increase in enzymatic activity in K-562, observed after treatment with imatinib mesylate, did not occur in PBMNCs, since the effects of imatinib mesylate are dependent on the binding of this drug to the active site of BCR-ABL, which is not present in PBMNCs (Table S2). In addition, in all cells the hydrolysis of ATP and ADP was decreased by the ARL 67156, a competitive inhibitor of NTPDases mainly 1 and 3. Similarly, the AMPase activity was decreased by APCP, a competitive inhibitor of CD73 (Fig. 2).
Fig. 2.
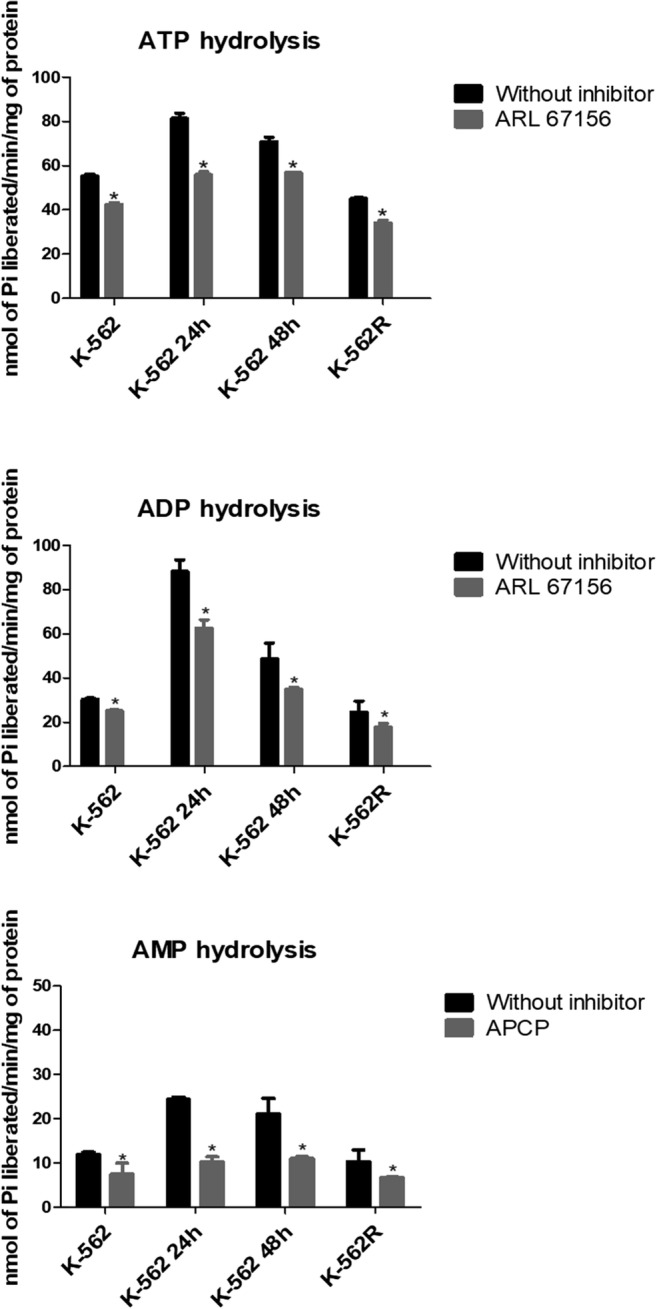
Effects of inhibitors on ATP, ADP and AMP hydrolysis in K-562 cells, K-562 cells after treatment with imatinib mesylate for 24 h (K-562 24 h) and 48 h (K-562 48 h) and imatinib-resistant K-562 cells (K-562R). The inhibitors were added to the reaction medium and preincubated for 30 min at 37 °C, and the enzyme reaction was started by the addition of ATP, ADP and AMP. Results are expressed as mean ± SD (n = 2). Data were compared by ANOVA, followed by Tukey’s test. An asterisk represents difference from control enzyme activity in the absence of inhibitor p < 0.05
Gene expressions of ENTPDs and NT5E
To confirm the difference found in nucleotide hydrolysis, mRNA levels of ENTPD and NT5E were determined. The K-562 cell line expressed all the enzymes investigated, furthermore, ENTPD 2, 3, 5 and 6 present higher expressions in K-562, when compared with PBMNCs (Figure S2), corroborating results found for nucleotide hydrolysis activities (Table 1). In order to analyze the effect of treatment with imatinib mesylate on the expressions of ENTPDs and NT5E, screening was performed using RT-PCR to observe which enzymes were influenced (Fig. 3a). RT-PCR demonstrated that treatment with imatinib mesylate modulated the expressions of the ENTPD1, ENTPD2, ENTPD3, ENTPD5 and NT5E genes and consequently these genes were analyzed by RT-qPCR. To confirm this observation, the mRNA was quantified using the 2−ΔΔCT method, where the expression was compared with the untreated K-562 cells. Figure 3b shows that after 24 h of treatment with imatinib mesylate, increases in the gene expressions of ENTPD1, ENTPD2, ENTPD3, ENTPD5 and NT5E were observed in relation to control cells. After 48 h of treatment with imatinib mesylate, only the expression of ENTPD5 was significantly reduced, consistent with the alteration in the hydrolysis rate of UDP at 48 h. The expressions of ENTPD1 and ENTPD5 were decreased in K-562R cells.
Fig. 3.

Expressions of ENTPDs and NT5E in K-562 cells, K-562 cells after treatment with imatinib mesylate for 24 h (K-562 24 h) and 48 h (K-562 48 h) and imatinib-resistant K-562 cells (K-562R). (a) Analysis by RT-PCR. Cell lines that already express these enzymes (as described in the literature) were used as positive controls (C+) and template controls (C−) were performed with distilled water. The lengths (bp) of the PCR products obtained with each pair of primers are given in each figure. (b) Quantitative expressions of ENTPDs and NT5E were analyzed by real-time PCR. Comparative analysis was performed using the 2−ΔΔCT method, where the expression was compared with the untreated K-562 cells using glyceraldehyde-3-phosphate dehydrogenase (GAPDH) as the endogenous control. The experiment was performed three times (n = 3) with samples in duplicate. Data were compared by ANOVA followed by Tukey’s test. *p < 0.05 represents statistical significance
HPLC analysis
The extracellular ATP metabolism profiles were similar in the K-562 and K-562R cells and were similar in K-562 cells treated with imatinib mesylate for 24 and 48 h (Fig. 4a). ADP and AMP formation occurred in all groups tested. During treatment with imatinib mesylate, ADP (27.05 μM ± 1.27) and AMP (4.56 μM ± 0.04) increased in K-562 at 24 h, in comparison with K-562 (ADP = 14.96 μM ± 0.57 and AMP = 1.35 μM ± 0.02), especially at 60 min (Fig. 4b). In contrast, the K-562R cells presented a slight reduction in the concentration of nucleotides formed (ADP = 12.96 μM ± 0.77 and AMP = 1.10 μM ± 0.44). In addition, to evaluate whether imatinib induces the releasing of nucleotides or nucleosides, cells were treated in the presence and absence of imatinib, centrifuged and incubated in enzyme activity buffer for 18 h, in the absence of nucleotides. The results showed that no nucleotide or nucleosides were released from cells (data not shown).
Fig. 4.

Hydrolysis of extracellular ATP and product formation by K-562 cells, K-562 cells after treatment with imatinib mesylate for 24 h (K-562 24 h) and 48 h (K-562 48 h) and imatinib-resistant K-562 cells (K-562R). (a) Cells were incubated with 100 μM ATP and supernatant aliquots were collected after 0, 10, 30, 60, 90 and 120 min. The nucleotides were quantified by HPLC. (b) Amounts of ATP, ADP and AMP formed after 60 min of incubation. Values are representative of two different experiments. Data were compared by one-way ANOVA, followed by Tukey’s test. *p < 0.05 represents statistical significance, comparing K-562 treated with imatinib mesylate for 24 h (K-562 24 h), 48 h (K-562 48 h) and imatinib-resistant K-562 (K-562R) cells to untreated K-562 (K-562)
Determination of NTPDase 1–3 and CD73 expression by flow cytometry
To assess whether imatinib mesylate was able to modulate the expression of the NTPDases 1–3 and CD73 at the protein level, flow cytometry was performed. As shown in Fig. 5, significant increases in expression (MFI) were observed after 24 h of imatinib treatment for NTPDase 1 (1900 ± 40.30 increased to 2803 ± 65.75), NTPDase 2 (1857 ± 37.4 to 3104 ± 86.67), NTPDase 3 (169 ± 3.53 to 258 ± 19.01) and CD73 (631 ± 36.06 to 723 ± 59.40). In contrast, these increases in enzyme expressions were not observed after 48 h of treatment. For the K-562R cell line, a decrease in the expression of NTPDase 1, in comparison with K-562, was observed (1900 ± 40.30 to 1029 ± 9.19), consistent with previous results showing that K-562R present decreased hydrolysis of ATP and ADP, and a decrease in the mRNA expression of ENTPD1.
Fig. 5.

Determination of NTPDase1, -2, -3 and CD73 protein expression by flow cytometry. (a) Histograms demonstrating enzyme expressions in K-562 cells after treatment with imatinib mesylate for 24 h (K-562 24 h) and 48 h (K-562 48 h) and imatinib-resistant K-562 (K-562R) cells, compared with untreated K-562. (b) Mean fluorescence intensity (MFI) plot in the same groups. The experiment was performed twice (n = 2) with samples in duplicate. Data were compared by ANOVA followed by Tukey’s test. *p < 0.05 represents statistically significant difference from untreated K-562. K-562 UC; labeled control with secondary antibody or unlabeled control
Discussion
The association of ectonucleotidases activities with different cancers has been proposed. The nucleotides balance in the tumor microenvironment play roles in proliferation, migration, differentiation, cell death, secretion of growth factors, inflammatory mediators and immune response, via modulation of extracellular ATP [10, 34]. However, the role of ATP in leukemias has not yet been fully elucidated. In cell lines and primary cultures of acute myeloid leukemia, ATP inhibits proliferative activity, which can be reversed using apyrase [35]. Another study, evaluating the role of ATP in the cell proliferation of the Jurkat acute myeloid leukemia cell line, found an increase of three times in the concentrations of ATP and ADP in the extracellular medium, when compared with healthy cells [36].
In this study, K-562 cells demonstrated a higher rate of nucleotide hydrolysis and NTPDase mRNA expression, when compared with PBMNCs. NTPDase1 expression, however, was higher in PBMNCs, while NT5E expression was not significant changed. These findings are in agreement with reports in the literature showing the presence of NTPDase1 in the mononuclear cells of healthy patients [24]. Our results indicate that purinergic signaling is altered in CML. Thus, we evaluated the influence of imatinib on purinergic signaling in imatinib-sensitive and -resistant CML cell lines.
The influence of imatinib mesylate on purinergic signaling was assessed in 4 different cell groups: untreated K-562 cells, K-562 cells treated with imatinib mesylate for 24 h and 48 h and in imatinib-resistant cells (K-562R). There was a significant increase in the hydrolysis of all nucleotides tested after 24 h of imatinib mesylate treatment, and this was followed by an increase in the ectonucleotidases mRNA and protein expressions. In previous studies, patients with lung cancer, treated with gemcitabine or cisplatin, displayed increased ATP and ADP hydrolyzing activities and increased CD39 expression, when compared with healthy individuals [37]. Another study that administered methotrexate to C6 rat glioblastoma cell cultures for 24 h demonstrated increases in CD73 activity and expression. This study analyzing the glioblastoma microenvironment also demonstrated that rats treated with methotrexate nanoparticles demonstrated increased CD39 expression in CD3+CD8+ cells [38]. Such increase in ATP hydrolysis was not observed at 48 h in our study. This result is corroborated by the analysis of gene expression data of CML patients obtained from the public NCBI GEO database GSE97562, in which progenitors cells from five patients were isolated and cultured with or without imatinib for 48 h and no changes in enzyme expression were observed (Figure S3).
In K-562R cells, we found decreases in the mRNA expression of ENTPD1 and in the protein expression of NTPDase1, confirming the results of the enzymatic activity and HPLC analyses, since nucleotide hydrolysis was lower on the surface of these cells. The imatinib-resistant cells also showed a decrease in the expression of ENTPD5, in association with a decrease in the enzymatic activity of UDP. We postulate that the modulation of NTPDase expression might contribute to resistance development; however, this finding should be further investigated. The role of the NTPDases in the development of resistance has been poorly explored in the literature; however, in cisplatin-resistant testicular tumor cells (NEC-8/DDP), the expression of ENTPD6 was found to be decreased [39].
NTPDase1, also known as CD39, has been studied as a possible prognostic marker. In chronic lymphocytic leukemia, a study showed a significantly increased expression of this enzyme in peripheral blood T lymphocytes, when compared with healthy controls [19]. The increased expression of NTPDase1 plays an important role in the overall survival of patients with gastric cancer and could act as a prognostic biomarker [15]. Although we observed high expression of NTPDase1 in cells treated with imatinib, the result with the presence of the NTPDases inhibitor (ARL67156) suggest that other enzymes may play an important role in ATP hydrolysis. Indeed, this increase in ATP hydrolysis may also be due to the enzymatic activities of NTPDase2 and -3, which were expressed in all groups evaluated, especially in the K-562 24 h group. Few studies have investigated these NTPDases in cancer; findings indicate that NTPDase2 is highly expressed in rat astrocytes and, when overexpressed in a C6 glioma cell line, promotes tumor growth and is associated with malignant characteristics in a rat glioma model [40–42]. In addition, the co-expression of NTPDase1 and -2 is associated with tumor growth in Walker’s Tumor, and the co-expression of NTPDase2 and -5 is also observed in Walker 256 cells [43, 44]. Although further studies will be necessary to elucidate the role of this enzyme in CML cells, our results demonstrate that treatment with imatinib alters the expression of these enzymes.
NTPDase5 is the principal enzyme with preference for diphosphate nucleotides and has low affinity for the degradation of the nucleoside triphosphates. Our results show that treatment of K-562 cells with imatinib mesylate for 24 h increased UDP hydrolysis in association with an increase in NTPDase5 expression, while treatment for 48 h and the resistance protocol decreased NTPDase5 expression. Of the enzymes investigated, only NTPDase5 is reportedly a proto-oncogene, also known as PCPH [45]. This enzyme presents an important association with the PI3K/PTEN and AKT signaling pathway [46]. These two pathways are related to the malignant transformation mediated by the BCR-ABL protein in CML. The proteomic and transcriptomic decrease of ENTPD5 was first identified during colon tumor progression from a normal colon through to colon adenoma and then to adenocarcinoma [47].
Ectonucleotidases are currently being studied as promising candidates for cancer immunotherapy and several studies have reported on the development of antibodies and inhibitors of CD39 and CD73 in animal models [11, 20, 48]. Our study also highlights the importance of understanding the role of purinergic signaling in CML, since its components could be modulated as a form of treatment.
In the scheme of Fig. 6, we suggested a possible mechanism by which the imatinib mesylate could modulate the expression of the NTPDases and CD73 enzymes. Panel 6a shows the presence of ectoenzymes in the leukemic cells before treatment with imatinib mesylate. After treatment with the drug for 24 h (Fig. 6b), we observed an increase in gene and protein expression of these enzymes, with consequent increase in ATP, ADP and AMP hydrolysis. However, in the resistant phenotype, where the imatinib mesylate is unable to interact, we did not observe the increase in the enzyme’s expression and activity, suggesting an involvement of imatinib in modulating ectonucleotidases in CML (Fig. 6c). However, we emphasize that this study provides the initial step towards understanding purinergic signaling in this leukemia and further studies investigating patient samples, as well as the fate of nucleotides and ectonucleotidases in resistance development are necessary.
Fig. 6.

Schematic illustration summarizing the influence of imatinib mesylate on the hydrolysis of nucleotides and the expression of ectonucleotidases in K-562 cells. (a) We emphasize that, regardless of the action of imatinib mesylate, enzymes participate in the pathology of chronic myeloid leukemia. (b) In the presence of imatinib mesylate for twenty-four hours of treatment occurs an increase in mRNA expression with consequently an increase in cell surface expression culminating in an increase in ATP hydrolysis. Already in the resistant phenotype, where the imatinib mesylate is unable to interact, we did not observe the increase in the enzymes expression and activity (c)
Electronic supplementary material
(DOCX 219 kb)
Acknowledgments
We thank Dr. Simone Cristina Baggio Gnoatto (PPGCF/UFRGS) for providing imatinib mesylate and PPGCF/UFRGS (Programa de Pós-graduação em Ciências Farmacêuticas da Universidade Federal do Rio Grande do Sul), PROPESQ/UFRGS (Pró-Reitoria de Pesquisa da Universidade Federal do Rio Grande do Sul and CAPES (Coordenação de Aperfeiçoamento de Pessoal de Nível Superior - Brasil) - Finance Code 001.
M.R.W is recipient of research fellowship from CNPq (Conselho Nacional de Desenvolvimento Científico e Tecnológico) and received support from CAPES, PROCAD (158819); ICGEB (405231/2015-6 MCTI/CNPq-ICGEB); and Fundação de Amparo à Pesquisa do Estado do Rio Grande do Sul (FAPERGS - Pronex 16/2551-0000473-0). This project was also supported by the Natural Sciences and Engineering Research Council of Canada (NSERC; RGPIN-2016-05867 to J.S.). J.S. was also the recipient of a “Chercheur National” Scholarship from the Fonds de Recherche du Québec-Santé (FRQS).
Compliance with ethical standards
Conflicts of interest
The authors declare that they have no conflict of interest.
Ethical approval
All procedures in this study were approved by the Ethics Committee of UFRGS (CEP/UFRGS) of the Universidade Federal de Rio Grande do Sul, under protocol number 1.979.570.
Footnotes
Publisher’s note
Springer Nature remains neutral with regard to jurisdictional claims in published maps and institutional affiliations.
References
- 1.Wagle M, Eiring AM, Wongchenko M, et al. A role for FOXO1 in BCR-ABL1-independent tyrosine kinase inhibitor resistance in chronic myeloid leukemia. Leukemia. 2016;30:1493–1501. doi: 10.1038/leu.2016.51. [DOI] [PMC free article] [PubMed] [Google Scholar]
- 2.Tamascar I, Ramanarayanan J. Targeted treatment of chronic myeloid leukemia: role of imatinib. Onco Targets Ther. 2009;2:63–71. doi: 10.2147/OTT.S3993. [DOI] [PMC free article] [PubMed] [Google Scholar]
- 3.Zhou T, Medeiros LJ, Hu S (2018) Chronic myeloid leukemia : beyond BCR-ABL1 [DOI] [PubMed]
- 4.Mitchell S, Ferdinand T, Batson S (2012) Treatments for chronic myeloid leukemia: a qualitative systematic review. J Blood Med 51. 10.2147/JBM.S33380 [DOI] [PMC free article] [PubMed]
- 5.Deininger MWN, Goldman JM, Melo JV, et al. The molecular biology of chronic myeloid leukemia. Review article. Mol Biol Chron Myeloid Leuk. 2013;96:3343–3356. [PubMed] [Google Scholar]
- 6.Illmer T, Schaich M, Platzbecker U, Freiberg-Richter J, Oelschlägel U, von Bonin M, Pursche S, Bergemann T, Ehninger G, Schleyer E. P-glycoprotein-mediated drug efflux is a resistance mechanism of chronic myelogenous leukemia cells to treatment with imatinib mesylate. Leukemia. 2004;18:401–408. doi: 10.1038/sj.leu.2403257. [DOI] [PubMed] [Google Scholar]
- 7.Begicevic RR, Falasca M (2017) ABC transporters in cancer stem cells: beyond chemoresistance. Int J Mol Sci 18. 10.3390/ijms18112362 [DOI] [PMC free article] [PubMed]
- 8.Ko BW, Han J, Heo JY, Jang Y, Kim SJ, Kim J, Lee MJ, Ryu MJ, Song IC, Jo YS, Kweon GR. Metabolic characterization of imatinib-resistant BCR-ABL T315I chronic myeloid leukemia cells indicates down-regulation of glycolytic pathway and low ROS production. Leuk Lymphoma. 2016;57:2180–2188. doi: 10.3109/10428194.2016.1142086. [DOI] [PubMed] [Google Scholar]
- 9.Burnstock G, Kennedy C (1985) Review is there a basis for distinguishing types of P2-purinoceptor? [DOI] [PubMed]
- 10.Di Virgilio F, Adinolfi E. Extracellular purines, purinergic receptors and tumor growth. Oncogene. 2017;36:293–303. doi: 10.1038/onc.2016.206. [DOI] [PMC free article] [PubMed] [Google Scholar]
- 11.Di Virgilio F, Sarti AC, Falzoni S, et al. Extracellular ATP and P2 purinergic signalling in the tumour microenvironment. Nat Rev Cancer. 2018;18:601–618. doi: 10.1038/s41568-018-0037-0. [DOI] [PubMed] [Google Scholar]
- 12.Zimmermann H. Ectonucleotidases: some recent developments and a note on nomenclature. Drug Dev Res. 2001;52:44–56. doi: 10.1002/ddr.1097. [DOI] [Google Scholar]
- 13.Robson SC, Sévigny J, Zimmermann H. The E-NTPDase family of ectonucleotidases: structure function relationships and pathophysiological significance. Purinergic Signal. 2006;2:409–430. doi: 10.1007/s11302-006-9003-5. [DOI] [PMC free article] [PubMed] [Google Scholar]
- 14.Beckenkamp A, Santana DB, Bruno AN, et al. Ectonucleotidase expression profile and activity in human cervical cancer cell lines. Biochem Cell Biol. 2014;92:95–104. doi: 10.1139/bcb-2013-0051. [DOI] [PubMed] [Google Scholar]
- 15.Cai XY, Wang XF, Li J, Dong JN, Liu JQ, Li NP, Yun B, Xia RL, Qin J, Sun YH. High expression of CD39 in gastric cancer reduces patient outcome following radical resection. Oncol Lett. 2016;12:4080–4086. doi: 10.3892/ol.2016.5189. [DOI] [PMC free article] [PubMed] [Google Scholar]
- 16.Stella J, Bavaresco L, Braganhol E, et al. Differential ectonucleotidase expression in human bladder cancer cell lines. Urol Oncol Semin Orig Investig. 2010;28:260–267. doi: 10.1016/j.urolonc.2009.01.035. [DOI] [PubMed] [Google Scholar]
- 17.Bertoni APS, de Campos RP, Tsao M, Braganhol E, Furlanetto TW, Wink MR. Extracellular ATP is differentially metabolized on papillary thyroid carcinoma cells surface in comparison to normal cells. Cancer Microenviron. 2018;11:61–70. doi: 10.1007/s12307-018-0206-4. [DOI] [PMC free article] [PubMed] [Google Scholar]
- 18.Dulphy N, Henry G, Hemon P, Khaznadar Z, Dombret H, Boissel N, Bensussan A, Toubert A. Contribution of CD39 to the immunosuppressive microenvironment of acute myeloid leukaemia at diagnosis. Br J Haematol. 2014;165:722–725. doi: 10.1111/bjh.12774. [DOI] [PubMed] [Google Scholar]
- 19.Schetinger MRC, Morsch VM, Bonan CD, Wyse ATS. NTPDase and 5′-nucleotidase activities in physiological and disease conditions: new perspectives for human health. BioFactors. 2007;31:77–98. doi: 10.1002/biof.5520310205. [DOI] [PubMed] [Google Scholar]
- 20.Guo W, Polich ED, Su J, Gao Y, Christopher DM, Allan AM, Wang M, Wang F, Wang G, Zhao X. HHS public access. Cell Rep. 2015;11:1651–1666. doi: 10.1080/10937404.2015.1051611.INHALATION. [DOI] [PMC free article] [PubMed] [Google Scholar]
- 21.Boyum A. Separation of lymphocytes, lymphocyte subgroups and monocytes: a review. Lymphology. 1977;10:71–76. doi: 10.1016/j.bushor.2014.08.001. [DOI] [PubMed] [Google Scholar]
- 22.Wang W, Zhang J, Li Y, Yang X, He Y, Li T, Ren F, Zhang J, Lin R. Divalproex sodium enhances the anti-leukemic effects of imatinib in chronic myeloid leukemia cells partly through SIRT1. Cancer Lett. 2015;356:791–799. doi: 10.1016/j.canlet.2014.10.033. [DOI] [PubMed] [Google Scholar]
- 23.Chan KM, Delfert D, Junger KD. A direct colorimetric assay for Ca2+-stimulated ATPase activity. Anal Biochem. 1986;157:375–380. doi: 10.1016/0003-2697(86)90640-8. [DOI] [PubMed] [Google Scholar]
- 24.Leal DBR, Streher CA, Neu TN, et al. Characterization of NTPDase (NTPDase1; ecto-apyrase; ecto-diphosphohydrolase; CD39; EC 3.6.1.5) activity in human lymphocytes. Biochim Biophys Acta Gen Subj. 2005;1721:9–15. doi: 10.1016/j.bbagen.2004.09.006. [DOI] [PubMed] [Google Scholar]
- 25.Bradford MM. A rapid and sensitive method for the quantitation of microgram quantities of protein utilizing the principle of protein-dye binding. Anal Biochem. 1976;72:248–254. doi: 10.1016/0003-2697(76)90527-3. [DOI] [PubMed] [Google Scholar]
- 26.Pelletier J, Agonsanou H, Delvalle N, Fausther M, Salem M, Gulbransen B, Sévigny J. Generation and characterization of polyclonal and monoclonal antibodies to human NTPDase2 including a blocking antibody. Purinergic Signal. 2017;13:293–304. doi: 10.1007/s11302-017-9561-8. [DOI] [PMC free article] [PubMed] [Google Scholar]
- 27.Munkonda MN, Pelletier J, Ivanenkov VV, Fausther M, Tremblay A, Künzli B, Kirley TL, Sévigny J. Characterization of a monoclonal antibody as the first specific inhibitor of human NTP diphosphohydrolase-3. FEBS J. 2009;276:479–496. doi: 10.1111/j.1742-4658.2008.06797.x. [DOI] [PMC free article] [PubMed] [Google Scholar]
- 28.Avilés-Vázquez S, et al. Global gene expression profiles of hematopoietic stem and progenitor cells from patients with chronic myeloid leukemia: the effect of in vitro culture with or without imatinib. Cancer Med. 2017;6(12):2942–2956. doi: 10.1002/cam4.1187. [DOI] [PMC free article] [PubMed] [Google Scholar]
- 29.Bono S, Dello Sbarba P, Lulli M. Imatinib-mesylate enhances the maintenance of chronic myeloid leukemia stem cell potential in the absence of glucose. Stem Cell Res. 2018;28:33–38. doi: 10.1016/j.scr.2018.01.038. [DOI] [PubMed] [Google Scholar]
- 30.Arrigoni E, Del Re M, Galimberti S, et al. Concise review: chronic myeloid leukemia: stem cell niche and response to pharmacologic treatment. Stem Cells Transl Med. 2018;7:305–314. doi: 10.1002/sctm.17-0175. [DOI] [PMC free article] [PubMed] [Google Scholar]
- 31.Curtarelli RB, Gonçalves JM, dos Santos LGP, et al. Expression of cancer stem cell biomarkers in human head and neck carcinomas: a systematic review. Stem Cell Rev Rep. 2018;14:769–784. doi: 10.1007/s12015-018-9839-4. [DOI] [PubMed] [Google Scholar]
- 32.Gottesman MM, Fojo T, Bates SE. Multidrug resistance in cancer: role of Atp-dependent transporters. Nat Rev Cancer. 2002;2:48–58. doi: 10.1080/02791072.1995.10472466. [DOI] [PubMed] [Google Scholar]
- 33.Kosztyu P, Bukvova R, Dolezel P, Mlejnek P. Resistance to daunorubicin, imatinib, or nilotinib depends on expression levels of ABCB1 and ABCG2 in human leukemia cells. Chem Biol Interact. 2014;219:203–210. doi: 10.1016/j.cbi.2014.06.009. [DOI] [PubMed] [Google Scholar]
- 34.Bastid J, Regairaz A, Bonnefoy N, Déjou C, Giustiniani J, Laheurte C, Cochaud S, Laprevotte E, Funck-Brentano E, Hemon P, Gros L, Bec N, Larroque C, Alberici G, Bensussan A, Eliaou JF. Inhibition of CD39 enzymatic function at the surface of tumor cells alleviates their immunosuppressive activity. Cancer Immunol Res. 2015;3:254–265. doi: 10.1158/2326-6066.CIR-14-0018. [DOI] [PubMed] [Google Scholar]
- 35.Salvestrini V, Zini R, Rossi L, Gulinelli S, Manfredini R, Bianchi E, Piacibello W, Caione L, Migliardi G, Ricciardi MR, Tafuri A, Romano M, Salati S, di Virgilio F, Ferrari S, Baccarani M, Ferrari D, Lemoli RM. Purinergic signaling inhibits human acute myeloblastic leukemia cell proliferation, migration, and engraftment in immunodeficient mice. Blood. 2012;119:217–226. doi: 10.1182/blood-2011-07-370775. [DOI] [PubMed] [Google Scholar]
- 36.Ledderose C, Woehrle T, Ledderose S, Strasser K, Seist R, Bao Y, Zhang J, Junger WG. Cutting off the power: inhibition of leukemia cell growth by pausing basal ATP release and P2X receptor signaling? Purinergic Signal. 2016;12:439–451. doi: 10.1007/s11302-016-9510-y. [DOI] [PMC free article] [PubMed] [Google Scholar]
- 37.Zanini D, Schmatz R, Pelinson LP, Pimentel VC, da Costa P, Cardoso AM, Martins CC, Schetinger CC, Baldissareli J, do Carmo Araújo M, Oliveira L, Chiesa J, Morsch VM, Leal DB, Schetinger MR. Ectoenzymes and cholinesterase activity and biomarkers of oxidative stress in patients with lung cancer. Mol Cell Biochem. 2013;374:137–148. doi: 10.1007/s11010-012-1513-6. [DOI] [PubMed] [Google Scholar]
- 38.Figueiró F, de Oliveira CP, Bergamin LS, Rockenbach L, Mendes FB, Jandrey EH, Moritz CE, Pettenuzzo LF, Sévigny J, Guterres SS, Pohlmann AR, Battastini AM. Methotrexate up-regulates ecto-5′-nucleotidase/CD73 and reduces the frequency of T lymphocytes in the glioblastoma microenvironment. Purinergic Signal. 2016;12:303–312. doi: 10.1007/s11302-016-9505-8. [DOI] [PMC free article] [PubMed] [Google Scholar]
- 39.Tada Y, Yokomizo A, Shiota M, Song Y, Kashiwagi E, Kuroiwa K, Oda Y, Naito S. Ectonucleoside triphosphate diphosphohydrolase 6 expression in testis and testicular cancer and its implication in cisplatin resistance. Oncol Rep. 2011;26:161–167. doi: 10.3892/or.2011.1274. [DOI] [PubMed] [Google Scholar]
- 40.Braganhol E, Morrone FB, Bernardi A, Huppes D, Meurer L, Edelweiss MI, Lenz G, Wink MR, Robson SC, Battastini AM. Selective NTPDase2 expression modulates in vivo rat glioma growth. Cancer Sci. 2009;100:1434–1442. doi: 10.1111/j.1349-7006.2009.01219.x. [DOI] [PMC free article] [PubMed] [Google Scholar]
- 41.Braganhol E, Zanin RF, Bernardi A, Bergamin LS, Cappellari AR, Campesato LF, Morrone FB, Campos MM, Calixto JB, Edelweiss MI, Wink MR, Sévigny J, Robson SC, Battastini AM. Overexpression of NTPDase2 in gliomas promotes systemic inflammation and pulmonary injury. Purinergic Signal. 2012;8:235–243. doi: 10.1007/s11302-011-9276-1. [DOI] [PMC free article] [PubMed] [Google Scholar]
- 42.Wink MR, Braganhol E, Tamajusuku ASK, Lenz G, Zerbini LF, Libermann TA, Sévigny J, Battastini AM, Robson SC. Nucleoside triphosphate diphosphohydrolase-2 (NTPDase2/CD39L1) is the dominant ectonucleotidase expressed by rat astrocytes. Neuroscience. 2006;138:421–432. doi: 10.1016/j.neuroscience.2005.11.039. [DOI] [PubMed] [Google Scholar]
- 43.Buffon A, Wink MR, Ribeiro BV, et al. NTPDase and 5′ ecto-nucleotidase expression profiles and the pattern of extracellular ATP metabolism in the Walker 256 tumor. Biochim Biophys Acta - Gen Subj. 2007;1770:1259–1265. doi: 10.1016/j.bbagen.2007.05.004. [DOI] [PubMed] [Google Scholar]
- 44.Buffon A, Ribeiro VB, Wink MR, Casali EA, Sarkis JJ. Nucleotide metabolizing ecto-enzymes in Walker 256 tumor cells: molecular identification, kinetic characterization and biochemical properties. Life Sci. 2007;80:950–958. doi: 10.1016/j.lfs.2006.11.024. [DOI] [PubMed] [Google Scholar]
- 45.Bracco PA, Bertoni APS, Wink MR (2014, 2014) NTPDase5/PCPH as a new target in highly aggressive tumors: a systematic review. Biomed Res Int. 10.1155/2014/123010 [DOI] [PMC free article] [PubMed]
- 46.Páez JG, Recio JA, Rouzaut A, Notario V. Identity between the PCPH proto-oncogene and the CD39L4 (ENTPD5) ectonucleoside triphosphate diphosphohydrolase gene. Int J Oncol. 2001;19:1249–1254. doi: 10.3892/ijo.19.6.1249. [DOI] [PubMed] [Google Scholar]
- 47.Mikula M, Rubel T, Karczmarski J, et al. Integrating proteomic and transcriptomic high-throughput surveys for search of new biomarkers of colon tumors. Funct Integr Genomics. 2011;11:215–224. doi: 10.1007/s10142-010-0200-5. [DOI] [PubMed] [Google Scholar]
- 48.Gareau AJ, Brien C, Gebremeskel S, Liwski RS, Johnston B, Bezuhly M. Ticagrelor inhibits platelet–tumor cell interactions and metastasis in human and murine breast cancer. Clin Exp Metastasis. 2018;35:25–35. doi: 10.1007/s10585-018-9874-1. [DOI] [PubMed] [Google Scholar]
Associated Data
This section collects any data citations, data availability statements, or supplementary materials included in this article.
Supplementary Materials
(DOCX 219 kb)