

Abstract
Background
Human parainfluenza virus (HPIV), usually combined with other pathogens, causes lower respiratory tract infection (LRTI) in children. However, clinical characteristics of HPIV coinfection with other pathogens were unclear. This study aimed to investigate the viral and atypical bacterial etiology of LRTI in children and compare the clinical characteristics of HPIV single infection with those of coinfection.
Methods
This study included 1335 patients, aged between 1 to 71 months, diagnosed with LRTI in Yuying Children's Hospital, Zhejiang, China, from December 2013 to June 2015. Nasopharyngeal secretions were collected, and respiratory pathogens were detected using Multiplex polymerase chain reaction. The clinical data of patients were collected and analyzed.
Results
At least 1 pathogen was detected in 1181/1335 (88.5%) patients. The pathogens identified most frequently were respiratory syncytial virus, human rhinovirus, HPIV, adenovirus, and human metapneumovirus. The coinfection rate was 24.8%. HPIV coinfection with other viruses was more associated with running nose, shortness of breath, and oxygen support compared with HPIV single infection. Moreover, HPIV coinfection with atypical bacteria was more related to running nose, moist rales, and longer hospital duration compared with HPIV single infection, and also to longer hospital duration compared with coinfection with other viruses.
Conclusions
This study demonstrated that viral infections were highly associated with LRTI and the rate of coinfection was high. HPIV single infection was milder than coinfection with other viruses. Moreover, HPIV coinfection with atypical bacteria was more serious than HPIV single infection and coinfection with other viruses.
Keywords: children, clinical characteristics, coinfection, human parainfluenza virus, lower respiratory tract infection
Highlights
Viral infections are highly associated with lower respiratory tract infection and the rate of coinfection is high.
HPIV single infection was milder than coinfection with other viruses.
HPIV coinfection with atypical bacteria was more serious than HPIV single infection and coinfection with other viruses.
1. INTRODUCTION
Lower respiratory tract infection (LRTI) is one of the top five causes of death in children aged less than 5 years.1 Various pathogens cause LRTIs. However, pathogen detection in the initial stage of disease has long been a serious challenge, limiting the guiding function of pathogen detection. In 2008, the xTAG RVP assay based on polymerase chain reaction (PCR), which allowed the simultaneous detection of 12 respiratory viruses, was approved by the Food and Drug Administration.2 Since then, an increasing number of commercialized multiplex PCR kits have been developed, allowing the simultaneous detection of a large panel of viruses and atypical bacteria in clinical practice.3 Several studies used this molecular diagnostic tool to show that viral infections accounted for a large proportion of LRTIs. In addition, mixed infections were identified frequently.4, 5, 6
Several studies discussed the clinical characteristics of coinfection compared with single virus infection, but most of them analyzed on a general basis or focused solely on respiratory syncytial virus (RSV).5, 6, 7 As one of the most common pathogens of LRTI, human parainfluenza virus (HPIV) is found worldwide, especially in children aged less than 5 years.8 HPIV can cause severe respiratory infection and accounts for 9 to 30% inpatient children admitted due to acute respiratory infection.9 An increasing number of recent studies focused on HPIV, especially the epidemiology and presentation of four types of HPIV.10 However, a few studies discussed coinfections with HPIV. Therefore, this study aimed to investigate the viral and atypical bacterial etiology of LRTI in children and compare the clinical characteristics of HPIV single infection with those of coinfection.
2. METHODS
2.1. Clinical data
This study was performed on LRTIs in children requiring hospitalization. It was conducted prospectively at the Pediatric Respiratory Department of Yuying Children's Hospital affiliated to Wenzhou Medical University, Zhejiang, China, from December 2013 to June 2015.
The inclusion criteria for this study were as follows: (1) children aged between 1 to 71 months; (2) hospitalization during the study period; (3) within 7 days of the disease at admission; and (4) a diagnosis of LRTI. The exclusion criteria for this study were as follows: (1) failure of PCR or insufficient sample and (2) incomplete clinical data. Patients with positive bacterial culture were excluded while analyzing the impact of HPIV single infection and coinfection. HPIV‐positive patients were divided into three groups based on the test results: HPIV single infection, coinfection with other viruses, and coinfection with atypical bacteria. The diagnosis of LRTI for each patient was performed by at least two attending physicians based on Zhu Futang Practice of Pediatrics, 8th edition.11 It was defined according to the clinical symptoms, including severe cough, fever, tachypnea, wheezing, and respiratory distress signs such as nasal flaring, retraction, cyanosis, and abnormal auscultatory findings (wheezing and crackles), or radiologic evidence indicative of an LRTI. Clinical syndromes of bronchitis, bronchiolitis, and pneumonia were included in the LRTI category. Bronchitis was diagnosed based on the clinical manifestations including severe cough with or without fever, symmetrical breath sounds without permanent rales on auscultation, and increased bronchovascular shadows in chest X‐ray examination. Bronchiolitis was recognized in patients aged <24 months with lower respiratory symptoms of wheezing, tachypnea, and signs of respiratory distress such as nasal flaring, intercostal/subcostal retractions, and central cyanosis. The diagnosis of pneumonia was established based on clinical findings, including fever, tachypnea, and respiratory distress, with the presence of focal or diffuse crackles, decreased vesicular sounds, and radiographic findings such as patchy and macular shadows and/or atelectasis, and/or air bronchograms. The pertussis‐like cough was defined based on clinical signs including spasmodic cough, inspiratory whoop, and posttussive vomiting. Data included demographic information, subjective symptoms, physical examination findings, hospital course and management, radiographic findings, and laboratory results.
2.2. Collection of respiratory tract specimens and multiplex PCR detection
Nasopharyngeal secretions or sputum was obtained by sputum suction within 24 hours at entry. Pathogens were detected using advanced fragment analysis (AFA) based on multiplex PCR12 provided by Ningbo Health Gene Technologies Ltd (Ningbo, China). The tested respiratory tract pathogens were influenza A virus (InfA, including pandemic influenza A virus‐2009 [09H1] and seasonal H3N2 virus [H3]), influenza B virus (InfB), RSV, adenoviruses (ADV), human rhinovirus (HRV), human bocavirus (HBoV), human metapneumovirus (HMPV), HPIV (including HPIV‐1, 2, 3, and 4), human coronavirus (HCoV, including OC43, 229E, NL63, and HKU1), Chlamydia (Ch, including Chlamydia trachomatis and Chlamydia pneumoniae), and Mycoplasma pneumoniae (MP). The details are provided in the Supporting Information Material.
2.3. Statistical analysis
The data were analyzed using SPSS (version 17.0; SPSS, Inc., IL). They were expressed as mean, standard deviation, median, quartile, frequency, and percentage. Continuous variables with a normal distribution were compared using analysis of variance, whereas other variables were compared using the Mann‐Whitney U test. The categorical data were evaluated using the χ 2 and Fisher's exact tests. A P value less than .05 was considered statistically significant (two‐tailed).
2.4. Ethics statement
The study was submitted to the local ethics committee for approval. Oral information was given together with a paper explaining the content of the study. A consent form was signed by a parent or legal guardian before the inclusion of each patient in the study.
3. RESULTS
3.1. Pathogen detection
The flow of the study is depicted in Figure 1. A total of 1335 patients were enrolled in this study. The median age was 9 months (interquartile range, 4‐24 months) and ranged from 1 month to 71 months. The male‐to‐female ratio was 2:1. Among 1335 patients, 1181 (88.5%) were positive for at least 1 virus or atypical bacteria. The positive rate in children aged 1 to 11 months,12 to 35 months, and 36 to 71 months was 88.5% (684/773), 91.4% (352/385), and 81.9% (145/177), respectively. Children aged l to 11 months and 12 to 35 months had a higher positive rate compared with children aged 36 to 71 months (χ 2 = 5.586; P = .018; χ 2 = 10.716; P = .001). Viral infection was found in 1138 patients (85.2%). The pathogens identified most frequently were RSV, HRV, HPIV, ADV, and HMPV (Table 1). The total coinfection rate was 24.8%. HCoV showed the highest coinfection rate of 65.0%, followed by InfB (63.9%), HBoV (59.3%), ADV (56.5%), and HRV (51.7%).
Figure 1.
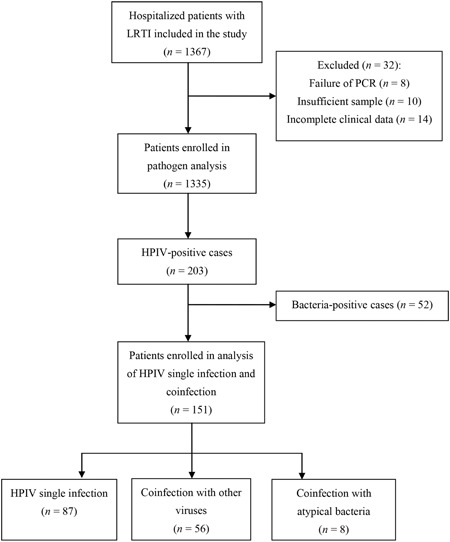
Flow chart of the study. HPIV, human parainfluenza virus; LRTI, lower respiratory tract infection; PCR, polymerase chain reaction
Table 1.
Detection of respiratory pathogens using AFA
| Number of positive samples of potential pathogens | ||||||||||||
|---|---|---|---|---|---|---|---|---|---|---|---|---|
| Pathogen | HPIV | InfA | InfB | HRV | RSV | HMPV | HCoV | ADV | HBoV | MP | Ch | Positive rate (%) |
| HPIV | 203 | 3 | 5 | 39 | 17 | 4 | 9 | 13 | 8 | 10 | 3 | 15.2 |
| InfA | 67 | 6 | 7 | 9 | 2 | 0 | 0 | 2 | 2 | 1 | 5.0 | |
| InfB | 36 | 2 | 7 | 1 | 0 | 2 | 0 | 1 | 0 | 2.7 | ||
| HRV | 414 | 90 | 23 | 11 | 32 | 18 | 22 | 8 | 31.0 | |||
| RSV | 440 | 5 | 5 | 18 | 7 | 4 | 2 | 33.0 | ||||
| HMPV | 93 | 2 | 4 | 2 | 1 | 0 | 7.0 | |||||
| HCoV | 40 | 4 | 2 | 2 | 0 | 3.0 | ||||||
| ADV | 115 | 5 | 2 | 1 | 8.6 | |||||||
| HBoV | 54 | 0 | 0 | 4.0 | ||||||||
| MP | 69 | 0 | 5.2 | |||||||||
| Ch | 25 | 1.9 | ||||||||||
| 1 Pathogen a | 110 | 43 | 13 | 200 | 299 | 56 | 14 | 50 | 22 | 30 | 13 | 63.7 |
| 2 Pathogens b | 77 | 18 | 18 | 185 | 122 | 31 | 17 | 50 | 22 | 35 | 9 | 21.9 |
| 3 Pathogens c | 13 | 4 | 4 | 25 | 15 | 5 | 9 | 13 | 8 | 3 | 3 | 2.5 |
| ≥4 Pathogens d | 3 | 2 | 1 | 4 | 4 | 1 | 0 | 2 | 2 | 1 | 0 | 0.4 |
| Coinfection rate (%) e | 45.8 | 35.8 | 63.9 | 51.7 | 32.0 | 39.8 | 65.0 | 56.5 | 59.3 | 56.5 | 48.0 | 24.8 f |
Note: Boldface indicates total numbers of pathogens detected.
Abbreviations: ADV, adenovirus; AFA, advanced fragment analysis; Ch, chlamydia; HBoV, human bocavirus; HCoV, human coronavirus; HMPV, human metapneumovirus; HPIV, human parainfluenza virus; HRV, human rhinovirus; InfA, influenza A virus; InfB, influenza B virus; RSV, respiratory syncytial virus; MP, mycoplasma pneumoniae.
The number of single infection of a certain pathogen.
The number of certain pathogen coinfected with another pathogen.
The number of certain pathogen coinfected with other two pathogens.
The number of certain pathogen coinfected with more than two pathogens.
The coinfection rate of certain pathogen.
The total coninfection rate of all the detected pathogens.
This article is being made freely available through PubMed Central as part of the COVID-19 public health emergency response. It can be used for unrestricted research re-use and analysis in any form or by any means with acknowledgement of the original source, for the duration of the public health emergency.
3.2. HPIV infection
Among the 203 HPIV‐positive patients (55 female [27.1%] and 148 male [72.9%]), the median age at enrollment was 7 months (interquartile range, 3–13 months), ranging from 1 month to 71 months. A total of 32 (15.8%) among 203 patients had underlying diseases. Demographics of all the HPIV‐positive patients are shown in Table 2. The positive rate of HPIV in children aged 1 to 11 months, 12 to 35 months, and 36 to 71 months was 17.5% (135/773), 15.1% (58/385), and 5.6% (10/177), respectively. Further comparison revealed that children aged 1 to 11 months and 12 to 35 months had higher positive rates compared with children aged 36 to 71 months (χ 2 = 15.544; P < .001; χ 2 = 10.106; P = .001). No significant difference in the positive rate was observed between children aged 1 to 11 months and 12 to 35 months.
Table 2.
Demographics of all HPIV‐positive patients (n = 203)
| Characteristics | n (%) |
|---|---|
| Male sex | 148(72.9) |
| Age group | |
| Infant (1 to 11 m) | 135 (66.5) |
| Toddler (12 to 35 m) | 58 (28.6) |
| Preschool (36 to 71 m) | 10 (4.9) |
| Underlying diseases | 32(15.8) |
| Atrial septal defect | 14(6.9) |
| Ventricular septal defect | 4 (2.0) |
| Patent ductus arteriosus | 4(2.0) |
| Tracheobronchomalacia | 4(2.0) |
| Bronchial asthma | 2(1.0) |
| Malnutrition | 2(1.0) |
| Congenital laryngeal stridor | 2(1.0) |
| Bronchial pulmonary hypoplasia | 1(0.5) |
| Kawasaki disease | 1(0.5) |
| Decrease in thyroid function | 1(0.5) |
| Lack of selective immunoglobulin A | 1(0.5) |
Abbreviation: HPIV, human parainfluenza virus.
This article is being made freely available through PubMed Central as part of the COVID-19 public health emergency response. It can be used for unrestricted research re-use and analysis in any form or by any means with acknowledgement of the original source, for the duration of the public health emergency.
3.3. HPIV single infection and coinfection
The percentage of HPIV single infection, coinfection with bacteria, coinfection with other virus, coinfection with atypical bacteria, and multiple infection was 42.9% (87/203), 11.3% (23/203), 27.6% (56/203), 3.9% (8/203), and 14.3% (29/203), respectively. The highest rate of virus coinfection with HPIV was HRV (19.2%, 39/203), followed by RSV (8.4%, 17/203), ADV (6.4%, 13/203), HCoV (4.4%, 9/203), HBoV (3.9%, 8/203), InfB (2.5%, 5/203), HMPV (2.0%, 4/203), and InfA (1.5%, 3/203).
HPIV single infection was the most common in all age groups, following by coinfection with other viruses. In patients aged 1 to 11 months, 12 to 35months, 36 tp 71months, HPIV coinfection with other viruses accounted for 25.9% (35/135), 32.8%(19/58), and 20%(2/10), respectively. And 20% (2/10) of patients aged 36 to 71months were coinfected with atypical bacteria, which was far more than that in the other two groups (Figure 2). A total of 52 bacteria‐positive patients were excluded. No statistically significant differences were observed in terms of gender, birth weight, preterm/full term, and underlying diseases (Table 3).
Figure 2.
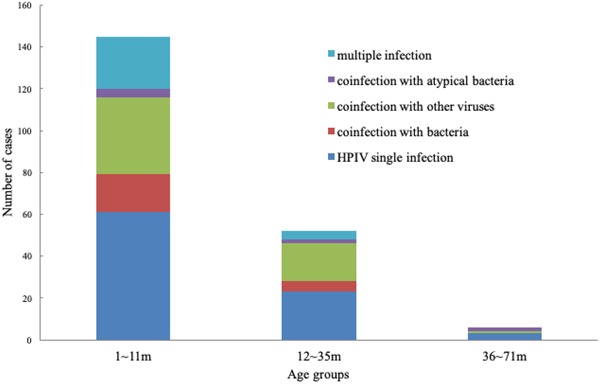
Distribution of infection status in HPIV‐positive patients according to age. HPIV, human parainfluenza virus
Table 3.
Demographic data of HPIV‐positive patients
| HPIV single infection n = 87 | Coinfection with other viruses n = 56 | Coinfection with atypical bacteria, n = 8 | χ 2/F | P | |
|---|---|---|---|---|---|
| Sex | |||||
| Male | 65(74.7) | 43(76.8) | 4(50.0) | 2.653 | 0.265 |
| Female | 22(25.3) | 13(23.2) | 4(50.0) | ||
| Age | |||||
| 1‐11 m | 58(66.7) | 35(62.5) | 3(37.5) | 5.037 | 0.283 |
| 12‐35 m | 25(28.7) | 19(33.9) | 3(37.5) | ||
| 36‐71 m | 4(4.6) | 2(3.6) | 2(25.0) | ||
| Birth weight a | 3.27 ± 0.65 | 3.27 ± 0.53 | 3.61 ± 0.66 | 1.218 | 0.299 |
| Preterm | 14(16.1) | 7(12.5) | 0(0.0) | 1.732 | 0.421 |
| Underlying diseases | 14(16.1) | 10(17.9) | 0(0) | 1.676 | 0.433 |
Abbreviations: HPIV, human parainfluenza virus.
The birth weight was measured in kilograms. The data were expressed as mean ± standard deviation. The others were numbers (%) of each group.
This article is being made freely available through PubMed Central as part of the COVID-19 public health emergency response. It can be used for unrestricted research re-use and analysis in any form or by any means with acknowledgement of the original source, for the duration of the public health emergency.
The clinical characteristics of HPIV‐positive patients were compared(Table 4). The most common diagnosis was pneumonia, followed by bronchiolitis and bronchitis. A few patients (5.4‐12.5%) in each group had a pertussis‐like cough. HPIV coinfection with other viruses was more associated with running nose and shortness of breath (χ 2 = 5.235; P = 0.022; χ 2 = 7.87; P = 0.005), and more patients needed oxygen support (χ 2 = 6.539; P = 0.011) compared with HPIV single infection. Neutrophil percentage was higher in coinfection with viruses than in HPIV single infection (χ 2 = 5.744; P = 0.017). Moreover, HPIV coinfection with atypical bacteria was more related to running nose (χ 2 = 6.511; P = 0.011), moist rales (χ 2 = 5.167; P = 0.023), and longer hospital duration (χ 2 = 5.904; P = 0.015) compared with HPIV single infection, and also to longer hospital duration compared with coinfection with other viruses (χ 2 = 4.847; P = 0.028).
Table 4.
Clinical characteristics of HPIV‐positive patients
| HPIV single infection n = 87 | Coinfection with other viruses n = 56 | Coinfection with atypical bacteria n = 8 | χ 2 | P | |
|---|---|---|---|---|---|
| Diagnosis | |||||
| Bronchitis | 9 (10.3) | 4 (7.1) | 0 (0) | 4.731 | 0.316 |
| Bronchiolitis | 31 (35.6) | 21 (37.5) | 1 (12.5) | ||
| Pneumonia | 47 (54.0) | 31 (55.4) | 7 (87.5) | ||
| Symptoms | |||||
| Fever | 54 (62.1) | 34 (60.7) | 6 (75.0) | 0.645 | 0.724 |
| Productive cough | 75 (86.2) | 53 (94.6) | 7 (87.5) | 2.592 | 0.274 |
| Pertussis‐like cough | 7 (8.0) | 3 (5.4) | 1 (12.5) | 0.679 | 0.712 |
| Running nose | 15 (17.2) | 19 (33.9) | 5 (62.5) | 10.883 | 0.004 |
| Vomit or diarrhea | 23 (26.4) | 14 (25.0) | 1 (12.5) | 0.757 | 0.685 |
| Shortness of breath | 6 (6.9) | 13 (23.2) | 0 (0) | 9.463 | 0.009 |
| Cyanosis | 3 (3.4) | 2 (3.6) | 0 (0) | 0.555 | 0.758 |
| Cough duration a | 11.0 (8.0,15.0) | 13.0 (9.0,19.0) | 13.5 (13.0,17.8) | 3.962 | 0.138 |
| Wheezing duration a | 7.0(0.0,10.0) | 6.0 (0.0,11.0) | 2.5 (0.0,4.0) | 2.727 | 0.256 |
| Fever duration a | 1.0(0.0,4.0) | 1.0 (0.0,4.0) | 5.0 (0.5,7.0) | 2.845 | 0.241 |
| Physical examination | |||||
| Three depression signs b | 6 (6.9) | 8 (14.3) | 0(0) | 3.075 | 0.215 |
| Moist rale | 34 (39.1) | 30 (53.6) | 7(87.5) | 8.994 | 0.011 |
| Wheezing rale | 58 (66.7) | 39 (69.6) | 6(75.0) | 0.319 | 0.853 |
| Treatment | |||||
| Oxygen therapy | 6 (6.9) | 12 (21.4) | 0 (0) | 7.996 | 0.018 |
| Duration of steroid therapy a | 0.0 (0.0,4.0) | 0.0 (0.0,5.0) | 2.5 (0.0,4.0) | 1.659 | 0.436 |
| ICU duration a | 0.0 (0.0,0.0) | 0.0 (0.0,0.0) | 0.0 (0.0,0.0) | 0.736 | 0.692 |
| Hospital duration a | 6.0 (4.0, 7.0) | 6.0 (4.0, 7.0) | 8.0 (6.0, 9.8) | 5.932 | 0.049 |
| Laboratory examination | |||||
| PCT>0.5 ng/mL | 6 (9.7) | 3 (6.7) | 0 (0) | 1.667 | 0.434 |
| Peak of WBC count c | 9.8 (7.4, 12.5) | 10.5 (8.1, 13.7) | 9.6 (7.8, 16.6) | 2.253 | 0.324 |
| Neutrophil percentage | 33.9 (23.3, 48.6) | 42.3 (32.1, 58.3) | 53.4 (32.0, 59.8) | 7.296 | 0.026 |
| Peak CRP d level | 4.0 (2.0, 6.3) | 6.0 (2.1, 10.8) | 6.5 (1.9, 30.5) | 2.701 | 0.259 |
| Leukocytosis e | 24 (27.6) | 21 (37.5) | 2 (25.0) | 1.710 | 0.425 |
| CRP increase f | 18 (20.7) | 18 (32.1) | 3 (37.5) | 2.934 | 0.231 |
| Leukopenia g | 9 (10.3) | 4 (7.1) | 1 (12.5) | 0.520 | 0.771 |
Abbreviations: CRP, C‐reactive protein; HPIV, human parainfluenza virus; PCT, procalcitonin; WBC, white blood cell.
Boldface indicates a P value of less than 0.05.
The duration was measured in days.
Three depression sighs were described as supraclavicular, suprasternal, or intercostal/subcostal retractions.
The unit for peak and bottom of WBC was 109/L; the normal value was 4–12 × 109/L.
The unit for CRP was mg/L; the normal value was 0–8 mg/L.
Leukocytosis was defined as WBC more than 12 × 109/L.
CRP increase was defined as CRP more than 8 mg/L.
Leukopenia was defined as WBC less than 4 × 10⁹/L. The quantitative data were expressed as median(quartile). The count data were expressed as numbers (%) of each group.
This article is being made freely available through PubMed Central as part of the COVID-19 public health emergency response. It can be used for unrestricted research re-use and analysis in any form or by any means with acknowledgement of the original source, for the duration of the public health emergency.
4. DISCUSSION
A total of 1335 samples were tested for respiratory pathogens in the present study. The viruses positive rate was 85.2%. In studies performed in other countries, the number varied from 62.4% to 81.8%.4, 5, 13, 14, 15 Viral infection has reached a consensus as the most common cause of respiratory tract illness. Several factors may lead to the diversity in the positive rate, such as the standard of enrollment, region, season, pathogen spectrum, and detection method.
The most frequently identified virus in this study was RSV (33.0%), followed by HRV (31.0%), HPIV (15.2%), ADV (8.6%), and HMPV (7.0%). This result was in line with the findings of other studies that investigated the etiology of acute respiratory infection (ARI) in hospitalized children.5, 16, 17, 18 HPIV was the third most frequent pathogen detected in the present study. MP‐ and Ch‐positive rate were low (5.2% and 1.9%, respectively) in the present study, indicating that they are not common pathogens in young children.
This study revealed a high coinfection detection rate of 24.8%. The previously reported rate was 18 to 65% in patients with ARI.4, 5, 17, 19 It appears that coinfections are related to the prolonged period of viral persistence in the mucosa of the respiratory tract.20 The large difference in the coinfection rate is probably due to the age and severity of patients enrolled. Infants and toddlers have an extremely high rate of virus coinfection compared with older children and adults.19
Singleton et al21 suggested that HPIV caused LRTI in hospitalized children, with a positive rate of 18%, which was in line with the value in the present study (15.2%). HPIV coinfection was high in the present study, accounting for 57.1% of all the HPIV infections. Coinfection with virus took the major part, of which HRV, RSV, and ADV were the most frequently detected agents. The fastest growing virus HRV was most commonly found in combination with HPIV, possibly due to the same age and seasonal distribution and the specific characteristics of the two viruses.18, 22 Children aged less than 3 years had a higher positive rate of HPIV compared with children older than 3 years, indicating that young children are vulnerable to respiratory infection.15, 16, 17 Only eight patients were coinfected with HPIV and atypical bacteria in the present study. One hypothesis to explain the relative paucity of the codetections is that infections with these pathogens exhibit different age and seasonal distributions.
Several studies focused on the association between the severity of illness and coinfection, but no consensus has been reached. Some studies showed that viral coinfection did not increase severity,17, 23 some studies indicated that virus single infection increased the risk of severe situations,24 while others suggested that patients with dual or mixed respiratory virus infections had an increased risk of being admitted to a general ward or intensive care unit (ICU) or having longer hospital stays.7, 25, 26, 27 These contradictory conclusions might indicate the necessity for further investigations, especially for specific viruses.
A few studies focused on the clinical features of HPIV coinfection with specific pathogens. This study analyzed HPIV single infection, coinfection with other viruses, and coinfection with atypical bacteria. In the present study, most HPIV‐positive patients had a mild clinical presentation, and only one patient had ICU experience. Coinfection with other viruses was associated with running nose and shortness of breath, and more patients needed oxygen inhalation compared with patients with HPIV single infection. This indicated the mild presentation of HPIV single infection compared with that of coinfection with other viruses. However, another study found no difference.10 Many factors may be responsible for the absolute opposite conclusions, such as specific viruses involved in coinfection, order of infection, and number of viruses. Controlling these factors may be possible in an in vitro study, but this scenario is highly unlikely in patients. To date, a few experimental studies have been conducted on simultaneous respiratory infections, especially those caused by HPIV. It has long been known that simultaneous viral infections exhibit a phenomenon called viral interference, in which one virus blocks the growth of another virus.28 The effect depends on the virus causing the primary infection,29 number of viruses used to initiate an infection,30 speed of virus replication, and delay between initial and secondary infections.22 A study found that rhinovirus, the fastest‐growing virus, reduced the replication of the remaining viruses during a coinfection, while the replication of parainfluenza virus, the slowest‐growing virus, was suppressed in the presence of other viruses.22 An early infection and a high number of viruses promote coinfection.22 Therefore, further studies should focus on the coinfection of specific viruses and confirm the course of virus infection.
HPIV has four subtypes. HPIV3 manifests the major part of HPIV.17 The tropism of HPIV1‐4 are different with each other. HPIV1 and HPIV2 are more likely to induce stridor and croup, while HPIV3 and HPIV4 have similar clinical presentations, and are more associated with hypoxia.31, 32 A study compared the clinical manifestations between HPIV3 and HPIV4 single infection and coinfection groups respectively, found no difference between the two groups. They did not compare the clinical manifestations of HPIV1 and HPIV2 due to the low number cases.33 However, further classification of HPIV subtypes was not done in the present study. The severity of HPIV1‐4 coinfection remains unclear.
Neutrophilia were most commonly detected in patients with ADV and HRV.17 Meanwhile, HRV, RSV, and ADV were the most frequent agents detected in coinfection. It might explain the result that neutrophil percentage in coinfection with viruses was higher than that in HPIV single infection. Another study found that the percentage of neutrophils was lower among children with single virus infection compared with mixed viruses and mixed virus/bacteria infection.34 This might suggest it was a common phenomenon that coinfection increased the percentage of neutrophils. The mechanism needs further study.
Compared with HPIV single infection, coinfection with atypical bacteria was more related to running nose, moist rales, and longer hospital duration. Coinfection with atypical bacteria was also associated with longer hospital duration compared with coinfection with other viruses. It might indicate that HPIV coinfection with atypical bacteria led to more serious situations. Children with a viral coinfection with mycoplasma had significantly higher rates of running nose,35 which might manifest the synergistic effect on running nose of the two kinds of pathogens. Coinfection with atypical bacteria was more related to moist rales, contrary to the typical clinical features of atypical bacteria single infection. Few studies have explored the coinfection with atypical bacteria. Hence, further studies are needed to confirm the findings.
The present study had several limitations. Children were evaluated at a single center and the number of patients enrolled was small, limiting the validity of virus‐specific clinical correlations in other settings. Also, the study was not double blind. In addition, the study lacked further division of HPIV 1 to 4 and analyses of the clinical characteristics of coinfection with bacteria. Last but not least, the study lacked long‐term follow‐up information.
In conclusion, this study demonstrated viral infections as the leading cause of lower respiratory tract illness, especially in children aged less than 3 years. The pathogens identified most frequently were RSV, HRV, HPIV, ADV, and HMPV. The coinfection rate was high. HPIV single infection was milder compared with coinfection with other viruses. Coinfection with atypical bacteria led to more serious situations compared with HPIV single infection and coinfection with other viruses.
FUNDING
This study was supported by the Science and Technology projects in Zhejiang Province (2015C37026).
CONFLICT OF INTEREST
The authors declare that there are no conflict of interest.
Supporting information
Supporting information
ACKNOWLEDGMENTS
The authors thank the colleagues at the Department of Children's Respiratory Disease, Second Affiliated Hospital & Yuying Children's Hospital, for their support during the study.
Zhong P, Zhang H, Chen X, Lv F. Clinical characteristics of the lower respiratory tract infection caused by a single infection or coinfection of the human parainfluenza virus in children. J Med Virol. 2019;91:1625‐1632. 10.1002/jmv.25499
References
REFERENCES
- 1. Naghavi M, Wang H, Lozano R, et al. Global, regional, and national age–sex specific all‐cause and cause‐specific mortality for 240 causes of death, 1990–2013: a systematic analysis for the Global Burden of Disease Study 2013. The Lancet. 2015;385:117‐171. [DOI] [PMC free article] [PubMed] [Google Scholar]
- 2. Krunic N, Yager TD, Himsworth D, Merante F, Yaghoubian S, Janeczko R. xTAG RVP assay: analytical and clinical performance. J Clin Virol. 2007;40(Suppl 1):S39‐46. [DOI] [PMC free article] [PubMed] [Google Scholar]
- 3. Pillet S, Lardeux M, Dina J, et al. Comparative evaluation of six commercialized multiplex PCR kits for the diagnosis of respiratory infections. PLOS One. 2013;8:e72174. [DOI] [PMC free article] [PubMed] [Google Scholar]
- 4. Cantais A, Mory O, Pillet S, et al. Epidemiology and microbiological investigations of community‐acquired pneumonia in children admitted at the emergency department of a university hospital. J Clin Virol. 2014;60:402‐407. [DOI] [PMC free article] [PubMed] [Google Scholar]
- 5. Ljubin‐Sternak S, Marijan T, Ivkovic‐Jurekovic I, Cepin‐Bogovic J, Gagro A, Vranes J. Etiology and clinical characteristics of single and multiple respiratory virus infections diagnosed in croatian children in two respiratory seasons. J Pathog. 2016;2016:2168780‐8. [DOI] [PMC free article] [PubMed] [Google Scholar]
- 6. Martinez‐Roig A, Salvado M, Caballero‐Rabasco MA, Sanchez‐Buenavida A, Lopez‐Segura N, Bonet‐Alcaina M. Viral coinfection in childhood respiratory tract infections. Arch Bronconeumol. 2015;51:5‐9. [DOI] [PMC free article] [PubMed] [Google Scholar]
- 7. Arruda E, Jones MH, Escremim de Paula F, et al. The burden of single virus and viral coinfections on severe lower respiratory tract infections among preterm infants: a prospective birth cohort study in Brazil. Pediatr Infect Dis J. 2014;33:997‐1003. [DOI] [PubMed] [Google Scholar]
- 8. Pan Y, Zhang Y, Weixian S, et al. Human parainfluenza virus infection in severe acute respiratory infection cases in Beijing, 2014‐2016: a molecular epidemiological study. Influenza Other Respir Viruses. 2017;11:564‐568. [DOI] [PMC free article] [PubMed] [Google Scholar]
- 9. Pawelczyk M, Kowalski ML. The role of human parainfluenza virus infections in the immunopathology of the respiratory tract. Curr Allergy Asthma Rep. 2017;17:16. [DOI] [PMC free article] [PubMed] [Google Scholar]
- 10. Liu WK, Liu Q, Chen DH, et al. Epidemiology and clinical presentation of the four human parainfluenza virus types. BMC Infect Dis. 2013;13:28. [DOI] [PMC free article] [PubMed] [Google Scholar]
- 11. Jiang ZF, Shen KL, Shen Y. Zhu Futang Practice of Pediatrics. Beijing, China: People's medical publishing house; 2015:1251‐1253p. [Google Scholar]
- 12. Zhang. H, Cheng H, Wang Q, et al. An advanced fragment analysis‐based individualized subtype classification of pediatric acute lymphoblastic leukemia. Sci Rep. 2015;5:12435. [DOI] [PMC free article] [PubMed] [Google Scholar]
- 13. Esposito S, Daleno C, Prunotto G, et al. Impact of viral infections in children with community‐acquired pneumonia: results of a study of 17 respiratory viruses. Influenza Other Respir Viruses. 2013;7:18‐26. [DOI] [PMC free article] [PubMed] [Google Scholar]
- 14. Akturk H, Sutcu M, Badur S, et al. Evaluation of epidemiological and clinical features of influenza and other respiratory viruses. Turk Pediatri Ars. 2015;50:217‐225. [DOI] [PMC free article] [PubMed] [Google Scholar]
- 15. Gooskens J, van der Ploeg V, Sukhai RN, Vossen AC, Claas EC, Kroes AC. Clinical evaluation of viral acute respiratory tract infections in children presenting to the emergency department of a tertiary referral hospital in the Netherlands. BMC Pediatr. 2014;14:297. [DOI] [PMC free article] [PubMed] [Google Scholar]
- 16. Wang H, Zheng Y, Deng J, et al. Prevalence of respiratory viruses among children hospitalized from respiratory infections in Shenzhen, China. Virol J. 2016;13:39. [DOI] [PMC free article] [PubMed] [Google Scholar]
- 17. Bicer S, Giray T, D Ç, et al. Virological and clinical characterizations of respiratory infections in hospitalized children. Ital J Pediatr. 2013;39:22. [DOI] [PMC free article] [PubMed] [Google Scholar]
- 18. Chen J, Hu P, Zhou T, et al. Epidemiology and clinical characteristics of acute respiratory tract infections among hospitalized infants and young children in Chengdu, West China, 2009‐2014. BMC Pediatr. 2018;18:216. [DOI] [PMC free article] [PubMed] [Google Scholar]
- 19. da Silva ER, Pitrez MC, Arruda E, et al. Severe lower respiratory tract infection in infants and toddlers from a non‐affluent population: viral etiology and co‐detection as risk factors. BMC Infect Dis. 2013;13:41. [DOI] [PMC free article] [PubMed] [Google Scholar]
- 20. Broccolo F, Falcone V, Esposito S, Toniolo A. Human bocaviruses: possible etiologic role in respiratory infection. J Clin Virol. 2015;72:75‐81. [DOI] [PubMed] [Google Scholar]
- 21. Singleton RJ, Bulkow LR, Miernyk K, et al. Viral respiratory infections in hospitalized and community control children in Alaska. J Med Virol. 2010;82:1282‐1290. [DOI] [PMC free article] [PubMed] [Google Scholar]
- 22. Pinky L, Dobrovolny HM. Coinfections of the respiratory tract: viral competition for resources. PLOS One. 2016;11:e0155589. [DOI] [PMC free article] [PubMed] [Google Scholar]
- 23. Scotta MC, Chakr VC, de Moura A, et al. Respiratory viral coinfection and disease severity in children: a systematic review and meta‐analysis. J Clin Virol. 2016;80:45‐56. [DOI] [PMC free article] [PubMed] [Google Scholar]
- 24. Martin ET, Kuypers J, Wald A, Englund JA. Multiple versus single virus respiratory infections: viral load and clinical disease severity in hospitalized children. Influenza Other Respir Viruses. 2012;6:71‐77. [DOI] [PMC free article] [PubMed] [Google Scholar]
- 25. Richard N, Komurian‐Pradel F, Javouhey E, et al. The impact of dual viral infection in infants admitted to a pediatric intensive care unit associated with severe bronchiolitis. Pediatr Infect Dis J. 2008;27:213‐217. [DOI] [PubMed] [Google Scholar]
- 26. Goka EA, Vallely PJ, Mutton KJ, Klapper PE. Single, dual and multiple respiratory virus infections andrisk of hospitalization and mortality. Epidemiol Infect. 2015;143:37‐47. [DOI] [PMC free article] [PubMed] [Google Scholar]
- 27. Cilla G, Onate E, Perez‐Yarza EG, Montes M, Vicente D, Perez‐Trallero E. Viruses in community‐acquired pneumonia in children aged less than 3 years old: high rate of viral coinfection. J Med Virol. 2008;80:1843‐1849. [DOI] [PMC free article] [PubMed] [Google Scholar]
- 28. Ziegler JE, Horsfall FL. Interference between the influenza viruses: I. the effect of active virus upon the multiplication of influenza viruses in the chick embryo. J Exp Med. 1944;79:361‐377. [DOI] [PMC free article] [PubMed] [Google Scholar]
- 29. Dobrescu I, Levast B, Lai K, et al. In vitro and ex vivo analyses of co‐infections with swine influenza and porcine reproductive and respiratory syndrome viruses. Vet Microbiol. 2014;169:18‐32. [DOI] [PMC free article] [PubMed] [Google Scholar]
- 30. Li Y, Handel A. Modeling inoculum dose dependent patterns of acute virus infections. J Theor Biol. 2014;347:63‐73. [DOI] [PubMed] [Google Scholar]
- 31. Wu K‐W, Wang S‐M, Shen C‐F, Ho T‐S, Wang J‐R, Liu C‐C. Clinical and epidemiological characteristics of human parainfluenza virus infections of children in southern Taiwan. J Microbiol Immunol Infect. 2018;51:749‐755. [DOI] [PubMed] [Google Scholar]
- 32. Frost HM, Robinson CC, Dominguez SR. Epidemiology and clinical presentation of parainfluenza type 4 in children: a 3‐year comparative study to parainfluenza types 1‐3. J Infect Dis. 2014;209:695‐702. [DOI] [PMC free article] [PubMed] [Google Scholar]
- 33. Xiao NG, Duan ZJ, Xie ZP, et al. Human parainfluenza virus types 1‐4 in hospitalized children with acute lower respiratory infections in China. J Med Virol. 2016;88:2085‐2091. [DOI] [PMC free article] [PubMed] [Google Scholar]
- 34. Jiang W, Wu M, Zhou J, et al. Etiologic spectrum and occurrence of coinfections in children hospitalized with community‐acquired pneumonia. BMC Infect Dis. 2017;17:787. [DOI] [PMC free article] [PubMed] [Google Scholar]
- 35. Schildgen O, Søndergaard MJ, Friis MB, Hansen DS, Jørgensen IM. Clinical manifestations in infants and children with mycoplasma pneumoniae infection. PLOS One. 2018;13:e0195288. [DOI] [PMC free article] [PubMed] [Google Scholar]
Associated Data
This section collects any data citations, data availability statements, or supplementary materials included in this article.
Supplementary Materials
Supporting information