

Abstract
Problem
Human parainfluenza virus (hPIV) is an important pathogen in respiratory infections, however the health burden of hPIV is underestimated. This study describes the infections by hPIV1‐3 in Rio Grande do Sul, Brazil, from 1990 to 2017, providing data of the frequency and seasonality of cases and associated clinical symptoms.
Method of study
Nasopharyngeal samples of patients with respiratory infection were collected, clinical data were analyzed, and immunofluorescence was used to detect hPIV.
Results
Respiratory viruses were detected in 33.63% of respiratory infections. In a total of 11 606 cases of viral respiratory infection, 781 were positive for hPIV; hPIV prevalence ranged from 2.14% to 27% of viral respiratory infections. hPIV1 circulates mainly during fall; hPIV3 circulation, in turn, starts in fall and peaks during spring; and cases of hPIV2 are reported along the year, with peaks in fall and early spring. The most affected age group was children, with hPIV prevalence of 74.23% in patients for less than 1 year. A higher proportion of girls were infected than boys, however, no difference by sex was observed considering all age groups. The most frequent type was hPIV3, especially in hospitalized patients. Both hPIV1 and 3 were associated with dyspnea, while hPIV2 caused mild symptoms mainly in nonhospitalized patients. Nineteen fatalities occurred, 89.5% of them associated with risk factors (prematurity; chronic diseases; age, <1 or >60 years).
Conclusion
hPIV causes a high number of respiratory infections, leading to hospitalization especially in children; epidemiological and surveillance studies are important for the control and management of respiratory infections.
Keywords: acute respiratory infection, hPIV infection, respiratory virus, severe acute respiratory infection
Highlights
Parainfluenza viruses circulate throughout the year and cause severe acute respiratory infection in children.
hPIV1 and 3 infections are associated with dyspnea and hospitalization.
hPIV2 infection causes mild symptoms.
1. INTRODUCTION
Human parainfluenza viruses (hPIVs) infect the upper and lower respiratory tract of humans causing symptoms ranging from mild acute respiratory infection (ARI) to severe acute respiratory infection (SARI); severe cases might lead to death. hPIVs were discovered in the late 1950s; they belong to the family Paramyxoviridae and are divided into four types—hPIV1, 2, 3, and 4, the latter subdivided in subtypes hPIV4a and hPIV4b—which belong to two different genera: Respirovirus (hPIV1 and 3) and Rubulavirus (hPIV2 and 4).1
The clinical profile of patients infected by hPIV may vary according to viral type: hPIV1 is known to cause laryngotracheobronchitis (croup)2; hPIV2 is associated to hospitalizations, however, little is known about its epidemiology2; hPIV3, which is the most prevalent type, is one of the main causes of pneumonia and bronchiolitis in children and newborns2; and hPIV4 is associated with mild upper respiratory tract infections in children and adults.2, 3
Respiratory infections associated with hPIV are observed year‐round, and trends in viral type circulation can be observed in some regions. Usually, during fall the main hPIV types are hPIV1 and 2, and during spring hPIV3 becomes dominant.2, 4 The factors that contribute to specific regional viral circulation are not well understood and do not necessarily depend on the climate; for example, a study reports high hPIV3 prevalence during summer and beginning of fall in the United Kingdom, and during winter in Norway and Denmark5; in other geographic regions, this virus is more frequent from spring to summer.6
In Brazil, respiratory infections are the leading cause of hospitalization in children,7 especially in the southern region, which includes the state of Rio Grande do Sul (RS). An increase in the prevalence of respiratory viruses is usually observed in RS from May to August; nonetheless, respiratory virus outbreaks are also registered during the summer.4, 8, 9 Because of this, state health authorities in RS have put efforts in the epidemiological surveillance of respiratory infections in the region since 1990, when data of SARI cases started to be recorded by the State Central Laboratory (LACEN‐RS). In 2003, the Brazilian Health Ministry included ARI in the national disease surveillance system, therefore all Brazilian states started to follow the governmental guidelines. Later, after the 2009 influenza pandemics, all cases of SARI became of compulsory notification in the country.
Epidemiological surveillance is the basis for the control and prevention of viral respiratory infections, however regional efforts regarding surveillance of respiratory viruses are directed mainly to influenza A virus (IAV) and human respiratory syncytial virus (hRSV), therefore little is known about other viral pathogens associated to ARI and SARI in RS. The present study describes the prevalence of hPIVs in RS from 1990 to 2017, providing important data and contributing to public health strategies regarding respiratory infections in South America.
2. MATERIALS AND METHODS
This study includes 34 038 patients with respiratory infection symptoms in RS from June 1990 to December 2017. All patients that sought medical assistance at health units due to symptoms of respiratory infection and that were diagnosed with ARI or SARI were included in this study. Clinical symptoms considered to define SARI were dyspnea (oxygen saturation below 95%), fever, myalgia, lethargy, cough, and sore throat.9, 10 For ARI definition, clinical symptoms were fever (above 37.5°C), accompanied by cough or sore throat, and at least one of these symptoms: headache, myalgia, and arthralgia.9
2.1. Virus detection
Nasopharyngeal secretion, including nasopharyngeal aspirates and swabs, was collected for laboratory analyses. Samples were processed at LACEN‐RS, a reference laboratory that belongs to the Brazilian network of Influenza and Other Respiratory Virus Surveillance and performs analyses of respiratory infections in RS.
For respiratory virus detection, either molecular or immunoassays were used in routine laboratory analysis. Influenza virus A and B were detected using the reverse‐transcription quantitative polymerase chain reaction (PCR),10 and hRSV, hAdV, and hPIV 1‐3 were detected using indirect immunofluorescence assay (IFA) using the Light Diagnostic Respiratory Panel 1 Viral Screening and Identification Kit (Darmstadt, Germany) and/or D3 Ultra DFA Respiratory Virus Screening & ID Kit (Diagnostic Hybrids, Athens, OH), with monoclonal antibodies for each virus.
Of note, regarding hPIV, between 1990 and 1999, only hPIV3 was investigated in samples using specific commercial reagents (Chemicon International Inc, Temecula, CA). Respiratory viruses antigen control slides were used in all assays.
2.2. Demographics and clinical data
Data from June 1990 to December 2002 were obtained from LACEN‐RS records of patients hospitalized with SARI in RS and included 5067 samples.
At the end of 2002, the Brazilian Ministry of Health launched SIVEP‐GRIPE, a digital platform for surveillance of respiratory viruses with records obtained from specific health units distributed throughout the country, called Sentinel Units of the epidemiological surveillance network. In RS, 342 316 medical appointments in Sentinel Units were registered in the system from 2003 to 2017; in total, 8496 nasopharyngeal samples were collected from patients with ARI symptoms and analyzed for respiratory viral infection; the number of monthly visits, respiratory complains, patient data, and laboratory test results were assessed.
In 2009 cases of SARI became of mandatory notification in Brazil and were included on SINAN (Information System on Diseases of Compulsory Declaration), a digital platform used by the Brazilian Health Ministry for reporting notifiable conditions. In total, 22 356 cases of SARI were notified by health institutions throughout RS from 2010 to 2017. Of these, 20 475 samples were analyzed at LACEN‐RS and included in this study.
Based on these records, patients were classified into three groups: group 1 (n = 5067: SARI, patients hospitalized from 1990 to 2002), group 2 (n = 8496: ARI, outpatients from 2003 to 2017), and group 3 (n = 20 475: SARI, patients hospitalized from 2010 to 2017).
Information about demographics, the first day of symptoms, respiratory infection symptoms, pregnancy, smoking habits, and comorbidities, as well as disease outcome (cure/fatality) were recorded. The study was approved by the Ethics Committee of UFCSPA (Protocol 2.340.964).
2.3. Statistical analysis
Frequency plots were used to describe: age groups; the total number of cases positive for the respiratory virus and for hPIV types in each year of the study; and monthly circulation of hPIV types. Statistical analysis was performed using SPSS Statistics 23.0 software (IBM, Armonk, NY). The χ2 and Fisher exact tests were used to compare hPIV prevalence between male and female, and to analyze clinical symptoms. Results were considered statistically significant when P < 0.05.
3. RESULTS
In this study, we assessed hPIV‐positivity among patients with respiratory infection in southern Brazil from 1990 to 2017. Figure 1 shows the total number of viral respiratory infections throughout the period; cases positive for hPIV1‐3 are also shown. hPIV positivity in each patient group (groups 1‐3 as described in Section 2) is shown in Table 1.
Figure 1.
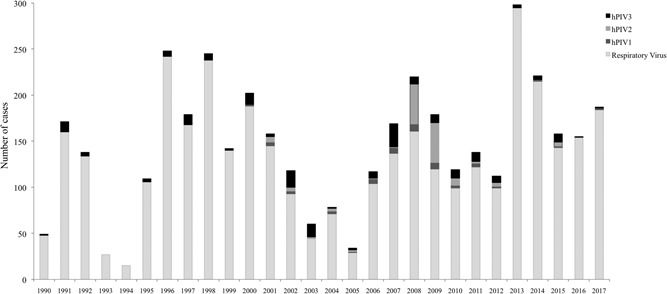
Total number of cases positive for respiratory viruses in Rio Grande do Sul (1990‐2017) and cases positive for each hPIV type. Between 1990 and 1999, only hPIV3 was tested; years from 2000 to 2017 include data for hPIV1‐3. hPIV: human parainfluenza virus
Table 1.
Cases of patients with ARI or SARI in RS (1990‐2017) included in the study
| Variables | Group 1 | Group 2 | Group 3 | |||
|---|---|---|---|---|---|---|
| SARI (1990‐2002) | ARI (2003‐2017) | SARI (2010‐2017) | ||||
| Samples collected | 5067 | 8496 | 20 475 | |||
| Respiratory virus positive, N (%) | 1704 (33.63) | 2034 (23.94) | 7925 (35.45) | |||
| Sex, N (%) | ||||||
| Male | 1021 (59.92) | 951 (46.76) | 3525 (52.12) | |||
| Female | 683 (40.08) | 1083 (53.24) | 3238 (47.88) | |||
| hPIV positivity, N (%) a | 45/52 (5.69) b | 271 (13.32) | 416 (5.25) | |||
| hPIV1 | NA/9 (17.31) | 44 (16.24) | 70 (16.83) | |||
| hPIV2 | NA/10 (19.23) | 115 (42.43) | 18 (4.33) | |||
| hPIV3 | 45 (100)/33 (63.46) | 112 (41.33) | 328 (78.85) | |||
| Outcome | ||||||
| Cure | 97 | 271 | 397 | |||
| Death | 0 | 0 | 19 (4.57) c | |||
| Sex, N (%) d | P = 0.026* | P = 0.087* | P = 0.392* | |||
| Male | 48 (4.70) | 110 (11.57) | 187 (5.31) | |||
| Female | 49 (7.17) | 154 (14.22) | 156 (4.82) | |||
Abbreviations: ARI, acute respiratory infection; hPIV, human parainfluenza virus; NA, not analyzed; RS, Rio Grande do Sul; SARI, severe acute respiratory infection.
Percentage in relation to the number of cases positive for at least one respiratory virus.
Between 1990 and 1999 laboratory diagnostic was only for hPIV3; from 2000 to 2002, all three viral types were included in the analysis.
Percentage in relation to the number of cases of the same sex‐positive for at least one respiratory virus; data about the sex was missing for some patients.
Percentage in relation to the number of hPIV‐positive cases in group 3.
The χ2 and Fisher exact tests were used. Results were considered statistically significant when P < 0.05.
This article is being made freely available through PubMed Central as part of the COVID-19 public health emergency response. It can be used for unrestricted research re-use and analysis in any form or by any means with acknowledgement of the original source, for the duration of the public health emergency.
In 1990, LACEN‐RS initiated laboratory analysis of respiratory viruses to support epidemiological surveillance in RS, with a diagnosis of hPIV3, IAV, influenza B (IBV), hRSV, and human adenovirus (hAdV); hPIV1 and 2 were added to the respiratory virus panel in 2000. This study analyzed 5067 samples from patients hospitalized with SARI in RS between June 1990 and December 2002 (group 1) based on records from LACEN‐RS notebooks, before implementation of the epidemiological surveillance information system. In group 1, 1704 (33.63%) patients were positive for at least one respiratory virus and 97 were hPIV‐positive (5.69% prevalence) (Table 1). From 1990 to 1999, the prevalence of hPIV3 in relation to other respiratory viruses was 6.2% (45 of 726) (Figure 1). hPIV3 was the most prevalent type compared to hPIV1 and 2 in the laboratory analysis (2000‐2002), accounting for 63.46% (33 of 52) of cases, followed by 19.23% (10 of 52) of hPIV2 and 17.31% (9 of 52) of hPIV1. hPIV prevalence among all cases of respiratory viruses varied significantly along 1990‐2002, with years of no detection of hPIV, and years in which the virus accounted for more than 25% of all viral respiratory infections.
Group 2 included 8496 nasopharyngeal samples collected from patients with ARI symptoms from 2003 to 2017 in RS. Respiratory viruses were found in 23.94% of ARI patients; among these, 271 were positive for hPIV, which accounted for 13.32% of all respiratory viral infections. Among the hPIV‐positive cases, 16.24% were hPIV1, 41.33% hPIV3, and 42.43% hPIV2 (Figure 1 and Table 1). Of note, hPIV outbreaks were observed in the city of Caxias do Sul in three consecutive years, accounting for most of the ARI cases in adult patients in RS: two outbreaks of hPIV3 occurred in winter and spring of 2007; an outbreak of hPIV2 occurred in 2008, starting during fall, with peaks in winter and spring; and two outbreaks of hPIV2 occurred in the fall and spring of 2009.
In group 3 (n = 20,475), viral respiratory infections accounted for 7925 of SARI cases (35.45%), among which 416 patients were infected by hPIV (5.25% of all respiratory viral infections). hPIV3 was the most prevalent type (78.85%), followed by hPIV1 (16.83%) and hPIV2 (4.33%) (Figure 1 and Table 1).
3.1. hPIV circulation
All three hPIVs occur throughout the year, with some alternate circulation among viral types (Figures 1, 2). Accordingly, hPIV1 and 3 show alternate prevalence: hPIV1 circulate more during fall and its incidence decreases with the appearance of hPIV3 in late fall; the latter displays a gradual increase, with the highest incidence during spring (September‐October). Cases of hPIV2 occur along the year, with peaks in April (fall) and September (early spring).
Figure 2.
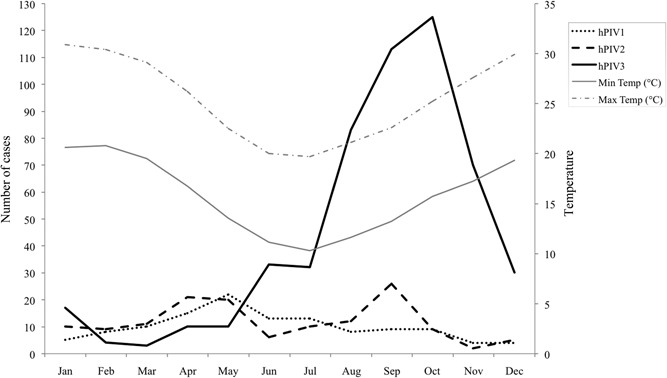
Total number of hPIV‐positive cases according to epidemiological weeks in Rio Grande do Sul (data accumulated monthly from 1990 to 2017); Max temp, average maximum temperature (in degrees Celsius) registered for each month during the period; Min temp, average minimum temperature (in degrees Celsius) registered for each month during the period. hPIV, human parainfluenza virus
3.2. Patient demographics
Pediatric patients were most of the cases in group 1, in which 84.54% were children younger than 10 years of age. In addition, according to LACEN‐RS records 62.87% of hPIV‐positive cases in this group were observed in children younger than 6 months (data not shown). Interestingly, though 59.92% of all cases positive for the respiratory virus in group 1 were male and hPIV prevalence was higher in females (7.17% vs 4.7%, respectively; P = 0.026; Table 1).
When patients with ARI symptoms were analyzed (group 2), results showed the occurrence of all three hPIVs in all age groups (Figure 3A). Of note, in patients up to 5 years of age, hPIV3 was the most prevalent type and hPIV2 was highly prevalent among adults between 20 and 49 years of age. Of all ARI cases with confirmed viral infection, 46.76% were male; the proportion of females among hPIV‐positive cases was slightly higher (14.22% vs 11.57% males; P = 0.087), and no significant differences were found between sex regardless of hPIV types (hPIV1 P = 1.0, hPIV2 P = 0.383, and hPIV3 P = 0.46).
Figure 3.
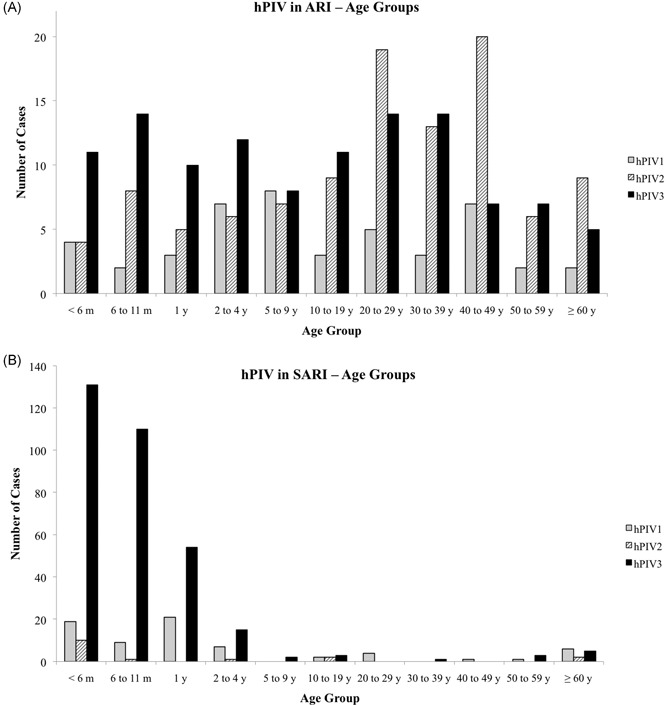
Distribution of patients with ARI (A) or SARI (B) according to age groups. ARI, acute respiratory infection; hPIV, human parainfluenza virus; SARI, severe acute respiratory infection
For SARI cases notified in SINAN from 2010 to 2017 (n = 416), demographic data from 410 patients were obtained (group 3). Regardless of the virus type, 92.2% of hPIV infections occurred in children less than 5 years of age; notably, 68.29% were children younger than 1 year (Figure 3B). Interestingly, even though hPIV3 is more frequent than hPIV1, the latter seems to be more distributed in all age groups. In general, people between 20 and 60 years of age are less susceptible to hPIV infections. Of all positive respiratory viruses studied in LACEN‐RS from 2010 to 2017, 52.12% were male; accordingly, hPIV prevalence was slightly higher in this group (5.31% vs 4.82% in female, P = 0.392), and no significant differences were found between sex regardless of hPIV types (hPIV1 P = 0.66, hPIV2 P = 0.073, and hPIV3 P = 0.219).
3.3. Symptoms
The most common symptoms among ARI patients infected by hPIV were fever, cough, and coryza regardless of the viral type (Table 2). Of note, patients infected by hPIV2 reported nasal obstruction (77.35%), myalgia (60.37%), and arthralgia (34.9%); moreover, fever was less common among hPIV2 patients than in patients infected by either hPIV1 or 3. In patients with hPIV3, fever (87.5%) and cough (89.28%) were the most common symptoms. Less common symptoms were earache, vomiting, cyanosis, muscular pain, and wheezing.
Table 2.
Symptoms presented by patients with ARI or SARI positive for hPIV
| ARI patients, N (%) | |||
|---|---|---|---|
| Symptoms | hPIV1 (n = 44) | hPIV2 (n = 106) | hPIV3 (n = 112) |
| Fever | 32 (72.72) | 74 (68.81) | 98 (87.5) |
| Cough | 36 (81.81) | 82 (77.35) | 100 (89.28) |
| Earache | 9 (20.45) | 16 (15.09) | 15 (13.39) |
| Sore throat | 14 (31.81) | 44 (41.50) | 46 (41.07) |
| Arthralgia | 7 (15.9) | 37 (34.90) | 24 (21.42) |
| Myalgia | 19 (43.18) | 64 (60.37) | 41 (36.60) |
| Headache | 16 (36.36) | 50 (47.16) | 44 (39.28) |
| Coryza | 40 (90.90) | 95 (89.2) | 85 (75.89) |
| Nasal obstruction | 27 (61.36) | 82 (77.35) | 64 (57.12) |
| SARI patients, N (%) | |||
|---|---|---|---|
| Symptoms | hPIV1 (n = 57) | hPIV2 (n = 12) | hPIV3 (n = 275) |
| Fever | 53 (92.98) | 11 (91.66) | 261 (95.25) |
| Cough | 56 (98.24) | 12 (100) | 261 (95.25) |
| Chills | 1 (1.75) | 3 (25) | 1 (0.34) |
| Dyspnea | 43 (75.43) | 11 (91.66) | 256 (93.43) |
| Sore throat | 9 (15.78) | 1 (8.3) | 8 (2.9) |
| Arthralgia | 9 (15.78) | 2 (16.66) | 5 (1.81) |
| Myalgia | 9 (15.78) | 2 (16.66) | 10 (3.6) |
| Conjunctivitis | 2 (3.5) | 0 (0) | 12 (4.37) |
| Coryza | 5 (8.77) | 4 (33.33) | 25 (9.12) |
| Diarrhea | 1 (1.75) | 1 (8.3) | 7 (2.55) |
Abbreviations: ARI, acute respiratory infection; hPIV, human parainfluenza virus; SARI, severe acute respiratory infection.
This article is being made freely available through PubMed Central as part of the COVID-19 public health emergency response. It can be used for unrestricted research re-use and analysis in any form or by any means with acknowledgement of the original source, for the duration of the public health emergency.
Patients hospitalized with SARI exhibit cough, fever, and dyspnea, and these were the symptoms mostly observed in hPIV‐infected patients in groups 1 and 3; however, because samples of group 1 were analyzed before implementation of the national information system for surveillance of respiratory infections, no clinical data were available for this group of patients. Symptoms more frequent for each hPIV type are shown in Table 2 and included: dyspnea, sore throat, and myalgia for hPIV1; chills for hPIV2; and dyspnea for hPIV3. Other less reported symptoms included vomiting, tachypnea, wheezing, conjunctivitis, coryza, diarrhea, and headache.
Data regarding disease outcome (cure/fatality) were available only for group 2 (outpatients with ARI, n = 271) and group 3 (hPIV‐positive patients hospitalized with SARI, n = 416); fatality outcomes were found only in group 3, with a total of 19 deaths (Table 3). Thus, in this group, the mortality rate reached 4.57%; however, if all hPIV‐positive cases are taken into account (n = 781), the mortality rate in hPIV infection was approximately 2.43%. Notably, 68.4% of the fatalities were in female patients and at least one risk factor was present in 89.5% of deaths, including prematurity, children up to 2 years, and adult above 60 years and/or patients with chronic diseases (Table 3).
Table 3.
Fatalities among hPIV‐positive patients in group 3 (n = 416)
| Variable | hPIV1 (n = 70) | hPIV2 (n = 18) | hPIV3 (n = 328) |
|---|---|---|---|
| Fatalities (%) a | 6 (8.57) | 4 (22.22) | 9 (2.74) |
| Sex | |||
| Male | 3 | 1 | 2 |
| Female | 3 | 3 | 7 |
| Age | |||
| ≤6 mo | 1 | 2 | 6 |
| 6 mo ≤ 2 y | 2 | 0 | 0 |
| 2 ≤ 60 y | 0 | 0 | 1 |
| >60 y | 3 | 2 | 2 |
| Other conditions | Pneumo, Cardio, DB | Alcohol, Cardio, Neuro, Smoke | Cardio, DB, Neuro, Pneumo, Premat |
Abbreviations: Alcohol, ex‐alcoholic; Cardio, chronic cardiopathy; DB, diabetes; hPIV, human parainfluenza virus; Neuro, neurological disease; Pneumo, chronic pneumopathy; Premat, prematurity; Smoke, ex‐smoker.
Percentage is relative to the total number of cases positive for the respective hPIV type in group 3.
This article is being made freely available through PubMed Central as part of the COVID-19 public health emergency response. It can be used for unrestricted research re-use and analysis in any form or by any means with acknowledgement of the original source, for the duration of the public health emergency.
4. DISCUSSION
The health burden of hPIV infection is underestimated due to lack of studies about this virus; a few studies analyzed hPIV infection in pediatric patients11, 12, 13, 14, 15; apart from these, secondary data on hPIV can be found in some studies about influenza and hRSV.6, 16, 17, 18
To help in the understanding of how hPIV impacts human health, this study describes hPIV infection in patients with respiratory infections in RS, southern Brazil, where the incidence of respiratory infections is one of the highest in the country.9 Southern Brazil is the coldest region in the country; it is known that exposure to cold can induce vasoconstriction in the respiratory tract and suppression of immune responses.19 Therefore, low temperatures combined with high humidity during the winter are factors that may contribute for a high incidence of respiratory infections in RS; furthermore, during the winter people stay indoors most of the time, increasing the risk of transmission of respiratory pathogens.
In this study we analyzed 34 038 patients from 1990 to 2017; 11 606 patients were positive for viral infection and 781 were positive for hPIV. Notably, when we analyzed the number of hPIV cases in each year separately (data not shown), we observed that hPIV prevalence ranged from 2.14% up to almost 27% of all viral respiratory infections in SARI patients; the highest prevalence over other respiratory viruses were observed in 2002 (26.88%), 2010 (7.63%), 2014 (10.96%), and 2015 (9.6%). In agreement with findings from other studies,11, 14, 20, 21, 22, 23 hPIV3 was the most common type among all hPIV‐positive patients in this study, especially those presenting severe symptoms. When we look at hPIV types among ARI patients (group 2), we found a significant number of hPIV2 cases (Table 1). This finding could suggest that hPIV2 is associated with mild symptoms; in this sense, previous reports have shown that symptoms such as bronchiolitis and pneumonia are common among children infected with hPIV1 and 3, while croup is more common in children with hPIV2 infection.15
Even though hPIV2 infection is associated with mild symptoms, its potential in causing outbreaks is of clinical importance and must not be neglected. Accordingly, hPIV2 outbreaks occurred in 2009, during the same period as the 2009 influenza A pandemics and accounted for 35.8% of all viral respiratory infections in ARI patients (Figure 1), revealing the need of health professionals to be aware of other respiratory viruses during influenza outbreaks.
Of all hPIV‐positive hospitalized patients in our study, 74.38% were children younger than 1 year infected with hPIV3, a percentage higher than described in the literature for this age group.2 This finding is important because nosocomial dissemination have been described for hPIV3, causing high morbidity in neonatal units,24 therefore it is important to consider hPIV infection in hospitalized pediatric patients. Previous analyses by our group, performed before the inclusion of hPIV1 and 2 in the surveillance protocol in RS, also showed high prevalence of hPIV3 in children hospitalized with respiratory infection.8 Similar findings were reported for hPIV3 outbreaks in southeast Brazil,25 Spain,12 and southern China.26 Nonetheless, hPIV1 and 2 outbreaks were an important cause of mild ARI in people of all age groups.
Some studies show a higher proportion of young male infected by hPIV than young female, and such an incidence of infection becomes similar to the sex as age increases.27, 28 However, because a higher proportion of male is observed among patients with acute respiratory infection, regardless of being hPIV‐positive or hPIV‐negative,29 occasional differences in the sex among hPIV‐infected patients should consider higher morbidity in males and their susceptibility in displaying symptoms typical of viral respiratory infections. Interestingly, our results differ from others in the literature regarding the sex differences in hospitalized pediatric patients with SARI27, 28, 29, 30: though most were young males, we observed a higher proportion of young female infected with hPIV. When other age groups were taken into account, though, we found similar numbers of hPIV‐positive cases between male and female.
Previous studies reporting hPIV seasonality have shown that hPIV1 circulates mainly in fall,11, 15, 27, 31, 32, 33 and our analyses show similar findings, with some cases also occurring in other seasons. However, some studies describe peaks of hPIV activity in odd‐numbered years, but we did not find biennial patterns of hPIV circulation along 28 years of analysis.2, 15, 27, 32
Viral dynamics in the human population is related to host, viral and environmental determinants, whose complexity is not well understood, especially when different viruses are involved in a pathological condition. Accordingly, respiratory infections in RS can be caused by a plethora of pathogens, including IAV, IBV, hPIV, hRSV, hAdV, and metapneumovirus9, 34; in this sense, our findings show that hPIV activity is high during fall and spring, just before and after influenza and hRSV season, which occur in winter (from May to August).35 Similarly, a study analyzed the circulation of hPIV, hRSV, and IAV in Fortaleza (Northeast Brazil) and found an inverse association between hPIV, hRSV, and IAV circulation.16 With regard to hPIV types, our findings corroborate studies that show an inverse correlation between the hPIV1 and 3 circulations, suggesting intracompetition among the hPIV types.2, 30, 36
Interestingly, hPIV outbreaks were registered in a single municipality in three consecutive years, caused by hPIV3 in 2007 and by hPIV2 in 2008 and 2009. hPIV3 outbreaks last longer than hPIV1 and 2,1 which might be related to the fact that hPIV3 infects the lower respiratory airways, causing bronchitis, bronchiolitis, and pneumonia, usually requiring hospitalization.1, 2, 11, 14, 16, 33, 37, 38, 39 hPIV1 and 2, in turn, infect mainly the laryngeal and proximal trachea and are associated with croup.1, 2, 3, 30 Accordingly, we found that most patients hospitalized with SARI exhibited fever, cough, and dyspnea, with sore throat and myalgia being more common in hPIV1 cases, chills in hPIV2, and dyspnea in hPIV3. Though symptoms were milder in outpatients that did not require hospitalization, a high proportion of outpatients displayed headache, coryza, and nasal obstruction. Of note, in patients with ARI, myalgia, arthralgia, coryza, and nasal obstruction were symptoms more frequently in hPIV2 infection, while fever, myalgia, and coryza were more observed to hPIV3 infection.
It is well known that coinfection with different respiratory pathogens, including virus and bacteria, can increase the severity of symptoms,40, 41 In the present study we focused specifically on the epidemiology of hPIV in Rio Grande do Sul, therefore we did not analyze other respiratory viruses. Nevertheless, cases of respiratory virus coinfection are occasionally observed, mainly during influenza seasons (unpublished data). In this sense, further studies about coinfection of hPIV and other viruses could contribute to understanding the course of the disease. In fact, studies on the association between hPIV and mortality are scarce. Though morbidity due to hPIV is low in developed countries, occurring occasionally in newborns, the elderly, or immunocompromised people,1 hPIV infection in adults has been shown to be associated with higher mortality and longer hospitalization when compared with influenza virus infection, and patients with underlying cardiovascular diseases were particularly at risk.42 In the present study, 2.43% of the patients infected with hPIV died; when only hospitalized patients with SARI are considered, the mortality rate for hPIV infection increases to 4.57% and occurs mainly in children and elderly people with underlying diseases, such as cardiovascular and/or pneumopathy; of note, these comorbidities increase the risk to virus infection, including influenza infection.9 In England and Wales,43 it has been estimated that three deaths occur per year due to infection by hPIV2 in children up to 1‐year old. In addition, hPIV has also been associated with mortality and a greater impact in the elderly above 75 years.44 In our study, we found a higher fatality rate among patients infected with hPIV2 (22.22%) compared to hPIV1 and 3 (8.57% and 2.74%, respectively), mainly in young infants and in the elderly hospitalized with SARI.
One of the main limitations of this study was that only hPIV3 was assessed between 1990 and 1999, therefore data about hPIV1 and 2 infections were included in the analysis only from 2000 onwards. In addition, data was lacking for some patients, mainly those reported before 2002, therefore some patients had to be excluded from the study due to incomplete epidemiological information, both related to clinical and demographic data as well as to viral type. Another limitation was a change in the way that symptoms are reported in the system, and some important symptoms, including disease outcome, were included in the notification forms only after the 2009 influenza pandemics.
Recently, molecular methods based on singleplex‐ and multiplex‐PCR have been developed for the diagnosis of viral respiratory infection; multiplex‐PCR assays employ respiratory viruses panels which include, among other viruses, hPIVs.45, 46, 47 Though more sensitive than IFA, multiplex‐PCR presents higher costs for implementation, therefore many reference laboratories in Brazil still rely on IFA for epidemiological surveillance of viral respiratory diseases. This represented a limitation for our study, and we cannot discard the possibility of finding a higher number of hPIV‐positive cases if PCR‐based methods had been used in our analyses. Nevertheless, we were able to detect a significant number of hPIV‐positive cases, which reinforces the need for implementing molecular diagnostics for the respiratory virus in our region. As a matter of fact, as part of the improvement of epidemiological surveillance network in Brazil, a respiratory viruses panel to be used in multiplex‐PCR is being implemented in some of the reference laboratories in the country, which will include IAV, IBV, hAdV, hPIVs, RSV, human metapneumovirus, human Bocavirus, human coronavirus, and rhinovirus.
Despite the difficulties found, we were able to perform historical analysis of cases of hPIV in RS along 28 years, with data about the epidemiological and laboratory surveillance of three hPIV types—hPIV1‐3. Our analysis contributes to information about hPIV seasonality in South America, prevalence among age groups and most common symptoms observed in hPIV infection both in mild and severe acute respiratory infection.
CONFLICT OF INTERESTS
The authors declare that there are no conflict of interests.
ACKOWLEDGMENTS
The authors thank Ivana R. dos Santos Varella for technical assistance, the State Secretary of Health of Rio Grande do Sul and Universidade Federal de Ciências da Saúde de Porto Alegre.
Gregianini TS, Seadi CF, Zavarize Neto LD, et al. A 28‐year study of human parainfluenza in Rio Grande do Sul, Southern Brazil. J Med Virol. 2019;91:1423‐1431. 10.1002/jmv.25459
References
REFERENCES
- 1. Chambers R, Takimoto T. Parainfluenza Viruses eLS. John Wiley & Sons Ltd; 2011. 10.1002/9780470015902.a0001078.pub3 [DOI] [Google Scholar]
- 2. Henrickson KJ. Parainfluenza viruses. Clin Microbiol Rev. 2003;16:242‐264. [DOI] [PMC free article] [PubMed] [Google Scholar]
- 3. Fox TG, Christenson JC. Influenza and parainfluenza viral infections in children. Pediat Rev. 2014;35:217‐228. [DOI] [PubMed] [Google Scholar]
- 4. Freitas FT de M. Sentinel surveillance of influenza and other respiratory viruses, Brazil, 2000‐2010. Braz J Infect Dis. 2013;17:62‐68. [DOI] [PMC free article] [PubMed] [Google Scholar]
- 5. Ørstavick I, Gradien M, Halonen P, et al. Viral diagnosis using the rapid immunofluorescence techniques and epidemiological implications of acute respiratory infections among children in different European countries. Bull World Health Organ. 1984;62:307‐313. [PMC free article] [PubMed] [Google Scholar]
- 6. Mizuta K, Abiko C, Aoki Y, et al. Seasonal patterns of respiratory syncytial virus, influenza A virus, human metapneumovirus, and parainfluenza virus type 3 infections on the basis of virus isolation data between 2004 and 2011 in Yamagata, Japan. Jpn Journal Infect Dis. 2013;66:140‐145. [DOI] [PubMed] [Google Scholar]
- 7. Oliveira BRG, Viera CS, Collet N, Lima RAG. Causes of hospitalization in the National Health care System of children aged zero to four in Brazil. Rev Bras Epidemiol. 2010;13(2):268‐277. [Google Scholar]
- 8. Straliotto SM, Siqueira MM, Muller RL, Fischer GB, Cunha MLT, Nestor SM. Viral etiology of acute respiratory infections among children in Porto Alegre, RS, Brazil. Rev Soc Bras Med Trop. 2002;35:283‐291. [DOI] [PubMed] [Google Scholar]
- 9. Brasil. Boletim Epidemiológico . Seceretaria de Vigilância em Saúde—Ministério da Saúde 2017;48:1–11.
- 10. World Health Organization, Global Influenza Surveillance Network . Manual for the laboratory diagnosis and virological surveillance of influenza. Geneva, Switzerland: WHO Press; 2011. http://apps.who.int/iris/bitstream/10665/44518/1/9789241548090_eng.pdf [Google Scholar]
- 11. Weinberg GA. Parainfluenza viruses. Pediat Infect Dis J. 2006;25:447‐448. [DOI] [PubMed] [Google Scholar]
- 12. Calvo C, García‐García ML, Ambrona P, et al. The burden of infections by parainfluenza virus in hospitalized children in Spain. Pediat Infect Dis. 2011;30:792‐794. [DOI] [PubMed] [Google Scholar]
- 13. Pawełczyk M, Kowalski ML. The role of human parainfluenza virus infectins in the immunopathology of the respiratory tract. Curr Allergy Asthm R. 2017;17:16. [DOI] [PMC free article] [PubMed] [Google Scholar]
- 14. Weinberg GA, Hall CB, Iwane MK, et al. Parainfluenza virus infection of young children: estimates of the population‐based burden of hospitalization. J Pediatr. 2009;154:694‐699. [DOI] [PubMed] [Google Scholar]
- 15. Abedi GR, Prill MM, Langley GE, et al. Estimates of parainfluenza virus‐associated hospitalizations and cost among children aged less than 5 years in the United States, 1998–2010. J Pediatric Infect Dis Soc. 2016;5:7‐13. [DOI] [PMC free article] [PubMed] [Google Scholar]
- 16. Fé MMM, Monteiro AJ, Moura FEA. Parainfluenza virus infections in a tropical city: clinical and epidemiological aspects. Braz J Infect Dis. 2008;12:192‐197. [DOI] [PubMed] [Google Scholar]
- 17. Moghadami M. A narrative review of influenza: a seasonal and pandemic disease. Iran J Med Sci. 2017;42:2‐13. [PMC free article] [PubMed] [Google Scholar]
- 18. Taylor S, Lopez P, Weckx L, et al. Respiratory viruses and influenza‐like illness: Epidemiology and outcomes in children aged 6 months to 10 years in a multi‐country population sample. J Infection. 2016;74:29‐41. [DOI] [PMC free article] [PubMed] [Google Scholar]
- 19. Mourtzoukou EG, Falagas ME. Exposure to cold and respiratory tract infections. Int J Tuberc Lung Dis. 2007;11(9):938‐943. [PubMed] [Google Scholar]
- 20. Murphy B, Phelan PD, Jack I, Uren E. Seasonal pattern in childhood viral lower respiratory tract infections in Melbourne. Med J Australia. 1980;1:22‐24. [DOI] [PubMed] [Google Scholar]
- 21. Lina B, Valette M, Foray S, et al. Surveillance of community‐acquired viral infections due to respiratory viruses in Rhone‐Alpes (France) during winter 1994 to 1995. J Clin Microbiol. 1996;34:3007‐3011. [DOI] [PMC free article] [PubMed] [Google Scholar]
- 22. Shetty AK, Treynor E, Hill DW, Gutierrez KM, Warford A, Baron EJ. Comparison of conventional viral cultures with direct fluorescent antibody stains for diagnosis of community‐acquired respiratory virus infections in hospitalized children. Pediatr Infec Dis J. 2003;22:789‐794. [DOI] [PubMed] [Google Scholar]
- 23. Lukšić I, Kearns PK, Scott F, Rudan I, Campbell H, Nair H. Viral etiology of hospitalized acute lower respiratory infections in children under 5 years of age—a systematic review and meta‐analysis. Croat Med J. 2013;54:122‐134. [DOI] [PMC free article] [PubMed] [Google Scholar]
- 24. Wan Yee T, Rajadurai VS, Sriram B. Morbity of parainfluenza 3 outbreaks in preterm infants in a neonatal unit. Ann Acad Med Singapore. 2010;39:836‐837. [PubMed] [Google Scholar]
- 25. Nascimento JP, Siqueira MM, Sutmoller F, et al. Longitudinal study of acute respiratory diseases in Rio de Janeiro: occurrence of respiratory viruses during four consecutive years. Rev Inst Med Trop Sao Paulo. 1991;33:287‐296. [DOI] [PubMed] [Google Scholar]
- 26. Xie M, Ma Q, Chen X, Lu X, Zhong B. Epidemiological characteristics of seven respiratory viruses among pediatric patients with acute respiratory tract infections from 2011 to 2015 in Dongguan, Southern China. Braz J Infect Dis. 2017;21:486‐488. [DOI] [PMC free article] [PubMed] [Google Scholar]
- 27. Marx A, Torok TJ, Holman RC, Clarke MJ, Anderson LJ. Pediatric hospitalizations for croup (laryngotracheobronchitis): biennial increases associated with human parainfluenza virus 1 epidemics. J Infect Dis. 1997;176:1423‐1427. [DOI] [PubMed] [Google Scholar]
- 28. Mao N, Ji Y, Xie Z, et al. Human parainfluenza virus‐associated respiratory tract infection among children and genetic analysis of HPIV‐3 strains in Beijing, China. PLOS One. 2012;7:e43893. [DOI] [PMC free article] [PubMed] [Google Scholar]
- 29. Liu WK, Liu Q, Chen DH, et al. Epidemiology and clinical presentation of the four human parainfluenza virus types. BMC Infect Dis. 2013;13:28. [DOI] [PMC free article] [PubMed] [Google Scholar]
- 30. Laurichesse H, Dedman D, Watson JM, Zambon MC. Epidemiological features of parainfluenza virus infections: Laboratory surveillance in England and Wales, 1975‐1997. Eur J Epidemiol. 1999;15:475‐484. [DOI] [PubMed] [Google Scholar]
- 31. Monto AS. Epidemiology of viral respiratory infections. Am J Med. 1997;176:4‐12. [DOI] [PubMed] [Google Scholar]
- 32. Fry AM, Curns AT, Harbour K, Hutwagner L, Holman RC, Anderson LJ. Seasonal trends of human parainfluenza viral infections: United States, 1990‐2004. Clin Infect Dis. 2006;43:1016‐1022. [DOI] [PubMed] [Google Scholar]
- 33. Hall CB. Respiratory syncitial virus and parainflueza virus. Engl J. 2011;344:1917‐1928. [DOI] [PubMed] [Google Scholar]
- 34. Gregianini TS, Seadi CF, Menegolla I, et al. Human metapneumovirus in southern Brazil. Rev Soc Bras Med Trop. 2018;51:30‐38. [DOI] [PubMed] [Google Scholar]
- 35. Veiga ABG, Kretzmann NA, Correa LT, et al. Viral load and epidemiological profile of patients infected by pandemic influenza A(H1N1)2009 and seasonal influenza A virus in southern Brazil. J Med Virol. 2012;84:371‐379. [DOI] [PubMed] [Google Scholar]
- 36. Munoz FM Parainfluenza viruses in children. http://www.uptodate.com/contents/parainfluenza-viruses-in-children. Accessed 28 October 2017.
- 37. Porter DD, Prince GA, Hemming VG, Porter HG. Pathogenesis of human parainfluenza virus 3 infection in two species of cotton rats: Sigmodon hispidus develops bronchiolitis, while Sigmodon fulviventer develops interstitial pneumonia. J Virol. 1991;65:103‐111. [DOI] [PMC free article] [PubMed] [Google Scholar]
- 38. Parija SC, Marrie TJ. Parainfluenza virus: background pathophysiology, etiology. https://emedicine.medscape.com/article/224708-overview#showall. Accessed 14 September 2018.
- 39. Pecchini R, Berezin EN, Souza MC, et al. Parainfluenza virus as a cause of acute respiratory infection in hospitalized children. Braz J Infect Dis. 2015;19:358‐362. [DOI] [PMC free article] [PubMed] [Google Scholar]
- 40. Lakhan N, Clarke M, Mathew SM, Marshall H. Retrospective review of factors associated with severe hospitalised community‐acquired influenza in a tertiary paediatric hospital in South Australia. Influenza Other Respir Viruses. 2016;10:479‐485. [DOI] [PMC free article] [PubMed] [Google Scholar]
- 41. Borges LGA, Giongo A, Pereira LM, et al. Comparison of the nasopharynx microbiome between influenza and non‐influenza cases of severe acute respiratory infections: a pilot study. Health Sci Rep. 2018;1:e47 10.1002/hsr2.47 [DOI] [PMC free article] [PubMed] [Google Scholar]
- 42. Hung IFN, Li J, To K, Tam A, Chan J. High mortality associated with parainfluenza virus infection in hospitalized adults. Open Forum Infect Dis. 2017;4(suppl 1):s568. [Google Scholar]
- 43. Markov PV, Crowcroft NS. Modelling the unidentified mortality burden from thirteen infectious pathogenic microorganisms in infants. Epidemiol Infect. 2007;135:17‐26. [DOI] [PMC free article] [PubMed] [Google Scholar]
- 44. van Asten L, van den Wijngaard C, van Pelt W, et al. Mortality attributable to 9 common infections: significant effect of influenza A, respiratory syncytial virus, influenza B, norovirus, and parainfluenza in elderly persons. J Infect Dis. 2012;206:628‐639. [DOI] [PubMed] [Google Scholar]
- 45. Kim C, Ahmed JA, Eidex RB, et al. Comparison of nasopharyngeal and oropharyngeal swabs for the diagnosis of eight respiratory viruses by real‐time reverse transcription‐PCR assays. PLOS One. 2011;6:e21610. [DOI] [PMC free article] [PubMed] [Google Scholar]
- 46. Coiras MT, Aguilar JC, García M, Casas I, Pérez‐Breña P. Simultaneous detection of fourteen respiratory viruses in clinical specimens by two multiplex reverse transcription nested‐PCR assays. J Med Virol. 2004;72:484‐495. [DOI] [PMC free article] [PubMed] [Google Scholar]
- 47. Templeton KE, Scheltinga SA, Beersma MF, Kroes AC, Claas EC. Rapid and sensitive method using multiplex real‐time PCR for diagnosis of infections by influenza A and influenza B viruses, respiratory syncytial virus, and parainfluenza viruses 1, 2, 3, and 4. J Clin Microbiol. 2004;42:1564‐1569. [DOI] [PMC free article] [PubMed] [Google Scholar]