

Abstract
To investigate the time origin, genetic diversity, and transmission dynamics of the recent 2019‐nCoV outbreak in China and beyond, a total of 32 genomes of virus strains sampled from China, Thailand, and the USA with sampling dates between 24 December 2019 and 23 January 2020 were analyzed. Phylogenetic, transmission network, and likelihood‐mapping analyses of the genome sequences were performed. On the basis of the likelihood‐mapping analysis, the increasing tree‐like signals (from 0% to 8.2%, 18.2%, and 25.4%) over time may be indicative of increasing genetic diversity of 2019‐nCoV in human hosts. We identified three phylogenetic clusters using the Bayesian inference framework and three transmission clusters using transmission network analysis, with only one cluster identified by both methods using the above genome sequences of 2019‐nCoV strains. The estimated mean evolutionary rate for 2019‐nCoV ranged from 1.7926 × 10⁻³ to 1.8266 × 10⁻³ substitutions per site per year. On the basis of our study, undertaking epidemiological investigations and genomic data surveillance could positively impact public health in terms of guiding prevention efforts to reduce 2019‐nCOV transmission in real‐time.
Keywords: 2019‐nCoV, evolutionary rate, phylogenetic cluster, time to most recent common ancestor, TMRCA, transmission cluster
Highlights
On the basis of our results in the present study, the increasing tree‐like signals (from 0 to 8.2%, 18.2%, and 25.4%) over time may be indicative of increasing genetic diversity of 2019‐nCoV in human hosts. We only find one cluster identified by two methods (phylogenetic clusters using the Bayesian inference framework and transmission clusters using transmission network analysis). We estimated mean evolutionary rate for 2019‐nCoV ranged from 1.7926 × 10‐3 to 1.8266 × 10‐3 substitutions per site per year. Our study also highlights that undertaking epidemiological investigations and genomic data surveillance could positively impact public health in terms of guiding prevention efforts to reduce 2019‐nCOV transmission in real time.
1. INTRODUCTION
On 30 January 2020, the World Health Organization (WHO) declared the current outbreak of the novel coronavirus 2019‐nCoV, which was first detected in the Chinese city of Wuhan on 31 December 2019, a “public health emergency of international concern”—an alarm it reserves for events that pose a risk to multiple countries and which requires a coordinated international response. Previous studies have confirmed that this virus can spread from person to person after identifying clusters of cases among families, as well as transmission from patients to healthcare workers. 1 , 2 As of 3 February 2020, there have been 20 438 cases of 2019‐nCoV confirmed in mainland China, including 2788 serious, 425 deaths, and 632 discharged, as well as 15 in Hong Kong, 8 in Macao, and 10 in Taiwan. More than 150 cases had also been confirmed in at least 18 other countries on four continents. In epidemiological studies, the basic reproductive number (R 0) is defined as the possible number of infection cases generated from a single infected person at a particular time point during an outbreak and is often used to describe transmission dynamics over the course of a disease epidemic. On the basis of earlier research, the initial R 0 was estimated to be 2.2 (95% confidence interval, 1.4 to 3.9) among the first 425 patients with 2019‐nCoV‐induced pneumonia, 2 consistent with the preliminary estimate of 1.4 to 2.5 presented by the WHO during their International Health Regulations Emergency Committee meeting on the 2019‐nCoV outbreak. It is possible that subsequent control measures, such as the strict travel restrictions in Wuhan and China as well as overseas, may change or reduce the R 0 value over the course of the virus outbreak. Of note, the coronaviridae family not only includes 2019‐nCoV, but also severe acute respiratory syndrome coronavirus (SARS‐CoV), Middle East respiratory syndrome coronavirus (MERS‐CoV), and the common cold viruses in immunocompetent individuals (eg, 229E, OC43, NL63, and HKU1). 3 The SARS‐CoV pathogen was responsible for the 2002‐2003 outbreak of SARS in Guangdong Province, China, which resulted in more than 8000 cases and 774 deaths in 37 countries worldwide. 4 , 5 , 6 The MERS‐CoV pathogen was responsible for the 2012 outbreak of MERS, which resulted in 2494 cases and 858 deaths in 27 countries worldwide. 7 , 8 Notably, both SARS‐CoV and MERS‐CoV are zoonotic in origin, with prior studies revealing bats to be the animal host source, 9 , 10 , 11 , 12 and masked palm civets 13 , 14 , 15 and camels 16 , 17 to be the intermediate animal hosts (between bats and humans) of the two diseases, respectively. Recent research has also reported that the 2019‐nCoV virus is 96% identical at the genome level to a previously detected bat coronavirus, which belongs to a SARS‐related coronavirus species (ie, SARS‐CoV). 18 Like SARS‐CoV, MERS‐CoV, and many other coronaviruses, 2019‐nCoV likely originated in bats, but it remains unclear whether an intermediary animal host was involved before the virus jumped to humans. As reported in earlier research, however, although bats could be the original host of 2019‐nCoV, the virus may have initially been transmitted to an intermediate animal host sold at the Wuhan Huanan Seafood Wholesale Market, thus facilitating the emergence of 2019‐nCoV in humans. 19
In the present study, we investigated the time origin and genetic diversity of 2019‐nCoV in humans based on 32 genomes of virus strains sampled from China, Thailand, and the USA with known sampling dates between 24 December 2019 and 23 January 2020. We conducted a comprehensive genetic analysis of four 2019‐nCoV genome sequence datasets (ie, “dataset_14,” “dataset_24,” “dataset_30,” and “dataset_32”), and elucidated the transmission dynamics and evolutionary history of the virus outbreak in China, Thailand, and the USA. These analyses should extend our understanding of the origins and dynamics of the 2019‐nCoV outbreak in China and elsewhere.
2. MATERIALS AND METHODS
2.1. Collation of 2019‐nCoV genome datasets
As of 28 January 2020, 33 genomes of 2019‐nCoV obtained from humans have been released on GISAID (http://gisaid.org/). 20 The BetaCoV/Wuhan/IPBCAMS‐WH‐02/2019 (EPI_ISL_403931) sample shows evidence of sequencing artifacts due to the appearance of clustered spurious single‐nucleotide polymorphisms and thus was excluded in this study. The final dataset (“dataset_32”) included 32 genomes of 2019‐nCoV from China (n = 25), Thailand (n = 2), and USA (n = 5), with sampling dates between 24 December 2019 and 23 January 2020. Of the 25 samples collected from China, 14 were from Wuhan, Hubei Province, 6 were from Shenzhen, Guangdong Province, 2 were from Zhuhai, Guangdong Province, 2 were from Hangzhou, Zhejiang Province, and 1 was from Taiwan (Table S1). The sampling dates of BetaCoV/Shenzhen/HKU‐SZ‐005/2020 and BetaCoV/Shenzhen/HKU‐SZ‐002/2020 were known to the nearest month (January 2020). For this dataset, the 2019‐nCoV genomes were aligned using MAFFT v7.222 21 and then manually curated using BioEdit v7.2.5. 22 In addition, we subsampled three other datasets, that is, “dataset_14” collected between 24 December 2019 and 1 January 2020, comprising 14 genomes from Wuhan, Hubei Province, China; “dataset_24” collected between 24 December 2019 and 18 January 2020, comprising 24 genomes from China and Thailand; and “dataset_30” collected between 24 December 2019 and 23 January 2020, comprising 30 genomes from China, Thailand, and USA.
2.2. Recombination and phylogenetic analyses
To assess the recombination for the full dataset (ie, “dataset_32”), we employed the pairwise homoplasy index (PHI) test to measure the similarity between closely linked sites using SplitsTree v4.15.1. 23 The best‐fit nucleotide substitution model for “dataset_32” was identified according to the Akaike information criterion (AIC), small‐sample corrected AIC (AICc), Bayesian information criterion (BIC), and performance‐based decision theory (DT) method with 3 (24 candidate models) or 11 (88 candidate models) substitution schemes in jModelTest v2.1.10. 24 To evaluate the phylogenetic signals of the datasets, we performed likelihood‐mapping analysis 25 using TREE‐PUZZLE v5.3, 26 with 35 000 to 80 000 randomly chosen quartets for the four datasets. Maximum‐likelihood (ML) phylogenies were reconstructed using the Hasegawa‐Kishino‐Yano (HKY) nucleotide substitution model in PhyML v3.1. 27 Bootstrap support values were calculated with 1000 replicates and trees were midpoint rooted. Regression analyses were used to determine the correlations among sampling dates and root‐to‐tip genetic divergences of the four ML phylogenies using TempEst v1.5. 28
2.3. Reconstruction of time‐scaled phylogenies
To reconstruct the evolutionary history of 2019‐nCoV, Bayesian inference through a Markov chain Monte Carlo (MCMC) framework was implemented in BEAST v1.8.4, 29 with the BEAGLE library program (v2.1.2) 30 used to improve computation. For each dataset, we employed HKY, as well as a constant size coalescent tree prior and strict molecular clock model to estimate the time to a most recent common ancestor (TMRCA). We then used two schemes to set the time scale prior for each dataset, that is, constrained evolutionary rate method with a lognormal prior (mean = 1.0 × 10⁻³ substitutions per site per year; 95% Bayesian credible interval (BCI): 1.854 × 10⁻⁴‐4 × 10⁻³ substitutions per site per year) placed on the evolutionary rate parameter based on previous studies 31 , 32 , 33 and the tip‐dating method, for which the evolutionary rate for each dataset was also estimated. To ensure adequate mixing of model parameters, MCMC chains were run for 100 million steps with sampling every 10 000 steps from the posterior distribution. Convergence was evaluated by calculating the effective sample sizes of the parameters using Tracer v1.7.1. 34 All parameters had an effective sample size of more than 200, indicative of sufficient sampling. Trees were summarized as maximum clade credibility (MCC) trees using TreeAnnotator v1.8.4 after discarding the first 10% as burn‐in and then visualized in FigTree v1.4.4 (http://tree.bio.ed.ac.uk/software/figtree).
2.4. Transmission network reconstruction
The HIV TRAnsmission Cluster Engine (http://www.hivtrace.org) 35 was employed to infer transmission network clusters for the full dataset (ie, “dataset_32”). All pairwise distances were calculated and a putative linkage between each pair of genomes was considered whenever their divergence was less than equal to 0.0001 (0.01%) or less than equal to 0.00001 (0.001%) substitutions/site (TN93 substitution model). Multiple linkages were then combined into putative transmission clusters. Clusters comprised of only two linked nodes were identified as dyads. This approach detects transmission clusters in which the clustering strains are genetically similar, implying a direct or indirect epidemiological connection.
3. RESULTS
3.1. Demographic characteristics of the full dataset
“Dataset_32” included 32 genomes of 2019‐nCoV strains sampled from China (Wuhan, n = 14; Shenzhen, n = 6; Zhuhai, n = 2; Hangzhou, n = 2; Taiwan, n = 1), Thailand (n = 2), and USA (n = 5) with sampling dates between 24 December 2019 and 23 January 2020 (Table S1). The samples were primarily from China (78.125%) and Wuhan (43.75%), the Chinese city identified as the region of the original 2019‐nCoV outbreak.
3.2. Tree‐like signals and phylogenetic analyses
For “dataset_32”, the HKY model provided the best fit across the four different methods (ie, AIC, AICc, BIC, and DT) and two different substitution schemes (ie, 24 and 88 candidate models), and was thus used in subsequent likelihood‐mapping and phylogenetic analyses for the four datasets. The PHI test of “dataset_32” did not find statistically significant evidence for recombination (P = 1.0). Likelihood‐mapping analysis of “dataset_14” revealed that 100% of the quartets were distributed in the center of the triangle, indicating a strong star‐like topology signal reflecting a novel virus, which may be due to exponential epidemic spread (Figure 1A). Likewise, 91.9%, 81.8%, and 74.7% of the quartets from “dataset_24,” “dataset_30,” and “dataset_32,” respectively, were distributed in the center of the triangle, indicating relatively more phylogenetic signals as additional sequences were analyzed over time (Figure 1B‐D). ML phylogenetic analysis of the four datasets also showed star‐like topologies, in accordance with the likelihood‐mapping results (Figure 2). Root‐to‐tip regression analyses between genetic divergence and sampling date using the best‐fitting root showed that “dataset_14” had a relatively strong positive temporal signal (R 2 = .2967; correlation coefficient = .5446) (Figure 3A). In contrast, “dataset_24” had a minor negative temporal signal (R 2 = 4.4428 × 10⁻²; correlation coefficient = −.2108) (Figure 3B); whereas, “dataset_30” and “dataset_32” both had minor positive temporal signals (R 2 = 1.2155 × 10⁻²; correlation coefficient = .1102 and R 2 = 1.1506 × 10⁻²; correlation coefficient = .1073) (Figure 3C,D). On the basis of Bayesian time‐scaled phylogenetic analysis using the constrained evolutionary rate method with a lognormal prior (mean = 1.0 × 10⁻³ substitutions per site per year; 95% BCI: 1.854 × 10⁻⁴‐4 × 10⁻³ substitutions per site per year) placed on the evolutionary rate parameter, we estimated the TMRCA dates for 2019‐nCoV from the four datasets, that is, 1 November 2019 (95% BCI: 21 July 2019 and 29 December 2019), 10 November 2019 (95% BCI: 16 July 2019 and 16 January 2020), 21 October 2019 (95% BCI: 20 May 2019 and 19 January 2020), and 15 October 2019 (95% BCI: 2 May 2019 and 17 January 2020) for “dataset_14,” “dataset_24,” “dataset_30,” and “dataset_32,” respectively (Table 1). Furthermore, based on Bayesian time‐scaled phylogenetic analysis using the tip‐dating method, we also estimated the TMRCA dates and evolutionary rates from “dataset_30” and “dataset_32,” with resulting showing 6 December 2019 (95% BCI: 16 November 2019 and 22 December 2019) and 6 December 2019 (95% BCI: 16 November 2019 and 21 December 2019), respectively; and 1.7926 × 10⁻³ substitutions per site per year (95% BCI: 7.216 × 10⁻⁴‐3.0558 × 10⁻³) and 1.8266 × 10⁻³ substitutions per site per year (95% BCI: 7.5813 × 10⁻⁴‐3.0883 × 10⁻³), respectively (Table 1). Due to poor convergence in the MCMC chains, we did not obtain the TMRCA date and evolutionary rate from “dataset_14” and “dataset_24.” The estimates of the MCC phylogenetic relationships among the 2019‐nCoV genomes from the Bayesian coalescent framework using the constrained evolutionary rate method with a lognormal prior (mean = 1.0 × 10⁻³ substitutions per site per year; 95% BCI: 1.854 × 10⁻⁴‐4 × 10⁻³ substitutions per site per year) placed on the evolutionary rate parameter and using the tip‐dating method are displayed in Figures 4 and 5, respectively. As shown, three phylogenetic clusters (number of sequences 2‐6; posterior probability .99‐1.0) were identified, that is, Guangdong/20SF028/2020 and Guangdong/20SF040/2020 from Zhuhai, Guangdong Province, China, reported from a family cluster infection; USA/CA2/2020 and Taiwan/2/2020 from USA and Taiwan; Guangdong/20SF012/2020, Guangdong/20SF013/2020, Guangdong/20SF025/2020, Shenzhen/HKU‐SZ‐002/2020, Shenzhen/HKU‐SZ‐005/2020, and USA/AZ1/2020 from Shenzhen, Guangdong Province, China, and USA, which included five genomes (Guangdong/20SF012/2020, Guangdong/20SF013/2020, Guangdong/20SF025/2020, Shenzhen/HKU‐SZ‐002/2020, and Shenzhen/HKU‐SZ‐005/2020) reported from a family cluster infection.
Figure 1.
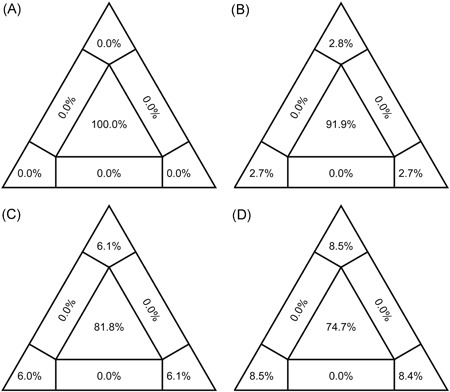
Likelihood‐mapping analyses of 2019‐nCOV. Likelihoods of three tree topologies for each possible quartet (or for a random sample of quartets) are denoted by a data point in an equilateral triangle. The distribution of points in seven areas of triangle reflects tree‐likeness of data. Specifically, three corners represent fully resolved tree topologies; center represents an unresolved (star) phylogeny; and sides represent support for conflicting tree topologies. Results of likelihood‐mapping analyses of four datasets (A, “dataset_14”; B, “dataset_24”; C, “dataset_30”; and D, “dataset_32”) are shown
Figure 2.
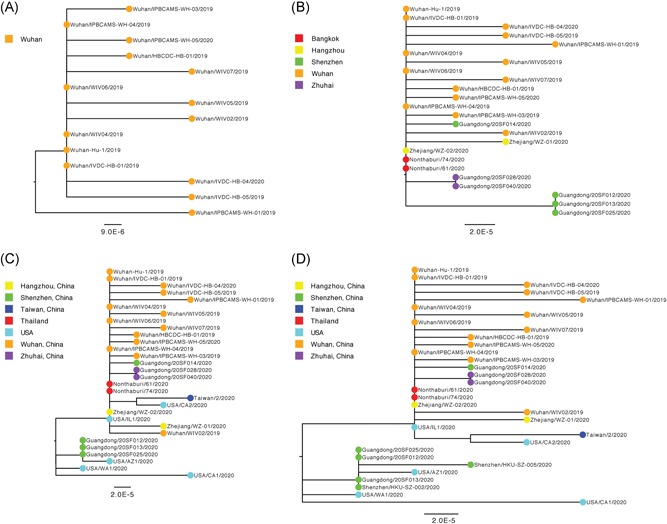
Estimated maximum‐likelihood phylogenies of 2019‐nCOV. Colors indicate different sampling locations. The tree is midpoint rooted. Results of maximum‐likelihood phylogenetic analyses of four datasets (A, “dataset_14”; B, “dataset_24”; C, “dataset_30”; and D, “dataset_32”) are shown
Figure 3.
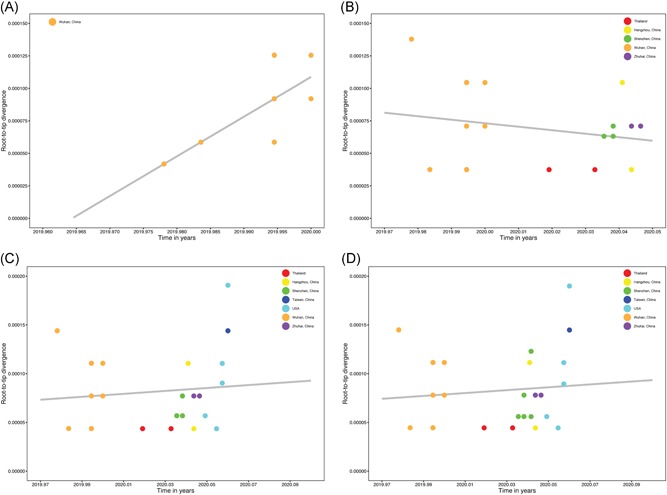
Regression of root‐to‐tip genetic distance against the year of sampling for 2019‐nCOV. Colors indicate different sampling locations. Gray indicates the linear regression line. Results of linear regression analyses of four datasets (A, “dataset_14”; B, “dataset_24”; C, “dataset_30”; and D, “dataset_32”) are shown
Table 1.
Estimated TMRCA of sampled 2019‐nCoV genome datasets used for genetic analysis
| Dataset | No. sequences | Estimated TMRCA | |||||
|---|---|---|---|---|---|---|---|
| Evolutionary rate informed method | Tip‐dated method | ||||||
| Mean | Lower 95% BIC | Upper 95% BIC | Mean | Lower 95% BIC | Upper 95% BIC | ||
| Dataset 1 | 14 | 11/1/19 | 7/21/19 | 12/29/19 | NA | NA | NA |
| Dataset 2 | 24 | 11/10/19 | 7/16/19 | 1/16/20 | NA | NA | NA |
| Dataset 3 | 30 | 10/21/19 | 5/20/19 | 1/19/20 | 12/6/19 | 11/16/19 | 12/22/19 |
| Dataset 4 | 32 | 10/15/19 | 5/2/19 | 1/17/20 | 12/6/19 | 11/16/19 | 12/21/19 |
Abbreviations: BIC, Bayesian information criterion; NA, not available; TMRCA, time to most recent common ancestor.
This article is being made freely available through PubMed Central as part of the COVID-19 public health emergency response. It can be used for unrestricted research re-use and analysis in any form or by any means with acknowledgement of the original source, for the duration of the public health emergency.
Figure 4.
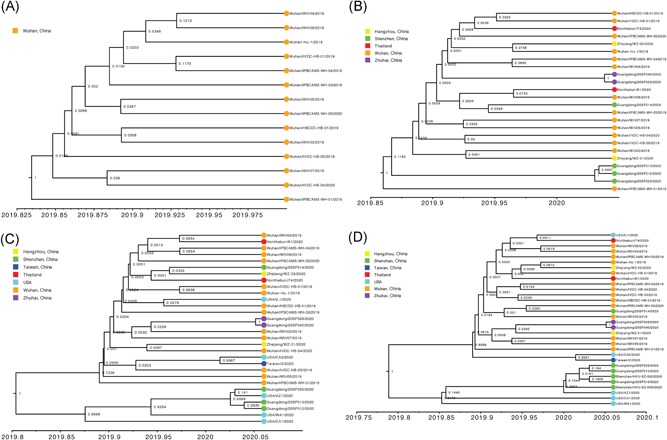
Estimated maximum clade credibility tree of 2019‐nCOV using constrained evolutionary rate. Colors indicate different sampling locations. Nodes are labeled with posterior probability values. Estimated maximum clade credibility tree of four datasets (A, “dataset_14”; B, “dataset_24”; C, “dataset_30”; and D, “dataset_32”) are shown
Figure 5.
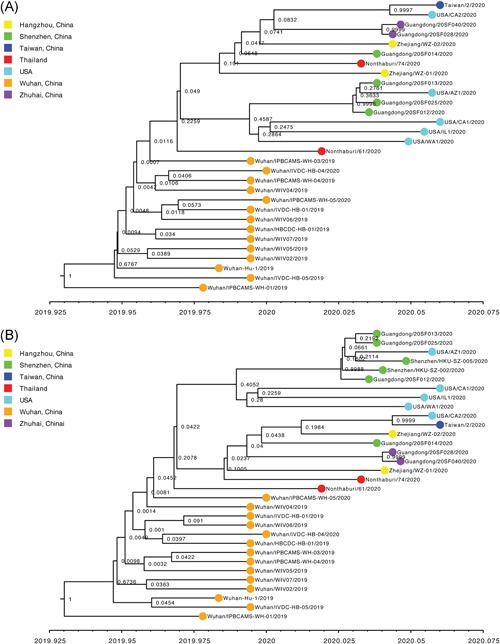
Estimated maximum clade credibility tree of 2019‐nCOV using the tip‐dating method. Colors indicate different sampling locations. Nodes are labeled with posterior probability values. Estimated maximum clade credibility tree of four datasets (A, “dataset_30”; and B, “dataset_32”) are shown
3.3. Transmission network analysis
We considered individuals as genetically linked when the genetic distance between 2019‐nCoV strains was less than 0.01% substitutions/site. This allowed us to identify a single large transmission cluster that included 30 of 32 (93.75%) genomes, thus suggesting low genetic divergence for “dataset_32” (Figure 6A). We also considered individuals as genetically linked when the genetic distance between 2019‐nCoV strains was less than 0.001% substitutions/site. This allowed us to identify three transmission clusters that included 15 of 32 (46.875%) genomes for “dataset_32” (Figure 6B). Clusters ranged in size from two to nine genomes. Two clusters, which contained two (Guangdong/20SF028/2020 and Guangdong/20SF040/2020) and four genomes (Guangdong/20SF012/2020, Guangdong/20SF013/2020, Guangdong/20SF025/2020, and Shenzhen/HKU‐SZ‐002/2020), respectively, included individuals sampled exclusively from Zhuhai and Shenzhen, respectively. The largest cluster of nine genomes included five sampled from Wuhan (Wuhan‐Hu‐1/2019, Wuhan/IVDC‐HB‐01/2019, Wuhan/WIV04/2019, Wuhan/WIV06/2019, and Wuhan/IPBCAMS‐WH‐04/2019), one sampled from Hangzhou (Zhejiang/WZ‐02/2020), two sampled from Thailand (Nonthaburi/61/2020 and Nonthaburi/74/2020), and one sampled from USA (USA/IL1/2020).
Figure 6.
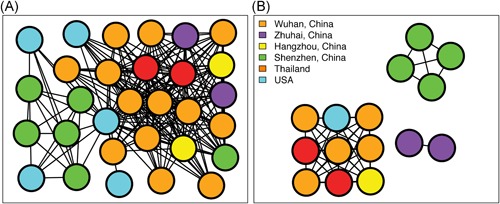
Transmission clusters of 2019‐nCOV. Structure of inferred 2019‐nCOV transmission clusters from full dataset (“dataset_32”) using genetic distances of less than 0.01% and less than 0.001% substitutions/site are illustrated in (A) and (B), respectively. Nodes (circles) represent connected individuals in the overall network, and putative transmission linkages are represented by edges (lines). Nodes are color‐coded by sampling locations
4. DISCUSSION
On the basis of “dataset_32,” which included 32 genomes of 2019‐nCoV strains sampled from China (Wuhan, n = 14; Shenzhen, n = 6; Zhuhai, n = 2; Hangzhou, n = 2; Taiwan, n = 1), Thailand (n = 2), and USA (n = 5) with sampling dates between 24 December 2019 and 23 January 2020, and subsampled “dataset_14,” “dataset_24,” and “dataset_30,” which included 14, 24, and 30 2019‐nCoV strain genomes, respectively, our likelihood‐mapping analysis confirmed additional tree‐like signals (from 0% to 8.2%, 18.2%, and 25.4%) over time, thus indicating increasing genetic divergence of 2019‐nCoV in human hosts (Figure 1). Of note, the strong star‐like signal (100% of quartets were distributed in the center of the triangle) from “dataset_14” at the beginning of the virus outbreak suggests that 2019‐nCoV initially exhibited low genetic divergence, with recent and rapid human‐to‐human transmission. This result is consistent with the ML phylogenetic analyses, which showed polytomy topology from “dataset_14” (Figure 2A). The genetic divergence from “dataset_32” and “dataset_30” was higher than that for “dataset_14,” but still demonstrated minor temporal signals (Figure 3). Using the constrained evolutionary rate method, the mean TMRCA dates for 2019‐nCoV based on the four datasets ranged from 15 October to 10 November 2019, when using a lognormal prior (mean = 1.0 × 10⁻³ substitutions per site per year; 95% BCI: 1.854 × 10⁻⁴‐4 × 10⁻³ substitutions per site per year) placed on the evolutionary rate parameter (Table 1). This is considered reasonable given the limited genetic divergence and strong star‐like signals and is also consistent with our previous study. 36 Using the tip‐dating method, the mean TMRCA date and evolutionary rate for 2019‐nCoV based on the “dataset_30” and “dataset_32” ranged from 16 November to 22 December 2019 and from 1.7926 × 10⁻³ to 1.8266 × 10⁻³ substitutions per site per year, respectively (Table 1). The TMRCA estimated by the tip‐dating method was relatively narrower than that determined by the constrained evolutionary rate method. We identified three phylogenetic clusters with posterior probabilities between .99 and 1.0 using Bayesian inference (Figures 4 and 5). We also identified three transmission clusters when the genetic distance between the 2019‐nCoV strains was less than 0.001% substitutions/site (Figure 6). Intriguingly, only one cluster (Guangdong/20SF028/2020 and Guangdong/20SF040/2020 from Zhuhai) was identified by both phylogenetic and network‐based methods. This is a good example showing the differences between phylogenetic (posterior probability or bootstrap value) and network‐based (genetic distance) methods. However, our conclusions should be considered preliminary and explained with caution due to the limited number of 2019‐nCOV genome sequences presented in this study.
The first genome sequence of 2019‐nCoV was made public in early January 2020, with several dozen—taken from various people—now available. The genome sequences of 2019‐nCoV have already led to diagnostic tests, as well as efforts to study its dispersal and evolution. As the outbreak continues, we will require multiple genome sequences of samples over the course of the outbreak and from different locations to determine how the virus evolves. We also need to gain a better understanding of the virus's biology, especially compared to findings from previous studies on the SARS and MERS viruses. For instance, 2019‐nCoV can kill cultured human cells, entering them via the same molecular receptor as SARS‐CoV. 18 Therefore, it is essential that we isolate, share, and study virus samples, both in China and elsewhere, to identify animals that exhibit similar infection to humans for drug and vaccine testing, to better understand virus transmission (eg, airborne or close contact), and to develop blood tests for viral antibodies. Currently, 2019‐nCoV has primarily caused severe illness and death in older people, particularly those with pre‐existing conditions such as diabetes and heart disease. Although this virus does not typically infect or kill young and healthy individuals, a 36‐year‐old Wuhan man with no known pre‐existing health conditions has been the youngest victim reported so far. In situations where a virus jumps from one animal host to another species—which is probably how this coronavirus initially infected humans—most mutations are detrimental to or have no effect on the virus, and selection pressure may improve survival in the new host. Therefore, we predict that one or more mutations may be selected and sustained during the 2019‐nCoV outbreak as the virus adapts to human hosts and possibly reduces its virulence, as reported in the previous study. 37 However, we are uncertain whether this will influence its transmissibility.
In conclusion, our results emphasize the importance of likelihood‐mapping, transmission network, and phylogenetic analyses in providing insights into the time origin, genetic diversity, and transmission dynamics of 2019‐nCOV. Improving the linkage between patient records and genome sequence data would also allow large‐scale studies to be undertaken. Such research could directly influence public health in terms of prevention efforts introduced to reduce virus transmission in real‐time.
CONFLICT OF INTERESTS
The authors declare that there are no conflict of interests.
AUTHOR CONTRIBUTIONS
XL conceived and designed the study and drafted the manuscript. XL and AC analyzed the data. XL, WW, XZ, JZ, QZ, YL, and AC interpreted the data and provided critical comments. All authors reviewed and approved the final manuscript.
Supporting information
Supporting information
ACKNOWLEDGMENTS
This study was supported by a grant from the National Natural Science Foundation of China (No. 31470268) to Yi Li. This study was also supported by the Project of Guangxi Health Committee (No. Z20191111) and the Natural Science Foundation of Guangxi Province of China (No. 2017GXNSFAA198080) to deputy director of the physician of Xiaofang Zhao. This study was sponsored by the K.C. Wong Magna Fund in Ningbo University. We gratefully acknowledge the Authors and Originating and Submitting Laboratories for their sequences and metadata shared through GISAID, 20 on which this study is based.
EPI_ISL_402119, EPI_ISL_402120, EPI_ISL_402121:
Originating and submitting lab—National Institute for Viral Disease Control and Prevention, China CDC.
Authors—Wenjie Tan, Xiang Zhao, Wenling Wang, Xuejun Ma, Yongzhong Jiang, Roujian Lu, Ji Wang, Weimin Zhou, Peihua Niu, Peipei Liu, Faxian Zhan, Weifeng Shi, Baoying Huang, Jun Liu, Li Zhao, Yao Meng, Xiaozhou He, Fei Ye, Na Zhu, Yang Li, Jing Chen, Wenbo Xu, George F. Gao, Guizhen Wu.
EPI_ISL_402123:
Originating and submitting lab—Institute of Pathogen Biology, Chinese Academy of Medical Sciences & Peking Union Medical College.
Authors—Lili Ren, Jianwei Wang, Qi Jin, Zichun Xiang, Yongjun Li, Zhiqiang Wu, Chao Wu, Yiwei Liu.
EPI_ISL_402124, EPI_ISL_402127, EPI_ISL_402128, EPI_ISL_402129, EPI_ISL_402130:
Originating lab—Wuhan Jinyintan Hospital.
Submitting lab—Wuhan Institute of Virology, Chinese Academy of Sciences.
Authors—Peng Zhou, Xing‐Lou Yang, Ding‐Yu Zhang, Lei Zhang, Yan Zhu, Hao‐Rui Si, Zheng‐Li Shi.
EPI_ISL_402124:
Originating lab—Unknown.
Submitting lab—National Institute for Communicable Disease Control and Prevention (ICDC), Chinese Center for Disease Control and Prevention (China CDC)
Authors—‐F Wu, S Zhao, B Yu, Y‐M Chen, W Wang, Y Hu, Z‐G Song, Z‐W Tao, J‐H Tian, Y‐Y Pei, ML Yuan, Y‐L Zhang, F‐H Dai, Y Liu, Q‐M Wang, J‐J Zheng, L Xu, EC Holmes, and Y‐Z Zhang.
EPI_ISL_402128, EPI_ISL_402129, EPI_ISL_402130, EPI_ISL_402131:
Originating and submitting lab—Institute of Pathogen Biology, Chinese Academy of Medical Sciences & Peking Union Medical College.
Authors—Lili Ren, Jianwei Wang, Qi Jin, Zichun Xiang, Zhiqiang Wu, Chao Wu, Yiwei Liu.
EPI_ISL_402132:
Originating lab—Wuhan Jinyintan Hospital.
Submitting lab—Hubei Provincial Center for Disease Control and Prevention.
Authors—Bin Fang, Xiang Li, Xiao Yu, Linlin Liu, Bo Yang, Faxian Zhan, Guojun Ye, Xixiang Huo, Junqiang Xu, Bo Yu, Kun Cai, Jing Li, Yongzhong Jiang.
EPI_ISL_403962, EPI_ISL_403963:
Originating lab—Bamrasnaradura Hospital.
Submitting lab—Department of Medical Sciences, Ministry of Public Health, Thailand, Thai Red Cross Emerging Infectious Diseases ‐ Health Science Center, and Department of Disease Control, Ministry of Public Health, Thailand.
Authors—Pilailuk, Okada; Siripaporn, Phuygun; Thanutsapa, Thanadachakul; Supaporn, Wacharapluesadee; Sittiporn, Parnmen; Warawan, Wongboot; Sunthareeya, Waicharoen; Rome, Buathong; Malinee, Chittaganpitch; Nanthawan, Mekha.
EPI_ISL_404227, EPI_ISL_404228
Originating lab—Zhejiang Provincial Center for Disease Control and Prevention.
Submitting lab—Department of Microbiology, Zhejiang Provincial Center for Disease Control and Prevention.
Authors ‐ Yin Chen, Yanjun Zhang, Haiyan Mao, Junhang Pan, Xiuyu Lou, Yiyu Lu, Juying Yan, Hanping Zhu, Jian Gao, Yan Feng, Yi Sun, Hao Yan, Zhen Li, Yisheng Sun, Liming Gong, Qiong Ge, Wen Shi, Xinying Wang, Wenwu Yao, Zhangnv Yang, Fang Xu, Chen Chen, Enfu Chen, Zhen Wang, Zhiping Chen, Jianmin Jiang, Chonggao Hu.
EPI_ISL_403932, EPI_ISL_403933, EPI_ISL_4039324, EPI_ISL_403935, EPI_ISL_403936, EPI_ISL_403937
Originating lab—Guangdong Provincial Center for Disease Control and Prevention; Guangdong Provincial Public Health.
Submitting lab—Department of Microbiology, Guangdong Provincial Center for Disease Control and Prevention.
Authors—Min Kang, Jie Wu, Jing Lu, Tao Liu, Baisheng Li, Shujiang Mei, Feng Ruan, Lifeng Lin, Changwen Ke, Haojie Zhong, Yingtao Zhang, Lirong Zou, Xuguang Chen, Qi Zhu, Jianpeng Xiao, Jianxiang Geng, Zhe Liu, Jianxiong Hu, Weilin Zeng, Xing Li, Yuhuang Liao, Xiujuan Tang, Songjian Xiao, Ying Wang, Yingchao Song, Xue Zhuang, Lijun Liang, Guanhao He, Huihong Deng, Tie Song, Jianfeng He, Wenjun Ma.
EPI_ISL_405839, EPI_ISL_406030
Originating lab—University of Hong Kong ‐ Shenzhen Hospital.
Submitting lab—Li Ka Shing Faculty of Medicine, University of Hong Kong.
Authors—‐JF‐W Chan, S Yuan, KH Kok, KK‐W To, H Chu, J Yang, F Xing, J Liu, CC‐Y Yip, RW‐S Poon, HW Tsai, SK‐F Lo, KH Chan, VK‐M Poon, WM Chan, JD Ip, JP Cai, VC‐C Cheng, H Chen, CK‐M Hui, and KY Yuen.
EPI_ISL_406031
Originating and submitting lab—Centers for Disease Control, Taiwan.
Authors—Ji‐Rong Yang, Yu‐Chi Lin, Jung‐Jung Mu, Ming‐Tsan Liu, Shu‐Ying Li.
EPI_ISL_404253
Originating lab—IL Department of Public Health Chicago Laboratory.
Submitting lab—Pathogen Discovery, Respiratory Viruses Branch, Division of Viral Diseases, Centers for Disease Control and Prevention.
Authors—Ying Tao, Krista Queen, Clinton R. Paden, Jing Zhang, Yan Li, Anna Uehara, Xiaoyan Lu, Brian Lynch, Senthil Kumar K. Sakthivel, Brett L. Whitaker, Shifaq Kamili, Lijuan Wang, Janna' R. Murray, Susan I. Gerber, Stephen Lindstrom, Suxiang Tong.
EPI_ISL_406034, EPI_ISL_406036
Originating lab—California Department of Public Health.
Submitting lab—Pathogen Discovery, Respiratory Viruses Branch, Division of Viral Diseases, Centers for Disease Control and Prevention.
Authors—Anna Uehara, Krista Queen, Ying Tao, Yan Li, Clinton R. Paden, Jing Zhang, Xiaoyan Lu, Brian Lynch, Senthil Kumar K. Sakthivel, Brett L. Whitaker, Shifaq Kamili, Lijuan Wang, Janna' R. Murray, Susan I. Gerber, Stephen Lindstrom, Suxiang Tong.
EPI_ISL_406223
Originating lab—Arizona Department of Health Services.
Submitting lab—Pathogen Discovery, Respiratory Viruses Branch, Division of Viral Diseases, Centers for Disease Control and Prevention.
Authors—Ying Tao, Clinton R. Paden, Krista Queen, Anna Uehara, Yan Li, Jing Zhang, Xiaoyan Lu, Brian Lynch, Senthil Kumar K. Sakthivel, Brett L. Whitaker, Shifaq Kamili, Lijuan Wang, Janna' R. Murray, Susan I. Gerber, Stephen Lindstrom, Suxiang Tong.
EPI_ISL_404895
Originating lab—Providence Regional Medical Center.
Submitting lab—Division of Viral Diseases, Centers for Disease Control and Prevention.
Authors—K Queen, Y Tao, Y Li, CR Paden, X Lu, J Zhang, SI Gerber, S Lindstrom, S Tong.
Li X, Wang W, Zhao X, et al. Transmission dynamics and evolutionary history of 2019‐nCoV. J Med Virol. 2020;92:501–511. 10.1002/jmv.25701
Xingguang Li, Wei Wang, Xiaofang Zhao, Junjie Zai, and Qiang Zhao contributed equally to this study.
Contributor Information
Xingguang Li, Email: xingguanglee@hotmail.com.
Yi Li, Email: liyi@whsw.edu.cn.
Antoine Chaillon, Email: achaillon@health.ucsd.edu.
REFERENCES
- 1. Chan JFW, Yuan S, Kok KH, et al. A familial cluster of pneumonia associated with the 2019 novel coronavirus indicating person‐to‐person transmission: a study of a family cluster. Lancet. 2020. 10.1016/S0140-6736(20)30154-9 [DOI] [PMC free article] [PubMed] [Google Scholar]
- 2. Li Q, Guan X, Wu P, et al. Early transmission dynamics in Wuhan, China, of novel coronavirus‐infected pneumonia. N Engl J Med. 2020. 10.1056/NEJMoa2001316 [DOI] [PMC free article] [PubMed] [Google Scholar]
- 3. Su S, Wong G, Shi W, et al. Epidemiology, genetic recombination, and pathogenesis of coronaviruses. Trends Microbiol. 2016;24:490‐502. 10.1016/j.tim.2016.03.003 [DOI] [PMC free article] [PubMed] [Google Scholar]
- 4. Drosten C, Günther S, Preiser W, et al. Identification of a novel coronavirus in patients with severe acute respiratory syndrome. N Engl J Med. 2003;348:1967‐1976. 10.1056/NEJMoa030747 [DOI] [PubMed] [Google Scholar]
- 5. Ksiazek TG, Erdman D, Goldsmith CS, et al. A novel coronavirus associated with severe acute respiratory syndrome. N Engl J Med. 2003;348:1953‐1966. 10.1056/NEJMoa030781 [DOI] [PubMed] [Google Scholar]
- 6. Zhong N, Zheng B, Li Y, et al. Epidemiology and cause of severe acute respiratory syndrome (SARS) in Guangdong, People's Republic of China, in February 2003. Lancet. 2003;362:1353‐1358. 10.1016/s0140-6736(03)14630-2 [DOI] [PMC free article] [PubMed] [Google Scholar]
- 7. Zaki AM, van Boheemen S, Bestebroer TM, Osterhaus AD, Fouchier RA. Isolation of a novel coronavirus from a man with pneumonia in Saudi Arabia. N Engl J Med. 2012;367:1814‐1820. 10.1056/NEJMoa1211721 [DOI] [PubMed] [Google Scholar]
- 8. de Groot RJ, Baker SC, Baric RS, et al. Middle East respiratory syndrome coronavirus (MERS‐CoV): announcement of the Coronavirus Study Group. J Virol. 2013;87:7790‐7792. 10.1128/JVI.01244-13 [DOI] [PMC free article] [PubMed] [Google Scholar]
- 9. Lau SKP, Li KSM, Huang Y, et al. Ecoepidemiology and complete genome comparison of different strains of severe acute respiratory syndrome‐related Rhinolophus bat coronavirus in China reveal bats as a reservoir for acute, self‐limiting infection that allows recombination events. J Virol. 2010;84:2808‐2819. 10.1128/JVI.02219-09 [DOI] [PMC free article] [PubMed] [Google Scholar]
- 10. Guan Y, Zheng BJ, He YQ, et al. Isolation and characterization of viruses related to the SARS coronavirus from animals in southern China. Science. 2003;302:276‐278. 10.1126/science.1087139 [DOI] [PubMed] [Google Scholar]
- 11. Lau SKP, Woo PCY, Li KSM, et al. Severe acute respiratory syndrome coronavirus‐like virus in Chinese horseshoe bats. Proc Natl Acad Sci USA. 2005;102:14040‐14045. 10.1073/pnas.0506735102 [DOI] [PMC free article] [PubMed] [Google Scholar]
- 12. Li W, Shi Z, Yu M, et al. Bats are natural reservoirs of SARS‐like coronaviruses. Science. 2005;310:676‐679. 10.1126/science.1118391 [DOI] [PubMed] [Google Scholar]
- 13. Song HD, Tu CC, Zhang GW, et al. Cross‐host evolution of severe acute respiratory syndrome coronavirus in palm civet and human. Proc Natl Acad Sci U S A. 2005;102:2430‐2435. 10.1073/pnas.0409608102 [DOI] [PMC free article] [PubMed] [Google Scholar]
- 14. Chinese SARS Molecular Epidemiology Consortium . Molecular evolution of the SARS coronavirus during the course of the SARS epidemic in China. Science. 2004;303:1666‐1669. 10.1126/science.1092002 [DOI] [PubMed] [Google Scholar]
- 15. Wang M, Yan M, Xu H, et al. SARS‐CoV infection in a restaurant from palm civet. Emerg Infect Dis. 2005;11:1860‐1865. 10.3201/eid1112.041293 [DOI] [PMC free article] [PubMed] [Google Scholar]
- 16. Müller MA, Corman VM, Jores J, et al. MERS coronavirus neutralizing antibodies in camels, Eastern Africa, 1983‐1997. Emerg Infect Dis. 2014;20:2093‐2095. 10.3201/eid2012.141026 [DOI] [PMC free article] [PubMed] [Google Scholar]
- 17. Chu DKW, Poon LLM, Gomaa MM, et al. MERS coronaviruses in dromedary camels, Egypt. Emerg Infect Dis. 2014;20:1049‐1053. 10.3201/eid2006.140299 [DOI] [PMC free article] [PubMed] [Google Scholar]
- 18. Zhou P, Yang XL, Wang XG, et al. Discovery of a novel coronavirus associated with the recent pneumonia outbreak in humans and its potential bat origin. BioRxiv. 2020. 10.1101/2020.01.22.914952 [DOI] [Google Scholar]
- 19. Lu R, Zhao X, Li J, et al. Genomic characterisation and epidemiology of 2019 novel coronavirus: implications for virus origins and receptor binding. Lancet. 2020. 10.1016/S0140-6736(20)30251-8 [DOI] [PMC free article] [PubMed] [Google Scholar]
- 20. Elbe S, Buckland‐Merrett G. Data, disease and diplomacy: GISAID's innovative contribution to global health. Glob Chall. 2017;1:33‐46. 10.1002/gch2.1018 [DOI] [PMC free article] [PubMed] [Google Scholar]
- 21. Katoh K, Standley DM. MAFFT multiple sequence alignment software version 7: improvements in performance and usability. Mol Biol Evol. 2013;30:772‐780. 10.1093/molbev/mst010 [DOI] [PMC free article] [PubMed] [Google Scholar]
- 22. Hall TA. BioEdit: a user‐friendly biological sequence alignment editor and analysis program for Windows 95/98/NT. Nucleic Acids Symp Ser. 1999;41:95‐98. https://doi.org/citeulike-article-id:691774 [Google Scholar]
- 23. Huson DH, Bryant D. Application of phylogenetic networks in evolutionary studies. Mol Biol Evol. 2006;23:254‐267. 10.1093/molbev/msj030 [DOI] [PubMed] [Google Scholar]
- 24. Darriba D, Taboada GL, Doallo R, Posada D. jModelTest 2: more models, new heuristics and parallel computing. Nat Methods. 2012;9:772 10.1038/nmeth.2109 [DOI] [PMC free article] [PubMed] [Google Scholar]
- 25. Schmidt HA, von Haeseler A. Maximum‐likelihood analysis using TREE‐PUZZLE. Curr Protoc Bioinformatics. 2007;1:6.6.1‐6.6.23. [DOI] [PubMed] [Google Scholar]
- 26. Schmidt HA, Strimmer K, Vingron M, von Haeseler A. TREE‐PUZZLE: maximum likelihood phylogenetic analysis using quartets and parallel computing. Bioinformatics. 2002;18:502‐504. 10.1093/bioinformatics/18.3.502 [DOI] [PubMed] [Google Scholar]
- 27. Guindon S, Dufayard JF, Lefort V, Anisimova M, Hordijk W, Gascuel O. New algorithms and methods to estimate maximum‐likelihood phylogenies: assessing the performance of PhyML 3.0. Syst Biol. 2010;59:307‐321. 10.1093/sysbio/syq010 [DOI] [PubMed] [Google Scholar]
- 28. Rambaut A, Lam TT, Max Carvalho L, Pybus OG. Exploring the temporal structure of heterochronous sequences using TempEst (formerly Path‐O‐Gen). Virus Evol. 2016;2:vew007 10.1093/ve/vew007 [DOI] [PMC free article] [PubMed] [Google Scholar]
- 29. Drummond AJ, Suchard MA, Xie D, Rambaut A. Bayesian phylogenetics with BEAUti and the BEAST 1.7. Mol Biol Evol. 2012;29:1969‐1973. 10.1093/molbev/mss075 [DOI] [PMC free article] [PubMed] [Google Scholar]
- 30. Suchard MA, Rambaut A. Many‐core algorithms for statistical phylogenetics. Bioinformatics. 2009;25:1370‐1376. 10.1093/bioinformatics/btp244 [DOI] [PMC free article] [PubMed] [Google Scholar]
- 31. Zhao Z, Li H, Wu X, et al. Moderate mutation rate in the SARS coronavirus genome and its implications. BMC Evol Biol. 2004;4:21 10.1186/1471-2148-4-21 [DOI] [PMC free article] [PubMed] [Google Scholar]
- 32. Cotten M, Watson SJ, Kellam P, et al. Transmission and evolution of the Middle East respiratory syndrome coronavirus in Saudi Arabia: a descriptive genomic study. Lancet. 2013;382:1993‐2002. 10.1016/S0140-6736(13)61887-5 [DOI] [PMC free article] [PubMed] [Google Scholar]
- 33. Cotten M, Watson SJ, Zumla AI, et al. Spread, circulation, and evolution of the Middle East respiratory syndrome coronavirus. mBio. 2014;5, 10.1128/mBio.01062-13 [DOI] [PMC free article] [PubMed] [Google Scholar]
- 34. Rambaut A, Drummond AJ, Xie D, Baele G, Suchard MA. Posterior summarization in Bayesian phylogenetics using Tracer 1.7. Syst Biol. 2018;67:901‐904. 10.1093/sysbio/syy032 [DOI] [PMC free article] [PubMed] [Google Scholar]
- 35. Kosakovsky Pond SL, Weaver S, Leigh Brown AJ, Wertheim JO. HIV‐TRACE (TRAnsmission Cluster Engine): a tool for large scale molecular epidemiology of HIV‐1 and other rapidly evolving pathogens. Mol Biol Evol. 2018;35:1812‐1819. 10.1093/molbev/msy016 [DOI] [PMC free article] [PubMed] [Google Scholar]
- 36. Li X, Zai J, Wang X, Li Y. Potential of large 'first generation' human‐to‐human transmission of 2019‐nCoV. J Med Virol. 2020. 10.1002/jmv.25693 [DOI] [PMC free article] [PubMed] [Google Scholar]
- 37. Muth D, Corman VM, Roth H, et al. Attenuation of replication by a 29 nucleotide deletion in SARS‐coronavirus acquired during the early stages of human‐to‐human transmission. Sci Rep. 2018;8:15177 10.1038/s41598-018-33487-8 [DOI] [PMC free article] [PubMed] [Google Scholar]
Associated Data
This section collects any data citations, data availability statements, or supplementary materials included in this article.
Supplementary Materials
Supporting information