

Summary
Previous studies investigating community‐level relationships between plant functional trait characteristics and stream environmental characteristics remain scarce. Here, we used community‐weighted means to identify how plant traits link to lowland stream typology and how agricultural intensity in the catchment affects trait composition.
We analysed plant trait characteristics in 772 European lowland streams to test the following two hypotheses: (i) trait characteristics differ between plant communities in small and medium‐sized streams, reflecting adaptations to different habitat characteristics, and (ii) trait characteristics vary with the intensity of agricultural land use in the stream catchment, mediated either directly by an increase in productive species or indirectly by an increase in species that efficiently intercept and utilize light.
We found that the communities in small streams were characterized by a higher abundance of light‐demanding species growing from single apical meristems, reproducing by seeds and rooted to the bottom with floating and/or heterophyllous leaves, whereas the community in medium‐sized streams was characterized by a higher abundance of productive species growing from multi‐apical and basal growth meristems forming large canopies.
We also found indications that community trait characteristics were affected by eutrophication. We did not find enhanced abundance of productive species with an increasing proportion of agriculture in the catchments. Instead, we found an increase in the abundance of species growing from apical and multi‐apical growth meristems as well as in the abundance of species tolerant of low light availability. The increase in the abundance of species possessing these traits likely reflects different strategies to obtain greater efficiency in light interception and utilization in nutrient‐enriched environments.
Synthesis and applications. Our findings challenge the general assumption of the EU Water Framework Directive compliant assessment systems that plant community patterns in streams reflect the nutrient preference of the community. Instead, light availability and the ability to improve interception and utilization appeared to be of key importance for community composition in agricultural lowland streams. We therefore suggest moving from existing approaches building on species‐specific preference values for nutrients to determine the level of nutrient impairment to trait‐based approaches that provide insight into the biological mechanisms underlying the changes. We recommend that existing systems are critically appraised in the context of the findings of this study.
Keywords: assessment, eutrophication, functional traits, growth form, macrophyte, nutrients, plant trait characteristics, river, vegetation, Water Framework Directive
Short abstract
Our findings challenge the general assumption of the EU Water Framework Directive compliant assessment systems that plant community patterns in streams reflect the nutrient preference of the community. Instead, light availability and the ability to improve interception and utilization appeared to be of key importance for community composition in agricultural lowland streams. We therefore suggest moving from existing approaches building on species‐specific preference values for nutrients to determine the level of nutrient impairment to trait‐based approaches that provide insight into the biological mechanisms underlying the changes. We recommend that existing systems are critically appraised in the context of the findings of this study.
Introduction
Ecological theory suggests that multiple environmental factors shape local species assemblages by progressively filtering species from the regional species pool to local communities. One approach to identify environmental factors of importance for species filtering is to analyse functional trait characteristics, defined as the morphological, physiological and phenological features measurable at the individual level (Diaz, Cabido & Casanoves 1998; Garnier et al. 2004; McGill et al. 2006; Shipley 2010). A wide range of traits can be used to describe the response of species to their environment, and different traits may capture different aspects of the resource use and habitat requirements of the species (e.g. Bornette et al. 1994; Suding et al. 2006; Thuiller et al. 2010). For plants, traits related to life‐form characteristics, growth forms, growth rates, photosynthetic pathways, leaf morphology and chemistry have all been used to describe responses to environmental conditions as they may affect species growth, survival and reproductive output (Violle et al. 2007; Cavalli, Baattrup‐Pedersen & Riis 2014).
Trait‐based species loss can lead to a shift in the mean functional trait composition of the community (Xia & Wan 2008). Indeed, selective changes in community trait composition can be expected to severely affect community functional diversity (Cadotte 2011) independently of other possible random trait losses accompanying decreases in species richness. Gaining insight into the direction and the outcome of changes in trait composition caused by natural and anthropogenic drivers is therefore essential for understanding the response of communities to change (Diaz et al. 2007; Moretti & Legg 2009) as well as effects on ecosystem services (Tilman et al. 1997; but see Garcia‐Llorente et al. 2011). Such insight may help identifying the trait characteristics of species with specific sensitivity towards anthropogenic pressures in different types of ecosystems, which, in turn, may enable society to take adequate measures to combat species loss.
Today, anthropogenic pressures related to agriculture are one of the main drivers of ecological deterioration of stream and river ecosystems, primarily through emissions of nitrogen and phosphorous, an increased sediment load and physical and hydrological alterations (Vörösmarty et al. 2010). Despite a general decline in nitrogen and phosphorus loads to freshwater ecosystems in Europe during the last two decades, concentrations are still beyond those considered critical for freshwater ecosystems (Soer 2010). Furthermore, the influence from agricultural emissions is expected to increase in the coming years. This is due to a projected increase in nitrogen fertilizer use by around 4% in 2020 combined with an increasing proportional role of agriculture for phosphorus loss through progressive implementation of the Urban Wastewater Treatment Directive mitigating phosphorus loss from point sources (Soer 2010). High agricultural intensity is also often associated with physical modifications of aquatic habitats such as channelization of stream reaches to facilitate run‐off from cultivated land, which completely or partly alters the environmental conditions supporting the biotic communities.
Although a number of studies have investigated community‐level relationships between functional trait composition and agricultural intensity in terrestrial ecosystems (e.g. Lavorel et al. 1998; Lavorel, Rochette & Lebreton 1999; Fonseca et al. 2001; Van Landuyt et al. 2008; Maskell et al. 2010; Pakeman 2011), only few have examined the functional response of stream plant communities to environmental gradients (Bornette et al. 1994; Ali, Murphy & Abernethy 1999; Demars & Harper 2005; Demars & Trémolières 2009) and these do not build on weighted means of trait characteristics of whole communities and its variability along specific anthropogenic stressor gradients. By analysing community‐weighted means of functional trait characteristics, we gain knowledge of indicative traits and, in extension, also the mechanisms likely responsible for the changes in community structure. The use of community‐weighted means of trait characteristics may therefore give valuable new insight of importance for aquatic managers in their identification of possible causes of non‐compliance with good ecological status in lowland streams required by the EU Water Framework Directive (WFD) and to select appropriate mitigation measures.
In the present study, we investigate the functional trait composition of plant communities in a large number of European lowland streams classified into small and medium‐sized streams according to the WFD typology and, furthermore, relationships between trait composition and the proportion of agricultural land use in the catchments. Several important physical characteristics that are known to affect plant compositional patterns change according to stream size (Haslam 1978). These include an increase in discharge, velocity, channel width and depth and a decrease in light availability with increasing stream size (Sand‐Jensen et al. 2006), whereas substratum characteristics, which also play an important role for the plant composition in streams (Butcher 1933; Baattrup‐Pedersen & Riis 1999), vary more unpredictably with stream size (Sand‐Jensen et al. 2006). Considering that plant compositional patterns reflect the filtering of the regional species pool to local environmental conditions, we hypothesize that multiple functional characteristics of the plant communities will respond to stream size. Specifically, we expect to find traits characterizing helophytes living in the transition zone between land and water to be proportionally more abundant in small streams than in medium‐sized streams. This will be reflected in a higher proportion of emergent species growing from apical meristems and regenerating from seeds and a higher proportion of species with heterophylly (a specific adaptation to maximize resource uptake at changing water levels) in small compared to medium‐sized streams. On the other hand, traits characterizing hydrophytes should be proportionally more abundant in medium‐sized streams, indicated by a higher proportion of submerged species forming large and dense canopies and of species that are tolerant of lower light availabilities. Since submerged species exhibit a number of adaptations to life in water, including mechanical fragmentation with subsequent regeneration of whole plants from the fragment and the ability to form specialized buds or turions which survive winter when the rest of the vegetative parts decay (Hutchinson 1975), we also expect that these traits will be proportionally more abundant in the plant community in medium‐sized streams than in small streams.
Additionally, we expect that the functional characteristics of the plant communities will be influenced by agricultural intensity in the catchments. Eutrophication is one of the most widespread environmental problems in freshwater ecosystems. Yet, the mechanisms driving changes in plant composition along nutrient‐enrichment gradients in streams and rivers remain unsolved (Demars et al. 2012). Here, we test two non‐mutually exclusive hypotheses with the aim to identify the main mechanism causing these changes (Fig. 1). The first hypothesis suggests that eutrophication directly promotes productive species with fast growth, building on the assumption that nutrients are limiting for plant growth (Carignan & Kalff 1980; Mesters 1995; Mainstone & Parr 2002). This assumption also forms the framework for existing plant‐based WFD‐compliant assessment systems building on expert knowledge of the nutrient preferences of single species (Holmes et al. 1999; Birk & Wilby 2010; see Demars et al. 2012 and references therein). Provided that the main drivers for changes in community composition under eutrophication are nutrients, we expect to find an increase in the proportion of highly productive plant species with increasing nutrient availability. According to Grime (1988), this should be reflected in an increase in the proportion of species with an ecological preference for high nutrient levels (high Ellenberg N) as well as an increase in tall species forming dense standing crops with extensive lateral spread. The second hypothesis suggests that the main driver of changes in community composition is light limitation caused by increased water turbidity and biofilm growth in addition to enhanced aquatic plant growth (Sand‐Jensen 1990; Hilton et al. 2006). According to this hypothesis, we expect to find an increase in the proportion of species that can compete efficiently under light‐limiting conditions. This can be accomplished either by concentrating the photosynthetic biomass in the uppermost waters by possessing apical growth and/or by producing floating leaves, which both serve to maximize light uptake, or by having efficient light utilization so growth can be maintained under low light availabilities (low Ellenberg L).
Figure 1.

Conceptual figure depicting two non‐mutually exclusive hypotheses on mechanisms driving changes in plant composition under nutrient‐enriched conditions in lowland streams. The first hypothesis suggests that eutrophication directly promotes productive species forming large standing crops, building on the assumption that nutrients are limiting for plant growth, whereas the second hypothesis suggests that species efficiently capturing or utilizing light are promoted. According to the second hypothesis, species with low light requirement and species capable of concentrating their photosynthetic active biomass in the uppermost waters by possessing single and multi‐apical growth meristems should increase in abundance.
Materials and methods
Data
In this study, we used plant data from a total of 772 stream sites situated in 13 countries in central and western Europe and the Baltic region. The metadata are stored in the meta‐data base of BioFresh including relevant contact details for the organizations where the data are held. The meta‐data base can be assessed at http://www.freshwaterbiodiversity.eu/metadb/pdf/BF48-MaPHYTE_database.pdf.
The stream sites belong to two common lowland stream types (R‐C1 and R‐C4; ECOSTAT 2004), delineated by altitude, catchment size, geology, substrate composition and alkalinity. R‐C1 streams were small with a catchment size varying between 10 and 100 km2, mainly sandy in‐stream substrate and an alkalinity above 1 meq L−1. Streams belonging to this type were situated in Belgium, Denmark, Estonia, Germany, Italy, Latvia, Lithuania, the Netherlands, Poland and the United Kingdom. R‐C4 streams were medium‐sized with a catchment size varying between 100 and 1000 km2 and an in‐stream substrate dominated by sand and gravel and an alkalinity above 2 meq L−1 (Birk & Wilby 2010). Streams belonging to this type were situated in Belgium, Czech Republic, Denmark, Estonia, France, Germany, Ireland, Italy, Latvia, Lithuania, Luxembourg, the Netherlands, Poland, Spain and the United Kingdom. The proportion of the catchment with intensive land use classified using CORINE land‐use codes 2·1 (arable land), 2·2 (permanent crops), 2·4·1 (annual crops associated with permanent crops) and 2·4·2 (complex cultivation patterns) (EEA‐ETC/TE 2002) varied among stream sites and so did the water chemistry characteristics (Table 1) .
Table 1.
The proportion of the catchment with intensive land use categorized using CORINE land‐use codes 2·1, 2·2, 2·4·1 and 2·4·2 and annual means of chemical characteristics of the stream water
| Parameter | n | Mean | Minimum | Maximum |
|---|---|---|---|---|
| Intensive agriculture (%) | 181 | 34 | 0 | 89 |
| Ammonium (mg L−1) | 80 | 0·392 | 0·01 | 13·27 |
| Nitrate (mg L−1) | 77 | 1·740 | 0·05 | 7·71 |
| Total phosphorus (mg L−1) | 49 | 0·643 | 0·0185 | 13·6 |
| Phosphate (mg L−1) | 51 | 0·116 | 0·00326 | 1·22 |
This article is being made freely available through PubMed Central as part of the COVID-19 public health emergency response. It can be used for unrestricted research re-use and analysis in any form or by any means with acknowledgement of the original source, for the duration of the public health emergency.
Plant data originated from national plant surveys using protocols in line with the requirements of the European Standard EN 14184:2003 (Birk & Wilby 2010). Representative c. 100‐m‐long river stretches were visually surveyed during the growing season (June to September) by wading, diving or boating, using rake, grapnel or aquascope where necessary (Birk et al. 2007). Macrophyte abundance was recorded using national abundance scales that were later converted into an international abundance scale according to Birk & Wilby (2010).
Hydromorphological impairment was recorded as the degree of channel profile modifications along the river stretch studied and was categorized into unmodified, slightly modified or highly modified according to Pardo et al. (2012). By applying a one‐way anova, we did not find that the distribution of highly modified, slightly modified and unmodified stream channels varied with agricultural intensity in the catchment. On the other hand, we found strong indications that the main stressor operating along this gradient was eutrophication since NO3, PO4 and conductivity were the variables that best explained variation along the agricultural intensity gradient (F3, 230 = 52·19; P < 0·001; r = 0·63). Since the quality of the nutrient data was rather poor, reflecting differences in sampling effort and timing, we decided to use intensity in agricultural land use as a proxy for eutrophication. This approach has been confirmed in previous studies observing close linkages between agricultural land use and eutrophication (e.g. Jones et al. 2001; Galbraith & Burns 2007; Monaghan et al. 2009), reflecting that intensified land use increases diffuse source contaminants in terms of nutrients and sediment load to stream sites (Allan 2004; Ballantine & Davies‐Colley 2014; Evans et al. 2014).
Description of Traits
A total of 120 submerged and amphibious taxa were included in the data set. We were able to allocate 18 traits relevant for our hypotheses to 77 species that represented 64% of the total species pool and 83% of the total abundance of plants in the streams (estimated from the international abundance scales). The traits covered life‐form characteristics and traits related to morphology, dispersal, reproduction and survival as well as ecological indicator values of nutrients (Ellenberg N; EN) and light (Ellenberg L; EL; Ellenberg et al. 1991) (Table 2). The Ellenberg indicator values offer autecological information on the response of c. 2000 species to a range of climatic and edaphic factors in central Europe. Data on the 18 traits were extracted from the literature and online data bases (Willby, Abernethy & Demars 2000; Klotz, Kühn & Durka 2002; Kühn, Durka & Klotz 2004). Life‐forms were divided into six categories: free floating on the surface (Frflsr), free floating submerged (Frflsb), anchored with floating leaves (Anflle), anchored with submerged leaves (Ansule) and amphibious species with homophyllus emergent leaves (Anemle) and heterophyllus emergent leaves (Anhete). Growth morphology described the position of the meristem growth point and was divided into three categories: single basal (Meris.sb), single apical (Meris.sa) and multi‐apical (Meris.ma) (Table 2). Plant morphological traits also included the leaf area of the species and a morphology index (Morph.ind) building on the height and lateral extension of the canopy.
Table 2.
The 18 functional traits used in the present study to characterize the plant species. The selected traits give information on ecological preference (LE and NE), life‐form, morphology (meristem characteristics, leaf area and canopy characteristics), dispersal (vegetative by root–rhizome growth, fragmentation and seed production) and survival (overwintering organs). See text for further explanation. Life‐form, morphology, dispersal and survival traits were all derived from Willby, Abernethy & Demars (2000)
| Short trait name | Explanation | Category |
|---|---|---|
| LE | Ellenberg light | Ecological preference |
| NE | Ellenberg nutrient | Ecological preference |
| Frflsr | Free floating, surface | Life‐form |
| Frflsb | Free floating, submerged | Life‐form |
| Anflle | Anchored, floating leaves | Life‐form |
| Ansule | Anchored, submerged leaves | Life‐form |
| Anemle | Anchored, emergent leaves | Life‐form |
| Anhete | Anchored, heterophylly | Life‐form |
| Meris.ma | Meristem single apical growth point | Morphology |
| Meris.sb | Meristem single basal growth point | Morphology |
| Meris.sa | Meristem multiple apical growth point | Morphology |
| Morph.ind | Morphology index = (height + lateral extension of the canopy)/2 | Morphology |
| Leaf.area | Leaf area | Morphology |
| Seeds | Reproduction by seeds | Dispersal |
| Rhizome | Reproduction by rhizomes | Dispersal |
| Frag | Reproduction by fragmentation | Dispersal |
| N.rep.org | Number of reproductive organs per year and individual | Dispersal |
| Overwintering.org | Overwintering organs | Survival |
This article is being made freely available through PubMed Central as part of the COVID-19 public health emergency response. It can be used for unrestricted research re-use and analysis in any form or by any means with acknowledgement of the original source, for the duration of the public health emergency.
Dispersal was characterized by four traits. Local dispersal was inferred from the root–rhizome system (Rhizome), while regional dispersal was extrapolated from the ability to disperse/reproduce by fragmentation (Frag) and by seeds (Seeds) and the number of reproductive organs produced by the species (N.rep.org), which considers both sexual (seeds) and vegetative reproduction (dormant buds, turions, tubers and fragmentation). We also included traits related to survival in terms of overwintering organs (Overwintering.org) such as tubers, turions and rhizomes. Some inevitable redundancy may occur between the traits as the distinction between vegetative parts serving for reserve and those for dispersal is complex among aquatic plants. Thus, many organs for vegetative reproduction are also organs of perennation (van der Pijl 1972; Barrat‐Segretain 1996).
The life‐forms, meristem growth position and traits covering fragmentation, seeds, overwintering organs and rhizomes were given a score of 0 for absence, 1 for occasionally but not generally present attributes and 2 for present attributes. The number of reproductive organs was classified into low (<10), medium (10–100), high (100–1000) and very high (>1000), with values ranging from 1 to 4 based on number per individual per year (Willby, Abernethy & Demars 2000). Leaf area was classified according to the leaf size categories with values ranging from 1 to 4, representing small (<1 cm3), medium (1–20 cm3), large (20–100 cm3) and very large areas (>100 cm3; Willby, Abernethy & Demars 2000). The morphology index was also classified into categories (2, 3–5, 6–7, 8–9 and 10) with values ranging from 1 to 5 (Willby, Abernethy & Demars 2000). In some cases, species were classified in‐between two categories as to number of reproductive organs, leaf area and morphology index (Willby, Abernethy & Demars 2000). In these cases, a classification code in‐between was allocated to the particular trait (i.e. 1·5, 2·5, 3·5 and 4·5).
Data Analyses
The relationships between species abundance and trait variables were examined using multivariate ordination techniques. To analyse relationships between the spatial distribution of plant species and their traits, we constructed two tables: one with site and species abundance information and one with species and trait information data. First, we analysed the two tables separately, and then, we used coinertia analysis (COIA) to couple the two tables (Dolédec et al. 1996; Dray, Saïd & Débias 2008). The site by species abundance table was analysed by applying a principal component analyses (PCA) comprising 772 sites and 77 species. The species by trait table was also analysed with a PCA combining the 18 (log transformed) traits with the 77 species. The PCA (here based on centred and scaled data) constructs a distance matrix based on Euclidean distance to detect a linear combination of the original variables, thus maximizing the variance.
The site by abundance table and species by trait table were subsequently linked through COIA to study co‐structure by maximizing covariance between trait and abundance ordination scores in the two PCAs (Dray, Chessel & Thioulouse 2003). This method permits a combined analysis of the ecological and spatial distribution of species and allows mixing of quantitative and qualitative data. All the analyses were performed in r with the ade4 package (Dray & Dufour 2007). To test whether species trait characteristics and distributional patterns differed between the two stream types, we performed a permutational multivariate analysis of variance using a Euclidean distance matrix based on the site scores from the COIA with the function adonis in r package vegan (Oksanen et al. 2013).
Next, groups of species sharing similar distributional patterns and ecological traits were identified by performing a hierarchical clustering analysis (Ward's method) that minimizes within‐group sums of squares (Legendre & Legendre 1998). The input to the cluster analysis was a Euclidean distance matrix based on species trait vs. distribution scores obtained in the COIA. After visually inspecting the cluster dendrogram, we decided to cut it at height 13 since this gave five distinct groups of species and made good sense according to our ecological knowledge of the species. The cluster analysis was run using the package stats in r (R Core Team 2013).
To identify possible links between the impact from agriculture and community trait characteristics for the two stream types, we applied ordinary linear regression analysis using community‐weighted means (obtained through COIA; Garnier et al. 2004; Diaz et al. 2007; Lepš et al. 2011) as response variables and the percentage of intensive agriculture in the catchment as explanatory variable.
Results
We found that the abundance patterns of plants in European lowland streams were significantly related to species trait characteristics (Monte Carlo test for COIA, P = 0·019, Fig. 2a). Based on species abundance patterns and trait characteristics, we identified five groups of species in the cluster analysis that were characterized by different trait characteristics (Fig. 2a,b; Table 3). Species group 1 was characterized by species with low EN, growing from single apical growth meristems rooted to the stream bottom with submerged and/or floating, sometimes heterophyllous leaves (e.g. P. natans, A. plantago‐aquatica) together with a few less frequent species growing from basal growth meristems (e.g. L. natans and S. natans; Fig. 3; Table 3). Species group 2 was characterized by slightly more productive species growing from single and multi‐apical growth meristems with submerged and sometimes heterophyllous leaves including several Callitriche and Ranunculus species and a few species with emergent leaves (e.g. V. anagallis‐aquatica; Fig. 3; Table 3). Both groups 1 and 2 had high abundances of species dispersed by seeds. Group 3 was also dominated by anchored species with submerged leaves (e.g. P. pectinatus) as well as species with both submerged and emerged leaves (e.g. Myosotis palustris, Berula erecta). Species in group 3 were slightly more productive than those in groups 1 and 2 (Fig. 3). Similar to group 2 species, group 3 species grew from multi‐ and single apical growth meristems, but in contrast to group 2 they had low preference values for light (Fig. 3). Groups 4 and 5 were both dominated by productive species (Fig. 3). Group 4 was dominated by free‐floating plants with small leaf‐like thalli (e.g. Lemna sp., S. polyrhiza and A. filiculoides; Fig. 3, Table 3), whereas group 5 was dominated by submerged species with floating and/or submerged and/or emergent leaves (e.g. S. emersum, S. erectum and E. canadensis; Fig. 3; Table 3). Both groups 4 and 5 were dominated by species growing from basal growth meristems (Fig. 3). Group 5 was also dominated by species with high specific leaf areas compared to the other groups (Fig. 3).
Figure 2.

Ordination plots of the coinertia analysis (COIA) between species traits (18 traits) and species abundances (77 plant species). In total, 772 stream sites were included in the analysis, all of which were located in the central Baltic region of Europe. The first plot (a) shows how species cluster groups (1–5) associate with the first two axes of the COIA. Large light grey circles indicate mean abundance based on the ordination score of species within each cluster group (normed row scores from the COIA) where small circles represent the score of individual species. Dark grey squares indicate mean trait‐based ordination score of species within each cluster group (normed row scores from the COIA) where small squares represent the score of individual species. The lines between the circles and the squares indicate mean distances in species abundance‐based scores and trait‐based scores within each cluster group (i.e. the level of association between species distributional patterns and ecological traits). The second plot (b) shows how traits associate with the first two axes of the COIA (a projection of the canonical weights of species traits) and thus indicates which traits are related to which cluster group in (a). See Table 2 for definitions of the trait names.
Table 3.
Groups of species sharing similar distributional patterns and ecological trait characteristics identified by performing a hierarchical clustering analysis based on the Euclidean distance results obtained in the coinertia analysis (COIA). We cut the cluster dendrogram at height 13, yielding five groups of species. Species within each group are listed with decreasing frequency calculated as the percentage of sites with the species present relative to the total number of sites
| Group 1 | % | Group 2 | % | Group 3 | % | Group 4 | % | Group 5 | % |
|---|---|---|---|---|---|---|---|---|---|
| Potamogeton natans | 26 | Veronica anagallis‐aquatica | 15 | Myosotis palustris | 35 | Lemna minor | 48 | Sparganium emersum | 52 |
| Alisma plantago‐aquatica | 16 | Callitriche hamulata | 12 | Potamogeton pectinatus | 21 | Spirodela polyrhiza | 11 | Sparganium erectum | 44 |
| Glyceria fluitans | 16 | Veronica beccabunga | 11 | Berula erecta | 20 | Lemna trisulca | 10 | Elodea canadensis | 29 |
| Butomus umbellatus | 8 | Callitriche platycarpa | 10 | Mentha aquatica | 19 | Lemna minuta | 7 | Nuphar lutea | 24 |
| Potamogeton alpinus | 5 | Ranunculus fluitans | 9 | Myriophyllum spicatum | 15 | Hydrocharis morsus‐ranae | 4 | Sagittaria sagittifolia | 17 |
| Eleocharis acicularis | 2 | Callitriche obtusangula | 9 | Potamogeton crispus | 15 | Lemna gibba | 4 | ||
| Alisma lanceolatum | 1 | Callitriche stagnalis | 7 | Apium nodiflorum | 14 | Azolla filiculoides | 1 | ||
| Juncus bulbosus | 1 | Ranunculus peltatus | 3 | Elodea nuttallii | 13 | Stratiotes aloides | <1 | ||
| Nymphaea alba | 1 | Potamogeton polygonifolius | 2 | Potamogeton perfoliatus | 10 | ||||
| Luronium natans | 1 | Ranunculus aquatilis | 2 | Ceratophyllum demersum | 9 | ||||
| Sparganium natans | <1 | Ranunculus flammula | 1 | Potamogeton trichoides | 8 | ||||
| Ranunculus penicillatus | 1 | Ceratophyllum submersum | 8 | ||||||
| Callitriche cophocarpa | 1 | Zannichellia palustris | 3 | ||||||
| Oenanthe aquatica | 1 | Potamogeton nodosus | 3 | ||||||
| Apium inundatum | <1 | Potamogeton lucens | 3 | ||||||
| Callitriche brutia | <1 | Potamogeton panormitanus | 3 | ||||||
| Ranunculus hederaceus | <1 | Sium latifolium | 3 | ||||||
| Myriophyllum alterniflorum | 3 | ||||||||
| Ranunculus trichophyllus | 3 | ||||||||
| Utricularia vulgaris | 2 | ||||||||
| Potamogeton obtusifolius | 2 | ||||||||
| Ranunculus circinatus | 2 | ||||||||
| Oenanthe fluviatilis | 2 | ||||||||
| Groenlandia densa | 1 | ||||||||
| Potamogeton praelongus | 1 | ||||||||
| Potamogeton filiformis | 1 | ||||||||
| Callitriche truncata | 1 | ||||||||
| Myriophyllum verticillatum | 1 | ||||||||
| Nymphoides peltata | <1 | ||||||||
| Hottonia palustris | <1 | ||||||||
| Potamogeton gramineus | <1 | ||||||||
| Ceratophyllum submersum | <1 | ||||||||
| Hippuris vulgaris | <1 | ||||||||
| Potamogeton compressus | <1 | ||||||||
| Potamogeton friesii | <1 | ||||||||
| Utricularia australis | <1 |
This article is being made freely available through PubMed Central as part of the COVID-19 public health emergency response. It can be used for unrestricted research re-use and analysis in any form or by any means with acknowledgement of the original source, for the duration of the public health emergency.
Figure 3.
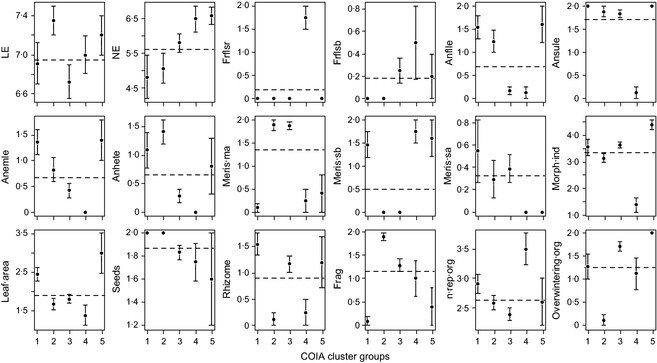
Mean trait values [community‐weighted means obtained through coinertia analysis (COIA)] in the identified species groups 1–5 for the range of traits used to characterize the plant communities. Error bars indicate standard error. Horizontal line indicates the grand mean for all sites. See Table 2 for definitions of the trait names.
Overall, trait characteristics and distributional patterns differed between IC types (permanova; P < 0·05). Species in groups 1, 2, 4 and 5 were similarly abundant in both small and medium‐sized streams (anova P > 0·05; Fig. 4), whereas species in group 3 were more abundant in small streams than in medium‐sized streams. The distribution of the species groups differed significantly between stream types (anova; P < 0·005). For small streams, we found that species group 5 was significantly more widespread than species groups 2 and 3, whereas for medium‐sized streams, species group 5 was significantly more widespread than all other groups (anova; P < 0·05; Fig. 4).
Figure 4.

Plots showing mean local abundance (a) and distribution (b) of species belonging to cluster groups 1–5 in small (R‐C1; black points) and medium‐sized (R‐C4; white points) streams. Error bars indicate standard error. Local abundance was calculated as the average abundance for each site where the species was present. Distribution was calculated as the sum of sites where the species was present divided by the total number of sites.
We used community‐weighted means for the individual traits to examine differences in community trait characteristics between small and medium‐sized streams. Overall, we found that community trait characteristics for a large majority of the investigated traits differed significantly between the two stream types (Fig. 5, anova, P < 0·001). Seed‐producing species with high light requirement (high LE), growing from single apical growth meristems and rooted to the stream bottom with heterophyllous and/or floating leaves, were more abundant in small streams than in medium‐sized streams (anova; P < 0·05). On the other hand, species with high productivity (high NE), growing from single basal or multiple apical meristems and forming well‐developed large‐leaved canopies, were more abundant in medium‐sized streams (Fig. 5; anova; P < 0·05). Species with a large production of overwintering organs, such as tubers, turions and rhizomes, were also more abundant in medium‐sized streams than in small streams (Fig. 5; anova; P < 0·05). We did not find significant differences in the abundance of species growing emergent or submerged between small and medium‐sized streams (Fig. 5; anova, P > 0·05).
Figure 5.

Plots showing mean trait values for the range of traits used to characterize the plant communities in small (black bars) and medium‐sized (white bars) streams. Error bars indicate standard errors of the grand mean for the respective stream types. The traits are ordered according to difference in mean trait values between small and medium‐sized streams, with the largest difference first (NE) and the smallest difference last (Ansule).* = significant differences between mean values (P < 0·05). See Table 2 for definitions of the trait names.
Several trait characteristics were significantly related to the percentage of intensive agriculture in the catchment for both small and medium‐sized streams (Table 4). Specifically, the abundance of species growing from single (both streams types) and multi‐apical (small streams) meristems increased with increasing percentage of intensive agriculture in small (F = 12·48; P < 0·05; R 2 = 21·3%) and medium‐sized streams (F = 18·55; P < 0·05; R 2 = 28·7%), respectively. In contrast, the abundance of species growing from a single basal growth meristem decreased with increasing agriculture in both small (F = 29·21; P < 0·05; R 2 = 38·8%) and medium‐sized streams (F = 7·53; P < 0·05; R 2 = 27·4%; Table 4). The ecological preference for light also decreased with increasing agriculture in small streams (F = 19·75; P < 0·05; R 2 = 0·30). In addition to these traits, we also found that dispersal by fragmentation increased with increasing percentage of agriculture in small streams, whereas seed dispersal decreased. The life‐form characteristics also changed with agricultural intensity in the catchment. We found that the abundance of species with submerged leaves increased in abundance in small streams (Table 4), whereas the abundance of species with floating and emergent leaves decreased (Table 4).
Table 4.
Results obtained from ordinary linear regression analysis between the percentage of agricultural intensity in the catchment [as a measure of eutrophication and community‐weighted means for a range of traits characterizing the ecological preference, life‐form, morphology, dispersal and survival characteristics of the plant community in small (R‐C1) and medium‐sized (R‐C4) streams (see Table 2)]. All regression models were statistically significant (P < 0·05). Estimates, F‐values, significance level and R 2 in % are given in decreasing order of magnitude. See Table 2 for definitions of the trait names
| Stream type | Trait | Estimate | F‐value | Pr > F | R 2 |
|---|---|---|---|---|---|
| Type R‐C1 (n = 47) | Meris.sb | −0·0033 | 29·21 | <0·0001 | 38·8 |
| EL | −0·0018 | 19·75 | <0·0001 | 30·0 | |
| Meris.ma | 0·0030 | 18·55 | <0·0001 | 28·7 | |
| Meris.sa | 0·0021 | 12·48 | 0·0009 | 21·3 | |
| Frag | 0·0022 | 16·69 | 0·0002 | 26·6 | |
| Rhizome | −0·0011 | 11·50 | 0·0014 | 20·0 | |
| Seeds | −0·0027 | 8·22 | 0·0062 | 15·2 | |
| Frflsr | −0·0012 | 8·61 | 0·0052 | 15·8 | |
| Ansule | 0·0011 | 7·53 | 0·0086 | 14·1 | |
| N.rep.org | −0·0014 | 5·74 | 0·0207 | 11·1 | |
| Anemle | −0·0016 | 5·48 | 0·0236 | 10·6 | |
| Morph.ind | 0·0009 | 4·70 | 0·0354 | 9·3 | |
| Type R‐C4 (n = 21) | Meris.sa | 0·0030 | 9·00 | 0·0071 | 31·0 |
| Meris.sb | −0·0026 | 7·53 | 0·0125 | 27·4 |
This article is being made freely available through PubMed Central as part of the COVID-19 public health emergency response. It can be used for unrestricted research re-use and analysis in any form or by any means with acknowledgement of the original source, for the duration of the public health emergency.
Discussion
In accordance with our first hypothesis, we found that the size of the stream influenced the abundance trait characteristics of the plant community. Generally, the communities in small streams were characterized by a higher abundance of light‐demanding species growing from single apical meristems, including species that proliferate on the surface (e.g. Callitriche sp.), species that may grow out of the water during summer (e.g. Myosotis sp.) and species with heterophylly (e.g. Alisma plantago‐aquatica), where heterophylly can be seen as a specialized adaptation to meet seasonal drops in water level during summer where these species develop floating or aerial leaves (Allsopp 1965; Sculthorpe 1967). These traits are likely to provide a clear advantage for species growing in the land–water ecotone. Generally, freshwaters have a low and fluctuating supply of carbon dioxide as well as generally low light availability and these resources often limit growth in streams (e.g. Maberly & Madsen 2002). Therefore, plants that can reach the water surface during the growth period and get access to atmospheric carbon dioxide may have a strong competitive advantage. Heterophyllous species not only have access to atmospheric carbon dioxide, they also have leaves with lower surface area‐to‐volume ratios under water compared to those that are at or near the water surface (e.g. Callitriche palustris; Alisma plantago‐aquatica; some Ranunculus species), which may contribute to maximizing the carbon dioxide uptake both below and above water. Besides these structural and morphological adaptions to life in water, physiological adaptations exist to overcome potential carbon limitation. In particular, the ability to use bicarbonante in photosynthesis is an important and widespread carbon acquisition strategy among aquatic plants. This ability is, however, confined to submerged species that rely on inorganic carbon uptake from the water (Maberly & Madsen 2002).
We also observed that the abundance of species reproducing by seeds was higher in small streams, which again likely reflects lower depths that enable flowering and seed dispersal above water, making small streams more favourable as habitats for species possessing these traits. On the other hand, the observation that the plant communities in medium‐sized streams were dominated by species forming dense, continuous surface canopies can be seen as an adaptation to maximize light capture in the deeper medium‐sized streams. Generally, by concentrating the photosynthetic tissues in the upper waters, plants may be able to grow in low light environments although the maximum depth for growth will depend on water turbidity as well as species‐specific light requirements (Westlake 1975). In contrast to our expectations, we did not identify differences in the abundance of species being emergent and submerged between the two stream types, suggesting that these traits are inappropriate indicators of stream size. This may reflect the high plasticity exhibited by numerous aquatic plants that are able to grow both below and above water, that is amphibious species (Hutchinson 1975; Riis, Sand‐Jensen & Larsen 2001), which complicates the use of simple classifications into emergent and submerged species.
In accordance with our expectations, we also found clear indications that community trait characteristics were affected by land‐use characteristics in the catchments. Of particular interest, we observed enhanced abundance of species growing from single and/or multi‐apical growth meristems (both stream types) and of species with low light requirements (small streams) with increasing agricultural intensity in the catchment (used as a proxy for eutrophication, see ‘Materials and methods’). The observed changes in community trait characteristics likely represent different strategies to increase the efficiency in light interception or utilization under nutrient enrichment. Species able to concentrate their photosynthetic active biomass in the uppermost waters either by growing from apical meristems or by producing floating leaves improve their light interception, whereas species with low light requirements are able to more efficiently utilize light for growth, thereby tolerating reduced light availability. Both strategies can be seen as a way to strengthen competitive interactions when light becomes limiting for growth. Our findings strongly support the conceptual model proposed by Hilton et al. (2006) that eutrophication promotes species that efficiently capture or utilize light, reflecting that the driver of change in community structure is light limitation. Besides intensified competition for light among plants due to enhanced aquatic plant growth, this can relate to enhanced periphytic algal growth on the leaves of the plants under nutrient‐enriched conditions (Sand‐Jensen 1990), which may reduce the amount of light reaching the leaves. Further, the turbidity of the water may increase under nutrient‐enriched conditions, in particular in streams downstream of lakes and/or rivers with a long retention time (Hilton et al. 2006).
The obtained results question the reasoning behind currently used plant‐based WFD‐compliant assessment systems that build on the assumption that any responses in plant compositional patterns under eutrophication are directly driven by nutrients (Birk & Wilby 2010; see Demars et al. 2012 and references therein).We found clear indications, from our analysis of trait patterns, that the biological mechanisms underlying community changes in stream plant communities following eutrophication were associated with light capture and utilization and not with nutrient preferences. Thus, we did not find significant relationships between agricultural intensity in the catchments to the streams and traits indicative of productivity, that is the morphology index and EN where EN is highly correlated with existing WFD‐compliant methods (Birk, Korte & Hering 2006; Dudley et al. 2013). Instead, we found that traits associated with the ability to circumvent reduced light availability either by concentrating the photosynthetic active biomass in the upper waters, where the availability of light is plenty, or by being physiologically efficient in light utilization, seem to be key traits under nutrient‐enriched conditions.
Although many streams and rivers currently exhibit high nutrient concentrations, a prevailing view for many years was that many rivers are insensitive to nutrient inputs (e.g. Hynes 1969). Here, we find evidence that lowland streams are indeed sensitive to nutrients, but that the mechanisms behind compositional changes in the plant community are related to light availability and not nutrient availability. Nutrient enrichment is accompanied by increases in the biomass of suspended particles and/or benthic primary producers in streams and rivers (e.g. Correll 1998; Smith, Tilman & Nekola 1999), and this increase eventually affects the light climate in the streams and selects for plant species that compete successfully under reduced light availability (apical growth; floating leaves; low EL). Based on the findings obtained here, we recommend that existing WFD‐compliant assessment systems are critically reappraised. We suggest moving from existing approaches building on species‐specific preference values for nutrients to determine the level of nutrient impairment (see references in Demars et al. 2012) to approaches that reveal the underlying mechanisms causing compositional changes. We found clear indications that community trait characteristics were affected by eutrophication (i.e. meristem characteristics and light preference/tolerance), indicating that community‐weighted means of trait values for plants can be a useful approach to detect eutrophication‐related impacts in lowland streams. Our findings therefore support the merit of trait‐based approaches in biomonitoring (see Friberg 2014) as they can throw light on mechanisms behind structural changes under environmental change.
Conclusions
We found that stream size influenced abundance trait characteristics of the plant communities in European lowland streams. Generally, the communities in small streams were characterized by higher abundance of species growing from single apical meristems, reproducing by seeds and being rooted to the bottom with floating and heterophyllous leaves, whereas the community in medium‐sized streams was characterized by higher abundance of productive species forming large canopies with a high overwintering capacity. We also found clear indications that community trait characteristics were affected by eutrophication, indicating that community‐weighted means of trait values for plants may act as a useful approach to detect eutrophication‐related impacts in lowland streams. We did not find an increase in the abundance of productive species with increasing eutrophication; rather, species capable of concentrating the photosynthetic active biomass in the uppermost waters by possessing single and multi‐apical growth meristems rose in abundance as did species with efficient light utilization. This response is likely a consequence of intensified competition for light, reflecting that light becomes the overall limiting factor for growth in nutrient‐enriched streams. Our findings support the merit of trait‐based approaches in biomonitoring (e.g. Friberg 2014) as they provide a means to obtain insight into mechanisms behind structural changes in community structure under environmental change.
Acknowledgements
The authors thank the European Union 7th Framework Project REFORM under contract no. 282656 for financial support. We also thank three reviewers for fruitful comments on previous versions of the manuscript Anne Mette Poulsen for editorial support and the following colleagues and institutions who provided plant data for the intercalibration exercise: Christian Chauvin (France), Krzysztof Szoszkiewicz (Poland), Martin McGarrigle (Ireland), Maria Rita Minicardi (Italy), Nigel Willby (Great Britain), Normunds Kadikis (Latvia), Zofija Sinceviciene (Lithuania), Hugo Coops and Roelf Pot (the Netherlands), Daniel Galoux (Wallonia, Belgium), the Research Institute for Nature and Forest (Flanders, Belgium), the North Rhine‐Westphalia State Environment Agency (Germany), the Saxon State Office for the Environment, Agriculture and Geology (Germany), the Lower Saxony Water Management, Coastal Defence and Nature Conservation Agency (Germany) and the European Union 5th Framework Project STAR project (Standardisation of River Classifications: Framework method for calibrating different biological survey results against ecological quality classifications to be developed for the Water Framework Directive; contract no. EVK1‐CT 2001‐00089).
Data accessibility
The metadata are stored in the meta‐data base of BioFresh including relevant contact details for the organizations where the data are held. The meta‐data base can be assessed at http://www.freshwaterbiodiversity.eu/metadb/pdf/BF48-MaPHYTE_database.pdf.
References
- Ali, M.M. , Murphy, K.J. & Abernethy, V.J. (1999) Macrophyte functional variables versus species assemblages as predictors of trophic status in flowing waters. Hydrobiologia, 415, 131–138. [Google Scholar]
- Allan, J.D. (2004) Landscapes and riverscapes: the influence of land use on stream ecosystems. Annual Review of Ecology, Evolution and Systematics, 35, 257–284. [Google Scholar]
- Allsopp, A. (1965) Land and water forms: physiological aspects. Handbuch Pflanzenphysiologie, 15, 1236–1255. [Google Scholar]
- Baattrup‐Pedersen, A. & Riis, T. (1999) Plant diversity and composition in relation to substratum characteristics in regulated and unregulated Danish streams. Freshwater Biology, 42, 1–11. [Google Scholar]
- Ballantine, D.J. & Davies‐Colley, R.J. (2014) Water quality trends in New Zealand rivers: 1989–2009. Environmental Monitoring and Assessment, 186, 1939–1950. [DOI] [PubMed] [Google Scholar]
- Barrat‐Segretain, M.H. (1996) Strategies of reproduction, dispersion and competition in river plants: a review. Vegetatio, 123, 13–37. [Google Scholar]
- Birk, S. , Korte, T. & Hering, D. (2006) Intercalibration of assessment methods for macrophytes in lowland streams: direct comparison and analysis of common metrics. Hydrobiologia, 566, 417–430. [Google Scholar]
- Birk, S. & Wilby, N. (2010) Towards harmonization of ecological quality classification: establishing common grounds in European plant assessment for rivers. Hydrobiologia, 652, 149–263. [Google Scholar]
- Birk, S. , Willby, N. , Chauvin, C. , Coops, H.C. , Denys, L. , Galoux, D. et al (2007) Report on the Central Baltic River GIG Macrophyte Intercalibration Exercise, June 2007, 82 pp. University of Duisburg‐Essen, Essen. [Google Scholar]
- Bornette, G. , Henry, C. , Barrat, M.‐H. & Amoros, C. (1994) Theoretical habitat templets, species traits, and species richness: aquatic macrophytes in the upper Rhone River and its floodplain. Freshwater Biology, 31, 487–505. [Google Scholar]
- Butcher, R.W. (1933) Studies on the ecology of rivers: I. On the distribution of macrophytic vegetation in the rivers of Britain. The Journal of Ecology, 21, 58–91. [Google Scholar]
- Cadotte, M.W. (2011) The new diversity: management gains through insights into the functional diversity of communities. Journal of Applied Ecology, 48, 1067–1069. [Google Scholar]
- Carignan, R. & Kalff, J. (1980) Phosphorus sources for aquatic weeds: water or sediments? Science, 207, 987–989. [DOI] [PubMed] [Google Scholar]
- Cavalli, G. , Baattrup‐Pedersen, A. & Riis, T. (2014) The role of species functional traits for distributional patterns in lowland stream vegetation. Freshwater Science, 33, 1074–1085. [Google Scholar]
- Correll, D.L. (1998) The role of phosphorus in the eutrophication of receiving waters: a review. Journal of Environmental Quality, 27, 261–266. [Google Scholar]
- Demars, B.O.L. & Harper, D.M. (2005) Distribution of aquatic vascular plants in lowland rivers: separating the effects of local environmental conditions, longitudinal connectivity and river basin isolation. Freshwater Biology, 50, 418–437. [Google Scholar]
- Demars, B.O.L. & Trémolières, M. (2009) Aquatic macrophytes as bioindicators of carbon dioxide in groundwater fed rivers. Science of the Total Environment, 407, 4752–4763. [DOI] [PubMed] [Google Scholar]
- Demars, B.O.L. , Potts, J.M. , Termolieres, M. , Thiebaut, G. , Gougelin, N. & Nordmann, V. (2012) River plant indices: not the Holy Grail!. Freshwater Biology, 57, 1745–1759. [Google Scholar]
- Diaz, S. , Cabido, M. & Casanoves, F. (1998) Plant functional traits and environmental filters at a regional scale. Journal of Vegetation Science, 9, 113–122. [Google Scholar]
- Diaz, S. , Lavorel, S. , de Bello, F. , Quétier, F. , Grigulis, K. & Robson, T.M. (2007) Incorporating plant functional diversity effects in ecosystem service assessments. Proceedings of the National Academy of Sciences of the United States of America, 104, 20684–20689. [DOI] [PMC free article] [PubMed] [Google Scholar]
- Dolédec, S. , Chessel, D. , Ter Braak, C.J.F. & Champely, S. (1996) Matching species traits to environmental variables: a new three‐table ordination method. Environmental and Ecological Statistics, 3, 143–166. [Google Scholar]
- Dray, S. , Chessel, D. & Thioulouse, J. (2003) Co‐inertia analysis and the linking of ecological data tables. Ecology, 84, 3078–3089. [Google Scholar]
- Dray, S. & Dufour, A.B. (2007) The ade4 package: implementing the duality diagram for ecologists. Journal of Statistical Software, 22, 1–20. [Google Scholar]
- Dray, S. , Saïd, S. & Débias, F. (2008) Spatial ordination of vegetation data using a generalization of Wartenberg's multivariate spatial correlation. Journal of Vegetation Science, 19, 45–56. [Google Scholar]
- Dudley, B. , Dunbar, M. , Penning, E. , Kolada, A. , Hellsten, S. , Oggioni, A. , Bertrin, V. , Ecke, F. & Søndergaard, M. (2013) Measurements of uncertainty in macrophyte metrics used to assess European lake water quality. Hydrobiologia, 704, 179–191. [Google Scholar]
- ECOSTAT (CIS WG 2.A Ecological Status) (2004) Overview of Common Intercalibration Types. Final Version for Finalisation of the Intercalibration Network Spring 2004. Version 5.1 – 23 April, 2004. 37 pp. Joint Research Centre, Ispra. [Google Scholar]
- EEA‐ETC/TE (2002) CORINE land cover update. I&CLC2000 project. Technical guidelines, http://terrestrial.eionet.eu.int
- Ellenberg, H. , Weber, H.E. , Düll, R. , Wirth, V. , Werner, W. & Paulissen, D. (1991) Zeigerwerte von Pflanzen in Mitteleuropa. Scripta Geobotanica, 18, 1‐248. [Google Scholar]
- Evans, D.M. , Schoenholtz, S.H. , Wigington, P.J. , Griffith, S.M. & Floyd, W.C. (2014) Spatial and temporal patterns of dissolved nitrogen and phosphorus in surface waters of a multi‐land use basin. Environmental Monitoring and Assessment, 186, 873–887. [DOI] [PubMed] [Google Scholar]
- Fonseca, R.R. , Overton, J.M. , Collins, B. & Westoby, M. (2001) Shifts in trait‐combinations along rainfall and phosphorus gradients. Journal of Ecology, 88, 964–977. [Google Scholar]
- Friberg, N. (2014) Impacts and indicators of change in lotic ecosystem. Wiley Interdisciplinary Reviews: Water, 1, 513–531. [Google Scholar]
- Galbraith, L.M. & Burns, C.V. (2007) Linking land‐use, water body type and water quality in southern New Zealand. Landscape Ecology, 22, 231–241. [Google Scholar]
- Garcia‐Llorente, M. , Martin‐Lopez, B. , Diaz, S. & Montes, C. (2011) Can ecosystem properties be fully translated into service values? An economic valuation of aquatic plant services. Ecological Applications, 21, 3083–3103. [Google Scholar]
- Garnier, E. , Cortez, J. , Billès, G. , Navas, M.‐L. , Roumet, C. , Debussche, M. et al (2004) Plant functional markers capture ecosystem properties during secondary succession. Ecology, 85, 2630–2637. [Google Scholar]
- Grime, J.P. (1988) The C‐S‐R model of primary plant strategies – origins, implications and tests Plant Evolutionary Biology (eds Gottlieb L.D. & Jain K.S.), pp. 371–393. Chapman and Hall, London, UK. [Google Scholar]
- Haslam, S.M. (1978) River Plants. Cambridge University Press, Cambridge. [Google Scholar]
- Hilton, J. , O'Hare, M. , Bowes, M.J. & Jones, I. (2006) How green is my river? A new paradigm of eutrophication in rivers. Science of the Total Environment, 365, 66–83. [DOI] [PubMed] [Google Scholar]
- Holmes, N.T.H. , Newman, J.R. , Chadd, S. , Rouen, K.J. , Saint, L. & Dawson, F.H. (1999) Mean Trophic Rank: A User's Manual. R&D Technical Report E38, Environment Agency, Bristol. [Google Scholar]
- Hutchinson, G.E. (1975) A Treatise on Limnology. Volume III. Limnological Botany. John Wiley & Sons, New York. [Google Scholar]
- Hynes, H.B.N. (1969) The enrichment of streams, pp. 188–196. Eutrophication: Causes, Consequences, Correctives. Proceedings of a Symposium. National Academy of Sciences, Washington, DC. [Google Scholar]
- Jones, K.B. , Neale, A.C. , Nash, M.S. , Van Remortel, R.D. , Wickham, J.D. , Riitters, K.H. & O'Neill, R.V. (2001) Predicting nutrient and sediment loadings to streams from landscape metrics: a multiple watershed study from the United States Mid‐Atlantic Region. Landscape Ecology, 16, 301–312. [Google Scholar]
- Klotz, S. , Kühn, I. & Durka, W. (2002) BIOLFLOR — Eine Datenbank zu biologisch‐ökologischen Merkmalen der Gefäßpflanzen in Deutschland. Schriftenreihe für Vegetationskunde. Bundesamt für Naturschutz, Bonn. (In German) [Google Scholar]
- Kühn, I. , Durka, W. & Klotz, S. (2004) BiolFlor – a new plant‐trait database as a tool for plant invasion ecology. Diversity and Distributions, 10, 363–365. [Google Scholar]
- Lavorel, S. , Rochette, C. & Lebreton, J.‐D. (1999) Functional groups for response to disturbance in Mediterranean old fields. Oikos, 84, 480–498. [Google Scholar]
- Lavorel, S. , Touzard, B. , Lebreton, J.‐D. & Clement, B. (1998) Identifying functional groups for response to disturbance in an abandoned pasture. Acta Oecologica, 19, 227–240. [Google Scholar]
- Legendre, P. & Legendre, L. . (1998) Numerical Ecology, 2nd English edn Elsevier Science, Amsterdam. [Google Scholar]
- Lepš, J. , de Bello, F. , Smilauer, P. & Dolesal, J. (2011) Community trait response to environment: disentangling species turnover vs intraspecific trait variability effects. Ecography, 34, 856–863. [Google Scholar]
- Maberly, S.C. & Madsen, T.V. (2002) Freshwater angiosperm carbon concentrating mechanisms: processes and patterns. Functional Plant Biology, 29, 393–405. [DOI] [PubMed] [Google Scholar]
- Mainstone, C.P. & Parr, W. (2002) Phosphorus in rivers‐ecology and management. Science of the Total Environment, 282, 25–47. [DOI] [PubMed] [Google Scholar]
- Maskell, L. , Smart, C.S.M. , Bullock, J.M. , Thompson, K. & Stevens, C.J. (2010) Nitrogen deposition causes widespread loss of species richness in British habitats. Global Change Biology, 16, 671–679. [Google Scholar]
- McGill, J.B. , Enquist, B.J. , Weiher, E. & Westoby, M. (2006) Rebuilding community ecology from functional traits. Trends in Ecology and Evolution, 21, 178–185. [DOI] [PubMed] [Google Scholar]
- Mesters, C.M.L. (1995) Shifts in macrophyte species composition as a result of eutrophication and pollution in Dutch transboundary streams over the past decades. Journal of Aquatic Ecosystem Health, 4, 295–305. [Google Scholar]
- Monaghan, R.M. , Carey, P.L. , Wilcock, R.J. , Drewry, J.J. , Houlbrooke, D.J. , Quinn, J.M. & Thorrold, B.S. (2009) Linkages between land management activities and stream water quality in a border dyke‐irrigated pastoral catchment. Agriculture Ecosystems and Environment, 129, 201–211. [Google Scholar]
- Moretti, M. & Legg, C. (2009) Combining plant and animal traits to assess community functional responses to disturbance. Ecography, 32, 299–309. [Google Scholar]
- Oksanen, J. , Blanchet, F.G. , Kindt, R. , Legendre, P. , Minchin, P.R. , O'Hara, R.B. et al (2013) Vegan: Community Ecology Package. R package version 2.0‐8. URL http://CRAN.R-project.org/package=vegan [Google Scholar]
- Pakeman, R.J. (2011) Functional diversity indices reveal the impacts of land use intensification on plant community assembly. Journal of Ecology, 99, 1143–1151. [Google Scholar]
- Pardo, I. , Gómez‐Rodríguez, C. , Wasson, J.‐C. , Owen, R. , van de Bund, W. , Kelly, M. et al (2012) The European reference condition concept: a scientific and technical approach to identify minimally‐impacted river ecosystems. Science of the Total Environment, 420, 33–42. [DOI] [PubMed] [Google Scholar]
- van der Pijl, L. (1972) Principles of Dispersal in Higher Plants, 2nd edn Springer, Berlin. [Google Scholar]
- R Core Team (2013) R: A Language and Environment for Statistical Computing. R Foundation for Statistical Computing, Vienna, Austria: URL http://www.R-project.org/ [Google Scholar]
- Riis, T. , Sand‐Jensen, K. & Larsen, S.E. (2001) Plant distribution and abundance in relation to physical conditions and location within Danish stream systems. Hydrobiologia, 448, 217–228. [Google Scholar]
- Sand‐Jensen, K. (1990) Epiphytes shading: its role in resulting depth distribution of submerged aquatic macrophytes. Folia Geobotanica et Phytotaxonomica, 25, 315–320. [Google Scholar]
- Sand‐Jensen, K. , Riis, T. , Vestergaard, O. & Moeslund, B. (2006) From spring to river – patterns and mechanisms Running Waters: Historical Development and Restoration of Lowland Danish Streams (eds Sand‐Jensen I.K., Friberg N. & Murphy J.), pp. 45–54. National Environmental Research Institute, Aarhus Universitetsforlag, Aarhus. [Google Scholar]
- Sculthorpe, C.D. (1967) The Biology of Aquatic Vascular Plants. Edward Arnold Ltd, London. [Google Scholar]
- Shipley, B. (2010) Community assembly, natural selection and maximum entropy models. Oikos, 119, 604–609. [Google Scholar]
- Smith, V.H. , Tilman, G.D. & Nekola, J.C. (1999) Eutrophication: impacts of excess nutrient inputs on freshwater, marine and terrestrial ecosystems. Environmental Pollution, 100, 179–196. [DOI] [PubMed] [Google Scholar]
- Soer (2010) The European Environment – State and Outlook 2010: Synthesis. European Environment Agency, Copenhagen. [Google Scholar]
- Suding, K.N. , Lavorel, S. , Chapin, F.S. , Cornelissen, J.H.C. , Díaz, S. , Garnier, E. et al (2006) Scaling environmental change through the community‐level: a trait based response and effect framework for plants. Global Change Biology, 14, 1125–1140. [Google Scholar]
- Thuiller, W. , Albert, C.H. , Dubuis, A. , Randin, C. & Guisan, A. (2010) Variation in habitat suitability does not always relate to variation in species plant functional traits. Biology Letters, 6, 120–123. [DOI] [PMC free article] [PubMed] [Google Scholar]
- Tilman, D. , Knops, J. , Wedin, D. , Reich, P. , Ritchie, M. & Siemann, E. (1997) The influence of functional diversity and composition on ecosystem processes. Science, 277, 1300–1302. [Google Scholar]
- Van Landuyt, W. , Vanhecke, L. , Hoste, I. , Hendrickx, F. & Bauwens, D. (2008) Changes in the distribution area of vascular plants in Flanders (northern Belgium): eutrophication as a major driving force. Biodiversity Conservation, 17, 3045–3060. [Google Scholar]
- Violle, C. , Navas, M.‐L. , Vile, D. , Kazakou, E. , Fortunel, C. , Hummel, I. & Garnier, E. (2007) Let the concept of trait be functional! Oikos, 116, 882–892. [Google Scholar]
- Vörösmarty, C.J. , McIntyre, P.B. , Gessner, M.O. , Dudgeon, D. , Prusevich, A. , Greeen, P. et al (2010) Global threats to human water security and river biodiversity. Nature, 467, 555–561. [DOI] [PubMed] [Google Scholar]
- Westlake, D.F. (1975) River Ecology. Macrophytes (ed. Whitton B.A.), pp. 106–128. Cambridge University Press, Cambridge. [Google Scholar]
- Willby, N.J. , Abernethy, V.J. & Demars, B.O.L. (2000) Attribute‐based classification of European hydrophytes and its relationship to habitat utilization. Freshwater Biology, 43, 43–74. [DOI] [PMC free article] [PubMed] [Google Scholar]
- Xia, J. & Wan, S. (2008) Global response patterns of terrestrial plant species to nitrogen addition. New Phytologist, 179, 428–439. [DOI] [PubMed] [Google Scholar]