

Abstract
Matrix metalloproteinases (MMPs) play an important role in respiratory inflammatory diseases, such as asthma and chronic obstructive pulmonary disease. It was hypothesized that MMP‐8 and MMP‐9 may function as biological markers to assess disease severity in viral lower respiratory tract infections in children. MMP‐8 and MMP‐9 mRNA expression levels in peripheral blood mononuclear cells (PBMCs) and granulocytes obtained in both the acute and recovery phase from 153 children with mild, moderate, and severe viral lower respiratory tract infections were determined using real‐time PCR. In addition, MMP‐8 and MMP‐9 concentrations in blood and nasopharyngeal specimens were determined during acute mild, moderate, and severe infection, and after recovery using ELISA. Furthermore, PBMCs and neutrophils obtained from healthy volunteers were stimulated with RSV, LPS (TLR4 agonist), and Pam3Cys (TLR2 agonist) in vitro. Disease severity of viral lower respiratory tract infections in children is associated with increased expression levels of the MMP‐8 and MMP‐9 genes in both PBMCs and granulocytes. On the contrary, in vitro experiments showed that MMP‐8 and MMP‐9 mRNA and protein expression in PBMCs and granulocytes is not induced by stimulation with RSV, the most frequent detected virus in young children with viral lower respiratory tract infections. These data indicate that expression levels of the MMP‐8 and MMP‐9 genes in both PBMCs and neutrophils are associated with viral lower respiratory tract infections disease severity. These observations justify future validation in independent prospective study cohorts of the usefulness of MMP‐8 and MMP‐9 as potential markers for disease severity in viral respiratory infections. J. Med. Virol. 84:1471–1480, 2012. © 2012 Wiley Periodicals, Inc.
Keywords: matrix metalloproteinases, viral respiratory infections, disease severity, biomarkers
INTRODUCTION
Respiratory viral infections are an important cause of hospitalization among children younger than 5 years of age with estimated population‐based hospitalization rates of 1–2% [Shay et al., 1999; Henrickson et al., 2004; Iwane et al., 2004]. Human respiratory syncytial virus (RSV) is the most commonly identified virus with detection rates up to 40–85% in infants hospitalized for respiratory infections during winter epidemics [Wang et al., 1995; Boyce et al., 2000; Black, 2003]. The clinical manifestations range from a simple common cold to severe lower respiratory tract symptoms requiring mechanical ventilation. About 6–11% of the children admitted to hospital with RSV infection require intensive care admission [Purcell and Fergie, 2004; Berger et al., 2009]. Up to 35% of the children hospitalized with bronchiolitis did not receive any supportive intervention [Mansbach et al., 2008]. On the other hand, it is crucial to avoid discharge of those children who may experience clinical deterioration. Among children sent home with the diagnosis bronchiolitis, 4.6–6.8% required hospitalization later on during infection [Roback and Baskin, 1997; Norwood et al., 2010]. Biomarkers to assess severity of viral lower respiratory tract infections, in particular RSV infection, may be helpful to clinicians in the decision whether a child needs to be hospitalized.
Lung injury during severe RSV infection is thought to be mediated by both direct cytotoxic effects of the virus and the result of the induced inflammation. Pathologic features of severe RSV infection include extensive bronchiolar epithelial destruction, peribronchial lymphocyte infiltration, necrosis of bronchial epithelium, and mucus plugs in the small bronchioles [Johnson et al., 2007; Welliver et al., 2008]. Matrix metalloproteinases (MMPs) are family of zinc endopeptidases capable of degrading components of the cellular matrix, and consequently, are suggested to be important in several diseases associated with tissue remodeling. Pronounced increase in their expression is thought to be associated with a variety of inflammatory disease, including respiratory diseases [Greenlee et al., 2007].
MMPs play a role in cellular migration of neutrophils, lymphocytes, and other immune cells to the lungs by degrading extracellular matrix, but also have pro‐ and anti‐inflammatory properties. The activity of MMPs is regulated through binding to tissue inhibitor of metalloproteinases (TIMPs) leading to inactivation. An imbalance in production and activation, or inactivation by TIMPs might augment airway inflammation through direct or indirect effects upon signaling pathways that influence migration of leukocytes through the tissues [Greenlee et al., 2007; Schuurhof et al., 2012]. Increased concentrations and activity of MMP‐8 and MMP‐9 have been observed in respiratory samples obtained from adults and children with acute lung injury and pneumonia [Hartog et al., 2003; Fligiel et al., 2006; Schaaf et al., 2008; Kong et al., 2009] as well as in chronic lung diseases such as asthma [Prikk et al., 2002; Obase et al., 2010]. In addition, a relation between MMP‐9 concentrations and disease severity of pneumonia [Hartog et al., 2003; Schaaf et al., 2008] and asthma [Belleguic et al., 2002; Mattos et al., 2002] has been described.
Yeo et al. [2002] have reported that MMP‐9 protein expression is increased in human airway epithelial cell lines infected with RSV. In addition, MMP‐9 gene expression is increased in the lungs of RSV‐infected mice [Li and Shen, 2007]. Another study demonstrated that nasopharyngeal samples from infants infected with RSV and parainfluenza virus (PIV) contain increased MMP‐9 and TIMP‐1 concentrations [Elliott et al., 2007].
In the current study, it was hypothesized that MMP‐8 and MMP‐9 gene expression levels, and consequently, MMP‐8 and MMP‐9 plasma concentrations may function as biomarkers for disease severity in viral lower respiratory tract infections.
METHODS
Study Design
Children younger than 5 years of age with laboratory confirmed viral lower respiratory tract infections were prospectively included during three consecutive winter seasons (November–April in the years 2006–2009). Patients with congenital heart or lung disease, known immunodeficiency's or glucocorticoid use were excluded. Viral lower respiratory tract infections was defined as an acute infection of the lower airways, characterized by increased respiratory effort (tachypnea and/or use of accessory respiratory muscles and/or expiratory wheezing and/or crackles and/or apnea) in combination with a confirmed viral etiology by multiplex real‐time polymerase chain reaction (RT‐PCR) on nasopharyngeal washes as described previously [Templeton et al., 2004]. The multiplex RT‐PCR assay detect 15 different viral pathogens; influenza virus types A and B, coronavirus 229E and OC43, human bocavirus, enterovirus, adenovirus, parechovirus, PIV types 1–4, human metapneumovirus, rhinovirus (RV), and RSV.
Written informed consent was obtained from all parents and the study was approved by the Committee on Research involving Human Subjects of the University Nijmegen Medical Centre. Within 24 hr after admission a blood sample and nasopharyngeal aspirate was collected and parents from hospitalized children were asked permission to draw a second blood sample and nasopharyngeal aspirate 4–6 weeks after admission. Medical history, demographics, and clinical parameters were collected from questionnaires and medical records. Patients were classified into three different groups based on severity of disease. Children without hypoxia or severe feeding problems were allocated in the mild group, those requiring hospitalization for supplemental oxygen (oxygen saturations <93%) and/or nasogastric feeding in the moderate group and children requiring mechanical ventilation in the severe group.
Sample Collection
A nasopharyngeal aspirate was collected by introducing a catheter, connected to a collection tube and an aspiration system, into the nasopharyngeal cavity. Then, 1.5 ml of saline was instilled into the catheter and, while slowly retracting the catheter, the nasopharyngeal fluid was aspirated in a collection tube. Afterwards the catheter was flushed with 1 ml of saline and added to the collection fluid. The samples were kept cold and immediately transferred to the laboratory. The nasopharyngeal aspirate was centrifuged at 500g for 10 min at 4°C to spin down the mucus and cells, after which the supernatant was frozen at −80°C.
Five milliliters of blood was collected into sodium heparin tubes and directly transferred to the laboratory. A thin blood smear was prepared and stained with (May‐Grunwald‐)Giemsa to determine the percentages of granulocytes and PBMCs. PBMCs were obtained by density gradient centrifugation (Lymphoprep®; Axis Shield, Oslo, Norway) and stored in Trizol at −80°C for RNA isolation. Plasma samples were stored at −80°C for ELISAs.
Quantitative mRNA Expression of MMP‐8 and MMP‐9 in PBMCs and Granulocytes
RNA from PBMC and granulocytes was extracted using Trizol (Invitrogen Life Technologies, Bleiswijk, The Netherlands) according to the manufacturers' protocol. Subsequently, a clean‐up was performed on total RNA with the RNeasy Minikit (Qiagen, Venlo, The Netherlands) according to the manufacturers' instructions. Total RNA (2 µg, measured with spectrophotometry, Nanodrop, Wilmington) was reverse transcribed using a high‐capacity cDNA reverse transcription kit according to the manufacturers' instructions (Applied Biosystems, Foster City, CA) and cDNA was stored at −20°. The relative gene expression was measured with SYBR Green PCR Mastermix (Applied Biosystems; P/N 4367659) on the ABI 7500 Fast Real Time PCR system using standard program and software. After 40 repetitions a dissociation curve was performed as control for the specificity of the PCR reaction. The following primers were used: hActin F: CGTCACACTTCATGATGGAGTTG, hActin R: CTTCCTTCCTGGGCATGGA; hMMP‐9 F: GCCCCCCTTGCATAAGGA, hMMP‐9 R: CAGGGCGAGGACCATAGAG; and hMMP‐8 F: CCAGTTTGACATTTGATGCTATCAC, hMMP‐8 R: CTGAGGATGCCTTCTCCAGAA. All reactions were performed in duplo. Actin was used as reference gene. After a quality check (melting temp, curve of reaction, and standard deviation Ct) the ΔCt of the MMP‐8 and MMP‐9 to actin was calculated and expressed as relative expression.
MMP‐8, MMP‐9, and TIMP‐1 Concentrations in Plasma and Nasopharyngeal Washes
Concentrations of total MMP‐8 and MMP‐9 in plasma, nasopharyngeal aspirate, and supernatants of cell stimulation assay were measured by ELISA according to the manufacturers' protocol (DuoSet, R&D systems, Abingdon, UK). In addition, TIMP‐1 concentrations in plasma were determined as described above.
In Vitro Stimulation of PBMCs and Neutrophils From Healthy Volunteers
After informed consent, blood was drawn from healthy volunteers and collected in EDTA tubes. Blood was diluted 1:1 with pyrogene‐free PBS (Lonza, Basel, Switzerland). PBMCs and granulocytes were obtained by density gradient centrifugation (Lymphoprep®; Axis Shield). After washing, PBMCs were brought at a concentration of 5 × 10⁶ cells/ml in serum‐free RPMI (Gibco, Invitrogen, Paisley, UK) with 100 U/ml of penicilin/streptavidin (Gibco, Invitrogen). Granulocytes were purified by lysing the red blood cells (0.155 M NH4Cl, 0.0001 M Na2EDTA and 0.01 M KHCO3), and, after washing, granulocytes were suspended at a concentration of 5 × 10⁶ cells/ml in RPMI supplemented with 0.5% human serum albumin (Sanquin, Amsterdam, The Netherlands).
Mononuclear cells (5 × 10⁵ in 100 µl) were added to round‐bottom 96‐well plates and stimulated with either 100 µl culture medium (negative control), 1 ng/ml LPS (Escherichia coli serotype 055:B5, Sigma–Aldrich, purified as described previously [Hirschfeld et al., 2000] or MOI 1 of RSV A2 (kindly provided by Dr. R. de Swart, Erasmus MC, Rotterdam, The Netherlands). RSV A2 was cultured in HeLa cells and purified by ultracentrifuge over a sucrose 30% gradient. After incubation for 24 hr at 37°C and 5% CO2. supernatant was collected and stored at −80°C. Neutrophils (5 × 10⁵ in 100 µl) were stimulated and incubated in the same way for 4 hr and supernatant was stored at −80°C. Apoptosis was determined on the FACScalibur by Annexin V apoptosis detection kit (BD) according to the manufacturers' instructions and no differences between stimuli were found after 4 hr.
Statistics
Values are expressed as percentages for categorical variables and as mean and standard error (SE) or median and interquartile range (IQR) for continuous variables. For variables that were not normally distributed, Kruskal–Wallis test was performed to compare continuous variables followed by Mann–Whitney U‐tests for individual comparisons. Chi‐squared tests were performed to compare categorical data. A two‐sided value of P < 0.05 was considered statistically significant.
RESULTS
Patient Characteristics
In total, 153 patients were included. In 109 patients (71%) RSV was detected. RSV positive children were significantly younger than RSV negative children. No other significant differences were observed between these groups (Table I).
Table I.
Patient Characteristics
| Total (N = 153) | RSV+ (N = 109) | RSV− (N = 44) | P‐value | |
|---|---|---|---|---|
| Age (days ± SE) | 206 ± 26 | 149 ± 20 | 347 ± 72 | <0.001 |
| Male | 95 (62%) | 70 (64%) | 25 (57%) | NS |
| Prematurity | 21 (14%) | 16 (15%) | 5 (11%) | NS |
| Family history of atopy | 82 (57%) | 56 (54%) | 26 (63%) | NS |
| Symptomatic days before presentation (days ± SE) | 5.5 ± 0.4 | 5.2 ± 0.4 | 6.3 ± 1.1 | NS |
Data are presented as number (%), unless otherwise specified. For variables that were not normally distributed, Kruskal–Wallis test was performed to compare continuous variables followed by Mann–Whitney U‐tests for individual comparisons. Chi‐squared tests were performed to compare categorical data. A two‐sided value of P < 0.05 was considered statistically significant. NS, not significant, SE, standard error.
A total of 54, 60, and 39 children were classified as having mild, moderate, and severe disease, respectively. Patients with severe disease were significantly younger compared to those with mild disease (105 days vs. 278 days; P < 0.05). More prematurely born children were observed in the severe group compared to the mild and moderate group. No other significant differences in clinical parameters were found between the different severity groups (Table II). In addition, total leukocytes and neutrophil counts were comparable between all groups.
Table II.
Patient Characteristics for Mild, Moderate, and Severe Infections
| Total (N = 153) | Mild (N = 54) | Moderate (N = 60) | Severe (N = 39) | P‐value | |
|---|---|---|---|---|---|
| Age (days) | 206 ± 26 | 278 ± 52 | 206 ± 38 | 105 ± 36 | <0.01 |
| Male (%) | 95 (62%) | 32 (59%) | 36 (60%) | 27 (69%) | NS |
| Prematurity (%) | 21 (14%) | 5 (9%) | 6 (10%) | 10 (26%) | <0.05 |
| Family history of atopy (%) | 82 (57%) | 27 (52%) | 36 (62%) | 19 (55%) | NS |
| Symptomatic days before presentation | 5.5 ± 0.4 | 7.0 ± 1.1 | 4.8 ± 0.3 | 4.6 ± 0.4 | NS |
| RSV (%) | 109 (71%) | 35 (65%) | 45 (75%) | 29 (74%) | NS |
| Leukocytes counts | 8.7 ± 0.7 | 9.8 ± 1.1 | 8.6 ± 1.0 | 8.2 ± 1.4 | NS |
| Neutrophil counts | 3.5 ± 0.5 | 3.1 ± 0.7 | 2.9 ± 0.7 | 4.3 ± 1.1 | NS |
Data are presented as percentages or mean ± standard error (SE). Cell counts are given as *10E6 cells/ml ± SE. For variables that were not normally distributed, Kruskal–Wallis test was performed to compare continuous variables followed by Mann–Whitney U‐tests for individual comparisons. Chi‐squared tests were performed to compare categorical data. A two‐sided value of P < 0.05 was considered statistically significant. NS, not significant.
Disease Severity Is Associated With Increased Gene Expression Levels of MMP‐8 and MMP‐9 in Both Granulocytes and PBMCs
During acute viral infection we observed increased expression of the MMP‐8 and MMP‐9 genes in both PBMCs and granulocytes compared to recovery. No differences in gene expression of MMP‐8 and MMP‐9 in both PBMCs and granulocytes were found between RSV positive and RSV negative children during acute infection. In general, gene expression of the MMP‐9 gene was higher in granulocytes than in PBMCs. For MMP‐8, the same trend was noticed (Figs. 1A,B and 2A,B).
Figure 1.
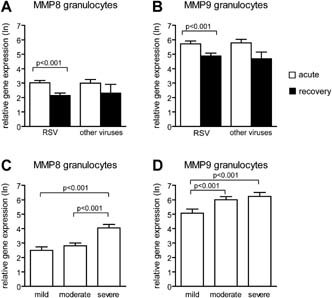
Gene expression levels of MMP‐8 and MMP‐9 in granulocytes from children with viral lower respiratory tract infections. Relative gene expression levels (mean ± standard error) of MMP‐8 (A) and MMP‐9 (B) in PBMCs from children during acute RSV positive and RSV negative viral lower respiratory tract infections and after recovery of infection. Relative gene expression levels of MMP‐8 (C) and MMP‐9 (D) for RSV positive children with mild, moderate, and severe disease. Mann–Whitney U‐test was performed to compare children infected by RSV and other viruses. Paired analyses (Wilcoxon) were performed to compare acute and recovery samples. A two‐sided value of P < 0.05 was considered statistically significant.
Figure 2.
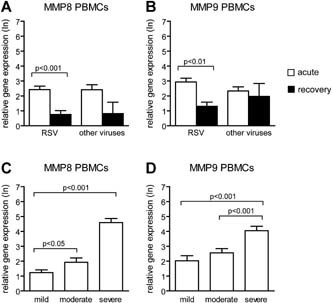
Expression levels of the MMP‐8 and MMP‐9 genes in PBMCs from children with viral lower respiratory tract infections. Relative gene expression levels (mean ± standard error) of MMP‐8 (A) and MMP‐9 (B) in PBMCs from children during acute RSV positive and RSV negative viral lower respiratory tract infections and after recovery of infection. Relative gene expression levels of MMP‐8 (C) and MMP‐9 (D) for RSV positive children with mild, moderate, and severe disease. Mann–Whitney U‐test was performed to compare children infected by RSV and other viruses. Paired analyses (Wilcoxon) were performed to compare acute and recovery samples. A two‐sided value of P < 0.05 was considered statistically significant.
Increased disease severity was associated with higher expression levels of the MMP‐8 and MMP‐9 genes in both PBMCs and granulocytes. To determine whether this association was dependent on the type of virus, RSV positive and RSV negative children were analyzed separately. For RSV positive patients, the same association was found between disease severity and gene expression levels (Figs. 1C,D and 2C,D). For RSV negative patients, MMP‐8 and MMP‐9 gene expression was higher in children with severe disease compared to those with mild. In addition, RSV negative children with severe disease had higher expression levels of the MMP‐8 gene in both PBMCs and granulocytes compared to those with moderate disease (data not shown).
Disease Severity Is Associated With Increased MMP‐8 Plasma Levels
The plasma concentration of MMP‐8 was increased during acute RSV infection compared to recovery. In RSV negative patients this difference was not significant (Fig. 3A). Higher MMP‐8 plasma concentrations were found in children with severe and moderate disease compared to those with mild disease (Fig. 4A). In nasopharyngeal washes, the concentration of MMP‐8 was increased during acute RSV infection compared to recovery washes (Fig. 3D). No significant differences of MMP‐8 concentrations in the nasopharyngeal washes were observed between the different severity groups (Fig. 4D). In both RSV positive as RSV negative patients MMP‐9 concentrations in the nasopharyngeal washes were increased during infection (Fig. 3E). Children with moderate disease had increased MMP‐9 concentrations in nasopharyngeal washes compared to those with mild disease. However, no significant differences in MMP‐9 concentrations were observed in children with severe disease compared to those with mild and moderate disease (Fig. 4E). TIMP‐1 concentrations in plasma or nasopharyngeal washes were not increased during acute infection and there was no correlation with disease severity (Figs. 3C and 4C). The ratio between MMP‐9 and TIMP‐1 plasma concentrations, an indicator for enzyme activity, was not increased during acute RSV infection. This ratio was significant higher in the recovery plasma of RSV negative patients compared to the acute samples (Fig. 3F). No relation between disease severity and the plasma MMP‐9 and TIMP‐1 ratio was found (Fig. 4F).
Figure 3.
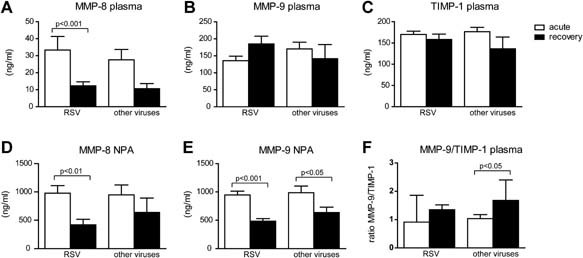
MMP‐8 and MMP‐9 concentrations in plasma and nasopharyngeal samples from children during acute lower respiratory tract infections and after recovery. Plasma concentration of MMP‐8 (A), MMP‐9 (B), TIMP‐1 (C), and concentration in nasopharyngeal washes of MMP‐8 (D) and MMP‐9 (E) from children during acute RSV positive and RSV negative viral lower respiratory tract infections and after recovery of infection. Ratio's between plasma MMP‐9 and TIMP‐1 (F). Concentrations (ng/ml) are given in mean ± standard error. Mann–Whitney U‐test was performed to compare children infected by RSV and other viruses. Paired analyses (Wilcoxon) were performed to compare acute and recovery samples. A two‐sided value of P < 0.05 was considered statistically significant.
Figure 4.
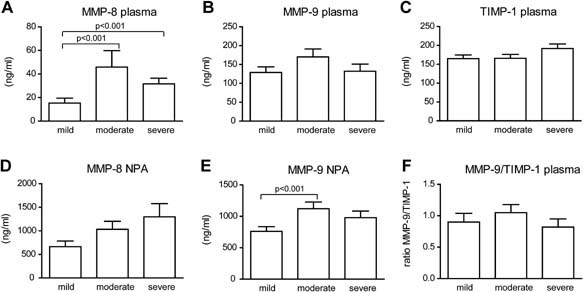
MMP‐8 and MMP‐9 concentrations in plasma and nasopharyngeal samples from children with mild, moderate, and severe RSV infection. For RSV positive children plasma concentration of MMP‐8 (A), MMP‐9 (B), TIMP‐1 (C), and concentration in nasopharyngeal washes of MMP‐8 (D) and MMP‐9 (E) in mild, moderate, and severe disease are given. Ratio's between plasma MMP‐9 and TIMP‐1 (F). Concentrations (ng/ml) are given in mean ± standard error. Mann–Whitney U‐tests were performed to compare mild, moderate, and severe disease. A two‐sided value of P < 0.05 was considered statistically significant.
No differences in plasma or nasopharyngeal levels of MMP‐8, MMP‐9, and TIMP‐1 plasma concentrations were observed between RSV positive and RSV negative children during acute viral respiratory infection. In general, MMP‐8 and MMP‐9 concentrations were higher in nasopharyngeal samples compared to plasma.
MMP‐9 Plasma Concentrations Are Correlated With the Number of Granulocytes
MMP‐9 plasma concentrations correlated with the number of granulocytes measured during acute RSV infection (Pearson's correlation coefficient 0.33; P = 0.019). No correlation was found between the number of granulocytes and MMP‐8 plasma and nasopharyngeal concentrations and MMP‐9 nasopharyngeal concentrations (data not shown). Furthermore, there was no correlation between symptomatic days before presentation and levels of MMP‐8 and MMP‐9 gene expression or concentration of the protein in plasma and nasopharyngeal washes (data not shown).
MMP‐8 and MMP‐9 mRNA and Protein Expression by PBMCs and Neutrophils Is Not Induced by RSV In Vitro
To investigate whether the source of plasma MMP‐8 and MMP‐9 during RSV infection was the result of direct interaction of PBMCs or neutrophils with RSV, PBMCs and neutrophils were stimulated with RSV in vitro. Stimulation of PBMCs with LPS (TLR4 agonist) induced MMP‐9 secretion, whereas stimulation with RSV had no effect. None of the stimuli induced MMP‐8 secretion by PBMC (Fig. 5A). Stimulation of PBMCs with RSV did not result in increased gene expression of MMP‐8 and only a moderate increase of MMP‐9 expression was observed (Fig. 5B). Unstimulated neutrophils secreted high levels of MMP‐8 and MMP‐9. Stimulation with LPS and RSV had no effect on the release of MMP‐8 and MMP‐9 by neutrophils (Fig. 5C).
Figure 5.
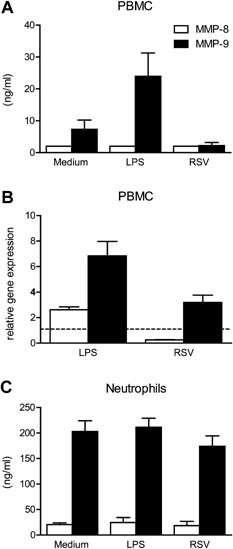
Stimulation of PBMCs and neutrophils by LPS and RSV in vitro. Human PBMC of healthy volunteers (n = 4) were stimulated with LPS (1 ng/ml) or RSV A2 (MOI 1) and MMP‐8 and MMP‐9 concentrations in supernatant were measured after 24 by ELISA (A) or at transcriptional level by q‐PCR (B). Neutrophils were stimulated for 4 hr and MMP levels were determined in the supernatant (C).
DISCUSSION
This study demonstrates that disease severity of viral lower respiratory tract infections in children is associated with increased gene expression levels of the MMP‐8 and MMP‐9 genes in both PBMCs and granulocytes. These associations were observed in children with lower respiratory tract infections caused by either RSV or other respiratory viruses. The in vitro experiments in this study show that MMP‐8 and MMP‐9 mRNA and protein expression in PBMCs and granulocytes is not induced by stimulation with RSV. Consequently, other factors than direct viral interaction induce gene expression in PBMCs and granulocytes.
This is the first study that describes an association between MMP‐8 and MMP‐9 gene expression and disease severity of viral lower respiratory infections in children. This association was significant for children with a RSV infection and there was a trend for children with a viral lower respiratory infection caused by other viruses, indicating to a more general marker for disease severity during respiratory viral infections.
Several studies have shown that transcriptional analysis of peripheral blood cells can be used to discriminate the etiology and disease outcome [Alizadeh et al., 2000; Allantaz et al., 2007; Ramilo et al., 2007; Chaussabel et al., 2008]. Ramilo et al. [2007] compared the transcriptional profiles of PBMCs of children with infectious diseases, and identified a set of genes that could separate influenza A infections from bacterial infections (Staphylococcus aureus, Escherichia coli, and Streptococcus pneumoniae). Both MMP‐8 and MMP‐9 were not represented in the selected set of classifier genes. Retrospective analysis of the microarray data set was performed by us, and showed that mRNA expression of MMP‐8 and MMP‐9 were elevated in all groups compared to controls, indicating a more general marker for inflammatory disease (data not shown). No data were available on disease severity, so it is not possible to exclude an association with disease severity. In an experimental model of viral infection of the upper respiratory tract in adults with RSV, influenza, and RV, no up‐regulation of MMP‐8 and MMP‐9 was detected in whole blood transcriptional profiles [Zaas et al., 2009]. However, these infections were all mild with consequently low levels of inflammatory markers.
This study shows that in MMP‐8 plasma concentrations were increased during acute infection with RSV. Although MMP‐8 plasma concentrations were higher in moderate and severe disease compared to mild disease, there was no step‐wise relation with disease severity. This is in contrast with the gene expression data and indicates a different source of plasma proteins than the circulating cell population. This is in line with the study of Hartog et al. [2003] in which they found elevated MMP‐8 concentrations in plasma and lung fluid in adults with hospital‐acquired bacterial pneumonia compared to healthy controls. They found an association between clinical severity scores and MMP‐8 concentrations in BAL fluid, but not in plasma.
Although MMP‐9 plasma concentrations were increased during acute viral respiratory infections in children, no association between MMP‐9 plasma concentrations and disease severity was found in this study. Previous studies have described such an association for several inflammatory diseases, such as pneumonia [Hartog et al., 2003], tuberculosis infections [Hrabec et al., 2002], septic shock [Nakamura et al., 1998], and asthma [Belleguic et al., 2002]. This may be related to the fact that, in consistent with other studies [Ricou et al., 1996; Vignola et al., 1998; Yang et al., 2005], MMP‐9 concentrations were correlated to neutrophil counts, although no significant differences in neutrophil counts between the different severity groups were observed in this study.
TIMP‐1 is an inhibitor of the protease activity of all known MMPs [Gomez et al., 1997]. Previous studies have described an association between an imbalance between MMP‐9 and TIMP‐1 and tissue degradation and airflow obstruction in asthma and chronic bronchitis [Vignola et al., 1998; Mautino et al., 1999]. In addition, elevated MMP‐9/TIMP‐1 ratios have been observed in plasma from patients with status asthmatics [Belleguic et al., 2002]. Furthermore, it has been shown that increased TIMP‐1 concentrations, but not MMP‐9, in nasopharyngeal washes of RSV‐infected children correlated with disease severity and this suggests that a disturbed MMP‐9/TIMP‐1 homeostasis contributes to disease severity [Elliott et al., 2007]. The ratio of MMP‐9 and TIMP‐1 concentration in plasma did not show a correlation with disease severity in this study and indicates that MMP‐9 is differentially regulated at the mucosal level during infection.
Although both MMP‐8 and MMP‐9 concentrations in nasopharyngeal samples were increased during acute infection compared to recovery samples no association with disease severity was observed. The wide range of nasopharyngeal concentrations between individuals is partly due to the variation induced by aspiration volumes from the nasopharyngeal cavity. Currently, more standardized methods have been developed, such as flocked swabs, which can be used for viral diagnostics as well as protein analysis [Dezzutti et al., 2011; Munywoki et al., 2011]. Normalization of protein levels to stable metabolites present in the mucus might further improve the use of nasopharyngeal samples for diagnostics, although these methods are not available yet. Further it should be taken in account that upper respiratory samples do not necessarily represent the situation in the lower airways and the systemic inflammatory response.
The in vitro experiments in this study show that MMP‐8 and MMP‐9 mRNA and protein expression in PBMCs and granulocytes were not induced by stimulation with RSV. Other factors than direct interaction between RSV and host cells could explain the increased gene expression levels of MMP‐8 and MMP‐9 in children with viral lower respiratory tract infections. Influx of bone marrow‐derived neutrophil precursors in blood from children with severe RSV infections can result in higher MMP‐9 expression due to granule protein production, such as MMP‐8 and MMP‐9, during immature stages of neutrophil development [Lukens et al., 2010]. Also inflammatory mediators, such as growth factors, pro‐inflammatory cytokines, oxidative stress upon viral infection can induce elevated gene expression levels of MMPs [Greenlee et al., 2007]. It has also been shown that the lung injury caused by mechanical ventilation has resulted in increased MMP‐8 and MMP‐9 expression [Albaiceta et al., 2010]. However, in this study, the last mentioned cannot completely explain the differences in gene expression since also differences in gene expression between patients with mild and moderate disease were observed, all non‐ventilated patients.
The results of this study indicate that neutrophils are the major source of MMP‐9 production. The higher MMP‐8 and MMP‐9 concentrations in nasopharyngeal samples compared to plasma may therefore reflect the influx and degranulation of neutrophils in the airways during infection.
This is in contrast to observations made by others that suggest that airway epithelial cells are the primary source of MMPs. It has been shown that MMP‐9 gene expression is increased in human airway epithelial cell lines infected with RSV [Yeo et al., 2002]. However, another study indicated that infected human airway epithelial cells are not the primary source of MMPs and TIMP‐1 and that infiltrating leukocytes are responsible for MMP‐9 in airway samples [Elliott et al., 2007]. Also in a RSV infection model in mice, of which it is known that the epithelial cells are not infected, it was demonstrated that gene expression of MMP‐9 is elevated in the lungs most likely by infiltrating cells [Li and Shen, 2007]. For MMP‐8, no correlation with neutrophil counts was observed and gene expression levels in granulocytes and PBMCs were comparable indicating that MMP‐8 transcription and secretion was different regulated than MMP‐9. This is supported by differences in the degranulation of subcellular neutrophilic granules, in which MMP‐8 and MMP‐9 are stored [Faurschou and Borregaard, 2003] and differences in transcriptional events that induce MMP‐8 and MMP‐9 mRNA expression. For example, it has been shown that pro‐inflammatory cytokines, particularly IL‐1β, play a central role in the modulation of MMP‐8 expression [Knauper et al., 1993; Abe et al., 2001]. Future studies may reveal the role for MMP‐8 plasma concentrations as a potential biomarker to assess disease severity in viral lower respiratory tract infections in children.
The relation of MMP‐8 and MMP‐9 with viral load in the nasopharyngeal cavity have not been investigated in this study. In experimental respiratory viral infection models, inflammatory markers such as cytokines correlated with viral load and the symptom scores, indicating that the amount of virus is the driving force for inflammation [DeVincenzo et al., 2010]. Also in children, disease severity has been associated with high viral titers [Houben et al., 2010; El Saleeby et al., 2011]. Further research might reveal the role of inflammatory mediators in the pathogeneses of severe respiratory viral infections [Openshaw, 2005]. In this light, it is interesting to consider inflammatory mediators, such as MMPs, as potential targets for therapy.
Some limitations of this study need to be considered. First, the younger age of the children with the most severe lower respiratory tract infections may have caused a bias in the results. However, age was not correlated with MMP‐8 and MMP‐9 plasma concentrations, which suggests that age alone cannot explain the observed differences. According to these results, Thrailkill et al. [2005] did not found significant differences in MMP‐8 and MMP‐9 serum concentrations in children, 2–18 years of age. Second, multiple viruses were detected in 40% children with lower respiratory tract infections and it cannot be entirely exclude that the presence of multiple viruses have induced a different inflammatory response.
The results of this study suggest that the expression of MMP‐8 and MMP‐9 genes are potential marker candidates for diagnostic use to assess disease severity in children with viral lower respiratory tract infections. Markers for disease severity do not have clinical implication at present, because currently antiviral treatment is not available. However, new antiviral treatment of patients will be based most likely on diagnostics predicting disease severity and susceptibility [Quinn, 2010; Hoggatt, 2011]. Furthermore, markers for disease severity are also important for research purposes to study effects of interventions, such as treatment. Although currently no biomarkers at transcription level are available in the clinic, because the processing is time consuming, innovative techniques may enable rapid analysis of the expression of multiple genes at transcriptional level in the near future [Brand et al., 2010].
In conclusion, increased expression of the MMP‐8 and MMP‐9 genes was observed in PBMCs and granulocytes obtained from children with severe viral lower respiratory tract infections. MMP‐8 and MMP‐9 gene expression levels in circulating cells may be useful markers to support clinical evaluation of disease severity in viral respiratory infections. These results justify future follow‐up, that is, the validation in independent prospective study cohorts of the usefulness of MMP‐8 and MMP‐9 as a potential markers for disease severity in viral respiratory infections.
Acknowledgements
We would like to thank all parents and children for their participation in the study. We are grateful to the medical staff of the Department of Pediatrics and Intensive Care Unit at the UMCN St. Radboud and Canisius Wilhelmina Hospital for assistance in obtaining clinical samples. In addition, we would like to thank E. Voorbrood and P. Ruijs from the Laboratory of Hematology at the UMCN St. Radboud for counting the blood smears.
Financial disclosure: The authors have indicated that they have no personal financial relationships relevant to this article to disclose.
REFERENCES
- Abe M, Kawamoto K, Okamoto H, Horiuchi N. 2001. Induction of collagenase‐2 (matrix metalloproteinase‐8) gene expression by interleukin‐1beta in human gingival fibroblasts. J Periodontal Res 36: 153–159. [DOI] [PubMed] [Google Scholar]
- Albaiceta GM, Gutierrez‐Fernandez A, Garcia‐Prieto E, Puente XS, Parra D, Astudillo A, Campestre C, Cabrera S, Gonzalez‐Lopez A, Fueyo A, Taboada F, Lopez‐Otin C. 2010. Absence or inhibition of matrix metalloproteinase‐8 decreases ventilator‐induced lung injury. Am J Respir Cell Mol Biol 43: 555–563. [DOI] [PubMed] [Google Scholar]
- Alizadeh AA, Eisen MB, Davis RE, Ma C, Lossos IS, Rosenwald A, Boldrick JC, Sabet H, Tran T, Yu X, Powell JI, Yang L, Marti GE, Moore T, Hudson J, Jr. , Lu L, Lewis DB, Tibshirani R, Sherlock G, Chan WC, Greiner TC, Weisenburger DD, Armitage JO, Warnke R, Levy R, Wilson W, Grever MR, Byrd JC, Botstein D, Brown PO, Staudt LM. 2000. Distinct types of diffuse large B‐cell lymphoma identified by gene expression profiling. Nature 403: 503–511. [DOI] [PubMed] [Google Scholar]
- Allantaz F, Chaussabel D, Stichweh D, Bennett L, Allman W, Mejias A, Ardura M, Chung W, Smith E, Wise C, Palucka K, Ramilo O, Punaro M, Banchereau J, Pascual V. 2007. Blood leukocyte microarrays to diagnose systemic onset juvenile idiopathic arthritis and follow the response to IL‐1 blockade. J Exp Med 204: 2131–2144. [DOI] [PMC free article] [PubMed] [Google Scholar]
- Belleguic C, Corbel M, Germain N, Lena H, Boichot E, Delaval PH, Lagente V. 2002. Increased release of matrix metalloproteinase‐9 in the plasma of acute severe asthmatic patients. Clin Exp Allergy 32: 217–223. [DOI] [PubMed] [Google Scholar]
- Berger TM, Aebi C, Duppenthaler A, Stocker M. 2009. Prospective population‐based study of RSV‐related intermediate care and intensive care unit admissions in Switzerland over a 4‐year period (2001–2005). Infection 37: 109–116. [DOI] [PubMed] [Google Scholar]
- Black CP. 2003. Systematic review of the biology and medical management of respiratory syncytial virus infection. Respir Care 48: 209–231. [PubMed] [Google Scholar]
- Boyce TG, Mellen BG, Mitchel EF, Jr. , Wright PF, Griffin MR. 2000. Rates of hospitalization for respiratory syncytial virus infection among children in Medicaid. J Pediatr 137: 865–870. [DOI] [PubMed] [Google Scholar]
- Brand HK, Hermans PW, de Groot R. 2010. Host biomarkers and paediatric infectious diseases: From molecular profiles to clinical application. Adv Exp Med Biol 659: 19–31. [DOI] [PMC free article] [PubMed] [Google Scholar]
- Chaussabel D, Quinn C, Shen J, Patel P, Glaser C, Baldwin N, Stichweh D, Blankenship D, Li L, Munagala I, Bennett L, Allantaz F, Mejias A, Ardura M, Kaizer E, Monnet L, Allman W, Randall H, Johnson D, Lanier A, Punaro M, Wittkowski KM, White P, Fay J, Klintmalm G, Ramilo O, Palucka AK, Banchereau J, Pascual V. 2008. A modular analysis framework for blood genomics studies: Application to systemic lupus erythematosus. Immunity 29: 150–164. [DOI] [PMC free article] [PubMed] [Google Scholar]
- DeVincenzo JP, Wilkinson T, Vaishnaw A, Cehelsky J, Meyers R, Nochur S, Harrison L, Meeking P, Mann A, Moane E, Oxford J, Pareek R, Moore R, Walsh E, Studholme R, Dorsett P, Alvarez R, Lambkin‐Williams R. 2010. Viral load drives disease in humans experimentally infected with respiratory syncytial virus. Am J Respir Crit Care Med 182: 1305–1314. [DOI] [PMC free article] [PubMed] [Google Scholar]
- Dezzutti CS, Hendrix CW, Marrazzo JM, Pan Z, Wang L, Louissaint N, Kalyoussef S, Torres NM, Hladik F, Parikh U, Mellors J, Hillier SL, Herold BC. 2011. Performance of swabs, lavage, and diluents to quantify biomarkers of female genital tract soluble mucosal mediators. PLoS ONE 6: e23136. [DOI] [PMC free article] [PubMed] [Google Scholar]
- El Saleeby CM, Bush AJ, Harrison LM, Aitken JA, DeVincenzo JP. 2011. Respiratory syncytial virus load, viral dynamics, and disease severity in previously healthy naturally infected children. J Infect Dis 204: 996–1002. [DOI] [PMC free article] [PubMed] [Google Scholar]
- Elliott MB, Welliver RC, Sr. , Laughlin TS, Pryharski KS, LaPierre NA, Chen T, Souza V, Terio NB, Hancock GE. 2007. Matrix metalloproteinase‐9 and tissue inhibitor of matrix metalloproteinase‐1 in the respiratory tracts of human infants following paramyxovirus infection. J Med Virol 79: 447–456. [DOI] [PubMed] [Google Scholar]
- Faurschou M, Borregaard N. 2003. Neutrophil granules and secretory vesicles in inflammation. Microbes Infect 5: 1317–1327. [DOI] [PubMed] [Google Scholar]
- Fligiel SE, Standiford T, Fligiel HM, Tashkin D, Strieter RM, Warner RL, Johnson KJ, Varani J. 2006. Matrix metalloproteinases and matrix metalloproteinase inhibitors in acute lung injury. Hum Pathol 37: 422–430. [DOI] [PubMed] [Google Scholar]
- Gomez DE, Alonso DF, Yoshiji H, Thorgeirsson UP. 1997. Tissue inhibitors of metalloproteinases: Structure, regulation and biological functions. Eur J Cell Biol 74: 111–122. [PubMed] [Google Scholar]
- Greenlee KJ, Werb Z, Kheradmand F. 2007. Matrix metalloproteinases in lung: Multiple, multifarious, and multifaceted. Physiol Rev 87: 69–98. [DOI] [PMC free article] [PubMed] [Google Scholar]
- Hartog CM, Wermelt JA, Sommerfeld CO, Eichler W, Dalhoff K, Braun J. 2003. Pulmonary matrix metalloproteinase excess in hospital‐acquired pneumonia. Am J Respir Crit Care Med 167: 593–598. [DOI] [PubMed] [Google Scholar]
- Henrickson KJ, Hoover S, Kehl KS, Hua W. 2004. National disease burden of respiratory viruses detected in children by polymerase chain reaction. Pediatr Infect Dis J 23: S11–S18. [DOI] [PubMed] [Google Scholar]
- Hirschfeld M, Ma Y, Weis JH, Vogel SN, Weis JJ. 2000. Cutting edge: Repurification of lipopolysaccharide eliminates signaling through both human and murine toll‐like receptor 2. J Immunol 165: 618–622. [DOI] [PubMed] [Google Scholar]
- Hoggatt J. 2011. Personalized medicine—Trends in molecular diagnostics: Exponential growth expected in the next ten years. Mol Diagn Ther 15: 53–55. [DOI] [PubMed] [Google Scholar]
- Houben ML, Coenjaerts FE, Rossen JW, Belderbos ME, Hofland RW, Kimpen JL, Bont L. 2010. Disease severity and viral load are correlated in infants with primary respiratory syncytial virus infection in the community. J Med Virol 82: 1266–1271. [DOI] [PMC free article] [PubMed] [Google Scholar]
- Hrabec E, Strek M, Zieba M, Kwiatkowska S, Hrabec Z. 2002. Circulation level of matrix metalloproteinase‐9 is correlated with disease severity in tuberculosis patients. Int J Tuberc Lung Dis 6: 713–719. [PubMed] [Google Scholar]
- Iwane MK, Edwards KM, Szilagyi PG, Walker FJ, Griffin MR, Weinberg GA, Coulen C, Poehling KA, Shone LP, Balter S, Hall CB, Erdman DD, Wooten K, Schwartz B. 2004. Population‐based surveillance for hospitalizations associated with respiratory syncytial virus, influenza virus, and parainfluenza viruses among young children. Pediatrics 113: 1758–1764. [DOI] [PubMed] [Google Scholar]
- Johnson JE, Gonzales RA, Olson SJ, Wright PF, Graham BS. 2007. The histopathology of fatal untreated human respiratory syncytial virus infection. Mod Pathol 20: 108–119. [DOI] [PubMed] [Google Scholar]
- Knauper V, Osthues A, DeClerck YA, Langley KE, Blaser J, Tschesche H. 1993. Fragmentation of human polymorphonuclear–leucocyte collagenase. Biochem J 291: 847–854. [DOI] [PMC free article] [PubMed] [Google Scholar]
- Kong MY, Gaggar A, Li Y, Winkler M, Blalock JE, Clancy JP. 2009. Matrix metalloproteinase activity in pediatric acute lung injury. Int J Med Sci 6: 9–17. [DOI] [PMC free article] [PubMed] [Google Scholar]
- Li W, Shen HH. 2007. Effect of respiratory syncytial virus on the activity of matrix metalloproteinase in mice. Chin Med J (Engl) 120: 5–11. [PubMed] [Google Scholar]
- Lukens MV, van de Pol AC, Coenjaerts FE, Jansen NJ, Kamp VM, Kimpen JL, Rossen JW, Ulfman LH, Tacke CE, Viveen MC, Koenderman L, Wolfs TF, van Bleek GM. 2010. A systemic neutrophil response precedes robust CD8(+) T‐cell activation during natural respiratory syncytial virus infection in infants. J Virol 84: 2374–2383. [DOI] [PMC free article] [PubMed] [Google Scholar]
- Mansbach JM, Clark S, Christopher NC, LoVecchio F, Kunz S, Acholonu U, Camargo CA, Jr. 2008. Prospective multicenter study of bronchiolitis: Predicting safe discharges from the emergency department. Pediatrics 121: 680–688. [DOI] [PubMed] [Google Scholar]
- Mattos W, Lim S, Russell R, Jatakanon A, Chung KF, Barnes PJ. 2002. Matrix metalloproteinase‐9 expression in asthma: Effect of asthma severity, allergen challenge, and inhaled corticosteroids. Chest 122: 1543–1552. [DOI] [PubMed] [Google Scholar]
- Mautino G, Capony F, Bousquet J, Vignola AM. 1999. Balance in asthma between matrix metalloproteinases and their inhibitors. J Allergy Clin Immunol 104: 530–533. [DOI] [PubMed] [Google Scholar]
- Munywoki PK, Hamid F, Mutunga M, Welch S, Cane P, Nokes DJ. 2011. Improved detection of respiratory viruses in pediatric outpatients with acute respiratory illness by real‐time PCR using nasopharyngeal flocked swabs. J Clin Microbiol 49: 3365–3367. [DOI] [PMC free article] [PubMed] [Google Scholar]
- Nakamura T, Ebihara I, Shimada N, Shoji H, Koide H. 1998. Modulation of plasma metalloproteinase‐9 concentrations and peripheral blood monocyte mRNA levels in patients with septic shock: Effect of fiber‐immobilized polymyxin B treatment. Am J Med Sci 316: 355–360. [DOI] [PubMed] [Google Scholar]
- Norwood A, Mansbach JM, Clark S, Waseem M, Camargo CA, Jr. 2010. Prospective multicenter study of bronchiolitis: Predictors of an unscheduled visit after discharge from the emergency department. Acad Emerg Med 17: 376–382. [DOI] [PMC free article] [PubMed] [Google Scholar]
- Obase Y, Rytila P, Metso T, Pelkonen AS, Tervahartiala T, Turpeinen M, Makela M, Saarialho‐Kere U, Selroos O, Sorsa T, Haahtela T. 2010. Effects of inhaled corticosteroids on metalloproteinase‐8 and tissue inhibitor of metalloproteinase‐1 in the airways of asthmatic children. Int Arch Allergy Immunol 151: 247–254. [DOI] [PubMed] [Google Scholar]
- Openshaw PJ. 2005. Antiviral immune responses and lung inflammation after respiratory syncytial virus infection. Proc Am Thorac Soc 2: 121–125. [DOI] [PubMed] [Google Scholar]
- Prikk K, Maisi P, Pirila E, Reintam MA, Salo T, Sorsa T, Sepper R. 2002. Airway obstruction correlates with collagenase‐2 (MMP‐8) expression and activation in bronchial asthma. Lab Invest 82: 1535–1545. [DOI] [PubMed] [Google Scholar]
- Purcell K, Fergie J. 2004. Driscoll Children's Hospital respiratory syncytial virus database: Risk factors, treatment and hospital course in 3308 infants and young children, 1991 to 2002. Pediatr Infect Dis J 23: 418–423. [DOI] [PubMed] [Google Scholar]
- Quinn B. 2010. Payers and the assessment of clinical utility for companion diagnostics. Clin Pharmacol Ther 88: 751–754. [DOI] [PubMed] [Google Scholar]
- Ramilo O, Allman W, Chung W, Mejias A, Ardura M, Glaser C, Wittkowski KM, Piqueras B, Banchereau J, Palucka AK, Chaussabel D. 2007. Gene expression patterns in blood leukocytes discriminate patients with acute infections. Blood 109: 2066–2077. [DOI] [PMC free article] [PubMed] [Google Scholar]
- Ricou B, Nicod L, Lacraz S, Welgus HG, Suter PM, Dayer JM. 1996. Matrix metalloproteinases and TIMP in acute respiratory distress syndrome. Am J Respir Crit Care Med 154: 346–352. [DOI] [PubMed] [Google Scholar]
- Roback MG, Baskin MN. 1997. Failure of oxygen saturation and clinical assessment to predict which patients with bronchiolitis discharged from the emergency department will return requiring admission. Pediatr Emerg Care 13: 9–11. [DOI] [PubMed] [Google Scholar]
- Schaaf B, Liebau C, Kurowski V, Droemann D, Dalhoff K. 2008. Hospital acquired pneumonia with high‐risk bacteria is associated with increased pulmonary matrix metalloproteinase activity. BMC Pulm Med 8. [DOI] [PMC free article] [PubMed] [Google Scholar]
- Schuurhof A, Bont L, Hodemaekers HM, de Klerk F A, de Groot H, Hofland RW, van de Pol AC, Kimpen JL, Janssen R. 2012. Proteins involved in extracellular matrix dynamics are associated with RSV disease severity. Eur Respir J. [DOI] [PubMed] [Google Scholar]
- Shay DK, Holman RC, Newman RD, Liu LL, Stout JW, Anderson LJ. 1999. Bronchiolitis‐associated hospitalizations among US children, 1980–1996. JAMA 282: 1440–1446. [DOI] [PubMed] [Google Scholar]
- Templeton KE, Scheltinga SA, Beersma MF, Kroes AC, Claas EC. 2004. Rapid and sensitive method using multiplex real‐time PCR for diagnosis of infections by influenza A and influenza B viruses, respiratory syncytial virus, and parainfluenza viruses 1, 2 3, and 4. J Clin Microbiol 42: 1564–1569. [DOI] [PMC free article] [PubMed] [Google Scholar]
- Thrailkill KM, Moreau CS, Cockrell G, Simpson P, Goel R, North P, Fowlkes JL, Bunn RC. 2005. Physiological matrix metalloproteinase concentrations in serum during childhood and adolescence, using Luminex Multiplex technology. Clin Chem Lab Med 43: 1392–1399. [DOI] [PMC free article] [PubMed] [Google Scholar]
- Vignola AM, Riccobono L, Mirabella A, Profita M, Chanez P, Bellia V, Mautino G, D'accardi P, Bousquet J, Bonsignore G. 1998. Sputum metalloproteinase‐9/tissue inhibitor of metalloproteinase‐1 ratio correlates with airflow obstruction in asthma and chronic bronchitis. Am J Respir Crit Care Med 158: 1945–1950. [DOI] [PubMed] [Google Scholar]
- Wang EE, Law BJ, Stephens D. 1995. Pediatric Investigators Collaborative Network on Infections in Canada (PICNIC) prospective study of risk factors and outcomes in patients hospitalized with respiratory syncytial viral lower respiratory tract infection. J Pediatr 126: 212–219. [DOI] [PubMed] [Google Scholar]
- Welliver TP, Reed JL, Welliver RC, Sr. 2008. Respiratory syncytial virus and influenza virus infections: Observations from tissues of fatal infant cases. Pediatr Infect Dis J 27: S92–S96. [DOI] [PubMed] [Google Scholar]
- Yang SF, Chu SC, Chiang IC, Kuo WF, Chiou HL, Chou FP, Kuo WH, Hsieh YS. 2005. Excessive matrix metalloproteinase‐9 in the plasma of community‐acquired pneumonia. Clin Chim Acta 352: 209–215. [DOI] [PubMed] [Google Scholar]
- Yeo SJ, Yun YJ, Lyu MA, Woo SY, Woo ER, Kim SJ, Lee HJ, Park HK, Kook YH. 2002. Respiratory syncytial virus infection induces matrix metalloproteinase‐9 expression in epithelial cells. Arch Virol 147: 229–242. [DOI] [PubMed] [Google Scholar]
- Zaas AK, Chen M, Varkey J, Veldman T, Hero AO III, Lucas J, Huang Y, Turner R, Gilbert A, Lambkin‐Williams R, Oien NC, Nicholson B, Kingsmore S, Carin L, Woods CW, Ginsburg GS. 2009. Gene expression signatures diagnose influenza and other symptomatic respiratory viral infections in humans. Cell Host Microbe 6: 207–217. [DOI] [PMC free article] [PubMed] [Google Scholar]