

Abstract
Background and Aim: Expression profiling of genes specific to pediatric Crohn's Disease (CD) patients was performed to elucidate the molecular mechanisms underlying disease cause and pathogenesis at disease onset.
Methods: We used suppressive subtractive hybridization (SSH) and differential screening analysis to profile the mRNA expression patterns of children with CD and age‐ and sex‐matched controls without inflammatory bowel disease (IBD).
Results: Sequence analysis of 1000 clones enriched by SSH identified 75 functionally annotated human genes, represented by 430 clones. The 75 genes have potential involvement in gene networks, such as antigen presentation, inflammation, infection mechanism, connective tissue development, cell cycle and cancer. Twenty‐eight genes were previously described in association with CD, while 47 were new genes not previously reported in the context of IBD. Additionally, 29 of the 75 genes have been previously implicated in bacterial and viral infections. Quantitative real‐time reverse transcription polymerase chain reaction performed on ileal‐derived RNA from 13 CD and nine non‐IBD patients confirmed the upregulation of extracellular matrix gene MMP2 (P = 0.001), and cell proliferation gene REG1A (P = 0.063) in our pediatric CD cohort.
Conclusion: The retrieval of 28 genes previously reported in association with adult CD emphasizes the importance of these genes in the pediatric setting. The observed upregulation of REG1A and MMP2, and their known impact on cell proliferation and extracellular matrix remodeling, agrees with the clinical behavior of the disease. Moreover, the expressions of bacterial‐ and virus‐related genes in our CD‐patient tissues support the concept that microbial agents are important in the etiopathogenesis of CD.
Keywords: Crohn's disease, gene expression profiling, microbiology, pediatric, virology
Introduction
Crohn's disease (CD) is a chronic inflammatory disorder of the bowel. The cause of CD is unclear and a complex interplay between genetic, environmental and immune components has been implicated. 1 The prevailing hypothesis for the pathogenesis of CD is that an aberrant immune response, generated against microbial agents in genetically susceptible hosts, results in chronic intestinal inflammation. Thus far, 71 genes have been implicated in CD based on genome‐wide association studies, and include genes involved in autophagy, maintenance of mucosal barrier integrity and immune regulation. 2 , 3 The NOD2/CARD15 on chromosome 16 was the first locus implicated, mutations of which are thought to affect bacterial recognition. 4 Subsequently, four genes, IL10RA, IL10RB, PSMG1 and TNFRSF6B, have been linked to pediatric CD. 5 , 6 The polygenic nature of CD suggests that direct targeting of individual disease susceptibility genes is unlikely to be therapeutically effective. Key molecules in pathophysiology, downstream of regulatory events induced by different causative factors are more likely targets for therapeutic interventions.
Insights into key gene‐environmental interactions relevant to disease pathogenesis could help identify causative stimuli (e.g. infectious agents) based on molecular signatures of the host response. 7 To date, microarray studies carried out on intestinal tissue of CD patients have identified several molecular biomarkers relating to inflammation, abnormal immunoregulation and cell biology, metabolism, signaling, transcription, electrolyte transport and extracellular matrix structure. 8 , 9 , 10 , 11 , 12 , 13 , 14
The suppressive subtractive hybridization (SSH) technique provides a complementary, non‐biased approach to the identification of new genes or pathogens associated with CD. In SSH, suppression PCR normalizes the representation of rare and abundant cDNA within the target population, and the subtraction step removes common nucleic acid sequences between the target specimen and its matched control. This results in an enriched pool of sequences specific to the target population. 15 The advantage of this approach is that no assumed knowledge of gene identity is required, as it does not rely on a defined set of gene library or conserved sequence signatures as probes for gene identification. 7 Hence SSH complements microarray studies by identifying potentially important genes that may not be represented on the array platforms utilized by inflammatory bowel disease (IBD) microarray studies. SSH has been successfully used in the discovery of novel viruses, and the transcriptome profiling of human hepatoma and bone regeneration. 16 , 17 , 18
In the present study, we used SSH to analyze the differential expression profile in ileal biopsies from children with CD compared with age‐ and sex‐matched non‐IBD control children. The purpose of this study was to examine the initial events occurring during CD pathogenesis.
Methods
Tissue selection. Ileal biopsy specimens (3–6 mm3) were obtained from patients (aged 4–16) with symptoms suggestive of IBD and undergoing initial diagnostic endoscopy at the Royal Children's Hospital, Melbourne, Australia. All tissue specimens were stored in RNAlater (Ambion, Melbourne, Australia) at −70°C until nucleic acid extraction. The diagnosis of CD was established using standard clinical endoscopic and histopathological criteria according to the Montreal classification. 19 Patients with esophagitis, mild non‐specific gastritis or no known pathological diagnosis were used as non‐IBD controls. None of the patients had received antibiotics or immunosuppressive drugs prior to endoscopy. Demographic and clinical details of patients assayed by suppressive subtractive hybridization and real‐time reverse transcription polymerase chain reaction (RT–PCR) are presented in 1, 2, respectively.
Table 1.
Demographics, clinical details and genotype of pediatric patients assayed by suppressive subtractive hybridization
| Patient | Sex | Age at | Montreal | Diagnosis | Endoscopic | NOD2 § | NOD2 § | NOD2 § | IL23 § | ATG16L1 § | TLR4 § |
|---|---|---|---|---|---|---|---|---|---|---|---|
| diagnosis | Class † | Presentation ‡ | (Leu1007FsinC) | (Arg702Trp) | (Gly908Arg) | (Arg381Gln) | (Thr300Ala) | (Asp299Gly) | |||
| CD‐SSH1 | F | 10.1 | A1/L2/B1 | CD | Uninflamed | DEL | CC | GG | GG | CT | GA |
| CD‐SSH2 | M | 14.5 | A1/L1+4/B1 | CD | Inflamed, uninflamed | DEL | CC | GG | GG | CC | AA |
| CD‐SSH3 | F | 12.8 | A1/L3+4/B1 | CD | Inflamed | C.DEL | CT | GG | GG | TT | AA |
| CD‐SSH4 | M | 13.3 | A1/L3/B1 | CD | Inflamed | DEL | CT | GG | GG | CT | AA |
| N‐SSH1 | F | 17 | – | Mild gastritis | Uninflamed | DEL | CT | GG | GG | TT | AA |
| N‐SSH2 | F | 10.9 | – | No pathological diagnosis | Uninflamed | DEL | CT | GG | GG | CT | AA |
| N‐SSH3 | M | 15.8 | – | No pathological diagnosis | Uninflamed | DEL | CC | GG | GG | TT | AA |
| N‐SSH4 | M | 10.7 | – | Esophagitis | Uninflamed | DEL | CC | GG | GG | CT | AA |
A1 age ≤ 16 years old; L1 ileal location, L2 colonic, L3 ileocolonic, L4 upper gastrointestinal, B1 non‐stricturing, non‐penetrating; P perianal disease modifier.
Endoscopic presentation of ileal region where biopsy is taken. Where two biopsies taken from separate ileal locations of a patient differ in presentation, both are described here.
Genotyping of patients based on single‐nucleotide polymorphism were performed for an earlier study. 20 Major alleles are DEL, C, G, G, C and A; for NOD2 Leu1007FsinC, Arg702Trp, Gly908Arg; IL23, ATG16L1 and TLR4 respectively.
CD, Crohn's disease; SSH, suppressive subtractive hybridization.
Table 2.
Demographics and clinical details for pediatric patients assayed by real‐time reverse transcription polymerase chain reaction
| Patient | Sex | Age at diagnosis (years) | Ileal biopsy endoscopic presentation † | Histology | Montreal class ‡ |
|---|---|---|---|---|---|
| CD | |||||
| CD1 | M | 14.6 | Unaffected | Extensive ulceration | L3 B1 |
| CD2 | F | 10.4 | Affected | Complete loss of villi, extensive neutrophil infiltration | L3 B1 P |
| CD3 | M | 14.7 | Affected | Occasional neutrophil infiltration | L3+4 B1 P |
| CD4 | M | 11 | Unaffected | Occasional neutrophil infiltration | NA |
| CD5 | M | 11.7 | Unaffected; Affected | Moderate neutrophil infiltration | L3 B1 P |
| CD6 | F | 8.3 | Unaffected; Affected | Ulceration and granulation | L3+4 B1 P |
| CD7 | M | 12 | Unaffected | Normal villous architecture | NA |
| CD8 | M | 9.6 | Affected | Neutrophilic infiltration, crypt abscesses | L3+4 B2 P |
| CD9 | M | 13.8 | Unaffected | Focal clusters of neutrophils, occasional granuloma | L3+4 B1 P |
| CD10 | M | 11.6 | Unaffected | Several granulomas | L3 B1 P |
| CD11 | F | 13.4 | Unaffected; Affected | Extensive ulceration | L3 B3 P |
| CD12 | F | 12.9 | Affected | Moderate eosinophilic infiltration | L3+4 B1 |
| CD13 | M | 12.8 | Affected | Extensive leukocyte infiltration, extensive ulceration | L3+4 B1 P |
| Non‐IBD | |||||
| N1 | F | 10.8 | Unaffected | Normal villous architecture | – |
| N2 | M | 12 | Unaffected | Normal villous architecture | – |
| N3 | M | 7.6 | Unaffected | Normal villous architecture | – |
| N4 | M | 13.8 | Unaffected | Normal villous architecture | – |
| N5 | F | 11.1 | Unaffected | Normal villous architecture | – |
| N6 | M | 13.5 | Unaffected | Normal villous architecture | – |
| N7 | M | 4.9 | Unaffected | Normal villous architecture | – |
| N8 | M | 13.7 | Unaffected | Normal villous architecture | – |
| N9 | F | 13.5 | Unaffected | Normal villous architecture | – |
Endoscopic presentation of ileal region where biopsy is taken. Where two biopsies taken from separate ileal locations of a patient differ in presentation, both are described here.
A1 age ≤ 16 years old; L1 ileal location, L2 colonic, L3 ileocolonic, L4 upper gastrointestinal, B1 non‐stricturing, non‐penetrating B2 stricturing, B3 penetrating; P perianal disease modifier.
CD, Crohn's disease; IBD, inflammatory bowel disease.
Sample preparation and RNA extraction. Each biopsy was mechanically homogenized, the supernatant harvested, and RNA extracted using the AllPrep DNA/RNA Mini Kit (Qiagen, Melbourne, Australia) according to the manufacturer's protocol. All extractions were conducted in a biological safety cabinet class II.
Suppressive subtractive hybridization. The CD‐specific subtractive library was constructed using the PCR‐Select cDNA Subtraction Kit according to the user manual provided (Clontech, Palo Alto, CA, USA). An overview of the SSH technique is described in Figure S1. Ileal RNA were obtained separately from four CD and four non‐IBD patients, then pooled into CD and non‐IBD groups for the SSH assay. The patient groups were matched based on sex, mean age and common genotypes associated with CD, to minimize heterogeneity.
Differential screening. The library of differentially expressed cDNA specific to the CD population was constructed using the TOPO TA cloning kit (Invitrogen, Melbourne, Australia). Five thousand randomly selected clones from the CD‐specific subtractive library were spotted onto Hybond nylon membrane (Amersham Biosciences, Sydney, Australia) in 384 × 3 by 2 arrays by the Australian Genome Research Facility (AGRF), Melbourne. CD‐specific sequences were detected by reverse hybridization with digoxigenin (DIG)‐labeled probes (Roche, Sydney, Australia) synthesized directly from cDNA of the CD and non‐IBD subtractive library, according to manufacturer's protocol (DIG applications manual for filter hybridization, Roche). Clones with greater than three times hybridization affinity to the CD‐library‐specific probes as compared to non‐IBD‐library‐specific probes were selected for sequencing.
Sequence identification and data analysis. Sanger sequencing of differentially expressed clones was performed using an ABI 3730 DNA analyzer (Applied Biosystems, Melbourne, Australia) at the AGRF, Melbourne. The ChromasPro software (Technelysium, Brisbane, Australia) was used to remove adaptor and vector sequences, and sequences were blasted against GenBank (http://www.ncbi.nlm.nih.gov/BLAST). Annotated sequences were submitted to SOURCE (http://smd.stanford.edu/cgi-bin/source/sourceBatchSearch), where all gene symbols and chromosome locations were obtained. 21 Functional assignment was determined using the University of California, Santa Cruz (UCSC) genome browser and National Center for Biotechnology Information (NCBI) Entrez Gene database. 22 Ingenuity Systems' IPA software (Ingenuity Systems Inc., http://www.ingenuity.com) was used to group the differentially expressed genes into biologically relevant networks.
Quantitative real‐time RT–PCR. Expression of selected human genes (REG1A, MMP2 and ANPEP) in ileal biopsy was analyzed using quantitative real‐time RT–PCR. Commercially available clones from OriGene (RPL32: SC119501, MMP2: SC321560, ANPEP: SC119422, REG1A: SC122637) were used for real‐time RT–PCR method establishment. First strand cDNA was synthesized using the Superscript III RT kit (Invitrogen) according to manufacturer's instructions. Oligonucleotide primers spanning two different exons of each target gene were selected based on published sequences or designed using Primer3 Output software to avoid amplifying genomic DNA. 23 The primers used are detailed in Table S1.
Quantification of cDNA by real‐time PCR was performed using the SYBR GreenER qPCR Super mix for ABI PRISM (Invitrogen), in accordance with manufacturer's instructions. Analysis of real‐time RT–PCR reactions and quantification of RNA was determined using the 7300 System Sequence Detection Software Version 1.4 (Applied Biosystems). Each sample was analyzed in triplicate. Gene expression levels for individual patient samples were normalized relative to the expression of ribosomal protein L32 (RPL32) housekeeping gene. Calculations were based on the Pfaffl method, a mathematical method based on the real‐time PCR efficiencies. 24 The OriGene clone cDNA (125 fg) of each gene was used as the calibrator in every assay to allow for direct comparison of gene expression for all samples analyzed across multiple assays.
Statistical analysis. The Mann–Whitney U‐test was used to compare the difference in median values between gene expression in CD and non‐IBD patient samples. A P‐value of less than 0.05 was considered statistically significant. All statistical tests were performed using SigmaStat, version 3.5 (SyStat Software Inc., San Jose, CA, USA).
Ethical considerations. This study received ethics approval from the Human Ethics Committee of the Royal Children's Hospital (EHRC no. 23003). Written and informed consent was obtained from each individual, parent or guardian prior to enrolment in the study.
Results
Functional classification of differentially expressed genes specific to Crohn's disease ileum. Sequence analysis of 1000 differentially expressed clones from the CD subtraction library identified 863 clones with high homology to GenBank sequences. These included 430 clones, which had matches to human mRNA sequences representing 75 annotated genes. The remaining clones had sequence similarity to mitochondrial and ribosomal genes, hypothetical proteins, expressed sequence tag (EST), human chromosomes, bacterial and animal genes.
The 75 annotated genes were assigned to eight functional clusters based on information obtained from the UCSC genome browser and NCBI Entrez Gene database. The map location, gene function and frequency of SSH clone representation for each gene is listed in Table S2. We noted an enrichment of immune function genes and inflammatory mediators (Cluster I and II); extracellular matrix, remodeling, and ion transport coding genes (Cluster III); metabolic enzymes and signal transducers (Cluster IV); genes involved in cell‐cycle regulation (Cluster V); cancer‐related genes (Cluster VI); transcription factors and post‐transcription modifiers (Cluster VI) and genes with unknown function (Clusters VIII).
Real‐time RT–PCR confirmation of SSH results. To assess the quality of the SSH data, genes representing different clone abundance levels were selected for real‐time RT–PCR quantification on ileal biopsies. Three genes were selected based on their representation of the SSH detection frequency range (high: > 50; moderate: 10–50; low: < 10), and also on potential functional interest with respect to CD pathogenesis. REG1A (55 clones) was selected based on its cell proliferative function and earlier reports of upregulation in colonic tissue of adult CD patients. 11 , 12 MMP2 (12 clones) is involved in wound healing and has been proposed to have a protective role in colitis by regulating barrier function and vascularisation. 25 ANPEP (2 clones) has previously been reported to be a receptor for coronavirus. 26
Real‐time RT–PCR analysis of the three genes was conducted on ileum‐derived RNA from 13 CD and nine non‐IBD patients, in triplicate. For CD patients CD5, CD6 and CD11, biopsies taken from both endoscopically affected and unaffected ileal locations were used in the analysis. Individual gene expression levels for each sample were represented as fold change ratios relative to the expression of positive controls (OriGene clones for MMP2, ANPEP and REG1A). The individual expression levels (fold change value) of each gene for the biopsy samples of the 13 CD and nine non‐IBD patients are depicted in Figure 1.
Figure 1.
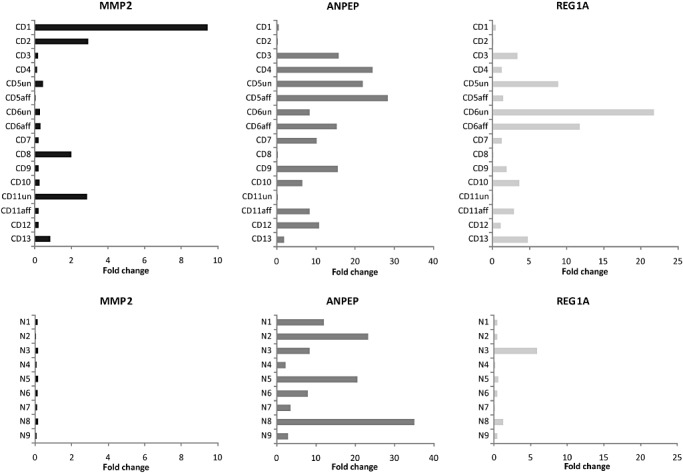
The relative expression levels of REG1A, MMP2 and ANPEP in ileal biopsies from 13 Crohn's disease (CD) and nine non‐inflammatory bowel disease (IBD) patients. The relative expression ratio of each gene was calculated based on real‐time reverse transcription polymerase chain reaction (RT–PCR) efficiency and the crossing point deviation of the target patient sample versus the internal RPL32 control, according to Pfaffl. 24
Using the Mann–Whitney statistical test for non‐parametric and unpaired populations, the transcript expression levels of MMP2 were found to be significantly higher in CD ileal biopsies as compared to non‐IBD ileal biopsies (P = 0.001). The CD population had a trend towards a higher level of REG1A transcript expression, although the difference was not statistically significant (P = 0.063). There was no significant difference in ANPEP transcript expression between CD and non‐IBD patient samples (P = 0.305). The real‐time RT–PCR results validated that genes represented by > 10 clones enriched by subtractive hybridization were expressed in higher abundance in CD as compared with non‐IBD ileal biopsies.
REG1A, MMP2 and ANPEP expression. Analysis of REG1A, MMP2 and ANPEP gene expression across the CD patient samples revealed interesting patterns of expression. Using a fold change ratio of 1 as reference, four CD ileum samples (CD1, CD2, CD8, CD11un) with high levels of MMP2 expression, had low or negligible REG1A and ANPEP expression (Fig. 1). This inverse pattern of expression was also observed in the CD ileum samples where MMP2 gene expression was high.
Comparison of the CD expression profile represented in the SSH library with published microarray data. To contextualize our SSH findings, we compared our results with the data tables from seven microarray studies published previously, that had reported differential expression of genes between inflamed biopsies of CD and non‐inflamed biopsies of non‐IBD controls. 8 , 9 , 10 , 11 , 12 , 13 , 14 Of the 75 annotated genes, 28 genes have been previously analyzed by microarray (Table 3). The genes were either reported to be upregulated (n = 16), downregulated (n = 10) or variable (n = 2) depending on biopsy site assayed. There were 47 genes identified in this study that have not been previously described in the context of IBD investigations.
Table 3.
Genes identified by SSH in this study that have previously been associations with CD
| Genes symbol | Study reference | Tissue site | Gene expression in CD | SSH clone abundance |
|---|---|---|---|---|
| REG1A | 10, 11, 12 | Colon | Upregulated | 55 |
| 13 | TI | Downregulated | ||
| CEACAM5 | 13 | TI | Upregulated | 17 |
| CD74 | 8 | Colon | Upregulated | 12 |
| MMP2 | 9 | Sigmoid colon | Upregulated | 12 |
| IGHG1 | 9 | Sigmoid colon | Upregulated | 11 |
| PSME2 | 14 | Colon | Upregulated | 9 |
| IGL@ | 11 | Colon | Upregulated | 9 |
| REG1B | 12 | Colon | Upregulated | 7 |
| LGALS4 | 11 | Colon | Upregulated | 5 |
| OLFM4 | 13 | All intestinal sites | Upregulated | 5 |
| SERPINA1 | 8 | Colon | Upregulated | 4 |
| GBP1 | 13 | All intestinal sites | Upregulated | 4 |
| APOB | 13 | All intestinal sites | Upregulated | 4 |
| TI | Downregulated | |||
| CEACAM6 | 13 | TI | Upregulated | 3 |
| CANX | 11 | Colon | Upregulated | 2 |
| ALDOB | 10 | Intestinal mucosa | Upregulated | 2 |
| HLA‐DRA | 8 | Colon | Upregulated | 1 |
| DMBT1 | 10, 13 | All intestinal sites | Upregulated | 1 |
| SRGN | 12 | Colon | Upregulated | 1 |
| EIF4EBP2 | 13 | TI | Downregulated | 5 |
| SLC5A1 | 13 | TI | Downregulated | 4 |
| TGOLN2 | 13 | TI | Downregulated | 3 |
| ANPEP | 8, 12 | Colon | Downregulated | 2 |
| UGT2B17 | 13 | TI | Downregulated | 2 |
| HIST1H1B | 13 | All intestinal sites | Downregulated | 1 |
| TTRAP | 13 | TI | Downregulated | 1 |
| LAPTM5 | 13 | TI | Downregulated | 1 |
| GDA | 13 | TI | Downregulated | 1 |
CD, Crohn's disease; SSH, suppressive subtractive hybridization; TI, terminal ileum.
Gene networks. To identify biological and functional networks based on potential gene interactions among the 75 SSH enriched genes, we utilized the “Core” program of the Ingenuity Pathway Analysis Software. The majority of the 75 genes were classified into six networks comprising the following functions: (i) antigen presentation, inflammatory response, cancer; (ii) cancer, cell cycle, cellular compromise; (iii) connective tissue development and function, tissue morphology, developmental disorder; (iv) infection mechanism, genetic disorder, nutritional disease; (v) cell signaling, cellular assembly and organization, cellular function and maintenance; and (vi) amino acid metabolism, molecular transport, small molecule biochemistry (Table 4).
Table 4.
Gene networks represented by suppressive‐subtractive‐hybridization‐enriched genes
| Gene network | Top functions | Genes involved | Number of genes |
|---|---|---|---|
| 1 | Antigen presentation, inflammatory response, cancer | ANPEP, APOB, CANX, CD74, CEACAM5, CEACAM6, CTSS, DDC, DMBT1, GBP1, HLA‐DRA, IGHG1, ITGB1, LGALS4, MMP2, OLFM4, PARP9, PSME2, PTMA, SERPINA1, SLC5A1, TGOLN2, UGT2B17 | 23 |
| 2 | Cancer, cell cycle, cellular compromise | C12ORF35, DOCK9, EVL, GBP3, HIST1H1B, LAPTM5, LPHN1, MACF1, MAN1A1, MARK3, OTUD4, PABPC1, PRKCSH, SRGN, TUBA1B | 15 |
| 3 | Connective tissue development and function, tissue morphology, developmental disorder | ALDOB, APH1A, CAP1, EIF4EBP2, GUF1, HNF4G, RBM17, REG1A, REG1B, SF3B1, STOM, TTRAP, TMEM66, XRN1 | 14 |
| 4 | Infection mechanism, genetic disorder, nutritional disease | APPBP2, CLCA1, CRIM1, HSD11B2, IGL@, NACA, PLS1, SCP2, SLC26A3 | 9 |
| 5 | Cell signaling, cellular assembly and organization, cellular function and maintenance | DNAJC5, EEF1A1, GDA, NRF1, PLCB3, PRKAA1, PSAP, VAV2 | 8 |
| 6 | Amino acid metabolism, molecular transport, small molecule biochemistry | SLC17A7 | 1 |
Network 1 contained the highest number of SSH genes. Interestingly, 18/23 genes in this network have been previously reported in microarray studies. The five newly identified genes within this network are cathepsin (CTSS), DOPA decarboxylase (DDC), integrin beta 1 (ITGB1), poly ADP‐ribose polymerase (PARP9) and prothymosin alpha (PTMA). Figure 2 depicts a schematic representation of this gene network. CTSS and ITGB1 appear to be involved in multiple pathways, including several direct and indirect associations with the previously reported genes.
Figure 2.
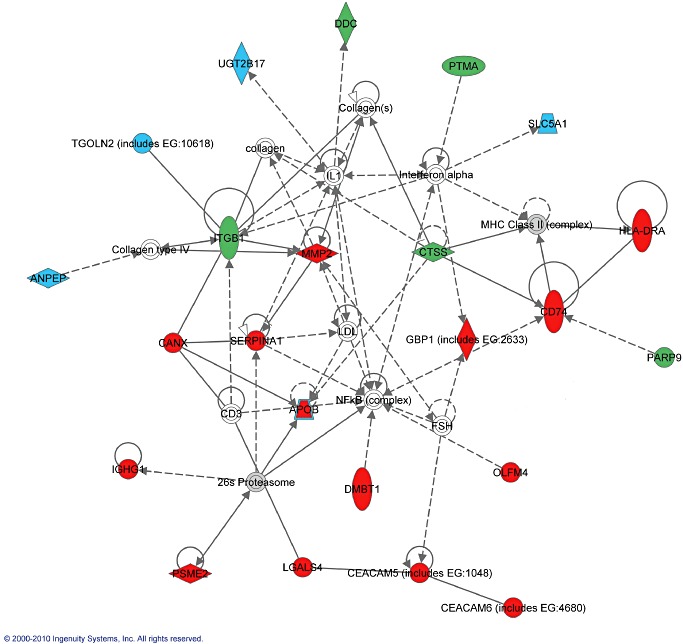
Gene network containing antigen presentation, inflammatory response and cancer as top functions. Genes enriched by suppressive subtractive hybridization (SSH) are highlighted in red, blue and green, while the other molecules serve as intermediates in the gene interactome. Genes previously reported as upregulated (red) in Crohn's disease (CD) population are closely associated with inflammatory proteins, such as major histocompatibility complex (MHC) class II complex, NF‐κB complex and 26S proteasome. Genes previously reported as downregulated (blue) in CD population are either indirectly activated by interferon‐α and interleukin (IL)‐1, or indirectly associated with ITGB1. Of the new genes identified (highlighted green), CTSS and ITGB1 appear to be involved in multiple pathways within the inflammatory network. The different interactions include direct (solid lines) or indirect (dashed lines) interactions; binding (straight line), activation (arrow), inhibition (truncated line) or either activation or inhibition (truncated line with arrow).
Genes associated with microbial pathogenesis. To elucidate evidence for microbial pathogenesis, the 75 functionally annotated genes were individually searched against the NCBI Entrez Gene database for reported functional associations with viral or bacterial infections. A total of 29 genes associated with microbial pathogenesis were identified (Table 5).
Table 5.
Differentially expressed genes associated with microbial pathogenesis
| Gene symbol | Gene name | Function |
|---|---|---|
| ANPEP | Alanyl (membrane) aminopeptidase | Receptor for human coronavirus 229E 27 |
| CEACAM6 | Carcinoembryonic antigen‐related cell adhesion molecule 6 (non‐specific cross reacting antigen) | Receptor for adherent invasive Escherichia coli, abnormally expressed by ileal epithelial cells in Crohn's disease patients 28 |
| ITGB1 | Integrin beta 1 | Receptor for Kaposi sarcoma herpesvirus KSHV.HHV8, and Helicobacter pylori, promotes infection by human metapneumovirus 29 |
| CD74 | CD74 molecule, major histocompatibility complex, class II invariant chain | CD74 receptor facilitates the adhesion of H. pylori to gastric epithelial cells 30 |
| TTRAP | TRAF and TNF receptor associated protein | Facilitates lentiviral integration 31 |
| DMBT1 | Deleted in malignant brain tumors 1 | Facilitator of HIV‐1 transcytosis, broad bacterial‐binding specificity (LRR) inhibits LPS‐induced TLR4‐mediated NF‐kappaB activation 32 |
| TUBA1B | Tubulin, alpha 1b | HIV‐1 binding to CD4 permissible cells induce acetylation of tubulin, facilitating HIV cell fusion, involved in EPEC and EHEC infection 33 |
| CTSS | Cathepsin S | Mammalian reoviruses utilize CTSS for disassembly of the virus outer capsid and activation of the membrane penetration machinery 34 |
| NRF1 | Nuclear respiratory factor 1 | Human T lymphotropic virus type 1 transactivates the promoter for T cell tropic HIV‐1 through association with NRF 35 |
| MAN1A1 | Mannosidase, alpha, class 1A, member 1 | Processing of gp160 of HIV 36 |
| EEF1A1 | Eukaryotic translation elongation factor 1 alpha 1 | Interacts with hepatitis deltavirus RNA and HIV gag protein, possibly permitting packaging of viral RNA into virion 37 |
| TGOLN2 | Trans‐golgi network protein 2 | Involved in the final envelopment of herpesviruses 38 |
| CANX | Calnexin | Interacts with measles virus protein F and hemagglutinin 39 |
| MMP2 | Matrix metallopeptidase 2 (gelatinase A, 72 kDa gelatinase, 72 kDa type IV collagenase) | HIV‐1 induces MMP2 expression in astrocytes 40 |
| SERPINA1 | Serpin peptidase inhibitor, clade A (alpha‐1 antiproteinase, antitrypsin), member 1 | Specifically induced in Helicobacter pylori infection, inhibitor of HIV replication 41 |
| OTUD4 | OTU domain containing 4 | Expressed only in HIV‐1 infected cell 42 |
| MACF1 | Microtubule‐actin cross‐linking factor 1 | Parvovirus infection induces the upregulation of MACF1 43 |
| PLS1 | Plastin 1 (I isoform) | PLS1 is upregulated in HIV‐1‐infected human monocyte‐derived macrophages 44 |
| MUC17 | Mucin 17 | MUC17 is upregulated upon infection by atypical enteropathogenic Escherichia coli 45 |
| CLCA1 | Chloride channel accessory 1 | CLCA1 plays a role in bacterial‐induced mucus hypersecretion 46 |
| EIF4EBP2 | Eukaryotic translation initiation factor 4E binding protein 2 | Adenovirus infection inactivates translational inhibitors 4E‐BP1 and 4E‐BP2 47 |
| SLC5A1 | Solute carrier family 5 (sodium/glucose cotransporter), member 1 | HIV Tat induces SGLT1 mis‐sorting and impairs intestinal glucose absorption 48 |
| PABPC1 | Poly(A) binding protein, cytoplasmic 1 | Rotavirus nsp3 expression directs PABC1 from cytoplasm to nucleus, in poliovirus, cleavage of PABP contributes to viral translation shutoff that is required for the switch from translation to RNA replication 49 |
| SF3B1 | Splicing factor 3b, subunit 1, 155 kDa | Vpr, the viral protein R of HIV‐1, induces G(2) cell cycle arrest and apoptosis in mammalian cells via binding to a subunit of multimeric SF3B 50 |
| PSME2 | Proteasome (prosome, macropain) activator subunit 2 (PA28 beta) | Upregulates presentation of viral MHC 1 51 |
| PTMA | Prothymosin, alpha | Inhibitor of HIV‐1 expression 52 |
| HLA‐DRA | Major histocompatibility complex, class II, DR alpha | Particular HLA class II region haplotypes affect the probability that an HBV infection will become persistent 53 |
| LRRC25 | Leucine rich repeat containing 25 | Contains motifs involved in bacterial LPS recognition |
| XRN1 | 5′‐3′ exoribonuclease 1 | XRN1 possess strong anti‐RNA virus activity by degrading uncapped RNA 54 |
EHEC, enterohaemorrhagic Escherichia coli; EPEC, enteropathogenic Esherichia coli; HBV, hepatitis B virus; LPS, lipopolysaccharide; LRR, leucine rich region; MHC, major histocompatibility complex; NRF, nuclear respiratory factors; OUT, operational taxonomic unit; PABP, poly A binding protein; TNF, tumor necrosis factor; TRAF, tumour necrosis factor receptor—associated factor 1.
Discussion
The pathogenesis of CD is thought to involve a complex interplay between the microbiome, the environment and multiple genetic factors. To gain further insights into the gene regulation processes involved, several gene array analyses have been performed using surgical resections or endoscopic biopsies of the colon obtained during treatment of adults with known IBD. 8 , 9 , 10 , 11 , 12 , 14 However, the chronicity of the disease process and variability of treatments used are likely to have influenced gene expression profiles in these patients. Our study used tissue obtained at initial diagnosis in treatment‐naive children with early onset disease. To date, there have been very few studies of events at the genetic level during early disease onset in children. A recent study examining the genome‐wide expression profile of pediatric IBD patients was conducted using colonic tissue. 8
Our study extends these initial gene expression profile studies by comparing ileal biopsies from a pediatric cohort of CD and non‐IBD patients. SSH analysis led to the identification of 75 functionally annotated genes, specific to the CD cohort. Comparison of our SSH data with existing microarray studies revealed that 47 of these genes are novel and 28 genes have been previously identified by microarray to be either upregulated or downregulated in the CD population.
Gene networks. The antigen presentation, inflammatory response and cancer gene network (Network 1) comprise one‐third of the genes identified by SSH, with a high proportion of genes previously identified to be differentially expressed in CD. This is partially attributable to acute inflammation of the biopsies of CD patients as compared with the non‐inflamed biopsies of non‐IBD controls. Differences in gene expression profiles between inflamed and non‐inflamed CD terminal ileum have been recently described. 13 Relative to non‐IBD controls, the gene expressions of IL‐8 and SAA1 were reportedly much higher in inflamed CD terminal ileum as compared to non‐inflamed CD terminal ileum. 13
New genes identified within this network include CTSS, DDC, ITGB1, PARP9 and PTMA. Based on the molecular interactions depicted in this network, CTSS and ITGB1 appear to be involved in multiple pathways associated with inflammatory complexes (major histocompatibility complex [MHC] class II complex and NF‐κB complex), and with other genes previously reported as upregulated in CD population. CTSS is mainly expressed in antigen‐presenting cells and is required for the degradation of MHC‐class‐II‐associated invariant chains, necessary for proper MHC class II antigen presentation. 55 , 56 Integrins, which include ITGB1, are membrane receptors involved in cell adhesion and several processes, including immune response. ITGB1 is expressed during hypoxic conditions, and can serve as an indicator of intestinal wound repair, which occurs only in a hypoxic environment. 57
REG1A and MMP2 expression. The REG1A gene is involved in regulation of cell proliferation, and has been proposed to function as a mitogenic and/or an anti‐apoptotic factor in ulcerative colitis (UC)‐colitic cancer progression. 58 Its high expression levels have been correlated with the severity of intestinal inflammation in patients with UC, and microarray studies have reported its upregulation in the colon of adult IBD patients. 9 , 10 , 12 Similarly, we identified an upregulation of REG1A in the terminal ileum of pediatric CD patients. This was however contrary to a recent study comparing the expression of REG1A in the terminal ileum of adult CD and non‐IBD controls, which reported a downregulation in REG1A expression. 13 The difference in REG1A expression could indicate a distinction between the pathogenesis of early onset CD and adult‐onset CD. Based on the knowledge that REG1A gene expression is associated with cancer development, 59 the high level of REG1A expression in the terminal ileum of some CD pediatric patients could indicate an increased risk for colorectal cancer development. Individuals with early onset CD have been previously described to have an increased risk of developing colorectal cancer. 60
The increased levels of MMP2 observed in CD ileum are consistent with previous studies conducted on colonic tissue where MMP2 is highly expressed in the intestinal epithelia during IBD. 61 , 62 Other studies have suggested the involvement of MMP2 in the regulation of epithelial barrier function. 25 Since epithelial barrier dysfunction plays a central role in the pathogenesis of intestinal inflammation, the increased expression of MMP2 may serve as a response to counteract tissue damage, hence protecting against colitis. 63
The fluctuation in REG1A and MMP2 gene expression between ileal biopsies of different patients and also between biopsies taken at different ileal locations of the same patient, suggest a spatial‐temporal nature of gene regulation during early CD pathogenesis. This finding is consistent with the clinical nature of CD, with its patchy distribution.
Microbial associations. Twenty‐nine of the 75 genes identified in this study have functional roles in the processes of bacterial or viral infection. Evidence of host response in facilitating viral infection is demonstrated by the enrichment of gene products involved in viral attachment (ANPEP, ITGB1), viral entry, vesicular trafficking and transcytosis of viral proteins (TUBA1B, DMBT1, CTSS); lentiviral integration (TTRAP); viral translation (PABPC1, EIF4EBP2) and replication (NRF1); virion glycoprotein processing (MAN1A1); packaging (TGOLN2, EEF1A1) and possibly release (CANX). Evidence of response to bacterial infection is reflected by the enrichment of receptors for adherent invasive Escherichia coli and Helicobacter pylori (CEACAM6, CD74). 28 , 30
The enrichment of MMP2, SERPINA1, OTUD4, MACF1, PLS1, MUC17 and CLCA1 transcripts suggests the presence of infectious agent(s) early in disease pathway as these genes have previously been reported to be upregulated during bacterial or viral infections. 40 , 41 , 42 , 43 , 44 , 45 , 46 The involvement of SLC5A1 and SF3B1 gene products in the impairment of intestinal glucose absorption and apoptosis due to HIV‐1‐induced glucose channel mis‐sorting and cell cycle arrest suggest the occurrence of viral activities in early CD pathogenesis. 48 , 50 The PSME2, PTMA, HLA‐DRA, LRRC25 and XRN1 genes or gene products have been previously reported to be associated with defense against viral and bacterial infections. 51 , 52 , 53 , 54 It is possible that these genes are differentially expressed in CD patients in response to infectious triggers.
Our study recognizes the limitation of the SSH technique whereby the CD subtraction library contained clones that are not differentially expressed, as shown by the ANPEP expression data. This limitation was also observed in previous studies. 15 Preliminary SSH data presented in this study were verified either by real‐time PCR quantification or comparison to microarray data from studies performed on individuals with and without IBD. Several of the genes anecdotally identified in the context of CD by our study have roles in microbial pathogenesis, promoting inflammation, epithelial remodeling, vesicular transport or cell differentiation and proliferation. These processes are relevant to CD pathogenesis, hence future investigations into the association between these novel gene candidates and CD could contribute to the understanding of the disease.
Supporting information
Figure S1 Suppressive subtractive hybridization method. Restriction endonuclease‐digested tester DNA was split into two pools and ligated with Adaptor 1 or Adaptor 2R. Two successive rounds of hybridization with excess restriction endonuclease‐digested driver DNA followed. Thereafter, single‐stranded components of the adaptors were filled in. Exponential amplification of tester‐specific sequences is used to enrich for potential differentially expressed genes. Type a molecules are significantly enriched, differentially expressed sequences, while cDNA that are not differentially expressed form type c molecules with the driver. The concentration of high‐ and low‐abundance sequences is equalized, whereby highly abundant molecules re‐anneal to form type b and d molecules. During the second hybridization, remaining equalized and subtracted single‐stranded tester cDNA reassociate to form type e hybrids, with different ends corresponding to sequences of Adaptor 1 and Adaptor 2R (adapted from Clontech PCR‐Select cDNA subtraction kit user manual [BD Biosciences]).
Table S1 Primers used for real‐time reverse transcription polymerase chain reaction quantification of ANPEP, REG1A, MMP2 and RPL32
Table S2 Differentially expressed genes specific to Crohn’s Disease (CD) ileum. Genes within each functional category are listed in order of clone abundance
Supporting info item
Supporting info item
Acknowledgments
We would like to thank the children and families for their participation in this study. This project was supported by research grants from the Murdoch Children's Research Institute, The CASS Foundation, The Lynne Quayle Charitable Trust, Equity Trustees Ltd, GlaxoSmithKline Australia, the Victorian Government's Operational Infrastructure Support Program, and by a National Health and Medical Research Council (NHMRC) research grant. Dr Kirkwood is supported by an NHMRC RD Wright Research Fellowship (607347).
References
- 1. Sartor RB. Mechanisms of disease: pathogenesis of Crohn's disease and ulcerative colitis. Nat. Clin. Pract. Gastroenterol. Hepatol. 2006; 3: 390–407. [DOI] [PubMed] [Google Scholar]
- 2. Franke A, McGovern DP, Barrett JC et al Genome‐wide meta‐analysis increases to 71 the number of confirmed Crohn's disease susceptibility loci. Nat. Genet. 2010; 42: 1118–25. [DOI] [PMC free article] [PubMed] [Google Scholar]
- 3. Van Limbergen J, Wilson DC, Satsangi J. The genetics of Crohn's disease. Annu. Rev. Genomics Hum. Genet. 2009; 10: 89–116. [DOI] [PubMed] [Google Scholar]
- 4. Hugot JP, Laurent‐Puig P, Gower‐Rousseau C et al Mapping of a susceptibility locus for Crohn's disease on chromosome 16. Nature 1996; 379: 821–3. [DOI] [PubMed] [Google Scholar]
- 5. Kugathasan S, Baldassano RN, Bradfield JP et al Loci on 20q13 and 21q22 are associated with pediatric‐onset inflammatory bowel disease. Nat. Genet. 2008; 40: 1211–15. [DOI] [PMC free article] [PubMed] [Google Scholar]
- 6. Glocker EO, Kotlarz D, Boztug K et al Inflammatory bowel disease and mutations affecting the interleukin‐10 receptor. N. Engl. J. Med. 2009; 361: 2033–45. [DOI] [PMC free article] [PubMed] [Google Scholar]
- 7. Relman DA. New technologies, human‐microbe interactions, and the search for previously unrecognized pathogens. J. Infect. Dis. 2002; 186 (Suppl. 2): S254–8. [DOI] [PubMed] [Google Scholar]
- 8. Carey R, Jurickova I, Ballard E et al Activation of an IL‐6:STAT3‐dependent transcriptome in pediatric‐onset inflammatory bowel disease. Inflamm. Bowel Dis. 2008; 14: 446–57. [DOI] [PMC free article] [PubMed] [Google Scholar]
- 9. Costello CM, Mah N, Hasler R et al Dissection of the inflammatory bowel disease transcriptome using genome‐wide cDNA microarrays. PLoS Med. 2005; 2: e199. [DOI] [PMC free article] [PubMed] [Google Scholar]
- 10. Dieckgraefe BK, Stenson WF, Korzenik JR, Swanson PE, Harrington CA. Analysis of mucosal gene expression in inflammatory bowel disease by parallel oligonucleotide arrays. Physiol. Genomics 2000; 4: 1–11. [DOI] [PubMed] [Google Scholar]
- 11. Dooley TP, Curto EV, Reddy SP et al Regulation of gene expression in inflammatory bowel disease and correlation with IBD drugs: screening by DNA microarrays. Inflamm. Bowel Dis. 2004; 10: 1–14. [DOI] [PubMed] [Google Scholar]
- 12. Lawrance IC, Fiocchi C, Chakravarti S. Ulcerative colitis and Crohn's disease: distinctive gene expression profiles and novel susceptibility candidate genes. Hum. Mol. Genet. 2001; 10: 445–56. [DOI] [PubMed] [Google Scholar]
- 13. Noble CL, Abbas AR, Lees CW et al Characterization of intestinal gene expression profiles in Crohn's disease by genome‐wide microarray analysis. Inflamm. Bowel Dis. 2010; 16: 1717–28. [DOI] [PubMed] [Google Scholar]
- 14. Wu F, Dassopoulos T, Cope L et al Genome‐wide gene expression differences in Crohn's disease and ulcerative colitis from endoscopic pinch biopsies: insights into distinctive pathogenesis. Inflamm. Bowel Dis. 2007; 13: 807–21. [DOI] [PubMed] [Google Scholar]
- 15. Diatchenko L, Lau YF, Campbell AP et al Suppression subtractive hybridization: a method for generating differentially regulated or tissue‐specific cDNA probes and libraries. Proc. Natl Acad. Sci. U.S.A. 1996; 93: 6025–30. [DOI] [PMC free article] [PubMed] [Google Scholar]
- 16. Chang Y, Cesarman E, Pessin MS et al Identification of herpesvirus‐like DNA sequences in AIDS‐associated Kaposi's sarcoma. Science 1994; 266: 1865–9. [DOI] [PubMed] [Google Scholar]
- 17. Hadjiargyrou M, Lombardo F, Zhao S et al Transcriptional profiling of bone regeneration. Insight into the molecular complexity of wound repair. J. Biol. Chem. 2002; 277: 30177–82. [DOI] [PubMed] [Google Scholar]
- 18. Pan YS, Lee YS, Lee YL, Lee WC, Hsieh SY. Differentially profiling the low‐expression transcriptomes of human hepatoma using a novel SSH/microarray approach. BMC Genomics 2006; 7: 131; doi: 10.1186/1471‐2164‐7‐131. [DOI] [PMC free article] [PubMed] [Google Scholar]
- 19. Silverberg MS, Satsangi J, Ahmad T et al Toward an integrated clinical, molecular and serological classification of inflammatory bowel disease: report of a Working Party of the 2005 Montreal World Congress of Gastroenterology. Can. J. Gastroenterol. 2005; 19 (Suppl. A): 5–36. [DOI] [PubMed] [Google Scholar]
- 20. Wagner J, Sim WH, Ellis JA et al Interaction of Crohn's disease susceptibility genes in an Australian paediatric cohort. PLoS ONE 2010; 5: e15376. [DOI] [PMC free article] [PubMed] [Google Scholar]
- 21. Diehn M, Sherlock G, Binkley G et al SOURCE: a unified genomic resource of functional annotations, ontologies, and gene expression data. Nucleic Acids Res. 2003; 31: 219–23. [DOI] [PMC free article] [PubMed] [Google Scholar]
- 22. Rhead B, Karolchik D, Kuhn RM et al The UCSC genome browser database: update 2010. Nucleic Acids Res. 2010; 38: D613–19. [DOI] [PMC free article] [PubMed] [Google Scholar]
- 23. Rozen S, Skaletsky H. Primer3 on the WWW for general users and for biologist programmers. Methods Mol. Biol. 2000; 132: 365–86. [DOI] [PubMed] [Google Scholar]
- 24. Pfaffl MW. A new mathematical model for relative quantification in real‐time RT‐PCR. Nucleic Acids Res. 2001; 29: e45. [DOI] [PMC free article] [PubMed] [Google Scholar]
- 25. Garg P, Rojas M, Ravi A et al Selective ablation of matrix metalloproteinase‐2 exacerbates experimental colitis: contrasting role of gelatinases in the pathogenesis of colitis. J. Immunol. 2006; 177: 4103–12. [DOI] [PubMed] [Google Scholar]
- 26. Delmas B, Gelfi J, L'Haridon R et al Aminopeptidase N is a major receptor for the entero‐pathogenic coronavirus TGEV. Nature 1992; 357: 417–20. [DOI] [PMC free article] [PubMed] [Google Scholar]
- 27. Breslin JJ, Mork I, Smith MK et al Human coronavirus 229E: receptor binding domain and neutralization by soluble receptor at 37 degrees C. J. Virol. 2003; 77: 4435–8. [DOI] [PMC free article] [PubMed] [Google Scholar]
- 28. Barnich N, Carvalho FA, Glasser AL et al CEACAM6 acts as a receptor for adherent‐invasive E. coli, supporting ileal mucosa colonization in Crohn disease. J. Clin. Invest. 2007; 117: 1566–74. [DOI] [PMC free article] [PubMed] [Google Scholar]
- 29. Akula SM, Pramod NP, Wang FZ, Chandran B. Integrin alpha3beta1 (CD 49c/29) is a cellular receptor for Kaposi's sarcoma‐associated herpesvirus (KSHV/HHV‐8) entry into the target cells. Cell 2002; 108: 407–19. [DOI] [PubMed] [Google Scholar]
- 30. Beswick EJ, Bland DA, Suarez G, Barrera CA, Fan X, Reyes VE. Helicobacter pylori binds to CD74 on gastric epithelial cells and stimulates interleukin‐8 production. Infect. Immun. 2005; 73: 2736–43. [DOI] [PMC free article] [PubMed] [Google Scholar]
- 31. Zhang JQ, Wang JJ, Li WJ et al Cellular protein TTRAP interacts with HIV‐1 integrase to facilitate viral integration. Biochem. Biophys. Res. Commun. 2009; 387: 256–60. [DOI] [PubMed] [Google Scholar]
- 32. Stoddard E, Ni H, Cannon G et al gp340 promotes transcytosis of human immunodeficiency virus type 1 in genital tract‐derived cell lines and primary endocervical tissue. J. Virol. 2009; 83: 8596–603. [DOI] [PMC free article] [PubMed] [Google Scholar]
- 33. Xu Y, Kulkosky J, Acheampong E, Nunnari G, Sullivan J, Pomerantz RJ. HIV‐1‐mediated apoptosis of neuronal cells: proximal molecular mechanisms of HIV‐1‐induced encephalopathy. Proc. Natl. Acad. Sci. U.S.A. 2004; 101: 7070–5. [DOI] [PMC free article] [PubMed] [Google Scholar]
- 34. Johnson EM, Doyle JD, Wetzel JD et al Genetic and pharmacologic alteration of cathepsin expression influences reovirus pathogenesis. J. Virol. 2009; 83: 9630–40. [DOI] [PMC free article] [PubMed] [Google Scholar]
- 35. Moriuchi M, Moriuchi H, Fauci AS. HTLV type I Tax activation of the CXCR4 promoter by association with nuclear respiratory factor 1. AIDS Res. Hum. Retroviruses 1999; 15: 821–7. [DOI] [PubMed] [Google Scholar]
- 36. Knas M, Choromanska M, Karaszewska K et al Activity of lysosomal exoglycosidases in saliva of patients with HIV infection. Adv. Med. Sci. 2007; 52: 186–90. [PubMed] [Google Scholar]
- 37. Sikora D, Greco‐Stewart VS, Miron P, Pelchat M. The hepatitis delta virus RNA genome interacts with eEF1A1, p54(nrb), hnRNP‐L, GAPDH and ASF/SF2. Virology 2009; 390: 71–8. [DOI] [PubMed] [Google Scholar]
- 38. Mori Y, Koike M, Moriishi E et al Human herpesvirus‐6 induces MVB formation, and virus egress occurs by an exosomal release pathway. Traffic 2008; 9: 1728–42. [DOI] [PMC free article] [PubMed] [Google Scholar]
- 39. Bolt G. The measles virus (MV) glycoproteins interact with cellular chaperones in the endoplasmic reticulum and MV infection upregulates chaperone expression. Arch. Virol. 2001; 146: 2055–68. [DOI] [PubMed] [Google Scholar]
- 40. Lopez‐Herrera A, Liu Y, Rugeles MT, He JJ. HIV‐1 interaction with human mannose receptor (hMR) induces production of matrix metalloproteinase 2 (MMP‐2) through hMR‐mediated intracellular signaling in astrocytes. Biochim. Biophys. Acta 2005; 1741: 55–64. [DOI] [PubMed] [Google Scholar]
- 41. Wex T, Kuester D, Vieth M et al Helicobacter pylori infection and short‐term intake of low‐dose aspirin have different effects on alpha‐1 antitrypsin/alpha‐1 peptidase inhibitor (alpha1‐PI) levels in antral mucosa and peripheral blood. Scand. J. Gastroenterol. 2008; 43: 1194–201. [DOI] [PubMed] [Google Scholar]
- 42. Raineri I, Senn HP. HIV‐1 promotor insertion revealed by selective detection of chimeric provirus‐host gene transcripts. Nucleic Acids Res. 1992; 20: 6261–6. [DOI] [PMC free article] [PubMed] [Google Scholar]
- 43. Kerr JR, Kaushik N, Fear D, Baldwin DA, Nuwaysir EF, Adcock IM. Single‐nucleotide polymorphisms associated with symptomatic infection and differential human gene expression in healthy seropositive persons each implicate the cytoskeleton, integrin signaling, and oncosuppression in the pathogenesis of human parvovirus B19 infection. J. Infect. Dis. 2005; 192: 276–86. [DOI] [PubMed] [Google Scholar]
- 44. Ciborowski P, Kadiu I, Rozek W et al Investigating the human immunodeficiency virus type 1‐infected monocyte‐derived macrophage secretome. Virology 2007; 363: 198–209. [DOI] [PMC free article] [PubMed] [Google Scholar]
- 45. Vieira MA, Gomes TA, Ferreira AJ, Knobl T, Servin AL, Lievin‐Le Moal V. Two atypical enteropathogenic Escherichia coli strains induce the production of secreted and membrane‐bound mucins to benefit their own growth at the apical surface of human mucin‐secreting intestinal HT29‐MTX cells. Infect. Immun. 2010; 78: 927–38. [DOI] [PMC free article] [PubMed] [Google Scholar]
- 46. Hauber HP, Goldmann T, Vollmer E et al LPS‐induced mucin expression in human sinus mucosa can be attenuated by hCLCA inhibitors. J. Endotoxin Res. 2007; 13: 109–16. [DOI] [PubMed] [Google Scholar]
- 47. Gingras AC, Sonenberg N. Adenovirus infection inactivates the translational inhibitors 4E‐BP1 and 4E‐BP2. Virology 1997; 237: 182–6. [DOI] [PubMed] [Google Scholar]
- 48. Canani RB, De Marco G, Passariello A et al Inhibitory effect of HIV‐1 Tat protein on the sodium‐D‐glucose symporter of human intestinal epithelial cells. AIDS 2006; 20: 5–10. [DOI] [PubMed] [Google Scholar]
- 49. Bonderoff JM, Larey JL, Lloyd RE. Cleavage of poly(A)‐binding protein by poliovirus 3C proteinase inhibits viral internal ribosome entry site‐mediated translation. J. Virol. 2008; 82: 9389–99. [DOI] [PMC free article] [PubMed] [Google Scholar]
- 50. Terada Y, Yasuda Y. Human immunodeficiency virus type 1 Vpr induces G2 checkpoint activation by interacting with the splicing factor SAP145. Mol. Cell. Biol. 2006; 26: 8149–58. [DOI] [PMC free article] [PubMed] [Google Scholar]
- 51. Sijts A, Sun Y, Janek K et al The role of the proteasome activator PA28 in MHC class I antigen processing. Mol. Immunol. 2002; 39: 165–9. [DOI] [PubMed] [Google Scholar]
- 52. Mosoian A, Teixeira A, High AA et al Novel function of prothymosin alpha as a potent inhibitor of human immunodeficiency virus type 1 gene expression in primary macrophages. J. Virol. 2006; 80: 9200–6. [DOI] [PMC free article] [PubMed] [Google Scholar]
- 53. Almarri A, Batchelor JR. HLA and hepatitis B infection. Lancet 1994; 344: 1194–5. [DOI] [PubMed] [Google Scholar]
- 54. Esteban R, Vega L, Fujimura T. 20S RNA narnavirus defies the antiviral activity of SKI1/XRN1 in Saccharomyces cerevisiae. J. Biol. Chem. 2008; 283: 25812–20. [DOI] [PMC free article] [PubMed] [Google Scholar]
- 55. Bania J, Gatti E, Lelouard H et al Human cathepsin S, but not cathepsin L, degrades efficiently MHC class II‐associated invariant chain in nonprofessional APCs. Proc. Natl. Acad. Sci. U.S.A. 2003; 100: 6664–9. [DOI] [PMC free article] [PubMed] [Google Scholar]
- 56. Riese RJ, Wolf PR, Bromme D et al Essential role for cathepsin S in MHC class II‐associated invariant chain processing and peptide loading. Immunity 1996; 4: 357–66. [DOI] [PubMed] [Google Scholar]
- 57. Keely S, Glover LE, MacManus CF et al Selective induction of integrin beta1 by hypoxia‐inducible factor: implications for wound healing. FASEB J. 2009; 23: 1338–46. [DOI] [PMC free article] [PubMed] [Google Scholar]
- 58. Sekikawa A, Fukui H, Fujii S et al Possible role of REG Ialpha protein in ulcerative colitis and colitic cancer. Gut 2005; 54: 1437–44. [DOI] [PMC free article] [PubMed] [Google Scholar]
- 59. Astrosini C, Roeefzaad C, Dai YY, Dieckgraefe BK, Jons T, Kemmner W. REG1A expression is a prognostic marker in colorectal cancer and associated with peritoneal carcinomatosis. Int. J. Cancer 2008; 123: 409–13. [DOI] [PubMed] [Google Scholar]
- 60. Ekbom A, Helmick C, Zack M, Adami HO. Increased risk of large‐bowel cancer in Crohn's disease with colonic involvement. Lancet 1990; 336: 357–9. [DOI] [PubMed] [Google Scholar]
- 61. Baugh MD, Perry MJ, Hollander AP et al Matrix metalloproteinase levels are elevated in inflammatory bowel disease. Gastroenterology 1999; 117: 814–22. [DOI] [PubMed] [Google Scholar]
- 62. Stallmach A, Chan CC, Ecker KW et al Comparable expression of matrix metalloproteinases 1 and 2 in pouchitis and ulcerative colitis. Gut 2000; 47: 415–22. [DOI] [PMC free article] [PubMed] [Google Scholar]
- 63. Ravi A, Garg P, Sitaraman SV. Matrix metalloproteinases in inflammatory bowel disease: boon or a bane? Inflamm. Bowel Dis. 2007; 13: 97–107. [DOI] [PubMed] [Google Scholar]
- 64. Shinozaki S, Nakamura T, Iimura M et al Upregulation of Reg 1alpha and GW112 in the epithelium of inflamed colonic mucosa. Gut 2001; 48: 623–9. [DOI] [PMC free article] [PubMed] [Google Scholar]
- 65. Ishii T, Wallace AM, Zhang X et al Stability of housekeeping genes in alveolar macrophages from COPD patients. Eur. Respir. J. 2006; 27: 300–6. [DOI] [PubMed] [Google Scholar]
Associated Data
This section collects any data citations, data availability statements, or supplementary materials included in this article.
Supplementary Materials
Figure S1 Suppressive subtractive hybridization method. Restriction endonuclease‐digested tester DNA was split into two pools and ligated with Adaptor 1 or Adaptor 2R. Two successive rounds of hybridization with excess restriction endonuclease‐digested driver DNA followed. Thereafter, single‐stranded components of the adaptors were filled in. Exponential amplification of tester‐specific sequences is used to enrich for potential differentially expressed genes. Type a molecules are significantly enriched, differentially expressed sequences, while cDNA that are not differentially expressed form type c molecules with the driver. The concentration of high‐ and low‐abundance sequences is equalized, whereby highly abundant molecules re‐anneal to form type b and d molecules. During the second hybridization, remaining equalized and subtracted single‐stranded tester cDNA reassociate to form type e hybrids, with different ends corresponding to sequences of Adaptor 1 and Adaptor 2R (adapted from Clontech PCR‐Select cDNA subtraction kit user manual [BD Biosciences]).
Table S1 Primers used for real‐time reverse transcription polymerase chain reaction quantification of ANPEP, REG1A, MMP2 and RPL32
Table S2 Differentially expressed genes specific to Crohn’s Disease (CD) ileum. Genes within each functional category are listed in order of clone abundance
Supporting info item
Supporting info item