

Abstract
BACKGROUND
Several workers have studied the effect of harvest time on chemical and nutritional composition of almonds, but the results are partly conflicting, probably due to differences in the cultivars considered and to different agronomic and climatic conditions in the growing areas. In this paper, the influence of harvest time and cultivar on the chemical and nutritional composition of almonds (Prunus dulcis (Mill). D.A. Webb) were evaluated. Ten cultivars were considered, grown in the same orchard and subjected to the same agronomical regime. Almonds were collected at two different harvest times: (i) when the fruits were unripe, but already edible, and showed green and moist hull; and (ii) when the fruits were ripe, with dry brown hull. The analyses of proximate composition, fatty acid profile, total phenolic compounds, and antioxidant activity were carried out.
RESULTS
Lipid content increased (P < 0.001) during ripening, while both protein and carbohydrate content decreased (P < 0.01). Fatty acid composition showed a not univocal behavior during ripening and was highly influenced by cultivar. Total phenolic compounds and antioxidant activity varied among cultivars but increased during ripening with the exception of cv Marcona. The ‘Genco’ and ‘Francolì’ cultivars were found to be phenolic rich.
CONCLUSION
Harvest time and cultivar significantly influenced the chemical and nutritional composition of almonds. Genotype strongly influenced fatty acid composition and total phenolic compounds. The changes of bioactive compounds and antioxidant activity suggest that the synthesis of antioxidants also occurs in the last stage of ripening. Unripe almonds, a valuable niche product, showed interesting nutritional value. © 2018 Society of Chemical Industry
Keywords: almonds, fatty acid composition, total phenolic compounds, antioxidant activity, harvest time
INTRODUCTION
Almond (Prunus dulcis (Mill.) D.A. Webb) is one of the oldest cultivated nut trees in the world and a major nut tree crop in hot‐arid countries of the Mediterranean basin,1, 2 including southern Italy and, particularly, the Apulia region.3
Almond trees produce nutrient‐dense nuts appreciated for their favorable lipid profile, and for high contents of vitamin E and polyphenols. Almonds are mostly consumed without removing the skin, but may also be blanched and peeled, then milled and processed to nondairy beverages, or confectionery delicacies.4
The importance of almonds from an agronomical and nutritional point of view explains the presence of numerous studies related in particular to the characterization of the chemical composition of fruit, with particular emphasis on the lipid fraction.5 The latter is characterized by the predominance of unsaturated fatty acids, such as oleic and linoleic acid, and low amounts of saturated fatty acids, as well as by the presence of antioxidant compounds.6 Previous studies showed the influence of several factors, such as genotype and harvest year, on the antioxidant compounds of almonds. In particular, Bolling et al.7 reported that the synthesis of the individual polyphenols was related only to the cultivar. Flavonoids, antioxidant activity, and total polyphenols instead showed a significant interaction between genotype and environmental conditions.
Furthermore, almond genotype is the main cause of variability of fatty acid composition, oleic/linoleic acid ratio, and content of minor compounds (squalene and α‐tocopherol).8, 9 At the same time, several studies10, 11 reported that both lipid content and fatty acid composition were affected by growing region, pointing out the significant interaction between genotype and environment. Finally, Yada et al.12 showed that moisture, total lipid, monounsaturated fatty acids, dietary fiber, and ash content of almonds were significantly affected by the harvest year, although this aspect was not univocally demonstrated in literature.
Moreover, many other studies were carried out in order to investigate the use of almonds to produce processed food, such as almond milk,13 almond fermented milk,14 and almond paste for desserts,15 all pointing out the health benefits of almonds and related products.16, 17, 18, 19 At the same time, to take advantage of the high phenolic content of almond skins,4 several studies evaluated the potential use of this by‐product of almond blanching as a new ingredient, with the aim of improving the health value of foods.20, 21
The composition of almonds is also strongly influenced by harvest time; that is, it varies at increasing ripening degree, as reported by several studies. Nanos et al.1 carried out a study on two cultivars (‘Texas’ and ‘Ferragnès’) studying the effect of both harvest time and irrigation strategies on lipid content, lipid quality and sugar content. Cherif et al.22 studied three cultivars (‘Achaak’, ‘Perlees’, and ‘Mazzetto’) and reported an increase of lipid content during ripening, with significant changes in fatty acid composition. Hawker and Buttrose23 considered two cultivars (‘Chellaston’ and ‘Johnston Prolific’) and studied the anatomy and the chemical composition of different parts of the fruit, reporting the evolution of lipid, protein, and sugar contents during ripening. Soler et al.24 reported the changes of carbohydrates, proteins, and free amino acids during almond fruit developing, considering a single cultivar. Egea et al.25 investigated the changes of both carbohydrate and protein content during fruit development in a single almond cultivar (‘Marta’), under deficit irrigation conditions.
However, these studies focused on very few cultivars, and their results were partly conflicting. This could be due to a difference in the cultivars considered as well as to different agronomic and climatic conditions in the growing areas.
In this framework, the aim of this study was to determine the influence of harvest time and cultivar on the chemical composition of almond fruit by considering ten different cultivars, all grown in the same orchard. Two different harvest times were considered. The first corresponded to an early stage of almond maturity, when the fruit was still unripe but could be already consumed as fresh product, whereas the second harvest time corresponded to ripe fruits with dry hull.
EXPERIMENTAL
Plant material and sampling
The research was carried out on adult almond trees (30 years old) belonging to the germplasm collection of the Department of Soil, Plant and Food Science (DISSPA) of the University of Bari, grown in Valenzano, near Bari (Apulia region, southeastern Italy). Ten commercially important cultivars were studied, of which eight were selected among the most widespread in the top producing countries (Australia, California, Italy, and Spain),26, 27, 28, 29 and two were new cultivars obtained in recent breeding programs.27, 28 In detail, the cultivars examined were the Australian ‘Johnston Prolific’ (JPcv), the Californian ‘Texas’ (TEcv) and ‘Thompson’ (THcv), the Italian ‘Filippo Ceo’ (FCcv), ‘Genco’ (GEcv) and ‘Tuono’ (TUcv), the Spanish ‘Desmajo Largueta’ (DLcv), and ‘Marcona’ (MAcv), as well as ‘Francolì’ (FR cv) and ‘Ferragnès’ (FEcv), the latter two being the new ones, recently grown in Italian and Spanish new plantations.27, 28 Among these cultivars, the Italian ‘Tuono’, is also grown in Greece, Libya, Tunisia and in Spain (where it is known as ‘Guara’).30 All almond cultivars were grafted, on sweet almond cv Don Carlo, by T‐budding in the fall onto almond seedling rootstocks, a common grafting technique used for almond orchards located in the Mediterranean region and already used in other studies.31, 32 Almond cultivars were grown under rainfed conditions and with a tree spacing of 6.0 m × 6.0 m. All trees had the same age, and standard cultural practices were performed. Fruits were randomly collected from four different trees for each cultivar at two different harvest times, as follows: (i) T 1 (14 July 2016) corresponding to stage ‘J’33 – that is, an early stage of almond maturity, when the fruit was still unripe, with green and moist hull, but with developed cotyledons, easily separable from almond skin; (ii) T 2 (between the second half of August and the beginning of September 2016), corresponding to stage ‘L’33 – that is, ripe fruits with dry brown hull. Whole fruits collected at T 1 and T 2 were quickly stored at −18 °C until analysis. Then, the hull and shell were removed to obtain the kernel. Finally, almonds were finely milled by an electric grinder (B7301, Imetec, Azzano S. Paolo, Bergamo, Italy) and analyzed with three replicates. Samples at T 1 were lyophilized (De Mori, Milan, Italy) prior to milling.
Morphological features of almonds
Weight was determined by an analytical scale on 100 fruits. Width, length, and thickness were measured by a caliper on 100 fruits. All parameters were measured on fruits collected at T 1 and T 2.
Chemical composition
Protein (total nitrogen × 5.18), ash, and moisture content were determined according to the AACC methods 46‐11A, 0801, and 44‐15A respectively.34 Fat content was determined by means of a Soxhlet apparatus using diethyl ether (Sigma Aldrich, Milan, Italy) as extracting solvent.35 Total carbohydrates were calculated by difference. Energy value was expressed as kilocalories per kilogram and was calculated using Atwater's coefficients.36
Fatty acid composition
The fatty acid composition was determined by gas chromatographic analysis of fatty acid methyl esters according to AOCS method Ch 1–91.37
The gas chromatography system used consisted of a 7890A gas chromatograph (Agilent Technologies, Palo Alto, USA) equipped with a flame ionization detector and an SP2340 fused‐silica capillary column 60 m × 0.25 mm × 0.2 μm film thickness (Supelco Park, Bellefonte, PA, USA). The gas chromatography conditions used were the same as those reported in our previous study.38 In particular, the temperature of the split injector was 230 °C, with a splitting ratio of 1 : 50; the detector temperature was 290 °C. The oven temperature was programmed from 60 to 180 °C, with increments of 5 °C min−1, then to 240 °C with increments of 3 °C min−1, and a final isothermal of 20 min. Helium was utilized as carrier gas at a constant flow rate of 3 mL min−1. The identification of each fatty acid was carried out by comparing the retention time with that of the corresponding methyl ester standard (Sigma Aldrich, Milan, Italy). The results were expressed as grams per kilogram.
Determination of antioxidant activity and total phenolic compounds
Radical 2,2‐diphenyl‐1‐picrylhydrazyl (DPPH) scavenging activity and content of total phenolic compounds were measured on the methanol extract prepared as follows: 0.5 g of sample powder was mixed with 10 mL of aqueous methanol (70% v/v) and stirred for 2 h. After centrifugation at 10 000 rpm for 10 min, the supernatant was utilized for the determination of the antioxidant activity, as reported in Cosmai et al.39 with some modifications. In particular, 100 μL of extract were diluted ten times and added at 900 μL of 60 μmol L−1 DPPH methanol solution (Sigma Aldrich, Milan, Italy). Samples were stored in dark condition for 1 h, then the absorbance at 517 nm was read for each sample with a Cary 60 UV–Vis spectrometer (Agilent Technologies, Santa Clara, CA, USA). A calibration curve was prepared with (±)‐6‐hydroxy‐2,5,7,8‐tetramethylchromane‐2‐carboxylic acid (Trolox, Sigma Aldrich, Milan, Italy) in order to express antioxidant activity in equivalents of this compound.
Total phenolic compounds were determined using the Folin–Ciocalteu method, previously reported in Singleton and Rossi40 with some variations. Basically, 100 μL of extract was added to 100 μL of Folin and Ciocalteu's phenol reagent (Sigma Aldrich, Milan, Italy) and to 800 μL of sodium carbonate (5% w/v). The mixture was kept stirring in dark condition for 1 h, then was centrifuged at 10 000 rpm for 3 min. Finally, the absorbance at 765 nm was read. Total phenolic compounds were expressed as milligrams per kilogram of gallic acid, previously used to obtain the calibration curve.
Statistical analysis
To analyze the differences among samples, one‐way analysis of variance (ANOVA), followed by Fisher's test (least significant difference) for multiple comparisons at P < 0.05, was carried out on the experimental data by means of the XLStat software (Addinsoft SARL, New York, NY, USA). Principal component analysis was applied to define the influence of cultivar and harvest time.
RESULTS AND DICUSSION
Morphological and basic nutritional data
Table 1 reports the mean values of weight and size of kernels collected at two different harvest times: T 1, corresponding to unripe fruits with green and moist hull, traditionally consumed fresh, and T 2, corresponding to drier fruits collected at full ripening time. Almond size's indices at T 1 were characterized by a great variability; in particular, kernel weight ranged from 1.63 to 3.14 g. Kernel weight remarkably decreased at T 2, due to moisture loss, with a lower variability than at T 1 (range 1.21–1.78 g). JPcv showed the highest kernel weight both at T 1 and T 2 and was affected by the highest weight loss (exceeding 43%) during ripening. The same cultivar showed the longest kernels. The cultivars under investigation were characterized by different kernel shape, varying from round (MAcv, with 0.80 and 0.76 width/length ratio at T 1 and at T 2 respectively) to elongated (JPcv, with 0.43 and 0.47 width/length ratio at T 1 and at T 2 respectively).
Table 1.
Mean value of kernel weight, length, width and thickness of almonds examined at two different harvest times
| T 1 | T 2 | |||||||||
|---|---|---|---|---|---|---|---|---|---|---|
| Cultivar | Weight (g) | Thickness (mm) | Length (mm) | Width (mm) | Width/length ratio | Weight (g) | Thickness (mm) | Length (mm) | Width (mm) | Width/length ratio |
| DLcv | 2.20 | 8.52 | 27.93 | 14.73 | 0.52 | 1.43 | 7.35 | 28.45 | 15.02 | 0.53 |
| GEcv | 1.94 | 10.41 | 22.33 | 14.94 | 0.67 | 1.56 | 8.46 | 23.88 | 15.52 | 0.65 |
| JPcv | 3.14 | 9.52 | 35.77 | 15.57 | 0.43 | 1.78 | 7.19 | 32.14 | 15.15 | 0.47 |
| MAcv | 1.78 | 9.62 | 20.30 | 16.26 | 0.80 | 1.45 | 8.54 | 21.90 | 16.69 | 0.76 |
| THcv | 1.84 | 8.76 | 25.13 | 13.31 | 0.52 | 1.31 | 7.77 | 24.22 | 13.89 | 0.57 |
| TUcv | 1.86 | 8.70 | 25.38 | 15.02 | 0.59 | 1.35 | 7.08 | 25.07 | 15.93 | 0.63 |
| FCcv | 2.16 | 11.09 | 24.73 | 15.88 | 0.64 | 1.21 | 7.73 | 24.88 | 14.98 | 0.60 |
| FEcv | 2.12 | 8.89 | 31.20 | 14.76 | 0.47 | 1.62 | 8.28 | 28.74 | 14.04 | 0.49 |
| FRcv | 2.01 | 9.26 | 26.51 | 14.10 | 0.53 | 1.39 | 6.90 | 25.94 | 15.02 | 0.58 |
| TEcv | 1.63 | 9.61 | 22.37 | 13.51 | 0.60 | 1.46 | 9.42 | 23.48 | 13.80 | 0.59 |
T 1, unripe, but already edible, drupes with green and moist hull; T 2, ripe almonds. DLcv, cv Desmajo Largueta; FCcv, cv Filippo Ceo; FEcv, cv Ferragnès; GEcv, cv Genco; MAcv, cv Marcona; THcv, cv Thompson; TUcv, cv Tuono; TEcv, cv Texas; JPcv, cv Johnston Prolific; FRcv, cv Francolì.
Table 2 reports the chemical composition of almond cultivars at the two different harvest times considered. All almond cultivars showed a remarkable variability for the chemical parameters evaluated. T 1 almonds were characterized by a high moisture content (450.8 g kg−1 as mean value, reaching 562.0 g kg−1 in TEcv), which dramatically decreased to 58.3 g kg−1 in T 2 almonds. The lipid content at T 1 was between 200.6 g kg−1 (in TEcv) and 301.1 g kg−1 (in DLcv) on fresh matter, and considerably increased at T 2, reaching 561.7 g kg−1 (in FCcv). The latter cultivar also showed the lowest protein content at both T 1 and T 2 (101.1 g kg−1 and 141.2 g kg−1 respectively). In this regard, other authors25 reported that the highest lipid content was coupled with the lowest protein content.
Table 2.
Chemical composition (g kg−1 on fresh weight) and energy value (kcal kg−1 on fresh weight) of almonds examined at two different harvest times (n = 3)
| T 1 | T 2 | |||||||||||
|---|---|---|---|---|---|---|---|---|---|---|---|---|
| Cultivar | Moisture content | Lipid content | Protein content | Carbohydrate content | Ash content | Energy value | Moisture content | Lipid content | Protein content | Carbohydrate content | Ash content | Energy value |
| DLcv | 394.0 | 301.1 | 140.1 | 145.5 | 19.3 | 3852.3 | 56.8 | 505.7 | 196.6 | 208.9 | 32.0 | 6173.3 |
| GEcv | 482.2 | 233.2 | 124.4 | 144.5 | 15.7 | 3174.4 | 65.3 | 423.9 | 214.6 | 266.3 | 29.9 | 5738.7 |
| JPcv | 438.6 | 210.9 | 151.7 | 184.3 | 14.5 | 3242.1 | 54.3 | 469.7 | 201.6 | 248.1 | 26.3 | 6026.1 |
| MAcv | 421.0 | 264.1 | 147.9 | 150.7 | 16.3 | 3571.3 | 60.9 | 527.1 | 220.8 | 157.1 | 34.1 | 6255.5 |
| THcv | 430.7 | 268.4 | 149.2 | 134.8 | 16.9 | 3551.6 | 52.7 | 480.3 | 212.3 | 223.6 | 31.1 | 6066.3 |
| TUcv | 422.4 | 269.3 | 148.9 | 140.9 | 18.5 | 3582.9 | 53.0 | 473.0 | 204.5 | 239.3 | 30.2 | 6032.2 |
| FCcv | 476.0 | 227.0 | 101.1 | 181.5 | 14.4 | 3173.4 | 53.8 | 561.7 | 141.2 | 218.4 | 24.9 | 6493.7 |
| FEcv | 439.0 | 247.1 | 138.7 | 157.4 | 17.8 | 3408.3 | 65.0 | 501.3 | 181.4 | 223.7 | 28.6 | 6132.1 |
| FRcv | 442.3 | 266.3 | 123.9 | 149.4 | 18.1 | 3489.9 | 56.7 | 442.9 | 204.9 | 260.6 | 34.9 | 5848.1 |
| TEcv | 562.0 | 200.6 | 121.9 | 100.1 | 15.4 | 2693.4 | 64.5 | 487.5 | 201.4 | 217.4 | 29.2 | 6062.7 |
| Mean | 450.8 | 248.8 | 134.8 | 148.9 | 16.7 | 3374.0 | 58.3 | 487.3 | 197.9 | 226.3 | 30.1 | 6082.5 |
| SD | 46.8 | 30.8 | 16.5 | 23.7 | 1.7 | 438.0 | 5.2 | 39.7 | 22.7 | 31.0 | 3.1 | 572.1 |
T 1, unripe, but already edible, drupes with green and moist hull; T 2, ripe almonds. DLcv, cv Desmajo Largueta; FCcv, cv Filippo Ceo; FEcv, cv Ferragnès; GEcv, cv Genco; MAcv, cv Marcona; THcv, cv Thompson; TUcv, cv Tuono; TEcv, cv Texas; JPcv, cv Johnston Prolific; FRcv, cv Francolì. SD, standard deviation.
MAcv showed the highest protein content at T 2 (220.8 g kg−1), whereas JPcv showed the highest protein content at T 1 (151.7 g kg−1). Carbohydrates mean content accounted for 184.3 g kg−1 and 226.3 g kg−1 at T 1 and T 2 respectively. Ash content was below 20.0 g kg−1 at T 1, rising to a range of 24.9–34.9 g kg−1 at T 2.
Owing to the strong difference in moisture content (much lower at T 2 than at T 1), the total energy value (expressed on fresh matter) of almonds collected at T 2 was dramatically higher (6082.5 kcal kg−1) than at T 1 (3374.0 kcal kg−1). These observations could induce modern consumers, searching for less energetic food, to prefer fresh unripe almonds over ripe fruits.
The differences between T 1 and T 2 are highlighted in Fig. 1, which reports the mean value and the results of statistical analysis (one‐way ANOVA) of proteins, lipids, carbohydrates, and ash content expressed on dry matter. Harvest time significantly influenced the lipid content, making it strongly increase during ripening (P < 0.001). This trend was due to the incomplete biosynthesis of triacylglycerols at T 1. Cherif et al.22 Egea et al.,25 and Piscopo et al.2 previously reported similar results, whereas Nanos et al.1 reported no significant differences in lipid content during ripening, considering two cultivars (TEcv and FEcv) under two different irrigation strategies.
Figure 1.
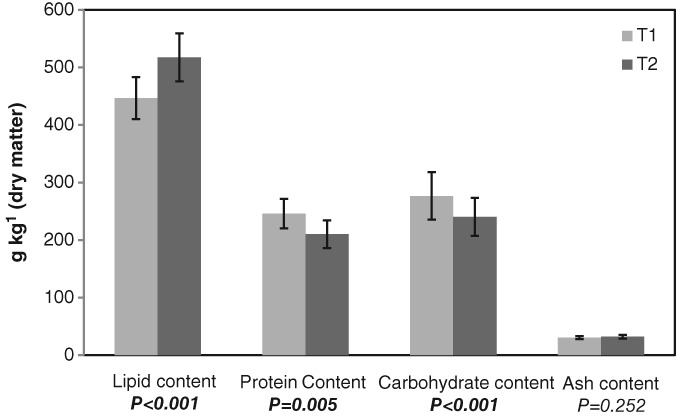
Mean value, with standard deviation, and results of statistical analysis of lipid, protein, carbohydrate, and ash contents of almonds collected at two different harvest times: T 1, unripe, but already edible, drupes with green and moist hull; T 2, ripe almonds.
Protein content exhibited a significant decrease (P < 0.01) in almonds harvested at T 2, ranging from 246.0 to 210.2 g kg−1. A previous study carried out over 3 years in cv Marta reported a sharp decrease of protein content immediately after fruit dehydration, but just in 1 year of production.25 Thus, protein content could be influenced by several factors in addition to cultivar, such as climatic conditions during kernel filling stage. Changes in protein content during ripening were previously studied by Soler et al.24 who reported a protein increase as ripening proceeded. This trend was not found in our samples.
Paralleling the same trend of protein content, a drop of total carbohydrates on dry matter was observed, from an average of 276.7 g kg−1 (T 1) to 240.4 g kg−1 (T 2). Carbohydrates could be used as substrate for the biosynthesis of other chemical compounds during ripening. Finally, ash content remained constant during almond ripening (P = 0.252).
The changes that occurred in chemical composition could also be explained by considering the differences in kernel weight at the two harvest times (Table 1). Considering the chemical composition on a dry basis (data not shown), a significant and negative correlation was found between kernel weight and lipid content (R = −0.756), whereas a positive correlation occurred with carbohydrate content (R = 0.634). Thickness, length and width were not significantly correlated with chemical composition. Greater variations in kernel weight during ripening (such as in FCcv and JPcv) corresponded to stronger changes in the chemical composition.
Considering the data obtained in our investigation, unripe almonds (T 1) revealed interesting nutritional characteristics compared with fully ripe almonds (T 2). As a matter of fact, almonds have much lower lipid content and higher protein content at T 1 than at T 2. Moreover, owing to their high moisture content, unripe almonds have a lower energy value than fully ripe fruits. However, such a high moisture level determines a very low shelf‐life, limiting the consumption of unripe almonds, as fresh product, to a short period of the year.41 Frozen storage could be effective to extend the shelf‐life of this nutritionally valuable product.
Fatty acid composition
Table 3 reports the fatty acid composition and the results of statistical analysis of almond kernels collected at T 1 and T 2, expressed as grams per kilogram. All the cultivars showed a predominance of oleic acid, ranging from 599.14 g kg−1 (TEcv at T 1) to 782.75 g kg−1 (GEcv at T 2). Linoleic acid was the second most abundant fatty acid, with the lowest content in JPcv at T 1 (150.69 g kg−1) and the highest content in DLcv at T 2 (261.08 g kg−1). At the same time, DLcv showed the highest content of palmitic acid at both T 1 and T 2, with values of 76.72 g kg−1 and 77.03 g kg−1 respectively. The lowest contents of palmitic acid were found in GEcv and FCcv at both harvest times. Therefore, almonds showed a well‐balanced and healthy fatty acid composition, even at the earliest stages of ripeness.
Table 3.
Mean value (n = 3), standard deviation (SD) and results of statistical analysis of the fatty acid composition (g kg−1) of the lipid fraction of almonds collected at two different harvest times
| DLcv | FCcv | FEcv | FRcv | GEcv | JPcv | MAcv | TEcv | THcv | TUcv | ||
|---|---|---|---|---|---|---|---|---|---|---|---|
| C14:0 | T 1 | 0.28 ± 0.02a | 0.23 ± 0.02 | 0.26 ± 0.01 | 0.16 ± 0.03 | 0.24 ± 0.01b | 0.44 ± 0.13 | 0.21 ± 0.14 | 0.14 ± 0.03b | 0.26 ± 0.07 | 0.20 ± 0.03 |
| T 2 | 0.20 ± 0.00b | 0.28 ± 0.03 | 0.28 ± 0.01 | 0.11 ± 0.02 | 0.49 ± 0.09a | 0.32 ± 0.11 | 0.29 ± 0.11 | 0.32 ± 0.07a | 0.17 ± 0.06 | 0.16 ± 0.04 | |
| C14:1 | T 1 | 0.28 ± 0.01 | 0.17 ± 0.00 | 0.21 ± 0.02 | 0.20 ± 0.01 | 0.20 ± 0.03 | 0.26 ± 0.03 | 0.22 ± 0.15 | 0.32 ± 0.03 | 0.30 ± 0.01 | 0.24 ± 0.02 |
| T 2 | 0.30 ± 0.01 | 0.17 ± 0.01 | 0.26 ± 0.03 | 0.22 ± 0.01 | 0.24 ± 0.01 | 0.32 ± 0.02 | 0.30 ± 0.12 | 0.27 ± 0.03 | 0.30 ± 0.01 | 0.22 ± 0.01 | |
| C15:0 | T 1 | 0.11 ± 0.01b | 0.09 ± 0.00 | 0.09 ± 0.03 | 0.09 ± 0.02 | 0.09 ± 0.00 | 0.12 ± 0.00 | 0.07 ± 0.01 | 0.16 ± 0.03 | 0.11 ± 0.01 | 0.11 ± 0.02 |
| T 2 | 0.24 ± 0.07a | 0.10 ± 0.01 | 0.13 ± 0.02 | 0.12 ± 0.01 | 0.07 ± 0.11 | 0.13 ± 0.01 | 0.08 ± 0.11 | 0.13 ± 0.02 | 0.12 ± 0.00 | 0.12 ± 0.01 | |
| C16:0 | T 1 | 76.72 ± 0.29 | 56.59 ± 0.15 | 64.82 ± 1.23 | 63.81 ± 1.25 | 55.61 ± 1.00 | 63.18 ± 1.08b | 66.49 ± 0.22 | 71.49 ± 0.39a | 63.56 ± 0.27 | 71.28 ± 0.40a |
| T 2 | 77.03 ± 0.19 | 59.09 ± 0.29 | 68.61 ± 1.31 | 61.56 ± 1.14 | 60.10 ± 1.76 | 68.02 ± 0.91a | 70.17 ± 0.30 | 64.39 ± 0.22b | 67.50 ± 0.34 | 69.22 ± 0.33b | |
| C16:1 | T 1 | 4.90 ± 0.11 | 3.14 ± 0.23 | 4.23 ± 0.12b | 3.71 ± 0.22 | 4.18 ± 0.32b | 4.97 ± 0.61 | 5.12 ± 0.06b | 4.07 ± 0.01 | 3.99 ± 0.31 | 4.10 ± 0.21 |
| T 2 | 5.35 ± 0.23 | 3.79 ± 0.21 | 5.60 ± 0.22a | 4.32 ± 0.34 | 6.17 ± 0.16a | 6.15 ± 0.81 | 7.26 ± 0.07a | 4.10 ± 0.05 | 4.90 ± 0.42 | 4.60 ± 0.25 | |
| C17:0 | T 1 | 0.60 ± 0.02 | 0.70 ± 0.03 | 0.55 ± 0.01 | 0.56 ± 0.02 | 0.52 ± 0.04 | 0.56 ± 0.04 | 0.54 ± 0.06 | 0.64 ± 0.06 | 0.56 ± 0.01 | 0.61 ± 0.03 |
| T 2 | 0.59 ± 0.01 | 0.62 ± 0.02 | 0.54 ± 0.01 | 0.55 ± 0.10 | 0.48 ± 0.01 | 0.53 ± 0.06 | 0.45 ± 0.04 | 0.57 ± 0.04 | 0.54 ± 0.00 | 0.60 ± 0.03 | |
| C17:1 | T 1 | 1.02 ± 0.03 | 0.86 ± 0.03 | 0.94 ± 0.02 | 0.93 ± 0.11 | 1.00 ± 0.02 | 1.03 ± 0.05 | 0.98 ± 0.02 | 0.89 ± 0.05 | 1.04 ± 0.02 | 0.89 ± 0.03 |
| T 2 | 0.98 ± 0.03 | 0.78 ± 0.04 | 0.90 ± 0.00 | 0.89 ± 0.13 | 1.05 ± 0.08 | 0.92 ± 0.04 | 0.94 ± 0.03 | 0.91 ± 0.05 | 1.05 ± 0.02 | 0.89 ± 0.03 | |
| C18:0 | T 1 | 20.62 ± 0.12 | 39.73 ± 0.22 | 20.20 ± 0.23 | 23.40 ± 0.91 | 18.46 ± 1.02 | 17.38 ± 1.02b | 20.00 ± 1.13 | 24.72 ± 0.13a | 17.35 ± 0.15 | 24.21 ± 0.10b |
| T 2 | 21.29 ± 0.21 | 39.25 ± 0.26 | 21.43 ± 0.37 | 26.82 ± 0.94 | 14.35 ± 1.06 | 21.74 ± 1.10a | 18.11 ± 0.80 | 21.94 ± 0.10b | 16.86 ± 0.17 | 30.50 ± 0.21a | |
| C18:1 | T 1 | 628.20 ± 1.32 | 685.36 ± 0.81a | 729.68 ± 1.17a | 720.68 ± 0.3 | 752.80 ± 0.94b | 760.11 ± 1.41a | 694.8 ± 1.39 | 599.14 ± 1.37b | 721.99 ± 0.16 | 671.56 ± 0.19 |
| T 2 | 631.46 ± 2.12 | 667.26 ± 0.73b | 685.13 ± 0.91b | 727.98 ± 0.49 | 782.75 ± 0.83a | 682.80 ± 1.50b | 689.01 ± 1.08 | 678.30 ± 1.13a | 716.68 ± 0.26 | 671.15 ± 0.98 | |
| C18:2 | T 1 | 265.98 ± 1.10 | 210.89 ± 0.09b | 177.44 ± 0.82b | 184.58 ± 1.11 | 165.49 ± 4.02a | 150.69 ± 0.08b | 210.18 ± 0.18 | 296.81 ± 1.11a | 189.38 ± 0.46 | 224.62 ± 0.74 |
| T 2 | 261.08 ± 1.12 | 226.26 ± 0.03a | 215.48 ± 1.01a | 175.40 ± 1.32 | 133.04 ± 1.23b | 217.94 ± 0.13a | 212.18 ± 0.18 | 227.78 ± 1.18b | 190.78 ± 0.36 | 220.18 ± 1.69 | |
| C20:0 | T 1 | 0.65 ± 0.02 | 1.35 ± 0.01 | 0.75 ± 0.01 | 0.94 ± 0.04 | 0.63 ± 0.21 | 0.55 ± 0.13 | 0.63 ± 0.03 | 0.79 ± 0.15 | 0.69 ± 0.23 | 1.25 ± 0.05 |
| T 2 | 0.69 ± 0.01 | 1.38 ± 0.01 | 0.74 ± 0.01 | 1.09 ± 0.05 | 0.50 ± 0.12 | 0.31 ± 0.44 | 0.50 ± 0.07 | 0.57 ± 0.10 | 0.32 ± 0.45 | 1.37 ± 0.03 | |
| C18:3 | T 1 | 0.53 ± 0.01 | 0.72 ± 0.01 | 0.68 ± 0.02 | 0.76 ± 0.07 | 0.66 ± 0.04 | 0.56 ± 0.14 | 0.64 ± 0.03 | 0.69 ± 0.02 | 0.62 ± 0.03 | 0.71 ± 0.01 |
| T 2 | 0.61 ± 0.03 | 0.79 ± 0.02 | 0.72 ± 0.02 | 0.77 ± 0.05 | 0.69 ± 0.05 | 0.70 ± 0.14 | 0.54 ± 0.07 | 0.61 ± 0.02 | 0.64 ± 0.02 | 0.71 ± 0.03 | |
| C22:0 | T 1 | 0.12 ± 0.02 | 0.17 ± 0.03 | 0.15 ± 0.01 | 0.17 ± 0.00 | 0.11 ± 0.08 | 0.13 ± 0.00 | 0.11 ± 0.01 | 0.15 ± 0.00 | 0.14 ± 0.01 | 0.23 ± 0.00 |
| T 2 | 0.17 ± 0.01 | 0.23 ± 0.04 | 0.17 ± 0.02 | 0.19 ± 0.01 | 0.06 ± 0.08 | 0.12 ± 0.03 | 0.18 ± 0.03 | 0.11 ± 0.03 | 0.16 ± 0.04 | 0.28 ± 0.03 |
Different letters in column, for the same fatty acid, indicate significant differences at P < 0.05.
T 1, unripe, but already edible, drupes with green and moist hull; T 2, ripe almonds. DLcv, cv Desmajo Largueta; FCcv, cv Filippo Ceo; FEcv, cv Ferragnès; GEcv, cv Genco; MAcv, cv Marcona; THcv, cv Thompson; TUcv, cv Tuono; TEcv, cv Texas; JPcv, cv Johnston Prolific; FRcv, cv Francolì.
The results of the statistical analysis (one‐way ANOVA) revealed that fatty acid composition was influenced by harvest time, pointing out significant differences among seven out of ten cultivars under investigation. The evolution of fatty acid composition during ripening did not exhibit univocal behavior.
In particular, GEcv and TEcv showed a significant increase of oleic acid content during ripening and, oppositely, FCcv, FEcv, and JPcv revealed a significant decrease of the same fatty acid. In a previous study, Nanos et al.1 examined TEcv and FEcv and reported a higher oleic content in early‐harvested almonds than in late‐harvested ones. On the other hand, both Cherif et al.22 and Piscopo et al.2 reported an increase of oleic acid during ripening.
In FCcv, FEcv, and JPcv, the decrease of oleic acid corresponded to a significant increase of linoleic acid during ripening, whereas GEcv and TEcv showed a decrease. Palmitoleic acid significantly decreased in FEcv, GEcv, and MAcv.
The saturated lipid fraction was represented mostly by palmitic acid, which also exhibited divergent trends among cultivars. Its content significantly decreased in TEcv and TUcv. Stearic acid increased in JPcv and TUcv, but significantly decreased in TEcv.
To better point out the influence of cultivar in our samples, fatty acid compositional data were submitted to principal component analysis, setting the cultivar as supplementary variable (Fig. 2). As expected, the distribution of samples was strongly influenced by the variable ‘cultivar’, regardless of harvest time. However, we found an irregular behavior in sample distribution among the two principal components. PC1 explained over the 42% of total variability and was influenced by minor and saturated fatty acids. In this case, some cultivars, such as GEcv, JPcv, TEcv, and DLcv, exhibited a great variability on this axis. PC2, instead, was influenced by major fatty acids (oleic and linoleic acids), and both JPcv and TEcv showed a large variability related to harvest time.
Figure 2.
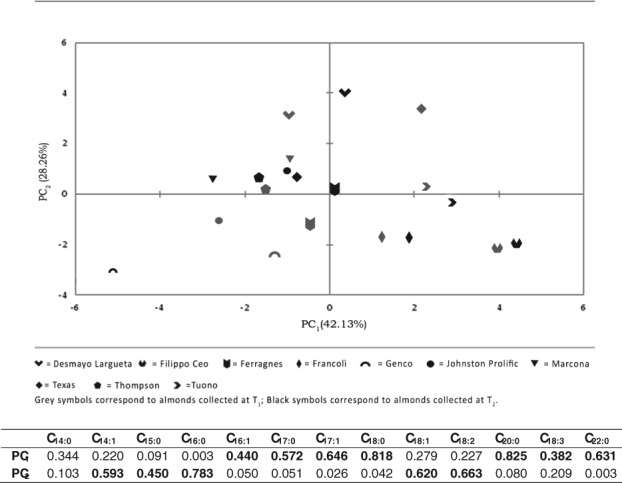
Loading plot of the principal component analysis carried out on the fatty acid composition of almonds collected at two different harvest times: T1, unripe, but already edible, drupes with green and moist hull; T 2, ripe almonds. The cultivar has been considered as supplementary variable. The table at the bottom reports the contribution of the single fatty acid to the PC1 and PC2.
On the whole, our results agreed with existing literature1, 2, 5, 8, 12, 42 and highlighted that the evolution of fatty acid composition during ripening was related to varietal factors.
The positive effects of almond consumption on health are widely reported in the literature.43 These properties are mainly related to almond fatty acid composition, which contributes to enrich the diet in monounsaturated fatty acids. The latter have a more favorable effect on health than polyunsaturated fatty acids,44, 45 besides the obvious positive effect over saturated fatty acids.46, 47 A moderate and regular consumption of almonds and nuts (∼30 g daily) is associated with health‐promoting effects, and the use of almonds as a nutraceutical tool is conceivable in metabolic diseases because they reduce low‐density lipoprotein and total cholesterol and improve glycemic control.18, 48, 49, 50 Thus, the consumption of almonds is gaining interest both locally, in the producing areas, and worldwide.
Antioxidant activity and total phenolic compounds
The total phenolic compounds and the antioxidant activity of almond cultivars at both T 1 and T 2 are reported in Table 4. The total phenolic compounds showed a great variability among cultivars, ranging from 943.84 (JPcv) to 2751.22 mg kg−1 gallic acid (FRcv) on dry matter. The phenolic compounds were more abundant at T 2 than at T 1, with the highest value in GEcv (11 030.53 mg kg−1). MAcv at T 2 was characterized by the lowest phenolic content, with a mean value of 391.98 mg kg−1 gallic acid. This unusual result was also found by Čolić et al.,51 who reported a total phenolic compound content of 204 mg kg−1 gallic acid. Overall, our results agree with the existing literature that reports a wide variability in the content of total phenolic compounds among almond cultivars.7, 52 It should be underlined that almond phenolic compounds have positive health effects, such as the reduction of oxidative stress and inflammation.53, 54 In particular, the most abundant class of polyphenols in almonds is represented by proanthocyanidins,4 recognized as strong contributors of the stability of intestinal microbiota, improving the immune response.55, 56 Therefore, the variations observed among cultivars could have consequences on the health benefits associated with almond consumption.43, 47, 57 Moreover, some phenolic‐rich cultivars, in particular GEcv and FRcv, could be used in the formulation of food products in order to extend their shelf‐life, by reducing the lipid oxidation and preventing the formation of off‐flavors.58 These cultivars will be the object of further studies of shelf‐life assessment.
Table 4.
Mean value (n = 3), plus/minus standard deviation, and results of statistical analysis of the antioxidant activity (μmol Trolox equivalents g−1 on dry matter) and of the total phenolic compounds (mg kg−1 gallic acid on dry matter) of almonds collected at two different harvest times
| Antioxidant activity | Total phenolic compounds | |||||
|---|---|---|---|---|---|---|
| T 1 | T 2 | P‐value | T 1 | T 2 | P‐value | |
| DLcv | 25.00 ± 0.22 | 28.80 ± 3.87 | 0.164 | 1669.74 ± 33.59 | 1853.56 ± 322.04 | 0.23 |
| GEcv | 27.25 ± 2.12 | 60.30 ± 3.31 | <0.001 | 2171.66 ± 191.45 | 11 030.53 ± 54.91 | <0.001 |
| JPcv | 14.13 ± 1.33 | 16.27 ± 1.68 | 0.158 | 943.84 ± 19.24 | 782.05 ± 51.08 | 0.002 |
| MAcv | 15.04 ± 0.40 | 12.69 ± 1.35 | 0.044 | 1015.24 ± 8.84 | 391.98 ± 15.71 | <0.001 |
| THcv | 13.26 ± 1.19 | 21.97 ± 0.55 | <0.001 | 806.49 ± 12.99 | 1538.54 ± 46.36 | <0.001 |
| TUcv | 18.25 ± 0.84 | 40.98 ± 1.56 | <0.001 | 1285.69 ± 11.84 | 4887.99 ± 146.36 | <0.001 |
| FCcv | 20.59 ± 2.76 | 28.19 ± 2.58 | 0.025 | 1258.26 ± 17.12 | 2659.81 ± 417.69 | 0.001 |
| FEcv | 29.08 ± 0.20 | 44.36 ± 2.20 | <0.001 | 2505.83 ± 203.26 | 4170.8 ± 876.93 | 0.011 |
| FRcv | 29.96 ± 2.89 | 60.99 ± 3.61 | <0.001 | 2751.22 ± 264.81 | 7272.32 ± 602.92 | <0.001 |
| TEcv | 14.71 ± 1.77 | 19.57 ± 4.84 | 0.178 | 1500.65 ± 16.93 | 1483.25 ± 19.89 | 0.726 |
T 1, unripe, but already edible, drupes with green and moist hull; T 2, ripe almonds. DLcv, cv Desmajo Largueta; FCcv, cv Filippo Ceo; FEcv, cv Ferragnès; GEcv, cv Genco; MAcv, cv Marcona; THcv, cv Thompson; TUcv, cv Tuono; TEcv, cv Texas; JPcv, cv Johnston Prolific; FRcv, cv Francolì. Bold values indicate significant differences at P < 0.05.
Considering the effect of harvest time, eight out of ten cultivars showed significant differences between T 1 and T 2. In particular, six cultivars showed a significant increase during ripening, probably as a consequence of the incomplete biosynthesis of phenolic compounds in unripe green almonds. Two cultivars (MAcv and JPcv), on the contrary, showed a significant decrease of the total phenolic compounds during ripening, while for DLcv and TEcv the variation observed during ripening was not significant.
The antioxidant activity was significantly correlated with the total phenolic content (R = 0.9306 and 0.9408 at T 1 and T 2 respectively). Also, the antioxidant activity varied greatly among cultivars, in particular at T 2, when the lowest value accounted for 12.69 μmol Trolox equivalents per gram for MAcv and the highest value, observed in FRcv and GEcv, was five times higher.
With the exception of MAcv, JPcv, and TEcv, the antioxidant activity at T 2 was significantly higher than at T 1. Even for this parameter, MAcv showed a peculiar behavior, with a significant decrease during ripening. The differences in the content of total phenolic compounds and antioxidant activity observed among cultivars could be due to several factors, such as genetic influence and harvest year, as reported by numerous workers.7, 20, 59 Furthermore, total phenolic compounds and antioxidant activity were influenced by harvest time.
CONCLUSIONS
In this study, the influence of harvest time and cultivar on the chemical composition of almonds was evaluated considering ten cultivars grown in the same orchard. Harvest time significantly influenced the chemical composition of almonds, showing an increase of the lipid content, and, at the same time, a decrease in carbohydrates and protein content. Ash content remained constant during ripening.
The fatty acid composition was also affected by harvest time, showing no univocal behavior among the cultivars and then pointing out a strong varietal influence.
A great variability of antioxidant activity and content of total phenolic compounds was found among the ten cultivars considered, pointing out the strong influence of the genotype. These parameters tended to increase with harvest time, suggesting that the synthesis of antioxidant compounds also occurred in the last stage of ripening.
Data variability, also considering the influence of kernel weight, suggests that each cultivar has a particular attitude to different purposes. Lower lipid content and higher levels of phenolic compounds could positively influence the shelf‐life, by limiting the oxidative process during almond storage.
Moreover, in this study we also carried out a nutritional characterization of unripe almonds. Owing to lower lipid content and higher moisture content, they show a markedly lower energy value than fully ripe fruits.
Unripe almonds are a valuable niche product. Owing to their very low shelf‐life, unripe almonds are traditionally consumed fresh in the producing area during a very short period of the year when they are naturally available. However, unripe almonds could be stored frozen and then marketed all the year round and far beyond the area of production, fulfilling the expectation of consumers aware of the relation between healthy diet and well‐being.
REFERENCES
- 1. Nanos GD, Kazantzisb I, Kefalas P, Petrakisb C and Stavroulakisc G, Irrigation and harvest time affect almond kernel quality and composition. Sci Hortic 96:249–256 (2002). [Google Scholar]
- 2. Piscopo A, Romeo FV, Petrovicova B and Poiana M, Effect of harvest time on kernel quality of several almond varieties (Prunus dulcis (Mill.) DA Webb). Sci Hortic 125:41–46 (2010). [Google Scholar]
- 3. De Giorgio D, Leo L, Zacheo G and Lamascese N, Evaluation of 52 almond (Prunus amygdalus Batsch) cultivars from the Apulia region in southern Italy. J Hortic Sci Biotechnol 82:541–546 (2007). [Google Scholar]
- 4. Bolling BW, Almond polyphenols: methods of analysis, contribution to food quality, and health promotion. Compr Rev Food Sci Food Saf 16:346–368 (2017). [DOI] [PubMed] [Google Scholar]
- 5. Yada S, Lapsley K and Huang G, A review of composition studies of cultivated almonds: macronutrients and micronutrients. J Food Compos Anal 24:469–480 (2011). [Google Scholar]
- 6. Takeoka GR and Dao LT, Antioxidant constituents of almond (Prunus dulcis (Mill.) DA Webb) hulls. J Agric Food Chem 51:496–501 (2003). [DOI] [PubMed] [Google Scholar]
- 7. Bolling BW, Dolnikowski G, Blumberg JB and Chen CO, Polyphenol content and antioxidant activity of California almonds depend on cultivar and harvest year. Food Chem 122:819–825 (2010). [DOI] [PMC free article] [PubMed] [Google Scholar]
- 8. Kodad O, Alonso JM, Espiau MT, Estopañan G, Juan T and Socias i Company R , Chemometric characterization of almond germplasm: compositional aspects involved in quality and breeding. J Am Soc Hortic Sci 136:273–281 (2011). [Google Scholar]
- 9. Maestri D, Martínez M, Bodoira R, Rossi Y, Oviedo A, Pierantozzi P et al, Variability in almond oil chemical traits from traditional cultivars and native genetic resources from Argentina. Food Chem 170:56–61 (2015). [DOI] [PubMed] [Google Scholar]
- 10. Abdallah A, Ahumada MH and Gradziel TM, Oil content and fatty acid composition of almond kernels from different genotypes and California production regions. J Am Soc Hortic Sci 123:1029–1033 (1998). [Google Scholar]
- 11. Kodad O, Estopañán G, Juan T and Socias i Company R , Protein content and oil composition of almond from Moroccan seedlings: genetic diversity, oil quality and geographical origin. J Am Oil Chem Soc 90:243–252 (2013). [Google Scholar]
- 12. Yada S, Guangwei H and Lapsley H, Natural variability in the nutrient composition of California‐grown almonds. J Food Compos Anal 30:80–85 (2013). [Google Scholar]
- 13. Berger J, Bravay G and Berger M, Almond milk preparation process and products obtained. US Patent 5656321 A (1997).
- 14. Bernat N, Cháfer M, Chiralt A, Laparra JM and González‐Martínez C, Almond milk fermented with different potentially probiotic bacteria improves iron uptake by intestinal epithelial (Caco‐2) cells. Int J Food Stud 4:49–60 (2015). [Google Scholar]
- 15. Matsunobu A, Horishita S and Yamada T, Almond nut paste for beverages and desserts. US Patent 4639374 A (1987).
- 16. Salpietro CD, Gangemi S, Briuglia S, Meo A, Merlino MV, Muscolino G et al, The almond milk: a new approach to the management of cow‐milk allergy/intolerance in infants. Minerva Pediatr 57:173–180 (2005). [PubMed] [Google Scholar]
- 17. Fasoli E, D'Amato A, Kravchuk AV, Citterio A and Righetti PG, In‐depth proteomic analysis of non‐alcoholic beverages with peptide ligand libraries. I: almond milk and orgeat syrup. J Proteomics 74:1080–1090 (2011). [DOI] [PubMed] [Google Scholar]
- 18. Li SC, Liu YH, Liu JF, Chang WH, Chen CM and Chen CY, Almond consumption improved glycemic control and lipid profiles in patients with type 2 diabetes mellitus. Metabolism 60:474–479 (2011). [DOI] [PubMed] [Google Scholar]
- 19. Jambazian PR, Haddad E, Rajaram S, Tanzman J and Sabaté J, Almonds in the diet simultaneously improve plasma α‐tocopherol concentrations and reduce plasma lipids. J Am Diet Assoc 105:449–454 (2005). [DOI] [PubMed] [Google Scholar]
- 20. Monagas M, Garrido I, Lebron‐Aguilar R, Bartolome B and Gomez‐Cordoves C, Almond [Prunus dulcis (Mill.) D.A. Webb] skins as a potential source of bioactive polyphenols. J Agric Food Chem 55:8498–8507 (2007). [DOI] [PubMed] [Google Scholar]
- 21. Pasqualone A, Laddomada B, Spina A, Todaro A, Guzmàn C, Summo C et al, Almond by‐products: extraction and characterization of phenolic compounds and evaluation of their potential use in composite dough with wheat flour. LWT – Food Sci Technol 89:299–306 (2018). [Google Scholar]
- 22. Cherif A, Sabei K, Boukhchina S, Habib K, Belkacemi K and Arul J, Kernel fatty acid and triacylglycerol composition for three almond cultivars during maturation. J Am Oil Chem Soc 81:901–905 (2004). [Google Scholar]
- 23. Hawker JS and Buttrose MS, Development of the almond nut (Prunus dulcis (Mill.) DA Webb). Anatomy and chemical composition of fruit parts from anthesis to maturity. Ann Bot 46:313–321 (1980). [Google Scholar]
- 24. Soler L, Cañellas J and Saura‐Calixto F, Changes in carbohydrate and protein content and composition of developing almond seeds. J Agric Food Chem 37:1400–1404 (1989). [Google Scholar]
- 25. Egea G, Gonzáles‐Real MM, Baille A, Nortes PA, Sánchez‐Bel P and Domingo R, The effects of contrasted deficit irrigation strategies on the fruits growth and kernel quality of mature almond trees. Agric Water Manag 96:1605–1614 (2009). [Google Scholar]
- 26. Wirthensohn MG and Sedgley M, Almond breeding in Australia. Acta Hortic 591:245–248 (2002). [Google Scholar]
- 27. Socias i Company R , Kodad O, Alonso JM, Espada JL, Chomé P and Martínez‐Treceno A, The Introduction of New Almond Varieties in Spanish Almond Orchards FAO–CIHEAM – Nucis‐Newsletter 15, pp. 14–17 (2011).
- 28. Sottile F, Barone E, Barbera G and Palasciano M, The Italian almond industry: new perspectives and ancient tradition. Acta Hortic 1028:401–407 (2014). [Google Scholar]
- 29. Asai WK, Micke WC, Kester DE and Rough D, The evaluation and selection of current varieties, in Almond Production Manual, ed. by Micke WC. University of California, Division of Agriculture and Natural Resources, Publ. 3364, Berkeley, CA, pp. 52–60 (1996). [Google Scholar]
- 30. Dicenta F, Sánchez‐Pérez R, Rubio M, Egea J, Batlle I, Miarnau X et al, The origin of the self‐compatible almond ‘Guara’. Sci Hortic 197:1–4 (2015). [Google Scholar]
- 31. Hartmann HT, Kester DE, Davies FT and Geneve RL, Propagation methods and rootstocks for fruit and nut species, in Plant Propagation: Principles and Practices. Prentice Hall, Englewood Cliffs, NJ, pp. 739–740 (2002). [Google Scholar]
- 32. Camposeo S, Palasciano M, Vivaldi GA and Godini A, Effect of increasing climatic water deficit on some leaf and stomatal parameters of wild and cultivated almonds under Mediterranean conditions. Sci Hortic 127:234–241 (2011). [Google Scholar]
- 33. Felipe A, Stadi fenologici del mandorlo, in Proceedings of 3rd GREMPA Colloquium, 3–8 October 1977, Valenzano, Bari, Italy. Edizioni Quadrifoglio, Bari, 1997; 101–103.
- 34. AACC , 2003 AACC Approved Methods of the American Association of Cereal Chemistry, 10th edn. AACC, St. Paul, MN: (2003). [Google Scholar]
- 35. AOAC , Official Method 948.22 Official Methods of Analysis of Official Analytical Chemists, 16th edn. AOAC International, Arlington, VA: (1995). [Google Scholar]
- 36. Merrill AL and Watt BK, Energy Value of Foods: Basis and Derivation. Agriculture Handbook No. 74 US Government Printing Office, Washington, DC: (1973). [Google Scholar]
- 37. AOCS , Official Methods and Recommended Practices of the American Oil Chemists' Society, 4th edn. AOCS Press, Champaign, IL: (1993). [Google Scholar]
- 38. Summo C, Centomani I, Paradiso VM, Caponio F and Pasqualone A, The effects of the type of cereal on the chemical and textural properties and on the consumer acceptance of pre‐cooked, legume‐based burgers. LWT – Food Sci Technol 65:290–296 (2016). [Google Scholar]
- 39. Cosmai L, Caponio F, Pasqualone A, Paradiso VM and Summo C, Evolution of the oxidative stability, bio‐active compounds and color characteristics of non‐thermally treated vegetable pâtés during frozen storage. J Sci Food Agric 97:4904–4911 (2017). [DOI] [PubMed] [Google Scholar]
- 40. Singleton VL and Rossi JA, Colorimetric of total phenolics with phosphomolybdic–phosphotungstic acid reagents. Am J Eno Viticult 16:144–158 (1965). [Google Scholar]
- 41. Salcedo CL, Lόpez de Mishima BA and Nazareno AM, Walnuts and almond as model system of foods constituited by oxidisable, pro‐oxidant and antioxidant factors. Food Res Int 43:1187–1197 (2010). [Google Scholar]
- 42. Sathe SK, Seeram NP, Kshirsagar HH, Heber D and Lapsley KA, Fatty acid composition of California grown almonds. J Food Sci 73:607–614 (2008). [DOI] [PubMed] [Google Scholar]
- 43. Ros E, Health benefits of nut consumption. Nutrients 2:652–682 (2010). [DOI] [PMC free article] [PubMed] [Google Scholar]
- 44. Gillingham LG, Harris‐Janz S and Jones PJ, Dietary monounsaturated fatty acids are protective against metabolic syndrome and cardiovascular disease risk factors. Lipids 46:209–228 (2011). [DOI] [PubMed] [Google Scholar]
- 45. Rajaram S, Connell KM and Sabaté J, Effect of almond‐enriched high‐monounsaturated fat diet on selected markers of inflammation: a randomised, controlled, crossover study. Br J Nutr 103:907–912 (2010). [DOI] [PubMed] [Google Scholar]
- 46. Giarnetti M, Paradiso VM, Caponio F, Summo C and Pasqualone A, Fat replacement in shortbread cookies using an emulsion filled gel based on inulin and extra virgin olive oil. LWT – Food Sci Technol 63:339–345 (2015). [Google Scholar]
- 47. Tey SL, Delahunty C, Gray A, Chisholm A and Brown RC, Effects of regular consumption of different forms of almonds and hazelnuts on acceptance and blood lipids. Eur J Clin Nutr 54:483–487 (2015). [DOI] [PubMed] [Google Scholar]
- 48. Sabaté J, Bell HE and Fraser GE, Nut composition and coronary heart disease risk, in Lipids in Human Nutrition, ed. by Spiller GA. CRC Press, Boca Raton, FL, pp. 145–152 (1996). [Google Scholar]
- 49. Sabaté J and Hook DG, Almonds, walnuts and serum lipids, in Lipids in Human Nutrition, ed. by Spiller GA. CRC Press, Boca Raton, FL, pp. 137–144 (1996). [Google Scholar]
- 50. Lovejoy JC, Most MM, Lefevre M, Greenway FL and Rood JC, Effect of diets enriched in almonds on insulin action and serum lipids in adults with normal glucose tolerance or type 2 diabetes. Am J Clin Nutr 76:1000–1006 (2002). [DOI] [PubMed] [Google Scholar]
- 51. Čolić SD, Fotirić Akšić MM, Lazarević KB, Zec GN, Gašić UM, Dabić Zagorac DČ et al, Fatty acid and phenolic profiles of almond grown in Serbia. Food Chem 234:455–463 (2017). [DOI] [PubMed] [Google Scholar]
- 52. Kornsteiner M, Wagner KH and Elmadfa I, Tocopherols and total phenolics in 10 different nut types. Food Chem 98:381–387 (2006). [Google Scholar]
- 53. Mandalari G, Bisignano C, Genovese T, Mazzon E, Wickham MS, Paterniti I et al, Natural almond skin reduced oxidative stress and inflammation in an experimental model of inflammatory bowel disease. Int Immunopharmacol 11:915–924 (2011). [DOI] [PubMed] [Google Scholar]
- 54. Chen CY and Blumberg JB, In vitro activity of almond skin polyphenols for scavenging free radicals and inducing quinone reductase. J Agric Food Chem 56:4427–4434 (2008). [DOI] [PubMed] [Google Scholar]
- 55. Han M, Song P, Huang C, Rezaei A, Farrar S, Brown MA et al, Dietary grape seed proanthocyanidins (GSPs) improve weaned intestinal microbiota and mucosal barrier using a piglet model. Oncotarget 7:80313–80326 (2016). [DOI] [PMC free article] [PubMed] [Google Scholar]
- 56. Fan P, Tan Y, Jin K, Lin C, Xia S, Han B et al, Supplemental lipoic acid relieves post‐weaning diarrhoea by decreasing intestinal permeability in rats. J Anim Physiol Anim Nutr (Berl) 101:136–146 (2017). [DOI] [PubMed] [Google Scholar]
- 57. Diella G, Di Ciaula A, Lorusso MP, Summo C, Caggiano G, Caponio F et al, Distinct effects of two almond cultivars on agreeability and gastrointestinal motility in healthy subjects: more than mere nutraceuticals. J Gastrointestin Liver Dis 27:31–39 (2018). [DOI] [PubMed] [Google Scholar]
- 58. Lanza CM, Mazzaglia A, Paladino R, Auditore L, Barnà RC, Loria D et al, Characterization of peeled and unpeeled almond (Prunus amygdalus) flour after electron beam processing. Radiat Phys Chem 86:140–144 (2013). [Google Scholar]
- 59. Milbury PE, Chen CY, Dolnikowski GG and Blumberg JB, Determination of flavonoids and phenolics and their distribution in almonds. J Agric Food Chem 54:5027–5033 (2006). [DOI] [PubMed] [Google Scholar]