Abstract
目的
明确新型冠状病毒肺炎(COVID-19)患者从发病到治愈的胸部CT表现动态变化。
方法
回顾性分析我院收治的6例确诊COVID-19患者的临床及胸部CT表现。6例患者从入院到治愈出院进行胸部CT检查共计30次, 以发病到治愈的时间及发病到每次CT检查的时间, 将胸部CT检查分为4期, 一期:0~4 d; 二期:5~9 d; 三期10~14 d; 四期: > 14 d。同时采用半定量评分法对CT各期肺叶病变累及程度进行CT评分。比较各期胸部CT征象及CT上肺损伤程度的差别。
结果
病程早期(一期), 病变多呈胸膜下分布的磨玻璃密度, CT评分最低(4.00±0.40分); 随着时间的推移, 病变密度逐渐升高呈混合密度(铺路石样改变)并出现实变(二期), CT评分达到峰值(7.38±3.34分), 一期与二期CT评分差异有统计学意义(P < 0.05)。三期实变范围扩大, 病变内出现索条灶, CT评分为6.86±2.91分; 发病14 d后(四期), 病变密度以混合型为主, 实变范围较前缩小, 同时伴有多的索条灶形成, CT评分为6.21±1.56分。三~四期肺损伤CT评分中, 下肺叶评分高于中上肺叶(P < 0.05)。
结论
胸部CT检查可以动态观察不同时期病变的分布、密度和范围, 反映病变随病程的变化规律, 以更好地指导临床治疗。
Keywords: COVID-19; 体层摄影术, X线计算机; 动态变化
Abstract
Objective
To define chest CT findings and their dynamic changes in patients with coronavirus disease 2019 (COVID-19) from disease onset to the cure.
Method
We analyzed the clinical and chest CT data of 6 patients with RT-PCR-confirmed COVID-19. According to the time from the disease onset to the cure or from the onset to each CT scan, the total of 30 chest CT scans were divided into 4 stages, namely stage 1 (0-4 days), stage 2 (5-9 days), stage 3 (10-14 days), and stage 4 (over 14 days). A semi-quantitative scoring system was used to quantitatively assess the pulmonary involvement on the basis of the involved area. The differences in chest CT signs and the lung injury scores based on CT findings were compared among the 4 stages.
Results
In stage 1, ground-glass opacities (GGO) was found frequently in the subpleura, and the CT score was the lowest at 4.00±0.40. Stage 2 was characterized by an increased and mixed density (crazy-paving pattern) with mild consolidation of the lungs, and the CT score reached its peak level of 7.38±3.34 (P < 0.05). In stage 3, an expanded range of consolidation and linear lesions were found in the lungs, and the total CT score averaged 6.86±2.91. In stage 4, a gradual resolution of the consolidation occurred with more linear lesions in the lungs, and the total CT score was 6.21±1.56. The CT scores of the lower lobes were significantly higher compared with those of the middle/upper lobes (P < 0.05) in stage 3 and stage 4.
Conclusion
Chest CT scans allows dynamic monitoring of the changes in the distribution, density and extent of the pulmonary lesions in the 4 stages, which are closely correlated with the evolution of the disease course of COVID-19.
Keywords: coronavirus disease 2019; tomography, X-ray computed; dynamic change
2019年12月以来, 一种新型冠状病毒肺炎(COVID-19)已构成全球范围内的流行病威胁, 其传染性强, 蔓延速度快, 短期内给人民健康和国家经济造成巨大损害, 因此早期诊断并及时隔离和治疗对患者的预后及控制疫情至关重要。胸部CT检查具有及时、快捷、阳性率高的特点, 在患者排查中可起到重要的辅助诊断作用, 且已有研究证实CT检查较核酸检测具有更高的敏感性[1-4]。然而, 在COVID-19临床诊治中出现了临床表现、核酸检测和影像学表现不一致的病例, 推测可能与患者就诊的时间处在疾病的不同发展阶段有关,因此,正确认识COVID-19患者胸部CT表现的动态演变规律对于指导临床诊治有着重要价值。本研究参考已有分析方法[5],回顾性分析我院收治的6例COVID-19确诊患者的临床和30次胸部CT扫描影像资料,以患者发病到治愈的时间为基础,根据发病到每次胸部CT检查时间间隔,将所有胸部CT检查进行分期,旨在明确其CT动态变化的特点,定性及定量评估了胸部CT表现随病程变化的关系,更好地指导临床医生对COVID-19的诊治。
1. 资料和方法
1.1. 临床资料
回顾性分析2020年1月27日~2月26日于西安交通大学第二附属医院收治的6例确诊COVID-19患者的资料,包括临床表现、实验室检查及胸部CT表现。诊断及治愈出院标准符合国家卫生健康委员会《新型冠状病毒肺炎诊疗方案(试行第七版)》[6]。其中男性4例,女性2例,年龄17~56岁(41.83±13.61岁)
1.2. CT扫描图像及分析方法
采用美国GE LightSpeed VCT螺旋CT或德国Siemens Somation Definition AS128 CT扫描仪。患者采用仰卧位, 头先进, 屏气方式进行扫描。CT扫描参数:管电压为100~120 kV, 管电流分别为150 mA和自适应管电流(CARE Dose 4D), 螺距:0.98 mm, 矩阵512×512, 层厚5.0 mm, 视野350 mm×350 mm, 行多平面重建, 重建层厚为1.25mm。肺部标准窗(窗宽1500HU, 窗位-500 HU), 纵隔窗(窗宽350 HU, 窗位50 HU)。
以患者发病到治愈的时间为基础, 统计每位患者从发病到每次CT检查的时间间隔, 对患者的所有CT影像进行分期[3]:一期(0~4 d); 二期(5~9 d); 三期(10~14 d)和四期(> 14 d); 分别记录各期病变CT表现包括[7]:(1)部位:单肺、双肺、肺叶; (2)分布:周边、中心、周边及中心同时受累; (3)病变密度:磨玻璃、实变、混合型; (4)有无纵隔淋巴结肿大及胸腔积液; (4)肺损伤CT评分。采用半定量评分法分别对各肺叶病变累及程度进行CT评分[3-4]:各肺叶的评分范围为0~4分, 0分:未累及; 1分:轻微受累; 2分:轻度受累; 3分:中度受累; 4分:重度受累。其中, 未累及定为肺叶内未见确切病灶; 轻微受累定为病变累及肺叶面积的1%~25 %; 轻度受累定为病变累及肺叶面积的26%~50%;中度受累定为病变累及肺叶面积的51%~75%;重度受累定为病变累及肺叶面积的76%~100%。肺损伤CT总评分即为各肺叶损伤分值之和(范围:0~20分)。
CT检查图象分别由两位专业的放射科医师(工作时间 > 3年)通过医学影像信息系统(Vue PACS, version 11.3.5.8902, Carestream Health, Canada)阅览, 详细记录不同时期的CT表现和肺损伤CT评分, 并对患者的影像学进展情况进行判读, 意见不一致时由第3位放射科医师进行综合判断、评估后得出结论。
1.3. 统计学分析
应用IBM SPSS 21.0软件进行统计处理, 定性资料用频数及构成比表示, 定量资料采用均数±标准差表示。对各期肺损伤及每期各肺叶损伤CT评分进行Wilcoxon秩和检验分析, P < 0.05为差异具有统计学意义。
2. 结果
2.1. 临床资料分析
本组6例确诊COVID-19患者(男4例, 女2例), 年龄17~56岁(41.83±13.61岁)。根据国家卫生健康委员会《新型冠状病毒肺炎诊疗方案(试行第七版)》中临床分型标准[6]:6例患者中1例患者静息状态下, 氧饱和度(SaO2)≤93%(89%), 属于重型, 余均属于普通型。本组患者临床症状主要以发热(6例, 100%)和咳嗽(4例, 66.67%)为主, 其中发热以中低热为主(5例, 83.33%), 重型患者伴有高热。实验室检查中:3例患者(50%)白细胞计数正常, 2例患者(33.33%)白细胞计数降低; 6例患者淋巴细胞及嗜酸性粒细胞计数均减低, 6例患者C反应蛋白(CRP)均升高(表 1)。
1.
6例确诊COVID-19患者的临床资料
Clinical data of the 6 confirmed cases of COVID-19
| Clinical data | n(%) |
| Gender: Male | 4 (66.67) |
| Female | 2 (33.33) |
| Fever: Low grade fever (37.3-38 ℃) | 3 (50.00) |
| Moderate grade fever (38.1-39 ℃) | 2 (33.33) |
| High grade fever (> 39 ℃) | 1 (16.67) |
| Cough | 4 (66.67) |
| Shortness of breath | 2 (33.33) |
| Fatigue | 1 (16.67) |
| Chills | 1 (16.67) |
| Myalgia | 2 (33.33) |
| Leucocytes (×109/L) | |
| Normal | 3 (50.00) |
| Decrease | 2 (33.33) |
| Increase | 1 (16.67) |
| Lymphocytes (×109/L): decrease | 6 (100.00) |
| Eosnophils (×109/L): decrease | 6 (100.00) |
| C-reactive protein (mg/L): Increase | 6 (100.00) |
| Time from onset of initial symptoms to first scan (day, Mean±SD) | 6.00±2.00 |
| Number of scans (Mean±SD) | 5.00±1.10 |
| Interval between the adjacent scans (day, Mean±SD) | 3.38±1.06 |
| Hospitalized period (day, Mean±SD) | 14.67±4.32 |
| Period between onset of initial symptoms to discharge (day, Mean±SD) | 23.67±6.19 |
2.2. 胸部CT表现评估
2.2.1. 胸部CT检查分期
6例患者从发病到首次CT检查时间间隔6.00±2.00(3~8)d, 每连续2次CT检查之间间隔3.38±1.06(2~7)d, 共进行了30次CT扫描, 5.00±1.10次/人(4~7次), 住院时间14.67 ± 4.32(10~21)d, 发病至治愈时间间隔23.67±6.19(17~33)d。以患者发病到治愈的时间为基础, 根据发病到每次CT检查时间间隔, 将30次CT检查分为四期, 其中, 一期2次, 二期8次, 三期10次, 四期10次。
2.2.2. 各期病变分布及影像特征
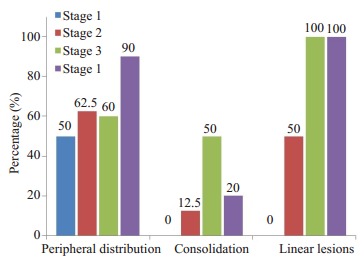
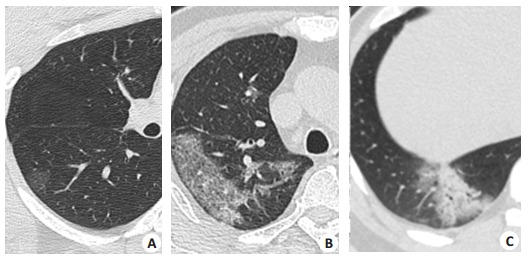
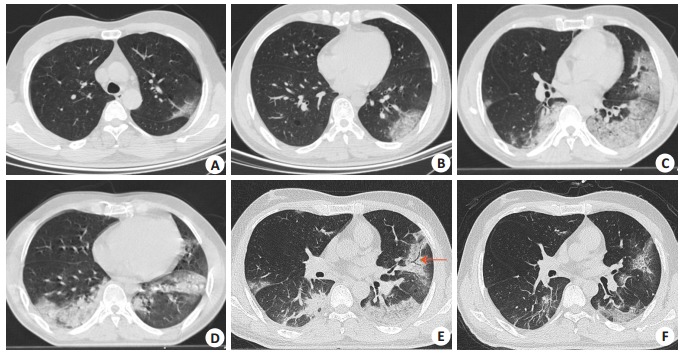
6例患者的所有胸部CT检查均有异常(表 2), 其中, 双侧肺受累在各期中均常见(一期、三期、四期:100.00%, 二期:87.50%); 病变以周边分布(胸膜下分布)为主(一期:50.00%, 二期:62.50%, 三期:60.00%, 四期:90.00%), 四期中更为常见(图 1)。各期病变以磨玻璃、实变、混合型密度(铺路石样改变)为主(图 2); 其中, 各期病变呈混合性密度均较常见; 与二~四期比较, 一期中磨玻璃密度更为常见(50.00%); 与一期相比较, 病变呈实变密度在二~四期出现, 其中三期范围最大(50.00%); 索条灶较多出现在二~四期的CT影像中, 其中三~四期比重最大(100.00%)(图 1, 3)。6例患者均未出现胸腔积液及纵隔淋巴结肿大。
2.
不同时期病变CT表现
Chest CT findings of the lesions in the 4 stages (n, %)
| CT findings (n=30) | Stage 1 (n=2) | Stage 2 (n=8) | Stage 3 (n=10) | Stage 4 (n=10) |
| GGO: Ground-glass opacities. | ||||
| Involvement | ||||
| Single | 0 (0.00) | 1 (12.50) | 0 (0.00) | 0 (0.00) |
| Bilateral | 2(100.00) | 7 (87.50) | 10(100.00) | 10(100.00) |
| Distribution | ||||
| Peripheral | 1 (50.00) | 5 (62.50) | 6 (60.00) | 9 (90.00) |
| Central | 0 (0.00) | 0 (0.00) | 0 (0.00) | 0 (0.00) |
| Ccntral+periphcral | 1 (50.00) | 3 (37.50) | 4 (40.00) | 1 (10.00) |
| Density | ||||
| GGO | 1 (50.00) | 1 (12.50) | 2 (20.00) | 2 (20.00) |
| Consolidation | 0 (0.00) | 1 (12.50) | 5 (50.00) | 2 (20.00) |
| Crazy-paving pattern | 1 (50.00) | 6 (75.()0) | 3 (30.00) | 6 (60.00) |
| Linear lesions | 0 (0.00) | 4 (50.00) | 10(100.00) | 10(100.00) |
1.

不同时期病变CT表现变化趋势
Changes in CT findings of the lesions at different stages.
2.

病变密度的CT表现
CT finding of the lesion density. A: Ground-glass opacities; B: Crazy-paving pattern(GGO with superimposed inter- and intralobular septal thickening); C: Consolidation.
3.

一例患者不同时期的CT动态图像
CT images of a patient in the 4 stages. A: GGO; B: crazy-paving pattern density of lesions in stage 1; C-D: In stage 2, chest CT images showed progression in the extent and density of the lesions, and consolidation can be seen; E: In stage 3, follow-up CT scan showed multiple consolidation foci in the bilateral lungs and air bronchogram sign in the lingular segment of left upper lung lobe (red arrow). There were linear lesions in the right lower lung lobe; F: CT scan obtained in the stage-4 showing gradual resolution of the consolidation and appearance of more linear lesions. The crazy-paving pattern was the main density.
2.2.3. 各期肺损伤CT评分
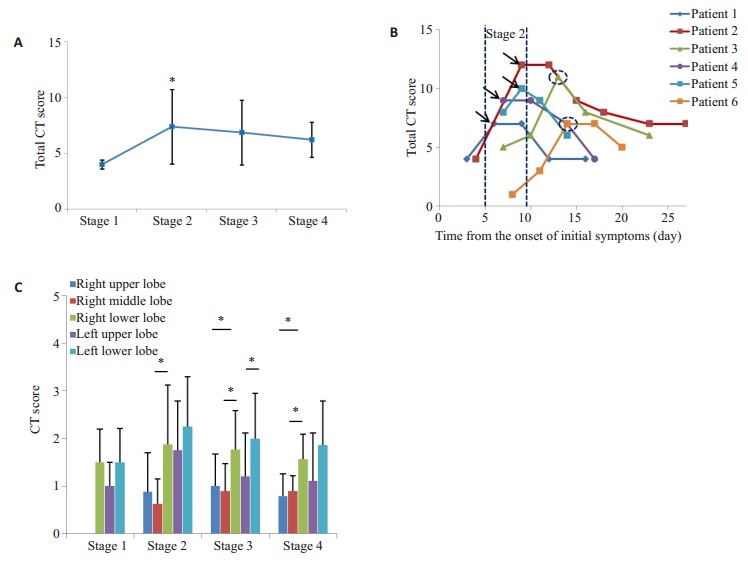
各期CT检查中, 肺损伤CT总评分(图 4A):一期最低(4.00±0.40分), 在二期中达到峰值(7.38±3.34分), 差异有统计学意义(P < 0.05, 表 3)。每例患者的CT总评分动态变化显示(图 4B):4例患者CT总评分均在二期中达到峰值, 2例患者在三期中达到峰值。在各期肺叶损伤CT评分中, 下肺叶损伤评分均较中上肺叶损伤评分高(表 3)。二期右肺下叶评分与中叶评分、三期左肺下叶评分与左肺上叶评分、三~四期右肺下叶评分与右肺上叶评分、右肺下叶评分与右肺中叶评分的差异均具有统计学意义(P < 0.05, 图 4C)。
4.

不同时期肺损伤CT评分
CT scores in different stages. A: Total CT score of pulmonary involvement in the 4 stages (*P < 0.05, Stage-1 vs Stage-2); B: Dynamic changes of total CT score from the onset of initial symptoms to discharge of the 6 patients. The total CT scores of 4 patients were in stage 2 (black arrow), and the other 2 in stage 3 (dashed circles); C: CT score of each lung lobe in the 4 stages (*P < 0.05).
3.
不同时期肺损伤CT评分
CT scores of pulmonary involvement in the 4 stages (Mean±SD)
| CT scores | Stage 1 (n=2) | Stage 2 (n=8) | Stage 3 (n=10) | Stage 4 (n=10) |
| aP < 0.05, left lower lobe vs left upper lobe; bP < 0.05, right lower lobe vs right upper lobe; cP < 0.05, right lower lobe vs right middle lobe; d Wilcoxon test showed significant difference between Stage-1 and Stage-2 (Z=-2.63, P=0.02). | ||||
| Total CT score | 4.00±0.40 | 7.38±3.34d | 6.86±2.91 | 6.21±1.56 |
| Number of involved lobes | 3.00±0.00 | 4.00±1.51 | 4.30±1.16 | 4.30±0.95 |
| Right upper lobe | 0.00±0.00 | 0.88±0.83 | 1.00±0.67 | 0.79±0.46 |
| Right middle lobe | 0.00±0.00 | 0.63±0.52 | 0.90±0.57 | 0.89±0.33 |
| Right lower lobe | 1.50±0.70 | 1.88±1.25 | 1.77±0.82 | 1.56±0.53 |
| Left upper lobe | 1.00±0.50 | 1.75±1.04 | 1.20±0.92 | 1.11±1.00 |
| Left lower lobe | 1.50±0.71 | 2.25±1.04 | 1.99±0.95 | 1.86±0.93 |
| Z | -0.82a/-1.64b/-2.05c | -2.32a/-2.50b/-2.82c | -1.52a/-2.59b/-2.03c | |
| P | 0.41a/0.10b/0.04c | 0.02a/0.01b/0.01c | 0.13a/ 0.01b/0.04c | |
3. 讨论
国家卫生健康委员会发布的《新型冠状病毒肺炎诊疗方案(试行第七版)》中将病毒核酸检测、基因测序以及病毒抗体血清学检测定为确诊COVID-19的金标准手段[6]。其中, 核酸检测、基因测序耗时较长, 假阴性率高[1-3], 往往不能及时对COVID-19进行确切诊断; 而病毒血清学检测作为一种新提出的确诊手段, 其特异性及敏感性有待进一步临床试验。与此同时, 胸部CT检查耗时短, 灵敏度高[8], 是目前COVID-19筛选、诊断及评估病程转归的常规辅助检查手段。本文收集了6例确诊COVID-19患者的临床和30次胸部CT扫描影像资料, 以患者发病到治愈的时间为基础, 根据发病到每次胸部CT检查时间间隔, 将30次胸部CT检查归为四期, 对每期CT表现分别进行动态分析、评估, 总结归纳。
本研究显示, 6例患者均以发热及咳嗽为主要临床表现, 其中发热以低热为主, 部分患者体温在中低热范围波动, 高热见于重型患者。实验室检测指标中, 白细胞计数正常或降低, 其中重型患者白细胞计数升高, 与此同时这位患者的中性粒细胞计数(10.04×10⁹/L; 正常范围:1.8~6.3×10⁹/L)也升高, 考虑患者可能合并了细菌感染; 所有患者的淋巴细胞及嗜酸性粒细胞计数普遍降低, CRP普遍升高, 符合一般病毒性感染的血象特征[7]。类比SARS, 推测淋巴细胞及嗜酸性粒细胞计数降低与病毒损伤机体免疫器官相关[9-10]。
本研究分析6例患者的30次胸部CT扫描影像表现, 病变均表现为周边(胸膜下)及肺下叶分布为主的磨玻璃密度、混合型及实变密度, 这与肺损伤CT评分下肺叶评分高于中上肺叶结果一致。病变分布特点可能与病毒主要定植于下呼吸道的细支气管与肺泡上皮细胞有关[11]。病程早期(一期), 病变多呈胸膜下分布的磨玻璃密度, CT评分最低; 随着时间的推移, 病变密度逐渐升高呈混合密度(铺路石样改变)及出现实变(二期), CT评分达到峰值, 说明病变累及范围扩大, 疾病处于进展期, 这与6例患者中4例CT评分均在二期达到峰值一致; 发病10~14 d后, 病变实变密度范围扩大, 并出现较多索条灶, CT评分略有降低, 推测与病变部分吸收有关; 发病14 d后, 病变密度以混合型密度为主, 实变密度较前减少, 同时伴有多的索条灶形成, CT评分较前降低, 说明病变处于吸收期, 此时所有患者均于此期好转出院。
胸部CT影像征像与病理显示, COVID-19病理特征与SARS和中东呼吸综合征(MERS)冠状病毒引起的病理特征非常类似[10, 12-13], 且目前已有病理解剖证实COVID-19的CT表现形成主要与深部气道和肺泡的炎性损伤有关[14]。病程早期, 病毒主要引起肺间质(肺泡间隔、小叶间隔、胸膜下及支气管肺动脉鞘)为主的炎性渗出、水肿, CT上表现为磨玻璃密度; 随着病程进展, 渗出加重, 病变内增厚的小叶间隔及小叶内间隔线影叠加在磨玻璃样不透明背景下形成CT上典型的铺路石样改变, 即混合型密度。病程中晚期, 肺泡腔中出现细胞性纤维黏液样机化渗出[10-14], 病变密度增高, CT表现为在铺路石样改变基础上合并实变。与此同时, 索条灶形成逐渐增多。但通过随访部分患者出院恢复期胸部CT表现发现索条灶部分吸收。类比SARS、MERS及COVID-19已有的病理研究[10, 12-15], 提示其可能为病变累及肺泡囊及肺泡壁的间质后形成, 而不是肺组织的纤维化。对于其具体的病理学改变, 有待于进一步的病理及影像学对照研究来证实。
本研究存在以下局限性:总体样本量较少, COVID-19患者临床分型以轻型为主, 未能按疾病严重程度进行分类比较; 缺少患者治愈出院后恢复期的随访影像资料。后期将对恢复期患者进行长期影像随访, 评估胸部CT肺内残留病变的演变过程。
综上所述, COVID-19患者不同发病时期的胸部CT表现及肺损伤CT评分具有一定的特征性, 胸部CT检查可以动态反映病程变化的规律, 对COVID-19临床诊断及治疗评估具有重要价值。
Biography
向颖, 硕士, 住院医师, E-mail: yingxiang92@sina.com
Contributor Information
向 颖 (Ying XIANG), Email: yingxiang92@sina.com.
张 秋娟 (Qiujuan ZHANG), Email: zhangqjlcx@aliyun.com.
References
- 1.Tao A, Yang ZL, Hou HY, et al. Correlation of chest CT and RT-PCR testing in coronavirus disease 2019 (COVID-19) in China: a report of 1014 cases. http://cn.bing.com/academic/profile?id=75dacdd44e5dda0149ec532800d839c3&encoded=0&v=paper_preview&mkt=zh-cn. Radiology. 2020;(2):200642–8. doi: 10.1148/radiol.2020200642. [Tao A, Yang ZL, Hou HY, et al. Correlation of chest CT and RT-PCR testing in coronavirus disease 2019 (COVID-19) in China: a report of 1014 cases[J]. Radiology, 2020, (2): 200642-8.] [DOI] [PMC free article] [PubMed] [Google Scholar]
- 2.Fang YC, Zhang HQ, Xie JC, et al. Sensitivity of chest CT for COVID-19: comparison to RT-PCR. http://cn.bing.com/academic/profile?id=3628e86c5f809573c97537dda9e6df80&encoded=0&v=paper_preview&mkt=zh-cn. Radiology. 2020;(2):200432–7. doi: 10.1148/radiol.2020200432. [Fang YC, Zhang HQ, Xie JC, et al. Sensitivity of chest CT for COVID-19: comparison to RT-PCR[J]. Radiology, 2020, (2): 200432-7.] [DOI] [PMC free article] [PubMed] [Google Scholar]
- 3.Xie X, Zhong Z, Zhao W, et al. Chest CT for typical 2019-nCoV pneumonia: relationship to negative RT-PCR testing. http://cn.bing.com/academic/profile?id=4f4e1a67b18e0928523f830c85448c2a&encoded=0&v=paper_preview&mkt=zh-cn. Radiology. 2020;(2):200343–7. doi: 10.1148/radiol.2020200343. [Xie X, Zhong Z, Zhao W, et al. Chest CT for typical 2019-nCoV pneumonia: relationship to negative RT-PCR testing[J]. Radiology, 2020, (2): 200343-7.] [DOI] [PMC free article] [PubMed] [Google Scholar]
- 4.Bernheim A, Mei XY, Huang MQ, et al. Chest CT findings in coronavirus disease-19 (COVID-19): relationship to duration of infection. http://d.old.wanfangdata.com.cn/Periodical/zgddekzz202003007. Radiology. 2020;(2):200463–8. doi: 10.1148/radiol.2020200463. [Bernheim A, Mei XY, Huang MQ, et al. Chest CT findings in coronavirus disease-19 (COVID-19): relationship to duration of infection[J]. Radiology, 2020, (2): 200463-8.] [DOI] [PMC free article] [PubMed] [Google Scholar]
- 5.Feng P, Ye TH, Peng S, et al. Time course of lung changes on chest CT during recovery from 2019 novel coronavirus (COVID-19) pneumonia. http://cn.bing.com/academic/profile?id=03f0183c678c9ff9a35f2a0111b0fc2f&encoded=0&v=paper_preview&mkt=zh-cn. Radiology. 2020;(2):200370–6. [Feng P, Ye TH, Peng S, et al. Time course of lung changes on chest CT during recovery from 2019 novel coronavirus (COVID-19) pneumonia[J]. Radiology, 2020, (2): 200370-6.] [Google Scholar]
- 6.国家卫生健康委员会.国家中医药管理局.新型冠状病毒肺炎诊疗方案试行第七版[EB/OL].2020. <a href="http://www.nhc.gov.cn/yzygj/s7653p/202003/46c9294a7dfe4cef80dc7f5912eb1989.shtml" target="_blank">http://www.nhc.gov.cn/yzygj/s7653p/202003/46c9294a7dfe4cef80dc7f5912eb1989.shtml</a>.
- 7.黄 璐, 韩 瑞, 于 朋鑫, et al. 新型冠状病毒肺炎不同临床分型间CT和临床表现的相关性研究. 中华放射学杂志. 2020;54:1005–201. [黄璐, 韩瑞, 于朋鑫, 等.新型冠状病毒肺炎不同临床分型间CT和临床表现的相关性研究[J].中华放射学杂志, 2020, 54: 1005-201.] [Google Scholar]
- 8.Travis WD, Brambilla E, Noguchi M, et al. International association for the study of lung cancer/American thoracic society/European respiratory society: international multidisciplinary classification of lung adenocarcinoma: executive summary. Proc Am Thorac Soc. 2011;8(5):381–5. doi: 10.1513/pats.201107-042ST. [Travis WD, Brambilla E, Noguchi M, et al. International association for the study of lung cancer/American thoracic society/European respiratory society: international multidisciplinary classification of lung adenocarcinoma: executive summary[J]. Proc Am Thorac Soc, 2011, 8(5): 381-5.] [DOI] [PubMed] [Google Scholar]
- 9.杨 默, 韩 锦伦, 李 桂霞, et al. SARS冠状病毒对血液系统的影响及可能的机制. 中国实验血液学杂志. 2003;11(3):217–21. doi: 10.3969/j.issn.1009-2137.2003.03.001. [杨默, 韩锦伦, 李桂霞, 等. SARS冠状病毒对血液系统的影响及可能的机制[J].中国实验血液学杂志, 2003, 11(3): 217-21.] [DOI] [Google Scholar]
- 10.Xu Z, Lei S, Wang YJ, et al. Pathological findings of COVID-19 associated with acute respiratory distress syndrome. http://cn.bing.com/academic/profile?id=a6351596c7e1294322bbfc8985f05912&encoded=0&v=paper_preview&mkt=zh-cn. Lancet Respir Med. 2020 doi: 10.1016/S2213-2600(20)30076-X. [Xu Z, Lei S, Wang YJ, et al. Pathological findings of COVID-19 associated with acute respiratory distress syndrome[J]. Lancet Respir Med, 2020. https://doi.org/10.1016/S2213-2600(20)30076-X.] [DOI] [PMC free article] [PubMed] [Google Scholar]
- 11.Huang C, Wang Y, Li X, et al. Clinical features of patients infected with 2019 novel coronavirus in Wuhan, China. http://cn.bing.com/academic/profile?id=e5e6e43ac9e6f8e9ccf742ff5ad1095b&encoded=0&v=paper_preview&mkt=zh-cn. Lancet. 2020;(20):30183–5. doi: 10.1016/S0140-6736(20)30183-5. [Huang C, Wang Y, Li X, et al. Clinical features of patients infected with 2019 novel coronavirus in Wuhan, China[J]. Lancet, 2020(20): 30183-5.] [DOI] [PMC free article] [PubMed] [Google Scholar]
- 12.van Brand JM, Haagmans BL, van Riel D, et al. The pathology and pathogenesis of experimental severe acute respiratory syndrome and influenza in animal models. J Comp Pathol. 2014;151(1):83–112. doi: 10.1016/j.jcpa.2014.01.004. [van Brand JM, Haagmans BL, van Riel D, et al. The pathology and pathogenesis of experimental severe acute respiratory syndrome and influenza in animal models[J]. J Comp Pathol, 2014, 151(1): 83-112.] [DOI] [PMC free article] [PubMed] [Google Scholar]
- 13.Jiang G, Korteweg C. Pathology and pathogenesis of severe acute respiratory syndrome. Am J Pathol. 2007;170(4):1136–47. doi: 10.2353/ajpath.2007.061088. [Jiang G, Korteweg C. Pathology and pathogenesis of severe acute respiratory syndrome[J].Am J Pathol, 2007, 170(4): 1136-47.] [DOI] [PMC free article] [PubMed] [Google Scholar]
- 14.刘 茜, 王 荣帅, 屈 国强, et al. 新型冠状病毒肺炎死亡尸体系统解剖大体观察报告. 法医学杂志. 2020;36(1):1004–19. [刘茜, 王荣帅, 屈国强, 等.新型冠状病毒肺炎死亡尸体系统解剖大体观察报告[J].法医学杂志, 2020, 36(1): 1004-19.] [Google Scholar]
- 15.张 伟宏, 金 征宇, 王 沄, et al. SARS患者出院后恢复期的CT表现与肺功能相关性研究. 中华放射学杂志. 2004;38(5):477–81. doi: 10.3760/j.issn:1005-1201.2004.05.007. [张伟宏, 金征宇, 王沄, 等. SARS患者出院后恢复期的CT表现与肺功能相关性研究[J].中华放射学杂志, 2004, 38(5): 477-81.] [DOI] [Google Scholar]


