

Abstract
Exposure assessment traditionally relies on biomarkers that measure chemical concentrations in individual biological media (i.e., blood, urine, etc.). However, chemicals distribute unevenly among different biological media; thus, each medium provides incomplete information about body burden. We propose that machine learning and statistical approaches can create integrated exposure estimates from multiple biomarker matrices that better represent the overall body burden, which we term multi-media biomarkers (MMBs). We measured lead (Pb) in blood, urine, hair and nails from 251 Italian adolescents aged 11–14 years from the Public Health Impact of Metals Exposure (PHIME) cohort. We derived aggregated MMBs from the four biomarkers and then tested their association with Wechsler Intelligence Scale for Children (WISC) IQ scores. We used three approaches to derive the Pb MMB: one supervised learning technique, weighted quantile sum regression (WQS), and two unsupervised learning techniques, independent component analysis (ICA) and non-negative matrix factorization (NMF). Overall, the Pb MMB derived using WQS was most consistently associated with IQ scores and was the only method to be statistically significant for Verbal IQ, Performance IQ and Total IQ. A one standard deviation increase in the WQS MMB was associated with lower Verbal IQ (β [95% CI] = −2.2 points [−3.7, −0.6]), Performance IQ (−1.9 points [−3.5, −0.4]) and Total IQ (−2.1 points [−3.8, −0.5]). Blood Pb was negatively associated with only Verbal IQ, with a one standard deviation increase in blood Pb being associated with a −1.7 point (95% CI: [−3.3, −0.1]) decrease in Verbal IQ. Increases of one standard deviation in the ICA MMB were associated with lower Verbal IQ (−1.7 points [−3.3, −0.1]) and lower Total IQ (−1.7 points [−3.3, −0.1]). Similarly, an increase of one standard deviation in the NMF MMB was associated with lower Verbal IQ (−1.8 points [−3.4, −0.2]) and lower Total IQ (−1.8 points [−3.4, −0.2]). Weights highlighting the contributions of each medium to the MMB revealed that blood Pb was the largest contributor to most MMBs, although the weights varied from more than 80% for the ICA and NMF MMBs to between 30% and 54% for the WQS-derived MMBs. Our results suggest that MMBs better reflect the total body burden of a chemical that may be acting on target organs than individual biomarkers. Estimating MMBs improved our ability to estimate the full impact of Pb on IQ. Compared with individual Pb biomarkers, including blood, a Pb MMB derived using WQS was more strongly associated with IQ scores. MMBs may increase statistical power when the choice of exposure medium is unclear or when the sample size is small. Future work will need to validate these methods in other cohorts and for other chemicals.
Keywords: Lead, Neurodevelopment, Exposure assessment
1. Introduction
Understanding the impact of environmental exposures, such as heavy metals, on human health requires optimizing our estimates of exposure dose. In epidemiological studies, exposure biomarkers, surrogate measures of internal dose, are the gold standard method to estimate exposure. This is because the total body burden is unknown and exposure biomarkers, unlike environmental concentrations of chemicals in air, water or soil, reflect internalized levels of chemicals that are more likely to impact the target organ (Nordberg, 2010). However, exposure biomarkers are surrogate markers of total exposure from the environment. The level of exposure estimated using one biomarker may not correspond to the level estimated using another biomarker, as chemicals do not distribute evenly across the body but rather distribute based on chemical properties (e.g., fat solubility and charge, among others). Additionally, each exposure biomarker represents a particular body compartment (e.g., bone, blood, soft tissue) and, therefore, cannot capture the full internal dose of a given chemical. Thus, the use of a single exposure biomarker often fails to fully capture the internal dose of the chemical across all compartments (Basu et al., 2014). Misspecified levels of exposure in research studies lead to exposure imprecision and potential exposure misclassification.
Exposure imprecision could bias effect estimates towards the null, thus reducing the power to detect exposure-response relationships (Grandjean et al., 2003, 2004; Grandjean and Herz, 2011; Zeger et al., 2000; Grandjean and Budtz-Jorgensen, 2010), or it could create a false-positive result if the bias is directional. This would be the case if a chemical accumulates in a particular tissue due to its chemical properties but has no biological effect. For example, an inert fat-soluble chemical with a high volume of distribution may be expected to be associated with obesity, especially if the dose is measured in fat. The overall direction and magnitude of the bias depend on several factors, including the relationship between the exposure and the outcome, the variances of the exposure and outcomes and the correlation structure between the exposure, outcome and covariates (Zeger et al., 2000). Bias due to exposure measurement error has been highlighted as an under-appreciated and major limitation of environmental health studies (Spiegelman, 2010).
A potential solution to reduce the imprecision from individual biomarkers is to combine information from multiple exposure biomarkers, each representing different tissue compartments. To this end, we propose the derivation of an integrated measure of exposure across multiple media, which we call a multi-media biomarker (MMB). Prior studies using this concept but a different terminology have used methods such as confirmatory factor analysis (Budtz-Jorgensen et al., 2003; Grandjean and Budtz-Jorgensen, 2007) (CFA) and structural equation models (Grandjean and Budtz-Jorgensen, 2007; Kim et al., 2014; Heilmann et al., 2006) (SEMs). However, both methods are based upon strong assumptions about the distributions of the variables, which may not be true in practice, and proper model specification, both of which are issues that can lead to bias (VanderWeele, 2012; Flora et al., 2012a). Additionally, SEMs require a priori specification of causal relationships between variables, relationships that may not be possible to validate in practice. Finally, to our knowledge, the application of these methods has been limited to two chemicals, mercury and polychlorinated biphenyls (PCBs) (Budtz-Jorgensen et al., 2003; Grandjean and Budtz-Jorgensen, 2007; Kim et al., 2014; Heilmann et al., 2006), and predate recent advances in statistical methods and machine learning that integrate information from multiple exposures, such as methods designed to address chemical mixtures.
Statistical methods for mixtures were developed to determine the joint impact of multiple chemicals, generally in a single medium, on a health outcome, but fundamentally address the issue of combining sets of correlated predictors into a “vector,” “factor” or “index” that can be used to analyze their joint impact. Thus, we propose that a natural extension is to use these methods to evaluate the joint effect of a single chemical across multiple media, i.e., to estimate the body burden of the exposure. Statistical mixture methods include the estimation of the relative contributions of each predictor to the joint effect, which in the context of an MMB can be used to identify major biomarker media contributors to the MMB effect (e.g., blood or urine). The large number of mixture techniques (Stafoggia et al., 2017) makes it prohibitive to use all of them in this study. Instead, we focus on a few techniques to highlight the utility of MMBs for exposure assessment.
In seeking to improve upon exposure assessment using biomarkers and to formalize the concept of an MMB, we chose lead (Pb) as the paradigm chemical to derive an MMB. Pb is a neurotoxic metal with no known safe level of exposure and has been extensively studied (Ehman, 2018; Abadin et al., 2007). Higher Pb levels are consistently linked to declines in cognitive function, such as IQ scores in children (Abadin et al., 2007). Different media have been used individually as biomarkers of Pb exposure (Sanders et al., 2009; in Measuring Lead Exposur, 1993; Barbosa et al., 2005), but blood Pb is widely considered the ideal biomarker of Pb (in Measuring Lead Exposur, 1993; Barbosa et al., 2005). Blood Pb has been an effective biomarker in research studies yet comprises less than two percent of the total body burden of Pb (Barry, 1975). The concentration of Pb in the blood may not fully reflect total body burden because Pb follows a three-compartment kinetic model with the largest fraction of the body burden being found in bone (Graziano, 1994; Lyngbye et al., 1990). Bone Pb has been used as a biomarker of exposure in adults but not in children, due to differences in bone density and concerns about radiation exposure at young ages (Hu et al., 1998; Nie et al., 2011). The measurement of Pb in urine reflects Pb that has diffused through the plasma and has been excreted through the kidneys (Barbosa et al., 2005) and represents both recent exposure and remobilized tissue Pb levels. Excretion through urine increases during recent exposure (Sakai, 2000; Skerfving et al., 1988) and is the major elimination pathway of Pb, making up between one half and two thirds of the total elimination of Pb (Abadin et al., 2007; in Measuring Lead Exposur, 1993). Elimination through keratinizing tissues via secretion, i.e., nails and hair, is a minor elimination pathway, constituting less than 10% of the total elimination (in Measuring Lead Exposur, 1993). Nails and hair are considered to reflect longer-term exposure than urine and blood because both nails and hair are isolated from other metabolic activities in the body for months after secretion and grow relatively slowly (Takagi et al., 1988; Patra et al., 2006; LeBeau et al., 2011; Yaemsiri et al., 2010). Since each biomarker provides information on a different compartment and different biological processes, we hypothesize that combining information from multiple biomarkers will result in an improved measure of the total body burden of Pb and thus improved exposure characterization.
In this study, we derived MMBs for Pb using three mixture methods: non-negative matrix factorization (NMF), independent component analysis (ICA) and WQS regression. We used the exposure biomarkers blood, urine, hair and nails, collected as a part of the Public Health Impact of Manganese Exposure (PHIME) cohort in Italy, to derive the MMBs.
2. Material and methods
2.1. Description of the study population
Subjects for this study are from the PHIME cohort, based in the Italian province of Lombardy. 720 participants were recruited through the junior high schools in the public school district. Participants were eligible for the study if they were born and raised within the study area, were between 11 and 14 years of age and were from a family that had lived in the study area for at least two generations. Adolescents were excluded from the study if they had a neurodegenerative disease or a family history of neurodegenerative disease, were using medications with known neuro-psychological side effects or had visual or motor deficits. A detailed description of the recruitment process and study design has been previously published (Lucchini et al., 2012a). Eligible adolescents and their parents receive a detailed explanation of the study procedures prior to consenting to participate. The PHIME study protocols were approved by the Institutional Review Boards (IRBs) of the Public Health Agencies of Valcamonica and Brescia, the University of California, Santa Cruz and the Icahn School of Medicine at Mount Sinai. Complete data for all biomarkers, outcomes and covariates of interest were available from 251 adolescents and these comprise the final sample used in this analysis.
2.2. Lead biomarker measurements
The collection of biological samples (blood, urine, hair and nails) from the PHIME participants has been described previously (Lucas et al., 2015; Lucchini et al., 2012b). Whole blood samples were collected using butterfly catheters into trace metal-free vacutainers. Spot urine samples were collected into sterile polyethylene containers. Hair samples were collected using stainless steel scissors. Fingernail samples were collected with stainless steel nail clippers. Pb concentrations in all media were measured using magnetic sector inductively coupled plasma mass spectrometry (Thermo Element XR ICP–MS), described elsewhere (Smith et al., 2007; Eastman et al., 2013). To assess the overlap between the Pb biomarkers, we estimated the Spearman correlation, rs, among the Pb biomarkers and show the results in Supplemental Fig. 1.
2.3. Covariate data
In order to obtain sociodemographic information, trained study staff administered standardized questionnaires either at in-person visits or over the phone. Socioeconomic status (SES), categorized as low, medium and high, was determined using an Italy-specific methodology that incorporates information on both parental occupation and education (Cesana et al., 1995).
2.4. Wechsler Intelligence Scale for Children
We used the Third Edition of the Wechsler Intelligence Scale for Children (WISC-III), which is normed for children aged 6–16 years. The WISC-III is composed of 10 subtests that are grouped into two domains: verbal, which measures the participant’s language-based skills, and performance, which measures the participant’s non-verbal, perceptual organization. Verbal IQ and Performance IQ composite scores were created by combining the five subtests in each domain. The subtests comprising the Verbal IQ score are Information, Similarities, Arithmetic, Vocabulary and Comprehension. The subtests comprising the Performance IQ score are Picture Completion, Coding, Picture Arrangement, Block Design and Object Assembly. The Verbal and Performance IQ scores are combined to derive a measure of overall general intelligence, Total IQ. The WISC was administered by two trained neuro-psychologists. Age-adjusted WISC scores were used in analyses.
2.5. Statistical analyses
The statistical mixture methods used to estimate the MMBs can be grouped into two broad categories: supervised techniques, where information about the outcome of interest is used in the estimation of the MMB; and unsupervised techniques, where information about the outcome of interest is not used in the estimation of the MMB. In this work, we used the supervised method WQS and the unsupervised methods ICA and NMF. In deriving an MMB, each method generates a set of weights that estimate the relative contributions of each original Pb biomarker to the MMB. Note that the contributions of each biomarker to the MMBs derived using unsupervised methods will be the same for all outcomes, but the contributions of each biomarker to the MMBs derived using supervised methods may change depending on the outcome.
2.6. WQS
The full details of WQS have been presented previously (Carrico et al., 2014). Briefly, WQS is a supervised learning technique that empirically estimates weights, w, in order to maximize the likelihood of the following regression equation
| (1) |
where y is the outcome of interest; β0 is the intercept; β1 is the regression coefficient for the weighted sum of the quantiled biomarker concentrations, qb; B is the number of biomarkers; z = [z1, …, zC] is the set of covariates; and φ is the set of regression coefficients corresponding to z. The weights are constrained such that 0 ≤ wb ≤ 1 and (Carrico et al., 2014). For these analyses, we grouped the exposure data into quartiles. Additionally, we used 1000 bootstrap datasets, where wb was estimated as the average across the bootstrap estimates. Since the exposure was Pb and the outcome was IQ, we constrained the directionality of the association of the WQS index to be non-positive. Sensitivity analyses (not shown) were performed where the directionality of the constraint was reversed; however, none of the models achieved statistical significance at a threshold of p < 0.05. Due to our limited sample size, we did not separate the data into separate training and testing datasets.
Since the weights are constrained such that 0 ≤ wb ≤ 1 and , the weights can be used to determine the relative contribution of each biomarker as a percentage to the MMB.
2.7. ICA
ICA is an unsupervised matrix factorization technique that seeks to decompose a set of observations into a set of statistically independent factors. ICA contrasts with principal component analysis (PCA) in that PCA determines linearly uncorrelated factors, whereas the factors extracted using ICA are statistically independent. In practice, the factors generated using ICA are often more useful than those generated using PCA (Hyvarinen and Oja, 2000; Saidi et al., 2004). A fuller discussion of ICA can be found elsewhere (Hyvarinen and Oja, 2000; Adali et al., 2014). For a set of B Pb biomarkers from the m th subject, , the noiseless ICA model (Adali et al., 2015) can be written as
| (2) |
where is the set of factors estimated using ICA; A is the mixing matrix; and M is the total number of subjects. These factors are estimated such that they are statistically independent of each other. Four factors were estimated for ICA. The ICA MMB is defined as the first of these four factors. Sensitivity analyses (not shown) were performed assessing the association between the other factors generated using ICA and the IQ measures, and the other factors were not found to be significantly associated with any of the outcomes.
The rows of A contain the loadings of each factor across the original biomarkers, i.e., the ith row of A, ai, represents the loadings of the ith component for each biomarker. Therefore, these loadings can be used to determine the relationship between the ICA MMB and each of the original biomarkers. Since A is nearly an orthogonal matrix (Adali et al., 2015), we compute the relationship between the ICA MMB and the original biomarkers, as a percentage, as .
2.8. NMF
The details of NMF have been presented elsewhere (Berry et al., 2007). Briefly, if we collect all observations from the B Pb biomarkers from all M subjects into a single dataset, NMF is an unsupervised technique that determines a pair of nonnegative factor matrices W and H of lower matrix rank than X, such that
| (3) |
These factor matrices are estimated such that they minimize ‖X − WH‖F, where ‖·‖F is the Frobenius norm. Two factors were estimated for NMF. We define the NMF MMB as the first of these factors. Sensitivity analyses (not shown) were performed assessing the association between the other factors generated using NMF and the IQ measures and the other factor was not found to be significantly associated with any of the outcomes.
Similar to the matrix A in ICA, the rows of H in NMF contain the loadings of each factor across the original biomarkers, i.e., the ith row of H, ht, represents the loadings of the ith component for each biomarker. Therefore, these loadings can be used to determine the relationship between the NMF MMB and each of the original biomarkers. Each of the rows of H, ht, is constrained such that Thus, we compute the relationship between the NMF MMB and the original biomarkers, as a percentage, using the square of the elements of hi.
2.9. Summarizing the weights across MMBs
Since each MMB may rank the importance of each biomarker differently, we need a method to combine these importance measures across MMBs in order to determine an ordinal ranking of the biomarkers that can be used to determine their overall importance. We propose the use of the following metric to combine importance measures of the biomarkers across MMBs. Let be the t-statistic for the jth MMB that was statistically significantly associated, at a threshold of p < 0.05, with an outcome of interest. The proposed weighting of the kth biomarker, wk, across significant MMBs is
| (4) |
where wjk is the weight associated with biomarker k and MMB j. The proposed weighting scheme weighs the biomarker across MMB based upon the magnitude of the association between the MMB and the outcome as well as how well the model fits the data.
2.10. Data screening and analysis
Prior to calculating the MMBs, the Pb biomarker data were first converted to z-scores. Biomarker values more than three scaled median absolute deviations (MAD) were labeled as outliers and not used in analyses. For the WQS MMB, the data were then put into quartiles and the WQS MMB estimated. In order to test the effect of combining Pb biomarkers in an uninformed way, we also derived an MMB consisting of the average of all the original biomarkers, i.e., assuming equal weights for all biomarkers. Since the MMBs may not be in z-scores after they are generated, each MMB was transformed into z-scores in order to standardize the effect estimates across all biomarkers. Associations between MMBs and IQ scores were measured using linear regressions, adjusting for sex and SES. Note that the WISC IQ scores are adjusted for age. These covariates were chosen based upon prior research in the same cohort (Lucchini et al., 2012a; Butler et al., 2018; Bauer et al., 2017). The generation of the ICA and NMF MMBs were performed using MATLAB R2017b; all other analyses were performed using SAS 9.4.
3. Results
3.1. Descriptive statistics
The demographics of the subset of PHIME participants that had complete data on all exposures, covariates and outcomes are presented in Table 1. The average age of the participants was 12.3 years and approximately half of the participants (53.4%) were female. These characteristics in the subset of subjects included in these analyses were similar to those in the parent cohort. Metal concentrations in Pb biomarkers are summarized in Table 2. The rs among the Pb biomarkers are shown in Supplemental Fig. 1. Pb levels in blood were moderately correlated with both urine Pb (0.3, p < 0.001) and hair Pb (0.18, p < 0.001). Pb concentrations in other biomarkers were not correlated.
Table 1.
Demographic information and descriptive statistics.
| Demographics | Category | N (%) |
|---|---|---|
| Total | 251 (100%) | |
| Gender | Male | 117 (46.6%) |
| Female | 134 (53.4%) | |
| Socioeconomic Status | Low | 56 (22.3%) |
| Medium | 136 (54.2%) | |
| Average ± SD (range) | High | 59 (23.5%) |
| Age (years) | 12.3 ± 1.0 (11–14) | |
| SD: Standard deviation. |
Table 2.
Pb concentrations in exposure biomarkers (n = 251).
| Exposure Biomarker | Median | Interquartile range |
|---|---|---|
| Blood (μg/dL) | 1.2 | 0.9–1.6 |
| Urine (μg/L) | 0.52 | 0.35–0.75 |
| Hair (μg/g) | 0.09 | 0.04–0.22 |
| Nails (μg/g) | 0.09 | 0.04–0.20 |
3.2. Pb biomarkers and WISC-III
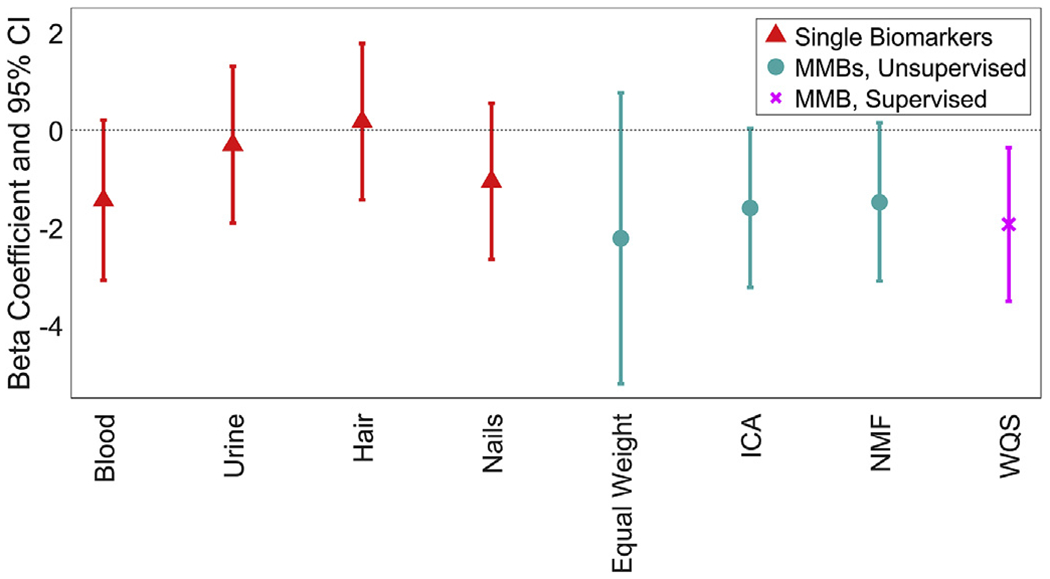
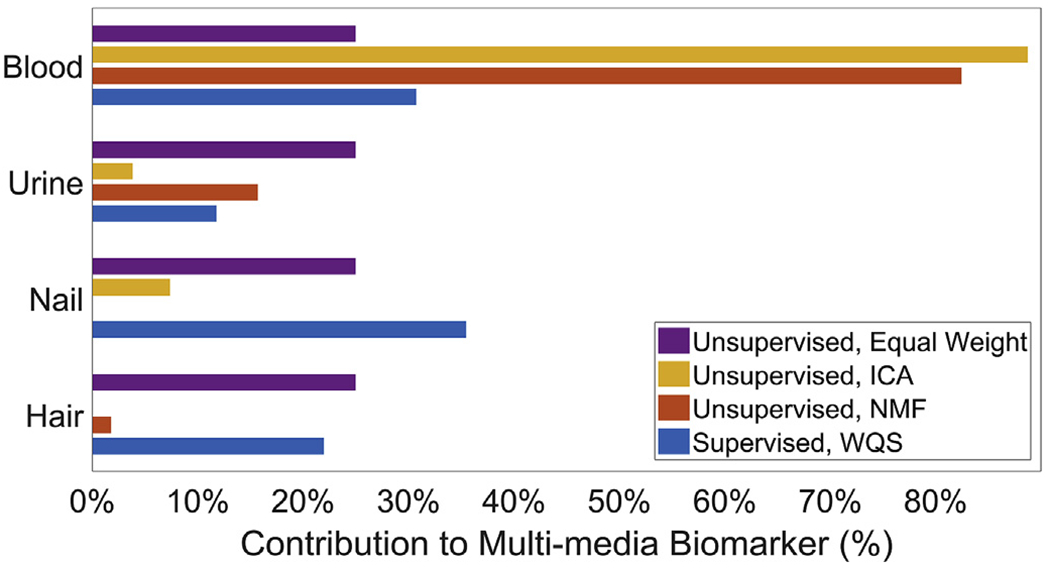
In covariate-adjusted models, none of the individual Pb biomarkers were associated with Total IQ scores at a p < 0.05 threshold for significance, though blood Pb is marginally significant (β [95% CI], p-value: −1.6 [−3.2, 0.0], 0.06). The ICA MMB, NMF MMB and WQS MMB were all negatively associated with Total IQ (Fig. 1). A one-standard-deviation increase in the ICA MMB, NMF MMB and WQS MMB was associated with 1.7 [95% CI: 0.1, 3.3], 1.8 [95% CI: 0.2, 3.4] and 2.1 [95% CI: 0.5, 3.7] point decreases in Total IQ, respectively. Blood was the largest contributor to the MMBs, with weights of 88.8%, 82.4% and 42.5%, respectively, from ICA, NMF and WQS (Fig. 2). Urine was the second highest contributor to the NMF MMB (15.7%), while nails were the second highest contributor to the ICA (7.4%) and WQS (29.0%) MMBs. Note that both the ICA and NMF MMBs were significantly associated with Total IQ even though blood Pb on its own was not significantly associated with Total IQ and both ICA and NMF MMBs have the majority of their weight from blood. Figures showing the associations of each of the biomarkers with each subscale of the WISC-III are shown in the Supplemental Information Section (Supplemental Figs. 2–9).
Fig. 1.
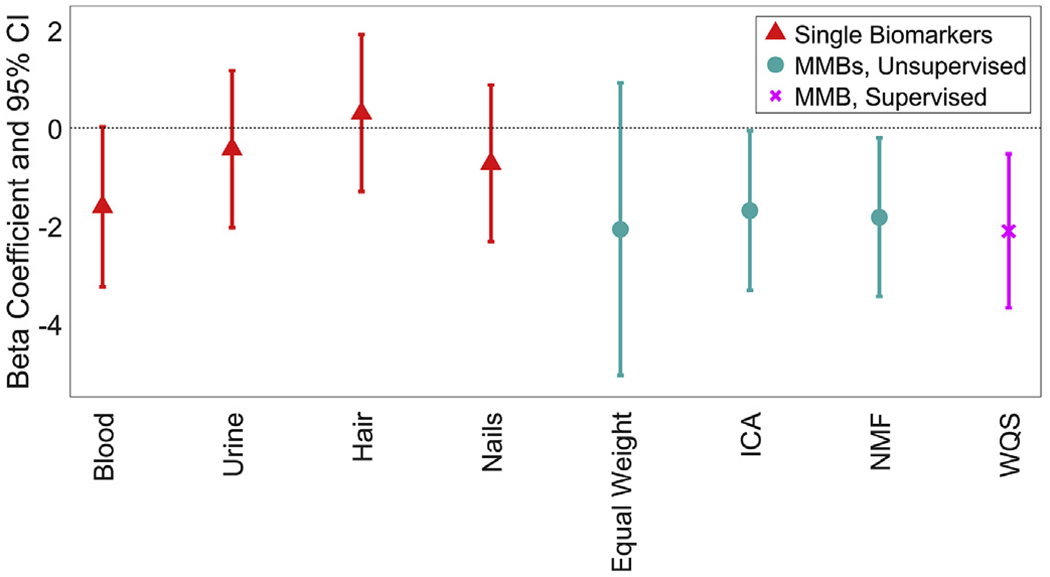
Beta coefficients and 95% confidence intervals of the association between each Pb biomarker and age-adjusted Total IQ. All models were adjusted for sex and SES. The original biomarkers are shown in red and denoted using triangles. The MMBs that are generated using unsupervised methods are shown in cyan and denoted using circles. The MMBs that are generated using supervised methods are shown in magenta and denoted using crosses. (For interpretation of the references to colour in this figure legend, the reader is referred to the Web version of this article.)
Fig. 2.
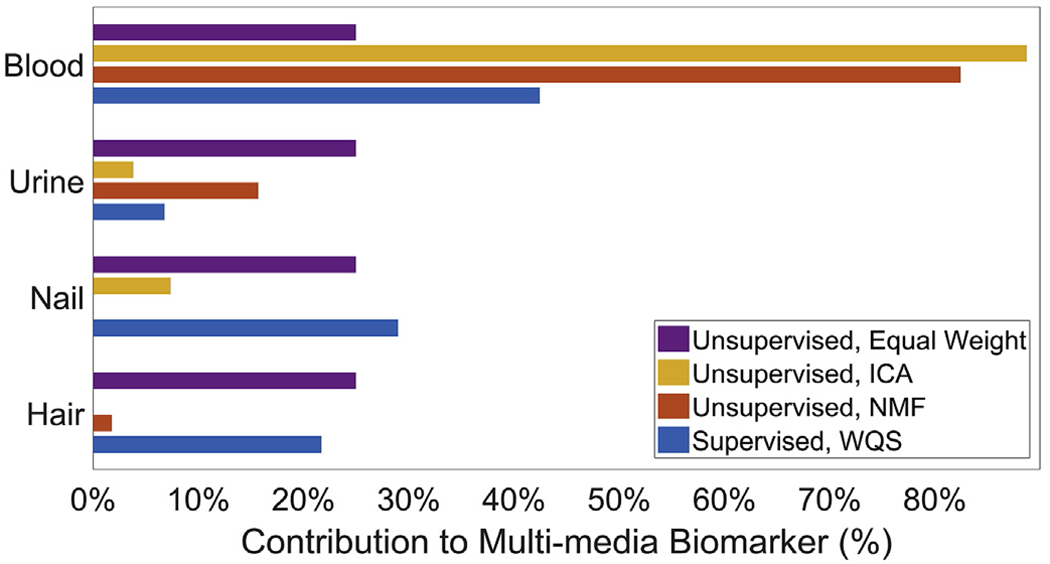
Bar graph of estimated biomarker weights for the MMBs in models of Total IQ. Larger weights indicate greater contributions of the original biomarkers to the MMBs.
In covariate-adjusted models, blood Pb, the ICA MMB, the NMF MMB and the WQS MMB were significantly associated with Verbal IQ (Fig. 3). A one-standard-deviation increase in blood Pb, ICA MMB, NMF MMB and WQS MMB, respectively, was associated with decreases of 1.7 [95% CI: 0.1, 3.3] points, 1.7 [95% CI: 0.1, 3.3] points, 1.8 [95% CI: 0.2, 3.4] points and 2.2 [95% CI: 0.6, 3.8] points in Verbal IQ. The top three contributors to the WQS MMB for Verbal IQ were blood (54.2%), hair (23.0%) and nails (18.8%); together making up 96.0% of the total weight (Fig. 4).
Fig. 3.
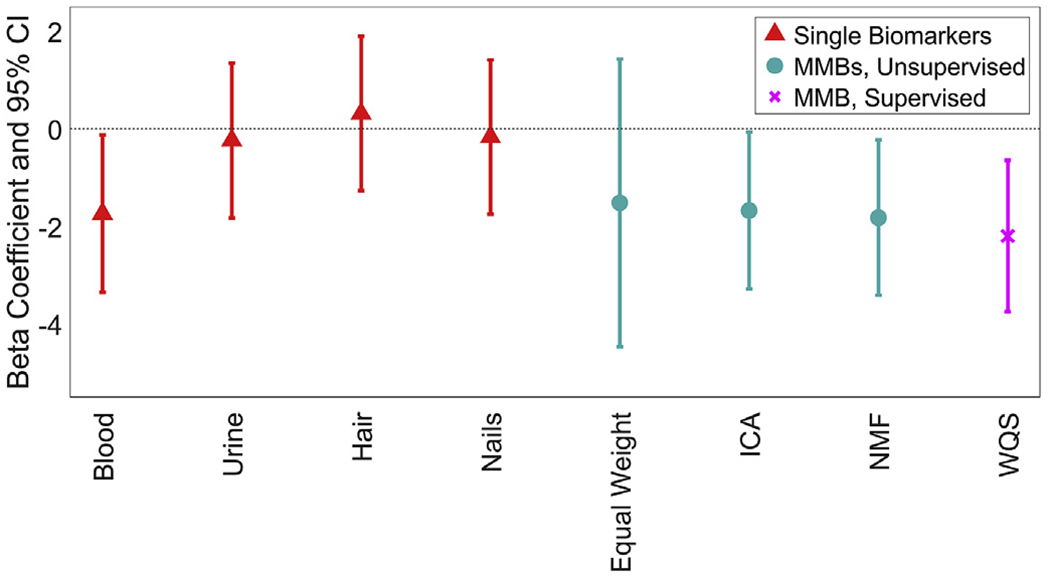
Beta coefficients and 95% confidence intervals of the association between each Pb biomarker and age-adjusted Verbal IQ. All models were adjusted for sex and SES. The original biomarkers are shown in red and denoted using triangles. The MMBs that are generated using unsupervised methods are shown in cyan and denoted using circles. The MMBs that are generated using supervised methods are shown in magenta and denoted using crosses. (For interpretation of the references to colour in this figure legend, the reader is referred to the Web version of this article.)
Fig. 4.
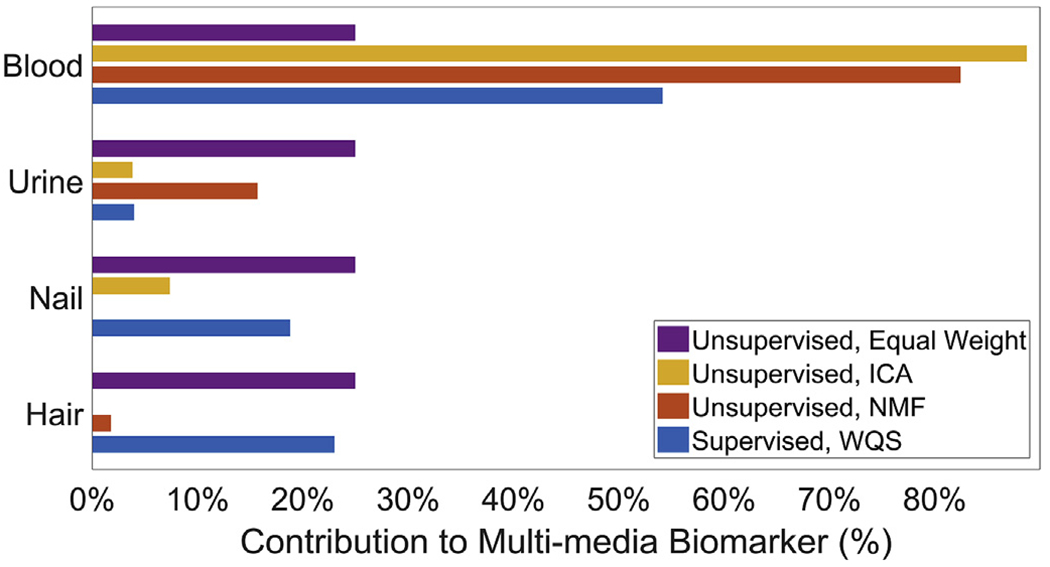
Bar graph of estimated biomarker weights for the MMBs in models of Verbal IQ. Larger weights indicate greater contributions of the original biomarkers to the MMBs.
Only the WQS MMB was associated with Performance IQ in the WISC-III (Fig. 5). A one-standard-deviation increase in the WQS MMB was associated with a 1.9 [95% CI: 0.4, 3.5] point decrease in Performance IQ. The top three contributors to the WQS MMB for Performance IQ were nails (35.5%), blood (30.7%) and hair (22.0%); together making up 88.2% of the total weight (Fig. 6). The MMB formed using an equal weighting from each medium was not significantly associated with any WISC score.
Fig. 5.
Beta coefficients and 95% confidence intervals of the association between each Pb biomarker and age-adjusted Performance IQ. All models were adjusted for sex and SES. The original biomarkers are shown in red and denoted using triangles. The MMBs that are generated using unsupervised methods are shown in cyan and denoted using circles. The MMBs that are generated using supervised methods are shown in magenta and denoted using crosses. (For interpretation of the references to colour in this figure legend, the reader is referred to the Web version of this article.)
Fig. 6.
Bar graph of estimated biomarker weights for the MMBs in models of Performance IQ. Larger weights indicate greater contributions of the original biomarkers to the MMBs.
Table 3 shows the combined weights representing the importance of each individual Pb biomarker to the significant Pb MMBs. We find that blood has the greatest importance, with 65.2% of the weight. Nails (14.9%), hair (11.1%) and urine (8.8%) are comparatively less informative biomarkers.
Table 3:
Combined importance measure of media used as Pb exposure biomarkers across all significant MMBs and the three outcomes verbal IQ, performance IQ, and total IQ.
| Exposure Biomarker | Blood | Urine | Hair | Nails |
|---|---|---|---|---|
| Weight | 65.2% | 8.8% | 11.1% | 14.9% |
4. Discussion
In this study, we demonstrated the utility and value of combining exposure information from multiple exposure biomarkers to derive a more integrated measure of exposure, a concept we formalize as the MMB. We applied this concept to Pb exposure on cognitive outcomes because Pb is a paradigm neurotoxicant and blood Pb is a well-established biomarker that is typically used in isolation and not in combination with other Pb biomarkers. If our concept were correct, we would expect MMBs to outperform blood Pb, which is our primary finding. The MMB approach yielded associations for Pb exposure that no single biomarker could replicate. Since MMBs combine information from multiple exposure biomarkers, they can create a more comprehensive estimate of Pb body burden than individual Pb biomarkers, including blood Pb. The weights estimated by each MMB method represent the relative contribution of each biomarker to the MMB. Thus, they can be used to determine an ordinal ranking of biomarkers based upon their ability to measure Pb exposure. Given the long history of Pb research based on blood Pb, and that prior studies show that the other biomarker matrices have not performed as well as blood Pb, we would expect blood Pb to have the highest weights in our MMBs, which we found to be the case. Our method allows researchers to avoid choosing one biomarker over another and instead allows them to integrate information from multiple biomarkers.
Overall, we found that higher Pb levels, estimated using blood and MMBs derived using ICA, NMF and WQS, were associated with lower IQ. While this adds to the considerable body of literature highlighting the neurological impacts of Pb exposure (Lidsky and Schneider, 2003; Flora et al., 2012b; Bellinger, 2008), our most important finding is that our MMB outperformed blood Pb. Our results are similar to prior studies of blood Pb, many of which had larger sample sizes than this study. For example, we found that the association between Pb levels across biomarkers was stronger with Verbal IQ compared with Performance IQ. This is consistent with previous investigations that have used blood Pb and measured cognitive function using the WISC-III (Surkan et al., 2007; Kim et al., 2009; Taylor et al., 2017; Wasserman et al., 1997). This was even true for the ICA and NMF MMB that have the majority of their weight from blood. Associations estimated by WQS were the strongest, suggesting that incorporating information about the outcome in the derivation of an MMB may improve our ability to estimate effects. However, like all research studies, these results should be replicated using an independent population.
The weights of the MMBs provide information about the utility of different media as biomarkers for Pb in this cohort. We found that blood was the highest contributor to nearly all MMBs. The amount of the contribution differed from more than 80% for the MMBs derived using ICA and NMF to between 30% and 54% for the MMBs derived using WQS. This aligns with the current understanding of Pb measurement that blood is more informative about the body burden of Pb than nails, hair or urine (Abadin et al., 2007; Barbosa et al., 2005; Bergdahl and Skerfving, 2008). We found that Pb levels measured in nails, hair and urine were not individually associated with any of the three IQ scores. However, there are issues with whether blood Pb alone can accurately reflect body burden that have been raised in the past, such as that blood reflects a small fraction of the total body burden and blood is a reflection of both short term and long term exposure (Bergdahl and Skerfving, 2008). MMBs may offer a solution to such concerns as all exposure biomarkers reflect the true body burden of exposure that is being observed with error, thus combining exposure information from multiple biomarkers will result in more accurate measures of the total body burden of the exposure (Grandjean et al., 2004). By examining the weights of the significant MMBs, we can determine an ordinal ranking of the individual Pb biomarkers. Our results indicate that the media that best highlight the connection between Pb exposure and poorer performance on the WISC-III are: blood, nails, hair and finally urine. This ordinal ranking of the biomarkers by their ability to highlight the connection between Pb exposure and cognitive function can inform future studies seeking to explore this connection. However, the ranking that we found in this work does contrast with a previous study that found that urine was more informative than either nails or hair (Wang et al., 2009).
Our study has multiple strengths. Measuring the level of Pb in multiple media from the same people at the same time, though not generally done in epidemiological research, enables the direct comparison of the performance of different Pb biomarkers. This could be a particularly useful means to compare different biomarkers of exposure for relatively new chemicals for which established biomarkers do not exist and for which the choice of biomarker matrix is subjective. As untargeted chemical assays are more commonly used, many previously unidentified chemicals that impact human health will be identified (Uppal et al., 2016; Xue et al., 2019). The ideal media in which to measure chemicals will likely vary among compounds and MMBs may offer a framework for direct comparison of different biomarkers, even allowing for and identifying situations in which more than one biomarker is needed to estimate exposure appropriately. Our use of multiple methods, with unique modeling assumptions, to generate MMBs allows us to probe the robustness of the estimated MMBs. The consistency of our results provides us with increased confidence in our conclusions. The critical advantage of the proposed MMB concept is that a more informative exposure assessment can be formed by combining exposure information from multiple media. In this study, we only considered the biomarkers blood, hair, nails and urine, but MMBs could be derived using any subset of these biomarkers or could include other biomarkers including saliva Pb or metallothioneins. Metallothioneins are cysteine-rich proteins that are induced by nutrient metals such as zinc and copper, but also bind toxic metals such as Pb and cadmium. While we did not measure metallothionein levels in this study, in future work, we will explore incorporating them to estimate the body’s response to exposure.
Our study does have limitations. Our sample size was relatively small. However, our ability to detect significant associations even with a modest sample size suggests that MMBs may increase statistical power. For the WQS MMB, the data used to generate the MMB is the same as the data that is used to validate the MMB; thus, we may have issues of overfitting for this MMB. The population used in this study is comprised of adolescents between the ages of 11 and 14; thus, our conclusions about the utility of different Pb biomarkers may not be generalizable to other age groups, such as the elderly, infants and young children. We believe that MMBs should be tested in younger age groups as well, given that Pb poisoning is more common in young children and the use of individual biomarkers rather than MMBs may not fully describe the true association due to incomplete exposure characterization. Also, data on Pb exposure and IQ during adolescence are uncommon; thus, we believe our study makes an important contribution in this regard as well. The level of Pb in this population is relatively low compared to other populations (da Rocha Silva et al., 2018; Huo et al., 2007; Pelc et al., 2016); but is likely similar to adolescents in other developed countries. Since the distribution of Pb in the body may differ depending on the levels of environmental exposure, our conclusions on the optimal biomarkers to measure Pb exposure may not generalize to populations with higher environmental exposure levels. The performance of the different biomarkers is also dependent on the outcome; therefore, the results may change depending on the use of different target organs, such as the kidney or heart, for the health endpoints. Populations with significant liver or kidney disease may particularly benefit from the MMB approach, as assumptions regarding the ideal biomarker to use in the presence of a chronic disease may be unclear. MMBs may enable more objective comparisons of different biomarkers. Finally, the methods considered in this study made two linearity assumptions, which may not fully capture the relationships between Pb biomarkers and IQ scores or between Pb biomarkers. The first assumption is linearity in the association between the exposure and the outcome. Though this assumption may be reasonable in our study, since the effects of Pb exposure on IQ is linear for the small range of Pb levels seen in this cohort (Canfield et al., 2003), it may not be reasonable for chemicals that have known nonlinear exposure-response relationships. The second assumption is that the methods used to construct the MMBs only allow them to be formed from linear combinations of the exposure biomarkers. The second assumption may not adequately capture the full toxicokinetics of Pb; however, these linear combinations are a first-order approximation of a more complicated nonlinear model of the relationships amongst the biomarkers. It should also be noted that because the level of exposure is relatively low in this population, higher-order interaction effects between the biomarkers might be expected to be modest.
We propose that our work has multiple potential applications. First, although measuring chemical concentrations in multiple media (blood, urine, hair and nails) may be cost-prohibitive for some studies, this would be mitigated by the increased statistical power of the MMB, allowing for lower enrollment levels. This may be particularly true for existing cohorts that no longer recruit new subjects and cannot increase sample size, but nonetheless may have stored samples from multiple media that can be used to measure chemical exposure. The MMB approach may be more statistically powerful than measuring exposure in a single medium in such a scenario. Additionally, the use of individual biomarkers by themselves do not enable us to differentiate between chronic and acute exposure (Hu et al., 1998). MMBs might have the potential to differentiate between these two exposure scenarios, since each biomarker provides different information about the timing of exposure and the weights inform the relative contribution of each biomarker.
5. Conclusion
Exposures to environmental contaminants are often estimated in environmental health research using samples from individual biological media. However, these surrogate measures of exposure rely on incomplete information about the body burden of exposure. In this study, we found that combining exposure information from multiple Pb biomarkers to derive an integrated measure of exposure, referred to as the MMB, outperformed individual biomarkers in estimating Pb associations with IQ. Of the derived MMBs, the WQS method was most strongly associated with IQ scores. Using weights that estimate how much information each medium contributes to the MMBs, we found that the order of importance for the media is blood, nails, hair and then urine. These results align with the performance of each individual Pb biomarker. Our proposed approach of combining exposure information across multiple biomarkers could be useful in future studies that seek to highlight the link between chemical exposures and human health.
Supplementary Material
Acknowledgements
This work was supported by the National Institutes of Health [T32HD049311, P30ES023515, R01ES019222, R01ES013744]; the Sixth Framework Program for RTD [contract no. FOOD-CT-2006–016253].
Abbreviations:
- MMB
Multi-media biomarker
Footnotes
Appendix A. Supplementary data
Supplementary data to this article can be found online at https://doi.org/10.1016/j.envres.2020.109148.
References
- Abadin H, et al. , 2007. Agency for Toxic Substances and Disease Registry (ATSDR) Toxicological Profiles. [PubMed] [Google Scholar]
- Adali T, Anderson M, Fu GS, 2014. Diversity in independent component and vector analyses: identifiability, algorithms, and applications in medical imaging. Ieee Signal Proc Mag 31, 18–33. 10.1109/Msp.2014.2300511. [DOI] [Google Scholar]
- Adali T, Levin-Schwartz Y, Calhoun VD, 2015. Multimodal data fusion using source separation: two effective models based on ICA and IVA and their properties. P Ieee 103, 1478–1493. 10.1109/Jproc.2015.2461624. [DOI] [PMC free article] [PubMed] [Google Scholar]
- Barbosa F Jr., Tanus-Santos JE, Gerlach RF, Parsons PJ, 2005. A critical review of biomarkers used for monitoring human exposure to lead: advantages, limitations, and future needs. Environ. Health Perspect 113, 1669–1674. 10.1289/ehp.7917. [DOI] [PMC free article] [PubMed] [Google Scholar]
- Barry PS, 1975. A comparison of concentrations of lead in human tissues. Br. J. Ind. Med 32, 119–139. 10.1136/oem.32.2.119. [DOI] [PMC free article] [PubMed] [Google Scholar]
- Basu N, Goodrich JM, Head J, 2014. Ecogenetics of mercury: from genetic polymorphisms and epigenetics to risk assessment and decision-making. Environ. Toxicol. Chem 33, 1248–1258. 10.1002/etc.2375. [DOI] [PubMed] [Google Scholar]
- Bauer JA, et al. , 2017. Manganese in teeth and neurobehavior: sex-specific windows of susceptibility. Environ. Int 108, 299–308. 10.1016/j.envint.2017.08.013. [DOI] [PMC free article] [PubMed] [Google Scholar]
- Bellinger DC, 2008. Very low lead exposures and children’s neurodevelopment. Curr. Opin. Pediatr 20, 172–177. 10.1097/MOP.0b013e3282f4f97b. [DOI] [PubMed] [Google Scholar]
- Bergdahl IA, Skerfving S, 2008. Biomonitoring of lead exposure—alternatives to blood. J. Toxicol. Environ. Health, Part A 71, 1235–1243. [DOI] [PubMed] [Google Scholar]
- Berry MW, Browne M, Langville AN, Pauca VP, Plemmons RJ, 2007. Algorithms and applications for approximate nonnegative matrix factorization. Comput. Stat. Data Anal 52, 155–173. 10.1016/j.csda.2006.11.006. [DOI] [Google Scholar]
- Budtz-Jorgensen E, Keiding N, Grandjean P, Weihe P, White RF, 2003. Consequences of exposure measurement error for confounder identification in environmental epidemiology. Stat. Med 22, 3089–3100. 10.1002/sim.1541. [DOI] [PubMed] [Google Scholar]
- Butler L, et al. , 2018. Assessing the contributions of metals in environmental media to exposure biomarkers in a region of ferroalloy industry. J. Expo. Sci. Environ. Epidemiol 10.1038/s41370-018-0081-6. [DOI] [PMC free article] [PubMed] [Google Scholar]
- Canfield RL, et al. , 2003. Intellectual impairment in children with blood lead concentrations below 10 microg per deciliter. N. Engl. J. Med 348, 1517–1526. 10.1056/NEJMoa022848. [DOI] [PMC free article] [PubMed] [Google Scholar]
- Carrico C, Gennings C, Wheeler DC, Factor-Litvak P, 2014. Characterization of weighted quantile sum regression for highly correlated data in a risk analysis setting. J. Agric. Biol. Environ. Stat 20, 100–120. [DOI] [PMC free article] [PubMed] [Google Scholar]
- Cesana GC, Ferrario M, De Vito G, Sega R, Grieco A, 1995. Evaluation of the socioeconomic status in epidemiological surveys: hypotheses of research in the Brianza area MONICA project. Med. Lav 86, 16–26. [PubMed] [Google Scholar]
- da Rocha Silva JP, et al. , 2018. High blood lead levels are associated with lead concentrations in households and day care centers attended by Brazilian preschool children. Environ. Pollut 239, 681–688. 10.1016/j.envpol.2018.04.080. [DOI] [PubMed] [Google Scholar]
- Eastman RR, Jursa TP, Benedetti C, Lucchini RG, Smith DR, 2013. Hair as a biomarker of environmental manganese exposure. Environ. Sci. Technol 47, 1629–1637. 10.1021/es3035297. [DOI] [PMC free article] [PubMed] [Google Scholar]
- Ehman K, 2018. Handbook of developmental neurotoxicology. Int. J. Toxicol 37, 404–409. 10.1177/1091581818798022 second ed. [DOI] [Google Scholar]
- Flora DB, Labrish C, Chalmers RP, 2012a. Old and new ideas for data screening and assumption testing for exploratory and confirmatory factor analysis. Front. Psychol 3, 55 10.3389/fpsyg.2012.00055. [DOI] [PMC free article] [PubMed] [Google Scholar]
- Flora G, Gupta D, Tiwari A, 2012b. Toxicity of lead: a review with recent updates. Interdiscip. Toxicol 5, 47–58. 10.2478/v10102-012-0009-2. [DOI] [PMC free article] [PubMed] [Google Scholar]
- Grandjean P, Budtz-Jorgensen E, 2007. Total imprecision of exposure biomarkers: implications for calculating exposure limits. Am. J. Ind. Med 50, 712–719. 10.1002/ajim.20474. [DOI] [PMC free article] [PubMed] [Google Scholar]
- Grandjean P, Budtz-Jorgensen E, 2010. An ignored risk factor in toxicology: the total imprecision of exposure assessment. Pure Appl. Chem 82, 383–391. 10.1351/PAC-CON-09-05-04. [DOI] [PMC free article] [PubMed] [Google Scholar]
- Grandjean P, Herz KT, 2011. Methylmercury and brain development: imprecision and underestimation of developmental neurotoxicity in humans. Mt. Sinai J. Med 78, 107–118. 10.1002/msj.20228. [DOI] [PMC free article] [PubMed] [Google Scholar]
- Grandjean P, White RF, Weihe P, Jorgensen PJ, 2003. Neurotoxic risk caused by stable and variable exposure to methylmercury from seafood. Ambul. Pediatr 3, 18–23. 2. [DOI] [PubMed] [Google Scholar]
- Grandjean P, Budtz-Jorgensen E, Keiding N, Weihe P, 2004. Underestimation of risk due to exposure misclassification. Int. J. Occup. Med. Environ. Health 17, 131–136. [PubMed] [Google Scholar]
- Graziano JH, 1994. Validity of lead exposure markers in diagnosis and surveillance. Clin. Chem 40, 1387–1390. [PubMed] [Google Scholar]
- Heilmann C, Grandjean P, Weihe P, Nielsen F, Budtz-Jorgensen E, 2006. Reduced antibody responses to vaccinations in children exposed to polychlorinated biphenyls. PLoS Med 3, e311 10.1371/journal.pmed.0030311. [DOI] [PMC free article] [PubMed] [Google Scholar]
- Hu H, Rabinowitz M, Smith D, 1998. Bone lead as a biological marker in epidemiologic studies of chronic toxicity: conceptual paradigms. Environ. Health Perspect 106, 1–8. 10.1289/ehp.981061. [DOI] [PMC free article] [PubMed] [Google Scholar]
- Huo X, et al. , 2007. Elevated blood lead levels of children in Guiyu, an electronic waste recycling town in China. Environ. Health Perspect 115, 1113–1117. 10.1289/ehp.9697. [DOI] [PMC free article] [PubMed] [Google Scholar]
- Hyvarinen A, Oja E, 2000. Independent component analysis: algorithms and applications. Neural Netw 13, 411–430. [DOI] [PubMed] [Google Scholar]
- Measuring Lead Exposure in Infants, Children, and Other Sensitive Populations. [PubMed]
- Kim Y, et al. , 2009. Co-exposure to environmental lead and manganese affects the intelligence of school-aged children. Neurotoxicology (Little Rock) 30, 564–571. 10.1016/j.neuro.2009.03.012. [DOI] [PubMed] [Google Scholar]
- Kim BM, et al. , 2014. Effect of hemoglobin adjustment on the precision of mercury concentrations in maternal and cord blood. Environ. Res 132, 407–412. 10.1016/j.envres.2014.04.030. [DOI] [PMC free article] [PubMed] [Google Scholar]
- LeBeau MA, Montgomery MA, Brewer JD, 2011. The role of variations in growth rate and sample collection on interpreting results of segmental analyses of hair. Forensic Sci. Int 210, 110–116. 10.1016/j.forsciint.2011.02.015. [DOI] [PubMed] [Google Scholar]
- Lidsky TI, Schneider JS, 2003. Lead neurotoxicity in children: basic mechanisms and clinical correlates. Brain 126, 5–19. 10.1093/brain/awg014. [DOI] [PubMed] [Google Scholar]
- Lucas EL, et al. , 2015. Impact of ferromanganese alloy plants on household dust manganese levels: implications for childhood exposure. Environ. Res 138, 279–290. 10.1016/j.envres.2015.01.019. [DOI] [PMC free article] [PubMed] [Google Scholar]
- Lucchini RG, et al. , 2012a. Inverse association of intellectual function with very low blood lead but not with manganese exposure in Italian adolescents. Environ. Res 118, 65–71. 10.1016/j.envres.2012.08.003. [DOI] [PMC free article] [PubMed] [Google Scholar]
- Lucchini RG, et al. , 2012b. Tremor, olfactory and motor changes in Italian adolescents exposed to historical ferro-manganese emission. Neurotoxicology (Little Rock) 33, 687–696. 10.1016/j.neuro.2012.01.005. [DOI] [PMC free article] [PubMed] [Google Scholar]
- Lyngbye T, Jorgensen PJ, Grandjean P, Hansen ON, 1990. Validity and interpretation of blood lead levels: a study of Danish school children. Scand. J. Clin. Lab. Investig 50, 441–449. 10.3109/00365519009091604. [DOI] [PubMed] [Google Scholar]
- Nie LH, et al. , 2011. Blood lead levels and cumulative blood lead index (CBLI) as predictors of late neurodevelopment in lead poisoned children. Biomarkers 16, 517–524. 10.3109/1354750X.2011.604133. [DOI] [PMC free article] [PubMed] [Google Scholar]
- Nordberg GF, 2010. Biomarkers of exposure, effects and susceptibility in humans and their application in studies of interactions among metals in China. Toxicol. Lett 192, 45–49. 10.1016/j.toxlet.2009.06.859. [DOI] [PubMed] [Google Scholar]
- Patra RC, Swarup D, Sharma MC, Naresh R, 2006. Trace mineral profile in blood and hair from cattle environmentally exposed to lead and cadmium around different industrial units. J Vet Med A Physiol Pathol Clin Med 53, 511–517. 10.1111/j.1439-0442.2006.00868.x. [DOI] [PubMed] [Google Scholar]
- Pelc W, Pawlas N, Dobrakowski M, Kasperczyk S, 2016. Environmental and socioeconomic factors contributing to elevated blood lead levels in children from an industrial area of Upper Silesia. Environ. Toxicol. Chem 35, 2597–2603. 10.1002/etc.3429. [DOI] [PubMed] [Google Scholar]
- Saidi SA, et al. , 2004. Independent component analysis of microarray data in the study of endometrial cancer. Oncogene 23, 6677–6683. 10.1038/sj.onc.1207562. [DOI] [PubMed] [Google Scholar]
- Sakai T, 2000. Biomarkers of lead exposure. Ind. Health 38, 127–142. 10.2486/indhealth.38.127. [DOI] [PubMed] [Google Scholar]
- Sanders T, Liu Y, Buchner V, Tchounwou PB, 2009. Neurotoxic effects and biomarkers of lead exposure: a review. Rev. Environ. Health 24, 15–45. [DOI] [PMC free article] [PubMed] [Google Scholar]
- Skerfving S, 1988. In: Clarkson Thomas W., Friberg Lars, Nordberg Gunnar F., Sager Polly R. (Eds.), Biological Monitoring of Toxic Metals. Springer US, pp. 169–197. [Google Scholar]
- Smith D, et al. , 2007. Biomarkers of Mn exposure in humans. Am. J. Ind. Med 50, 801–811. 10.1002/ajim.20506. [DOI] [PubMed] [Google Scholar]
- Spiegelman D, 2010. Approaches to uncertainty in exposure assessment in environmental epidemiology. Annu. Rev. Public Health 31, 149–163. 10.1146/annurev.publhealth.012809.103720. [DOI] [PMC free article] [PubMed] [Google Scholar]
- Stafoggia M, Breitner S, Hampel R, Basagaña X, 2017. Statistical approaches to address multi-pollutant mixtures and multiple exposures: the state of the science. Curr. Environ. Health Reports 4, 481–490. [DOI] [PubMed] [Google Scholar]
- Surkan PJ, et al. , 2007. Neuropsychological function in children with blood lead levels< 10 microg/dL. Neurotoxicology (Little Rock) 28, 1170–1177. 10.1016/j.neuro.2007.07.007. [DOI] [PMC free article] [PubMed] [Google Scholar]
- Takagi Y, et al. , 1988. Survey of trace elements in human nails: an international comparison. Bull. Environ. Contam. Toxicol 41, 690–695. 10.1007/bf02021020. [DOI] [PubMed] [Google Scholar]
- Taylor CM, Kordas K, Golding J, Emond AM, 2017. Effects of low-level prenatal lead exposure on child IQ at 4 and 8 years in a UK birth cohort study. Neurotoxicology (Little Rock) 62, 162–169. 10.1016/j.neuro.2017.07.003. [DOI] [PMC free article] [PubMed] [Google Scholar]
- Uppal K, et al. , 2016. Computational metabolomics: a framework for the million metabolome. Chem. Res. Toxicol 29, 1956–1975. 10.1021/acs.chemrestox.6b00179. [DOI] [PMC free article] [PubMed] [Google Scholar]
- VanderWeele TJ, 2012. Invited commentary: structural equation models and epidemiologic analysis. Am. J. Epidemiol 176, 608–612. 10.1093/aje/kws213. [DOI] [PMC free article] [PubMed] [Google Scholar]
- Wang Q, et al. , 2009. Adverse health effects of lead exposure on children and exploration to internal lead indicator. Sci. Total Environ 407, 5986–5992. 10.1016/j.scitotenv.2009.08.038. [DOI] [PubMed] [Google Scholar]
- Wasserman GA, et al. , 1997. Lead exposure and intelligence in 7-year-old children: the yugoslavia prospective study. Environ. Health Perspect 105, 956–962. 10.1289/ehp.97105956. [DOI] [PMC free article] [PubMed] [Google Scholar]
- Xue J, Lai Y, Liu CW, Ru H, 2019. Towards mass spectrometry-based chemical exposome: current approaches, challenges, and future directions. Toxics 7 10.3390/toxics7030041. [DOI] [PMC free article] [PubMed] [Google Scholar]
- Yaemsiri S, Hou N, Slining MM, He K, 2010. Growth rate of human fingernails and toenails in healthy American young adults. J. Eur. Acad. Dermatol. Venereol 24, 420–423. 10.1111/j.1468-3083.2009.03426.x. [DOI] [PubMed] [Google Scholar]
- Zeger SL, et al. , 2000. Exposure measurement error in time-series studies of air pollution: concepts and consequences. Environ. Health Perspect 108, 419–426. 10.1289/ehp.00108419. [DOI] [PMC free article] [PubMed] [Google Scholar]
Associated Data
This section collects any data citations, data availability statements, or supplementary materials included in this article.