

Abstract
Introduction
The search for drugs to treat Alzheimer's disease (AD) has failed to yield effective therapies. Here we report the first genome‐wide search for biomarkers associated with therapeutic response in AD. Blarcamesine (ANAVEX2‐73), a selective sigma‐1 receptor (SIGMAR1) agonist, was studied in a 57‐week Phase 2a trial (NCT02244541). The study was extended for a further 208 weeks (NCT02756858) after meeting its primary safety endpoint.
Methods
Safety, clinical features, pharmacokinetic, and efficacy, measured by changes in the Mini‐Mental State Examination (MMSE) and the Alzheimer's Disease Cooperative Study‐Activities of Daily Living scale (ADCS‐ADL), were recorded. Whole exome and transcriptome sequences were obtained for 21 patients. The relationship between all available patient data and efficacy outcome measures was analyzed with unsupervised formal concept analysis (FCA), integrated in the Knowledge Extraction and Management (KEM) environment.
Results
Biomarkers with a significant impact on clinical outcomes were identified at week 57: mean plasma concentration of blarcamesine (slope MMSE:P < .041), genomic variants SIGMAR1 p.Gln2Pro (ΔMMSE:P < .039; ΔADCS‐ADL:P < .063) and COMT p.Leu146fs (ΔMMSE:P < .039; ΔADCS‐ADL:P < .063), and baseline MMSE score (slope MMSE:P < .015). Their combined impact on drug response was confirmed at week 148 with linear mixed effect models.
Discussion
Confirmatory Phase 2b/3 clinical studies of these patient selection markers are ongoing. This FCA/KEM analysis is a template for the identification of patient selection markers in early therapeutic development for neurologic disorders.
Keywords: Alzheimer's disease, association rules, biomarker, genomic analysis, knowledge extraction management, machine learning, mixed effect models, precision medicine, unsupervised analysis
1. INTRODUCTION
Alzheimer's disease (AD) is a progressive neurodegenerative disorder characterized by loss of memory and other cognitive functions, leading to interference in daily life activities. At present, no pharmacological treatment has been shown to alter progression of the disease 1 . Heterogeneity of the AD patient population 2 , 3 and lack of objective efficacy measures or predictive biomarkers of response 4 contribute to this limitation. Sigma‐1 receptor (SIGMAR1), a modulator of calcium homeostasis and mitochondrial function, 5 is a new target relevant to AD. 6 SIGMAR1 activation has been shown to reduce key pathophysiological processes in AD including hyperphosphorylation of tau, 7 neuroprotection, 7 and oxidative stress. 7 , 8 Activation of SIGMAR1 also leads to increase in autophagic flux in human cells and in vivo. 9
Blarcamesine (ANAVEX2‐73), an agonist of the SIGMAR1, has been shown by positron emission tomography (PET) scan to directly bind its target 10 and to modulate cholinergic muscarinic receptors in mice. 11 The clinical potential of blarcamesine in AD was initially assessed in mouse models of AD, 11 , 12 followed by a Phase 1 study in healthy volunteers 13 and a 57‐week Phase 2a AD study. This study, ANAVEX2‐73‐002 (Figure 1a), enrolled 32 patients with mild‐to‐moderate AD and met its primary endpoint of safety and tolerability 14 (Tables S1 and S2 in supporting information), leading to a 208‐week extension study, labeled as ANAVEX2‐73‐003 (Figure 1a). Patients enrolled in the two studies were characterized at baseline and at each visit, including collection of data on clinical descriptors, physical examination, pharmacokinetics, and Mini‐Mental State Examination (MMSE) and Alzheimer's Disease Cooperative Study‐Activities of Daily Living scale (ADCS‐ADL) as efficacy measures (Figure 1b and Table 1).
FIGURE 1.
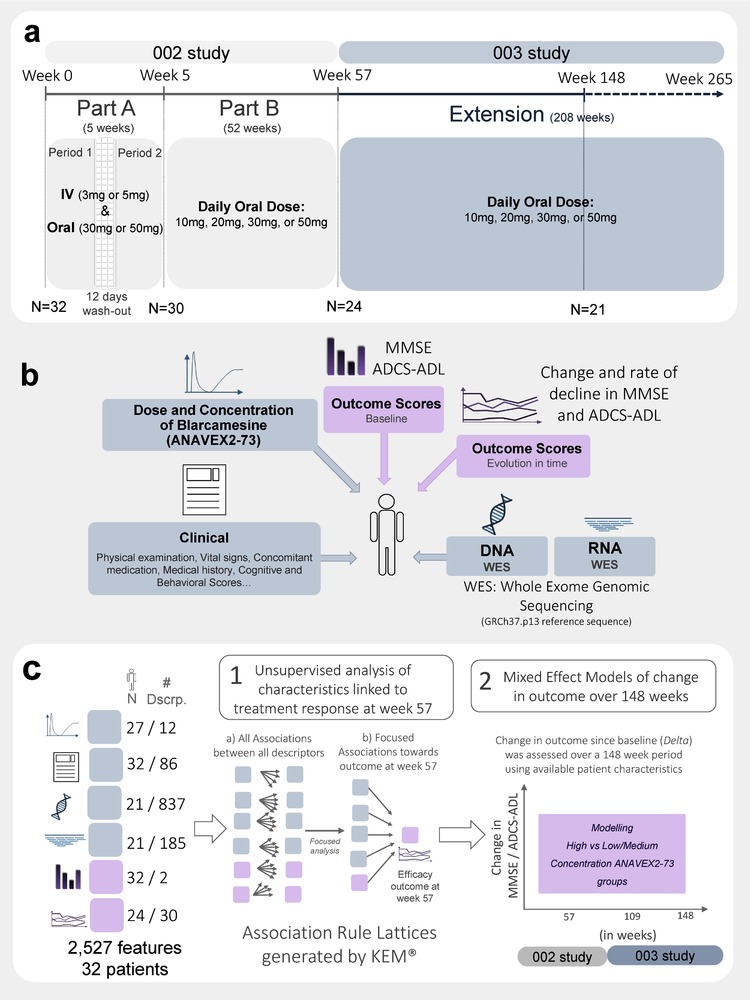
Overview of study design, data availability, and analytical methods. (a) Summary of consecutive clinical trials ANAVEX2‐73‐002 involving two parts: Part A over 5 weeks and Part B over 52 weeks, and the ANAVEX2‐73‐003 extension study over a planned 208‐week period immediately after the initial trial, with a cumulative 265 weeks. (b) Summary of integrated data sources. A total of 2527 features, from 1152 descriptors, were used for each subject, including 837 genomic sequences with amino acid changes, from a total of 27,155 annotated genes and 185 RNA expression profiles. Patient descriptors are shown in gray and outcomes in pink. (c) Classification of number of patient descriptors incorporated in the two analytical steps applied in the study: (1) Unsupervised FCA rule‐based analysis of response at week 57 and (2) longitudinal confirmation using mixed effect modeling of response over 148 weeks with markers found at week 57 to model two groups of ANAVEX2‐73 concentrations
TABLE 1.
Baseline characteristics (N = 32 and N = 21)
| All patients at baseline (N = 32) | Patients having genomic data (N = 21) | |
|---|---|---|
| Age, mean ± SD | 68.9 ± 9.84 | 67.9 ± 9.85 |
| Male, n (%) | 19 (59.4) | 10 (47.6) |
| Height (cm), mean ± SD | 169.9 ± 10.38 | 169.2 ± 9.84 |
| Weight (cm), mean ± SD | 76.8 ± 14.79 | 78.3 ± 16.31 |
| Cardiovascular disease, n (%) | 20 (62.5) | 12 (57.1) |
| Donepezil on‐going treatment, n (%) | 25 (78.1) | 16 (76.2) |
| APOE ε4‐positive, n (%) | 18 (56.3) | 10 (47.6) |
| APOE ε3/ε4, n (%) | 14 (43.6) | 7 (33.3) |
| APOE ε4/ε4, n (%) | 4 (12.6) | 3 (14.3) |
| Mini‐Mental State Examination (MMSE), mean ± SD | 21.0 ± 3.16 | 21.0 ± 2.73 |
| ADCS‐ADL, mean ± SD | 69.0 ± 6.83 | 70.6 ± 4.08 |
| Rosen Modified Hachinski Ischemic score, mean ± SD | 1.0 ± 0.67 | 1.0 ± 0.63 |
| Hamilton Psychiatric Rating Scale for Depression (HAM‐D), mean ± SD | 2.1 ± 2.18 | 2.2 ± 2.48 |
Baseline mean and standard deviation of characteristics of the 32 patients enrolled in ANAVEX2‐73‐002 study at baseline and the 21 patients having genomic data collected.
Patient tumors are routinely characterized in oncology studies by sequencing of their genomic material to identify and rank genomic biomarkers of disease and therapeutic response. 15 Genetic polymorphisms and changes in expression levels in somatic cells are associated with variations in treatment response in oncology, modulating therapeutic response in patient populations. 16 , 17 , 18
A similar strategy to the aforementioned one in precision oncology can also be applied to enhance therapeutic efficacy in neurologic disorders. In this study, whole exome sequencing (WES) and gene expression (RNAseq) were analyzed at 103 to 135 weeks in the 21 patients continuing in the ANAVEX2‐73‐003 study (Figure 1b). The integration of genomic data from these samples with longitudinal clinical and other patient data, including efficacy outcome measures and derived measures of progression, led to the identification and ranking of patient selection markers (Figures 1b and 1c).
Small sample sizes, for which the number of patient observations is orders of magnitude smaller than the number of attributes, is an analytical challenge 19 , 20 , 21 for standard statistical platforms. Formal concept analysis (FCA) is less affected by population size than other statistical analysis platforms. In this study, FCA, integrated in Knowledge Extraction and Management (KEM) software (v.3.6.2), 22 , 23 was used to identify and rank phenotypic and genotypic biomarkers. No link was assumed in these analyses of biomarkers and therapeutic responses, enabling a hypothesis free, data‐driven, tabulation of all relational effects between potential biomarkers and therapeutic responses in patients with AD.
2. METHODS
2.1. Study design
The present study analyzes data from two consecutive clinical trials: ANAVEX2‐73‐002 (http://NCT02244541) and ANAVEX2‐73‐003 (http://NCT02756858). ANAVEX2‐73‐002 was a multicenter Phase 2a clinical trial of the drug blarcamesine (ANAVEX2‐73) that recruited 32 subjects with mild‐to‐moderate AD. This was a two‐part study: Part A was a simple randomized, open‐label, two‐period, cross‐over, adaptive trial lasting up to 5 weeks. Each period involved one specific administration route and two possible dose levels: in the first period, the oral dose (30 or 50 mg) was administered, and in the second period an intravenous (IV) form (3 or 5 mg) was administered, with a total of eight possible dose administration schemes in Part A (details available in Fig. S1a in supporting information). The two periods were separated by a wash‐out period of 12 days when no dose was given.
Part B, following immediately after Part A, was an open‐label extension of the oral daily dose for an additional 52 weeks. The primary endpoint of ANAVEX2‐73‐002 was to establish the safety and tolerability of the drug. Secondary endpoints aimed at establishing the relationship between dosing regimen and pharmacodynamics‐exploratory efficacy outcomes of cognition and function. Cognition was assessed by the MMSE, while functional abilities were assessed by the ADCS‐ADL. Additional cognitive measures included the Cogstate Brief Battery (CBB) and functional measures of electroencephalography and event‐related potential (EEG and ERP). Part B continued an adaptive oral administration scheme. Figure S1d in supporting information summarizes the mean oral dose administration during the ANAVEX2‐73‐002 study.
Due to the favorable safety and tolerability profile of ANAVEX2‐73‐002 (Supplementary Table 1 and 2), and in response to requests from patients and caregivers, a 208‐week open‐label extension study (ANAVEX2‐73‐003) was added immediately after completion of ANAVEX2‐73‐002 Part B. ANAVEX2‐73‐003 enrolled the 24 subjects who completed Part B and applied similarly an adaptive daily oral administration scheme. ANAVEX2‐73‐003 includes continuous evaluation of safety and efficacy as measured by the MMSE and ADCS‐ADL. At week 148 (interim time point for analyses), data on the subjects remaining in the study (n = 21) was analyzed for efficacy outcomes. This article reports data up to week 148, while ANAVEX2‐73‐003 was still ongoing. The baseline for these analyses is defined as week 0 (Figure 1a) after all screening and baseline procedures have been completed.
2.2. Subjects
A total of 32 subjects with mild‐to‐moderate AD, between 50 and 85 years of age, were enrolled across three sites in Australia from December 2014 through September 2015. Their diagnoses were consistent with Diagnostic and Statistical Manual of Mental Disorders 4th edition (DSM‐IV) 24 and National Institute of Neurological and Communicative Disorders and Stroke/Alzheimer's Disease and Related Disorders Association criteria, 25 and included evaluation of magnetic resonance imaging (MRI) and/or computed tomography (CT) brain scans. The demographics and baseline characteristics of the 32 participants are summarized in Table 1 along with the group of participating subjects with genomic data collected after protocol amendment and patient consent (N = 21). Table S1 summarizes patient disposition. Seven patients discontinued therapy during the 57‐week ANAVEX2‐73‐002 study; six withdrew their consent and one had an adverse event (AE). An additional three patients discontinued therapy in the ANAVEX2‐73‐003 study throughout a 148‐week interim period of the on‐going extension study.
The following assessment scores and criteria were recorded at baseline and at each visit: MMSE, ADCS‐ADL, Hamilton Depression Rating scale (HAM‐D) assessment, Rosen Modified Hachinski Ischemic score (RmHis), CBB, and EEG/ERP. CBB subtests consisted of six different subscores: Detection (DET; Processing Speed), Identification (IDN; Attention/Vigilance), One‐Card‐Learning (OCL; Visual Recognition Memory), One‐Back (OBK; Working Memory), International Shopping List (ISLT; Verbal Learning), and International Shopping List delayed recall (ISRL; Verbal Memory).
RESEARCH IN CONTEXT
Systematic review: The authors reviewed the literature using PubMed, clinicaltrials.gov, and relevant Alzheimer's disease (AD) meeting abstracts and presentations. This study is, to the best of our knowledge, the first reported genome‐wide search for biomarkers associated with drug response in AD.
Interpretation of results: Our findings have led to the identification of two genomic variants and a clinical baseline to pre‐specify patients most likely to respond to a SIGMAR1 therapy using blarcamesine.
Future directions: The findings from this analysis have led to an ongoing confirmatory, randomized, and placebo‐controlled Phase 2b/3 study investigating blarcamesine in 450 subjects (http://NCT03790709).
2.3. Study endpoints
2.3.1. Safety endpoints
Safety was evaluated by assessment of incidence and severity of AEs (Table S2), vital signs, physical examination, clinical laboratory parameters (hematology, serum chemistry, and urinalysis), and electrocardiogram (data not shown).
2.3.2. Efficacy outcomes
Exploratory clinical efficacy in this study was defined as change from baseline of each patient's cognitive (MMSE) and functional ability (ADCS‐ADL) scores. MMSE 26 is a widely used and validated instrument in clinical AD research, included as a cognitive outcome measure in drug trials. The range of this scale is from 0 to 30, with a higher score indicating higher cognitive function. The ADCS‐ADL 27 is applied in a structured caregiver interview format and assesses performance in activities of daily living of patients with AD. The scale is from 0 to 78, with a higher score indicating greater function. The ADCS‐ADL has been shown to have good test‐retest reliability. 28 The MMSE and the ADCS‐ADL were assessed during pre‐specified clinical site visits across 14 different time points over the ANAVEX2‐73‐002 (weeks 0 and 5 in Part A; weeks 17, 31, 41, 53, and 57 in Part B), and ANAVEX2‐73‐003 (weeks 70, 83, 96, 109, 122, 135, and 148) studies.
Changes in scores over baseline (Delta) were calculated using the difference between values at each visit and at baseline for each individual patient. In addition, a rate of decline (Slope) was estimated for each individual patient having at least two scores recorded during the ANAVEX2‐73‐002 study to lower the impact of noise in MMSE and ADCS‐ADL scores, with a simple linear regression analysis across all available time points between the baseline and week 57 (end of ANAVEX2‐73‐002). The scores from these clinical outcomes show the progression of exploratory efficacy data from baseline at several specific time points (Deltas) and over a set period of 57 weeks (Slope). Subscores and derived measures from the same test score do not have an impact on the analytical platform in this study because they identify each relation independently of each other.
Tables S3a and S3b in supporting information summarize change since baseline of MMSE and ADCS‐ADL scores at 13 time points in ANAVEX2‐73‐002 (weeks 5, 17, 31, 41, 53, and 57) and in ANAVEX2‐73‐003 (weeks 70, 83, 96, 109, 122, 135, and 148). Summary statistics for Slopes for MMSE and ADCS‐ADL over 57 weeks are illustrated in Table S3a.
2.4. Pharmacokinetics
A pharmacokinetics analysis was performed during Part A only. Blood samples were drawn at 12 and 11 time points after the first oral or IV administration during the first and second periods of Part A, respectively. Pharmacokinetic parameters included in the analysis consisted of maximum plasma drug concentration (Cmax), time to maximum plasma concentration during a dosing interval (tmax), area under the curve from the time of dosing to the last measurable concentration (AUC0–t), mean elimination half‐life (t ½), and the total body clearance for extravascular administration divided by the fraction of dose absorbed (CL/F). Figure S1b shows AUC0‐inf after first administration (24 first hours).
Steady‐state plasma levels of blarcamesine (ANAVEX2‐73) and its metabolite ANAVEX19‐144 were measured in Part B in blood samples collected at prespecified time points (weeks 17, 31, 41, and 53). Mean concentration values in ng/mL were averaged for each patient. Figure S1e shows mean plasma concentrations of blarcamesine (ANAVEX2‐73) and its metabolite ANAVEX19‐144 in the ANAVEX2‐73‐002 study.
The relationship between dose and plasma concentration of blarcamesine (ANAVEX2‐73) was determined in a Phase 1 study, 13 and can be assumed to be linear in the 1 to 60 mg range in healthy male subjects. The dose‐dependent increase of plasma concentration of blarcamesine (ANAVEX2‐73) and metabolite has also been confirmed in the present study, as shown in Fig. S1b.
2.5. DNA and RNA extraction and sequencing
The protocol was amended to allow collection of blood samples in the ANAVEX2‐73‐003 extension study. The 21 patients who were still enrolled in the study at the time of protocol amendment accepted blood sample collection. Blood samples were collected at the next scheduled visit, between weeks 103 and 135. These samples were sequenced for DNA (WES) and RNA expression levels (RNASeq). Standard quality control (Q‐Score) as specified by the manufacturer Illumina 29 was applied and all reported sequences passed these standard quality control thresholds. 30 We identified 408,551 DNA variants within the cohort. Of these, 39,974 high‐ or moderate‐impact variants 31 driving an amino acid modification in proteins were kept; RNA expression values were normalized as transcripts per kilobase million. 32 , 33 An additive genetic model was used in the association study. When using a binary descriptor for genomic variants, the presence of one copy of the allele was considered sufficient to define the descriptor. For example, apolipoprotein E gene (APOE) genotype ε4 (APOE ε4/‐) was considered “TRUE” if at least one copy of ε4 was present.
2.5.1. Focused gene subset
We selected 243 genes from the 27,155 mapped sequences in the NGS analysis (Fig. S2a, S2b, S2c in supporting information). 102 genes were selected from their association with neurodegenerative diseases (Fig. S2a). A total of 113 genes of the cytochrome P450s gene family and 10 genes from the methyltransferase gene family were also added (S2b). Finally, 20 genes were selected as part of a SIGMAR1's functional interactome (Fig. S2c and S2d), based on a confidence score of 0.150 from the STRING database (January 2018). 34
2.6. Data analysis
Data analysis with the association rule‐based FCA platform on week 57 identified and ranked candidates for patient selection biomarkers for therapeutic response. Confirmation of this week 57 draft biomarker list was shown in linear mixed effect (LME) models and unadjusted mean averages after 148 weeks. Figure 1b illustrates the different types of data used in the analyses. Figure 1c displays the two different types of analyses applied for identification and confirmation of patient selection markers for therapeutic response.
2.6.1. Association rules and the KEM® platform
The KEM® v 3.6.2 22 , 23 analytical platform systematically extracted relations between all variables collected. These relations are developed from Galois lattices theory, or FCA. 35 KEM identifies groups of objects with shared properties 23 , 36 and generates corresponding association rules. Association rules have been developed to detect patterns and relationships in large heterogeneous databases. 37 , 38
FCA was introduced by Agrawal and Srikant. 39 , 40 FCA has been successfully applied in different domains, including: drug discovery, 22 , 41 studies for the identification of patient selection biomarkers for therapeutic responses, 42 , 43 genomic characterization of complex diseases, 44 and market basket analysis. 45 FCA association rules may reflect a causal relationship between two variables. However, the presence of a statistically significant association is neither necessary nor sufficient to indicate the presence of such causal relationships. 46 Quality measures described below calibrate the value of these association rules.
An association rule is a relationship such as X→Y, with X being the antecedent (or a combination of antecedents) and Y the consequent (or combination of consequents) of the rule, that allows inferring X as a consequence of Y. For a dataset of N subjects, nX, nY, and nXY, respectively are the numbers of subjects satisfying:
the antecedent(s) X of a rule,
the consequent(s) Y, and
both parts of the rule.
The nxy subjects matching any association rule can be identified with this platform.
Six quality measures describe and rank association rules:
Support
Confidence
Lift
Two P‐values
Measures of significance
Cohen's d (a measure of effect size)
Support, confidence, and lift
Support is the number of subjects for which the association has been observed:
Confidence is the percentage of the characterized subjects verifying the rule:
Lift (relative probability) is the ratio of observed support to that expected if X and Y were independent. N represents the total number of subjects. It measures the performance of a rule to identify a subgroup from a larger population:
See Methods S1 in supporting information for details of measures of significance, size effect, and discretization.
2.6.2. Linear mixed effect models
The routine application of LME modeling for continuous primary endpoints in longitudinal clinical trials and specifically to analyze the outcome of AD clinical studies is reflected in several publications. 47 , 48 LME models were developed with the R statistical software lme4 package. 49 , 50 Clinical outcomes of the LME models were changes in MMSE and ADCS‐ADL continuous scores compared to baseline. The same baseline (week 0) was used as defined in Section 2.1. Details of the LME models are given in Methods S2 in supporting information.
3. RESULTS
3.1. Exploratory therapeutic response analysis: Response to blarcamesine (ANAVEX2‐73) at week 57
A total of 3,145,630 relations between all available features were explored. Stringent filtering focused on relationships of response at week 57 (end of Part B) reduced the number of associations to only 15 linked to clinical outcomes, as measured by change from baseline (Delta) or rate of decline (Slope) MMSE or ADCS‐ADL (Table 2a). Within the 15 relations identified, average blood concentration of blarcamesine (ANAVEX2‐73) above 4 ng/mL in Part B increased the probability of improved MMSE outcome 1.88‐fold at week 57 (Table 2a). Higher concentrations also increased the probability of improved ADCS‐ADL scores (P = .03; Fig. S1c). Lower MMSE baseline scores (<20) increased the relative probability (lift) of worse MMSE outcome by 1.5‐fold, while higher MMSE baseline scores (≥20) increased the relative probability of improved MMSE by 1.62‐fold, both at week 57.
TABLE 2.
(a) FCA association rules results for clinical outcomes at week 57. Stringent filtering excluded rules containing variables coding for the absence of DNA variants and medium RNA expression groups. Numerical filtering of rules had the following thresholds: support (n > 3), confidence (>50%), and lift (≥1.2). The filtering steps led to a subset of 4009 association rules linking clinical, genomic, and transcriptomics patient characteristics with response at multiple time points. A second filtering step focused on relationships with response at week 57 only, raising support ≥ 5, lift ≥ 1.5, and P‐value (Fisher exact test or Mann‐Whitney‐Wilcoxon <.05), and excluding RNA expression, CYP variants, and dose/concentration from Part A. This further reduced the number of rules to 15 associations linked to clinical outcomes as measured by change since baseline, labeled Delta (with binarized discretization; see Supplementary Table 3a), or slope of MMSE or ADCS‐ADL at week 57. The 15 rules are shown in decreasing order for highest confidence and highest lift
| Antecedent X | Consequent Y | ||||||||||
|---|---|---|---|---|---|---|---|---|---|---|---|
| Patient Characteristic | Endpoint | Deriv. | Outcome | Week | Support | Confidence | Lift | Fisher exact test P‐value | Mann‐Whitney‐Wilcoxon P‐value | nx | ny |
| SIGMAR1 p.Gln2Pro variant | MMSE | Delta | Worsen | 57 | 5 | 1 | 1.75 | .039 | .081 | 5 | 12 |
| COMT p.L146fs variant | MMSE | Delta | Worsen | 57 | 5 | 1 | 1.75 | .039 | .106 | 5 | 12 |
| RmHis hypertension history FALSE | ADCS‐ADL | Delta | Worsen | 57 | 9 | 1 | 1.62 | .002 | .001 | 9 | 13 |
| MS4A6E p.M59T variant | ADCS‐ADL | Delta | Worsen | 57 | 6 | 1 | 1.62 | .032 | .101 | 6 | 13 |
| COMT p.Leu146fs variant | ADCS‐ADL | Delta | Worsen | 57 | 5 | 1 | 1.62 | .063 | .007 | 5 | 13 |
| SIGMAR1 p.Gln2Pro variant | ADCS‐ADL | Delta | Worsen | 57 | 5 | 1 | 1.62 | .063 | .035 | 5 | 13 |
| Baseline score MMSE low | MMSE | Slope | Worsen | 57 | 8 | 1 | 1.5 | .015 | .109 | 8 | 14 |
| HLA‐DRB1 p.Y89S variant | MMSE | Slope | Worsen | 57 | 7 | 1 | 1.5 | .03 | .039 | 7 | 14 |
| HLA‐DRB1 p.Y89S variant | MMSE | Delta | Worsen | 57 | 6 | 0.86 | 1.5 | .078 | .039 | 7 | 12 |
| DPYD p.I543V variant | MMSE | Delta | Improve | 57 | 5 | 0.71 | 1.67 | .08 | .043 | 7 | 9 |
| High baseline score ISRL | MMSE | Delta | Improve | 57 | 7 | 0.7 | 1.63 | .024 | .006 | 10 | 9 |
| RmHis hypertension history TRUE | ADCS‐ADL | Delta | Improve | 57 | 8 | 0.67 | 1.75 | .002 | .001 | 12 | 8 |
| High concentration AV2‐73 Part B | MMSE | Slope | Improve | 57 | 5 | 0.63 | 1.88 | .041 | .308 | 8 | 7 |
| High baseline score ISRL | MMSE | Slope | Improve | 57 | 6 | 0.6 | 1.8 | .021 | .006 | 10 | 7 |
| High baseline score MMSE | MMSE | Slope | Improve | 57 | 7 | 0.54 | 1.62 | .015 | .109 | 13 | 7 |
nx: number of antecedent (patient characteristic) observations
ny: number of consequent (Endpoint) observations
Deriv.: Calculation used for derived endpoint descriptor.
Delta: Change since baseline.
Slope: Rate of decline since baseline.
RmHis: Rosen Modified Hachinski Ischemic Score
ISRL: International Shopping List Delayed Recall (the measure describes the total number of words correctly recalled in verbal memory test).
3.1.1. Genomic markers
As we focused on relations displaying a 100% confidence and true for both a change in MMSE and a change in ADCS‐ADL, two DNA variants were identified, SIGMAR1 p.Gln2Pro (rs1800866) and COMT p.Leu146fs (rs113895332/rs61143203; Table 2b). Observed genotypes for SIGMAR1 p.Gln2Pro and COMT p.Leu146fs are shown in Table 2c. Genetic variants for SIGMAR1 p.Gln2Pro for the 21 patients were confirmed by an independent group using a real‐time PCR (rtPCR) assay. Blinded samples showed a 100% concordance between the rtPCR data and the reported WES data (data not shown). The structural impact of SIGMAR1 p.Gln2Pro was also modeled in Fig. S3 in supporting information. No multiple testing was applied to the top filtered rules.
TABLE 2.
(b) Association rule results of variants linked to worsen MMSE and ADCS‐ADL scores at week 57 (confidence = 100%)
| Antecedent X | Consequent Y | ||||||||||
|---|---|---|---|---|---|---|---|---|---|---|---|
| Variant | nx | Endpoint | Deriv. | Outcome | Week | ny | Support | Confidence | Lift | Fisher exact test P‐value | Mann‐Whitney‐Wilcoxon P‐value |
| COMT p.Leu146fs | 5 | MMSE | Delta | Worsen | 57 | 12 | 5 | 1.00 | 1.75 | .039 | .106 |
| COMT p.Leu146fs | 5 | ADCS‐ADL | Delta | Worsen | 57 | 13 | 5 | 1.00 | 1.62 | .063 | .007 |
| SIGMAR1 p.Gln2Pro | 5 | MMSE | Delta | Worsen | 57 | 12 | 5 | 1.00 | 1.75 | .039 | .081 |
| SIGMAR1 p.Gln2Pro | 5 | ADCS‐ADL | Delta | Worsen | 57 | 13 | 5 | 1.00 | 1.62 | .063 | .035 |
Deriv.: Calculation used for derived endpoint descriptor.
Delta: Change since baseline.
Slope: Rate of decline since baseline.
nx, number of antecedent (patient characteristic) observations; ny, number of consequent (endpoint) observations.
TABLE 2.
(c) Genotype information of SIGMAR1 p.Gln2Pro, COMT p.Leu146fs, and APOE variants
| SIGMAR1 p.Gln2Pro (rs1800866) (N = 21) | |||
|---|---|---|---|
| genotype | T/T (wild‐type) | T/G (heterozygous variant) | G/G (homozygous variant) |
| n | 16 | 5 | 0 |
| COMT p.Leu146fs (rs113895332/rs61143203) (N = 21) | |||
|---|---|---|---|
| genotype | T/T (wild‐type) | ‐/T (heterozygous variant) | ‐/‐ (homozygous variant) |
| n | 16 | 4 | 1 |
| APOE (rs429358/rs7412) N = 32 (N* = 21) | ||||
|---|---|---|---|---|
| genotype | ε2/ε3 | ε3/ε3 | ε3/ε4 | ε4/ε4 |
| n (n*) | 1 (1) | 14 (10) | 13 (7) | 4 (3) |
N: Number of total patients.
N*: Number of patients with WES data.
n: Number of patients in each genotype group.
n*: Number of patients in each genotype having WES data.
3.1.2. Effect size at week 57
Daily treatment with ANAVEX2‐73 for 57 weeks for the entire Phase 2a cohort showed effect sizes of 0.57 and 0.18 for change in MMSE and change in ADCS‐ADL, respectively, compared to standard of care (Table 3). When patients carrying SIGMAR1 p.Gln2Pro and COMT p.Leu146fs variants and low baseline MMSE score (9 out of 21 patients) were excluded, effect sizes increased to 1.05 and 0.93 for MMSE and ADCS‐ADL, respectively (Table 3). These values are considered "large" according to Cohen's d guidelines. 51
TABLE 3.
Effect size on clinical outcomes at week 57
| MMSE | ADCS‐ADL | |||||
|---|---|---|---|---|---|---|
| Subjects’ characteristics | Mean Δ at 57 weeks | Cohen's d | N (%) | Mean Δ at 57 weeks | Cohen's d | N (%) |
| All | −1.52 ± 4.15 | 0.57 a | 21 (100.0%) | −5.24 ± 8.42 | 0.18 | 21 (100.0%) |
| Baseline MMSE ≥ 20 | −0.15 ± 4.06 | 0.94 b | 13 (61.9%) | −2.08 ± 5.88 | 0.66 a | 13 (61.9%) |
| Absence of SIGMAR1 p.Gln2Pro variant | −0.62 ± 4.11 | 0.81 b | 16 (76.2%) | −3.38 ± 7.60 | 0.43 | 16 (76.2%) |
| Absence of COMT p.Leu146fs variant | −0.62 ± 4.05 | 0.81 b | 16 (76.2%) | −2.44 ± 6.93 | 0.57 a | 16 (76.2%) |
| Absence of SIGMAR1 p.Gln2Pro variant and baseline MMSE ≥ 20 | 0.27 ± 4.29 | 1.01 b | 11 (52.4%) | −1.36 ± 6.09 | 0.76 a | 11 (52.4%) |
| Absence of COMT p.Leu146fs variant and baseline MMSE ≥ 20 | 0.18 ± 4.35 | 0.98 b | 11 (52.4%) | −0.73 ± 5.29 | 0.89 b | 11 (52.4%) |
| Absence of SIGMAR1 p.Gln2Pro variant and absence of COMT p.Leu146fs variant and baseline MMSE ≥ 20 | 0.50 ± 4.45 | 1.05 b | 10 (47.6%) | −0.40 ± 5.46 | 0.93 b | 10 (47.6%) |
Summary of mean change in MMSE and mean change in ADCS‐ADL scores at week 57 since baseline, Cohen's d effect size calculation compared to standard of care 40 , 41 , 42 , 43 depending on genomic variant status of SIGMAR1 p.Gln2Pro and COMT p.Leu146fs, and/or baseline MMSE score.
Mean ± SD Delta scores baseline to week 57 are presented.
3.2. Confirmation of markers of response at week 57: Interim analysis at week 148
3.2.1. Confirmation at 148 weeks: LME models
Biomarkers for therapeutic response identified at week 57 were confirmed using regression analyses of longitudinal data at 148 weeks in the ANAVEX2‐73‐003 extension study. This analysis included 21 patients with genomic data and 287 results across 14 time points (Table S4a in supporting information). Blarcamesine (ANAVEX2‐73) concentration in Part B, identified as predictor of therapeutic response at week 57, was used to define two arms for the LME model. In addition to parameters identified at week 57 (ANAVEX2‐73 concentration levels, baseline MMSE score, SIGMAR1 p.Gln2Pro, and COMT p.Leu146fs variants), age, sex, APOE ε4 genotype status, and donepezil co‐medication were included in the LME models of change in MMSE and change in ADCS‐ADL. Observed genotypes of APOE for patients included in model are presented in Table 2c.
This analysis showed that the higher blarcamesine (ANAVEX2‐73) mean concentration arm had improved therapeutic responses of 78% and 88% in adjusted MMSE and adjusted ADCS‐ADL, respectively, relative to the low/medium arm at 148 weeks (P‐values < .0008 and <.0001, respectively). In addition to time, APOE ε4 status (P < .0001), and blarcamesine (ANAVEX2‐73) mean concentration were significant predictors (Figure 2a and 2b and Supplementary Tables 4b, 4c). Additional significant variables in this model were SIGMAR1 p.Gln2Pro, COMT p.Leu146fs, and APOE4 ε4 status interactions with time.
FIGURE 2.
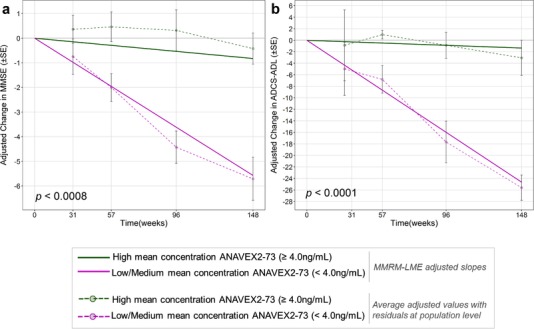
Linear mixed effect (LME) models of change in Mini‐Mental State Examination (MMSE) and Alzheimer's Disease Co‐operative Study‐Activities of Daily Living scale (ADCS‐ADL) since baseline over 148 weeks. To analyze the effect of high concentration on outcome over time, significant fixed effect terms linked to concentration were kept in the model. This has the effect of “correcting” for all other parameters except concentration. Because part of the response signal is not explained by the model (random error), this “residual” was added to the adjusted response values. For each time point, the model generates an adjusted predicted outcome for each patient. This adjusted outcome includes the residual mentioned above. For each time point, a mean and standard deviation of the adjusted outcome were calculated for the 21 patients and represented as solid points and error bars linked by dotted lines. A, LME‐adjusted slopes for the high concentration (green) cohort versus low and medium concentration patient cohort (magenta) with time (in weeks) against adjusted change in MMSE. Average adjusted values with residuals at the population level were plotted at each time point (dotted line). B, LME‐adjusted slopes for the high concentration (green) cohort versus low and medium concentration patient cohort (magenta) with time (in weeks) against adjusted change in ADCS‐ADL. Average adjusted values with residuals at the population level were plotted at each time point (dotted line)
3.2.2. Confirmation at 148 weeks: Unadjusted values
Unadjusted measures corroborated these results. Patients with biomarkers of improved therapeutic response at week 57 had improved therapeutic response in ADCS‐ADL at 148 weeks compared to those without these biomarkers or reference populations receiving standard of care (Figure 3a and 3b). Two patients showed exceptional therapeutic response during the longitudinal study (148‐week period). Both subjects had SIGMAR1 wild type, high mean concentration of blarcamesine (ANAVEX2‐73) in plasma and baseline MMSE ≥ 20 (Fig. S4 in supporting information). Clinical benefits reported included improvements in mood and alertness and increased independent activity.
FIGURE 3.
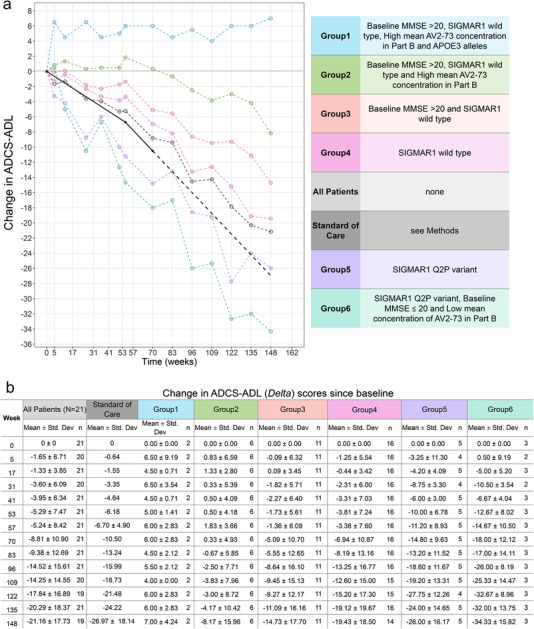
Unadjusted values of change in Alzheimer's Disease Co‐operative Study‐Activities of Daily Living scale (ADCS‐ADL) since baseline over 148 weeks. A, The plot presents (unadjusted) mean trajectories of change in ADCS‐ADL scores over interim 148 weeks of subgroups of ANAVEX2‐73‐002/003 patients depending on biomarker status (absent or present) and of patients given standard of care. The subgroups of ANAVEX2‐73‐002/003 patients are represented (blue, green, orange, pink, purple, and turquoise) with plot depending on identified biomarker and baseline criteria characteristics. B, Summary of the mean and standard deviations of different patient groups unadjusted change in ADCS‐ADL scores at 14 time points (weeks 0, 5, 17, 31, 41, 53, 57, 83, 96, 109, 122, 135, and 148). All patients in the ANAVEX2‐73 study are presented along with each patient subgroup depending on inclusion criteria. The standard of care mean changes from baseline for ADCS‐ADL scores were obtained from the literature with −6.7 point change in 1 year 42 and −10.5 change in 18 months/70 wk 43
4. DISCUSSION
This study is, to the best of our knowledge, the first reported genome‐wide search for biomarkers associated with improved therapeutic response in AD. This approach is different from standard classification or searches for molecular “signatures.” Analyzing pharmacological, genomic, and clinical data, including efficacy endpoints, the FCA‐based KEM framework identified and ranked predictors of response by association rules that are consistent with the observed data from our two clinical studies. The FCA platform enables an analysis of a very large combinatorial space, typically 109 and larger. Application of the platform to the present study led to a selection of smaller sets, typically 2 to 3 × 10⁶, and to the identification of dozens of important association rules, linking potential biomarkers with response. In contrast with “black box” numerical methods, the FCA approach allows the verification of each association rule for individual patients (as shown in Tables 2, 2). This analytical platform enables objective and explicit rules filtering strategies to identify patient selection biomarkers of therapeutic response.
The characterization of AD at early stages has been challenged by the absence of reliable genomic markers prognostic of the onset of mild cognitive impairment (MCI). APOE ε4 genotype status alone does not have sufficient predictive power, because only about 25% of the population carries the APOE ε4 genotype. TOMM40 52 has been proposed as a variant associated with the early detection of MCI, a hypothesis that was tested in the TOMORROW study. However, the TOMORROW study, which included 3494 patients (out of 24,136 screened) was not able to reach its primary biomarker endpoint. 53
Randomized clinical trials in AD have been challenged by two major hurdles:
Variability in the assessment of efficacy based on clinical evaluation of cognitive, behavioral, and functional changes over time with inherently noisy tests or questionnaires. Robust links have yet to be established between clinical outcomes and reproducible neuroimaging/fluid‐based biomarkers. The uncertainty in the values measured by these endpoints adds to the uncertainty in the determination of therapeutic efficacy.
Heterogeneity of AD, based on neurobehavioral features, inheritance (familial or sporadic) and other genetic characteristics, time course of progression, age of onset, pathological and other features, which have been discussed at length.
This observed heterogeneity is also seen in other therapeutic areas such as oncology. In oncology, multiple small, open‐label clinical trials are run in which a broad range of biomarker candidates are identified and hypotheses generated and tested iteratively, serving as foundation for the design of follow‐up controlled studies. Crizotinib is a good example of accelerated approval in oncology following an open‐label Phase 1a study, where a novel biomarker (ALK+) was first identified based on 2 of 11 patients with non‐small cell lung cancer enrolled in a Phase 1 dose escalation trial. 54 The biomarker was validated through an amended Phase 2a study including 19 patients, with 10 out of 19 patients being labeled as responders, which ultimately led to a preliminary drug registration. Subsequently, a confirmatory trial enrolled 82 ALK+ patients and showed 57% partial response and 1% complete response. Unbiased and unsupervised data analytics methods such as the KEM platform may be ideal tools to streamline this type of discovery process. As such, they provide systematic iterative precision medicine tools for drug development, suitable as much to AD as to oncology. The search for alternative druggable targets for AD is becoming a priority, and SIGMAR1 targeted by blarcamesine (ANAVEX2‐73) may be an important drug target to maintain cellular homeostasis, delay or halt neurodegeneration, and/or enhance synaptic compensatory responses, as suggested by experimental studies.
This article presents an unbiased analysis of data from two clinical studies, which enabled the identification of parameters associated with improved therapeutic response. By searching for and selecting biomarkers that are consistently associated with therapeutic response over multiple time points and multiple endpoints, a reliable identification and ranking of patient selection biomarkers for therapeutic response is possible. The approach described in this study, without a priori hypotheses, identified, in addition to a specific variant of the SIGMAR1 gene (rs1800866) and COMT variants (rs113895332/rs61143203), blarcamesine (ANAVEX2‐73) mean concentration, and baseline MMSE were included in the top 15 drivers of clinical response, from the >3 million retained subset of rules (Table 2a). Their relevance is supported because drug concentration is a more meaningful PK parameter than dose; low baseline MMSE is thought to be associated with an AD stage that has progressed beyond the reach of a number of therapeutic approaches; SIGMAR1 is the confirmed in vivo target of blarcamesine (ANAVEX2‐73); and COMT is a gene associated with memory and other neurobehavioral functions. 55 , 56
Biomarkers were identified in this article with the FCA framework, which enabled a systematic search for association rules between all parameters collected in the studies. FCA is an overview of relationships between all variables (ie, the analysis is not supervised), allowing mining and ranking these relationships based on measures of “interestingness”. 57 Commonly used interestingness measures include support (the number of patients verifying the relation), confidence (a probability of a property existing if a pre‐condition is set), and lift (a relative probability).
Unlike statistical tests and statistical modeling, association rules analysis does not state a null hypothesis nor estimates any parameters. Nevertheless, a measure of statistical significance of the association is calculated for each identified rule using the Fisher's exact test P‐value. This is a calculation of the likelihood that the relationship between the values of two variables, given a univariate rule X→Y, is caused by something other than chance. A threshold on P‐values in our study was set to P = .05, that is, the probability that the selected association is due to random chance is <5%.
Because association rule methods generate rules which are dependent on each other, multiple testing P‐values corrections, such as Bonferroni, are too conservative and reject true positive results. Instead, we characterized the magnitude of the changes in outcome by calculating effect sizes using Cohen's d. Monte Carlo simulations were considered to assess validity and reliability of results; however, they were deemed unsuitable in this analysis and are discussed in detail in the Discussion in supporting information.
The goal of FCA and association rule analysis is to explicitly generate hypotheses consistent with the data and provide a framework for ranking them. All hypotheses generated from the data are considered without a priori hypotheses. These hypotheses can be challenged by the existing body of evidence in the field, beyond the data contained in the trial, and are confirmed in subsequent experiments, as in any scientific discovery process. Short of testing the relations identified in this study in an independent cohort, we did an initial confirmation of the hypotheses generated by KEM with the longitudinal assessment over 148 weeks. LME models were derived using all 287 available observed outcome data from patients. LME models account for missing data and provide robust results in small clinical trial studies. 58
The LME model analysis at week 148 showed a significant difference in therapeutic response between the two concentration arms related to adjusted mean change from baseline in ADCS‐ADL (88%) and adjusted mean change from baseline MMSE (78%). These differences are significant and quite large. These values compare favorably with recent results obtained in other studies for data presented at CTAD 2018 for BAN2401 after 72 weeks: 59 47% in adjusted mean change from baseline in ADAS‐Cog and 30% adjusted mean change in ADCOMS, 60 in which about 18% of the change reported may be associated with an imbalance of the APOE ε4 genotype status in the respective arms.
There are some limitations in this study:
Small sample size, with 32 patients entering the study and 21 patients having available genomic data, which limited the power of the study.
Lack of adjustment for multiple comparisons in the analyses of relations between markers and therapeutic response.
Genomic analysis results reported for only a subset panel of 243 genes; however, an analysis of 39,974 DNA variants (Table S5 in supporting information) showed SIGMAR1 p.Gln2Pro and COMT p.Leu146fs in the top 0.2% association rules linked to outcome.
Standard of care measure of change in MMSE and change in ADCS‐ADL for calculating effect size were obtained from the literature at 48, 52, and 82 weeks 61 , 62 , 63 , 64 and extrapolated to 57 weeks, which was the time point used in this study.
RNA analysis was limited due to collection time (103 to 135 weeks) and lack of baseline transcriptome data for comparison. Nonetheless, an exploratory analysis did find that high SIGMAR1 expression was associated with better therapeutic response (Table S6 in supporting information).
Newly identified patient selection biomarkers were longitudinally confirmed for change in ADCS‐ADL, but not for change in MMSE, over 148 weeks. This result may be due to a higher variability in MMSE scores.
Findings from this study are the basis for a new ongoing Phase 2b/3 AD study (NCT03790709), as well as for identifying patient populations likely to have better therapeutic responses to blarcamesine (ANAVEX2‐73) in clinical trials for Parkinson's disease dementia (NCT03774459) and Rett syndrome (NCT03758924).
The FCA platform described in this work opens the possibility of using data‐driven unbiased biomarker identification early in the drug development process. The “white box” and systematic approach of FCA is ideal for the analysis of early data, leading to the identification of patient selection biomarkers that can assist in the design of more effective subsequent clinical trials.
CONFLICT OF INTERESTS
Harald Hampel is an employee of Eisai Inc. and serves as Senior Associate Editor for the Journal Alzheimer's & Dementia; during the past three years he had received lecture fees from Servier, Biogen and Roche, research grants from Pfizer, Avid, and MSD Avenir (paid to the institution), travel funding from Eisai, Functional Neuromodulation, Axovant, Eli Lilly and company, Takeda and Zinfandel, GE‐Healthcare and Oryzon Genomics, consultancy fees from Qynapse, Jung Diagnostics, Cytox Ltd., Axovant, Anavex, Takeda and Zinfandel, GE Healthcare, Oryzon Genomics, and Functional Neuromodulation, and participated in scientific advisory boards of Functional Neuromodulation, Axovant, Eisai, Eli Lilly and company, Cytox Ltd., GE Healthcare, Takeda and Zinfandel, Oryzon Genomics and Roche Diagnostics. He is co‐inventor in the following patents as a scientific expert and has received no royalties: In Vitro Multiparameter Determination Method for The Diagnosis and Early Diagnosis of Neurodegenerative Disorders Patent Number: 8916388. In Vitro Procedure for Diagnosis and Early Diagnosis of Neurodegenerative Diseases Patent Number: 8298784. Neurodegenerative Markers for Psychiatric Conditions Publication Number: 20120196300. In Vitro Multiparameter Determination Method for The Diagnosis and Early Diagnosis of Neurodegenerative Disorders Publication Number: 20100062463. In Vitro Method for The Diagnosis and Early Diagnosis of Neurodegenerative Disorders Publication Number: 20100035286. In Vitro Procedure for Diagnosis and Early Diagnosis of Neurodegenerative Diseases Publication Number: 20090263822. In Vitro Method for The Diagnosis of Neurodegenerative Diseases Patent Number: 7547553. CSF Diagnostic in Vitro Method for Diagnosis of Dementias and Neuroinflammatory Diseases Publication Number: 20080206797. In Vitro Method for The Diagnosis of Neurodegenerative Diseases Publication Number: 20080199966. Neurodegenerative Markers for Psychiatric Conditions Publication Number: 20080131921. Coralie Williams, Adrien Etcheto, and Frédéric Parmentier are employed by Ariana Pharmaceuticals. Mohammad Afshar is employed by and a shareholder of Ariana Pharmaceuticals. Federico Goodsaid is employed by and a shareholder of Regulatory Pathfinders. Walter E. Kaufmann is employed by Anavex Life Sciences Corp. Christopher U. Missling is employed by and a shareholder of Anavex Life Sciences Corp.
Supporting information
Supporting Information
ACKNOWLEDGMENTS
We wish to thank all patients and their caregivers, as well as all investigators and clinical teams in the cooperating centers in Australia, who participated in the trial. Harald Hampel is an employee of Eisai Inc. During his previous work (until April 2019) he was supported by the AXA Research Fund, the “Fondation partenariale Sorbonne Université” and the “Fondation pour la Recherche sur Alzheimer”, Paris, France.
AUTHOR CONTRIBUTIONS
Christopher U. Missling, Mohammad Afshar, and Federico Goodsaid contributed to the study design. Federico Goodsaid contributed to regulatory applications. Coralie Williams, Adrien Etcheto, and Frédéric Parmentier performed data integration, implemented statistical and machine learning analyses, and performed data interpretation. Mohammad Afshar and Jean Sallantin contributed to data interpretation and critical feedback of the statistical and machine learning results. Mohammad Afshar, Coralie Williams, Federico Goodsaid, Frédéric Parmentier, Walter E. Kaufmann, and Harald Hampel contributed to the writing of the manuscript and review. All authors discussed the results, provided critical feedback, and approved the final version of the manuscript.
SOFTWARE AVAILABILITY
All software tools used in the analysis of this paper, KEM, KNIME, and R statistical software, are commercially available.
Hampel H, Williams C, Etcheto A, et al. A precision medicine framework using artificial intelligence for the identification and confirmation of genomic biomarkers of response to an Alzheimer's disease therapy: Analysis of the blarcamesine (ANAVEX2‐73) Phase 2a clinical study. Alzheimer's Dement. 2020;00:1–14. 10.1002/trc2.12013
Contributor Information
Harald Hampel, Email: Harald.Hampel@med.uni-muenchen.de.
Walter E. Kaufmann, Email: walter.e.kaufmann@emory.edu.
Mohammad Afshar, Email: m.afshar@arianapharma.com.
DATA AVAILABILITY STATEMENT
Requests analyzed data and materials are promptly reviewed by the corresponding author to verify if the request is subject to any intellectual property or confidentiality obligations. Patient‐related data may be subject to patient confidentiality.
REFERENCES
- 1. Cummings J, Lee G, Ritter A, Zhong K. Alzheimer's disease drug development pipeline: 2018. Alzheimers Dement Transl Res Clin Interv. 2018;4:195‐214. [DOI] [PMC free article] [PubMed] [Google Scholar]
- 2. Dong A, Toledo JB, Honnorat N, et al. Heterogeneity of neuroanatomical patterns in prodromal Alzheimer's disease: links to cognition, progression and biomarkers. Brain J Neurol. 2017;140(3):735‐747. [DOI] [PMC free article] [PubMed] [Google Scholar]
- 3. Gamberger D, Lavrač N, Srivatsa S, Tanzi RE, Doraiswamy PM. Identification of clusters of rapid and slow decliners among subjects at risk for Alzheimer's disease. Sci Rep. 2017;7(1):6763. [DOI] [PMC free article] [PubMed] [Google Scholar]
- 4. Evans S, McRae‐McKee K, Wong MM, Hadjichrysanthou C, De Wolf F, Anderson R. The importance of endpoint selection: how effective does a drug need to be for success in a clinical trial of a possible Alzheimer's disease treatment?. Eur J Epidemiol. 2018;33(7):635‐644. [DOI] [PMC free article] [PubMed] [Google Scholar]
- 5. Su T‐P, Su T‐C, Nakamura Y, Tsai S‐Y. Sigma‐1 receptor as a pluripotent modulator in the living system. Trends Pharmacol Sci. 2016;37(4):262‐278. [DOI] [PMC free article] [PubMed] [Google Scholar]
- 6. Nguyen L, Lucke‐Wolds BP, Mookerjee S, Kaushal N, Matsumoto RR. Sigma‐1 receptors and neurodegenerative diseases: towards a hypothesis of sigma‐1 receptors as amplifiers of neurodegeneration and neuroprotection. Adv Exp Med Biol. 2017;964:133‐152. [DOI] [PMC free article] [PubMed] [Google Scholar]
- 7. Ruscher K, Wieloch T. The involvement of the sigma‐1 receptor in neurodegeneration and neurorestoration. J Pharmacol Sci. 2015;127(1):30‐35. [DOI] [PubMed] [Google Scholar]
- 8. Mavlyutov TA, Epstein ML, Verbny YI, et al. Lack of sigma‐1 receptor exacerbates ALS progression in mice. Neuroscience. 2013;240:129‐134. [DOI] [PMC free article] [PubMed] [Google Scholar]
- 9. Christ MG, Huesmann H, Nagel H, Kern A, Behl C. Sigma‐1 receptor activation induces autophagy and increases proteostasis capacity in vitro and in vivo. Cells. 2019;8(3):211. [DOI] [PMC free article] [PubMed] [Google Scholar]
- 10. Reyes ST, Guo SG, Castillo JB, et al. Sigma‐1 receptor target occupancy study with dynamic PET scan analysis of ANAVEX®2‐73, a clinical candidate for neurodegenerative and neurodevelopmental diseases. Alzheimers Dement J Alzheimers Assoc. 2018;14(7):P1547. [Google Scholar]
- 11. Lahmy V, Meunier J, Malmström S, et al. Blockade of tau hyperphosphorylation and Aβ1‐42 generation by the aminotetrahydrofuran derivative ANAVEX2‐73, a mixed muscarinic and σ1 receptor agonist, in a nontransgenic mouse model of Alzheimer's disease. Neuropsychopharmacology. 2013;38(9):1706‐1723. [DOI] [PMC free article] [PubMed] [Google Scholar]
- 12. Villard V, Espallergues J, Keller E, Vamvakides A, Maurice T. Anti‐amnesic and neuroprotective potentials of the mixed muscarinic receptor/sigma 1 (σ1) ligand ANAVEX2‐73, a novel aminotetrahydrofuran derivative. J Psychopharmacol Oxf Engl. 2011;25(8):1101‐1117. [DOI] [PubMed] [Google Scholar]
- 13. Voges O, Weigmann I, Bitterlich N, Missling C, Schindler C. A Phase I Dose Escalation Study to Investigate Safety, Tolerability, and Pharmacokinetics of ANAVEX 2‐73 in Healthy Male Subjects. CNS Summit 2014. Innovations in Clinical Neuroscience, 12(Suppl B), 1‐20. [Google Scholar]
- 14. Macfarlane S, Maruff P, Cecchi M, Moore D, Zografidis T, Missling C. New exploratory Alzheimer's drug anavex 2‐73: dose dependent clinical cognitive improvement observed in Mini Mental State Examination (MMSE) and other cognitive markers in a Phase 2a study in mild‐to‐moderate alzheimer's patients. Alzheimers Dement J Alzheimers Assoc. 2016;12(7):P419. [Google Scholar]
- 15. Hyman DM, Taylor BS, Baselga J. Implementing genome‐driven oncology. Cell. 2017;168(4):584‐599. [DOI] [PMC free article] [PubMed] [Google Scholar]
- 16. Kelloff GJ, Sigman CC. Cancer biomarkers: selecting the right drug for the right patient. Nat Rev Drug Discov. 2012;11:201. [DOI] [PubMed] [Google Scholar]
- 17. Morris‐Rosendahl DJ, Fiebich BL. The future of genetic testing for drug response. Dialogues Clin Neurosci. 2004;6(1):27‐37. [PMC free article] [PubMed] [Google Scholar]
- 18. Roden DM, Wilke RA, Kroemer HK, Stein CM. Pharmacogenomics: the genetics of variable drug responses. Circulation. 2011;123(15):1661‐1670. [DOI] [PMC free article] [PubMed] [Google Scholar]
- 19. Lee CH, Yoon H‐J. Medical big data: promise and challenges. Kidney Res Clin Pract. 2017;36(1):3. [DOI] [PMC free article] [PubMed] [Google Scholar]
- 20. Salsburg D. Hundreds of patients, thousands of observations: the curse of dimensionality in clinical research. Drug Inf J. 1993;27(3):597‐609. [Google Scholar]
- 21. Sinha A, Hripcsak G, Markatou M. Large datasets in biomedicine: a discussion of salient analytic issues. J Am Med Inform Assoc. 2009;16(6):759‐767. [DOI] [PMC free article] [PubMed] [Google Scholar]
- 22. Jullian N, Jourdan N, Afshar M. Hypothesis generation for scientific discovery. Examples from the use of KEM®, a rule‐based method for multi‐objective analysis and optimization. Solvay Pharmaceuticals Conferences. 2008;9: Towards Drugs of the Future: Key Issues in Lead Finding and Lead Optimization:75‐80. 10.3233/978-1-58603-949-3-75 [DOI] [Google Scholar]
- 23. Liquiere M, Sallantin J. Structural Machine Learning with Galois Lattice and Graphs. Proceedings of the Fifteenth International Conference on Machine Learning. 1998:305‐313. [Google Scholar]
- 24. Guze SB. Diagnostic and Statistical Manual of Mental Disorders. 4th ed. (DSM‐IV). Am J Psychiatry. 1995;152(8):1228‐1228. 10.1176/ajp.152.8.1228 [DOI] [Google Scholar]
- 25. McKhann G, Drachman D, Folstein M, Katzman R, Price D, Stadlan EM. Clinical diagnosis of Alzheimer's disease. Neurology. 1984;34(7):939. [DOI] [PubMed] [Google Scholar]
- 26. Folstein MF, Folstein SE, McHugh PR. “Mini‐mental state”: a practical method for grading the cognitive state of patients for the clinician. J Psychiatr Res. 1975;12(3):189‐198. [DOI] [PubMed] [Google Scholar]
- 27. Galasko D, Bennett D, Sano M, et al. An inventory to assess activities of daily living for clinical trials in Alzheimer's disease. Alzheimer Dis Assoc Disord. 1997;11(Suppl 2):S33‐S39. [PubMed] [Google Scholar]
- 28. Marsico M, Grant A, Chandler J. The reliability and validity of the Alzheimer's disease cooperative study–activities of daily living (ADCS‐ADL) in China. Alzheimers Dement J Alzheimers Assoc. 2015;11(7):P444. [Google Scholar]
- 29. Illumina . Understanding Illumina Quality Scores 2012. Available at: https://www.illumina.com/documents/products/technotes/technote_understanding_quality_scores.pdf.
- 30. Ewing B, Hillier L, Wendl MC, Green P. Base‐calling of automated sequencer traces using phred. I. Accuracy assessment. Genome Res. 1998;8(3):175‐185. [DOI] [PubMed] [Google Scholar]
- 31. Cingolani P, Platts A, Wang LL, et al. A program for annotating and predicting the effects of single nucleotide polymorphisms, SnpEff. Fly (Austin). 2012;6(2):80‐92. [DOI] [PMC free article] [PubMed] [Google Scholar]
- 32. Li B, Ruotti V, Stewart RM, Thomson JA, Dewey CN. RNA‐Seq gene expression estimation with read mapping uncertainty. Bioinformatics. 2010;26(4):493‐500. [DOI] [PMC free article] [PubMed] [Google Scholar]
- 33. Wagner GP, Kin K, Lynch VJ. Measurement of mRNA abundance using RNA‐Seq data: RPKM measure is inconsistent among samples. ResearchGate. 2012;131(4):281‐285. [DOI] [PubMed] [Google Scholar]
- 34. Szklarczyk D, Morris JH, Cook H, et al. The STRING database in 2017: quality‐controlled protein–protein association networks, made broadly accessible. Nucleic Acids Res. 2017;45(Database issue):D362‐D368. [DOI] [PMC free article] [PubMed] [Google Scholar]
- 35. Ganter B, Wille R. Formal Concept Analysis: Mathematical Foundations. 1st ed Berlin, Heidelberg, Germany: Springer‐Verlag; 1997. [Google Scholar]
- 36. Gasmi Gh, Yahia SB, Nguifo EM, Slimani Y. IGB: A new informative generic base of association rules In: Ho TB, Cheung D, Liu H, eds. Advances in Knowledge Discovery and Data Mining. Heidelberg, Germany: Springer Berlin Heidelberg; 2005:81‐90. 10.1007/11430919_11 [DOI] [Google Scholar]
- 37. Nebot V, Berlanga R. Finding association rules in semantic web data. Knowl‐Based Syst. 2012;25(1):51‐62. [Google Scholar]
- 38. Zhao Y, Zhang H, Figueiredo F, Cao L, Zhang C. Mining for Combined Association Rules on Multiple Datasets. In: Proceedings of the 2007 International Workshop on Domain Driven Data Mining DDDM ’07. New York, NY, USA: ACM; 2007:18‐23. 10.1145/1288552.1288555 [DOI]
- 39. Srikant R, Agrawal R. Mining generalized association rules. Data Min. 1997;13(2):161‐180. [Google Scholar]
- 40. Agrawal R, Imieliński T, Swami A. Mining Association Rules between Sets of Items in Large Databases. In: New York, NY, USA; 1993:207‐216. 10.1145/170036.170072. Accessed November 12, 2018. [DOI]
- 41. Afshar M, Lanoue A, Sallantin J. Multiobjective/Multicriteria Optimization and Decision Support in Drug Discovery. Comprehensive Medicinal Chemistry II. 2007:4:767‐774. 10.1016/B0-08-045044-X/00275-3 [DOI] [Google Scholar]
- 42. Abtroun L, Bunouf P, Gendreau RM, Vitton O. Is the efficacy of milnacipran in fibromyalgia predictable? A data‐mining analysis of baseline and outcome variables. Clin J Pain. 2016;32(5):435‐440. [DOI] [PMC free article] [PubMed] [Google Scholar]
- 43. Williams C, Polom K, Adamczyk B, et al. Machine learning methodology applied to characterize subgroups of gastric cancer patients using an integrated large biomarker dataset. Eur J Surg Oncol. 2019;45(2):e79. [Google Scholar]
- 44. Breuer R, Mattheisen M, Frank J, et al. Detecting significant genotype–phenotype association rules in bipolar disorder: market research meets complex genetics. Int J Bipolar Disord. 2018;6(1):24. [DOI] [PMC free article] [PubMed] [Google Scholar]
- 45. Blattberg RC, Kim B‐D, Neslin SA. Market basket analysis In: Blattberg RC, Kim B‐D, Neslin SA, eds. Database Marketing: Analyzing and Managing Customers. International Series in Quantitative Marketing. New York, NY: Springer New York; 2008:339‐351. 10.1007/978-0-387-72579-6_13 [DOI] [Google Scholar]
- 46. Tan PN, Steinbach M, Kumar V. Introduction to Data Mining. 1st ed Boston, MA: Addison‐Wesley Longman Publishing Co.; 2005. [Google Scholar]
- 47. Chen Y‐F, Ni X, Fleisher AS, Zhou W, Aisen P, Mohs R. A simulation study comparing slope model with mixed‐model repeated measure to assess cognitive data in clinical trials of Alzheimer's disease. Alzheimers Dement Transl Res Clin Interv. 2018;4:46‐53. [DOI] [PMC free article] [PubMed] [Google Scholar]
- 48. Broadhouse KM, Suo C, Singh MAF, et al. What happens to the hippocampus 12‐months after training? Longitudinal linear mixed effects model analysis of mild cognitive impairment in the smart trial. Alzheimers Dement J Alzheimers Assoc. 2017;13(7):P260. [Google Scholar]
- 49. R Core Team . R: A Language and Environment for Statistical Computing. Vienna, Austria: R Foundation for Statistical Computing; 2018. Available at: https://www.R-project.org/ [Google Scholar]
- 50. Bates D, Maechler M, Bolker B, et al. Lme4: Linear Mixed‐Effects Models Using “Eigen” and S4 2018. Available at: https://CRAN.R-project.org/package=lme4
- 51. Cohen J. Statistical Power Analysis for the Behavioral Sciences. New York, NY: Routledge Academic; 1988. [Google Scholar]
- 52. Roses AD, Lutz MW, Amrine‐Madsen H, et al. A TOMM40 variable‐length polymorphism predicts the age of late‐onset Alzheimer's disease. Pharmacogenomics J. 2010;10(5):375‐384. [DOI] [PMC free article] [PubMed] [Google Scholar]
- 53. Alexander R, Burns DK, Welsh‐Bohmer KA, et al. DT‐02‐02: Tommorrow: Results from a phase 3 trial to delay the onset of MCI due to AD and qualify a genetic biomarker algorithm. Alzheimer's and Dementia. 2019;15(7):P1488‐P1489. 10.1016/j.jalz.2019.08.011 [DOI] [Google Scholar]
- 54. Ou S‐HI. Crizotinib: a novel and first‐in‐class multitargeted tyrosine kinase inhibitor for the treatment of anaplastic lymphoma kinase rearranged non‐small cell lung cancer and beyond. Drug Des Devel Ther. 2011;5:471‐485. [DOI] [PMC free article] [PubMed] [Google Scholar]
- 55. Bruder GE, Keilp JG, Xu H, et al. Catechol‐O‐methyltransferase (COMT) genotypes and working memory: associations with differing cognitive operations. Biol Psychiatry. 2005;58(11):901‐907. [DOI] [PubMed] [Google Scholar]
- 56. de Frias CM, Annerbrink K, Westberg L, Eriksson E, Adolfsson R, Nilsson L‐G. COMT gene polymorphism is associated with declarative memory in adulthood and old age. Behav Genet. 2004;34(5):533‐539. [DOI] [PubMed] [Google Scholar]
- 57. Hilderman RJ, Hamilton HJ. Evaluation of interestingness measures for ranking discovered knowledge In: Cheung D, Williams GJ, Li Q, eds. Advances in Knowledge Discovery and Data Mining. Lecture Notes in Computer Science. Heidelberg, Germany: Springer Berlin Heidelberg; 2001:247‐259. [Google Scholar]
- 58. Muth C, Bales KL, Hinde K, Maninger N, Mendoza SP, Ferrer E. Alternative models for small samples in psychological research. Educ Psychol Meas. 2016;76(1):64‐87. [DOI] [PMC free article] [PubMed] [Google Scholar]
- 59. Swanson C. Clinical and Biomarker Updates from BAN2401 Study 201 in Early AD: Pre‐specified Subgroup Analysis in BAN2401 Study 201. Presented at the: October 24, 2018; 11th Clinical Trials on Alzheimer's Disease (CTAD) Conference. Barcelona, Spain. https://www.eisai.com/ir/library/presentations/pdf/e4523_181025.pdf. Accessed: February, 2020.
- 60. Cummings J. Clinical and Biomarker Updates from BAN2401 Study 201 in Early AD: BAN2401 Study 201 Design and Topline Results. Presented at the: 11th Clinical Trials on Alzheimer's Disease (CTAD) Conference; October 24, 2018; Barcelona, Spain. https://www.eisai.com/ir/library/presentations/pdf/e4523_181025.pdf. Accessed: February, 2020.
- 61. Clark C, Sheppard L, Fillenbaum G, et al. Variability in annual Mini‐Mental State Examination score in patients with probable Alzheimer disease: a clinical perspective of data from the consortium to establish a registry for alzheimer's disease. Arch Neurol. 1999;56(7):857‐862. [DOI] [PubMed] [Google Scholar]
- 62. Han L, Cole M, Bellavance F, McCusker J, Primeau F. Tracking cognitive decline in Alzheimer's disease using the Mini‐Mental State Examination: a meta‐analysis. Int Psychogeriatr. 2000;12(2):231‐247. [DOI] [PubMed] [Google Scholar]
- 63. Maher‐Edwards G, Watson C, Ascher J, et al. Two randomized controlled trials of SB742457 in mild‐to‐moderate Alzheimer's disease. Alzheimers Dement Transl Res Clin Interv. 2015;1(1):23‐36. [DOI] [PMC free article] [PubMed] [Google Scholar]
- 64. Schneider LS, Sano M. Current Alzheimer's disease clinical trials: methods and placebo outcomes. Alzheimers Dement J Alzheimers Assoc. 2009;5(5):388‐397. [DOI] [PMC free article] [PubMed] [Google Scholar]
Associated Data
This section collects any data citations, data availability statements, or supplementary materials included in this article.
Supplementary Materials
Supporting Information
Data Availability Statement
Requests analyzed data and materials are promptly reviewed by the corresponding author to verify if the request is subject to any intellectual property or confidentiality obligations. Patient‐related data may be subject to patient confidentiality.