

Abstract
In this study, we applied a quantitative proteomic approach, based on SILAC, to investigate the interactions of coronaviruses with the secretory pathway of the host cell, with the aim to identify host factors involved in coronavirus replication. Comparison of the protein profiles of Golgi‐enriched fractions of cells that were either mock infected or infected with mouse hepatitis virus revealed the significant depletion or enrichment of 116 proteins. Although ribosomal/nucleic acid binding proteins were enriched in the Golgi‐fractions of mouse hepatitis virus‐infected cells, proteins annotated to localize to several organelles of the secretory pathway were overrepresented among the proteins that were depleted from these fractions upon infection. We hypothesized that proteins, of which the abundance or distribution is affected by infection, are likely to be involved in the virus life cycle. Indeed, depletion of a small subset of the affected proteins by using small interfering RNAs identified several host factors involved in coronavirus infection. Transfection of small interfering RNAs targeting either C11orf59 or Golgi apparatus glycoprotein 1 resulted in increased virus replication, whereas depletion of vesicle‐trafficking protein vesicle‐trafficking protein sec22b enhanced the release of infectious progeny virus. Overexpression of these proteins, on the other hand, had a negative effect on virus replication. Overall, our study shows that the SILAC approach is a suitable tool to study host–pathogen interactions and to identify host proteins involved in virus replication.
Keywords: Host–pathogen interactions, Microbiology, Secretory pathway, SILAC
1 Introduction
Viruses depend on their host cell for virtually all steps of their infection cycle and many viruses have been shown to subvert host cellular processes for their own benefit 1, 2, 3, 4, 5, 6, 7. However, the contribution of the host cell to the infection cycle is often only poorly understood. Detailed insight into host–virus interactions is important for our understanding of virus infection processes and may also lead to new possibilities for therapeutic intervention.
Coronaviruses (CoVs) are enveloped single‐stranded positive sense RNA viruses, belonging to the family Coronaviridae in the order Nidovirales. They are able to infect a wide variety of mammals as well as avian species. In general, they cause respiratory and/or enteric infections, although some viruses may spread systemically. CoVs were brought to the centre of attention by the appearance of the severe acute respiratory syndrome‐CoV (SARS‐CoV) 8. These viruses contain a very large RNA genome (around 30 kb), the first two‐thirds of which code for the proteins involved in replication and transcription of the viral RNA. The other third of the genome codes among others for the structural proteins that build up the coronavirion. All CoVs contain a common set of structural proteins, consisting of the nucleocapsid (N), the spike (S), the membrane (M) and the envelope (E) protein 9, 10.
During their life cycle, CoVs interact with the host cell secretory pathway in several ways. In infected cells, CoVs induce the formation of a network of double membrane vesicles (DMVs) and convoluted membranes to which the viral replication–transcription complexes are anchored 11, 12, 13, 14, 15. The host cell pathways involved in the assembly of the DMV‐anchored replication–transcription complexes are not known. However, CoV replication and the secretory pathway were shown to be closely connected as CoV RNA replication was severely affected when ER‐to‐Golgi transport was interfered by the addition of drugs, by the expression of dominant‐negative mutants or by the depletion of host proteins using RNA interference 6, 16, 17. Also during assembly of progeny virus, the CoV life cycle and the secretory pathway are intertwined. CoV morphogenesis predominantly takes place at the ER‐to‐Golgi intermediate compartment. The ER‐to‐Golgi intermediate compartment membranes are modified by viral glycoproteins thereby facilitating the budding of the nucleocapsid through these membranes, resulting in the assembly of progeny virus. The CoV M protein is the most important viral protein for the budding process. It is considered the building brick of the coronavirion as it interacts with all other virion components 18. The M protein localizes to the budding compartment, but it is also abundantly present in the Golgi apparatus beyond the site of budding 19, 20, 21, 22. After assembly, the coronavirions are subject to an intracellular post‐budding maturation step that occurs while trafficking through the Golgi apparatus 23. It thus appears that the host cell secretory pathway, including the Golgi apparatus, plays an essential role in the CoV life cycle, although the exact molecular mechanisms are not yet clear.
In this study, we used a quantitative proteomic approach with the aim to identify host cell proteins that are involved in CoV replication. We reasoned that changes in protein levels in a cell or a cellular compartment, upon virus infection, are more likely to occur if a protein is somehow involved in the replication of the virus. Here, we focused our efforts on the secretory pathway, which plays an important role in the CoV life cycle as detailed above. To diminish the complexity of the samples and because of the known importance of the Golgi apparatus in CoV infection, we investigated changes in protein composition of an isolated Golgi‐enriched fraction from cells infected with the prototype mouse hepatitis CoV (mouse hepatitis virus (MHV)). To this end, SILAC was used for in vivo incorporation of stable isotopes into proteins for MS‐based quantitative proteomics 24. With this approach, we were able to identify 116 proteins that were significantly changed in their abundance in the Golgi‐enriched fraction upon MHV infection. Depletion of some of these proteins using small interfering RNAs (siRNAs) was shown to affect MHV RNA synthesis or the production and release of infectious progeny virus, demonstrating that quantitative proteomics based on SILAC is a suitable method for the identification of host factors important for virus replication and may contribute to our understanding of host–pathogen interactions.
2 Materials and methods
2.1 Cells, viruses and antibodies
HeLa‐CEACAM1a cells, which stably express the MHV receptor CEACAM1a, have been described previously 25. The cells were grown in DMEM (Cambrex) supplemented with 10% FCS, 100 IU of penicillin/mL, 100 μg of streptomycin/mL (pen/strep) and 0.5 mg/mL G418 (all from Life Technologies). For the SILAC experiments, wild‐type MHV strain A59 was used. For the RNA interference experiments, the recombinant MHV (MHV‐2aFLS) expressing firefly luciferase was used, which was described previously 26. The antibody against the cis‐Golgi marker p23 (anti‐p23) and the rabbit polyclonal antiserum k135 against the structural proteins of MHV were described before 27, 28. The conjugated secondary antibody, goat anti rabbit‐HRPO (gαrpo), was purchased from Nordic Immunology.
2.2 13C15N‐arginine‐ and 13C15N‐lysine‐labeling of HeLa‐CEACAM1a cells
The SILAC procedure, which was described by Ong et al. 24, was performed with certain adjustments. DMEM lacking l‐arginine and l‐lysine was obtained from PAN‐biotech (cat. no. P04‐04510S2). For the SILAC experiments, this medium was reconstituted with either the heavy amino acids, l‐arginine‐13C6 15N4 hydrochloride (Spectra Stable Isotopes, cat. no. 548ARG98) and l‐lysine‐13C6 15N2 hydrochloride (Spectra Stable Isotopes, cat. no. 548LYS98) (referred to as heavy medium), or with the normal, light amino acids, l‐arginine‐12C6 14N4 hydrochloride (Sigma, cat. no. A5131) and l‐lysine‐12C6 14N2 hydrochloride (Sigma, cat. no. L5626) (referred to as light medium) at a final concentration of 84 and 146 mg/L for arginine and lysine, respectively. The heavy and light culture media were supplemented with dialyzed FCS (Invitrogen, cat. no. 26400‐044) and pen/strep similarly as described above. Cells were passaged in fresh medium when 80–90% confluency was reached. Cells were lysed in lysis buffer (20 mM Tris‐HCl pH 7.6, 150 mM NaCl, 1% non‐idet P‐40, 0.5% NaDOC, 0.1% SDS) that contained protease inhibitors (2 μg/mL aprotinin, leupeptin and pepstatin), and proteins were separated by SDS‐PAGE. Gels were fixed, silver stained and peptides were digested with trypsin as described 29. After digestion, the samples were dissolved in 0.1% acetic acid and concentrated using μC18‐ZipTips (Millipore). The concentrated samples were directly eluted onto the target plates in 1 μL of matrix (saturated solution of CHCA in 50% v/v ACN). Data were acquired on a MALDI‐TOF‐TOF instrument (Applied Biosystems 4700 Proteomics Analyzer) in positive reflection mode at a laser intensity of 3800 and a bin time of 0.5 ns. No MS/MS was performed.
2.3 SILAC experiments: MHV infection
In each experiment, two pools of HeLa‐CEACAM1a cells were used that had been passaged six times in either the heavy or the light medium. The cells were grown in T175 flasks (Corning) until confluence was reached (approximately 3×10⁷ cells per flask). Cells from eight culture flasks were used per experiment, four flasks per labeling condition. In each SILAC experiment, cells cultured either in the light or in the heavy medium were mock inoculated or were inoculated with MHV A59 at a multiplicity of infection (MOI) of 50 in PBS supplemented with 50 mg/L diethylaminoethyl‐dextran (Sigma). After 1 h of incubation at 37°C, the inoculum was replaced by the heavy or light culture media and the infection was continued for another 5 h. Three independent SILAC experiments were performed, two in which the cells cultured in the light medium and one in which the cells cultured in the heavy medium were infected with MHV.
2.4 SILAC experiments: isolation of a Golgi‐enriched fraction
Golgi membranes were isolated from the cells by subcellular fractionation as described by Brügger et al. 30. Six hours post‐infection (p.i.), the MHV‐infected cells were harvested in homogenization buffer (250 mM sucrose in 10 mM Tris‐HCl, pH 7.4) and combined (1:1 ratio) with the harvested, mock‐infected cells. Cells were homogenized with the Balch homogenizer (gap size, 9 μm). Post‐nuclear supernatant (PNS) was obtained after centrifugation of the cell homogenate at 1700 rpm for 10 min at 4°C. This PNS was mixed with 62% w/w sucrose (in 10 mM Tris, pH 7.4) to obtain a 37% sucrose solution. Of this solution 4 mL was placed into a SW40 tube and overlaid with a 35 and 29% w/w layer (approximately 5 and 4 mL, respectively) of sucrose solution (in 10 mM Tris, pH 7.4). This gradient was centrifuged for 2 h and 40 min at 100 000×g. Approximately, 1 mL of a Golgi‐enriched fraction was collected at the 35−29% sucrose interphase. For further analysis, membranes were pelleted by centrifugation for 30 min at 100 000×g at 4°C after the addition of four volumes of PBS to one volume of the Golgi‐enriched fraction. Golgi‐enrichment of the isolated fraction was analyzed by Western blot analysis. A fraction of the PNS or Golgi‐enriched membranes corresponding to 20 μg protein was dissolved in Laemmli sample buffer containing β‐mercaptoethanol and heated for 5 min at 95°C. Proteins were separated using 12% SDS‐PAGE. The proteins were transferred to a PVDF membrane using the Western blot system from Bio‐rad and blocked in PBS/0.05% Tween/5% dried milk (Protifar, Nutricia) for 1 h at room temperature. Primary antibodies (p23; 1:1000 or k135; 1:400) were incubated in PBS/0.05% Tween/1% dried milk for 1 h at room temperature. After washing three times with PBS/0.05% Tween, the secondary antibody (gαrpo 1:10 000) was incubated for 1 h at room temperature. After another three washing steps, bound antibodies were visualized with the ECL detection kit from Pierce.
2.5 Mass spectrometry
Eighty microgram of isolated Golgi‐enriched membranes was dissolved in Laemmli sample buffer with 10 mM DTT and heated for 5 min at 95°C. Proteins were separated in a 12% SDS‐PAGE gradient gel (Invitrogen). Gels were fixed in 5% acetic acid/30% methanol and stained using GelCode Blue reagent (Pierce). Gel lanes were cut into 24 equally sized slices, which were subjected to in‐gel trypsin digestion as described 29. Twenty to eighty percent of the supernatants obtained after the digestion was used for LC‐MS/MS analysis on a ThermoFinnigan FT‐ICR equipped with a 7 Tesla magnet coupled to an Agilent Series 1100 binary pump system (Agilent Technologies). Peptide mixtures were trapped on an in‐house packed 5 cm×100 μm AquaTM C18 reversed phase column (Phenomenex) at a flow rate of 5 μL/min. Peptide separation was achieved on an 15 cm×75 μm AquaTM C18 reversed phase column using a gradient of 0–70% solution B (solution A=0.1 M acetic acid; solution B=80% v/v ACN, 0.1 M acetic acid) in 60 min at a constant flow rate of 200 nL/min.
2.6 MS data analysis
Finnigan *.raw files were converted to *.dta files using BioWorks software, version 3.1 SR1 (Thermo Electron). For this process, the program was set to track the scan limits automatically and calculate for peptides with a mass from 300 to 5000 AMU, automatically detecting the charge state and MS level (MS or MS/MS). The threshold was set to 100 counts. Subsequently, MASCOT generic files were generated through in‐house developed software. These files were used to search the IPI_Human 3.36 database 31 on an in‐house MASCOT server 32, allowing up to two missed cleavages, a peptide mass tolerance of 50 ppm and a fragment mass tolerance of 0.8 Da. Peptide modifications used in the searches were carbamidomethyl on cysteine (fixed) and oxidation on methionine, tryptophan and histidine (variable). Proteins matching the criteria for at least two reliable peptides (rank 1; unique; individual score higher than 29 (1% false‐positive rate)), and with a protein score higher than 64 were considered as positive identified proteins. Raw data files and MASCOT html results pages were loaded into the MSQuant program 33 adapted for SILAC‐based quantitative analysis. All quantified peptides were checked by manual inspection of the spectra used for quantification. To identify statistically different protein abundances between samples (p<0.05), data from three independent experiments were loaded into the StatQuant program for statistical analysis 34.
2.7 siRNA experiments
Three siRNA oligos per gene (targeting three different sites within the coding region) were obtained from Ambion. HeLa‐CEACAM1a cells were seeded into 96‐well plates and transfected with a final concentration of 10 nM siRNA using Oligofectamine (Invitrogen). siRNAs targeting green fluorescent protein (GFP; Ambion) were used as controls in each experiment. Seventy‐two hours after transfection, the cells were inoculated with MHV‐2aFLS at an MOI of 10. One hour after inoculation, cells were washed and fresh culture medium was added. Twelve hours p.i., the cell culture supernatants were taken and stored at −80°C to assess the presence of infectious MHV particles at a later time point (see below). Cell viability was measured using the Wst‐1 assay (Roche Diagnostics) according to the manufacturer's protocol using DMEM lacking phenol red (Cambrex). To investigate MHV‐driven luciferase expression, the Steadylite HTS firefly luciferase substrate (Perkin Elmer) was added to the cells and firefly luciferase expression was measured using a luminescence plate reader (Berthold Centro LB 960). Each siRNA experiment was performed in triplicate. For each well, luciferase values were corrected for the cell viability. These corrected luciferase values correspond to the level of MHV replication. To assess the assembly and release of infectious progeny virus, fresh HeLa‐CEACAM1a cells were inoculated with the cell culture supernatants obtained at 12 h p.i. (see above). Seven hours p.i., the firefly luciferase expression in the cells was measured as described above. These luciferase values are a measure for the production and release of infectious progeny virus. To validate the functional knockdown of the targeted genes, mRNA levels of each gene were determined after siRNA transfection using Taqman Gene Expression Assays (Applied Biosystems). The comparative Ct‐method was used to determine the fold change for each individual gene, as described by Raaben et al. 35. The housekeeping gene GAPDH was used as a reference in all experiments.
2.8 Gaussia luciferase secretion assay
To assess the functionality of the secretory pathway after transfection of siRNAs, cells were transfected with Gaussia princeps luciferase (GLuc)‐expressing plasmids (New England Biolabs). This luciferase is naturally secreted from cells. Seventy‐two hours after siRNA transfection, the cells were transfected with GLuc using lipofectamine 2000 according to the manufacturer's protocol (Invitrogen). Six hours post–transfection, intracellular luciferase levels as well as the amount of luciferase secreted into the culture media were measured using the Renilla luciferase assay kit (Promega). Briefly, 40 μL of Renilla substrate was added to 10 μL cell culture supernatant or 10 μL cell lysate (cells were lysed with the provided lysis buffer) and luciferase activity was measured using a luminometer (Berthold Centro LB 960). Relative Gluc secretion was determined by dividing the luciferase values of the supernatant by the intracellular GLuc values.
2.9 C11orf59, Golgi apparatus glycoprotein 1 and vesicle‐trafficking protein sec22b expression experiments
Plasmids encoding either vesicle‐trafficking protein sec22b (SEC22B) or Golgi apparatus glycoprotein 1 (GLG1) fused to GFP at their C terminus were obtained from OriGene. A C11orf59 cDNA clone was ordered at Open Biosystems. C11orf59 DNA was amplified using primers that introduce an XhoI restriction site upstream of the startcodon (primer: 5′‐ATCTCGAGCCATGGGGTGCTGCTACAGC) or a BglII restriction site (primer: 5′‐TTACAGATCTGGTGGGATCCCAAACTGTACAA), while removing the stopcodon. The PCR product was digested with XhoI and BglII and ligated into the XhoI‐BamHI digested pN1‐EGFP expression plasmid (Clontech). The construct was verified by sequence analysis. HeLa‐CEACAM1a cells were transfected with the C11orf59‐, GLG1‐ and SEC22B‐GFP fusion constructs using jetPRIME transfection reagent according to the manufacturer's protocol (Polyplus transfection). As controls, cells were transfected with the empty pN1‐EGFP vector or mock transfected. Sixteen hours post‐transfection, the cells were either infected with MHV‐2aFLS or with wild‐type MHV‐A59 at an MOI of 10. Replication and assembly of infectious progeny virus in cells infected with MHV‐2aFLS was assessed by measuring the intracellular luciferase values as described above. To assess replication of MHV‐A59 in cells expressing GFP (‐fusion proteins), cells were stained for dsRNA. Cells were fixed with 3.7% paraformaldehyde for 15 min at room temperature, washed with PBS and permeabilized and blocked by incubating with blocking buffer (BB; 2% BSA/0.1% saponin in PBS) for 30–60 min at room temperature. Subsequently, the antibody recognizing dsRNA, obtained from English & Scientific Consulting Bt 36, was incubated in BB for 60 min at room temperature. Cells were washed thoroughly with PBS and incubated with the secondary antibody (goat‐anti‐mouse conjugated with Alexa dye 568 from Invitrogen) for another 60 min at room temperature. After this incubation step, cells were washed three times with PBS and mounted on glass slides using FluorSave reagent (Calbiochem) and analyzed on a confocal microscope (Leica TCS Sp2 CLSM). MHV replication in the cells was analyzed by quantifying the fluorescent intensities corresponding to the dsRNA of the transfected and infected cells using the software from Applied Precision on a DeltaVision RT microscope as described by Hagemeijer et al. 37.
3 Results
3.1 Stable isotope labeling of HeLa‐CEACAM1a cells
In this study, we wanted to compare the protein profiles of Golgi‐enriched fractions isolated from cells that were mock infected with those of MHV‐infected cells by applying a quantitative proteomic approach, based on SILAC. In order to reliably identify proteins that are differentially expressed in heavy‐ as compared to light‐labeled cells, the complete substitution of the light by the heavy forms of the amino acids is required. Therefore, the extent and efficiency of the stable isotope labeling of the HeLa‐CEACAM1a cells that were used in the experiments were analyzed. Cells were grown in either the heavy or the light culture medium for several passages after which the incorporation of the heavy forms of arginine (13C6 15N4 Arg) and lysine (13C6 15N2 Lys) was analyzed by MALDI‐TOF MS. The results are shown in Fig. 1. Upper panels show mass spectra of two randomly chosen peptides from cells that were not yet passaged in the heavy medium (passage 0). Peaks in these mass spectra correspond to unlabeled peptides with a mass of 1790 and 1953 Da, respectively. The middle and lower panels show the same peptides from cells that had been passaged one or six times in the heavy medium, respectively. The peaks show a mass difference of either 10 Da (Fig. 1A, 1790 versus 1800) or 8 Da (Fig. 1B, 1953 versus 1961), corresponding to the incorporation of a heavy 13C6 15N4 Arg (Fig. 1A) or 13C6 15N2 Lys (Fig. 1B), respectively. Already after one passage, the entire peptide signal corresponds to the heavy peak, indicating that the incorporation of the 13C15N amino acids was complete. For practical reasons, cells that had been passaged six times in the heavy medium were used in the experiments.
Figure 1.
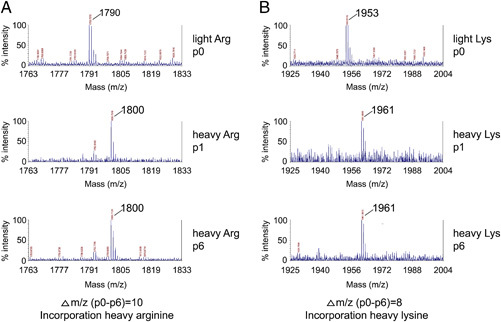
Incorporation of heavy (13C6 15N4) arginine and heavy (13C6 15N2) lysine in HeLa‐CEACAM1a cells at various time points. The incorporation of the heavy amino acids is illustrated by two random peptides ((A) heavy arginine and (B) heavy lysine). Peptides from cells that were not yet passaged in the heavy medium, and contain only light peptides, are shown in the upper panels (p0). For both peptides, already after one passage (p1) the entire peptide signal corresponds to the heavy peak, indicating that the peptides were fully incorporated with 13C6 15N4‐arginine (A) and 13C6 15N2‐lysine (B). Cells from passage 6 (p6) were used in the experiments.
3.2 SILAC experiments: MHV infection and isolation of a Golgi‐enriched fraction
After having established the SILAC procedure in HeLa‐CEACAM1a cells, we combined this procedure with MHV infection experiments with the aim to identify changes in the protein composition of a Golgi‐enriched fraction upon infection with MHV. The design of our experimental procedure is shown in Fig. 2A. Three independent infection experiments were performed. Cells were inoculated with MHV A59 at a high MOI (approximately 50) to ensure that essentially all cells were infected. At 6 ho p.i. the MHV‐infected and mock‐infected cells were harvested and combined in a 1:1 ratio prior to isolation of a Golgi‐enriched fraction using an established method 30, 38. At 6 h p.i. MHV RNA replication and protein expression is high 35, 39 and the M protein, key player in MHV assembly, is easily detected in the Golgi apparatus. At later time points, the Golgi apparatus starts to vesiculate, which might interfere with our analysis 39. Enrichment of the Golgi in the isolated fraction was assessed by Western blot analysis using antibodies recognizing either the Golgi marker p23 or the viral M protein. In Fig. 2B, the enrichment of both proteins in the isolated fraction when compared to the PNS is shown, indicating that a Golgi‐enriched fraction was indeed isolated from the MHV infected HeLa‐CEACAM1a cells that could now be used for further MS analyses.
Figure 2.
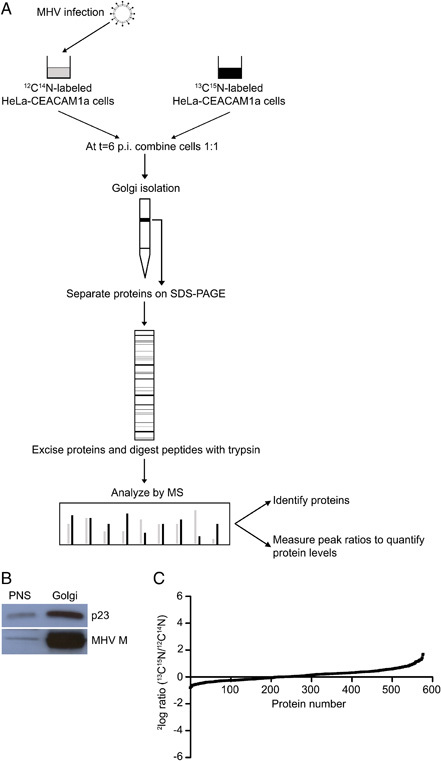
Experimental design and verification of Golgi‐enrichment in isolated fraction. The experimental setup is schematically shown (A) (for a description, see Section 2). Enrichment of a Golgi marker protein (p23) and the structural protein M of MHV was confirmed on Western blot (B). The ratio distribution graph of the identified proteins is shown in (C). Ratios of the majority of proteins distributed around 1.0 (2log ratio=0), confirming that the samples had been mixed equally and indicating that the majority of the proteins did not change their abundance upon MHV infection.
3.3 Protein identification and quantification
To identify and quantify proteins in the Golgi‐enriched fraction by MS, proteins from this fraction were separated by SDS‐PAGE, digested using in‐gel tryptic digestion and applied to LC‐MS/MS. After MASCOT database screening, identified proteins were analyzed using the Scaffold program 40, 41 and MSQuant 33, resulting in the identification of 578 proteins that were reliably identified and quantified (referred to as identified proteins; Supporting Information Table S1). Figure 2C shows the ratio distribution of these 578 proteins. For most proteins, the ratios were distributed around 1, confirming that the MHV‐infected and mock‐infected cells had been mixed in equal numbers and indicating that the majority of the proteins had not changed their abundance due to the infection. For further analysis, the identified proteins were loaded into the StatQuant program 34 to calculate for which proteins the ratios differed significantly (p<0.05) from the mean. This analysis showed that the abundance of 116 proteins had significantly changed (referred to as affected proteins; Table 1) in the Golgi‐enriched fraction upon infection. Of these 116 affected proteins, 43 were enriched (ratio<1, referred to as enriched proteins) and 73 were depleted (ratio>1, referred to as depleted proteins) in the Golgi‐enriched fraction.
Table 1.
List of affected proteins in Golgi‐enriched fraction of MHV‐infected HeLa‐CEACAM1a cells relative to mock‐infected cells based on SILAC analysis
| Protein ID | Protein | Mean ratioa) | p‐Value |
|---|---|---|---|
| Enriched proteins | |||
| IPI00019376 | Septin‐11 | 0.57±0.43 | 0.040 |
| IPI00033025 | Isoform 1 of septin‐7 | 0.57±0.20 | 0.010 |
| IPI00009057 | Isoform A of Ras GTPase‐activating protein‐binding protein 2 | 0.60±0.30 | 0.026 |
| IPI00024157 | FK506‐binding protein 3 | 0.62±0.20 | 0.014 |
| IPI00046057 | Isoform 2 of syntaxin‐binding protein 1 | 0.64±0.17 | 0.012 |
| IPI00012442 | Ras GTPase‐activating protein‐binding protein 1 | 0.65±0.09 | 0.003 |
| IPI00413108 | Ribosomal protein SA | 0.65±0.29 | 0.033 |
| IPI00014177 | Septin‐2 | 0.66±0.32 | 0.042 |
| IPI00220194 | Solute carrier family 2. facilitated glucose transporter member 1 | 0.66±0.09 | 0.004 |
| IPI00412607 | 60S ribosomal protein L35 | 0.68±0.17 | 0.016 |
| IPI00009111 | Trophoblast glycoprotein precursor | 0.69±0.17 | 0.016 |
| IPI00218696 | Isoform 4 of caldesmon | 0.69±0.14 | 0.011 |
| IPI00027087 | Isoform 1 of neural cell adhesion molecule L1 precursor | 0.70±0.12 | 0.009 |
| IPI00419880 | 40S ribosomal protein S3a | 0.70±0.20 | 0.024 |
| IPI00015833 | Coiled‐coil‐helix‐coiled‐coil‐helix domain‐containing protein 3 | 0.70±0.25 | 0.035 |
| IPI00021812 | Neuroblast differentiation‐associated protein AHNAK | 0.72±0.11 | 0.009 |
| IPI00031836 | Developmentally regulated GTP‐binding protein 1 | 0.72±0.06 | 0.003 |
| IPI00013485 | 40S ribosomal protein S2 | 0.74±0.23 | 0.042 |
| IPI00217121 | Uncharacterized protein C19orf21 | 0.75±0.15 | 0.020 |
| IPI00002821 | 60S ribosomal protein L14 | 0.75±0.21 | 0.040 |
| IPI00003918 | 60S ribosomal protein L4 | 0.75±0.15 | 0.020 |
| IPI00329389 | 60S ribosomal protein L6 | 0.75±0.07 | 0.005 |
| IPI00215719 | 60S ribosomal protein L18 | 0.76±0.19 | 0.035 |
| IPI00140420 | Staphylococcal nuclease domain‐containing protein 1 | 0.76±0.07 | 0.006 |
| IPI00013297 | 28 kDa heat‐ and acid‐stable phosphoprotein | 0.76±0.17 | 0.029 |
| IPI00031820 | Phenylalanyl‐tRNA synthetase α chain | 0.76±0.11 | 0.014 |
| IPI00002070 | Leucine‐rich repeat‐containing protein 8A | 0.77±0.20 | 0.041 |
| IPI00645815 | Solute carrier family 9 isoform 3 regulator 2 | 0.77±0.14 | 0.023 |
| IPI00009960 | Isoform 1 of mitochondrial inner membrane protein | 0.78±0.11 | 0.015 |
| IPI00856045 | AHNAK nucleoprotein 2 | 0.80±0.14 | 0.027 |
| IPI00456925 | Isoform 1 of drebrin‐like protein | 0.80±0.12 | 0.022 |
| IPI00021266 | 60S ribosomal protein L23a | 0.80±0.18 | 0.046 |
| IPI00011253 | 40S ribosomal protein S3 | 0.81±0.17 | 0.043 |
| IPI00410693 | Isoform 1 of plasminogen activator inhibitor 1 RNA‐binding protein | 0.81±0.11 | 0.022 |
| IPI00027493 | 4F2 cell‐surface antigen heavy chain | 0.82±0.15 | 0.039 |
| IPI00017529 | Isoform 1 of lymphocyte function‐associated antigen 3 precursor | 0.82±0.04 | 0.004 |
| IPI00012750 | 40S ribosomal protein S25 | 0.83±0.08 | 0.016 |
| IPI00000690 | Isoform 1 of apoptosis‐inducing factor 1. mitochondrial precursor | 0.84±0.07 | 0.010 |
| IPI00297910 | Tumor‐associated calcium signal transducer 2 precursor | 0.85±0.10 | 0.027 |
| IPI00418169 | Annexin A2 isoform 1 | 0.86±0.08 | 0.021 |
| IPI00016334 | Isoform 1 of cell surface glycoprotein MUC18 precursor | 0.86±0.07 | 0.018 |
| IPI00337541 | NAD(P) transhydrogenase. Mitochondrial precursor | 0.87±0.11 | 0.047 |
| IPI00010676 | Isoform 1 of urokinase plasminogen activator surface receptor precursor | 0.88±0.10 | 0.045 |
| Depleted proteins | |||
| IPI00470535 | Dihydropyridine receptor α 2 subunit | 1.11±0.09 | 0.049 |
| IPI00794397 | Chromatin modifying protein 4A | 1.16±0.11 | 0.039 |
| IPI00374563 | Agrin precursor | 1.16±0.08 | 0.024 |
| IPI00743716 | HLA class I histocompatibility antigen. Cw‐12 α chain precursor | 1.16±0.11 | 0.041 |
| IPI00027230 | Endoplasmin precursor | 1.16±0.12 | 0.043 |
| IPI00441498 | Folate receptor α precursor | 1.17±0.13 | 0.047 |
| IPI00409635 | Isoform 2 of protein FAM62B | 1.17±0.11 | 0.032 |
| IPI00022143 | Isoform 1 of protein FAM62A | 1.20±0.12 | 0.034 |
| IPI00026154 | Glucosidase 2 subunit β precursor | 1.20±0.11 | 0.026 |
| IPI00152540 | Isoform 1 of CD109 antigen precursor | 1.21±0.13 | 0.036 |
| IPI00004671 | Golgin subfamily B member 1 | 1.23±0.16 | 0.043 |
| IPI00472882 | HLA class I histocompatibility antigen. A‐68 α chain precursor | 1.23±0.03 | 0.001 |
| IPI00328391 | N‐acetylgalactosaminyltransferase 7 | 1.24±0.07 | 0.007 |
| IPI00171412 | Isoform 1 of sulfatase‐modifying factor 2 precursor | 1.24±0.14 | 0.031 |
| IPI00004416 | Charged multivesicular body protein 2a | 1.25±0.11 | 0.017 |
| IPI00026848 | α‐2‐Macroglobulin receptor‐associated protein precursor | 1.26±0.19 | 0.049 |
| IPI00328715 | Protein LYRIC | 1.29±0.15 | 0.024 |
| IPI00218200 | B‐cell receptor‐associated protein 31 | 1.30±0.16 | 0.028 |
| IPI00025874 | Dolichyl‐diphosphooligosaccharide‐glycosyltransferase 67 kDa subunit | 1.30±0.15 | 0.024 |
| IPI00021405 | Isoform A of lamin‐A/C | 1.33±0.20 | 0.037 |
| IPI00171626 | 1‐Acylglycerophosphocholine O‐acyltransferase 1 | 1.34±0.16 | 0.022 |
| IPI00395906 | Similar to RIKEN cDNA 2310002J15 gene | 1.35±0.16 | 0.022 |
| IPI00328415 | Isoform 1 of NADH‐cytochrome b5 reductase 3 | 1.37±0.24 | 0.040 |
| IPI00027438 | Flotillin‐1 | 1.39±0.02 | 0.000 |
| IPI00470467 | NADPH–cytochrome P450 reductase | 1.39±0.16 | 0.019 |
| IPI00004962 | Golgi integral membrane protein 4 | 1.39±0.29 | 0.050 |
| IPI00025252 | Protein disulfide‐isomerase A3 precursor | 1.42±0.18 | 0.018 |
| IPI00333619 | Isoform 1 of fatty aldehyde dehydrogenase | 1.43±0.19 | 0.021 |
| IPI00006865 | Vesicle‐trafficking protein SEC22b | 1.43±0.03 | 0.001 |
| IPI00018415 | Transmembrane 9 superfamily member 2 precursor | 1.44±0.29 | 0.045 |
| IPI00029737 | Isoform long of long‐chain‐fatty‐acid‐CoA ligase 4 | 1.45±0.16 | 0.014 |
| IPI00005202 | Membrane‐associated progesterone receptor component 2 | 1.45±0.23 | 0.026 |
| IPI00024284 | Basement membrane‐specific heparan sulfate proteoglycan core protein | 1.46±0.18 | 0.016 |
| IPI00007940 | ER lipid raft associated 1 | 1.48±0.26 | 0.030 |
| IPI00020984 | Calnexin precursor | 1.48±0.16 | 0.013 |
| IPI00328161 | FK506‐binding protein 8 | 1.49±0.23 | 0.026 |
| IPI00028369 | Isoform 1 of protein lunapark | 1.55±0.28 | 0.031 |
| IPI00335168 | Isoform non‐muscle of myosin light polypeptide 6 | 1.55±0.36 | 0.048 |
| IPI00298237 | Isoform 1 of tripeptidyl‐peptidase 1 precursor | 1.55±0.28 | 0.031 |
| IPI00789008 | Flotillin 2 | 1.58±0.14 | 0.008 |
| IPI00021985 | Transmembrane 9 superfamily member 4 | 1.59±0.19 | 0.012 |
| IPI00100796 | Charged multivesicular body protein 5 | 1.60±0.23 | 0.017 |
| IPI00019997 | Lin‐7 homolog C | 1.61±0.15 | 0.008 |
| IPI00220556 | Isoform 3 of pre‐B‐cell leukemia transcription factor‐interacting protein 1 | 1.62±0.28 | 0.024 |
| IPI00009225 | Syntaxin‐8 | 1.64±0.32 | 0.031 |
| IPI00106646 | 45 kDa calcium‐binding protein precursor | 1.67±0.37 | 0.036 |
| IPI00100980 | EH domain‐containing protein 2 | 1.73±0.37 | 0.033 |
| IPI00303894 | Protein FAM3A precursor | 1.73±0.38 | 0.034 |
| IPI00002412 | Palmitoyl‐protein thioesterase 1 precursor | 1.73±0.33 | 0.027 |
| IPI00010348 | Deoxyribonuclease‐2‐α precursor | 1.73±0.43 | 0.042 |
| IPI00011229 | Cathepsin D precursor | 1.77±0.13 | 0.004 |
| IPI00011284 | Isoform membrane‐bound of catechol O‐methyltransferase | 1.79±0.26 | 0.015 |
| IPI00215767 | Isoform long of β‐1.4‐galactosyltransferase 1 | 1.79±0.32 | 0.022 |
| IPI00013219 | Integrin‐linked protein kinase | 1.84±0.39 | 0.030 |
| IPI00295542 | Nucleobindin‐1 precursor | 1.84±0.24 | 0.012 |
| IPI00465431 | Galectin‐3 | 1.84±0.48 | 0.043 |
| IPI00030351 | Isoform 1 of disks large homolog 1 | 1.84±0.23 | 0.011 |
| IPI00296421 | EH domain‐binding protein 1‐like protein 1 | 1.91±0.50 | 0.043 |
| IPI00018871 | ADP‐ribosylation factor‐like protein 8B | 1.91±0.34 | 0.021 |
| IPI00004503 | Lysosomal‐associated membrane protein 1 | 1.96±0.18 | 0.006 |
| IPI00016915 | Insulin‐like growth factor‐binding protein 7 precursor | 1.97±0.16 | 0.004 |
| IPI00032831 | Synaptosomal‐associated protein 29 | 2.08±0.43 | 0.025 |
| IPI00010720 | T‐complex protein 1 subunit ε | 2.14±0.60 | 0.043 |
| IPI00290770 | Chaperonin containing TCP1. subunit 3 isoform b | 2.17±0.48 | 0.028 |
| IPI00016670 | C11orf59 protein | 2.20±0.57 | 0.037 |
| IPI00302927 | T‐complex protein 1 subunit δ | 2.23±0.20 | 0.005 |
| IPI00302925 | Uncharacterized protein CCT8 | 2.30±0.59 | 0.036 |
| IPI00021033 | Isoform 1 of collagen α‐1(III) chain precursor | 2.31±0.33 | 0.012 |
| IPI00414717 | GLG1 | 2.41±0.26 | 0.007 |
| IPI00290566 | T‐complex protein 1 subunit α | 2.43±0.70 | 0.043 |
| IPI00291262 | Clusterin precursor | 2.57±0.49 | 0.020 |
| IPI00171411 | Golgi phosphoprotein 2 | 3.10±0.43 | 0.011 |
| IPI00015688 | Glypican‐1 precursor | 3.18±0.92 | 0.044 |
a) The mean ratio is the average ratio from three independent SILAC experiments.
3.4 Protein analysis
To gain more insight into the origin and function of the proteins that were identified by our experimental procedure, they were classified according to their subcellular location or molecular function annotation using the Universal Protein Resource database (http://www.uniprot.org) and the PANTHER Classification System (Protein ANalysis THrough Evolutionary Relationships, http://www.pantherdb.org 42), respectively. In Fig. 3A, the categorization according to subcellular location annotation is shown for the 578 identified and the 116 affected proteins. The results show that the Golgi‐enriched fraction contained many proteins annotated to be localized to other organelles than the Golgi itself. The distribution of the 116 affected proteins was only slightly different from that of the 578 identified proteins. The affected proteins appeared to be enriched for proteins with an ER, Golgi, ribosome, endosome or lysosome annotation, whereas proteins annotated to the cytoplasm, mitochondrion or cytoskeleton appeared to be underrepresented. Next, the affected proteins were analyzed in more detail (Fig. 3B). The largest group of proteins consists of proteins annotated to be localized to the cytoplasm. This group contained an equal proportion of enriched and depleted proteins. However, the affected proteins annotated to originate from the ER, Golgi, endosomes and lysosomes were mainly depleted in the Golgi‐enriched fraction upon infection with MHV, whereas those predicted to be of ribosomal origin were all enriched.
Figure 3.
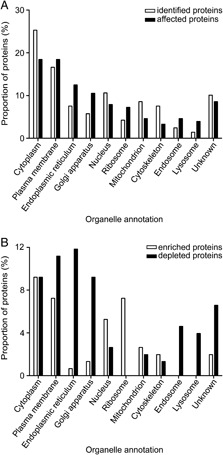
Subcellular localization of identified proteins. The subcellular localizations of the proteins were based on the annotations of UniProt. The distribution of the affected proteins was compared with that of all the identified proteins (A). The affected proteins were also categorized for the enriched and depleted proteins separately (B). Some proteins have more than one annotation; therefore, the sum of each category can be higher that 100%.
The identified proteins were also classified according to their molecular function annotation (Fig. 4A). Only little difference in distribution among the different molecular function groups between the identified proteins and the affected proteins was observed. This indicates that MHV infection did not lead to a change in abundance of proteins categorized into a specific molecular function group, with the exception of the group of proteins lacking a classified molecular function annotation and the extracellular matrix proteins, which both appeared to be enriched more than 1.5‐fold for the affected proteins when compared to the identified proteins. In Fig. 4B, the affected proteins were again distributed according to their molecular function annotation. This time we differentiated between the enriched and the depleted proteins in the isolated fraction upon infection. The largest functional annotation group was the one containing proteins lacking a classified molecular function. This group contained approximately an equal proportion of depleted and enriched proteins. Several functional annotation groups predominantly contained proteins that were depleted in the isolated fraction upon infection (such as the membrane traffic proteins, chaperones, select calcium‐binding proteins, transferases and defense/immunity proteins). In contrast, the majority of nucleic acid binding proteins were enriched in the isolated fraction upon infection.
Figure 4.
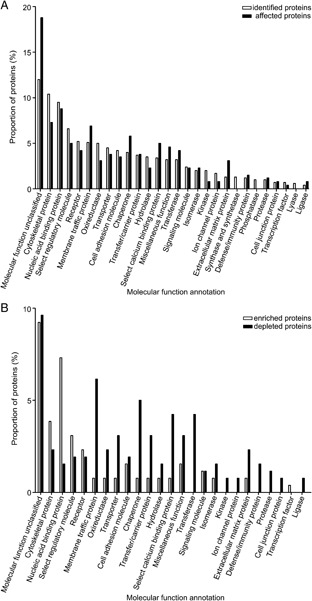
Molecular functions of identified proteins. The molecular functions of the proteins were based on the annotations of the PANTHER classification system. The distribution of the affected proteins was compared with that of all the identified proteins (A). The affected proteins were also categorized for the enriched and depleted proteins separately (B). Some proteins have more than one annotation; therefore, the sum of each category can be higher that 100%.
3.5 Functional relevance of selected protein hits
Next, we investigated in more detail whether the proteins that were affected in their distribution indeed play a role in the MHV infection cycle. From the 116 affected proteins, 13 proteins were selected (Table 2). The 13 selected proteins covered ten different molecular function groups and were predicted to be localized to six different organelles. Both enriched and depleted regulated proteins were selected.
Table 2.
Thirteen selected candidates for the siRNA experiments
| Selected candidate | Gene symbol | Mean ratioa) | MF annotationb) | Organelle annotationc) |
|---|---|---|---|---|
| Enriched proteins | ||||
| Isoform A of Ras GTPase‐activating protein‐binding protein 2 | G3BP2 | 0.60±0.30 | NAB/SM | CP |
| FK506‐binding protein 3 | FKBP3 | 0.61±0.20 | CHAP/ISO | N |
| Isoform 2 of syntaxin‐binding protein 1 | STXBP1 | 0.64±0.17 | MT/SRM | CP/PM |
| Ras GTPase‐activating protein‐binding protein 1 | G3BP1 | 0.65±0.09 | NAB/SM | CP/PM/N |
| Isoform 1 of neural cell adhesion molecule L1 precursor | L1CAM | 0.70±0.12 | CA | PM |
| Developmentally regulated GTP‐binding protein 1 | DRG1 | 0.72±0.06 | MFU | CP |
| Staphylococcal nuclease domain‐containing protein 1 | SND1 | 0.76±0.07 | TR/NAB | G/CP/N |
| Depleted proteins | ||||
| Vesicle‐trafficking protein SEC22b | SEC22B | 1.43±0.03 | MT/SRM | G/ER |
| Syntaxin‐8 | STX8 | 1.63±0.32 | MT/SRM | G/ER/E |
| Nucleobindin‐1 precursor | NUCB1 | 1.84±0.24 | NAB/SCB | G |
| C11orf59 protein | C11orf59 | 2.20±0.57 | MFU | ? |
| GLG1 | GLG1 | 2.42±0.26 | SM | G |
| Golgi phosphoprotein 2 | GOLM1 | 3.09±0.43 | MFU | G |
a) The mean ratio is the average ratio from three independent SILAC experiments.
b) Molecular function annotation: NAB, nucleic acid binding; SM, signaling molecule; CHAP, chaperone; ISO, isomerase; MT, membrane traffic; SRM, select regulatory molecule; CA, cell adhesion; MFU, molecular function unclassified; TR, transcription; SCB, select calcium binding.
c) CP, cytoplasm; N, nucleus; PM, plasma membrane; G, Golgi apparatus; E, endosome; ?, unknown.
HeLa‐CEACAM1a cells were depleted for each of the 13 selected proteins by transfecting cells with three different siRNA oligos per selected protein. As a control for the transfection efficiency, mRNA degradation was assessed by quantitative real‐time PCR. As shown in Fig. 5A, transfection of the different siRNA oligos led to a significant reduction (>85–95%) in the amount of mRNA encoding each of the 13 proteins when compared to cells transfected with the control siRNA targeting GFP. Seventy‐two hours post‐transfection, the cells were infected with MHV expressing a luciferase gene. MHV replication, production and release of infectious progeny virus were assessed by measuring luciferase expression as schematically shown in Fig. 5B and described in Section 2. MHV replication was assessed by measuring the intracellular luciferase values in the interfered and infected cells, at 12 h p.i. The level of luciferase protein expression has been previously shown to correspond to the level of MHV replication in the cells 16, 26. The production and release of progeny virus was studied by inoculating fresh (non‐interfered) HeLa‐CEACAM1a cells with the cell culture supernatants of the interfered and infected cells. The level of luciferase in these cells is a measure for the number of secreted infectious MHV virions. Figure 5C shows the relative luciferase expression levels, represented as the luciferase activity expressed relative to cells treated with siRNAs targeting GFP after correction for the cell viability. The data show that depletion of the protein C11orf59 and GLG1 resulted in a significantly increased luciferase expression, whereas cell viability was not affected, suggesting a role for C11orf59 and GLG1 in MHV replication. Figure 5D shows the production and release of infectious progeny virus showing the average intracellular luciferase expression values normalized to luciferase values of cells treated with siRNAs targeting GFP. The results show that depletion of vesicle‐trafficking protein SEC22B led to significantly increased levels of progeny virus release. As depletion of SEC22B did not affect MHV replication, we conclude that depletion of this protein enhances the assembly and/or release of infectious progeny virus. To investigate to what extent depletion of the selected proteins affected the secretory pathway per se, thereby possibly affecting MHV replication and release of infectious progeny virus, secretion of Gaussia luciferase was assessed after siRNA treatment of the cells. Figure 6 shows that secretion of Gaussia luciferase was not significantly affected after depletion of the selected proteins. Interestingly, although SEC22B depletion resulted in a slight decrease in Gaussia luciferase secretion (Fig. 6), it led to a significantly higher release of progeny virus (Fig. 5D).
Figure 5.
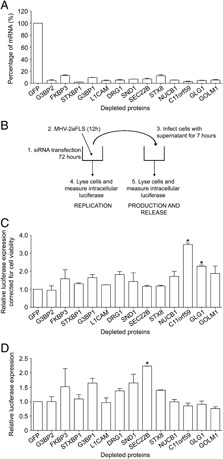
Functional relevance of the selected proteins. The efficiency of mRNA degradation after siRNA‐mediated depletion of the 13 selected genes is shown in (A). The experimental set‐up of the RNA interference experiments is shown in (B). The differences in MHV replication (C) or production and secretion of infectious progeny virus (D) in the interfered cells are shown as the luciferase activity expressed relative to cells treated with siRNA targeting GFP. The results of three independent experiments are shown. Error bars indicate standard deviations. Statistical analysis was performed using ANOVA followed by Dunnett's Multiple Comparison test; * p<0.01.
Figure 6.
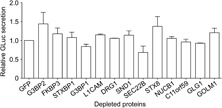
Gaussia secretion. The levels of Gaussia secretion in the interfered cells are shown as the luciferase activity expressed relative to cells treated with siRNA targeting GFP. The results of three independent experiments are shown. Error bars indicate standard deviations. Statistical analysis was performed using ANOVA followed by Dunnett's Multiple Comparison test.
In addition to the siRNA experiments, MHV replication and assembly was also assessed in cells overexpressing GFP‐fusion constructs of C11orf59, GLG1 and SEC22B. To this end, transfected and infected cells were stained using antibodies directed against dsRNA, the fluorescence intensity of which was quantified. DsRNA, which is not present in non‐infected cells, accumulates in the virus‐induced DMVs 15 where it probably functions as a replication intermediate during the multiplication of the viral RNA genome. The amount of dsRNA present in a cell is a measure for RNA synthesis. As shown in Figs. 7A and B, expression of C11orf59‐, GLG1‐ and SEC22B‐GFP resulted in a decreased MHV replication compared to the control cells. As the transfection efficiency of the C11orf59‐GFP construct, but not of the other constructs, was high (75–85% positive cells, data not shown), MHV replication in cells expressing C11orf59‐fusion protein was also analyzed using the luciferase‐expressing recombinant MHV (Fig. 7C). In agreement with the results shown in Fig. 7A, expression of C11orf59‐GFP resulted in lower luciferase levels when compared to mock‐ and GFP‐transfected cells.
Figure 7.
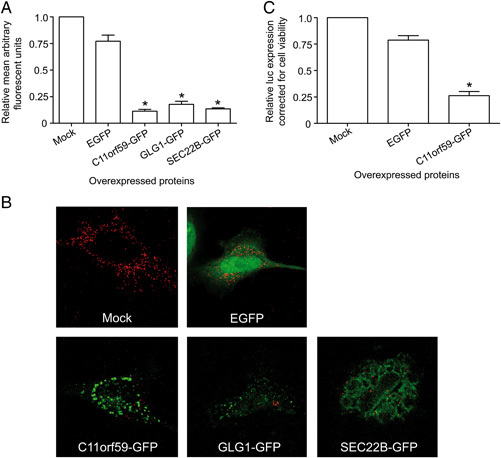
Effect of overexpression of C11orf59, GLG1 and SEC22B on MHV infection. MHV replication, as determined by the amount of dsRNA (A) in cells transfected with C11orf59‐GFP, GLG1‐GFP and SEC22B‐GFP is shown as the mean arbitrary fluorescent units relative to mock‐transfected cells. Representative confocal images used for the quantifications are shown in (B). MHV replication, as determined by the amount of luciferase expressed (C) in cells transfected with C11orf59‐GFP is shown relative to mock‐transfected cells. As a control, cells were also transfected with the empty pN1‐EGFP vector (EGFP). The results of three independent experiments are shown. Error bars indicate standard deviations. Statistical analysis was performed using ANOVA followed by Dunnett's Multiple Comparison test; * p<0.01.
4 Discussion
Viruses are obligatory intracellular pathogens that rely on the host cell for essentially all steps of their life cycle. Elucidating the full picture of virus–host interactions will be important for a complete understanding of the infection process and will likely require a large number of genomics and proteomic approaches. In this study, we explored the potential of SILAC‐based quantitative proteomics to contribute to our knowledge of virus–host interactions. With this approach, changes in protein composition of the cell or in protein distribution among cellular organelles can be established. We hypothesized that proteins that are affected in their abundance or distribution upon infection are likely to be involved in the virus life cycle. Because of the known role of the secretory pathway and the Golgi apparatus in the infection cycle of the model CoV MHV 6, 16, 19, 39, we focused our attention on Golgi‐enriched fractions isolated from MHV‐ and mock‐infected cells. We found that 116 proteins were affected in their abundance in these fractions upon infection of cells with MHV. The functional relevance of these results was confirmed by siRNA‐mediated depletion, which for some proteins was shown to increase either MHV replication or production of progeny virus. Overexpression of several proteins resulted in decreased MHV replication.
Up to now, only few studies have applied quantitative proteomics based on SILAC to analyze the profound alterations and virus–host interactions that occur in virus‐infected cells 43, 44, 45, 46, 47. Most studies 44, 45, 46, 47 reduced sample complexity by performing cell fractionation to study changes in the proteome of cytoplasmic, nucleolar or crude membrane fractions upon infection of cells with influenza A, infectious bronchitis, or respiratory syncytial virus. Although these studies identified a large number of host proteins that changed in abundance due to the infection, the functional relevance of these proteins in the virus infection cycle was not studied in further detail. In another study, Zhang et al. 43 applied SILAC to compare the protein profiles of cells containing a SARS‐CoV replicon with those of parental cells, which resulted in the identification of 74 host factors that had significantly altered levels of expression. Functional studies on one of these proteins, BAG3, demonstrated that this protein plays an important role in SARS‐CoV replication. Although two previous studies 43, 46 focused on CoV‐induced changes in the host proteome, no identical hits were obtained in these and our studies. This is probably explained by the different CoVs, experimental systems and subcellular fractions used. For example, in contrast to our study, Zhang et al. 43 used cells containing a CoV replicon rather than virus‐infected cells. In addition, although we focused on Golgi‐enriched fractions, the other groups analyzed total cell lysates and/or nucleolar fractions 44, 45, 46, 47.
To get more insight into what kind of proteins were isolated during the SILAC procedure and more specifically, what kind of proteins significantly changed their abundance upon MHV infection, the identified proteins were grouped according to intracellular location and molecular function. Proteins annotated to be localized to ten different cellular compartments were found in the Golgi‐enriched fraction. This is not unexpected as our Golgi isolation procedure is based on the protocols of Wieland and colleagues 30 and Rothman and colleagues 38, who showed a 52‐fold enrichment for Golgi protein markers, with a 1‐4‐fold enrichment of ER, plasma membrane and lysosomal protein markers. Also others have shown that isolation of a pure Golgi fraction is not possible 48, 49, 50, 51. For example, Wu et al. 50, identified 421 proteins in stacked Golgi membranes from rat liver, of which only 110 were Golgi resident proteins. Furthermore, proteins localizing primarily in other organelles than the Golgi may very well also be present in the Golgi, albeit probably at lower levels.
Approximately 40% of the affected proteins in the isolated Golgi fraction were enriched. Ribosomal/nuclear and nucleic acid‐binding proteins were overrepresented in this group. This is in agreement with the results obtained by Neuman et al. 52, who identified several RNA‐binding and ribosomal proteins in purified SARS‐CoV virions. We hypothesize that upon infection with MHV, the ribosomal/nucleic acid‐binding proteins are specifically recruited to the virion assembly sites, possibly by their interaction with viral genomic RNA, resulting in their enrichment in the isolated fractions (this study) and their incorporation into progeny virus 52. In agreement with the idea that the isolated Golgi fraction contains the membranes at which the virions assemble, this fraction also contained the major CoV structural proteins M and N (data not shown).
Proteins that were depleted in the isolated Golgi fraction, upon infection with MHV, were annotated to be particularly localized to the ER, Golgi, endosomes and lysosomes. Apparently, infection with MHV modifies the cells in such a way that these proteins are lost from the isolated Golgi fraction. We hypothesize that these observations are linked to the massive membrane rearrangements that are observed upon infection with CoV 15, 39. CoVs induce among others DMVs and convoluted membranes that are associated with the synthesis of viral RNA and to which the non‐structural proteins involved in RNA synthesis are localized 15, 39. As these non‐structural proteins could not be detected in the isolated Golgi‐enriched fraction (data not shown), it may well be that the proteins depleted from this fraction are recruited/redirected to these virally modified membranes.
To study the functional relevance of the affected proteins in the MHV infection cycle in more detail, siRNA experiments were performed for a selected subset of these proteins. As depletion of C11orf59 by siRNAs positively affected luciferase expression driven by MHV, we hypothesize the protein to have a negative effect on viral RNA synthesis. In agreement herewith, overexpression of C11orf59 negatively affected MHV replication. These results indicate that C11orf59 plays a role in MHV replication. Although the depletion (2.2‐fold) of this protein from the isolated fraction upon infection may indicate that it is recruited to the sites of viral RNA synthesis, this could not be confirmed by immunofluorescence microscopy (data not shown). Alternatively, the degradation of this protein may be enhanced upon infection. C11orf59 was shown to have multiple functions 53, 54, 55, 56. Hoshino et al. found that C11orf59 acts as a RhoA activator 53. Inhibition of RhoA has been previously described to result in an increased Hepatitis C virus replication and enhanced vaccinia virus cell‐to‐cell spread 57, 58. Although depletion of the RhoA activator, C11orf59, led to increased MHV replication (this study), depletion of RhoA itself, which was expected to have a similar effect as depletion of its activator, resulted in decreased MHV replication (data not shown). C11orf59 was recently also shown to play a role in cholesterol homeostatis 56. As cholesterol is known to be important for CoV infection 59, 60, 61, perturbation of cholesterol homeostasis after depletion or overexpression of C11orf59 may explain the interference with CoV replication. In addition, others have demonstrated a role for C11orf59 in endosome dynamics, lysosome maturation and mTORC1 kinase activation 54, 55, 56. Clearly, further analysis of these different functions of the C11orf59 protein is required to determine how the presence or absence of this protein affects MHV replication.
Similar to C11orf59, GLG1 was also depleted (2.42‐fold) from the Golgi‐enriched fraction, whereas depletion of the protein from cells using siRNAs also had a (modest) positive effect on MHV replication. In agreement herewith, overexpression of GLG1 negatively affected MHV replication. GLG1 is a 150‐kD integral membrane protein localized to the Golgi apparatus 62. It is able to bind fibroblast growth factor, and may play a role in fibroblast growth factor signaling 63, 64. In addition, GLG1 is highly homologous to the murine E‐selectin ligand‐1 65, 66 and to a membrane sialoglycoprotein of the medial cisternae of the rat Golgi complex (MG‐160) 67. However, the exact function of GLG1 is not known.
Depletion of vesicle‐trafficking protein SEC22B using siRNAs led to an increased production and/or release of infectious progeny virus, whereas no effect on MHV RNA synthesis was observed. Overexpression of this protein, however, negatively affected MHV replication. SEC22B is a protein involved in vesicular trafficking between the ER and the Golgi 68, 69, although depletion of this protein did not significantly affect secretion of Gaussia luciferase (this study). We speculate that in the absence of SEC22B, either assembly of MHV virions is more efficient or a higher proportion of the released particles is infectious. Overexpression of this protein might somehow interfere with the assembly and/or functioning of the membrane‐bound replication complexes. Unfortunately, the low transfection efficiency of the SEC22B‐GFP expression construct did not allow us to assess the assembly of MHV in cells overexpressing this protein.
In this study, we have shown that comparison of the protein profiles of Golgi‐enriched fractions of mock‐infected and MHV‐infected cells revealed the significant depletion or enrichment of 116 proteins. As many of these proteins are annotated to be located to the secretory pathway, this is yet another indication of the intertwinement of the CoV life cycle with this pathway. In addition, depletion of a small subset of these proteins already identified several host factors involved in CoV replication, which warrants follow‐up studies also on the other affected proteins.
Supporting information
Detailed facts of importance to specialist readers are published as ”Supporting Information”. Such documents are peer‐reviewed, but not copy‐edited or typeset. They are made available as submitted by the authors.
SupplInfo
Acknowledgements
This work was financially supported by the Faculty of Veterinary Medicine of Utrecht University, The Netherlands. The authors would like to thank Hélène Verheije for assistance with the siRNA experiments and Marne Hagemeijer for assistance with the (over)expression experiments.
The authors have declared no conflict of interest.
5 References
- 1. Belov, G. A. , Altan‐Bonnet, N. , Kovtunovych, G. , Jackson, C. L. et al., Hijacking components of the cellular secretory pathway for replication of poliovirus RNA. J. Virol. 2007, 81, 558–567. [DOI] [PMC free article] [PubMed] [Google Scholar]
- 2. Beske, O. , Reichelt, M. , Taylor, M. P. , Kirkegaard, K. , Andino, R. , Poliovirus infection blocks ERGIC‐to‐Golgi trafficking and induces microtubule‐dependent disruption of the Golgi complex. J. Cell. Sci. 2007, 120, 3207–3218. [DOI] [PubMed] [Google Scholar]
- 3. Choe, S. S. , Dodd, D. A. , Kirkegaard, K. , Inhibition of cellular protein secretion by picornaviral 3A proteins. Virology 2005, 337, 18–29. [DOI] [PubMed] [Google Scholar]
- 4. Konan, K. V. , Giddings, T. H., Jr. , Ikeda, M. , Li,K. et al., Nonstructural protein precursor NS4A/B from hepatitis C virus alters function and ultrastructure of host secretory apparatus. J. Virol. 2003, 77, 7843–7855. [DOI] [PMC free article] [PubMed] [Google Scholar]
- 5. Moffat, K. , Knox, C. , Howell, G. , Clark, S. J. et al., Inhibition of the secretory pathway by foot‐and‐mouth disease virus 2BC protein is reproduced by coexpression of 2B with 2C, and the site of inhibition is determined by the subcellular location of 2C. J. Virol. 2007, 81, 1129–1139. [DOI] [PMC free article] [PubMed] [Google Scholar]
- 6. Oostra, M. , te Lintelo, E. G. , Deijs, M. , Verheije, M. H. et al., Localization and membrane topology of coronavirus nonstructural protein 4: involvement of the early secretory pathway in replication. J. Virol. 2007, 81, 12323–12336. [DOI] [PMC free article] [PubMed] [Google Scholar]
- 7. Sakaguchi, T. , Leser, G. P. , Lamb, R. A. , The ion channel activity of the influenza virus M2 protein affects transport through the Golgi apparatus. J. Cell. Biol. 1996, 133, 733–747. [DOI] [PMC free article] [PubMed] [Google Scholar]
- 8. Drosten, C. , Gunther, S. , Preiser, W. , van der Werf, S. et al., Identification of a novel coronavirus in patients with severe acute respiratory syndrome. N. Engl. J. Med. 2003, 348, 1967–1976. [DOI] [PubMed] [Google Scholar]
- 9. Lai, M. M. , Coronavirus: organization, replication and expression of genome. Ann. Rev. Microbiol. 1990, 44, 303–333. [DOI] [PubMed] [Google Scholar]
- 10. Spaan, W. , Cavanagh, D. , Horzinek, M. C. , Coronaviruses: structure and genome expression. J. Gen. Virol. 1988, 69, 2939–2952. [DOI] [PubMed] [Google Scholar]
- 11. Goldsmith, C. S. , Tatti, K. M. , Ksiazek, T. G. , Rollin, P. E. et al., Ultrastructural characterization of SARS coronavirus. Emerg. Infect. Dis. 2004, 10, 320–326. [DOI] [PMC free article] [PubMed] [Google Scholar]
- 12. Gosert, R. , Kanjanahaluethai, A. , Egger, D. , Bienz, K. , Baker, S. C. , RNA replication of mouse hepatitis virus takes place at double‐membrane vesicles. J. Virol. 2002, 76, 3697–3708. [DOI] [PMC free article] [PubMed] [Google Scholar]
- 13. Sims, A. C. , Ostermann, J. , Denison, M. R. , Mouse hepatitis virus replicase proteins associate with two distinct populations of intracellular membranes. J. Virol. 2000, 74, 5647–5654. [DOI] [PMC free article] [PubMed] [Google Scholar]
- 14. Snijder, E. J. , van der Meer, Y. , Zevenhoven‐Dobbe, J. , Onderwater, J. J. et al., Ultrastructure and origin of membrane vesicles associated with the severe acute respiratory syndrome coronavirus replication complex. J. Virol. 2006, 80, 5927–5940. [DOI] [PMC free article] [PubMed] [Google Scholar]
- 15. Knoops, K. , Kikkert, M. , Worm, S. H. , Zevenhoven‐Dobbe, J. C. et al., SARS‐coronavirus replication is supported by a reticulovesicular network of modified endoplasmic reticulum. PLoS Biol. 2008, 6, e226. [DOI] [PMC free article] [PubMed] [Google Scholar]
- 16. Verheije, M. H. , Raaben, M. , Mari, M. , Te Lintelo, E. G. et al., Mouse hepatitis coronavirus RNA replication depends on GBF1‐mediated ARF1 activation. PLoS Pathogens 2008, 4, e1000088. [DOI] [PMC free article] [PubMed] [Google Scholar]
- 17. Knoops, K. , Swett‐Tapia, C. , van den Worm, S. H. , Te Velthuis, A. J. et al., Integrity of the early secretory pathway promotes, but is not required for, severe acute respiratory syndrome coronavirus RNA synthesis and virus‐induced remodeling of endoplasmic reticulum membranes. J. Virol. 2010, 84, 833–846. [DOI] [PMC free article] [PubMed] [Google Scholar]
- 18. de Haan, C. A. , Rottier, P. J. , Molecular interactions in the assembly of coronaviruses. Adv. Virus Res. 2005, 64, 165–230. [DOI] [PMC free article] [PubMed] [Google Scholar]
- 19. Klumperman, J. , Locker, J. K. , Meijer, A. , Horzinek, M. C. et al., Coronavirus M proteins accumulate in the Golgi complex beyond the site of virion budding. J. Virol. 1994, 68, 6523–6534. [DOI] [PMC free article] [PubMed] [Google Scholar]
- 20. Kuo, L. , Masters, P. S. , Genetic evidence for a structural interaction between the carboxy termini of the membrane and nucleocapsid proteins of mouse hepatitis virus. J. Virol. 2002, 76, 4987–4999. [DOI] [PMC free article] [PubMed] [Google Scholar]
- 21. Narayanan, K. , Chen, C. J. , Maeda, J. , Makino, S. , Nucleocapsid‐independent specific viral RNA packaging via viral envelope protein and viral RNA signal. J. Virol. 2003, 77, 2922–2927. [DOI] [PMC free article] [PubMed] [Google Scholar]
- 22. Narayanan, K. , Maeda, A. , Maeda, J. , Makino, S. , Characterization of the coronavirus M protein and nucleocapsid interaction in infected cells. J. Virol. 2000, 74, 8127–8134. [DOI] [PMC free article] [PubMed] [Google Scholar]
- 23. Risco, C. , Muntion, M. , Enjuanes, L. , Carrascosa, J. L. , Two types of virus‐related particles are found during transmissible gastroenteritis virus morphogenesis. J. Virol. 1998, 72, 4022–4031. [DOI] [PMC free article] [PubMed] [Google Scholar]
- 24. Ong, S. E. , Blagoev, B. , Kratchmarova, I. , Kristensen, D. B. et al., Stable isotope labeling by amino acids in cell culture, SILAC, as a simple and accurate approach to expression proteomics. Mol. Cell. Proteomics 2002, 1, 376–386. [DOI] [PubMed] [Google Scholar]
- 25. Wurdinger, T. , Verheije, M. H. , Raaben, M. , Bosch, B. J. et al., Targeting non‐human coronaviruses to human cancer cells using a bispecific single‐chain antibody. Gene Ther. 2005, 12, 1394–1404. [DOI] [PMC free article] [PubMed] [Google Scholar]
- 26. de Haan, C. A. , van Genne, L. , Stoop, J. N. , Volders, H. , Rottier, P. J. , Coronaviruses as vectors: position dependence of foreign gene expression. J. Virol. 2003, 77, 11312–11323. [DOI] [PMC free article] [PubMed] [Google Scholar]
- 27. Sohn, K. , Orci, L. , Ravazzola, M. , Amherdt, M. et al., A major transmembrane protein of Golgi‐derived COPI‐coated vesicles involved in coatomer binding. J. Cell. Biol. 1996, 135, 1239–1248. [DOI] [PMC free article] [PubMed] [Google Scholar]
- 28. Rottier, P. J. , Horzinek, M. C. , van der Zeijst, B. A. , Viral protein synthesis in mouse hepatitis virus strain A59‐infected cells: effect of tunicamycin. J. Virol. 1981, 40, 350–357. [DOI] [PMC free article] [PubMed] [Google Scholar]
- 29. van Balkom, B. W. , van Gestel, R. A. , Brouwers, J. F. , Krijgsveld, J. et al., Mass spectrometric analysis of the Schistosoma mansoni tegumental sub‐proteome. J. Prot. Res. 2005, 4, 958–966. [DOI] [PubMed] [Google Scholar]
- 30. Brügger, B. , Sandhoff, R. , Wegehingel, S. , Gorgas, K. et al., Evidence for segregation of sphingomyelin and cholesterol during formation of COPI‐coated vesicles. J. Cell. Biol. 2000, 151, 507–518. [DOI] [PMC free article] [PubMed] [Google Scholar]
- 31. Kersey, P. J. , Duarte, J. , Williams, A. , Karavidopoulou, Y. et al., The International Protein Index: an integrated database for proteomics experiments. Proteomics 2004, 4, 1985–1988. [DOI] [PubMed] [Google Scholar]
- 32. Perkins, D. N. , Pappin, D. J. , Creasy, D. M. , Cottrell, J. S. , Probability‐based protein identification by searching sequence databases using mass spectrometry data. Electrophoresis 1999, 20, 3551–3567. [DOI] [PubMed] [Google Scholar]
- 33. Schulze, W. X. , Mann, M. , A novel proteomic screen for peptide‐protein interactions. J. Biol. Chem. 2004, 279, 10756–10764. [DOI] [PubMed] [Google Scholar]
- 34. van Breukelen, B. , van den Toorn, H. W. , Drugan, M. M. , Heck, A. J. , StatQuant: a post‐quantification analysis toolbox for improving quantitative mass spectrometry. Bioinformatics 2009, 25, 1472–1473. [DOI] [PubMed] [Google Scholar]
- 35. Raaben, M. , Groot Koerkamp, M. J. , Rottier, P. J. , de Haan, C. A. , Mouse hepatitis coronavirus replication induces host translational shutoff and mRNA decay, with concomitant formation of stress granules and processing bodies. Cell. Microbiol. 2007, 9, 2218–2229. [DOI] [PMC free article] [PubMed] [Google Scholar]
- 36. Schonborn, J. , Oberstrass, J. , Breyel, E. , Tittgen, J. et al., Monoclonal antibodies to double‐stranded RNA as probes of RNA structure in crude nucleic acid extracts. Nucleic Acids Res. 1991, 19, 2993–3000. [DOI] [PMC free article] [PubMed] [Google Scholar]
- 37. Hagemeijer, M. C. , Verheije, M. H. , Ulasli, M. , Shaltiel, I. A. et al., Dynamics of coronavirus replication‐transcription complexes. J. Virol. 2010, 84, 2134–2149. [DOI] [PMC free article] [PubMed] [Google Scholar]
- 38. Balch, W. E. , Dunphy, W. G. , Braell, W. A. , Rothman, J. E. , Reconstitution of the transport of protein between successive compartments of the Golgi measured by the coupled incorporation of N‐acetylglucosamine. Cell 1984, 39, 405–416. [DOI] [PubMed] [Google Scholar]
- 39. Ulasli, M. , Verheije, M. H. , de Haan, C. A. , Reggiori, F. , Qualitative and quantitative ultrastructural analysis of the membrane rearrangements induced by coronavirus. Cell. Microbiol. 2010, 12, 844–861. [DOI] [PMC free article] [PubMed] [Google Scholar]
- 40. Craig, R. , Beavis, R. C. , A method for reducing the time required to match protein sequences with tandem mass spectra. Rapid Commun. Mass Spectrom. 2003, 17, 2310–2316. [DOI] [PubMed] [Google Scholar]
- 41. Fenyo, D. , Beavis, R. C. , A method for assessing the statistical significance of mass spectrometry‐based protein identifications using general scoring schemes. Anal. Chem. 2003, 75, 768–774. [DOI] [PubMed] [Google Scholar]
- 42. Thomas, P. D. , Campbell, M. J. , Kejariwal, A. , Mi, H. et al., PANTHER: a library of protein families and subfamilies indexed by function. Genome Res. 2003, 13, 2129–2141. [DOI] [PMC free article] [PubMed] [Google Scholar]
- 43. Zhang, L. , Zhang, Z. P. , Zhang, X. E. , Lin, F. S. , Ge, F. , Quantitative proteomics analysis reveals BAG3 as a potential target to suppress SARS‐CoV replication. J. Virol. 2010, 84, 6050–6059. [DOI] [PMC free article] [PubMed] [Google Scholar]
- 44. Emmott, E. , Wise, H. , Loucaides, E. M. , Matthews, D. A. et al., Quantitative proteomics using SILAC coupled to LC‐MS/MS reveals changes in the nucleolar Proteome in Influenza A virus‐infected cells. J. Proteome Res. 2010, 9, 5335–5345. [DOI] [PubMed] [Google Scholar]
- 45. Munday, D. , Emmott, E. , Surtees, R. , Lardeau, C. H. et al., Quantitative proteomic analysis of A549 cells infected with human respiratory syncytial virus. Mol. Cell. Proteomics 2010, Epub ahead of print, doi: 10.1074/mcp.M110.001859. [DOI] [PMC free article] [PubMed] [Google Scholar]
- 46. Emmott, E. , Rodgers, M. , Macdonald, A. , McCrory, S. et al., Quantitative proteomics using stable isotope labeling with amino acids in cell culture (SILAC) reveals changes in the cytoplasmic, nuclear and nucleolar proteomes in Vero cells infected with the coronavirus infectious bronchitis virus. Mol. Cell. Proteomics 2010, 9, 1920–1936. [DOI] [PMC free article] [PubMed] [Google Scholar]
- 47. Coombs, K. M. , Berard, A. , Xu, W. , Krokhin, O. et al., Quantitative Proteomic Analyses of Influenza virus‐Infected Cultured Human Lung Cells. J. Virol. 2010, 84, 10888–10906. [DOI] [PMC free article] [PubMed] [Google Scholar]
- 48. Takatalo, M. S. , Kouvonen, P. , Corthals, G. , Nyman, T. A. , Ronnholm, R. H. , Identification of new Golgi complex specific proteins by direct organelle proteomic analysis. Proteomics 2006, 6, 3502–3508. [DOI] [PubMed] [Google Scholar]
- 49. Taylor, R. S. , Wu, C. C. , Hays, L. G. , Eng, J. K. et al., Proteomics of rat liver Golgi complex: minor proteins are identified through sequential fractionation. Electrophoresis 2000, 21, 3441–3459. [DOI] [PubMed] [Google Scholar]
- 50. Wu, C. C. , MacCoss, M. J. , Mardones, G. , Finnigan, C. et al., Organellar proteomics reveals Golgi arginine dimethylation. Mol. Biol. Cell 2004, 15, 2907–2919. [DOI] [PMC free article] [PubMed] [Google Scholar]
- 51. Wu, C. C. , Yates, J. R., 3rd , Neville, M. C. , Howell, K. E. , Proteomic analysis of two functional states of the Golgi complex in mammary epithelial cells. Traffic 2000, 1, 769–782. [DOI] [PubMed] [Google Scholar]
- 52. Neuman, B. W. , Joseph, J. S. , Saikatendu, K. S. , Serrano, P. et al., Proteomics analysis unravels the functional repertoire of coronavirus nonstructural protein 3. J. Virol. 2008, 82, 5279–5294. [DOI] [PMC free article] [PubMed] [Google Scholar]
- 53. Hoshino, D. , Tomari, T. , Nagano, M. , Koshikawa, N. , Seiki, M. , A novel protein associated with membrane‐type 1 matrix metalloproteinase binds p27(kip1) and regulates RhoA activation, actin remodeling, and matrigel invasion. J. Biol. Chem. 2009, 284, 27315–27326. [DOI] [PMC free article] [PubMed] [Google Scholar]
- 54. Sancak, Y. , Bar‐Peled, L. , Zoncu, R. , Markhard, A. L. et al., Ragulator‐Rag complex targets mTORC1 to the lysosomal surface and is necessary for its activation by amino acids. Cell 2010, 141, 290–303. [DOI] [PMC free article] [PubMed] [Google Scholar]
- 55. Nada, S. , Hondo, A. , Kasai, A. , Koike, M. et al., The novel lipid raft adaptor p18 controls endosome dynamics by anchoring the MEK‐ERK pathway to late endosomes. EMBO J. 2009, 28, 477–489. [DOI] [PMC free article] [PubMed] [Google Scholar]
- 56. Guillaumot, P. , Luquain, C. , Malek, M. , Huber, A. L. et al., Pdro, a protein associated with late endosomes and lysosomes and implicated in cellular cholesterol homeostasis. PLoS One 2010, 5, e10977. [DOI] [PMC free article] [PubMed] [Google Scholar]
- 57. Mannová, P. , Fang, R. , Wang, H. , Deng, B. et al., Modification of host lipid raft proteome upon hepatitis C virus replication. Mol. Cell. Proteomics 2006, 5, 2319–2325. [DOI] [PubMed] [Google Scholar]
- 58. Cordeiro, J. V. , Guerra, S. , Arakawa, Y. , Dodding, M. P. et al., F11‐mediated inhibition of RhoA signalling enhances the spread of vaccinia virus in vitro and in vivo in an intranasal mouse model of infection. PLoS One 2009, 4, e8506. [DOI] [PMC free article] [PubMed] [Google Scholar]
- 59. Glende, J. , Schwegmann‐Wessels, C. , Al‐Falah, M. , Pfefferle, S. et al., Importance of cholesterol‐rich membrane microdomains in the interaction of the S protein of SARS‐coronavirus with the cellular receptor angiotensin‐converting enzyme 2. Virology 2008, 381, 215–221. [DOI] [PMC free article] [PubMed] [Google Scholar]
- 60. Ren, X. , Glende, J. , Yin, J. , Schwegmann‐Wessels, C. , Herrler, G. , Importance of cholesterol for infection of cells by transmissible gastroenteritis virus. Virus Res. 2008, 137, 220–224. [DOI] [PMC free article] [PubMed] [Google Scholar]
- 61. Thorp, E. B. , Gallagher, T. M. , Requirements for CEACAMs and cholesterol during murine coronavirus cell entry. J. Virol. 2004, 78, 2682–2692. [DOI] [PMC free article] [PubMed] [Google Scholar]
- 62. Mourelatos, Z. , Gonatas, J. O. , Nycum, L. M. , Gonatas, N. K. , Biegel, J. A. , Assignment of the GLG1 gene for MGF‐160, a fibroblast growth factor and E‐selectin binding membrane sialoglycoprotein of the Golgi apparatus, to chromosome 16q22‐q23 by fluorescence in situ hybridization. Genomics 1995, 28, 354–355. [DOI] [PubMed] [Google Scholar]
- 63. Burrus, L. W. , Zuber, M. E. , Lueddecke, B. A. , Olwin, B. B. , Identification of a cysteine‐rich receptor for fibroblast growth factors. Mol. Cell. Biol. 1992, 12, 5600–5609. [DOI] [PMC free article] [PubMed] [Google Scholar]
- 64. Zuber, M. E. , Zhou, Z. , Burrus, L. W. , Olwin, B. B. , Cysteine‐rich FGF receptor regulates intracellular FGF‐1 and FGF‐2 levels. J. Cell. Physiol. 1997, 170, 217–227. [DOI] [PubMed] [Google Scholar]
- 65. Steegmaier, M. , Borges, E. , Berger, J. , Schwarz, H. , Vestweber, D. , The E‐selectin‐ligand ESL‐1 is located in the Golgi as well as on microvilli on the cell surface. J. Cell. Sci. 1997, 110, 687–694. [DOI] [PubMed] [Google Scholar]
- 66. Steegmaier, M. , Levinovitz, A. , Isenmann, S. , Borges, E. et al., The E‐selectin‐ligand ESL‐1 is a variant of a receptor for fibroblast growth factor. Nature 1995, 373, 615–620. [DOI] [PubMed] [Google Scholar]
- 67. Gonatas, J. O. , Mezitis, S. G. , Stieber, A. , Fleischer, B. , Gonatas, N. K. , MG‐160. A novel sialoglycoprotein of the medial cisternae of the Golgi apparatus. J. Biol. Chem. 1989, 264, 646–653. [PubMed] [Google Scholar]
- 68. Hay, J. C. , Klumperman, J. , Oorschot, V. , Steegmaier, M. et al., Localization, dynamics, and protein interactions reveal distinct roles for ER and Golgi SNAREs. J. Cell. Biol. 1998, 141, 1489–1502. [DOI] [PMC free article] [PubMed] [Google Scholar]
- 69. Spang, A. , Schekman, R. , Reconstitution of retrograde transport from the Golgi to the ER in vitro . J. Cell. Biol. 1998, 143, 589–599. [DOI] [PMC free article] [PubMed] [Google Scholar]
Associated Data
This section collects any data citations, data availability statements, or supplementary materials included in this article.
Supplementary Materials
Detailed facts of importance to specialist readers are published as ”Supporting Information”. Such documents are peer‐reviewed, but not copy‐edited or typeset. They are made available as submitted by the authors.
SupplInfo