

Abstract
To identify host factors involved in Salmonella replication, SILAC‐based quantitative proteomics was used to investigate the interactions of Salmonella typhimurium with the secretory pathway in human epithelial cells. Protein profiles of Golgi‐enriched fractions isolated from S. typhimurium‐infected cells were compared with those of mock‐infected cells, revealing significant depletion or enrichment of 105 proteins. Proteins annotated to play a role in membrane traffic were overrepresented among the depleted proteins whereas proteins annotated to the cytoskeleton showed a diverse behavior with some proteins being enriched, others being depleted from the Golgi fraction upon Salmonella infection. To study the functional relevance of identified proteins in the Salmonella infection cycle, small interfering RNA (siRNA) experiments were performed. siRNA‐mediated depletion of a selection of affected proteins identified five host factors involved in Salmonella infection. Depletion of peroxiredoxin‐6 (PRDX6), isoform β‐4c of integrin β‐4 (ITGB4), isoform 1 of protein lap2 (erbin interacting protein; ERBB2IP), stomatin (STOM) or TBC domain containing protein 10b (TBC1D10B) resulted in increased Salmonella replication. Surprisingly, in addition to the effect on Salmonella replication, depletion of STOM or ITGB4 resulted in a dispersal of intracellular Salmonella microcolonies. It can be concluded that by using SILAC‐based quantitative proteomics we were able to identify novel host cell proteins involved in the complex interplay between Salmonella and epithelial cells.
Keywords: Cell biology, Host–pathogen interactions, Salmonella typhimurium, Secretory pathway, SILAC
1 Introduction
Salmonella typhimurium, a Gram‐negative bacterium, is a serovar of the species Salmonella enterica. S. enterica serovars cause a variety of different diseases in man and other animals. S. typhimurium infections are a major cause of foodborne illness in humans throughout the world. In man, S. typhimurium infection usually leads to a self‐limiting gastroenteritis. However, in susceptible mouse strains this bacterium provokes a typhoid‐like disease, very similar to the typhoid fever caused in humans by the closely related S. enterica serovar typhi 1, 2, 3. Investigations into host‐pathogen interactions by S. typhimurium therefore increase not only our understanding of the pathogenesis of gastroenteritis, but also that of typhoid fever.
S. typhimurium can infect both macrophages and epithelial cells. It enters the human body by infecting microfold (M) cells, which are specialized epithelial cells in the intestinal tract, or by infecting other intestinal epithelial cells. Once the epithelial barrier has been passed, they can infect macrophages, adjacent to the epithelial layer 4, 5. Salmonella can also enter the bloodstream when they are taken up by dendritic cells that are present at the basolateral side of the intestinal epithelium 6. The infection of epithelial cells is a crucial step in Salmonella infection. The bacterium invades this type of cells by inducing its own uptake. For this purpose it employs a specialized secretion apparatus, called a type three secretion system (T3SS).
The S. typhimurium genome encodes two T3SSs that can translocate a large number of effector proteins from the bacterium into the cytosol of a host cell 7, 8, 9, 10, 11. These effector proteins modify host cell functions to the benefit of the bacterium. The T3SSs are encoded by the Salmonella pathogenicity islands 1 and 2 (SPI‐1 and SPI‐2; for reviews, see 7, 8, 12, 13, 14, 15, 16). To enable Salmonella's invasion of epithelial cells, the SPI‐1‐encoded T3SS of the bacterium translocates effectors across the plasma membrane of the epithelial cell. Among others, these effectors cause actin rearrangements, which induce ruffling of host cell's plasma membrane and uptake of the Salmonella by macropinocytosis 17, 18, 19, 20. Once inside the host cell, the bacterium resides in a so‐called Salmonella‐containing vacuole (SCV). The SPI‐2‐encoded T3SS, T3SS‐2, translocates effector proteins across the membrane of the SCV into host cell's cytoplasm to promote intracellular survival and replication of Salmonella. In order for Salmonella to replicate, the SCV moves to the perinuclear region where it becomes surrounded by membranes of the Golgi apparatus. During the migration to the Golgi region, the SCV matures and recruits several markers from the endo/lysosomal system by interacting with the endocytic and secretory pathway (for extensive reviews on SCV maturation and biogenesis, see 21, 22, 23, 24, 25, 26). Three T3SS‐2 effectors, SifA, SseF and SseG, were shown to be important for the maintenance of the SCV in the Golgi region 27, 28, 29, 30. Although there is no evidence for a direct contact between Salmonella and the Golgi apparatus, it has been shown that intact Golgi membranes are required for efficient Salmonella replication. Drug‐induced disruption of the Golgi apparatus has been demonstrated to decrease Salmonella replication 29. In addition to positioning itself in the Golgi region during replication, S. typhimurium can also redirect host secretory traffic. This results in the accumulation of exocytic cargo vesicles (post‐Golgi vesicles) in close proximity of the SCV 31. Thus, during infection, Salmonella interacts with the host cell secretory pathway in several ways. However, the details of these interactions and the host proteins involved are largely unknown. Insight into the interplay between Salmonella and the host is important for our understanding of Salmonella infection.
To investigate Salmonella–host interactions in more detail we used a quantitative proteomics approach. This approach is based on stable isotope labeling by amino acids in cell culture (SILAC), developed by Ong et al. 32. Recently, we applied this technique to investigate interactions of coronaviruses with the host secretory pathway 33. In the present study, we compared the protein profiles of isolated Golgi‐enriched fractions from cells that were either infected with S. typhimurium or mock‐infected.
After statistical analysis, 105 proteins were identified that were significantly changed in their abundance in the Golgi‐enriched fraction upon Salmonella infection. By depletion of a selected subset of these proteins using small interfering RNAs (siRNAs) we identified five proteins that were found to affect Salmonella replication.
2 Materials and methods
2.1 Cells and bacteria
HeLa cells were grown in DMEM (Cambrex) supplemented with 10% FCS, 100 IU of penicillin/mL and 100 μg of streptomycin/mL (pen/strep); all from Life Technologies (Paisley). For the infection experiments, wild‐type S. typhimurium strain 14028 (obtained from ATCC) was used.
2.2 Salmonella infection
S. typhimurium cultures were grown in Luria Bertani broth (LB; Biotrading) for 16–18 h at 37°C with continuous shaking. On the day of the experiment, bacteria from the overnight culture were diluted 33 times in LB broth and incubated for another 3.5 h to reach the exponential phase as described before 34. To follow a synchronized population of bacteria, HeLa cells were infected with Salmonella at a multiplicity of infection (MOI) of 100, for 15 min at 37°C in DMEM with 10% FCS, washed thoroughly with PBS and incubated in DMEM with addition of 100 μg/mL gentamycin (Gibco) for one hour to kill all extracellular bacteria. After this incubation, the medium was replaced by DMEM with 10% FCS and 10 μg/mL gentamycin and the infection was continued for 5 or 7 h for the SILAC and siRNA experiments, respectively.
2.3  C
C N‐arginine‐ and
  C
C N‐lysine‐labeling of HeLa cells
For the 13C15N‐arginine‐ and 13C15N‐lysine‐labeling of HeLa cells, cells were cultured in specialized medium. DMEM lacking l‐arginine and l‐lysine was obtained from PAN‐biotech (cat. no. P04‐04510S2). For the SILAC experiments this medium was reconstituted with either the heavy amino acids, l‐arginine‐13C6 15N4 hydrochloride (Spectra Stable Isotopes, cat. no. 548ARG98) and l‐lysine‐13C6 15N2 hydrochloride (Spectra Stable Isotopes, cat.no. 548LYS98) (referred to as heavy medium), or with the normal, light amino acids, l‐arginine‐12C6 14N4 hydrochloride (Sigma, cat. no. A5131) and l‐lysine‐12C6 14N2 hydrochloride (Sigma, cat. no. L5626) (referred to as light medium) at a final concentration of 84 and 146 mg/L for arginine and lysine, respectively. The heavy and light culture media were supplemented with dialyzed FCS (Invitrogen, cat. no. 26400‐044) and pen/strep similarly as described above. Cells were passaged in fresh medium when 80–90% confluency was reached. The extent and efficiency of the stable isotope labeling of the HeLa cells were checked using MALDI‐TOF‐TOF analysis. As was shown previously 33, already after one passage, the incorporation of the 13C15N amino acids was complete. For practical reasons, cells that had been passaged six times in the heavy medium were used in the SILAC experiments.
2.4 SILAC experiments: S. typhimurium infection
The SILAC procedure, which was described by Ong et al. 32, was performed with certain adjustments as we published previously 33. Briefly, two pools of HeLa cells were used that had been passaged six times in either the heavy or the light medium. The cells were grown in T175 flasks (Corning) until confluence was reached (approximately 3×10⁷ cells per flask). Cells from eight culture flasks were used per experiment, four flasks per labeling condition. In each SILAC experiment, HeLa cells cultured either in the light or the heavy medium were infected with wt S. typhimurium at an MOI of 100 or mock‐infected for six hours as described above. Three independent SILAC experiments were performed, two in which the HeLa cells cultured in the light medium and one in which the HeLa cells cultured in the heavy medium were infected with Salmonella.
2.5 SILAC experiments: isolation of a Golgi‐enriched fraction
Six hours post‐infection (p.i.), the Salmonella‐infected cells were harvested in homogenization buffer (250 mM sucrose in 10 mM Tris‐HCl, pH7.4) and combined in a 1:1 ratio with the mock‐infected cells. A Golgi‐enriched fraction was isolated from the cells using an established method 33, 35, 36, 37. Cells were homogenized with the Balch homogenizer (gap size 9 μm). Post‐nuclear supernatant (PNS) was obtained after centrifugation of the cell homogenate at 1700 rpm for 10 min at 4°C. This PNS was mixed with 62% w/w sucrose (in 10 mM Tris, pH 7.4) to obtain a 37% sucrose solution. Four ml of this solution was placed into an SW40 tube and overlaid with a 35% w/w and 29% w/w layer (approximately 5 and 4 mL respectively) of sucrose solution (in 10 mM Tris, pH 7.4). This gradient was centrifuged for 2 h and 40 min at 100 000×g. Approximately, 1 mL of a Golgi‐enriched fraction was collected at the 35–29% sucrose interphase. For further analysis, membranes were pelleted by centrifugation for 30 min at 100 000×g at 4°C after the addition of 4 volumes of PBS to 1 volume of the Golgi‐enriched fraction. Golgi‐enrichment of the isolated fraction was analyzed by Western blot analysis. A fraction of the PNS or Golgi‐enriched membranes corresponding to 20 μg protein was dissolved in Laemmli sample buffer containing β‐mercaptoethanol and heated for 5 min at 95°C. Proteins were separated using 12% SDS‐PAGE. The proteins were transferred to a PVDF membrane using the Western blot system from Bio‐rad and blocked in PBS/0.05% Tween/5% dried milk (Protifar, Nutricia) for 1 hour at room temperature. Primary antibodies (p23; 1:1000 38, or β‐actin; 1:2000, Abcam) were incubated in PBS/0.05% Tween/1% dried milk for 1 h at room temperature. After washing three times with PBS/0.05% Tween, the secondary antibody (gαrpo 1:10 000) was incubated for 1 h at room temperature. After another three washing steps, bound antibodies were visualized with the ECL detection kit from Pierce.
2.6 MS
A fraction of the Golgi‐enriched membranes corresponding to 80 μg protein was dissolved in Laemmli sample buffer containing 10 mM DTT and heated for 5 min at 95°C. Proteins were separated in a 12% SDS‐PAGE gradient gel, fixed in 5% acetic acid/30% methanol and stained using GelCode Blue reagent (Pierce). Gel lanes were cut into 24 equally sized slices, which were subjected to in‐gel trypsin digestion as described 39. Totally, 20–80% of the supernatants obtained after the digestion was used for LC‐MS/MS analysis on a ThermoFinnigan FT‐ICR equipped with a 7 Tesla magnet coupled to an Agilent Series 1100 binary pump system (Agilent Technologies). Peptide mixtures were trapped on an in‐house packed 5 cm×100 μm Aqua™ C18 reversed‐phase column (Phenomenex) at a flow rate of 5 μL/min. Peptide separation was achieved on a 15 cm×75 μm Aqua™ C18 reversed‐phase column using a gradient of 0–70% solution B (solution A=0.1 M acetic acid; solution B=80% v/v ACN, 0.1 M acetic acid) in 60 min at a constant flow rate of 200 nL/min.
2.7 MS data analysis
Finnigan *.raw files were converted into *.dta files using BioWorks software, version 3.1 SR1 (Thermo Electron). For this process the program was set to track the scan limits automatically and calculate for peptides with a mass from 300 to 5000 amu, automatically detecting the charge state and MS level (MS or MS/MS). The threshold was set to 100 counts. Subsequently, MASCOT generic files were generated through in‐house developed software. These files were used to search the IPI_Human 3.36 database 40 on an in‐house MASCOT server 41, allowing up to 2 missed cleavages, a peptide mass tolerance of 50 ppm and a fragment mass tolerance of 0.8 Da. Peptide modifications used in the searches were carbamidomethyl on cysteine (fixed) and oxidation on methionine, tryptophan and histidine (variable). Proteins matching the criteria for at least two reliable peptides (rank 1; unique; individual score higher than 29 (1% false positive rate)), and with a protein score higher than 64 were considered as positive identified proteins. Raw data files and Mascot html result pages were loaded into the MSQuant program 42 adapted for SILAC‐based quantitative analysis. All quantified peptides were checked by manual inspection of the spectra used for quantification. To identify statistically different protein abundances between samples (p<0.05), data from three independent experiments were loaded into the StatQuant program for statistical analysis 43.
2.8 siRNA experiments: replication assay
Two siRNA oligos per gene (targeting two different sites within the coding region) were obtained from Ambion. Validated oligos were used that induce a guaranteed knockdown by at least 80% and are chemically modified to reduce off target effects by up to 90%. For each gene, both oligos showed the same effect on Salmonella replication, reflecting the specificity of the validated oligos. HeLa cells were seeded into 24‐well plates and transfected with a final concentration of 20 nM siRNA (each siRNA oligo was transfected separately) using Oligofectamine (Invitrogen). Scrambled siRNAs (Ambion) and mock‐transfected cells (only Oligofectamine) were used as controls in each experiment. Forty‐eight hours after siRNA transfection, the cells were infected with S. typhimurium at an MOI of 100 as described above. For counting intracellular bacteria, HeLa cells were washed three times with PBS, lysed in PBS containing 1% Triton X‐100 and 0.1% SDS for 2 min and a dilution series was plated onto LB agar as described 44. The Salmonella fold increase was determined by dividing the number of colony forming units (cfu) at 8 h p.i. by the number of cfu at 1 hour p.i. Each siRNA experiment was performed in triplicate.
2.9 Quantitative real‐time (RT) PCR
To validate the knockdown of the targeted genes in the siRNA experiments, mRNA levels of each gene were determined. Forty‐eight hours after siRNA transfection, total RNA was isolated from the interfered cells using the TRIzol reagent (Invitrogen) and further purified using the RNeasy mini kit from Qiagen. The knockdown of the targeted genes was verified by quantitative RT‐PCR using Taqman Gene Expression Assays (Applied Biosystems, CA, USA). RT‐PCR reactions were performed on a LightCycler 480 system (Roche). The comparative Ct‐method was used to determine the fold change for each individual gene and the housekeeping gene GAPDH was used as a reference in all experiments.
2.10 Analyzing protein pattern in uninfected and infected cells
To study the protein pattern of the affected proteins in uninfected and Salmonella‐infected cells, PNS samples obtained from those cells were analyzed by Western Blot. HeLa cells were infected with S. typhimurium as described above (Section 2.2) or mock‐infected. Six hours p.i., the cells were harvested and homogenized with the Balch homogenizer (gap size 9 μm). PNS was obtained after centrifugation of the cell homogenate at 1700 rpm for 10 min at 4°C. The protein concentration of the PNS samples were measured using the Bradford assay and equal amounts of infected and uninfected PNS (30 μg) were loaded on gel, transferred to a PVDF membrane and stained with the appropriate antibodies as described above (paragraph 2.5). Antibodies recognizing three of the affected proteins (STOM, TBC1D10B and PRDX6) were used (Santa Cruz Biotechnology) as well as antibodies against the Gα‐ and Gβ‐subunits of the heterotrimeric G protein (GαGβ, Santa Cruz Biotechnology) and the housekeeping gene β‐actin (Abcam).
2.11 Salmonella microcolony morphology
To study the Salmonella microcolony after siRNA‐mediated depletion of the selected proteins, HeLa cells were seeded onto glass coverslips in a 24‐well plate (Corning), depleted for the selected proteins as described above and infected with S. typhimurium at an MOI of 100. At 6 hours p.i., the cells were fixed with 3.7% paraformaldehyde (PFA) for 15 min at room temperature, washed with PBS and permeabilized and blocked by incubating with blocking buffer (BB: 2% BSA/0.1% saponin in PBS) for 30–60 min at room temperature. Subsequently, the cells were incubated with the primary antibodies targeting the Golgi marker GM130 (anti‐GM130, 1:400, BD Transduction Laboratories) or the lipopolysaccharide of Salmonella (anti‐LPS, 1:400, Abcam) in BB for 60 min at room temperature. Cells were washed thoroughly with PBS and incubated with the secondary antibodies (goat‐anti‐mouse or goat‐anti‐rabbit antibodies conjugated with Alexa dyes 488 or 568; all from Invitrogen) for another 60 min at room temperature. After this incubation step, cells were washed three times with PBS, mounted on glass slides using FluorSave reagent (Calbiochem) and analyzed on a confocal microscope (Leica TCS Sp2 CLSM). For quantification of two different microcolony phenotypes (tight and dispersed), three independent experiments were performed in which 100 cells were counted per condition. We scored a microcolony as being dispersed when the percentage of open space within the microcolony area was higher than 75%.
3 Results
3.1 SILAC experiments
We compared the protein profiles of Golgi‐enriched fractions from cells that were either infected with S. typhimurium or mock‐infected by applying a quantitative proteomics approach, based on SILAC. Three independent experiments were performed, two in which the light cells were infected and one in which the heavy cells were infected with Salmonella. Since Salmonella replication is strongly dependent on its Golgi localization 29, which occurs 4–8 h p.i., we allowed infection to proceed for 6 h before Golgi isolation.
Six hours p.i. the Salmonella‐infected cells were combined with the control mock‐infected cells and a well‐defined Golgi‐enriched fraction was isolated using established procedures 33, 35, 36, 37. Enrichment of the Golgi membranes in the isolated fractions was confirmed by Western blot analysis using antibodies recognizing the Golgi marker protein p23 (Fig. 1A).
Figure 1.
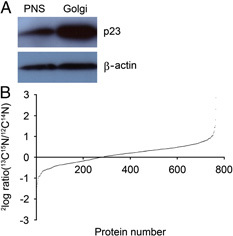
Ratio distribution of the identified proteins. Proteomic analysis was performed on Golgi‐enriched fractions. The enrichment of Golgi membranes in the isolated fraction (lane 2, 20 μg protein) was confirmed by Western blotting using the Golgi marker protein p23 by comparison with PNS (lane 1, 20 μg protein) (A). The ratios between the ‘heavy’ and ‘light’ peak in the corresponding mass spectra of the 765 identified proteins were calculated and plotted in the ratio distribution graph (B). The ratios of the majority of the proteins distributed around 1 (log2 ratio=0), confirming that the samples had been mixed equally and indicating that the majority of the proteins did not change in abundance upon Salmonella infection.
Proteins from the isolated Golgi fractions were separated by SDS‐PAGE, digested using in‐gel tryptic digestion and subjected to LC‐MS/MS. After Mascot database screening, the identified proteins were quantified using MSQuant 42, resulting in the identification of 765 proteins (referred to as identified proteins; Supporting Information Table S1) that were reliably identified and quantified. To analyze the differential expression of the identified proteins during Salmonella infection, ratios of the heavy and the light peak in the corresponding mass spectra were calculated (as described in Section 2). Figure 1 shows the ratio distribution of the 765 identified proteins. For the majority of the proteins, the ratios were distributed around 1 (2log ratio=0), confirming that the Salmonella‐infected and mock‐infected cells had been mixed in equal numbers and indicating that the majority of the proteins were not changed in abundance due to the infection. The StatQuant program 43 was used to calculate for which proteins the ratios differed significantly (p<0.05) from the mean. This analysis showed that the abundance of 105 proteins had significantly changed (referred to as affected proteins; Table 1) in the Golgi‐enriched fraction upon infection. Of these 105 affected proteins, 50 were enriched (2log ratio <1, referred to as enriched proteins) and 55 were depleted (2log ratio>1, referred to as depleted proteins) in the isolated Golgi‐enriched fraction.
Table 1.
List of affected proteins in Golgi‐enriched fraction of Salmonella‐infected HeLa cells relative to mock‐infected cells based on SILAC analysis
| ProteinID | Protein | Mean ratioa) | p‐Value |
|---|---|---|---|
| Enriched proteins | |||
| IPI00008780 | Stanniocalcin‐2 precursor | 0.216 | 0.0129 |
| IPI00410034 | Solute carrier family 38 member 2 | 0.225 | 0.0096 |
| IPI00025447 | EEF1A1protein | 0.498 | 0.0014 |
| IPI00025512 | Heat‐shock protein β‐1 | 0.499 | 0.0329 |
| IPI00178440 | Elongation factor 1‐β | 0.520 | 0.0167 |
| IPI00023860 | Nucleosome assembly protein 1‐like 1 | 0.530 | 0.0368 |
| IPI00001560 | Isoform 1 of cyclin‐dependent kinase inhibitor 2A | 0.536 | 0.0239 |
| IPI00217683 | A‐kinase anchor protein 12 isoform 2 | 0.545 | 0.0317 |
| IPI00013297 | 28 kDa heat‐ and acid‐stable phosphoprotein | 0.572 | 0.0112 |
| IPI00012837 | Kinesin heavy chain | 0.587 | 0.0323 |
| IPI00220301 | Peroxiredoxin‐6 | 0.636 | 0.0056 |
| IPI00479997 | Stathmin | 0.652 | 0.0182 |
| IPI00413108 | Ribosomal protein SA | 0.653 | 0.0134 |
| IPI00001639 | Importin β‐1subunit | 0.666 | 0.0002 |
| IPI00387144 | Tubulin α‐ubiquitous chain | 0.672 | 0.0003 |
| IPI00418471 | Vimentin | 0.678 | 0.0077 |
| IPI00554737 | Serine/threonine‐protein phosphatase 2A 65 kDa regulatory subunit A | 0.681 | 0.0487 |
| IPI00007752 | Tubulin β‐2C chain | 0.683 | 0.0199 |
| IPI00011654 | Tubulin β chain | 0.694 | 0.0317 |
| IPI00023048 | Elongation factor 1‐delta | 0.701 | 0.0036 |
| IPI00000643 | BAG family molecular chaperone regulator 2 | 0.727 | 0.0266 |
| IPI00396485 | Elongation factor 1‐α 1 | 0.729 | 0.0353 |
| IPI00419473 | Isoform 2 of Transcription factor BTF3 | 0.736 | 0.0271 |
| IPI00216587 | 40S ribosomal protein S8 | 0.739 | 0.0485 |
| IPI00014537 | Isoform 1 of Calumenin precursor | 0.741 | 0.0297 |
| IPI00645078 | Ubiquitin‐activating enzyme E1 | 0.749 | 0.0162 |
| IPI00008433 | 40S ribosomal protein S5 | 0.763 | 0.0260 |
| IPI00027230 | Endoplasmin precursor | 0.767 | 0.0344 |
| IPI00306332 | 60S ribosomal protein L24 | 0.774 | 0.0348 |
| IPI00221092 | 40S ribosomal protein S16 | 0.776 | 0.0284 |
| IPI00023785 | Isoform 1 of Probable ATP‐dependent RNA helicase DDX17 | 0.777 | 0.0425 |
| IPI00216975 | TPM4 Isoform 2 of Tropomyosin α‐4 chain | 0.778 | 0.0358 |
| IPI00013296 | 40S ribosomal protein S18 | 0.779 | 0.0143 |
| IPI00014263 | Isoform Long of Eukaryotic translation initiation factor 4H | 0.789 | 0.0125 |
| IPI00328748 | ARMET protein precursor | 0.791 | 0.0411 |
| IPI00009235 | Translocon‐associated protein subunit γ | 0.792 | 0.0403 |
| IPI00156689 | Synaptic vesicle membrane protein VAT‐1 homolog | 0.796 | 0.0229 |
| IPI00045396 | Isoform 2 of Calumenin precursor | 0.798 | 0.0126 |
| IPI00009904 | Protein disulfide‐isomerase A4 precursor | 0.806 | 0.0489 |
| IPI00332936 | Isoform 2 of Zinc finger CCCH type antiviral protein 1 | 0.811 | 0.0142 |
| IPI00000877 | 150 kDa oxygen‐regulated protein precursor | 0.812 | 0.0166 |
| IPI00216134 | Tropomyosin 1 α chain isoform 7 | 0.819 | 0.0179 |
| IPI00383581 | Isoform 1 of Neutral α‐glucosidase AB precursor | 0.819 | 0.0058 |
| IPI00010796 | Protein disulfide‐isomerase precursor | 0.823 | 0.0156 |
| IPI00220709 | Isoform 2 of Tropomyosin β chain | 0.824 | 0.0259 |
| IPI00063234 | PRKAR2A protein | 0.834 | 0.0246 |
| IPI00646304 | Peptidylprolyl isomerase B precursor | 0.874 | 0.0429 |
| IPI00027497 | Glucose‐6‐phosphate isomerase | 0.884 | 0.0315 |
| IPI00215893 | Heme oxygenase 1 | 0.904 | 0.0197 |
| IPI00020599 | Calreticulin precursor | 0.918 | 0.0186 |
| Depleted proteins | |||
| IPI00027397 | Isoform 1 of Hematological and neurological expressed 1‐like protein | 1.062 | 0.0471 |
| IPI00031697 | Transmembrane protein 109 precursor | 1.102 | 0.0253 |
| IPI00028946 | Isoform 3 of Reticulon‐3 | 1.148 | 0.0131 |
| IPI00297910 | Tumor‐associated calcium signal transducer 2 precursor | 1.172 | 0.0002 |
| IPI00385449 | Protein kinase C α type | 1.192 | 0.0086 |
| IPI00021076 | Isoform Long of Plakophilin‐4 | 1.226 | 0.0018 |
| IPI00075248 | Calmodulin | 1.251 | 0.0261 |
| IPI00029730 | Syntaxin‐4 | 1.252 | 0.0409 |
| IPI00023605 | Isoform 1 of Cdc42 effector protein 1 | 1.261 | 0.0232 |
| IPI00414005 | Isoform short of sodium/potassium‐transporting ATPase α‐1 chain | 1.275 | 0.0398 |
| IPI00017292 | Isoform 1 of Catenin β‐1 | 1.279 | 0.0396 |
| IPI00007755 | Ras‐related protein Rab‐21 | 1.297 | 0.0304 |
| IPI00293427 | E3 ubiquitin‐protein ligase ZNRF2 | 1.299 | 0.0397 |
| IPI00418169 | Annexin A2 isoform 1 | 1.312 | 0.0366 |
| IPI00398435 | Similar to Plexin‐B2 precursor | 1.313 | 0.0493 |
| IPI00012512 | Ras‐related protein R‐Ras2 precursor | 1.315 | 0.0484 |
| IPI00217563 | Isoform β‐1A of Integrin β‐1 precursor | 1.317 | 0.0285 |
| IPI00215995 | Isoform α‐3A of Integrin α‐3 precursor | 1.326 | 0.0061 |
| IPI00220194 | Solute carrier family 2. facilitated glucose transporter member 1 | 1.328 | 0.0162 |
| IPI00215948 | Isoform 1 of Catenin α‐1 | 1.331 | 0.0386 |
| IPI00010438 | Isoform SNAP‐23a of Synaptosomal‐associated protein 23 | 1.346 | 0.0076 |
| IPI00020557 | Low‐density lipoprotein receptor‐related protein 1 precursor | 1.348 | 0.0255 |
| IPI00216546 | Isoform 2 of Probable palmitoyltransferase ZDHHC5 | 1.354 | 0.0009 |
| IPI00302592 | Filamin A α | 1.365 | 0.0429 |
| IPI00742780 | FLJ00279 protein (Fragment) | 1.369 | 0.0432 |
| IPI00183002 | Isoform 1 of protein phosphatase 1 regulatory subunit 12A | 1.389 | 0.0185 |
| IPI00645194 | Integrin β 1 | 1.402 | 0.0460 |
| IPI00414320 | Annexin A11 | 1.409 | 0.0071 |
| IPI00019997 | Lin‐7 homolog C | 1.409 | 0.0162 |
| IPI00011578 | Isoform 1 of Neuroplastin precursor | 1.413 | 0.0337 |
| IPI00550234 | Isoform 1 of Actin‐related protein 2/3 complex subunit 5 | 1.416 | 0.0390 |
| IPI00033494 | Myosin regulatory light chain | 1.436 | 0.0161 |
| IPI00007058 | Coronin‐1B | 1.459 | 0.0203 |
| IPI00027422 | Isoform β‐4C of Integrin β‐4 precursor | 1.467 | 0.0072 |
| IPI00006034 | Cysteine‐rich protein 2 | 1.489 | 0.0053 |
| IPI00790010 | Engulfment adaptor PTB domain containing 1 | 1.503 | 0.0167 |
| IPI00021440 | Actin cytoplasmic 2 | 1.519 | 0.0138 |
| IPI00220991 | Isoform 2 of AP‐2 complex subunit β | 1.542 | 0.0244 |
| IPI00028911 | Dystroglycan precursor | 1.542 | 0.0241 |
| IPI00337415 | Guanine nucleotide‐binding protein G(i). α‐1 subunit | 1.551 | 0.0092 |
| IPI00335168 | Isoform Non‐muscle of Myosin light polypeptide 6 | 1.556 | 0.0332 |
| IPI00554521 | Ferritin heavy chain | 1.567 | 0.0331 |
| IPI00003348 | Guanine nucleotide‐binding protein G(I)/G(S)/G(T) subunit β 2 | 1.581 | 0.0355 |
| IPI00438286 | Isoform 1 of Protein LAP2 | 1.603 | 0.0498 |
| IPI00550363 | Transgelin‐2 | 1.607 | 0.0375 |
| IPI00219682 | Stomatin | 1.616 | 0.0016 |
| IPI00216682 | Calponin‐3 | 1.634 | 0.0157 |
| IPI00217059 | Isoform 2 of Coiled‐coil domain‐containing protein 50 | 1.663 | 0.0142 |
| IPI00020228 | Frizzled‐6 precursor | 1.690 | 0.0420 |
| IPI00220578 | Guanine nucleotide‐binding protein G | 1.762 | 0.0029 |
| IPI00015973 | Band 4.1‐like protein 2 | 1.869 | 0.0236 |
| IPI00464981 | Isoform 1 of Protein ITFG3 | 1.899 | 0.0442 |
| IPI00397949 | G protein‐coupled receptor 56 isoform b | 2.194 | 0.0282 |
| IPI00465071 | TBC domain containing protein 10B | 2.268 | 0.0060 |
| IPI00018219 | Transforming growth factor‐β‐induced protein ig‐h3 precursor | 2.692 | 0.0001 |
a) The mean ratio is the average ratio from three independent SILAC experiments.
3.2 Protein analysis
To gain more insight into the origin and function of the identified proteins, they were classified according to their subcellular location or molecular function annotation, using the Universal Protein Resource database (http://www.uniprot.org) and the PANTHER Classification System (Protein ANalysis THrough Evolutionary Relationships, http://www.pantherdb.org 45), respectively.
In Fig. 2A the categorization of the 765 identified proteins according to subcellular location annotation is compared with the 105 affected proteins. As expected, the 765 identified proteins were distributed among several different groups, since diverse intracellular membranes are known to be present in the isolated Golgi fraction, albeit at lower abundance 36. The overall distribution of the 105 affected proteins was only slightly different from that of the 765 identified proteins. The distribution of the affected proteins is somewhat changed for the cytoskeletal (CYT)‐, Golgi apparatus‐, mitochondrial‐ and endosomal‐localized proteins. As the distribution of proteins among different organelles in Fig. 2A does not distinguish between enrichment in or depletion from the Golgi‐enriched fraction upon infection, the affected proteins were analyzed in more detail for enriched and depleted proteins separately (Fig. 2B). The largest group of proteins consisted of proteins annotated to be localized to the cytoplasm. This group contained an equal proportion of enriched and depleted proteins. The proteins annotated to originate from the cytoskeleton and the Golgi apparatus were also both enriched in and/or depleted from the Golgi‐enriched fraction upon infection. The affected proteins predicted to be of ER or ribosomal origin were mainly enriched in the Golgi‐enriched fraction upon infection with Salmonella, whereas those annotated to originate from the plasma membrane, mitochondrion and endosomes were mainly depleted.
Figure 2.
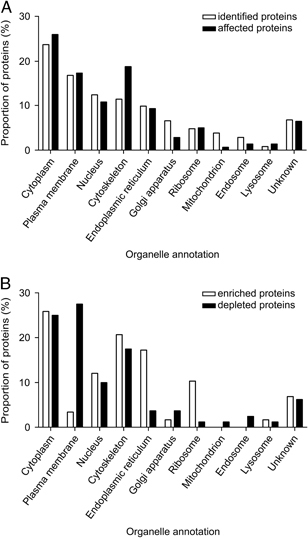
Subcellular localization of identified proteins. The subcellular localizations of the proteins were based on the annotations of UniProt. The distribution of the affected proteins was compared with that of all the identified proteins (A). The affected proteins were also categorized for the enriched and depleted proteins separately (B). Some proteins have more than one annotation, therefore the sum of each category can be higher than 100%.
The identified proteins were also categorized according to their molecular function annotation (Fig. 3A). The distribution of the majority of molecular function groups did not differ much between the identified and the affected proteins. It appeared that among the affected proteins, those with a CYT, select calcium‐binding (SCB) or isomerase (ISO) classification were overrepresented. Next, we again differentiated between the enriched and depleted proteins in the isolated fraction upon infection, and determined their distribution according to their molecular function (Fig. 3B). The CYT and SCB groups contained both enriched and depleted proteins, whereas the membrane traffic proteins (MT) were all depleted in the Golgi‐enriched fraction upon infection.
Figure 3.

Molecular functions of identified proteins. The molecular functions of the proteins were based on the annotations of the PANTHER classification system. The distribution of the affected proteins was compared with that of all the identified proteins (A). The affected proteins were also categorized for the enriched and depleted proteins separately (B). Some proteins have more than one annotation, therefore the sum of each category can be higher than 100%. MFU, molecular function unclassified; NAB, nucleic acid binding protein; CYT, cytoskeletal protein; SRM, select regulatory molecule; REC, receptor; MT, membrane traffic protein; TRANSP, transporter; SCB, select calcium‐binding protein; OX, oxireductase; CHA, chaperone; CA, cell adhesion molecule; MIF, miscellaneous function; HY, hydrolase; SM, signaling molecule; TRANSF, transferase; CAR, transfer/carrier protein; KIN, kinase; ISO, isomerase; SYNTH, synthase and synthetase; IONCH, ion channel protein; EXMX, extracellular matrix protein; PHOS, phosphatase; DEFIMM, defense/immunity protein; PROT, protease; TRF, transcription factor; CJ, cell junction protein; LY, lyase; LIG, ligase.
3.3 Functional relevance of selected protein hits
By performing RNA interference experiments, we validated the functional relevance of affected proteins in the Salmonella infection cycle. From the 105 affected proteins, 21 proteins were selected (Table 2). The 21 selected proteins covered 9 different molecular function groups and were predicted to localize to 6 different organelles. Both enriched and depleted proteins were selected. HeLa cells were depleted for each of the 21 selected proteins by transfecting cells with siRNA oligos targeting each selected protein. Forty‐eight hours post‐transfection the cells were infected with wt S. typhimurium for 8 h. The mean fold increase in Salmonella replication was calculated for each condition as described in Section 2.
Table 2.
21 selected candidates for the siRNA experiments
| Selected candidate | Gene symbol | Mean ratioa) | MF annotationb) | Organelle annotationc) |
|---|---|---|---|---|
| Enriched proteins | ||||
| Stanniocalcin‐2 precursor | STC2 | 0.22 | M | |
| Solute carrier family 38 member 2 | SLC38A2 | 0.22 | MFU | PM |
| A‐kinase anchor protein 12 isoform 2 | AKAP12 | 0.55 | MFU | CP/CYT |
| 28 kDa heat‐ and acid‐stable phosphoprotein | PDAP1 | 0.57 | MFU | ? |
| Kinesin heavy chain | KIF5B | 0.59 | CYT | CP/CYT |
| Peroxiredoxin‐6 | PRDX6 | 0.64 | OX | CP/L |
| Depleted proteins | ||||
| Coronin‐1B | CORO1B | 1.46 | CYT | CP/CYT |
| Isoform β‐4C of Integrin β‐4 precursor | ITGB4 | 1.47 | MFU | PM |
| Engulfment adaptor PTB domain containing 1 | GULP1 | 1.50 | SM | CP |
| Isoform 2 of AP‐2 complex subunit β | AP2B1 | 1.54 | MT | CP/PM |
| Guanine nucleotide‐binding protein G(i), α‐1 subunit | GNAI1 | 1.55 | SRM | PM |
| Ferritin heavy chain | FTH1 | 1.57 | MIF | CP |
| Guanine nucleotide‐binding protein G(I)/G(S)/G(T) subunit b2 | GNB2 | 1.58 | SRM/HY | CP |
| Isoform 1 of Protein LAP2 | ERBB2IP | 1.60 | MIF | N/CP/PM |
| Stomatin | STOM | 1.62 | CYT | CYT/PM |
| Frizzled‐6 precursor | FZD6 | 1.69 | MFU | PM |
| Guanine nucleotide‐binding protein G | GNAI3 | 1.76 | SRM | G/CP/PM |
| Band 4,1‐like protein 2 | EPB41L2 | 1.87 | MFU | CYT/PM |
| Isoform 1 of Protein ITFG3 | ITFG3 | 1.90 | MFU | ? |
| G protein‐coupled receptor 56 isoform b | GPR56 | 2.19 | REC | PM |
| TBC domain containing protein 10B | TBC1D10B | 2.27 | SRM | ? |
a)The mean ratio is the average ratio from three independent SILAC experiments.
b)Molecular Function annotation: SM, signaling molecule; MFU, molecular function unclassified; CYT, cytoskeletal protein; OX, oxireductase; MT, membrane traffic; SRM, select regulatory molecule; MIF, miscellaneous function; HY, hydrolase; REC, receptor.
c)?, unknown; PM, plasma membrane; CP, cytoplasm; CYT, cytoskeleton; L, lysosome; N, nucleus; G, Golgi apparatus.
Figure 4A depicts the differences in Salmonella replication in HeLa cells depleted for the selected proteins, as compared with HeLa cells transfected with control (scrambled) siRNA. Interestingly, depletion of peroxiredoxin‐6 (PRDX6), isoform β‐4c of integrin β‐4 (ITGB4), isoform 1 of protein lap2 (erbin interacting protein; ERBB2IP), stomatin (STOM) or TBC domain containing protein 10b (TBC1D10B) led to a >two‐fold increased Salmonella replication. Depletion of most other proteins did not lead to a major change in Salmonella replication.
Figure 4.
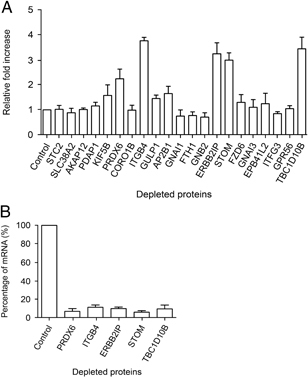
Functional relevance of the selected proteins. HeLa cells were transfected with siRNA oligos targeting the selected proteins for 48 h and infected with wt Salmonella for 8 h. The differences in Salmonella replication in the interfered cells are depicted as the mean fold increase expressed relative to cells treated with control siRNAs (A). The efficiency of mRNA degradation after transfection of siRNA oligos targeting PRDX6, ITGB4, ERBB2IP, STOM and TBC1D10B is shown in (B). The results of three independent experiments are shown. Error bars indicate standard deviations.
As a control for the siRNA transfection efficiency, mRNA degradation of PRDX6, ITGB4, ERBB2IP, STOM and TBC1D10B was assessed by quantitative RT‐PCR. As shown in Fig. 4B, transfection of the different siRNA oligos led to a significant reduction (>85–95%) in the amount of mRNA encoding each of the five proteins when compared to cells transfected with control siRNA oligos.
3.4 Protein patterns in uninfected and Salmonella‐infected cells
We determined the potential subcellular relocation of PRDX6, ITGB4, ERBB2IP, STOM or TBC1D10B upon infection. Using appropriate antibodies we were, however, unsuccessful at the immunofluorescence (IF) level to show significant changes in subcellular localization upon infection. This does, however, not exclude relocation of affected proteins as relocation of small (catalytic) amounts of protein to/from another organelle may have a strong effect at e.g. the Golgi complex. Since no evidence for appreciable relocation of affected proteins could be gleaned from IF microscopy, we also investigated alterations in expression levels as a mean to significantly change the amount of protein in the Golgi‐enriched fraction. To this end we compared the protein levels of STOM, TBC1D10B and PRDX6 in PNS of uninfected versus infected cells using Western blot analysis. As shown in Fig. 5, the cellular protein expression level of STOM, TBC1D10B and PRDX6 (and also of the controls, GαGβ and β‐actin) did not change upon infection.
Figure 5.
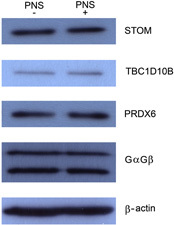
Western blot analysis of protein pattern in uninfected and infected cells. PNS obtained from mock‐infected (PNS‐) and Salmonella‐infected (PNS+) cells were loaded (30 μg protein for each PNS sample) and stained for three of the affected proteins (STOM, TBC1D10B and PRDX6) as well as two controls (GαGβ and β‐actin).
3.5 STOM and ITGB4 depletion leads to a dispersal of Salmonella microcolonies
To investigate whether the depletion of PRDX6, ITGB4, ERBB2IP, STOM or TBC1D10B also had an effect on the Salmonella microcolony morphology, cells were transfected with the siRNA oligos and infected with Salmonella (as described above), after which the microcolonies were analyzed by confocal microscopy. Two different phenotypes were observed: tight and dispersed microcolonies. Representative images used for the confocal analysis are shown in Fig. 6A. The control cells mainly contained tight Salmonella microcolonies in the Golgi region. Strikingly, however, depletion of STOM or ITGB4 resulted in a dispersal of Salmonella bacteria throughout the cytoplasm. Depletion of TBC1D10B, ERBB2IP or PRDX6 did not show this dispersal effect. The phenotype of the microcolonies after depletion of STOM or ITGB4 was also quantified by counting the microcolonies of 100 HeLa cells per condition in three independent experiments (Fig. 6B). Approximately, 75% of the control cells contained tight microcolonies, whereas the majority of STOM‐ or ITGB4‐depleted HeLa cells contained dispersed microcolonies. As an additional control, the microcolony phenotype in TBC1D10B‐depleted HeLa cells was also quantified. Similar to the control cells, approximately 75% of the TBC1D10B‐depleted cells contained tight microcolonies.
Figure 6.
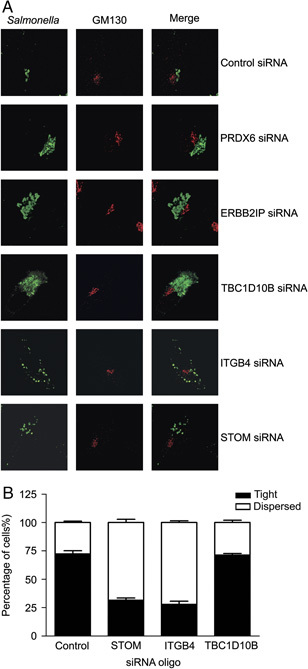
Changed morphology of Salmonella microcolonies upon depletion of STOM or ITGB4. HeLa cells were transfected with siRNA oligos targeting PRDX6, ITGB4, ERBB2IP, STOM or TBC1D10B and infected with wt Salmonella for 6 h. Cells were stained with anti‐LPS and anti‐GM130 antibodies. The morphology of Salmonella microcolonies in cells depleted of the five proteins is shown in (A). In green is the anti‐LPS staining, identifying the Salmonella microcolony, and in red is the anti‐GM130 (Golgi) staining. Quantification of the degree of dispersal of the microcolonies due to depletion of STOM, ITGB4 or TBC1D10B is shown in (B). Three independent experiments were performed in which 100 HeLa cells per condition were analyzed.
4 Discussion
During invasion and replication in cells, Salmonella delivers more than 30 effectors into the host cell cytosol to control SCV maturation by modulating its interaction with diverse intracellular compartments. Many of the host proteins that are involved in these interactions remain to be identified. Detailed insight into Salmonella–host interactions is important for our understanding of Salmonella infection and may also lead to new possibilities for therapeutic intervention. In a previous report 33 we applied SILAC‐based quantitative proteomics to investigate coronavirus–host interactions. In this study, we used the same approach to study Salmonella infection in epithelial cells. Because of the known role of the secretory pathway, and more specifically the Golgi apparatus, in the infection cycle of Salmonella, we focused our attention on isolated Golgi‐enriched fractions. We compared protein abundances in these fractions isolated from Salmonella‐ and mock‐infected HeLa cells. We identified 105 proteins that changed in abundance in the Golgi‐enriched fractions upon Salmonella infection. The functional relevance of a subset of these proteins was examined using siRNA‐mediated depletion and for five proteins this was shown to lead to an increased Salmonella replication.
To obtain more insight into the proteins that changed significantly in abundance upon Salmonella infection, the identified proteins were grouped according to their organellar and molecular function annotation. Proteins annotated to be localized to several cellular compartments were found in the Golgi‐enriched fraction. This is not unexpected as our Golgi isolation procedure is based on established protocols that show a maximal 52‐fold enrichment of Golgi markers, with a 1–4‐fold enrichment of protein markers from other organelles 35, 36, 37. Of note, proteins localizing primarily in other organelles than the Golgi may very well also be present in the Golgi, albeit at lower levels. We identified 765 proteins in the Golgi‐enriched fraction from which 105 were affected upon Salmonella infection. From Figs. 2 and 3 it is clear that Salmonella infection affected proteins from several different groups. Proteins predicted to associate with the cytoskeleton/annotated to the CYT function group (Figs. 2 and 3) were consistently affected. This is in agreement with several reports showing that Salmonella infection affects the cytoskeleton during entry and movement to the Golgi region in order to establish a replicating niche 17, 28, 46, 47, 48. Some of the affected CYT proteins in the Golgi‐enriched fraction were increased in abundance, whereas others were decreased. It remains to be established whether a change in the location of a cytoskeleton‐associated protein is initiated either by Salmonella to promote its replication, or by the host cell to elicit an immune response. In addition, proteins annotated to the membrane traffic group, mainly predicted to localize to the Golgi apparatus/endosomes, were consistently affected upon Salmonella infection. The majority of those proteins were depleted from the Golgi fraction upon Salmonella infection. The depletion of these affected proteins from the Golgi region upon Salmonella infection might be the result of relocation of these proteins away from the Golgi either induced by the bacterium for its own benefit or by the host cell as a defense mechanism. Our preliminary data (RT‐PCR analysis of mRNA levels in uninfected vs infected cells) indicated that the affected proteins are not down regulated, suggesting that the change in their abundance in the Golgi more likely results from altered membrane dynamics/protein relocation than from altered protein degradation/altered gene expression (data not shown). These data were confirmed by comparison of protein levels (STOM, TBC1D10B and PRDX6) in PNS of uninfected versus infected cells using Western blot analysis (Fig. 5). The results showed that at least for STOM, TBC1D10B and PRDX6 the cellular protein expression level did not change upon infection and suggest that relocation of these proteins is a likely cause of depletion or enrichment in the Golgi‐enrieched fraction. As a (loading) control for this experiment, antibodies recognizing GαGβ and β‐actin were used. As can be seen in Fig. 5, the signal for these proteins is the same in uninfected and infected PNS.
Of note, because of the (SILAC) procedure it is highly unlikely that the affected abundance of the CYT proteins and/or membrane traffic proteins that we observed during Salmonella infection is the result of cellular contamination. If an indentified protein (Table 1) would be present as a result of impurities, this protein will be present in isolated fractions from infected as well as from uninfected cells, resulting in a ratio of 1 (Fig. 1). In addition, when we use the same (SILAC) approach to investigate coronavirus infections 33, there is no overlap in identified proteins, illustrating the specificity of the identified proteins for Salmonella infections.
To study the functional relevance of the affected proteins in Salmonella replication, siRNA experiments were performed for a selected subset of these proteins. Depletion of PRDX6, ITGB4, ERBB2IP, STOM or TBC1D10B resulted in a >two‐fold increase of Salmonella replication. In addition to the effect of these five proteins on Salmonella replication, depletion of STOM or ITGB4 resulted in a dispersal of the Salmonella microcolony (Fig. 6). This is an interesting phenotype, although with our present knowledge, hard to explain. Efficient Salmonella replication in epithelial cells is known to be dependent on tight microcolonies that are surrounded by intact Golgi membranes. Dispersed microcolonies were shown to result in decreased replication by others before 29. However, in our case, cells that are depleted of STOM or ITGB4, show an increased Salmonella replication, despite of (or because of) dispersed microcolonies. This interesting phenotype is currently subject of further investigation.
In our assay system, PRDX6 was enriched in the isolated Golgi‐enriched fraction from Salmonella‐infected cells, while ITGB4, ERBB2IP, STOM and TBC1D10B were depleted in these fractions. Despite the difference in the effect of infection on the abundance in the Golgi fraction of PRDX6 on the one hand, and that of the other four proteins on the other hand, depletion of each of the five proteins by siRNA led to increased Salmonella replication. Although at first sight this may look like a discrepancy, it should be kept in mind that the siRNA treatment leads to depletion of the respective proteins in the whole cell, whereas the changes in abundance upon infection in our assay system were observed in isolated Golgi fractions. Moreover, with our current knowledge we cannot say whether the effects on the abundance of the five proteins seen in the Golgi fraction reflect changes initiated by the Salmonella to promote its own replication or changes initiated by the host cell to inhibit Salmonella replication. This may, of course, differ for the various proteins.
Below we will briefly discuss the five proteins that affected Salmonella replication.
PRDX6 is a member of the peroxiredoxin family of antioxidant enzymes. It is a bifunctional enzyme that has both glutathione peroxidase and phospholipase A2 (PLA2) enzymatic activities 49. As the PLA2 activity of PRX6 is maximal at acidic pH, it was suggested that PRDX6 has a lysosomal localization 50, 51, 52. Recently, another report has shown that PRDX6 can be translocated to the plasma membrane where its PLA2 activity can be activated 53. A function of PRDX6 in Salmonella infection has not been described, but as the SCV has several interactions with the endo/lysosomal pathway during maturation, PRDX6 might as well be involved in those interactions. Furthermore, PRDX6 might also interfere with the oxidative stress response that is induced by the host cell upon Salmonella infection.
ITGB4 is a member of the integrin family, which are transmembrane glycoprotein receptors that mediate cell–matrix and cell–cell adhesion. They also transduce signals that regulate gene expression and cell growth. Integrins are composed of different combinations of α and β subunits that differ in their ligand binding specificity. The role of ITGB4 in Salmonella infection has not been elucidated so far. Interestingly, ITGB4 has been shown to bind to ERBB2IP (a.k.a. ERBIN and LAP2 54) that was also found in our screen. Members of the LAP (leucine‐rich repeats and PDZ domains) family of proteins are involved in maintaining the shape and apical‐basal polarity of epithelial cells 55. ERBB2IP has been found to bind to Nod2 in epithelial cells infected with Shigella flexneri 56. Nod2 is a member of the NACHT‐LRR proteins (NLRs) that can sense bacterial components in order to elicit an immune response 57. It is localized to the cell membrane and this localization is important for its bacterium‐sensing function 58. Kufer et al. 56 showed that ERBB2IP and Nod2 partially co‐localize at the cell membrane and at the entry foci during infection with Shigella. It was furthermore shown that ERBB2IP acts as a negative regulator of Nod2 signaling 59. The decreased amount of ERBB2IP in the Golgi fraction isolated from HeLa cells infected by Salmonella may reflect a relocation of ERBB2IP, resulting in changed dynamics of the Nod2/ERBB2IP complex. This was also shown in Shigella infection 52 although the biological relevance of this observation remains to be established.
TBC1D10B is a member of the Tre‐2/Bub2/Cdc16 (TBC) domain‐containing proteins. The TBC domain is a conserved protein motif that functions as a Rab GTPase‐activating protein (Rab‐GAP). TBC1D10B was shown to function as a Rab‐GAP for Rab3A, Rab22A, Rab27A and Rab35 60. Smith et al. 61 studied the association of various Rabs with SCVs that either contain wt Salmonella or a non‐invasive Salmonella mutant that travels to late endocytic compartments (considered the model phagosome). Eighteen Rabs were found to be associated with the maturing SCV. Rab35 was not present on wt SCVs but was associated with the model phagosomes, which suggests a role for Rab35 in phagosome maturation 61. Since TBC1D10B was depleted from our Golgi fraction upon Salmonella infection, this may suggest an affected Rab35 activation and thereby an affected SCV maturation.
STOM is a multifunctional integral membrane protein. It associates with lipid rafts 62 and is suggested to regulate ion channel function or to act as a CYT anchor 63, 64, 65, 66, 67. Furthermore, STOM has been shown to associate with lipid droplets that interact with other vesicles in the cell 68. Lipid droplets accumulate in the surroundings of the SCV. This interaction may be involved in the supply of elevated levels of cholesterol on the SCV that become esterified by a Salmonella effector 69. Whether STOM plays a role in this process remains to be established.
In summary, we have identified 105 proteins that were significantly affected during Salmonella infection. Depletion of only a small subset of these proteins already identified five host factors involved in Salmonella replication. PRDX6, ITGB4, ERBB2IP, STOM and TBC1D10B all have different functions, which can shed new light on the details of Salmonella–host interactions. Therefore, these five proteins will be subjects of further investigations aimed at elucidating the interplay between Salmonella and epithelial cells.
Supporting information
Detailed facts of importance to specialist readers are published as ”Supporting Information”. Such documents are peer‐reviewed, but not copy‐edited or typeset. They are made available as submitted by the authors.
SupplInfo
Acknowledgements
This work was financially supported by the Faculty of Veterinary Medicine of Utrecht University, The Netherlands. The authors thank Ruud Eerland for assistance with the Salmonella replication assays and Richard Wubbolts (centre for cellular imaging (CCI) from the faculty of Veterinary Medicine, Utrecht University) for assistance with analyzing the confocal images. The authors acknowledge the Netherlands Proteomics Centre, embedded in the Netherlands Genomics Initiative, for support and access to the mass spectrometry facilities.
The authors have declared no conflict of interest.
Contributor Information
Mijke W. Vogels, Email: mijke.vogels@gmail.com
J. Bernd Helms, Email: j.b.helms@uu.nl.
5 References
- 1. Ohl, M. E. , Miller, S. I. , Salmonella: a model for bacterial pathogenesis. Annu. Rev. Med. 2001, 52, 259–274. [DOI] [PubMed] [Google Scholar]
- 2. Tsolis, R. M. , Kingsley, R. A. , Townsend, S. M. , Ficht, T. A. et al., Of mice, calves, and men. Comparison of the mouse typhoid model with other Salmonella infections. Adv. Exp. Med. Biol. 1999, 473, 261–274. [PubMed] [Google Scholar]
- 3. Santos, R. L. , Zhang, S. , Tsolis, R. M. , Kingsley, R. A. et al., Animal models of Salmonella infections: enteritis versus typhoid fever. Microbes Infect. 2001, 3, 1335–1344. [DOI] [PubMed] [Google Scholar]
- 4. Jones, B. D. , Ghori, N. , Falkow, S. , Salmonella typhimurium initiates murine infection by penetrating and destroying the specialized epithelial M cells of the Peyer's patches. J. Exp. Med. 1994, 180, 15–23. [DOI] [PMC free article] [PubMed] [Google Scholar]
- 5. Santos, R. L. , Bäumler, A. J. , Cell tropism of Salmonella enterica . Int. J. Med. Microbiol. 2004, 294, 225–233. [DOI] [PubMed] [Google Scholar]
- 6. Rescigno, M. , Urbano, M. , Valzasina, B. , Francolini, M. et al., Dendritic cells express tight junction proteins and penetrate gut epithelial monolayers to sample bacteria. Nat. Immunol. 2001, 2, 361–367. [DOI] [PubMed] [Google Scholar]
- 7. Hueck, C. J. , Type III protein secretion systems in bacterial pathogens of animals and plants. Microbiol. Mol. Biol. Rev. 1998, 62, 379–433. [DOI] [PMC free article] [PubMed] [Google Scholar]
- 8. Cornelis, G. R. , Van Gijsegem, F. , Assembly and function of type III secretory systems. Annu. Rev. Microbiol. 2000, 54, 735–774. [DOI] [PubMed] [Google Scholar]
- 9. Schraidt, O. , Lefebre, M. D. , Brunner, M. J. , Schmied, W. H. et al., Topology and organization of the Salmonella typhimurium type III secretion needle complex components. PLoS Pathog. 2010, 6, e1000824. [DOI] [PMC free article] [PubMed] [Google Scholar]
- 10. Galán, J. E. , Wolf‐Watz, H. , Protein delivery into eukaryotic cells by type III secretion machines. Nature 2006, 444, 567–573. [DOI] [PubMed] [Google Scholar]
- 11. He, S. Y. , Nomura, K. , Whittam, T. S. , Type III protein secretion mechanism in mammalian and plant pathogens. Biochim. Biophys. Acta 2004, 1694, 181–206. [DOI] [PubMed] [Google Scholar]
- 12. Galán, J. E. , Salmonella interactions with host cells: type III secretion at work. Annu. Rev. Cell Dev. Biol. 2001, 17, 53–86. [DOI] [PubMed] [Google Scholar]
- 13. Hansen‐Wester, I. , Hensel, M. , Salmonella pathogenicity islands encoding type III secretion systems. Microbes Infect. 2001, 3, 549–559. [DOI] [PubMed] [Google Scholar]
- 14. Hensel, M. , Salmonella pathogenicity island 2. Mol. Microbiol. 2000, 36, 1015–1023. [DOI] [PubMed] [Google Scholar]
- 15. Steele‐Mortimer, O. , Brumell, J. H. , Knodler, L. A. , Méresse, S. et al., The invasion‐associated type III secretion system of Salmonella enterica serovar Typhimurium is necessary for intracellular proliferation and vacuole biogenesis in epithelial cells. Cell Microbiol. 2002, 4, 43–54. [DOI] [PubMed] [Google Scholar]
- 16. Waterman, S. R. , Holden, D. W. , Functions and effectors of the Salmonella pathogenicity island 2 type III secretion system. Cell Microbiol. 2003, 5, 501–511. [DOI] [PubMed] [Google Scholar]
- 17. Finlay, B. B. , Ruschkowski, S. , Dedhar, S. , Cytoskeletal rearrangements accompanying Salmonella entry into epithelial cells. J. Cell Sci. 1991, 99, 283–296. [DOI] [PubMed] [Google Scholar]
- 18. Francis, C. L. , Ryan, T. A. , Jones, B. D. , Smith, S. J. , Falkow, S. , Ruffles induced by Salmonella and other stimuli direct macropinocytosis of bacteria. Nature 1993, 364, 639–642. [DOI] [PubMed] [Google Scholar]
- 19. Chen, L. M. , Hobbie, S. , Galán, J. E. , Requirement of CDC42 for Salmonella‐induced cytoskeletal and nuclear responses. Science 1996, 274, 2115–2118. [DOI] [PubMed] [Google Scholar]
- 20. Hardt, W. D. , Chen, L. M. , Schuebel, K. E. , Bustelo, X. R. , Galan, J. E. , S. typhimurium encodes an activator of Rho GTPases that induces membrane ruffling and nuclear responses in host cells. Cell 1998, 93, 815–826. [DOI] [PubMed] [Google Scholar]
- 21. Bakowski, M. A. , Braun, V. , Brumell, J. H. , Salmonella‐containing vacuoles: directing traffic and nesting to grow. Traffic 2008, 9, 2022–2031. [DOI] [PubMed] [Google Scholar]
- 22. Gorvel, J. P. , Méresse, S. , Maturation steps of the Salmonella‐containing vacuole. Microbes Infect 2001, 3, 1299–1303. [DOI] [PubMed] [Google Scholar]
- 23. Knodler, L. A. , Steele‐Mortimer, O. , Taking possession: biogenesis of the Salmonella‐containing vacuole. Traffic 2003, 4, 587–599. [DOI] [PubMed] [Google Scholar]
- 24. Ramsden, A. E. , Holden, D. W. , Mota, L. J. , Membrane dynamics and spatial distribution of Salmonella‐containing vacuoles. Trends Microbiol. 2007, 15, 516–524. [DOI] [PubMed] [Google Scholar]
- 25. Steele‐Mortimer, O. , The Salmonella‐containing vacuole: moving with the times. Curr. Opin. Microbiol. 2008, 11, 38–45. [DOI] [PMC free article] [PubMed] [Google Scholar]
- 26. Steele‐Mortimer, O. , Méresse, S. , Gorvel, J. P. , Toh, B. H. , Finlay, B. B. , Biogenesis of Salmonella typhimurium‐containing vacuoles in epithelial cells involves interactions with the early endocytic pathway. Cell Microbiol. 1999, 1, 33–49. [DOI] [PubMed] [Google Scholar]
- 27. Abrahams, G. L. , Müller, P. , Hensel, M. , Functional dissection of SseF, a type III effector protein involved in positioning the Salmonella‐containing vacuole. Traffic 2006, 7, 950–965. [DOI] [PubMed] [Google Scholar]
- 28. Deiwick, J. , Salcedo, S. P. , Boucrot, E. , Gilliland, S. M. et al., The translocated Salmonella effector proteins SseF and SseG interact and are required to establish an intracellular replication niche. Infect. Immun. 2006, 74, 6965–6972. [DOI] [PMC free article] [PubMed] [Google Scholar]
- 29. Salcedo, S. P. , Holden, D. W. , SseG, a virulence protein that targets Salmonella to the Golgi network. Embo J. 2003, 22, 5003–5014. [DOI] [PMC free article] [PubMed] [Google Scholar]
- 30. Ramsden, A. E. , Mota, L. J. , Munter, S. , Shorte, S. L. , Holden, D. W. , The SPI‐2 type III secretion system restricts motility of Salmonella‐containing vacuoles. Cell Microbiol. 2007, 9, 2517–2529. [DOI] [PMC free article] [PubMed] [Google Scholar]
- 31. Kuhle, V. , Abrahams, G. L. , Hensel, M. , Intracellular Salmonella enterica redirect exocytic transport processes in a Salmonella pathogenicity island 2‐dependent manner. Traffic 2006, 7, 716–730. [DOI] [PubMed] [Google Scholar]
- 32. Ong, S. E. , Blagoev, B. , Kratchmarova, I. , Kristensen, D. B. et al., Stable isotope labeling by amino acids in cell culture, SILAC, as a simple and accurate approach to expression proteomics. Mol. Cell. Proteomics 2002, 1, 376–386. [DOI] [PubMed] [Google Scholar]
- 33. Vogels, M. W. , van Balkom, B. W. , Kaloyanova, D. V. , Batenburg, J. J. et al., Identification of host factors involved in coronavirus replication by quantitative proteomics analysis. Proteomics 2011, 11, 64–80. [DOI] [PMC free article] [PubMed] [Google Scholar]
- 34. Beuzón, C. R. , Méresse, S. , Unsworth, K. E. , Ruiz‐Albert, J. et al., Salmonella maintains the integrity of its intracellular vacuole through the action of SifA. Embo J. 2000, 19, 3235–3249. [DOI] [PMC free article] [PubMed] [Google Scholar]
- 35. Balch, W. E. , Dunphy, W. G. , Braell, W. A. , Rothman, J. E. , Reconstitution of the transport of protein between successive compartments of the Golgi measured by the coupled incorporation of N‐acetylglucosamine. Cell 1984, 39, 405–416. [DOI] [PubMed] [Google Scholar]
- 36. Brügger, B. , Sandhoff, R. , Wegehingel, S. , Gorgas, K. et al., Evidence for segregation of sphingomyelin and cholesterol during formation of COPI‐coated vesicles. J. Cell Biol. 2000, 151, 507–518. [DOI] [PMC free article] [PubMed] [Google Scholar]
- 37. Gkantiragas, I. , Brügger, B. , Stuven, E. , Kaloyanova, D. et al., Sphingomyelin‐enriched microdomains at the Golgi complex. Mol. Biol. Cell 2001, 12, 1819–1833. [DOI] [PMC free article] [PubMed] [Google Scholar]
- 38. Sohn, K. , Orci, L. , Ravazzola, M. , Amherdt, M. et al., A major transmembrane protein of Golgi‐derived COPI‐coated vesicles involved in coatomer binding. J. Cell Biol. 1996, 135, 1239–1248. [DOI] [PMC free article] [PubMed] [Google Scholar]
- 39. van Balkom, B. W. , van Gestel, R. A. , Brouwers, J. F. , Krijgsveld, J. et al., Mass spectrometric analysis of the Schistosoma mansoni tegumental sub‐proteome. J. Proteome Res. 2005, 4, 958–966. [DOI] [PubMed] [Google Scholar]
- 40. Kersey, P. J. , Duarte, J. , Williams, A. , Karavidopoulou, Y. et al., The International Protein Index: an integrated database for proteomics experiments. Proteomics 2004, 4, 1985–1988. [DOI] [PubMed] [Google Scholar]
- 41. Perkins, D. N. , Pappin, D. J. , Creasy, D. M. , Cottrell, J. S. , Probability‐based protein identification by searching sequence databases using mass spectrometry data. Electrophoresis 1999, 20, 3551–3567. [DOI] [PubMed] [Google Scholar]
- 42. Schulze, W. X. , Mann, M. , A novel proteomic screen for peptide‐protein interactions. J. Biol. Chem. 2004, 279, 10756–10764. [DOI] [PubMed] [Google Scholar]
- 43. van Breukelen, B. , van den Toorn, H. W. , Drugan, M. M. , Heck, A. J. , StatQuant: a post‐quantification analysis toolbox for improving quantitative mass spectrometry. Bioinformatics 2009, 25, 1472–1473. [DOI] [PubMed] [Google Scholar]
- 44. Steele‐Mortimer, O. , Infection of epithelial cells with Salmonella enterica . Methods Mol. Biol. 2008, 431, 201–211. [DOI] [PubMed] [Google Scholar]
- 45. Thomas, P. D. , Campbell, M. J. , Kejariwal, A. , Mi, H. et al., PANTHER: a library of protein families and subfamilies indexed by function. Genome Res. 2003, 13, 2129–2141. [DOI] [PMC free article] [PubMed] [Google Scholar]
- 46. Kuhle, V. , Jackel, D. , Hensel, M. , Effector proteins encoded by Salmonella pathogenicity island 2 interfere with the microtubule cytoskeleton after translocation into host cells. Traffic 2004, 5, 356–370. [DOI] [PubMed] [Google Scholar]
- 47. Méresse, S. , Unsworth, K. E. , Habermann, A. , Griffiths, G. et al., Remodelling of the actin cytoskeleton is essential for replication of intravacuolar Salmonella . Cell Microbiol. 2001, 3, 567–577. [DOI] [PubMed] [Google Scholar]
- 48. Miao, E. A. , Brittnacher, M. , Haraga, A. , Jeng, R. L. et al., Salmonella effectors translocated across the vacuolar membrane interact with the actin cytoskeleton. Mol. Microbiol. 2003, 48, 401–415. [DOI] [PubMed] [Google Scholar]
- 49. Manevich, Y. , Fisher, A. B. , Peroxiredoxin 6, a 1‐Cys peroxiredoxin, functions in antioxidant defense and lung phospholipid metabolism. Free Radic. Biol. Med. 2005, 38, 1422–1432. [DOI] [PubMed] [Google Scholar]
- 50. Fisher, A. B. , Dodia, C. , Yu, K. , Manevich, Y. , Feinstein, S. I. , Lung phospholipid metabolism in transgenic mice overexpressing peroxiredoxin 6. Biochim. Biophys. Acta 2006, 1761, 785–792. [DOI] [PubMed] [Google Scholar]
- 51. Kim, T. S. , Dodia, C. , Chen, X. , Hennigan, B. B. et al., Cloning and expression of rat lung acidic Ca(2+)‐independent PLA2 and its organ distribution. Am. J. Physiol. 1998, 274, L750–L61. [DOI] [PubMed] [Google Scholar]
- 52. Kim, T. S. , Sundaresh, C. S. , Feinstein, S. I. , Dodia, C. et al., Identification of a human cDNA clone for lysosomal type Ca2+‐independent phospholipase A2 and properties of the expressed protein. J. Biol. Chem. 1997, 272, 2542–2550. [DOI] [PubMed] [Google Scholar]
- 53. Chatterjee, S. , Feinstein, S. I. , Dodia, C. , Sorokina, E. et al., Peroxiredoxin 6 phosphorylation and subsequent phospholipase A2 activity are required for agonist‐mediated activation of NADPH oxidase in mouse pulmonary microvascular endothelium and alveolar macrophages. J. Biol. Chem. 2011, 286, 32427–32436. [DOI] [PMC free article] [PubMed] [Google Scholar]
- 54. Favre, B. , Fontao, L. , Koster, J. , Shafaatian, R. et al., The hemidesmosomal protein bullous pemphigoid antigen 1 and the integrin beta 4 subunit bind to ERBIN. Molecular cloning of multiple alternative splice variants of ERBIN and analysis of their tissue expression. J. Biol. Chem. 2001, 276, 32427–32436. [DOI] [PubMed] [Google Scholar]
- 55. Bryant, P. J. , Huwe, A. , LAP proteins: what's up with epithelia? Nat. Cell Biol. 2000, 2, E141–3. [DOI] [PubMed] [Google Scholar]
- 56. Kufer, T. A. , Kremmer, E. , Banks, D. J. , Philpott, D. J. , Role for erbin in bacterial activation of Nod2. Infect. Immun. 2006, 74, 3115–3124. [DOI] [PMC free article] [PubMed] [Google Scholar]
- 57. Girardin, S. E. , Boneca, I. G. , Viala, J. , Chamaillard, M. et al., Nod2 is a general sensor of peptidoglycan through muramyl dipeptide (MDP) detection. J. Biol. Chem. 2003, 278, 8869–8872. [DOI] [PubMed] [Google Scholar]
- 58. Barnich, N. , Aguirre, J. E. , Reinecker, H. C. , Xavier, R. , Podolsky, D. K. , Membrane recruitment of NOD2 in intestinal epithelial cells is essential for nuclear factor‐kappaB activation in muramyl dipeptide recognition. J. Cell Biol. 2005, 170, 21–26. [DOI] [PMC free article] [PubMed] [Google Scholar]
- 59. McDonald, C. , Chen, F. F. , Ollendorff, V. , Ogura, Y. et al., A role for Erbin in the regulation of Nod2‐dependent NF‐kappaB signaling. J. Biol. Chem. 2005, 280, 40301–40309. [DOI] [PubMed] [Google Scholar]
- 60. Ishibashi, K. , Kanno, E. , Itoh, T. , Fukuda, M. , Identification and characterization of a novel Tre‐2/Bub2/Cdc16 (TBC) protein that possesses Rab3A‐GAP activity. Genes Cells 2009, 14, 41–52. [DOI] [PubMed] [Google Scholar]
- 61. Smith, A. C. , Heo, W. D. , Braun, V. , Jiang, X. et al., A network of Rab GTPases controls phagosome maturation and is modulated by Salmonella enterica serovar Typhimurium. J. Cell Biol. 2007, 176, 263–268. [DOI] [PMC free article] [PubMed] [Google Scholar]
- 62. Snyers, L. , Umlauf, E. , Prohaska, R. , Association of stomatin with lipid–protein complexes in the plasma membrane and the endocytic compartment. Eur. J. Cell Biol. 1999, 78, 802–812. [DOI] [PubMed] [Google Scholar]
- 63. Hiebl‐Dirschmied, C. M. , Adolf, G. R. , Prohaska, R. , Isolation and partial characterization of the human erythrocyte band 7 integral membrane protein. Biochim. Biophys. Acta 1991, 1065, 195–202. [DOI] [PubMed] [Google Scholar]
- 64. Wang, D. , Mentzer, W. C. , Cameron, T. , Johnson, R. M. , Purification of band 7.2b, a 31‐kDa integral phosphoprotein absent in hereditary stomatocytosis. J Biol Chem 1991, 266, 17826–17831. [PubMed] [Google Scholar]
- 65. Stewart, G. W. , Argent, A. C. , Dash, B. C. , Stomatin: A putative cation transport regulator in the red cell membrane. Biochim. Biophys. Acta 1993, 1225, 15–25. [DOI] [PubMed] [Google Scholar]
- 66. Stewart, G. W. , Hepworth‐Jones, B. E. , Keen, J. N. , Dash, B. C. et al., Isolation of cDNA coding for an ubiquitous membrane protein deficient in high Na+, low K+stomatocytic erythrocytes. Blood 1992, 79, 1593–1601. [PubMed] [Google Scholar]
- 67. Stewart, G. W. , Stomatin. Int. J. Biochem. Cell Biol. 1997, 29, 271–274. [DOI] [PubMed] [Google Scholar]
- 68. Umlauf, E. , Csaszar, E. , Moertelmaier, M. , Schuetz, G. J. et al., Association of stomatin with lipid bodies. J. Biol. Chem. 2004, 279, 23699–23709. [DOI] [PubMed] [Google Scholar]
- 69. Nawabi, P. , Catron, D. M. , Haldar, K. , Esterification of cholesterol by a type III secretion effector during intracellular Salmonella infection. Mol. Microbiol. 2008, 68, 173–185. [DOI] [PubMed] [Google Scholar]
Associated Data
This section collects any data citations, data availability statements, or supplementary materials included in this article.
Supplementary Materials
Detailed facts of importance to specialist readers are published as ”Supporting Information”. Such documents are peer‐reviewed, but not copy‐edited or typeset. They are made available as submitted by the authors.
SupplInfo