

Abstract
Protein microarrays, on which thousands of discrete proteins are printed, provide a valuable platform for functional analysis of the proteome. They have been widely used for biomarker discovery and to study protein–protein interactions. The accomplishments of DNA microarray technology, which had enabled massive parallel studies of gene expression, sparked great interest for the development of protein microarrays to achieve similar success at the protein level. Protein microarray detection techniques are often classified as being label‐based and label‐free. Most of the microarray applications have employed labelled detection such as fluorescent, chemiluminescent and radioactive labelling. These labelling strategies have synthetic challenges, multiple label issues and may exhibit interference with the binding site. Therefore, development of sensitive, reliable, high‐throughput, label‐free detection techniques are now attracting significant attention. Label‐free detection techniques monitor biomolecular interactions and simplify the bioassays by eliminating the need for secondary reactants. Moreover, they provide quantitative information for the binding kinetics. In this article, we will review several label‐free techniques, which offer promising applications for the protein microarrays, and discuss their prospects, merits and challenges.
Keywords: Carbon nanotubes, Interferometry, Label‐free techniques, Protein arrays, Protein microarrays, SPR
1 Introduction
One of the formidable challenges in the burgeoning field of proteomics is to study large number of proteins, and identify their interactions and function. In order to study the complexity of proteome, various proteomic techniques, including protein microarrays, have emerged during the past few years. A protein microarray provides a multiplex platform for high throughput (HT) studies. Two different strategies have been used for protein microarrays 1: (i) abundance based, where specific capture molecules such as antibodies and aptamers are spotted on the array or RP protein blots, where complex mixtures such as cell lysates are spotted and abundance of biomolecules are measured by antibodies; and (ii) function based, where purified proteins or proteins generated from cell‐free expression system are spotted on the array (Fig. 1). Protein microarrays have been successfully applied for protein–protein interactions 2, cytokine detection 3, protein–DNA interactions 4, kinase target identification 5, detection of various antigens and antibodies 6 as well as for biomarker discovery 7.
Figure 1.

Two different strategies for protein microarrays, abundance‐ and function‐based microarrays (1 and references therein). (A) Direct labelling, target proteins are labelled with fluorescence or other tag that allows detection after it is captured by an antibody immobilized on array; (B) Sandwich immunoassay, target protein is captured by an antibody, followed by detection with labelled second antibody; (C) Reverse phase protein blot, complex mixtures such as cell lysates are printed and probed with specific detection reagent; (D) Chemically linked microarray, purified proteins are immobilized on functionalized glass slides; (E) Peptide fusion tags, proteins fused to GST‐6XHis tag and spotted on Ni‐coated slides; (F) Nucleic acid programmable protein array, cDNA containing GST tag printed on array along with a capture anti‐GST antibody, protein is expressed using cell‐free expression system and captured by antibody (G) Multiple spotting technique, cell‐free in situ expression of unpurified PCR products.
There are two major strategies for the detection of protein microarrays, label‐based and label‐free. The label‐based technique requires labelling of query molecules with labels such as fluorescent dyes, radioisotopes, epitope tags, etc. 8. However, label‐free techniques measure an inherent property of the query itself (e.g. mass and dielectric property) thereby avoiding modifying interactors 9. In this article, we will review label‐free detection techniques, which have been applied for protein microarray applications, and discuss their merits and challenges in the context of protein microarrays.
2 Two major detection strategies for protein microarray: Label‐based and label‐free
The successes of sensing technologies are mostly determined by their sensitivity, resolution and detection limit. Dynamic range, real‐time monitoring, multiplexing and HT capability, widespread applicability and data handling are other key determining factors 10, 11. In protein microarray experiments, signals can be detected by label‐based or label‐free strategies. Both the approaches have their merits and demerits. The label‐based detection methods require labelling of query molecules with fluorescent dyes, radioisotopes or epitope tags. Label‐based detection is widely used in protein microarrays due to the common availability of reagents and simple instrument requirements. However, these labelling strategies often alter surface characteristics and natural activities of the query molecule. Moreover, the labelling procedure is laborious, lengthy and limits the number and types of query molecules that can be studied 12. In contrast to the label‐based techniques, the label‐free detection methods depend on the measurement of an inherent property of the query itself, such as mass and dielectric property. Label‐free techniques avoid interference due to the tagging molecules, and determine reaction kinetics of biomolecular interactions in real‐time 6, 13.
However, the label‐free detection techniques also have multiple pitfalls and issues regarding sensitivity and specificity (Table 1). Further, expensive fabrication techniques, morphological anomalies of sample spots and insufficient knowledge of biosensors often restrict their use.
Table 1.
Label‐free detection techniques for protein microarrays
| Techniques | Principle | Applications | Merits | Demerits | Sensitivity and resolution | Throughputa) | Used for protein microarrays |
|---|---|---|---|---|---|---|---|
| 1. SPR and related techniques | |||||||
| (i) SPR | Measures changes in the refractive index of the medium directly in contact with sensor surface | Studying association or dissociation kinetics 32 | 1. Real‐time measurements | Restricted to gold/silver surfaces | 10 ng/mL for casein by localized SPR 33 | ++b) | 32, 33 |
| Drug discovery 29 | 2. Multiplex analysis | High [B] | 400 protein–protein interactions 32 | ||||
| Rapid diagnosis of cancer patients 30 | 3. Sensitive to conformational change | ||||||
| Antigen–antibody interactions in protein microarrays 33 | 4. Quantitative and qualitative | ||||||
| (ii) SPRi | Captures an image reflected by polarized light at a fixed angle, and simultaneously detects many biomolecular interactions | Used for DNA–protein interaction 120, 121 | 1–4 as above+ | 1. Restricted to gold/silver surfaces | (nM–zM range) 64.8 zM (Best achievable sensitivity, 122) | ++c) | 34, 35, 36, 37, 40, 41, 42, 43, 44 |
| Protein–glycan interactions 35 | 5. Suitable for HT | 2. Requires sophisticated instrumentation | Very high [A] | 792 features on microarray 44 | |||
| Disease marker detection and protein expression profiling 44 | |||||||
| Antigen–antibody interactions on microarrays 42 | |||||||
| (iii) Nanohole array | Periodic nanoholes couple incident photons into SPs. SPs of both the side couple through periodic nanoholes to enhance light transmission | Binding kinetics measurement 45Protein–protein interaction 13 | 1, 2, 4, 5 as above+6. Simple optical alignment7. Unlike SPR, bulky prism is not required8. Use high numerical aperture is possible9. Miniaturization is possible | 1. Insensitive to conformational changes2. Restricted to gold/silver surfaces | 333 nm/RIU 49 d)9.4×10 −8 RIU 13 e)80 nM 50High [B] | +++b)20 164 sensors can be fabricated 13 | 13, 45, 48 |
| 2. Ellipsometry | Measures change in polarization state of the incident light which depends on the dielectric properties and refractive index of thin film | Real‐time and end point measurement of biomolecular interactions 55Hormone detection and cancer marker test 51Clinical diagnosis and narcotics detection 52Affinity determination 6Intrinsic pathway of coagulation 57 | 1, 2, 4 as above+10. Not restricted to gold/silver11. Cheaper than SPR‐based biosensors12. Simple instrumentation13. Large field of view for simultaneous monitoring of the entire microarray | 1. Less sensitive than SPRi2. Insensitive to conformational changes | 1 ng/mL 51, 5610 pg/mm2 54High [B] | +b)12 protein spots 53 | 6, 51, 53, 55 |
| 3. OI‐RD | Based on polarization modulated nulling ellipsometry | Real‐time and end point analysis of antigen–antibody interaction 60, 61DNA–DNA hybridization and protein–small ligand binding reactions 60, 62 | All the merits of ellipsometry+5+14. Higher sensitivity than imaging ellipsometry | Insensitive to conformational changes | 10 pm thickness change. Sensitivity comparable to SPRi 61Very high [A] | +++c)2760 spots 61 | 60, 61, 62 |
| 4. Interference‐based techniques | |||||||
| (i) SRIB | Detection of optical phase difference due to biomolecular mass accumulation. | Dynamic measurements of protein–protein interactions 63 | 5+15. Cost effective16. Fast determination of binding kinetics | 1. Suitable for only smooth layered substrates2. Non‐specific binding | 19 ng/mL 63High [B] | ++b)200 spots 63 | 63 |
| (ii) Dual‐channel BioCD | Simultaneous interferometry and fluorescence detection | Detection of mass and fluorescence signals from protein 64 | 5+17. Extremely fast18. Specific and non‐specific bindings can be differentiated | Expensive and complex | 30–70 pg/mL 64High [B] | +++c)6800 spots 64 | 64 |
| (iii) AIR | Measures small‐localized changes in optical thickness of a thin film | Detection of human proteins in cellular lysate and serum 71Biomolecular binding 70Protein spot homogeneity evaluation 71 | 6+15+17 | Sensitivity | 250 pg/mL 71High [B] | +b)4 spots 70 | 70 |
| 5. SKN | Measures alteration in work function and surface potential due to molecular interactions | Antigen–antibody interactions 75DNA structure analysis 75Isoelectric point determination 74 | 17+19. Non‐contact | Unsuitable for very complex samples | <50 nm 74High [B] | +b)36 spots 75 | 74, 75 |
| 6. AFM | High‐resolution scanning probe microscope detects vertical and horizontal deflection of cantilever | Pathogen detection 123Protein interaction 81 | 20. Detection under physiologically relevant conditions21. High specificity | 1. Imaging in aqueous solutions is very difficult2. Image artifacts | Picolitre volume 81High (B) | +b)12 protein spots 80 | 79, 80, 123 |
| 7. Nanowires and nonotubes | Detects changes in the electrical conductance of CNT/CNWs after target binding | Cellular detections 83Direct assay of human serum 84Cancer markers detection 82 Study of small molecule interactions 85 | 1+2+10+21 | 1. Lack of simple flexible well‐established surface modifications methods2. Unsuitable for systematic studies. | (nM–fM range) 1 fM (Best achievable sensitivity) 87Very high [A] | +b)30 microelectrodes 82 | 82, 84, 86, 87 |
| 8. Enthalpy array | Arrays of nanocalorimeters, measures heat generation of the reaction | Enzyme kinetics (Km, Kcat) and inhibitor constants (Ki) can be determined 90Biomolecular interactions enzymatic turnover and mitochondrial respiration determination 92 | 10+22. Immobilization of biomolecules not required23. Very rapid, small sample volumes required24. Can be used for complex samples (i.e. serum) | 1. False positives when two reacting solutions have different pH or ionic strength2. Complex instrumentation3. Real‐time analysis not possible4. Not sensitive to conformational change | μM–nM range, 92Moderate [C] | ++b)384 samples 90 | 90, 91 |
| 9. Microcantilevers | The binding of query molecules to the immobilized target molecules causes bending of microcantilever and change the resonant frequency | Investigating thermodynamics of biomolecular interactions 95Detecting conformational changes 99Determining mass of single virus or bacterium and measurement of cell growth on cantilever surface 94 | 1, 4, 10, 15 | False positives with complex sample (i.e. serum) | 0.2 ng/mL 96High [B] | ++b)80–120 reaction wells 98 | 97, 98, 100 |
| 10. Electrochemical impedance spectroscopy‐ aptamer array | Captures biomolecules with high affinity and selectivity using aptamers | Detection of thrombin in human plasma samples 105Protein kinases detection 104 | 1+6+25. High affinity26. Easy synthesis process | Aptamers denature at extreme conditions | 50 pM (approximately equal to 1.5 ng/mL CDK2) 104High [B] | ++b)96 spots 103 | 103, 104 |
Sensitivity scale: [A], Very high: atto‐femtogram/mL (10−18–10−15 g/mL). [B], High: pg–ng/mL (10−12–10−9 g/mL). [C], Moderate: μg/mL (10−6 g/mL). a) Throughput (maximum number of sample spots analysed simultaneously). +++High (capable to monitor thousands of biomolecular interactions simultaneously). ++Moderate (capable to monitor about 100 biomolecular interactions simultaneously). +Low (capable to monitor less than 100 biomolecular interactions simultaneously). HT applications demonstrated/proof‐of‐concept. b) Proof‐of‐concept for HT but actual demonstration of HT application is not yet done.c) HT applications already demonstrated using this technique. d) Amount of protein used in the microchannel during incubation 17.5 μg. e) Corresponds to 200 μL of 290 nM GST (∼34.9×10¹² molecule).
Many label‐free techniques such as SPR, carbon nanotubes (CNTs) and nanowires, nanohole arrays, interferometry, etc., have been successfully integrated with protein microarrays and are emerging rapidly as a potential complement to labelling methods 12. The label‐based detection techniques are also progressing rapidly. Quantum dots have been successfully introduced in biochemical and clinical research due to its ability to conjugate with different biomolecules such as peptides, proteins, nucleic acids and antibodies 14, 15. Nam et al. reported detection of protein analytes by using nanoparticle‐based bio‐bar codes 16. Chen et al. applied functionalized macromolecular single‐walled nanotubes (SWNTs) as multicolour Raman labels to detect human autoantibodies against proteinase 3 17. Multi‐label secondary antibody–SWNT bioconjugates were also applied for electrochemical immunodetection of a cancer biomarker, prostate‐specific antigen (PSA), in serum and tissue lysates 18. During the past few years, immense advancements have been made in the field of antibody microarray technology 19, 20, 21, 22, 23 and by using this robust and reproducible platform, low‐abundance proteins have also been selectively targeted in directly labelled complex proteomes 24, 25. Biotin‐based one colour‐labelling approach 26, 27 and planar waveguide array system 28 are promising label‐based techniques for multiplexed, quantitative biomolecular interaction analysis in a microarray format.
3 Label‐free techniques for protein microarrays
3.1 SPR and related techniques
3.1.1 SPR
SPR is a surface sensitive, spectroscopic method which measures change in the thickness or refractive index of biomaterials at the interface between metal surfaces, usually a thin gold film (50–100 nm) coated on a glass slide, and an ambient medium. In SPR the test proteins are immobilized on a gold‐surface, unlabelled query protein is added, and change in angle of reflection of light caused by binding of the probe to the immobilized protein is measured to characterize biomolecular interactions in real‐time (Fig. 2A). The angle at which the minimum intensity of the reflected light is obtained is known as the “SPR angle”, which is directly related to the amount of biomolecules bound to the gold surface.
Figure 2.

(A) SPR phenomenon: Due to the changes in refractive index on the gold‐coated surface, the reflection angle and intensity of the reflected light changes. Incident photons couple with the SPs and thus at particular incident angle and wavelength, the intensity of reflected light is decreased. Sensorgram represents the change in reflection intensity with respect to incident angle before and after the binding of analyte. (B) SPRi fixes on a single‐incidence angle and monitors reflection intensity for the whole array as a function of time. (C) A gold‐coated chip of 500 nanohole array. One nanohole array (one sensing spot) is made up of 12×12 nanoholes of approximately 150 nm diameter. Each sensing spot is separated by approximately 8 μm. The periodicity of each nanohole is in nanometre range of the visible light spectrum depending on the transmission light intensity. The adjacent graph shows that as the analyte concentration increases on the nanohole array, the transmission intensity of the light decreases exponentially (modified from 116).
SPR has been widely used for many biomedical, food and environmental applications 29. The critical angle refractometer, optically reconfigured to SPR technology, is suitable for measuring the binding kinetics of serum antibodies to human tumour antigen for the rapid diagnosis of cancer patients 30. Boer et al. 31 generated a unique SPR‐based microarray using natural glycans for rapid screening of serum antibody profiles, which demonstrated that SPR‐based label‐free detection techniques could be an excellent choice for the detection of infection status of an individual. Wassaf et al. 32 utilized SPR microarrays in combination with HT antibody purification technologies for rapid and accurate affinity ranking of antibodies. Hiep et al. 33 developed a localized SPR immunosensor for detection of casein allergen in raw milk samples and achieved a detection limit of 10 ng/mL. SPR‐based biosensors are in great demand as they provide label‐free, real‐time detection of the biomolecular interactions. SPR is best suited for drug discovery, rapid diagnosis and security applications.
3.1.2 SPR imaging
SPR imaging (SPRi) allows simultaneous analysis of multiple biomolecular interactions in HT manner. In SPRi, the entire biochip surface is illuminated at the same time with a broad beam, monochromatic, polarized light and the reflected light is captured from each spot by CCD camera simultaneously. The CCD camera continuously monitors the changes occurring on the surface and provides the real‐time kinetic data (Fig. 2B).
Lee et al. 34 applied SPRi for direct, multiplexed detection of unlabelled low molecular weight protein biomarkers, β2m and cysC, with a nanomolar detection limit. SPRi technique was also successfully applied to analyse interactions of GST‐fusion proteins with their antibodies 35, real‐time monitoring of auto‐antibodies in sera of autoimmune patients at picomolar concentrations 36, and direct discrimination of different proteins and investigation on their structural changes with the progress of denaturation 37.
In order to make SPRi compatible for HT protein arraying, Myszka's group improved protein printing by using a continuous‐flow microfluidic device, the continuous‐flow microspotter with 48 spot printhead, thereby allowing the researchers to simultaneously monitor multiple bimolecular interactions 38, 39.
SPRi combines the advantages of SPR (kinetic and affinity analysis) with HT capabilities. It is convenient, sensitive and offers HT label‐free measurement of biomolecular interactions. Many studies have demonstrated that SPRi can be used for relative as well as absolute protein expression profiling and drug discovery applications 40. In recent years, the SPRi platform has been successfully applied to detect adsorption and desorption of multiple proteins 41, real‐time study of antigen–antibody reactions in arrayed format 42, and detection of cancer biomarkers 43. Lausted et al. 44 used SPRi for label‐free analysis of an antibody microarray (792 features) having serum proteins from liver cancer patients and healthy subjects. The authors successfully identified 39 significantly modulated proteins. Preliminary promising results suggest that the use of protein chips for SPRi at proteome level may not be unachievable. SPRi is a potential alternative to label‐based detection techniques and offers nearly comparable sensitivity (picomolar level) to single‐colour and dual‐colour labelling approaches. But at the same time, it must also be emphasized that despite all its promises, SPRi is still a long way off from large scale use in protein microarrays.
3.1.3 Nanohole array
Unusual optical transmission characteristics at resonant wavelengths are shown by ordered arrays of nanoscale holes in metal films. Surface plasmons (SPs) excited on both sides of metal surface resonantly couple through the sub‐wavelength holes, which enhances the light transmission for a specific wavelength and makes nanohole arrays a potential surface‐based biosensor (Fig. 2C). Simple optical alignment, easy miniaturization, very small foot‐print, high accuracy, robustness, increased fluorescent signal, multiplexing and collinear optical detection are the major advantages of this biosensing technique 13, 45, 46.
Ji et al. 13 have introduced an integrated nanohole array with extraordinary optical transmission intensity and achieved about ten times higher sensitivity than that of prism‐based SPR. Yang et al. 47 have applied dip‐pen nanolithography (DPN)‐based nanohole arrays along with microwriting process to monitor multiple protein binding events simultaneously. Plasmonic Bragg mirrors, introduced by Lindquist et al. 48, was used to achieve enhanced sensitivity and for isolation of sensing areas. They were able to measure the real‐time streptavidin–biotin‐binding kinetics with a microarray of 600 sub‐micron biosensing pixels at a packing density of more than 107 per cm2. Leebeeck et al. 49 have constructed an SPR‐based sensor containing a microfluidic device with an integrated array of nanoholes and studied a biochemical affinity process involving biotin–streptavidin system. Recently, Eftekhari et al. 50 have introduced a flow‐through nanohole array‐based sensing technique by combining nanofluidics and nanoplasmonics. Using this nanohole array, they successfully performed the selective immobilization of an ovarian cancer‐specific antibody in real‐time manner with high accuracy. These studies suggest that nanohole arrays are promising for studying binding kinetics of protein–protein interaction in microarray format.
3.2 Ellipsometry‐based techniques
3.2.1 Ellipsometry
Ellipsometry is based on the polarization state of the reflected light, which is altered due to changes in dielectric property or refractive index of the sample surface. The imaging ellipsometry technique, which combines ellipsometer with the microscopy and CCD camera, makes it possible to measure total protein content on the solid surface without affecting the protein function and need of labelling (Fig. 3A). This technique has been successfully applied to study biomolecular interactions, hormonal activity, cell factor‐receptor binding, narcotics, diagnosis of hepatitis B, quantification of competitive adsorption of protein and kinetic measurement of multi‐protein interactions 51, 52.
Figure 3.
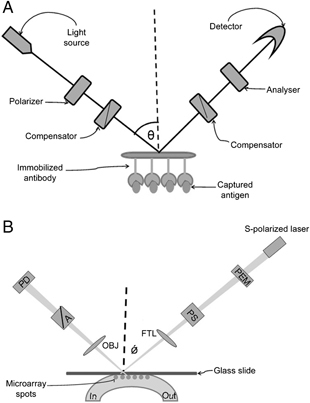
(A) Basic principle behind ellipsometry: A monochromatic laser light is linearly polarized by polarizer. This light is passed through a compensator, which produces elliptically polarized light. When this light is reflected from a sample surface, it again become linearly polarized and detected by the analyser filter. The intensity of the reflected light is monitored with the photodetector. (B) Top view of hybrid scanning OI‐RD microscope. X‐scan is performed by moving the sample holding stage and y‐scan is performed by a combination of a rotating mirror and f‐theta lens. The sample is coated on the glass slide, which is directly in contact with fluidic system. PD: photodiode detector, A: analyser, OBJ: objective lens, PS: phase shifter, PEM: photo elastic modulator (modified from 61).
Merging of imaging ellipsometry with microfluidic system provides various advantages such as low sample consumption, high automation, shorter reaction time and multiplexed assay with high sensitivity (pg of biomaterial/mm2 of the sensor surface) 53, 54. This technique was successfully applied for the real‐time measurement of binding kinetics of SARS virus and monoclonal antibody interactions 55, and for detection of five markers of Hepatitis B virus infection 56. Chamritski et al. 6 demonstrated the detection of mole fraction and affinity constants for antigen–antibody interactions using imaging ellipsometry. Westphal and Bornmann 54 developed a hybrid technology known as SP‐enhanced ellipsometry by combining ellipsometry and SPR. Using this integrated technique, authors finely resolved <10 pm thick biomolecular layer. Elwing 57 demonstrated the application of ellipsometry for systemic investigation of complex, surface‐associated phenomena such as complement activation and intrinsic pathway of coagulation. Asinovski et al. 58 have demonstrated the technical aspects for the qualitative, quasi‐quantitative and fully quantitative imaging ellipsometry. Recently, Siegel et al. 59 have introduced laser‐based ellipsometry for detection of arteriosclerotic nanoplaque formation. They tested lipoprotein from human blood for its atherogenic properties and determined the concentration of biomarkers related to oxidative stress, plaque stability and progression and inflammation. Although ellipsometry‐based techniques display some attractive features, such as shorter reaction time and simple instrumentation, they are not technically suitable for targeting very low abundant protein analytes.
3.2.2 Oblique incidence reflectivity difference
Oblique incidence reflectivity difference (OI‐RD) is a form of ellipsometry in which, the harmonics of modulated photocurrents are measured under suitable nulling conditions (Fig. 3B). Changes in thickness and/or dielectric response due to a reaction with a microarray spot, such as protein binding, yields a detectable OI‐RD signal 60, 61, 62. Application of this phenomenon makes OI‐RD a good choice for label‐free detection of proteins on microarrays.
OI‐RD microscope has been successfully applied for real‐time and end‐point monitoring of antigen–antibody interactions, nucleic acid hybridizations and protein–small ligand‐binding reactions 60. Fei et al. 61 employed a unique scanning optical microscope based on a polarization‐modulated nulling ellipsometry for HT label‐free detection of biomolecular interactions, in which they achieved an endpoint image of a 2760‐spot microarray in less than 15 min. Landry et al. 62 detected hundreds of real‐time biochemical reactions using this versatile optical platform. They performed the analysis of binding reactions between immobilized drug‐antigen target and probe antibody. Very high sensitivity (down to 10 pm thickness changes), rapid detection, large field view and real‐time measurements are the major advantages of this imaging ellipsometry‐based approach. Moreover, unlike SPRi it is not dependent on the gold‐coated surfaces and is applicable to conventional microscope glass slides.
3.3 Interference‐based techniques
The basic principle behind interferometry is the transformation of phase differences of wave fronts into observable intensity fluctuations known as interference fringes (Fig. 4A). There are several promising interferometric techniques at various stages of development for label‐free detection (Table 1). These techniques include spectral reflectance imaging biosensor (SRIB) 63, dual‐channel biosensor 64, SPR interferometry 42, 65, on chip interferometric backscatter detection 66, porous silicon‐based optical interferometric biosensor 67, high‐speed interferometric detection on the biological compact disc (BioCD) 68 and spinning disc interferometry 69. Interferometric measurements can provide high sensitivity and resolution of optical path length differences, with the best systems currently achieving <10−10 rad resolution 63. Interference‐based detection techniques are powerful tools for biochemical and functional analysis of proteins.
Figure 4.

Schematics of highly promising label‐free interferometric detection techniques for protein microarrays. (A) The basic principle of Interferometric techniques for protein microarray analysis. The phase differences of the wave fronts are transformed into observable intensity fluctuation called Interference fringes. (B) Changes in the optical index as a result of capture of biological material on the microarray surface are finely detected in SRIB using optical wave interference (modified from 63). (C) Optical setup of phase contrast BioCD (modified from 68). (D) Block diagram of the imaging apparatus used in AIR and composition of the standard multilayer thin film used for simulated AIR data (modified from 70).
3.3.1 SRIB
SRIB is a recent promising label‐free approach, which is based on interference 63. Changes in the optical index as a result of capture of biological material on the microarray surface are finely detected in SRIB using optical wave interference (Fig. 4B). This technique directly monitors primary molecular binding interactions. It is sensitive (19 ng/mL detection limit), relatively cheap and can be easily implemented 63.
3.3.2 BioCD
BioCD is a tool, which utilizes local interferometry to detect protein mass and realize label‐free protein detection (Fig. 4C). Wang et al. 64 introduced a dual channel biosensor for protein microarrays with detection limit of pg/mL level. It performs simultaneous interferometric and fluorescent detection of proteins on the solid surface. The dual channel protein BioCD scanning system simultaneously detects mass and fluorescence signals from proteins, and is compatible for spotted microarrays.
3.3.3 Arrayed imaging reflectometry
Arrayed imaging reflectometry (AIR) depends on the destructive interference of polarized light reflected off a silicon substrate (Fig. 4D). Mace et al. 70 applied AIR and finely detected extracellular domain of intimin protein even at picomolar concentration. The same group applied AIR to detect human proteins in cellular lysate and serum 71. Another study by this group 72 has demonstrated that introduction of non‐nucleophilic substances as additives in protein microarrays can effectively improve spot morphology. Simple inexpensive substrate reader, short assay time and high sensitivity are the major advantages of AIR but non‐ideal conditions such as finite spectral bandwidth, angular divergence of the light source, non‐homogeneity and roughness of the over layers on the substrate often restrict the achievable sensitivity 73. Overcoming these shortcomings can make AIR a promising label‐free diagnostic tool for clinical proteomics.
In spite of these successful demonstrations, application of interference‐based techniques for identification of low‐abundance proteins, hormones, growth factors, cytokines, chemokines remains relatively unexplored. However, label‐based antibody microarray technology has made significant progress in this area 21.
3.4 Scanning Kelvin nanoprobe
The Kelvin probe force microscope (KPFM) detects regional variations in surface potential across a substrate of interest, mostly gold 74. KPFM has several advantages as a biomolecular label‐free detection technique. It is a non‐contact technique, which does not require specialized vacuum or fluid cell. It can operate at high speed while maintaining the signal fidelity, unlike other scanning probe techniques that require substrate contact. Another important aspect of KPFM technology is the potential to analyse high‐density arrays 74.
The scanning Kelvin nanoprobe (SKN) constructed by Thompson et al. 75 distinguished a single internal mismatch in the DNA. By using this approach they visualized and examined protein concentration and formation of antigen–antibody pairs with high sensitivity, and good inter‐spot reproducibility (Fig. 5A). Sinensky and Belcher 74 tested the interaction between biotin and avidin and demonstrated the correlation between measured surface potential and isoelectric point of the biomolecules. By combining KPFM with another scanning probe method, DPN, they achieved high resolution (<10 nm), sensitivity (<50 nM) and speed (>1100 mm/s). A recent study by Saoud et al. 76 has established a new approach for the immobilization of biomolecule probes by using a linker diluent system on indium tin oxide. This method has potential to reduce the non‐specific binding of biomolecules.
Figure 5.

(A) Operational diagram of the KPFM (modified from 117). It can measure both surface potential and topographic image simultaneously without contacting the sample surface. The configuration of KPFM includes the conducting tip, air gap and sample, which functions as capacitor. The force which acts on the tip and sample surface is the combination of van der Waals force (F vd), electrostatic force (F s) and the force which vibrates the tip (F vib). Linker‐modified gold substrates are subjected to the printing of mouse antibodies. The printed antibodies capture an anti‐mouse antibody from solution and form antibody–antigen complexes. SKN is utilized to detect such bindings (modified from 75, 118). (B) Schematic representation of the basic instrumentation of AFM. The inset shows the principle of AFM technology for microarray analysis. It can measure the deflection of the cantilever with picometre resolution.
3.5 Atomic force microscope
Atomic force microscope (AFM) is the most commonly used member of the family of scanning probe microscopes (SPMs). AFM images reveal significant information about surface features and it can measure the deflection of cantilever with picometre resolution (Fig. 5B). Experimental evidences suggest effective implications of AFM‐based techniques such as nanoshaving, nanografting, DPN, etc., in patterning of stable proteins. Detection of protein–protein interactions on the protein array can be performed by monitoring the height increase by AFM imaging 77.
Tinazli et al. 78 have introduced a novel vibrational AFM mode in native protein nanolithography to detach immobilized proteins. Fabrication of protein nanoarrays, conducted under native conditions, resulted in high resolution and high specificity of patterning being achieved. Soultani‐Vigneron et al. 79 have demonstrated a unique three‐step method involving AFM along with Fourier transform infrared spectroscopy and fluorescence scanning microscopy to achieve immobilization of oligo‐peptide probes for protein microarrays. AFM‐based DPN technique for analysis of protein interactions was introduced by Lee et al. 80. In this method, AFM was used to monitor and evaluate height of protein nanoarrays. In a different study, the authors utilized a Prolinker‐coated AFM tip modified by vitronectin to measure the interaction between integrin αvβ3 and immobilized vitronectin on the cantilever tip 81. Reports combining AFM and nanolithography have demonstrated the potential of this technology for fabrication of protein nanoarrays; however, imaging biomolecules in aqueous solutions and image artifacts are major challenges which need to be overcome for the success of this technology.
3.6 Nanotubes and nanowires
CNTs are hollow cylindrical graphite sheets that exhibit high level of chemical stability and mechanical strength. Like CNTs, carbon nanowires are also exceptionally interesting from an application research point of view. Unique and well‐defined electrical and mechanical properties of SWNTs make them one of the most promising candidates for development of nanoscale biosensors. Binding of target protein to the functionalized nanowires leads to detectable changes in the electrical conductance of the device. Label‐free detection of protein molecules is achieved by applying this phenomenon (Fig. 6). Okuno et al. 82 have introduced label‐free immunosensor based on SWNT array‐modified microelectrodes for detection of a cancer marker, total PSA. Recently, Ishikawa et al. 83 have used metal‐cluster‐decorated CNT biosensor for detection of Aureococcus anophagefferens and BT3 cells with sensitivity down to 105 and 104 cells/mL, respectively. Drouvalakis et al. 84 constructed peptide‐coated CNT‐based immunosensor for the direct label‐free assay of human serum.
Figure 6.

Basic principle behind the application of carbon nanowires as label‐free detection tool (modified from 11). Binding of target protein to the functionalized nanowires leads to detectable changes in electrical conductance of the device.
Silicon nanowire field effect transistors (SiNW‐FET) and nanoscopic gold tubes have also been successfully applied for label‐free detection of small molecule‐protein interactions. Wang et al. 85 have used SiNW‐FET for detection of small molecule inhibitors of ATP binding to Abl kinase. They characterized concentration‐dependent inhibition of ATP binding by Gleevec (STI‐571) by monitoring the conductance of SiNW‐FET device. Lee et al. 86 fabricated silicon nanowire using an inexpensive micromachining‐“top‐down” method to measure C‐reactive protein binding, and detected signal changes down to femtomolar concentration. Zheng et al. 87 developed a label‐free, multiplexed electrical detection technique using silicon‐nanowire field effect devices, with which they successfully detected cancer markers such as PSA, carcinoembryonic antigen and mucin‐1 at pg/mL concentration. Cai and Ocko 88 used a novel approach by integrating nanosphere lithography and surface silane chemistry to fabricate hexagonal arrays of nanoscale protein‐island. This technique did not affect the functionality of proteins and provided an economical solution for large‐scale, high‐resolution protein patterning. Nanotube and nanowire‐based emerging techniques are very promising owing to their high sensitivity (nM to fM range), accuracy, label‐free detection ability, real‐time sensing and instrumental simplicity. However, there are few drawbacks of these techniques; for example, production of mixtures of metallic and semiconducting nanotubes by existing synthetic methods often reduces their activity and make them unsuitable for systematic studies. Lack of simple, flexible, well‐established surface modification methods of the nanowires/tubes are other major limitations 89.
3.7 Enthalpy array
Enthalpy arrays, which are arrays of nanocalorimeters, allow researchers to measure thermodynamics and kinetics of molecular interactions using small sample volumes and short measurement time 90 (Fig. 7A). The measurements do not require immobilization or labelling of reactants, and are unaffected by spectroscopically opaque solutions that may occur with high concentrations of substrate or product 91. Torres et al. have reported the use of 96‐detector format enthalpy array to detect molecular interactions, including protein–ligand‐binding, enzymatic turnover and mitochondrial respiration 92. The practical limitation of this technique is that significant heating effects can produce thermal signals that are indistinguishable from ligand‐binding effects, consequently leading to a high incidence of “false hits” 93.
Figure 7.
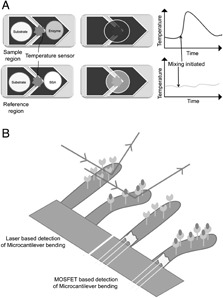
(A) Enthalpy array includes comparative measurement of temperature in two reaction chambers. One chamber is a sample region and second chamber is a reference region. Nanoliter drops of substrate and enzyme/BSA are mixed by an electrostatic merging and mixing mechanism, and change in temperature of sample and reference region is measured by the underneath temperature sensitive thermistors. (B) Binding of query molecules to the microcantilever immobilized target molecules bend the cantilever and changes its resonance frequency. The bending in cantilever is measured by the change in reflection angle of the laser light, or microcantilever coupled with a metal oxide semiconductor field effect transistor in which the bending of microcantilever causes the greatest stress on the transistor and thus causes a sharp change in the electric current flowing through it (modified from 119).
3.8 Microcantilever
Microcantilevers are silicon‐based, gold‐coated, thin (1 μm) surfaces, which are horizontally hanged from a solid support. Bending of the cantilevers due to biomolecular adsorptions is detected either optically by measuring the change in reflection angle or electrically with the help of metal oxide semiconductor field effect transistor (metal oxide semiconductor field effect transistor, Fig 7B) 94. Microcantilever sensors have been successfully applied to investigate the thermodynamics of protein–protein and other biomolecular interactions 95, detection of PSA in both free and complex forms at physiological concentrations 96, antigen–antibody‐binding assays 97, 98, conformational change of bacteriorhodopsin 99, DNA binding of transcription factors 100 and analysis of complex biological samples 101. The applications of simple inexpensive fabrication techniques, and short assay times, make this technique promising for protein microarrays.
3.9 Electrochemical impedance spectroscopy – aptamer array
Merging of electrochemical impedance spectroscopy (EIS) with protein array offers label‐free detection of multiple antigen–antibody and other protein–protein interactions. Improvement in immobilization of capture biomolecules onto the materials can effectively enhance the sensitivity of EIS, leading to the introduction of aptamers in EIS‐based biosensing studies. Aptamers are short pieces of single‐stranded oligonucleotide that can bind to wide range of molecular targets including peptides, proteins, metabolites and organic molecules with immense affinity and selectivity. Aptamers are highly promising capture molecules in microarray formats due to their structural stability and simple synthesis process. Effective binding of the desired target is dependent on correct folding of the aptamers, and is controlled by orientation of the immobilized aptamer 102. A novel aptamer‐based technique called “analyte‐dependent oligonucleotide modulation assay” was introduced by Yamamoto‐Fujita and Kumar 103 for analysis of protein small–ligand interactions. Evans et al. 104 detected cyclin‐dependent protein kinases (with sensitivity limit of around 50 pM) in whole‐cell lysates using arrays of ten electrodes functionalized with individual peptide aptamers. Recently, Xu et al. 105 have constructed aptamer‐functionalized gold nanoparticles as probes for detection of thrombin in human plasma samples with a 2.5 nM detection limit.
4 Potential label‐free techniques for protein microarrays
In addition to the label‐free techniques described in Section 3, which have already been directly used for protein microarrays, there are many potential label‐free techniques at various stages of development which can be applied for protein microarrays in future. These technologies include SPR–MS 106, backscattering interferometry 66, 107, brewster angle straddle interferometry 108, UV fluorometry 109, 110, SELDI‐TOF‐MS 111, 112, 113, tagged‐internal standard assay 114 and spectral‐domain optical coherence phase microscopy 115. Integration of these techniques in protein microarrays may exhibit significant impact in future but more research is required in these fields.
5 Concluding remarks
The rapidly emerging field of proteomics has now established itself as an inevitable platform to enrich our understanding of biological systems. Protein microarray is a HT analytical technique for protein profiling, which enables us to investigate thousands of proteins simultaneously. Many limitations of label‐based detection methods for protein microarrays have been successfully surmounted with the introduction of label‐free approaches, in which detection of target molecules is achieved by evaluating an inherent property of the query itself. Among the emerging label‐free detection techniques for protein microarrays, SPRi, CNTs, semi‐conducting nanowires, interferometric and ellipsometric techniques have attracted considerable interest due to their excellent sensitivity, high level of multiplexing and HT capability. These techniques have demonstrated a wide dynamic range and promise to meet the sensing needs of protein microarrays. Concurrent with the exploration of new effects, AFM and AIR, may also have significant impact for protein microarrays. Real‐time sensing, apparatus simplicity and elimination of disturbances from conjugated labels make these HT label‐free detection methods a prime choice for biological analysis. Successful detection of kinetic information as well as in situ identification of various biological species with outstanding performance testifies to the excellent potential of these novel label‐free techniques.
Development of label‐free detection tools is undoubtedly a great benediction for the large‐scale study of protein–protein interactions. These highly sensitive, reliable label‐free detection techniques also have revolutionizing impacts in the areas of pharmaceutical analysis, screening of potential drugs, cellular detection, biomolecular characterization, disease diagnostics and environmental monitoring. However, sensitivity and specificity often become major concerns for such label‐free techniques during handling of very complex samples. Marriage of microarrays and label‐free techniques is gaining popularity; however, the scientific community is still waiting for successful transformation of these label‐free principles to large microarray surfaces. Emerging label‐free detection techniques have demonstrated their applicability to protein microarrays by testing antigen–antibody interactions, what remains to be seen is how these detection techniques would be able to test clinically relevant, weak protein–protein interactions in HT. With the ongoing active research efforts, it is expected that the field of label‐free protein microarrays will become more robust, sensitive, reliable, rapid, cost‐effective and user‐friendly in near future.
Acknowledgements
The authors have declared no conflict of interest.
6 References
- 1. LaBaer, J. , Ramachandran, N. , Protein microarrays as tools for functional proteomics. Curr. Opin. Chem. Biol. 2005, 9, 14–19. [DOI] [PubMed] [Google Scholar]
- 2. Schweitzer, B. , Predki, P. , Snyder, M. , Microarrays to characterize protein interactions on a whole‐proteome scale. Proteomics 2003, 3, 2190–2199. [DOI] [PubMed] [Google Scholar]
- 3. Stillman, B. A. , Parker, B. O. , Tonkinson, J. , Harvey, M. A. , Applying multiplexed microspot immunoassays. Gen. Eng. News 2004, 24, 38–42. [Google Scholar]
- 4. Kersten, B. , Possling, A. , Blaesing, F. , Mirgorodskaya, E. et al., Protein microarray technology and ultraviolet crosslinking combined with mass spectrometry for the analysis of protein–DNA interactions. Anal. Biochem. 2004, 331, 303–313. [DOI] [PubMed] [Google Scholar]
- 5. Feilner, T. , Hultsching, C. , Lee, J. , Meyer, S. et al., High‐throughput identification of potential Arabidopsis MAP kinases substrates. Mol. Cell. Proteomics 2005, 4, 1558–1568. [DOI] [PubMed] [Google Scholar]
- 6. Chamritski, I. , Clarkson, M. , Franklin, J. , Li, S. W. , Real‐time detection of antigen–antibody reactions by imaging ellipsometry. Aust. J. Chem. 2007, 60, 667–671. [Google Scholar]
- 7. Hudson, M. E. , Pozdnyakova, I. , Haines, K. , Mor, G. , Snyder, M. , Identification of differentially expressed proteins in ovarian cancer using high‐density protein microarrays. Proc. Natl. Acad. Sci. USA 2007, 104, 17494–17499. [DOI] [PMC free article] [PubMed] [Google Scholar]
- 8. Espina, V. , Woodhouse, E. C. , Wulfkuhle, J. , Asmussen, H. D. et al., Protein microarray detection strategies: focus on direct detection technologies. J. Immunol. Methods 2004, 290, 121–133. [DOI] [PubMed] [Google Scholar]
- 9. Li, P. Y. , Lin, B. , Gerstenmaier, J. , Cinningham, B. T. , A new method for label‐free imaging of biomolecular interactions. Sens. Actuat. B 2004, 99, 6–13. [Google Scholar]
- 10. Srivastava, S. , LaBaer, J. , Nanotubes light up protein arrays. Nat. Biotechnol. 2008, 26, 1244–1246. [DOI] [PubMed] [Google Scholar]
- 11. Ramachandran, N. , Larson, D. N. , Stark, P. R. , Hainsworth, E. , LaBaer, J. , Emerging tools for real‐time label‐free detection of interactions on functional protein microarrays. FEBS J. 2005, 272, 5412–5425. [DOI] [PubMed] [Google Scholar]
- 12. Yu, X. , Xu, D. , Cheng, Q. , Label‐free detection methods for protein microarrays. Proteomics 2006, 6, 5493–5503. [DOI] [PubMed] [Google Scholar]
- 13. Ji, J. , O'Connell, J. G. , Carter, D. J. , Larson, D. N. , High‐throughput nanohole array based system to monitor multiple binding events in real time. Anal. Chem. 2008, 80, 2491–2498. [DOI] [PubMed] [Google Scholar]
- 14. Han, M. , Gao, X. , Su, J. Z. , Nie, S. , Quantum‐dot‐tagged microbeads for multiplexed optical coding of biomolecules. Nat. Biotechnol. 2001, 19, 631–635. [DOI] [PubMed] [Google Scholar]
- 15. Gao, X. , Cui, Y. , Levenson, R. M. , Chung, L. W. , Nie, S. , In vivo cancer targeting and imaging with semiconductor quantum dots. Nat. Biotechnol. 2004, 22, 969–976. [DOI] [PubMed] [Google Scholar]
- 16. Nam, J. M. , Thaxton, C. S. , Mirkin, C. A. , Nanoparticle‐based bio‐bar codes for the ultrasensitive detection of proteins. Science 2003, 301, 1884–1886. [DOI] [PubMed] [Google Scholar]
- 17. Chen, Z. , Tabakman, S. M. , Goodwin, A. P. , Kattah, M. G. et al., Protein microarrays with carbon nanotubes as multicolor Raman labels. Nat. Biotechnol. 2008, 26, 1285–1292. [DOI] [PubMed] [Google Scholar]
- 18. Yu, X. , Munge, B. , Patel, V. , Jensen, G. et al., Carbon nanotube amplification strategies for highly sensitive immunodetection of cancer biomarkers. J. Am. Chem. Soc. 2006, 128, 11199–11205. [DOI] [PMC free article] [PubMed] [Google Scholar]
- 19. Wingren, C. , Borrebaeck, C. A. K. , Antibody microarrays: current status and key technological advances. OMICS 2006, 10, 411–427. [DOI] [PubMed] [Google Scholar]
- 20. Wingren, C. , Borrebaeck, C. A. K. , High‐throughput proteomic using antibody microarrays – an update. Exp. Rev. Mol. Diagn. 2007, 7, 673–686. [DOI] [PubMed] [Google Scholar]
- 21. Wingren, C. , Borrebaeck, C. A. K. , Antibody microarray analysis of directly labelled complex proteomes. Curr. Opin. Biotechnol. 2008, 19, 55–61. [DOI] [PubMed] [Google Scholar]
- 22. Wingren, C. , Borrebaeck, C. A. K. , Antibody‐based microarrays. Methods Mol. Biol. 2009, 509, 57–84. [DOI] [PubMed] [Google Scholar]
- 23. Haab, B. B. , Applications of antibody array platforms. Curr. Opin. Biotechnol. 2006, 17, 415–421. [DOI] [PubMed] [Google Scholar]
- 24. Wingren, C. , Ingvarsson, J. , Dexlin, L. , Szul, D. , Borrebaeck, C. A. K. , Design of recombinant antibody microarrays for complex proteome analysis: choice of sample labeling‐tag and solid support. Proteomics 2007, 7, 3055–3065. [DOI] [PubMed] [Google Scholar]
- 25. Kusnezow, W. , Banzon, V. , Schroder, C. , Schaal, R. et al., Antibody microarray based profiling of complex specimens: systematic evaluation of labeling strategies. Proteomics 2007, 7, 1786–1799. [DOI] [PubMed] [Google Scholar]
- 26. Wingren, C. , Borrebaeck, C. A. K. , Progress in miniaturization of protein arrays – a step closer to high‐density nanoarrays. Drug Discov. Today. 2007, 12, 813–819. [DOI] [PubMed] [Google Scholar]
- 27. Ingvarsson, J. , Larsson, A. , Sjoholm, A. G. , Truedsson, L. et al., Design of recombinant antibody microarrays for serum protein profiling: targeting of complement proteins. J. Proteome Res. 2007, 6, 3527–3536. [DOI] [PubMed] [Google Scholar]
- 28. Pawlak, M. , Schick, E. , Bopp, M. A. , Schneider, M. J. et al., Zeptosens' protein microarrays: a novel high performance microarray platform for low abundance protein analysis. Proteomics 2002, 2, 383–393. [DOI] [PubMed] [Google Scholar]
- 29. Shankaran, D. R. , Gobi, K. V. , Miura, N. , Recent advancements in surface plasmon resonance immunosensors for detection of small molecules of biomedical, food and environmental interest. Sens. Actuat. B 2007, 121, 158–177. [Google Scholar]
- 30. Campagnolo, C. , Meyers, K. J. , Ryan, T. , Atkinson, R. C. et al., Real‐time, label‐free monitoring of tumor antigen and serum antibody interactions Christine. J. Biochem. Biophys. Methods 2004, 61, 283–298. [DOI] [PubMed] [Google Scholar]
- 31. de Boer, R. A. , Hokke, C. H. , Deelder, A. M. , Wuhrer, M. , Serum antibody screening by surface plasmon resonance using a natural glycan microarray. Glycoconj. J. 2008, 25, 75–84. [DOI] [PubMed] [Google Scholar]
- 32. Wassaf, D. , Kuang, G. , Kopacz, K. , Wu, Q. L. et al., High‐throughput affinity ranking of antibodies using surface plasmon resonance microarrays. Anal. Biochem. 2006, 351, 241–253. [DOI] [PubMed] [Google Scholar]
- 33. Hiep, H. M. , Endo, T. , Kerman, K. , Chikae, M. et al., A localized surface plasmon resonance based immunosensor for the detection of casein in milk. Sci. Technol. Adv. Mat. 2007, 8, 331–338. [Google Scholar]
- 34. Lee, H. J. , Nedelkov, D. , Corn, R. M. , Surface plasmon resonance imaging measurements of antibody arrays for the multiplexed detection of low molecular weight protein biomarkers. Anal. Chem. 2006, 78, 6504–6510. [DOI] [PubMed] [Google Scholar]
- 35. Yuk, J. S. , Kim, H. S. , Jung, J. W. , Jung, S. H. et al., Analysis of protein interactions on protein arrays by a novel spectral surface plasmon resonance imaging. Biosens. Bioelectron. 2006, 21, 1521–1528. [DOI] [PubMed] [Google Scholar]
- 36. Lokate, A. M. , Beusink, J. B. , Besselink, G. A. , Pruijn, G. J. , Schasfoort, R. B. , Biomolecular interaction monitoring of autoantibodies by scanning surface plasmon resonance microarray imaging. J. Am. Chem. Soc. 2007, 129, 14013–14018. [DOI] [PubMed] [Google Scholar]
- 37. Huang, H. , Chen, Y. , Label‐free reading of microarray‐based proteins with high throughput surface plasmon resonance imaging. Biosens. Bioelectron. 2006, 22, 644–648. [DOI] [PubMed] [Google Scholar]
- 38. Natarajan, S. , Katsamba, P. S. , Miles, A. , Eckman, J. et al., Continuous‐flow microfluidic printing of proteins for array‐based applications including surface plasmon resonance imaging. Anal. Biochem. 2008, 373, 141–146. [DOI] [PubMed] [Google Scholar]
- 39. Natarajan, S. , Hatch, A. , Myszka, D. G. , Gale, B. K. , Optimal conditions for protein array deposition using continuous flow. Anal. Chem. 2008, 80, 8561–8567. [DOI] [PubMed] [Google Scholar]
- 40. Dong, Y. , Wilkop, T. , Xu, D. , Wang, Z. , Cheng, Q. , Microchannel chips for the multiplexed analysis of human immunoglobulin G–antibody interactions by surface plasmon resonance imaging. Anal. Bioanal. Chem. 2008, 390, 1575–1583. [DOI] [PubMed] [Google Scholar]
- 41. Hook, A. L. , Thissen, H. , Voelcker, N. H. , Surface plasmon resonance imaging of polymer microarrays to study protein–polymer interactions in high throughput. Langmuir 2009, 25, 9173–9181. [DOI] [PubMed] [Google Scholar]
- 42. Xinglong, Y. , Dingxin, W. , Xing, W. , Xiang, D. et al., A surface plasmon resonance imaging interferometry for protein micro‐array detection. Sens. Actuat. B 2005, 108, 765–771. [Google Scholar]
- 43. Ladd, J. , Taylor, A. D. , Piliarik, M. , Homola, J. , Jiang, S. , Label‐free detection of cancer biomarker candidates using surface plasmon resonance imaging. Anal. Bioanal. Chem. 2009, 393, 1157–1163. [DOI] [PubMed] [Google Scholar]
- 44. Lausted, C. , Hu, Z. , Hood, L. , Quantitative serum proteomics from surface plasmon resonance imaging. Mol. Cell. Proteomics 2008, 7, 2464–2474. [DOI] [PubMed] [Google Scholar]
- 45. Lesuffleur, A. , Im, H. , Lindquist, N. C. , Lim, K. S. , Oh, S. H. , Laser‐illuminated nanohole arrays for multiplex plasmonic microarray sensing. Opt. Expr 2008, 16, 219–224. [DOI] [PubMed] [Google Scholar]
- 46. Piciu, O. M. , Krogt, M. C. v. der , Tatar, F. , Docter, M. W. , Nano‐hole arrays in thin Au/Pd film on glass, for high speed molecular analysis. IEEE Sens. 2006, 608–611. [Google Scholar]
- 47. Yang, J. C. , Ji, J. , Larson, D. N. , Nanohole arrays of mixed designs and microwriting for simultaneous and multiple protein binding studies. Biosens. Bioelectron. 2009, 24, 2847–2852. [DOI] [PMC free article] [PubMed] [Google Scholar]
- 48. Lindquist, N. C. , Lesuffleur, A. , Im, H. , Oh, S. H. , Sub‐micron resolution surface plasmon resonance imaging enabled by nanohole arrays with surrounding Bragg mirrors for enhanced sensitivity and isolation. Lab Chip 2009, 9, 382–387. [DOI] [PubMed] [Google Scholar]
- 49. Leebeeck, A. D. , Kumar, L. K. S. , Lange, V. D. , Sinton, D. et al., On‐chip surface‐based detection with nanohole arrays. Anal. Chem. 2007, 79, 4094–4100. [DOI] [PubMed] [Google Scholar]
- 50. Eftekhari, F. , Escobedo, C. , Ferreira, J. , Duan, X. et al., Polarization‐dependent sensing of a self‐assembled monolayer using biaxial nanohole arrays. Anal. Chem. 2009, 81, 4308–4311. [DOI] [PubMed] [Google Scholar]
- 51. Jin, G. , Zhao, Z. Y. , Wang, Z. H. , Meng, Y. H. et al., The development of biosensor with imaging ellipsometry. Conf. Proc. IEEE Eng. Med. Biol. Soc. 2004, 3, 1975–1978. [DOI] [PubMed] [Google Scholar]
- 52. Klenkar, G. , Liedberg, B. , A microarray chip for label‐free detection of narcotics. Anal. Bioanal. Chem. 2008, 391, 1679–1688. [DOI] [PubMed] [Google Scholar]
- 53. Wang, Z. , Meng, Y. , Ying, P. , Qi, C. , Jin, G. , A label‐free protein microfluidic array for parallel immunoassays. Electrophoresis 2006, 27, 4078–4085. [DOI] [PubMed] [Google Scholar]
- 54. Westphal, P. , Bornmann, A. , Biomolecular detection by surface plasmon enhanced ellipsometry. Sens. Actuat. B. 2002, 84, 278–282. [Google Scholar]
- 55. Qi, C. , Chen, Y. Y. , Wang, Z. H. , Jin, G. , Investigation of interactions between two monoclonal antibodies and SARS virus with a label‐free protein array. Conf. Proc. IEEE Eng. Med. Biol. Soc. 2005, 2, 1305–1308. [DOI] [PubMed] [Google Scholar]
- 56. Qi, C. , Zhu, W. , Niu, Y. , Zhang, H. G. et al., Detection of hepatitis B virus markers using a biosensor based on imaging ellipsometry. J. Viral Hepat. 2009. PMID: 19486471. [DOI] [PubMed] [Google Scholar]
- 57. Elwing, H. , Protein absorption and ellipsometry in biomaterial research. Biomaterials 1998, 19, 397–406. [DOI] [PubMed] [Google Scholar]
- 58. Asinovski, L. , Beaglehole, D. , Clarkson, M. T. , Imaging ellipsometry: quantitative analysis. Phys. Stat. Sol. 2008, 205, 764–771. [Google Scholar]
- 59. Siegel, G. , Rodríguez, M. , Sauer, F. , Abletshauser, C. et al., Nanotechnologic biosensor ellipsometry and biomarker pattern analysis in the evaluation of atherosclerotic risk profile. Biosens. Bioelectron. 2009, 24, 1512–1517. [DOI] [PubMed] [Google Scholar]
- 60. Zhu, X. , Landry, J. P. , Sun, Y. S. , Gregg, J. P. et al., Oblique‐incidence reflectivity difference microscope for label‐free high‐throughput detection of biochemical reactions in a microarray format. Appl. Opt. 2007, 46, 1890–1895. [DOI] [PMC free article] [PubMed] [Google Scholar]
- 61. Fei, Y. Y. , Landry, J. P. , Sun, Y. S. , Zhu, X. D. et al., A novel high‐throughput scanning microscope for label‐free detection of protein and small‐molecule chemical microarrays. Rev. Sci. Instrum. 2008, 79, 013708–1–013708–7. [DOI] [PMC free article] [PubMed] [Google Scholar]
- 62. Landry, J. P. , Sun, Y. S. , Lam, K. S. , Zhu, X. D. , High‐throughput endpoint and real‐time detection of biochemical reactions in microarrays using label‐free oblique‐incidence reflectivity difference microscopes. Lasers and Electro‐Optics. Optical Society of America 2007, DOI: 10.1109/CLEO.2007.4453099. [DOI] [PMC free article] [PubMed] [Google Scholar]
- 63. Ozkumur, E. , Needham, J. W. , Bergstein, D. A. , Gonzalez, R. et al., label‐free and dynamic detection of biomolecular interactions for high‐throughput microarray applications. Proc. Natl. Acad. Sci. USA 2008, 105, 7988–7992. [DOI] [PMC free article] [PubMed] [Google Scholar]
- 64. Wang, X. , Zhao, M. , Nolte, D. D. , Area‐scaling of interferometric and fluorescent detection of protein on antibody microarrays. Biosens. Bioelectron. 2008, 24, 987–993. [DOI] [PubMed] [Google Scholar]
- 65. Nikitin, I. P. , Grigorenko, A. N. , Beloglazov, A. , Valeiko, V. M. et al., Surface plasmon resonance interferometry for micro‐array biosensing. Sens. Actuat. 2000, 85,189–193. [Google Scholar]
- 66. Markov, D. A. , Swinney, K. , Bornhop, D. J. , Label‐free molecular interaction determinations with nanoscale interferometry. J. Am. Chem. Soc. 2004, 126, 16659–16664. [DOI] [PubMed] [Google Scholar]
- 67. Lin, V. S. , Motesharei, K. , Dancil, K. P. , Sailor, M. J. et al., A porous silicon‐based optical interferometric biosensor. Science 1997, 278, 840–843. [DOI] [PubMed] [Google Scholar]
- 68. Zhao, M. , Nolte, D. , Cho, W. , Regnier, F. et al., High‐speed interferometric detection of label‐free immunoassays on the biological compact disc. Clin. Chem. 2006, 52, 2135–2140. [DOI] [PubMed] [Google Scholar]
- 69. Glaser, V. , Protein microarray market scope broadens. Genet. Eng. Biotechnol. News 2007, 27, 6. [Google Scholar]
- 70. Mace, C. R. , Striemer, C. c. , Miller, B. L. , Theoretical and experimental analysis of arrayed imaging reflectometry as a sensitive proteomics technique. Anal. Chem. 2006, 78, 5578–5583. [DOI] [PubMed] [Google Scholar]
- 71. Mace, C. R. , Striemer, C. c. , Miller, B. L. , Detection of human proteins using arrayed imaging reflectometry. Biosens. Bioelectron. 2008, 24, 334–337. [DOI] [PMC free article] [PubMed] [Google Scholar]
- 72. Mace, C. R. , Yadav, A. R. , Miller, B. L. , Investigation of non‐nucleophilic additives for the reduction of morphological anomalies in protein arrays. Langmuir 2008, 24, 12754–12757. [DOI] [PMC free article] [PubMed] [Google Scholar]
- 73. Gao, T. , Lu, J. , Rothberg, L. J. , Biomolecular sensing using near‐null single wavelength arrayed imaging reflectometry. Anal. Chem. 2006, 78, 6622–6627. [DOI] [PubMed] [Google Scholar]
- 74. Sinensky, A. , Belcher, A. , Label‐free and high resolution protein/DNA nanoarray analysis using Kelvin probe force microscopy. Nat. Nanotechnol. 2007, 2, 653–659. [DOI] [PubMed] [Google Scholar]
- 75. Thompson, M. , Cheran, L. , Zhang, M. , Chacko, M. et al., Label‐free detection of nucleic acid and protein microarrays by scanning Kelvin nanoprobe. Biosens. Bioelectron. 2005, 20, 1471–1481. [DOI] [PubMed] [Google Scholar]
- 76. Saoud, M. , Blaszykowski, C. , Ballantyne, S. M., Thompson, M. , Linker immobilization of protein and oligonucleotide on indium‐tin‐oxide for detection of probe–target interactions by Kelvin physics. Analyst 2009, 134, 835–837. [DOI] [PubMed] [Google Scholar]
- 77. Lynch, M. , Mosher, C. , Huff, J. , Nettikadan, S. et al., Functional protein nanoarrays for biomarker profiling. Proteomics 2004, 4, 1695–1702. [DOI] [PubMed] [Google Scholar]
- 78. Tinazli, A. , Piehler, J. , Beuttler, M. , Guckenberger, R. , Tampë, R. , Native protein nanolithography that can write, read and erase. Nat. Nanotechnol. 2007, 2, 220–225. [DOI] [PubMed] [Google Scholar]
- 79. Soultani‐Vigneron, S. , Dugas, V. , Rouillat, M. H. , Fédollière, J. et al., Immobilisation of oligo‐peptidic probes for microarray implementation: characterisation by FTIR, atomic force microscopy and 2D fluorescence. J. Chromatogr. B Analyt. Technol. Biomed. Life Sci. 2005, 822, 304–310. [DOI] [PubMed] [Google Scholar]
- 80. Lee, M. , Kang, D. K. , Yang, H. K. , Park, K. H. et al., Protein nanoarray on Prolinker™ surface constructed by atomic force microscopy dip‐pen nanolithography for analysis of protein interaction. Proteomics 2006, 6, 1094–1103. [DOI] [PubMed] [Google Scholar]
- 81. Lee, M. , Yang, H. K. , Park, K. H. , Kang, D. K. et al., Measurement of interaction force between nanoarrayed integrin αvβ3 and immobilized vitronectin on the cantilever tip. Biochem. Biophys. Res. Commun. 2007, 362, 935–939. [DOI] [PubMed] [Google Scholar]
- 82. Okuno, J. , Maehashi, K. , Kerman, K. , Takamura, Y. et al., Label‐free immunosensor for prostate‐specific antigen based on single‐walled carbon nanotube array‐modified microelectrodes. Biosens. Bioelectron. 2007, 22, 2377–2381. [DOI] [PubMed] [Google Scholar]
- 83. Ishikawa, F. N. , Stauffer, B. , Caron, D. A. , Zhou, C. , Rapid and label‐free cell detection by metal‐cluster‐decorated carbon nanotube biosensors. Biosens. Bioelectron. 2009, 24, 2967–2972. [DOI] [PubMed] [Google Scholar]
- 84. Drouvalakis, K. A. , Bangsaruntip, S. , Hueber, W. , Kozar, qL. G. et al., Peptide‐coated nanotube‐based biosensor for the detection of disease‐specific autoantibodies in human serum. Biosens. Bioelectron. 2008, 23, 1413–1421. [DOI] [PMC free article] [PubMed] [Google Scholar]
- 85. Wang, W. U. , Chen, C. , Lin, K. H. , Fang, Y. , Lieber, C. M. , Label‐free detection of small‐molecule–protein interactions by using nanowire nanosensors. Proc. Natl. Acad. Sci. USA 2005, 102, 3208–3212. [DOI] [PMC free article] [PubMed] [Google Scholar]
- 86. Lee, M. H. , Lee, K. N. , Jung, S. W. , Kim, W. H. et al., Quantitative measurements of C‐reactive protein using silicon nanowire arrays. Int. J. Nanomed. 2008, 3, 117–124. [DOI] [PMC free article] [PubMed] [Google Scholar]
- 87. Zheng, G. , Patolsky, F. , Cui, Y. , Wang, W. U. , Lieber, C. M. , Multiplexed electrical detection of cancer markers with nanowire sensor arrays. Nat. Biotechnol. 2005, 23, 1294–1301. [DOI] [PubMed] [Google Scholar]
- 88. Cai, Y. , Ocko, B. M. , Large‐scale fabrication of protein nanoarrays based on nanosphere lithography. Langmuir 2005, 21, 9274–9279. [DOI] [PubMed] [Google Scholar]
- 89. Cui, Y. , Wei, Q. , Park, H. , Lieber, C. M. , Nanowire nanosensors for highly sensitive and selective detection of biological and chemical species. Science 2001, 293, 1289–1292. [DOI] [PubMed] [Google Scholar]
- 90. Recht, M. I. , Bruyker, D. D. , Bell, A. G. , Wolkin, M. V. et al., Enthalpy array analysis of enzymatic and binding reactions. Anal. Biochem. 2008, 377, 33–39. [DOI] [PMC free article] [PubMed] [Google Scholar]
- 91. Recht, M. I. , Torres, F. E. , Bruyker, D. D. , Bell, A. G. et al., Measurement of enzyme kinetics and inhibitor constants using enthalpy arrays. Anal. Biochem. 2009, 388, 204–212. [DOI] [PMC free article] [PubMed] [Google Scholar]
- 92. Torres, F. E. , Kuhn, P. , Bruyker, D. D. , Bell, A. G. et al., Enthalpy arrays. Proc. Natl. Acad. Soc. USA 2004, 101, 9517–9522. [DOI] [PMC free article] [PubMed] [Google Scholar]
- 93. Salemme, F. R. , High‐throughput biochemistry heats up. Nat. Biotechnol. 2004, 22, 1100–1101. [DOI] [PubMed] [Google Scholar]
- 94. Braun, T. , Ghatkesar, M. K. , Backmann, N. , Grange, W. et al., Quantitative time‐resolved measurement of membrane protein–ligand interactions using microcantilever array sensors. Nat. Nanotechnol. 2009, 4, 179–185. [DOI] [PubMed] [Google Scholar]
- 95. McKendry, R. , Zhang, J. , Arntz, Y. , Strunz, T. et al., Multiple label‐free biodetection and quantitative DNA‐binding assays on a nanomechanical cantilever array. Proc. Natl. Acad. Sci. USA 2002, 99, 9783–9788. [DOI] [PMC free article] [PubMed] [Google Scholar]
- 96. Wu, G. , Datar, R. H. , Hansen, K. M. , Thundat, T. et al., Bioassay of prostate‐specific antigen (PSA) using microcantilevers. Nat. Biotechnol. 2001, 19, 856–860. [DOI] [PubMed] [Google Scholar]
- 97. Backmann, N. , Zahnd, C. , Huber, F. , Bietsch, A. et al., A label‐free immunosensor array using single‐chain antibody fragments. Proc. Natl. Acad. Sci. USA 2005, 102, 14587–14592. [DOI] [PMC free article] [PubMed] [Google Scholar]
- 98. Yue, M. , Stachowiak, J. C. , Lin, H. , Datar, R. et al., Label‐free protein recognition two‐dimensional array using nanomechanical sensors. Nano Lett. 2008, 8, 520–524. [DOI] [PubMed] [Google Scholar]
- 99. Braun, T. , Backmann, N. , Vogtli, M. , Bietsch, A. et al., Conformational change of bacteriorhodopsin quantitatively monitored by microcantilever sensors. Biophys. J. 2006, 90, 2970–2977. [DOI] [PMC free article] [PubMed] [Google Scholar]
- 100. Huber, F. , Hegner, M. , Gerber, C. , Guntherodt, H. J. , Lang, H. P. , Label‐free analysis of transcription factors using microcantilever arrays. Biosens. Bioelectron. 2006, 21, 1599–1605. [DOI] [PubMed] [Google Scholar]
- 101. Huber, F. , Lang, H. P. , Hegner, M. , Despont, M. et al., Analyzing refractive index changes and differential bending in microcantilever arrays. Rev. Sci. Instrum. 2008, 79, 086110–1–086110–3. [DOI] [PubMed] [Google Scholar]
- 102. Walter, J. G. , Kökpinar, O. , Friehs, K. , Stahl, F. , Scheper, T. , Systematic investigation of optimal aptamer immobilization for protein‐microarray applications. Anal. Chem. 2008, 80, 7372–7378. [DOI] [PubMed] [Google Scholar]
- 103. Yamamoto‐Fujita, R. , Kumar, P. K. , Aptamer‐derived nucleic acid oligos: applications to develop nucleic acid chips to analyze proteins and small ligands. Anal. Chem. 2005, 77, 5460–5466. [DOI] [PubMed] [Google Scholar]
- 104. Evans, D. , Johnson, S. , Laurenson, S. , Davies, A. G. et al., Electrical protein detection in cell lysates using high‐density peptide‐aptamer microarrays. J. Biol. 2008, 7, 3. [DOI] [PMC free article] [PubMed] [Google Scholar]
- 105. Xu, H. , Mao, X. , Zeng, Q. , Wang, S. et al., Aptamer‐functionalized gold nanoparticles as probes in a dry‐reagent strip biosensor for protein analysis. Anal. Chem. 2009, 81, 669–675. [DOI] [PubMed] [Google Scholar]
- 106. Nedelkov, D. , Development of surface plasmon resonance mass spectrometry array platform. Anal. Chem. 2007, 79, 5987–5990. [DOI] [PMC free article] [PubMed] [Google Scholar]
- 107. Bornhop, D. J. , Latham, J. C. , Kussrow, A. , Markov, D. A. et al., Free‐solution, label‐free molecular interactions studied by back‐scattering interferometry. Science 2007, 317, 1732–1736. [DOI] [PubMed] [Google Scholar]
- 108. Gao, T. , Rothberg, L. J. , Label‐free sensing of binding to microarrays using Brewster angle straddle interferometry. Anal. Chem. 2007, 79, 7589–7595. [DOI] [PubMed] [Google Scholar]
- 109. Striebel, H. M. , Schellenberg, P. , Grigaravicius, P. , Greulich, K. O. , Readout of protein microarrays using intrinsic time resolved UV fluorescence for label‐free detection. Proteomics 2004, 4, 1703–1711. [DOI] [PubMed] [Google Scholar]
- 110. Tomizaki, K. , Mihara, H. , Rational design of homogenous protein kinase assay platforms that allow both fluorometric and colorimetric signal readouts. Mol. Biosyst. 2006, 2, 580–589. [DOI] [PubMed] [Google Scholar]
- 111. Mannello, F. , Medda, V. , Tonti, G. A. , Protein profile analysis of the breast microenvironment to differentiate healthy women from breast cancer patients. Exp. Rev. Proteomics 2009, 6, 43–60. [DOI] [PubMed] [Google Scholar]
- 112. Yang, S. Y. , Xiao, X. Y. , Zhang, W. G. , Zhang, L. J. et al., Application of serum SELDI proteomic patterns in diagnosis of lung cancer. Biomed. Chromatogr. Cancer 2005, 5, 83. [DOI] [PMC free article] [PubMed] [Google Scholar]
- 113. Chen, A. L. , Soman, K. V. , Rychahou, P. G. , Luxon, B. A. , Evers, B. M. , Proteomic analysis of colonic myofibroblasts and effect on colon cancer cell proliferation. Surgery 2005, 138, 382–390. [DOI] [PubMed] [Google Scholar]
- 114. Jung, J. W. , Jung, S. H. , Yoo, J. O. , Suh, I. B. et al., Label‐free and quantitative analysis of C‐reactive protein in human sera by tagged‐internal standard assay on antibody arrays. Biosens. Bioelectron. 2009, 24, 1469–1473. [DOI] [PubMed] [Google Scholar]
- 115. Joo, C. , Ozkumur, E. , Unlü, M. S. , Boer, J. F. , Spectral‐domain optical coherence phase microscopy for label‐free multiplexed protein microarray assay. Biosens. Bioelectron. 2009, 25, 275–281. [DOI] [PMC free article] [PubMed] [Google Scholar]
- 116. Im, H. , Lesuffleur, A. , Lindquist, N. C. , Oh, S. H. , Plasmonic nanoholes in a multichannel microarray format for parallel kinetic assays and differential sensing. Anal. Chem. 2009, 81, 2854–2859. [DOI] [PMC free article] [PubMed] [Google Scholar]
- 117. Yasutake, M. , Aoki, D. , Fujihira, M. , Surface potential measurements using the Kelvin probe force microscope. Thin Solid Films 1996, 273, 279–283. [Google Scholar]
- 118. Cheran, L. , Johnstone, S. , Sadeghi, S. , Thompson, M. , Work‐function measurement by high resolution scanning Kelvin nanoprobe. Meas. Sci. Technol. 2007, 18, 567–578. [Google Scholar]
- 119. Shekhavat, G. , Tark, S. H. , Dravid, V. P. , Deflection in biomolecular sensors MOSFET‐Embedded microcantilevers for measuring. Science 2006, 311, 1592–1595. [DOI] [PubMed] [Google Scholar]
- 120. Zhu, H. , Klemic, J. F. , Chang, S. , Bertone, P. et al., Analysis of yeast protein kinases using protein chips. Nat. Genet. 2000, 26, 283–289. [DOI] [PubMed] [Google Scholar]
- 121. Zhu, H. , Bilgin, M. , Bangham, R. , Hall, D. et al., Global analysis of protein activities using proteome chips. Science 2001, 293, 2101–2105. [DOI] [PubMed] [Google Scholar]
- 122. Beusink, J. B. , Lokate, A. M. , Besselink, G. A. , Pruijn, G. J. , Schasfoort, R. B. , Angle‐scanning SPR imaging for detection of biomolecular interactions on microarrays. Biosens. Bioelectron. 2008, 23, 839–844. [DOI] [PubMed] [Google Scholar]
- 123. Huff, J. L. , Lynch, M. P. , Nettikadan, S. , Johns!on, J. C. et al., Label‐free protein and pathogen detection using the atomic force microscope. J. Biomol. Screen. 2004, 9, 491–497. [DOI] [PubMed] [Google Scholar]