

Abstracts
Background
Available diagnostics often fail to distinguish viral from bacterial causes of pediatric community‐acquired pneumonia (pCAP). Metabolomics, which aims at characterizing diseases based on their metabolic signatures, has been applied to expand pathophysiological understanding of many diseases. In this exploratory study, we used the untargeted metabolomic analysis to shed new light on the etiology of pCAP.
Methods
Liquid chromatography coupled with mass spectrometry was used to quantify the metabolite content of urine samples collected from children hospitalized for CAP of pneumococcal or viral etiology, ascertained using a conservative algorithm combining microbiological and biochemical data.
Results
Fifty‐nine children with CAP were enrolled over 16 months. Pneumococcal and viral cases were distinguished by means of a multivariate model based on 93 metabolites, 20 of which were identified and considered as putative biomarkers. Among these, six metabolites belonged to the adrenal steroid synthesis and degradation pathway.
Conclusions
This preliminary study suggests that viral and pneumococcal pneumonia differently affect the systemic metabolome, with a stronger disruption of the adrenal steroid pathway in pneumococcal pneumonia. This finding may lead to the discovery of novel diagnostic biomarkers and bring us closer to personalized therapy for pCAP.
Keywords: bacterial, biomarkers, CAP, mass spectrometry, pCAP, viral
1. INTRODUCTION
Community‐acquired pneumonia (CAP) is the single most common cause of death among children worldwide, and a leading cause of hospitalization.1, 2 Although the body of knowledge of the epidemiology, etiology, microbiology, and pathophysiology of CAP has expanded over the last few decades, basic patient management questions remain largely unanswered. In fact, when confronted with a feverish child with respiratory symptoms, the single most important management question is whether or not to start antibiotics, which translates into how confident is the treating physician that the child in question does not have a bacterial lower respiratory tract infection.3, 4 Although epidemiological research has repeatedly pointed out that the large majority of lower respiratory infection in pediatric patients are caused by viruses,2 physicians often lack the tools to reliably discriminate between bacterial and viral etiology5, 6, 7 and a large percentage of children presenting with respiratory symptoms and fever are ultimately administered antibiotics.8 The absence of certainty regarding CAP etiology thus prompts an overtreatment with the consequence of increasing the emergence of bacterial resistance.
Metabolomics is the newest branch of the systems biology approach to biomedical research.9, 10, 11 It aims to provide an unabridged description, both qualitative and quantitative, of all the metabolites (ie, molecules with a molecular weight of less than 1200 Da) found in human biofluids and tissues at a given time. In other words, it aims to define particular metabolic signatures, or fingerprints, characterizing a disease state. Powerful analytical tools are used to amass large amounts of data, which are analyzed and applied to previously‐unsolvable, complex questions of biology. In particular, metabolomics can provide a more comprehensive overview of a disease's pathophysiology, identify new biomarkers for use in diagnostics, and point to potential therapeutic targets to consider in the search for new drugs.
In the present exploratory investigation, a hypothesis‐free approach based on untargeted metabolomics was applied to pediatric CAP (pCAP) in an effort to improve the diagnosis and clinical management of this common childhood infection. More specifically, our study aimed to elucidate whether a specific metabolic signature differentiates pneumococcal from viral pCAP.
2. PATIENTS AND METHODS
2.1. Study design
This exploratory work was a double‐cohort multicenter prospective study. Participants were enrolled at three different pediatric centers in Padua (Pediatric Emergency Room, Department for Women's and Children's Health, Padua University Hospital), Treviso (Pediatric Emergency Room, Pediatric Ward, Santa Maria di Ca’ Foncello Hospital), and Milan (Department of Maternal and Pediatric Sciences, Pediatric Ward, Regina Elena Hospital) from September 2013 to January 40The study was approved by each center's institutional ethics committee. Written informed consent, signed by both parents, was required for a child to be included in the study; for children aged 8 years or older, the child's written informed assent was also required.
2.2. Patients
Cases eligible for this study were hospitalized children less than 14 years of age with a diagnosis of moderate to severe pneumonia. This diagnosis of CAP was based on clinical presentation (presence of fever, symptoms suggestive of an acute respiratory illness defined as new cough or sputum production, chest pain, dyspnea, tachypnea), abnormal lung examination and chest X‐ray results.12, 13
Chest X‐rays were evaluated by a blinded radiologist to the study participants. The decision to admit a child to the hospital for CAP was made by the attending physician in the emergency department.
To increase the specificity of our findings and reduce the role of confounding variables, three exclusion criteria were strictly applied, concerning: infants (ie, children under 1 year of age), to avoid any diagnostic overlap between pneumonia and bronchiolitis; children with a previous diagnosis of chronic disease (HIV, asthma, immunodeficiency, CHD), to reduce the pathophysiological heterogeneity between CAP cases; and children given any oral or injected antibiotic therapy in the 48 hours preceding enrollment, to avoid cases of partially treated pneumonia, as the related pathophysiological profile differs from that of a lung infection devoid of any treatment.
The pharmacological treatment of the recruited subjects was monitored during hospitalization to evaluate potential confounding effects on our findings.
2.3. Urine sample collection
A urine sample of at least 5 mL was collected from each pneumonia patient within 24 hours of their enrollment. All precautions were taken to minimize the samples’ variability before their analysis and the collected samples were stored at −80°C. See Supplementary Materials for more details.
2.4. Definition of CAP etiology
At enrollment, a deep nasal swab and a whole blood sample were collected from each patient. These samples were stored at −20°C and shipped on dry ice to the laboratory of the Pediatric High‐Intensity Care Unit at the University of Milan. The nasal swabs were tested with a multiple‐probe polymerase chain reaction (PCR) targeting 17 different respiratory viruses and sub‐types (Influenza A/B virus, Parainfluenza virus 1‐4, Coronavirus 229E/NL63/OC43/HKU1, Human Metapneumovirus, Human Rhinovirus, Enterovirus, Respiratory Syncytial Virus, Adenovirus, Human Bocavirus) and with a single‐probe PCR targeting Streptococcus pneumoniae. Plasma procalcitonin (PCT) concentrations were also measured for each patient within 24 hours of their hospitalization. For more details, see the Supplementary Materials.
A three‐step algorithm combining microbiological information obtained from the PCR assays and PCT levels was used to ascertain pneumonia etiology for subsequent metabolomic analysis.14 Three variables were considered sequentially: presence or absence of respiratory viruses revealed by the multiplex PCR assay; presence or absence of S. pneumoniae on the PCR assay; and PCT cutoffs of 0.25 and 2.00 ng/mL. Using this algorithm, a viral etiology was assumed in the presence of respiratory viruses, the absence of S. pneumoniae, and PCT < 0.25 ng/mL; a pneumococcal etiology was assumed in the absence of respiratory viruses, the presence of S. pneumoniae, and PCT ≥ 2.00 ng/mL. Cases not falling into either category were labeled as “undetermined” and not included in the subsequent analysis. This strategy was applied to obtain “pure” groups for metabolomic investigation, by limiting the number of false‐positive cases (ie, S. pneumoniae carriers) pneumonia and avoiding confounding due to mix‐etiology cases (ie, bacterial infection superimposed on a viral one), which may have a peculiar additive effect on the patient metabolome.
2.5. Metabolomic analysis
The urine samples were analyzed at the Mass Spectrometry Laboratory of the Women's and Children's Health Department at Padua University Hospital, as described elsewhere.15, 16 After sample preparation, the metabolic profile of the urine was acquired using an Acquity Ultra‐Performance Liquid Chromatography (UPLC) system coupled with a Q‐TOF Synapt G2 mass spectrometer (Waters Corp, Milford, MA) following the chromatographic method described in the Supplementary Materials. The electrospray source operated in positive and negative ionization modes. Data were collected in centroid mode, with a mass scan range of 20 to 1200 amu and a resolution of 20 000.
All UPLC‐MS operations were run under the control of MassLynx 4.1 (Waters Corporation, MA). Quality control samples and test mix solutions were used to assess reproducibility and accuracy during the analysis. See the Supplementary Materials for more details.
2.5.1. Statistical data analysis and identification of metabolites
Raw data were converted into two data sets with MarkerLynx software (Waters Corporation). The Rt_mass variables were filtered according to the number of missing values and, after inputting the missing values, the data underwent probabilistic quotient normalization, log‐transformation, and mean centering.
Multivariate data analysis was conducted based on projection methods, and univariate data analysis based on the t test with false discovery rate correction and receiver operating characteristic curve analysis, described by the area under the curve (AUC). Specifically, an exploratory data analysis was performed using principal component analysis (PCA), and projection to latent structures discriminant analysis based on variable influence on projection selection (VIP‐based PLS‐DA) was applied to identify differences between the groups under investigation. Stability selection based on Monte‐Carlo sampling was used to highlight the subset of relevant variables characterizing the two groups being investigated, and to estimate the predictive power of the models, as explained elsewhere.17 The relevant variables highlighted by multivariate data analysis were merged with those obtained by univariate data analysis. The possible effect of corticosteroid treatment on the relevant variables was investigated a posteriori, dividing accordingly the children into subgroups, and applying the one‐way analysis of variance (ANOVA) followed by the Bonferroni's correction. The variables were annotated by searching in the Human Metabolome Database and in the METLIN metabolite database. See the Supplementary Materials for more details.
3. RESULTS
Fifty‐nine patients had been accrued by the end of the enrollment period. Using the proposed three‐step algorithm, 15 patients were classified as having pCAP of viral etiology (VRL), and 12 as having pCAP of pneumococcal etiology (PNC). The other 32 patients were classified as having pCAP of undetermined etiology (13 mix‐etiology cases and 19 cases with inconsistent results between PCT measurement and PCR analysis) and were excluded from any further subclass analysis. Table 1 contains the clinical and demographic characteristics of the 27 patients included in the final set for statistical data analysis. All patients were treated according to local protocols with a third‐generation cephalosporin (ceftriaxone or cefotaxime) plus a macrolide (clarithromycin or azithromycin) based on demographic and clinical considerations. Oral or parenteral steroids (betamethasone or methylprednisolone) were also administered to 8 of the 15 patients in the VRL group, and to none of those in the PNC group. This different treatment is due to viral pneumonia being frequently associated with wheezing, especially in younger patients, and therefore treated with steroids.
Table 1.
Demographic and clinical characteristics of the two groups of patients
| PNC (N = 12) | VRL (N = 15) | P value | |
|---|---|---|---|
| Sex (male/female) | 6/6 | 9/6 | 0.707 a |
| Age (mean [SD]), y | 4.8 (1.8) | 2.8 (1.7) | 0.49 b |
| Wheezing (yes/no) | 1/11 | 9/6 | 0.014 a |
| Treatment with systemic steroids (yes/no) | 0/12 | 8/7 | 0.003 a |
| PCT (median [IQR]), ng/mL | 8 (3.97; 24.19) | 0.13 (0.08; 0.20) | 0.002 c |
| Time to defervescence (median [IQR]), d | 1.5 (1; 2) | 1.0 (0; 1) | 0.034 c |
Abbreviations: IQR, interquartile range; PCT, procalcitonin; PNC, pneumococcal; VRL, viral.
P value obtained with Fisher's exact test.
P value obtained with the Student t test.
P value obtained with the Mann‐Whitney U test.
This article is being made freely available through PubMed Central as part of the COVID-19 public health emergency response. It can be used for unrestricted research re-use and analysis in any form or by any means with acknowledgement of the original source, for the duration of the public health emergency.
A preliminary exploratory PCA on the data for each group did not reveal any outliers (α = 0.05). The differences between the metabolic profiles of the urine collected from the 15 patients in the VRL group and the 12 patients in the PNC group were then investigated using VIP‐based PLS‐DA with stability selection. Reliable PLS‐DA models were obtained and proved capable of distinguishing between the two groups. Specifically, for the negative ionization dataset, the model obtained showed: A = 1 component, AUC = 0.96 (P < .01), an AUC during sevenfold full cross‐validation of 0.87 (P = .04), and a median AUCpred calculated by stability selection of 0.80 (fifth percentile = 0.56). For the positive ionization dataset, the figures were: A = 1 component, AUC = 0.97 (P < .01), an AUC during sevenfold full cross‐validation of 0.87 (P = .02), and a median AUCpred of 0.75 (fifth percentile = 0.50). Figure 1 shows the scatter plots of the scores obtained for the two models. The variables identified by the stability selection were merged with those selected by the univariate data analysis, obtaining a set of 93 variables (see Tables S1 and S2 in the Supplementary Materials). On the basis of the one‐way ANOVA with Bonferroni's correction (α = 0.05), we did not find effects of the corticosteroid treatment on the selected relevant variables.
Figure 1.
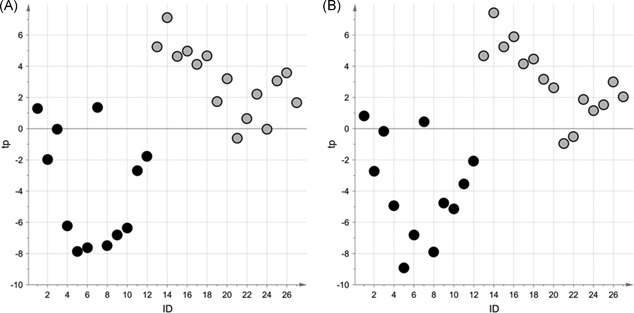
Scatter plot of the scores obtained for the VIP‐based PLS‐DA models for the NEG dataset (A), and POS dataset (B); light gray circles represent the urine samples in the VRL group, black circles those in the PNC group. NEG, negative ionization; PLS‐DA, projection to latent structures discriminant analysis; PNC, pneumococcal; POS, positive ionization; VIP, variable influence on projection; VRL, viral
Searching the available online metabolite databases generated a putative identification for 20 of these variables (Table 2).
Table 2.
Parameters characterizing the 20 putative biomarkers
| Rt | m/z | Type | AUC ROC (95% CI) | Spec | Sens | Class | Putative identification |
|---|---|---|---|---|---|---|---|
| 5.46 | 423.2015 | PNC >VRL | 0.900‐1.000 | 0.92 | 0.87 | Steroids | 18‐Hydroxycortisol |
| 6.23 | 495.2229 | PNC >VRL | 0.654‐0.978 | 0.67 | 0.80 | Steroids | Cortolone‐3‐glucuronide |
| 5.83 | 409.2220 | PNC >VRL | 0.90‐1.000 | 0.92 | 0.87 | Steroids | Tetrahydrocortisone (urocortisone) |
| 5.94 | 481.2433 | PNC >VRL | 0.866‐1.000 | 1.00 | 0.93 | Steroids | 11‐Beta‐hydroxy‐androsterone‐3‐glucuronide |
| 6.75 | 495.2956 | PNC >VRL | 0.828‐1.000 | 0.92 | 0.93 | Steroids | Pregnanediol‐3‐glucuronide |
| 5.94 | 288.2089 | PNC >VRL | 0.882‐1.000 | 1.00 | 0.93 | Steroids | Androstenedione |
| 1.66 | 137.0357 | PNC >VRL | 0.590‐0.986 | 0.75 | 0.80 | Amino acid derivatives | Urocanic acid |
| 4.69 | 204.0666 | PNC >VRL | 0.575‐0.957 | 0.83 | 0.73 | Amino acid derivatives | Indolelactic acid |
| 4.63 | 165.0557 | PNC >VRL | 0.534‐0.931 | 0.75 | 0.73 | Amino acid derivatives | l‐3‐Phenyl lactic acid |
| 1.55 | 344.0399 | PNC >VRL | 0.689‐0.999 | 0.83 | 0.80 | Purine derivatives | cGMP |
| 2.18 | 290.1603 | PNC >VRL | 0.843‐1.000 | 0.83 | 0.87 | Acyl‐carnitine | 3‐Methyl glutaryl‐carnitine |
| 0.71 | 673.2298 | PNC >VRL | 0.866‐1.000 | 0.83 | 0.87 | Syalyl‐oligosaccharide | 3′‐N‐acetyl neuraminyl‐N‐acetyl‐lactosamine |
| 0.81 | 187.0720 | PNC <VRL | 0.667‐1.000 | 0.83 | 0.93 | Peptides | l‐Glycyl‐l‐hydroxy‐proline |
| 2.13 | 245.1141 | PNC <VRL | 0.636‐0.985 | 0.83 | 0.80 | Peptides | l‐Beta‐aspartyl‐l‐leucine |
| 0.65 | 189.1236 | PNC <VRL | 0.728‐1.000 | 0.92 | 0.73 | Peptides | Glycyl‐l‐leucine |
| 3.27 | 132.1021 | PNC <VRL | 0.706‐0.993 | 0.75 | 0.80 | Amino acids and amino acid de‐ rivatives | l‐leucine |
| 1.05 | 188.0564 | PNC <VRL | 0.748‐1.000 | 0.75 | 0.93 | Acyl‐glycine | Glutaryl glycine |
| 3.81 | 230.1032 | PNC <VRL | 0.724‐1.000 | 0.83 | 0.87 | Acyl‐glycine | Suberyl glycine |
| 1.01 | 216.0989 | PNC <VRL | 0.654‐1.000 | 0.75 | 0.80 | Precursor polyamines | N‐a‐acetyl citrulline |
| 1.55 | 215.1037 | PNC <VRL | 0.743‐1.000 | 0.83 | 0.87 | Precursor polyamines | γ‐glutamyl‐γ‐amino‐butyraldehyde |
Abbreviations: AUC, area under the curve; CI, confidence interval; m/z, mass‐to‐charge ratio; PNC, pneumococcal; ROC, receiver operating characteristic; Rt, retention time; sens, sensitivity; spec, specificity; VRL, viral.
This article is being made freely available through PubMed Central as part of the COVID-19 public health emergency response. It can be used for unrestricted research re-use and analysis in any form or by any means with acknowledgement of the original source, for the duration of the public health emergency.
4. DISCUSSION
Metabolomics is a powerful method for analyzing the global metabolic profiles of biofluids. By applying this approach to compare children carrying a lung infection of PNC or VRL etiology, the present study shows that different types of lung infection affect this children's metabolome in different ways. The opportunities offered by host‐focused as opposed to pathogen‐focused diagnostics in the field of infectious diseases have been the object of increasing interest.18 The “omic sciences” enable the most thorough assessment of the host's response to a given set of environmental and/or clinical conditions, thus providing a unique opportunity to uncover diagnostic biomarkers and biological pathways in infectious diseases that may pave the way to personalized therapies.
To date, only a handful of published studies have examined the potential of metabolomic analysis applied to pneumonia,19, 20, 21, 22, 23, 24, 25 but they have all been successful in highlighting the remarkable opportunities afforded by this high‐throughput analytical tool. In particular, metabolomic analysis has proved capable of discriminating between different pneumonia etiologies in adults. Slupsky et al20 found that pneumococcal pneumonia has a metabolite fingerprint clearly distinguishable from that of bacterial pneumonia of other etiologies, or viral pneumonia. Banoei et al21 replicated these results by showing that H1N1 pneumonia generated a different plasma metabolic profile from that of bacterial culture‐positive pneumonia. Although metabolomic analyses focusing on pediatric CAP have so far been limited to small‐scale studies,22, 23, 24, 25 Adamko et al25 demonstrated that NMR‐based metabolomics discriminated respiratory tract infections caused by Respiratory Syncytial Virus from bacterial infections.
Metabolites belonging to the adrenal steroid synthesis and degradation pathway were the most prominent among those discriminating the etiology of CAP in our sample. In particular, urine samples from pneumococcal cases showed a relative increase in the concentrations of both the precursors of adrenal steroids, that is, androstenedione (a testosterone precursor) and pregnanediol (a derivative of progesterone), and their catabolites (ie, 11‐b‐OH‐androsterone, tetrahydrocortisone, and cortolone‐3‐glucuronide). A relative increase in the concentration of 18‐hydroxycortisol was also noted, which is a derivative of cortisol synthesized by zona fasciculata 11‐beta hydroxylase in physiological conditions. This pattern of metabolites is consistent with a global increase in the adrenal cortex bio‐synthetic activity driven by the stimulation of the hypothalamus‐pituitary‐adrenal (HPA) axis.26, 27, 28 Regulation of the HPA axis during bacterial infection involves a complex interaction between neuroendocrine and immune systems that is still not fully understood.29, 30 Cortisol biosynthesis and degradation are crucial to the host response mechanism in the event of severe infections, and many studies have examined the role of cortisol plasma levels as an indicator of CAP prognosis.31, 32, 33 Our study offers new evidence on the pathophysiology of the HPA axis in the course of pCAP and shows that changes in adrenal steroid metabolism occur even in relatively mild cases of CAP, since none of the patients enrolled in our study were admitted to the intensive care unit or developed sepsis.
The second class of compounds relevant to our study are amino acids and their derivatives. Generally speaking, plasma concentrations of amino acids are disrupted in the course of severe bacterial infection and sepsis, with greater changes corresponding to a worse prognosis in terms of survival.34 In particular, we found a significant difference in the relative concentrations of leucine, urocanic acid (the first intermediate of the histidine degradation pathway) and phenyl acetic acid, a phenylalanine derivative that promotes the activation of the polymorphonuclear leukocyte (PMNL) oxidative burst and phagocytosis, while reducing PMNL apoptotic cell death.35 Pleural fluid concentrations of phenylalanine rise in children with S. pneumoniae pleural infection,23 probably as a consequence of the aggressive metabolic activity and amino acid biosynthesis induced by S. pneumoniae replication.
Cyclic guanosine monophosphate (cGMP), the next significant molecule emerging from our analysis, mediates many of the proinflammatory and anti‐inflammatory functions of nitric oxide (NO).36 Toll‐like receptor ligands induce the expression of cGMP by increasing the activity of NO synthetase; in fact, endotoxin infusions in healthy volunteers have been shown to raise both exhaled NO and cGMP plasma concentrations.37 Bacteria may also increase the synthesis of cGMP by producing NO directly.38 Our study corroborates these previous reports and provides evidence for the plausibility of using this metabolite as a diagnostic marker of bacterial infection.
Another two molecules of interest to this discussion are 3‐methyl‐glutaryl‐carnitine (an acyl‐carnitine), and 3′‐N‐acetyl‐neuraminyl‐N‐acetyl‐lactosamine (a sialyl oligosaccharide). Carnitine metabolism is tied to mitochondrial homeostasis and has long been studied in the context of severe infections. Septic patients show many abnormalities in lipid metabolism, including a depletion of the cellular levels of l‐carnitine, a reduction in its plasma levels, and an increase in its urinary excretion.39 Three recent metabolomic studies also found an increase in the urinary concentration of acyl‐carnitines in patients with bacterial pneumonia.20, 25, 40 Indeed, the pneumococcal cytotoxin pneumolysin causes mitochondrial damage, which may account for the observed disarray in lipid metabolism.41, 42 Sialyl oligosaccharides are broken down and digested by lysosomes, and a relative increase in sialyl oligosaccharides in the course of bacterial infections may represent a transient lysosomal dysfunction. Indeed, the role of lysosomes in human health and disease is just starting to be unveiled, but evidence is already accumulating of lysosomes serving as regulators of macrophage function,43 and as key effectors of S. pneumoniae intracellular killing.44 A recent meta‐analysis of transcriptomic studies also showed that messenger RNA pathway associated with lysosomal function were among the most profoundly disrupted in the course of human sepsis.45 In short, our study points to organelle dysfunction as a crucial discriminator between bacterial and viral infection.
Viral pneumonia is associated with an increase in urine concentrations of glycyl‐l‐hydroxy‐proline (gly‐pro), an end product of collagen metabolism and the substrate of the enzyme prolidase, which promotes the surface expression of the interferon‐I receptor and is a target of viral antagonism.46, 47 The higher urinary levels of gly‐pro found in our study may, therefore, reflect an impaired prolidase activity, which could be expected in the course of viral infection.
Although state‐of‐the‐art, high‐throughput analytical methods and chemometric data processing methods were used in our study, it has some weaknesses. The most important concern the fact that we did not collect samples in therapy‐naive patients, and this constitutes a veritable source of bias. This issue could have been avoided by collecting urine samples from all therapy‐naive children presenting to the emergency department with respiratory symptoms and a fever, and then analyzing only those obtained from children actually enrolled in the study. This will be worth bearing in mind for future metabolomic studies conducted in acute care settings. Another weakness of our study concerns the small number of patients in our two groups, which may limit the validity of our findings. On the other hand, our adoption of stringent enrollment criteria and a conservative diagnostic algorithm ensured that the two groups were etiologically pure, thus enhancing the specificity of our findings. A further potential limitation of this exploratory study lies in the lack of any external validation set against which to test our models, which could only be validated internally by means of a cross‐validation and stability selection to ensure the reliability of the findings emerging from the data collected. Though ours is only a preliminary study, the present findings seem to be a promising starting point for the conduction of larger, validated studies.
In conclusion, MS‐based metabolomic analysis of urine samples collected from children with CAP of different etiologies can provide new insight into the multiple discrete pathophysiological pathways involved, and reveal putative biomarkers of considerable clinical value. Pneumococcal CAP prompts a stronger activation of the HPA axis, a marked organelle dysfunction, a relative increase in cGMP, and a significantly deranged amino acid metabolism. viral CAP, on the other hand, reduces prolidase activity and impairs macrophage activation. If confirmed by further, larger studies, these findings may have practice‐changing implications, possibly prompting the use of rapid point‐of‐care, urine‐based multi‐sticks for the diagnosis and management of pneumococcal CAP.
CONFLICT OF INTERESTS
The authors declare that there are no conflict of interests.
Supporting information
Supporting information
Supporting information
ACKNOWLEDGMENT
The work was supported by the “Bando Ricerca Pediatrica 2012–2014” Fondazione Cassa di Risparmio di Padova e Rovigo, Italy.
Del Borrello G, Stocchero M, Giordano G, et al. New insights into pediatric community‐acquired pneumonia gained from untargeted metabolomics: A preliminary study. Pediatric Pulmonology. 2020;55:418–425. 10.1002/ppul.24602
REFERENCES
- 1. Liu L, Oza S, Hogan D, et al. Global, regional, and national causes of child mortality in 2000‐13, with projections to inform post‐2015 priorities: an updated systematic analysis. Lancet. 2015;385(9966):430‐440. [DOI] [PubMed] [Google Scholar]
- 2. Jain S, Williams DJ, Arnold SR, et al. Community‐acquired pneumonia requiring hospitalization among U.S. children. N Engl J Med. 2015;372(9):835‐845. [DOI] [PMC free article] [PubMed] [Google Scholar]
- 3. Lynch T, Bialy L, Kellner JD, et al. A systematic review on the diagnosis of pediatric bacterial pneumonia: when gold is bronze. PLoS One. 2010;5(8). e11989 [DOI] [PMC free article] [PubMed] [Google Scholar]
- 4. Esposito S, Cohen R, Domingo JD, et al. Antibiotic therapy for pediatric community‐acquired pneumonia: do we know when, what and for how long to treat? Pediatr Infect Dis J. 2012;31(6):e78‐e85. [DOI] [PubMed] [Google Scholar]
- 5. Shah SN, Bachur RG, Simel DL, Neuman MI. Does this child have pneumonia?: the rational clinical examination systematic review. JAMA. 2017;318(5):462‐471. [DOI] [PubMed] [Google Scholar]
- 6. Hammitt LL, Murdoch DR, Scott JA, et al. Specimen collection for the diagnosis of pediatric pneumonia. Clin Infect Dis. 2012;54(Suppl 2):S132‐S139. [DOI] [PMC free article] [PubMed] [Google Scholar]
- 7. Murdoch DR, O'Brien KL, Driscoll AJ, et al. Laboratory methods for determining pneumonia etiology in children. Clin Infect Dis. 2012;54(Suppl 2):S146‐S152. [DOI] [PubMed] [Google Scholar]
- 8. Hersh AL, Shapiro DJ, Pavia AT, Shah SS. Antibiotic prescribing in ambulatory pediatrics in the United States. Pediatrics. 2011;128(6):1053‐1061. [DOI] [PubMed] [Google Scholar]
- 9. Nicholson JK, Wilson ID. Opinion: understanding “global” systems biology: metabonomics and the continuum of metabolism. Nat Rev Drug Discov. 2003;2(8):668‐676. [DOI] [PubMed] [Google Scholar]
- 10. Carraro S, Giordano G, Reniero F, Perilongo G, Baraldi E. Metabolomics: a new frontier for research in pediatrics. J Pediatr. 2009;154(5):638‐644. [DOI] [PubMed] [Google Scholar]
- 11. Fanos V, Antonucci R, Barberini L, Atzori L. Urinary metabolomics in newborns and infants. Adv Clin Chem. 2012;58:193‐223. [DOI] [PubMed] [Google Scholar]
- 12. Bradley JS, Byington CL, Shah SS, et al. The management of community‐acquired pneumonia in infants and children older than 3 months of age: clinical practice guidelines by the Pediatric Infectious Diseases Society and the Infectious Diseases Society of America. Clin Infect Dis. 2011;53(7):e25‐e76. [DOI] [PMC free article] [PubMed] [Google Scholar]
- 13. Harris M, Clark J, Coote N, et al. British Thoracic Society guidelines for the management of community acquired pneumonia in children: update 2011. Thorax. 2011;66(suppl 2):ii1‐ii23. [DOI] [PubMed] [Google Scholar]
- 14. Okada T, Matsubara K, Iwata S, et al. A practical approach estimating etiologic agents using real‐time PCR in pediatric inpatients with community‐acquired pneumonia. J Infect Chemother. 2012;18(6):832‐840. [DOI] [PubMed] [Google Scholar]
- 15. Bozzetto S, Pirillo P, Carraro S, et al. Metabolomic profile of children with recurrent respiratory infections. Pharmacol Res. 2017;115:162‐167. [DOI] [PubMed] [Google Scholar]
- 16. Carraro S, Bozzetto S, Giordano G, et al. Wheezing preschool children with early‐onset asthma reveal a specific metabolomic profile. Pediatr Allergy Immunol. 2018;29(4):375‐382. [DOI] [PubMed] [Google Scholar]
- 17. Arredouani A, Stocchero M, Culeddu N, et al. Metabolomic profile of low‐copy number carriers at the salivary α‐amylase gene suggests a metabolic shift toward lipid‐based energy production. Diabetes. 2016;65(11):3362‐3368. [DOI] [PubMed] [Google Scholar]
- 18. Ko ER, Yang WE, McClain MT, Woods CW, Ginsburg GS, Tsalik EL. What was old is new again: using the host response to diagnose infectious disease. Expert Rev Mol Diagn. 2015;15(9):1143‐1158. [DOI] [PubMed] [Google Scholar]
- 19. Nickler M, Ottiger M, Steuer C, et al. Systematic review regarding metabolic profiling for improved pathophysiological understanding of disease and outcome prediction in respiratory infections. Respir Res. 2015;16:125. [DOI] [PMC free article] [PubMed] [Google Scholar]
- 20. Slupsky CM, Rankin KN, Fu H, et al. Pneumococcal pneumonia: potential for diagnosis through a urinary metabolic profile. J Proteome Res. 2009;8(12):5550‐5558. [DOI] [PubMed] [Google Scholar]
- 21. Banoei MM, Vogel HJ, Weljie AM, et al. Plasma metabolomics for the diagnosis and prognosis of H1N1 influenza pneumonia. Crit Care. 2017;21(1):97. [DOI] [PMC free article] [PubMed] [Google Scholar]
- 22. Laiakis EC, Morris GA, Fornace AJ, Howie SR. Metabolomic analysis in severe childhood pneumonia in the Gambia, West Africa: findings from a pilot study. PLoS One. 2010;5(9). e12655 [DOI] [PMC free article] [PubMed] [Google Scholar]
- 23. Chiu CY, Lin G, Cheng ML, et al. Metabolomic profiling of infectious parapneumonic effusions reveals biomarkers for guiding management of children with streptococcus pneumoniae pneumonia. Sci Rep. 2016;6:24930. [DOI] [PMC free article] [PubMed] [Google Scholar]
- 24. Ambroggio L, Florin TA, Shah SS, et al. Emerging biomarkers of illness severity: urinary metabolites associated with sepsis and necrotizing methicillin‐resistant Staphylococcus aureus pneumonia. Pharmacotherapy. 2017;37(9):1033‐1042. [DOI] [PMC free article] [PubMed] [Google Scholar]
- 25. Adamko DJ, Saude E, Bear M, Regush S, Robinson JL. Urine metabolomic profiling of children with respiratory tract infections in the emergency department: a pilot study. BMC Infect Dis. 2016;16(1):439. [DOI] [PMC free article] [PubMed] [Google Scholar]
- 26. Xing Y, Edwards MA, Ahlem C, et al. The effects of ACTH on steroid metabolomic profiles in human adrenal cells. J Endocrinol. 2011;209(3):327‐335. [DOI] [PMC free article] [PubMed] [Google Scholar]
- 27. Rege J, Nakamura Y, Satoh F, et al. Liquid chromatography‐tandem mass spectrometry analysis of human adrenal vein 19‐carbon steroids before and after ACTH stimulation. J Clin Endocrinol Metab. 2013;98(3):1182‐1188. [DOI] [PMC free article] [PubMed] [Google Scholar]
- 28. Yamakita N, Gomez‐Sanchez CE, Mune T, et al. Regulation of 18‐oxocortisol and 18‐hydroxycortisol by the renin‐angiotensin system and ACTH in man. J Steroid Biochem Mol Biol. 1993;46(3):395‐399. [DOI] [PubMed] [Google Scholar]
- 29. Kanczkowski W, Sue M, Zacharowski K, Reincke M, Bornstein SR. The role of adrenal gland microenvironment in the HPA axis function and dysfunction during sepsis. Mol Cell Endocrinol. 2015;408:241‐248. [DOI] [PubMed] [Google Scholar]
- 30. Boonen E, Vervenne H, Meersseman P, et al. Reduced cortisol metabolism during critical illness. N Engl J Med. 2013;368(16):1477‐1488. [DOI] [PMC free article] [PubMed] [Google Scholar]
- 31. Salluh JI, Shinotsuka CR, Soares M, et al. Cortisol levels and adrenal response in severe community‐acquired pneumonia: a systematic review of the literature. J Crit Care. 2010;25(3):541.e1‐541.e8. [DOI] [PubMed] [Google Scholar]
- 32. Mueller C, Blum CA, Trummler M, et al. Association of adrenal function and disease severity in community‐acquired pneumonia. PLoS One. 2014;9(6). e65626 [DOI] [PMC free article] [PubMed] [Google Scholar]
- 33. Kolditz M, Halank M, Schulte‐Hubbert B, Höffken G. Adrenal function is related to prognosis in moderate community‐acquired pneumonia. Eur Respir J. 2010;36(3):615‐621. [DOI] [PubMed] [Google Scholar]
- 34. Hirose T, Shimizu K, Ogura H, et al. Altered balance of the aminogram in patients with sepsis—the relation to mortality. Clin Nutr. 2014;33(1):179‐182. [DOI] [PubMed] [Google Scholar]
- 35. Cohen G, Raupachova J, Hörl WH. The uraemic toxin phenylacetic acid contributes to inflammation by priming polymorphonuclear leucocytes. Nephrol Dial Transplant. 2013;28(2):421‐429. [DOI] [PubMed] [Google Scholar]
- 36. Guzik TJ, Korbut R, Adamek‐Guzik T. Nitric oxide and superoxide in inflammation and immune regulation. J Physiol Pharmacol. 2003;54(4):469‐487. [PubMed] [Google Scholar]
- 37. Soop A, Sollevi A, Weitzberg E, Lundberg JO, Palm J, Albert J. Exhaled NO and plasma cGMP increase after endotoxin infusion in healthy volunteers. Eur Respir J. 2003;21(4):594‐599. [DOI] [PubMed] [Google Scholar]
- 38. Kobsar A, Siauw C, Gambaryan S, et al. Neisseria meningitidis induces platelet inhibition and increases vascular endothelial permeability via nitric oxide regulated pathways. Thromb Haemost. 2011;106(6):1127‐1138. [DOI] [PubMed] [Google Scholar]
- 39. Nanni G, Pittiruti M, Giovannini I, Boldrini G, Ronconi P, Castagneto M. Plasma carnitine levels and urinary carnitine excretion during sepsis. JPEN J Parenter Enteral Nutr. 1985;9(4):483‐490. [DOI] [PubMed] [Google Scholar]
- 40. To K, Lee KC, Wong SSY, et al. Lipid mediators of inflammation as novel plasma biomarkers to identify patients with bacteremia. J Infect. 2015;70(5):433‐444. [DOI] [PubMed] [Google Scholar]
- 41. Preston JA, Dockrell DH. Virulence factors in pneumococcal respiratory pathogenesis. Future Microbiol. 2008;3(2):205‐221. [DOI] [PubMed] [Google Scholar]
- 42. Braun JS, Hoffmann O, Schickhaus M, et al. Pneumolysin causes neuronal cell death through mitochondrial damage. Infect Immun. 2007;75(9):4245‐4254. [DOI] [PMC free article] [PubMed] [Google Scholar]
- 43. Vural A, Al‐Khodor S, Cheung GYC, et al. Activator of G‐protein signaling 3‐induced lysosomal biogenesis limits macrophage intracellular bacterial infection. J Immunol. 2016;196(2):846‐856. [DOI] [PMC free article] [PubMed] [Google Scholar]
- 44. Gradstedt H, Iovino F, Bijlsma JJ. Streptococcus pneumoniae invades endothelial host cells via multiple pathways and is killed in a lysosome dependent manner. PLoS One. 2013;8(6). e65626 [DOI] [PMC free article] [PubMed] [Google Scholar]
- 45. Ma J, Chen C, Barth AS, Cheadle C, Guan X, Gao L. Lysosome and cytoskeleton pathways are robustly enriched in the blood of septic patients: a meta‐analysis of transcriptomic data. Mediators Inflamm. 2015;2015:2015. 984825‐15 [DOI] [PMC free article] [PubMed] [Google Scholar]
- 46. Lubick KJ, Robertson SJ, McNally KL, et al. Flavivirus antagonism of type I interferon signaling reveals prolidase as a regulator of IFNAR1 surface expression. Cell Host Microbe. 2015;18(1):61‐74. [DOI] [PMC free article] [PubMed] [Google Scholar]
- 47. Wilk P, Uehlein M, Kalms J, Dobbek H, Mueller U, Weiss MS. Substrate specificity and reaction mechanism of human prolidase. FEBS J. 2017;284(17):2870‐2885. [DOI] [PubMed] [Google Scholar]
Associated Data
This section collects any data citations, data availability statements, or supplementary materials included in this article.
Supplementary Materials
Supporting information
Supporting information