

Abstract
Mass spectrometry (MS) has become an important technique to identify microbial biomarkers. The rapid and accurate MS identification of microorganisms without any extensive pretreatment of samples is now possible. This review summarizes MS methods that are currently utilized in microbial analyses. Affinity methods are effective to clean, enrich, and investigate microorganisms from complex matrices. Functionalized magnetic nanoparticles might concentrate traces of target microorganisms from sample solutions. Therefore, nanoparticle‐based techniques have a favorable detection limit. MS coupled with various chromatographic techniques, such as liquid chromatography and capillary electrophoresis, reduces the complexity of microbial biomarkers and yields reliable results. The direct analysis of whole pathogenic microbial cells with matrix‐assisted laser desorption/ionization MS without sample separation reveals specific biomarkers for taxonomy, and has the advantages of simplicity, rapidity, and high‐throughput measurements. The MS detection of polymerase chain reaction (PCR)‐amplified microbial nucleic acids provides an alternative to biomarker analysis. This review will conclude with some current applications of MS in the identification of pathogens. © 2010 Wiley Periodicals, Inc., Mass Spec Rev 30:1203–1224, 2011
Keywords: pathogens, identification by mass spectrometry, biomarkers, proteins, nucleic acids, nanotechnology
INTRODUCTION
Rapid identification of infectious agents (viruses, bacteria, and fungi) is critical for the diagnosis and effective treatment of diseases. The monitoring of biohazards in the environment and the detection of pathogens in foodstuffs are also crucial to protect human health. Various procedures have traditionally been used to collect, isolate, and identify pathogens from different specimens and samples. In general, culture methods using differential and selective media are employed for isolation and identification. The identification is based on microscopic observation, colonial morphology, and phenotypic characteristics on isolation medium. Further, biochemical, serological, and molecular biology methods are employed for the definitive identification of microbial isolates. These established methods are often time‐consuming and labor‐intensive. For instance, cultivation on differential media and selective media might take days to weeks. Differentiation of clinical microorganisms to the species level might require as many as 20 biochemical tests. Consequently, the need for alternative procedures that allow the rapid and reliable identification of microorganisms is increasing. Mass spectrometry (MS) is a powerful tool in biological research, and represents an attractive alternative to classical biochemical methods, especially for the accurate identification and classification of microbial species (Anhalt & Fenselau, 1975; Cain, Lubman, & Weber, 1994; Fenselau & Demirev, 2001; Lay, 2001; Demirev & Fenselau, 2008a).
There are challenges associated with identification of various types of pathogens from wide range of samples. Viruses are ultramicroscopic and they must be cultivated within a susceptible cell. Unlike bacterial proteomes, viral proteomes are relatively small. Therefore, available biomarkers might be limited. The cell wall of Gram‐positive bacteria is more difficult to disrupt than that of Gram‐negative bacteria. Because of the resistance of spores, methods to identify them require germination and cultivation of the resulting vegetative cells. Microbiological analysis of a variety of samples generally requires specific approaches, as a first step, to isolate and culture the microorganisms. Liquid samples such as milk and body fluids might be directly cultured in media. Solid samples such as food are blended and diluted before culturing. Airborne pathogens should be sampled with an air sampler before further analysis.
The applicability of MS to the analysis of complex biomolecules has been greatly improved by the introduction of two soft‐ionization techniques–electrospray ionization (ESI) and matrix‐assisted laser desorption/ionization (MALDI) MS. These two soft‐ionization methods ionize large molecules with little or no fragmentation, and therefore have been applied to analyze various biomolecules such as carbohydrates, proteins and peptides, DNA and RNA, and synthetic polymers. MALDI and ESI have both been effectively used for the accurate analysis of peptides and the determination of peptide sequences to identify and characterize proteins in microorganisms (Yao, Demirev, & Fenselau, 2002; Dworzanski et al., 2004). These methods can be easily implemented in a straightforward diagnostic procedure to identify reliably the genus, species and, in some cases, subspecies of bacteria.
Microbial samples can be analyzed with MS by using a culture or a non‐culture approach. Figure 1 presents an overview of MS‐based approaches to identify and characterize microorganisms. In culture approaches, potential biomarkers are analyzed directly with MALDI‐MS or extracted/digested, separated by chromatography, and identified with MS. In non‐culture approaches, cell enrichment (with affinity methods) is performed with physical, chemical, or biochemical interactions with target cells, followed by MS analysis. The coupling of air sampling and polymerase chain reaction (PCR) amplification to MS has also been developed to detect microorganisms. Finally, unknown microorganisms are identified with a database search and/or a computer algorithm.
Figure 1.
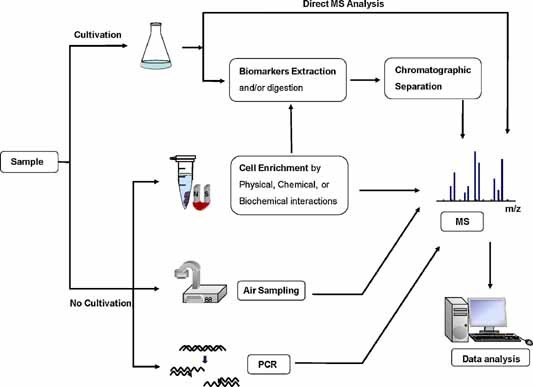
Overview of MS‐based approaches in microbial enrichment and identification. [Color figure can be viewed in the online issue, which is available at wileyonlinelibrary.com]
Mass spectrometry (MS) analysis of microorganisms present in complex biological samples obtained from food, water, and clinical specimens must often be preceded by purification and concentration. Affinity extraction can effectively clean up, enrich, and probe analytes of interest from complex biological mixtures. Nanostructures have many characteristics that favor their use as selective extraction agents, and their small size makes them inherently effective as concentration agents. The field of nanotechnology has seen explosive growth in recent years, primarily because of the availability of new strategies for the synthesis of nanomaterials and new tools for characterization and manipulation (Curtis & Wilkinson, 2001; Levy et al., 2002). Generally, biological molecules such as proteins/enzymes, antigens/antibodies, and DNA/oligonucleotides have been immobilized on the surfaces of nanoparticles with supports of organic/inorganic and polymer matrices. Exploiting the unique electronic, optical, and magnetic properties of nanomaterials, bioconjugated nanomaterials provide a novel platform for the development of nanobiotechnology to identify microorganisms (Gu et al., 2003a). Sample concentration techniques that are based on nanotechnology have potential applications to detect pathogens in complex samples.
The complexity of microbial biomarkers might be reduced with various chromatography‐based methods. However, sample preparation and fractionation tend to slow down measurements. Efficient separation approaches should be considered to achieve a fast and high‐throughput analysis. Various techniques, such as liquid chromatography (LC), capillary electrophoresis (CE), two‐dimensional gel electrophoresis (2DGE), protein precipitation, membrane‐based methods (dialysis, ultrafiltration), supercritical fluid extraction, and solid‐phase microextraction have been developed for sample pretreatment (Wang & Hanash, 2005; Bodzon‐Kulakowska et al., 2007). This article focuses only on sample fractionation methods that are used to identify microorganisms. MS analysis of various classes of biomolecules (peptides, proteins, nucleic acids, oligosaccharides, and lipids) with hyphenated MS techniques, including gas chromatography (GC), CE, and LC, are described. The direct analysis of pathogens with MALDI‐MS has several advantages, such as rapidity and simplicity. This review also describes direct methods, such as bioaerosol mass spectrometry (BAMS) and affinity methods, such as surface‐enhanced laser desorption/ionization (SELDI).
Various research groups have developed ambient ionization techniques, including desorption electrospray ionization (DESI) (Takats et al., 2004), direct analysis in real time (DART) (Cody, Laramee, & Durst, 2005), and electrospray‐assisted laser desorption ionization mass spectrometry (ELDI) (Shiea et al., 2005). Some of these techniques have been applied to examine bacterial samples without prior sample preparation, and enabled researchers to collect fingerprint‐spectra of bacteria in less than a minute with a mass spectrometer (Takats et al., 2004). The review will briefly describe recent progress in microbial analysis with DESI, DART, and other techniques, such as inductively coupled plasma mass spectrometry (ICP‐MS) and secondary ion mass spectrometry (SIMS).
Genotypic methods such as PCR and nucleotide sequence analysis might be used as diagnostic tools to identify pathogens. PCR methods are particularly promising because of their high specificity and sensitivity. Although PCR methods are quite useful to identify microbial species, they cannot be used for classification, especially when the microbial identities are unknown. The combination of PCR and MS is an even more powerful tool for microbial identification; in some cases, it yields additional information that cannot be obtained from either technique alone (Sampath et al., 2007b). The ESI‐based detection of PCR products and MALDI‐based resequencing provide detailed genomic information that is useful in the rapid identification of microorganisms (Sauer & Kliem, 2010). LC‐ESI‐MS has been successfully used to make mass measurements of bacterial PCR amplicons (Mayr et al., 2005). Ion‐pair reversed‐phase high‐performance LC with monolithic capillary columns has been employed for the rapid and efficient on‐line purification of DNA fragments amplified by PCR because it can be fully automated with a high throughput (Oberacher et al., 2000; Berger et al., 2002).
The utility of MS as an analytical tool for pathogens depends on the availability of a variety of MS methods and instruments that each provides particular pieces of information regarding the identity of the sample. The complexity of the relevant experimental data has led to the development of many dedicated algorithms to extract and interpret useful information. The review will also introduce methods of data analysis, including library searches and statistical approaches, to differentiate among pathogens and conclude with selected examples of applications of microbial analysis. The review is intended to cover most current MS techniques of microbial analysis. Clearly, although not all of the recently published literature will be referred to, representative studies will be described.
METHODS
Nanotechnologies to Concentrate Samples
Microbial biomarkers might be suppressed by the ions that are formed from complex matrices during MS analysis. Various affinity probes have been used to concentrate and purify the bacteria of interest. Fenselau and co‐workers described the detection of bacteria from complex biological mixtures using affinity capture coupled with MALDI‐MS. They proposed an affinity method to trap traces of bacterial cells from complex biological mixtures with a lectin‐immobilized substrate. This technique offers a broad range with less‐selective recovery because many bacteria have lectin on their cell surfaces (Bundy & Fenselau, 1999; Bundy & Fenselau, 2001; Afonso & Fenselau, 2003). Recently, affinity surfaces modified with immunoglobulin G (IgG) or small peptides that were selected from phage libraries were used to isolate protein A from Staphylococcus aureus. The structure of protein A was identified with MALDI‐MS (Johnson et al., 2009). Over the past decade, a number of biomedical applications of magnetic micro‐ and nanoparticles of various sizes, shapes, and compositions have emerged (Berry & Curtis, 2003). Immunomagnetic separation has been widely used to reduce the detection time/suppression effect, and to improve detection sensitivity. Magnetic particles conjugated with a specific antibody can selectively separate a target pathogen from complex samples (Ochoa & Harrington, 2005). Voorhees et al. proposed an approach that used affinity‐capture techniques, such as immunomagnetic separation, to concentrate and isolate bacteria from complex sample solutions, which was followed with a MALDI‐MS analysis (Madonna et al., 2001; Madonna, Van Cuyk, & Voorhees, 2003a). The method involved microsized magnetic beads immobilized with affinity‐purified antibodies. The immuno‐captured bacterium was further infected with a bacteriophage (a lytic virus). Phage amplification occurred within the living bacterial cell and induced cell lysis. Many phage progeny released into the sample medium and detection of the phage capsid proteins from the medium indicated the presence of the bacterium. The detectable concentration was improved to ∼5.0 × 10⁴ cells/mL and the analysis could be finished within 2 hr. Because many antibodies and bacteriophages are commercially available, the approach has the potential to analyze species‐ or even strain‐specific bacteria and to improve their detection limit.
The rapid and sensitive detection of microorganisms at low concentrations is a challenging task. Functionalized magnetic nanoparticles very efficiently concentrate pathogens from large sample volumes into much smaller volumes. A minimum capture efficiency of 94% for E. coli O157:H7 at concentrations from 1.6 × 101 to 7.2 × 10⁷ colony forming unit (CFU)/mL with magnetic nanoparticle‐anti‐E. coli conjugates has been reported (Varshney et al., 2005). Various carbohydrates have been recognized as receptors for the attachment of pathogens to epithelial cells of E. coli (Sharon, 2006). For example, mannose‐encapsulated gold nanoparticles have been used to observe the specific binding to a FimH protein of bacterial type 1 pili E. coli (Lin et al., 2002). The covalent binding between nanoparticles and targets is easily achieved with the self‐assembly of thiolated molecules on the nanoparticles (thiol–metal interactions). Gu et al. developed a strategy that used vancomycin‐conjugated Fe‐Pt nanoparticles to capture and detect pathogens such as vancomycin‐resistant enterococci and other Gram‐positive bacteria or ‐negative bacteria at exceptionally low concentrations (Gu et al., 2003a,b, 2006). They used optical and scanning electron microscopy to observe the captured bacteria. The thiol–metal binding protocol enabled the detection of bacteria from the samples within 1 hr, and had a detection limit of 10 CFU/mL (Gu et al., 2003a).
Several research groups have investigated nanoparticles as extraction/concentration agents for coupling with MS. Figure 2 shows the experimental procedure for the selective extraction and concentration of microorganisms with functionalized magnetic nanoparticles, followed by detection with MALDI‐MS. After functionalized magnetic nanoparticles are added to an Eppendorf tube that contains microbial cells, the suspension is incubated under gentle vortexing. The magnetic nanoparticles interact with the pathogens, and efficiently attach to them. The nanoparticle‐microbial cell conjugates are isolated by magnetic separation, and are deposited on a MALDI target for MS analysis. Chen's research group used functionalized nanoparticles to probe pathogenic bacteria (Chen, Tsai, & Chen, 2008). They proposed a simple method to fabricate IgG functionalized gold nanoparticles as useful probes of the electrostatic interactions between IgG and pathogens (Ho et al., 2004). The IgG‐modified magnetic nanoparticles, which bind selectively to IgG‐binding sites on the cell walls of pathogens, serve as affinity probes to capture targeted bacteria from sample solutions. The optimal detectable cell concentration of bacteria in aqueous sample solutions (Staphylococcus saprophyticus and S. aureus, 0.5 mL) and in urine samples (S. saprophyticus, 0.5 mL) was ∼3 × 10⁵ and ∼3 × 10⁷ CFU/mL, respectively (Ho et al., 2004). The same group used the IgG‐Fe3O4@TiO2 magnetic nanoparticles as photokilling agents that exhibit antimicrobial activity against pathogenic bacteria under UV irradiation (Chen, Tsai, & Chen, 2008). They also employed vancomycin‐modified magnetic nanoparticles for the selective isolation of Gram‐positive pathogens (S. saprophyticus, S. aureus, and E. faecalis) from sample solutions. The optimal detectable concentration of S. saprophyticus and S. aureus spiked in a urine sample was ∼7 × 10⁴ CFU/mL (Lin et al., 2005). Recently, pigeon ovalbumin‐bound Fe3O4@Al2O3 magnetic nanoparticles have been used as affinity probes to trap selectively uropathogenic P fimbriated E. coli from bacteria‐spiked urine samples (Liu et al., 2008) and Pseudomonas aeruginosa (Liu et al., 2009) from clinical urine samples through disaccharide–protein interactions. They have been able to detect peptide signal from 250 µL of samples at a concentration as low as 4 × 10⁴ cells/mL, corresponding to 102 cells deposited on the MALDI plate. Guo and co‐workers utilized anion‐exchange/cation‐exchange magnetic nanoparticles as affinity probes to separate bacteria from water (Guo et al., 2009; Li et al., 2009). The positively charged nanoparticles interacted with bacteria (generally carrying negative charges). This approach was used to analyze various bacteria spiked in tap water and reservoir water with a detection limit of 1 × 10³ CFU/mL in 2 hr. Although most of the above affinity methods employ MALDI‐MS for microbial analysis, LC‐ESI‐MS should be in principle as feasible as MALDI‐MS.
Figure 2.
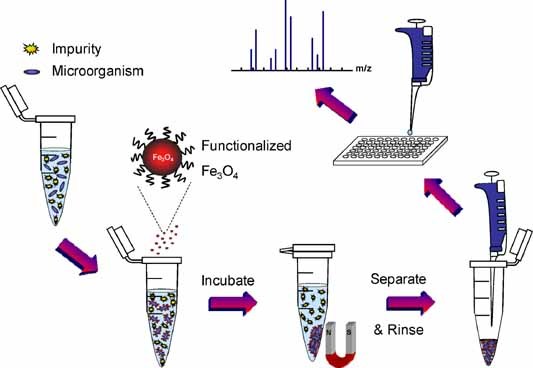
General experimental procedures for microbial enrichment with functionalized magnetic nanoparticles and MS detection. Following the incubation of a microbial solution with functionalized magnetic nanoparticles, microbial cells are isolated and concentrated with a magnet. They are washed. The enriched cells are mixed with a MALDI matrix solution and subjected to MS analysis. [Color figure can be viewed in the online issue, which is available at wileyonlinelibrary.com]
The most important advantage of affinity‐based nanotechnology is its ability to concentrate and purify microbial cells from complex samples such as urine. Microorganisms might be identified directly with MALDI‐MS without microbial culturing. Direct MALDI analysis of microorganisms in urine samples would be hindered by the high amounts of salts without the affinity‐enrichment step (Liu et al., 2008). Notably, different cell counting methods are used among various labs and absolute cell number or CFU per volume are reported in literatures. Although CFU reflects the viable cell number, absolute cell number is likely higher than those indicated by the CFU value. Limits of detection given in these two units should be compared carefully.
ESI‐MS
When a large set of digested peptides that are obtained from a complex microorganism are analyzed, MALDI‐MS yields spectra that are too complicated to be interpreted. Moreover, MALDI‐MS is relatively difficult to couple on‐line with sample pretreatment and separation methods, and cannot easily be automated. ESI‐MS, however, allows on‐line detection to be combined with sample purification, concentration, and separation techniques, such as microdialysis, solid phase extraction, LC, and CE. Thus, ESI‐MS is effective to analyze complex systems. Goodacre, Heald, and Kell (1999) applied ESI‐MS to characterize strains of intact Gram‐negative and Gram‐positive bacteria. The bacteria were suspended in 50% acetonitrile/water (1%, v/v, formic acid) for positive ESI and the samples were analyzed in 50% isopropanol/water for negative ESI. This approach produces the information‐rich spectra, in both the positive and negative ion modes, from whole bacterial suspensions, but requires the cells to be suspended in solvent before analysis. Further, Xiang et al. (2000) employed ESI‐MS/MS to identify bacteria by analyzing cell lysates. Vaidyanathan et al. also investigated the effectiveness of direct ESI‐MS of bacterial cell lysates/extracts without prior chromatographic separation (Vaidyanathan, Kell, & Goodacre, 2002; Vaidyanathan et al., 2001; Vaidyanathan, O'Hagan, & Goodacre, 2006). This approach yields informative mass spectra from microbial cells and crude cell extracts that are used in microbial characterizations.
LC‐MS
The combination of MS with LC is one of the most important analytical methods to separate and identify a wide variety of biological samples (Banoub et al., 2005). LC‐MS is rapidly being developed as a tool in proteomics to deal with the inherent complexity of a biological system, and to complement conventional approaches that are based on 2DGE (Delahunty & Yates, 2005). Furthermore, LC‐MS has greatly facilitated the determination of the molecular weights of proteins from complicated mixtures. Krishnamurthy et al. (1999) used LC‐ESI‐MS to identify protein biomarkers specific to individual organisms present in crude bacterial mixtures. Lyophilized intact bacterial cells were suspended in 0.1% aqueous TFA (containing 0–20% acetonitrile) to lyse the cells and release cellular proteins or metabolites specific to an individual microorganism. Biomarker proteins and peptides were separated with reversed‐phase HPLC and a chromatogram of biomarker signals was used to distinguish bacteria. However, this work was limited by the complexity of the data generated from ESI. A solution to this problem was reported by Williams and colleagues with an automated data handling algorithm that provided sequential scanning, centroiding, and deconvolution of multiply charged proteins present in successive scans of the LC‐MS analysis (Williams, Leopold, & Musser, 2002). This approach has proven useful for identifying protein biomarkers of Vibrio parahaemolyticus (Williams et al., 2004). The same group demonstrated a method in which LC‐MS was used to identify unique proteins that can be sequenced, identified, and reverse engineered into PCR primers that are specific to a desired phenotypic trait, thermal tolerance (Williams et al., 2005). Because the genome for Enterobacter sakazakii was not sequenced by that time, this methodology provided a unique, independent means to identify genetic differences among closely related strains of this species, without the need for any prior sequencing of the genome. Recently, Everley et al. discovered reproducible intact protein biomarkers with an LC‐ESI‐MS approach to differentiate and correctly identify unknown pathogens at the species (Everley et al., 2008) and strain level (Everley et al., 2009). The organism Bacillus anthracis was identified with the MS/MS analysis of an antigenic protein biomarker EA1 isolated with affinity chromatography and a monoclonal antibody (Krishnamurthy et al., 2006). Multi‐dimensional protein identification has been used to identify B. anthracis strains (Krishnamurthy et al., 2007). Ho and Hsu (2002) investigated with LC‐ESI‐MS the effect of variations in the protein patterns obtained from E. coli in bacterial identification.
Botulinum toxin (BTx) and tetanus toxin (TTx) both belong to a family of potent bacterial neurotoxins, and might be used as biological warfare agents. van Baar et al. noted that protein toxins can be unambiguously identified with MS, and they exploited this fact in analyses of tetanus (van Baar et al., 2002b) and botulinum (van Baar et al., 2002a, 2004) toxins. LC‐MS/MS of selected precursor ions from trypsin digest fragments yielded specific sequence data for the identification of the protein toxins. The authors showed that accurate strain assignments were possible when genetic sequences were available.
Mass spectrometry (MS) analysis of bacterial proteins (Fenselau & Demirev, 2001) or digests of protein extracts (Zhou et al., 2001), followed by statistical matching of protein/peptide masses that were detected in an unknown sample to those in a proteome database, has been developed as a useful tool for bacterial identification (Wang et al., 2002; Tao et al., 2004). Figure 3 schematically depicts a proteomic approach to identify microorganisms based on MS/MS analysis. Microbial proteins are extracted from a cell lysate and digested. The peptide digests are LC‐separated, and are analyzed with MS/MS. The MS/MS spectra are checked against a proteome database to identify the proteins, and to deduce the source of the microorganism. Demirev et al. (1999) was the first to propose this method. Mathematical methods might be applied to evaluate the search results. Hu et al. proposed a method that used LC‐selective proteotypic peptide analysis (LC‐SPA) to identify the bacterial species in a complex mixture. Many pathogens were simultaneously identified from a series of selective MS/MS analyses of marker peptides in the appropriate elution time windows for the specific peptides. The SEQUEST application was used to check all of the tandem mass spectra of the peptides against the NCBInr protein database. This method successfully identified eight pathogens present in a microbial mixture (Lo, Hu, & Ho, 2006). Dworzanski et al. (2004) developed a method to identify microorganisms or protein toxins based on the LC‐MS/MS analysis of peptides derived from bacterial proteins. In their research, product‐ion mass spectra of peptides that were generated from a microbial protein digest were checked against the prototype proteome database (87 bacterial genomes) with SEQUEST, and the results of the search of the database were subjected to discriminant function analysis. Instead of matching peptide sequences to a microbial source in the database, Dworzanski et al. (2006) employed multivariate statistical methods, such as principal component analysis (PCA) and cluster analysis, to determine the peptide‐sequence similarities between the unknown species and a database of bacteria, grouped by their established taxonomic position. They classified bacterial species into corresponding taxons based on similarities. More recently, the same group reported on the classification/identification and genotyping of B. anthracis, B. cereus, and B. thuringiensis strains based on the LC‐MS/MS analysis of whole‐cell protein digests (Dworzanski et al., 2010).
Figure 3.
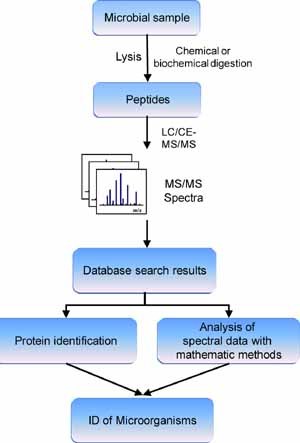
Schematic diagram of a proteomic approach to identify microorganisms based on MS/MS analysis. Microbial proteins are extracted and chemically or biochemically digested. The peptide digests are separated with chromatography and analyzed with MS/MS. The MS/MS spectra are checked against a proteome database to identify the proteins and to deduce the source microorganism. Mathematical algorithms might be applied to evaluate the search results before the microorganisms are identified. [Color figure can be viewed in the online issue, which is available at wileyonlinelibrary.com]
Lipid biomarkers have also been used extensively to characterize complex microorganisms from various environments with LC‐MS or MS/MS analysis (Jelinek et al., 2006; Zhang et al., 2007). The collision‐induced dissociation of lipid biomarkers produces arrays of fragment ions that reveal structural information about bacteria (Moe et al., 2005). Similarly, polar phospholipids can be used as a biomarker of bacterial presence. Mazzella et al. (2004) separated and identified with LC‐MS most of the phospholipid species (phosphatidylglycerol, phosphatidylinositol, diphosphatidylglycerol, and a unique lipid compound, acyl phosphatidylglycerol) of a Gram‐positive bacterium (Corynebacterium species strain 8). The same group proposed fragmentation pathways and identified the diagnostic ions of two common bacterial phospholipid classes, phosphatidylglycerol and phosphatidylethanolamine. They used LC‐MS and MS/MS methods to determine the structures of intact phospholipids from the two bacterial strains Pseudomonas nautica IP 617 and Marinobacter hydrocarbonoclasticus, cultured on either ammonium acetate or crude oil (Mazzella et al., 2005).
White et al. have developed a rapid method to extract and detect the bacterial biomarker 2,6‐dipicolinic acid, from Gram‐negative bacteria. Specific lipid components can also provide insights into the viability and potential infectivity of the pathogens detected in the samples (White et al., 2002). Bacteriohopanoids or bacteriohopanepolyols (BHPs) are good biomarkers for bacteria separation and identification. Many bacterial species are known to produce various BHPs with specific modifications in the side‐chain and ring‐structure. Intact BHPs have been directly detected from bacterial isolates with LC‐MS/MS (Talbot et al., 2003a,b; Talbot, Rohmer, & Farrimond, 2007a,b). Although lipid markers have been proven to be useful for microbial identification, the dependence of lipid profiles on growth conditions might complicate identification results.
CE‐MS
Capillary electrophoresis allows the rapid and efficient separation of biological molecules with the least consumption of sample and reagents. CE coupled to MS has been established as a method for the fast separation and identification of microorganisms (Kolch et al., 2005). A limited number of articles have described the use of CE‐MS to identify microorganisms (Chong et al., 2000; Hu, Tsai, & Ho, 2005; Lo, Hu, & Ho, 2006; Hu et al., 2007; Petr et al., 2009). Hu et al. applied CE‐MS/MS to selected proteotypic peptide ions to obtain partial sequences of protein biomarkers. Proteotypic peptides refer to those experimentally observable peptides that identify specific proteins. Their proposed approach is a highly selective and sensitive analytical method to characterize the pathogens from microbial mixtures (Hu, Tsai, & Ho, 2005). They performed a preliminary analysis with CE‐MS/MS of the proteolytic digests of cell extracts from pure pathogens, and carried out subsequent database searches to select abundant peptide ions that were specific to the pathogens of interest. Minor bacterial species present in the complex mixture at even 1% relative abundance were identified with high confidence. They also applied this method to identify pathogens present in a saliva sample that had been spiked with bacterial mixtures. Further, the speed of data analysis was greatly improved because only selected markers, instead of whole‐protein digests, were analyzed. CE‐MS/MS analysis of proteolytic digests of microbial cell extracts has been combined with SEQUEST searching and a new empirical scoring system to identify bacterial species in microbial mixtures (Hu et al., 2007). The search results for 19 samples of bacterial mixtures revealed that the empirical Z‐scoring function improved the identification of bacteria in the mixtures. Petr et al. (2009) combined CE separation with the off‐line MS identification of microorganisms. They separated the model microorganisms E. coli and Saccharomyces cerevisiae, and cultivated them after the fractions were collected. After cultivation, DESI‐MS was used for further identification.
MALDI‐MS
Protein Fingerprinting
Matrix‐assisted laser desorption/ionization‐mass spectrometry (MALDI‐MS) allows the fast and accurate identification and subtyping of bacterial species (Seng et al., 2009; Stevenson, Drake, & Murray, 2010), fungi (Marinach‐Patrice et al., 2009, 2010; Santos et al., 2010), and viruses (Swatkoski et al., 2007; Franco et al., 2010). Currently, most published studies of the direct mass spectrometric analysis of microorganisms are based on MALDI techniques (Demirev & Fenselau, 2008a,b). Direct bacterial profiling with MALDI‐TOFMS is based mainly on a comparison of specific mass spectra of the proteins, peptides, and other cellular components that are obtained from microbial cells. One of the first studies using this approach was based on the protein profiles of microorganisms (Cain, Lubman, & Weber, 1994). Although sample preparation is crucial to MALDI analysis of microbial markers, there is no universal sample preparation and measurement protocol. Many methods have been described since the method for direct MALDI analysis of bacteria was proposed. The experimental parameters studied include cultivation conditions, matrices, solvents, cell‐lysis, and matrix‐spotting methods. Microbial cells are generally obtained from a purified liquid culture or a single colony. Samples are analyzed by direct deposition of intact cells on the sample plate or using various ways of biomarker extraction. The MALDI matrices that most often used are α‐cyano‐4‐hydroxycinnamic acid (HCCA), ferulic acid (FA), and sinapinic acid (SA). HCCA provides better signal‐to‐noise ratio than FA and SA. FA is suitable for the detection of high‐mass ions above 15 kDa. A UV laser is often used as an irradiation source. IR‐MALDI is rarely used to analyze microorganisms because of its somewhat lower sensitivity compared to UV‐MALDI. Although 5 × 10³–104 intact cells deposited on the MALDI plate were sufficient to obtain useful biomarker signals, the detected biomarkers were low‐mass ions (less than 1,000 Da). It has been reported that 106 cells yielded the most good‐quality and reproducible spectra for protein fingerprinting (Mazzeo et al., 2006). Current protein fingerprinting methods still require culturing of the microbial cells to obtain detectable signals. Analysis of non‐culturable microorganism remains a challenge.
Recent studies on MALDI analysis of microorganisms have been focused on development of standardized analytical protocols (Vargha et al., 2006; Ilina et al., 2009) and high throughput analysis of pathogenic bacteria (Donohue et al., 2006; Rajakaruna et al., 2009). Perhaps a universal protocol for sample preparation and analysis will not be obtained, due to the complex nature of MALDI experiments. Careful control of the sample preparation and measurement parameters is the key to the success of the fingerprinting approaches. The MALDI‐MS fingerprinting approach has been applied to analyze Bacillus spores (Dickinson et al., 2004), Campylobacter (Mandrell et al., 2005), Salmonella (Leuschner, Beresford‐Jones, & Robinson, 2004), Aeromonas (Donohue et al., 2006), Clostridium (Grosse‐Herrenthey et al., 2008), Streptococcus (Williamson et al., 2008), non‐fermenting bacteria (Pseudomonas cepacia) (Mellmann et al., 2008), Staphylococcus (Rajakaruna et al., 2009), Neisseria (Ilina et al., 2009), and Helicobacter (Ilina et al., 2010). The approach has such advantages as being able to detect intact biomarkers, simplicity of sample preparation, broad‐band identification, and high throughput.
Matrix‐assisted laser desorption/ionization (MALDI) mass spectra might vary with growth media and growth stage (Valentine et al., 2005; Wunschel et al., 2005). The intra‐ and inter‐laboratory reproducibility of whole‐cell MS, and the effect of culture media on the spectral profiles, have been investigated (Walker et al., 2002). Williams et al. (2003) discussed the experimental factors that affect the quality and reproducibility of bacterial analysis with MALDI‐TOFMS.
The cell walls of Gram‐positive bacteria are usually more difficult to analyze with MALDI‐MS than those of Gram‐negative bacteria. Therefore, analysis of Gram‐positive bacteria yields spectra with fewer peaks, lower intensities, and a smaller mass range than the spectra of Gram‐negative bacteria. Several methods have been suggested to overcome these difficulties, including disruption of the cell wall with enzymatic or chemical cleavage (Smole et al., 2002; Williams et al., 2003). Smole et al. (2002) developed a method to prepare samples of whole‐cell Gram‐positive bacteria for analysis. They found that lysozyme treatment of Gram‐positive bacteria increased the spectral range to levels close to those of Gram‐negative bacteria from the Enterobacteriaceae family. Not only were intact cells analyzed, but also four cell‐lysis methods—mechanical, enzymatic, chemical, and heat treatment—were compared (Smole et al., 2002; Williams et al., 2003) and optimized to increase the complexity of the biomarker profile to develop bacterial species‐specific fingerprints. Vargha et al. (2006) optimized the experimental parameters of MALDI‐TOFMS analysis to differentiate among Arthrobacter isolates at the strain level. Liu et al. evaluated a universal sample‐preparation protocol to analyze Gram‐positive bacteria (B. anthracis and S. aureus) and Gram‐negative bacteria (Yersinia pestis, E. coli, and B. cepacia) that have high extracellular polysaccharide contents. In their study, three sample‐preparation methods (direct analysis, solvent treatment, and enzyme treatment) were tested for the direct analysis of bacteria with MALDI‐TOFMS (Liu et al., 2007).
B. anthracis is the etiological agent of anthrax in humans/animals, and is recognized to be a potential biological‐threat agent that could be used in biological warfare or by terrorists (Demirev & Fenselau, 2008b; Lasch et al., 2009). Numerous low‐molecular‐weight proteins can be readily extracted from the spores of B. anthracis and related species. Many of these proteins have been identified as small acid‐soluble spore proteins (SASPs) with various solvents including 10% TFA, 30% acetonitrile and 40% formic acid, 50% acetic acid, and acetonitrile‐5% TFA (70:30, vol/vol) (Hathout et al., 2003; Dickinson et al., 2004; Castanha et al., 2007; Fenselau et al., 2007), whereas others have been identified as cyclic lipopeptides (Madonna et al., 2003b). Coxiella burnetii, the causative agent of Q fever, has been identified from its proteins, extracted with acetonitrile and trichloroacetic acid (Hernychova et al., 2008), and characterized with MALDI‐TOFMS.
Several groups have focused on identifying fungal cells (Valentine et al., 2002) and fungal spores (Li, Liu, & Chen, 2000; Chen & Chen, 2005; Kemptner et al., 2009a,b) with MALDI‐TOFMS. Welham et al. (2000) presented the first article on the use of MALDI‐TOFMS with different matrices to characterize various fungal spores. MALDI‐MS has been used to desorb protein biomarkers from intact fungi, and to generate highly reproducible mass spectra for Penicillium species (Hettick et al., 2008b), 12 species of Aspergillus, and five strains of A. flavus (Hettick et al., 2008a). These results indicate that MALDI‐TOFMS data might be used to identify fungi unambiguously at the species and strain levels. Qian et al. (2008) investigated MALDI‐TOF mass signatures for the accurate identification and differentiation of pathogenic Candida species (C. albicans, C. glabrata, C. krusei, C. kefyr), Aspergillus species (A. terreus, A. fumigatus, A. syndowii), and other yeast genera (Cryptococcus neoformans, S. cerevisiae, and Rhodotorula spp.). Marinach‐Patrice et al. (2009) identified 62 clinical Fusarium isolates of nine Fusarium species with partial TEF1 gene sequencing and MALDI‐TOF analysis. Recently, Marklein et al. (2009) demonstrated the identification of more than 250 clinical yeasts and yeast‐like fungi (Candida, Cryptococcus, Saccharomyces, Trichosporon, Geotrichum, Pichia, and Blastoschizomyces spp.) with MALDI‐TOFMS. Cyclic lipopeptides are potential biomarker molecules that can differentiate some microorganisms at the species and even at the subspecies levels (Jegorov et al., 2006; Price et al., 2007).
The challenge in the above approach is that culture conditions and instrumental parameters can significantly influence the spectral reproducibility. Because of the complexity of mass spectral data, many statistical algorithms have been developed to match acquired spectra to reference spectra, or to generate fingerprints for microbial differentiation. The linear correlation of analyzed spectra and library spectra has been performed to differentiate among protein profiles from Bacillus spores (Dickinson et al., 2004). A fingerprint‐selection algorithm that is similar to a statistical test of significance has been used to extract key biomarkers from spectra. The constructed fingerprint library has been used to identify bacterial samples from three different laboratories (Wunschel et al., 2005). Keys et al. (2004) compiled a MALDI mass spectral database of over 100 genera and 350 species to characterize bacteria that are associated with human infectious diseases. Species‐ or subspecies‐specific markers in the spectra were sometimes difficult to identify because the number of overlapping signals increased with the number of strains in the database. Many multivariate analytical (MVA) techniques, including PCA, cluster analysis, and factor analysis, have been applied to analyze the protein profiles of bacterial samples (Chen, Lu, & Harrington, 2008). MVA is based on multivariate statistics, and involves the analysis of several statistical variables (m/z herein) simultaneously. Parisi et al. (2008) demonstrated the PCA classification of two pathogens and the linear discriminant analysis of MALDI‐MS spectra. Hsieh et al. (2008) identified six human pathogens with cluster analysis and genetic algorithms. Ilina et al. (2009) reported on the direct bacterial profiling of two human pathogens, N. meningitidis and N. gonorrboeae. Cluster analysis successfully separated mass spectra of pathogenic and non‐pathogenic Neisseria isolates. Discussion of various mathematic methods used in data analysis has been described elsewhere (Ho & Reddy, 2010).
Protein/Peptide Identification
The top‐down proteomics method identifies intact proteins without the need for prior proteolytic digestion of the sample. The method has been used successfully for microbial proteomics in the analysis of Bacillus spores. Demirev et al. presented results obtained with a top‐down proteomics approach that exploited MALDI‐TOF/TOFMS of protein biomarkers to identify directly and rapidly individual Bacillus spore species, whether they are present alone or in a mixture (Demirev et al., 2005; Wynne et al., 2009). A major advantage of this method is that the MS/MS spectra of biomarkers are obtained without the need for biomarker prefractionation, digestion, separation, or cleanup. The MALDI tandem mass spectra of intact biomarkers are fairly reproducible, and library fingerprint matching of such tandem mass spectra can be exploited to identify intact microorganisms. Top‐down proteomics has been applied to distinguish the pathogenic E. coli strain from the non‐pathogenic strain (Fagerquist et al., 2010). Figure 4 displays an MS/MS spectrum of a protein marker at m/z 7705.6. The protein was identified from its sequence‐specific fragment ions by checking against a database of theoretical fragment ions derived from bacterial proteomes. The protein sequences associated with the identified pathogenic strain and the non‐pathogenic strain differ by only one amino acid (1 Da). The 1 Da difference in protein mass would be difficult to detect with protein fingerprinting.
Figure 4.
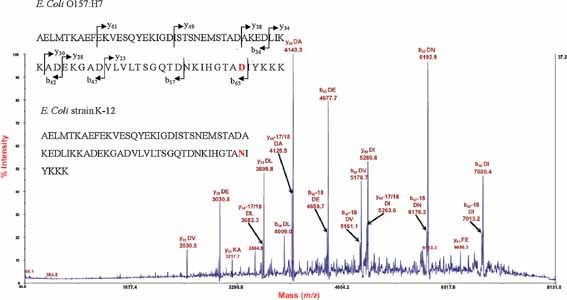
Tandem mass spectrum of a protein marker observed at m/z 7705.6, obtained from the extracted cell lysate of a pathogenic E. coli O157:H7 strain. Many of the fragment ions correspond to backbone cleavage adjacent to aspartic acid (D) and/or glutamic acid (E) residues. The identified protein sequence and the sequence of the non‐pathogenic E. coli K‐12 strain are shown with the spectrum. The two sequences differ by only one amino acid (in bold; aspartic acid vs. asparagine) and, therefore, by only 1 Da in molecular weight. The top‐down proteomics approach can distinguish E. coli O157:H7 from E. coli K‐12. Reprinted and modified with permission from Fagerquist et al. (2010), copyright 2010 American Chemical Society.
In bottom‐up proteomics, proteins from lysed cells are cleaved to form peptides, which are fragmented in a MS/MS experiment. The identification of peptides supports the identification of proteins, which confirms the identification of microorganisms (Demirev, Feldman, & Lin, 2004; Fenselau et al., 2007; Russell, Edwards, & Fenselau, 2007). The protein/peptide identification approach overcomes the challenges of identifying components of mixtures of microorganisms (Warscheid & Fenselau, 2004). Warscheid et al. found that proteolytic digests are generated in situ from SASPs to enable microorganisms to be identified with microsequencing and a database search (English et al., 2003; Warscheid & Fenselau, 2003; Warscheid et al., 2003). SASPs are reliable biomarkers for spore‐forming microorganisms, such as Bacillus and Clostridium species, and allow the identification and differentiation of closely related species (Hathout et al., 2003; Warscheid & Fenselau, 2003; Warscheid et al., 2003). The same group obtained the complete sequences of the three most‐abundant SASPs from B. globigii with MS. They used a combination of MS/MS, chemical derivatization, ladder sequencing, and checking against a database to determine peptide sequences and to construct entire protein sequences (Whiteaker et al., 2004). Unfortunately, several of the identified peptides are common to more than one species of Bacillus, and make difficult the determination of their origin (Warscheid & Fenselau, 2003; Warscheid et al., 2003). This difficulty applies particularly when closely related members of the cereus group (B. anthracis, B. cereus, B. mycoides, and B. thuringiensis) are involved. Furthermore, the determined major SASPs of B. globigii and B. stearothermophilus are almost identical (Whiteaker et al., 2004). Focusing directly on the identification of species‐unique peptide sequences with MALDI‐MS and MS/MS analysis can help to achieve more rapid and automatable species differentiation. Pribil et al. (2005) used the direct scanning of species‐unique SASP tryptic peptides and modified SASP extraction procedures to discriminate between B. anthracis and B. cereus with either MS or MS/MS analysis. In protein‐/peptide‐identification approaches, spectral reproducibility is not critical as long as the observed spectra of the product ions are consistent with the protein/peptides sequences in the database. Positive identification will be hindered if the protein database of the analyzed microorganism does not exist, unless the protein/peptide databases can be constructed from experimental data (Yao, Demirev, & Fenselau, 2002).
Other Biomarkers
Currently, proteins are the most used and accessible biomarkers for microbial identification because of their high‐abundances and gene‐related characteristics. MALDI analysis of biomarkers other than proteins has also been reported. Ishida et al. applied an on‐probe sample pretreatment protocol for the MALDI‐MS measurement of phospholipids in growing bacterial colonies, obtained directly from culture dishes. They successfully observed a series of ions derived from phospholipids in Gram‐negative bacteria (Enterobacteriaceae family) (Ishida et al., 2002). However, the spectra of Gram‐positive bacteria did not include any lipid‐related peaks, presumably because these bacteria have a thicker peptidoglycan layer. Therefore, Ishida et al. (2005) developed a new method for the direct detection of phospholipids in Gram‐positive bacteria (B. subtilis) with MALDI‐MS combined with on‐probe sample pretreatment with trifluoroacetic acid as an additional reagent. They also characterized the phospholipids in whole bacteria with solid‐sampling MALDI‐MS (Ohtani & Ishida, 2007). With MALDI‐FTMS, Jones et al. (2003) investigated E. coli lipids in the low‐mass region (m/z 100–1,000). They identified two major components, phosphatidyl ethanolamine and triglycerides, that are generally found in prokaryotic membranes. The same group described methods for the lipid analysis of S. cerevisiae with conventional MALDI‐FTMS (Jones et al., 2004).
Lipopolysaccharides (LPSs), broadly known as endotoxins, are essential components of the outer membrane of all Gram‐negative bacteria. Bacterial LPSs are dimeric molecules that comprise a polysaccharide moiety linked to a lipid core, termed lipid A, which is anchored within the cell membrane. Therisod, Labas, and Caroff (2001) reported a method for the direct selective extraction and separation of LPSs from bacterial cells with thin‐layer chromatography followed by MALDI‐MS analysis. This method can be used for the direct MS analysis of heterogeneous LPS and lipid A preparations (E. coli lipid A and Bordetella LPSs were used). Tirsoaga et al. (2007) characterized the lipids A from three Citrobacter and two Bordetella strains with a procedure that involved direct extraction from cells followed by MALDI‐MS. This method is especially convenient when only small amounts of bacteria, LPS, or lipid A are available. Schilling et al. (2007) investigated low‐abundance lipid A species from LPS, obtained from Francisella tularensis, F. novicida, and F. philomiragia grown in vitro with a MALDI‐linear ion‐trap mass spectrometer.
BAMS
Bioaerosol mass spectrometry (BAMS) has been used to identify bacteria, spores, and viruses without consuming any reagent (Fergenson et al., 2004; Adams et al., 2008; Russell, 2009). The first attempt at species‐level identification with reagentless BAMS was that of Fergenson et al. This technique has been used to distinguish aerosolized spores of B. thuringiensis and B. atrophaeus from a variety of background mixtures of powders, soil, and fungal spores, by matching the mass spectra with fingerprints of pure samples (Fergenson et al., 2004). A pulse laser at 226 nm was used to desorb and ionize chemicals from the aerosolized particles. They demonstrated that chemical components of the two Bacillus spore species were consistently and easily laser desorbed and detected in seconds. Furthermore, BAMS has been applied to detect Mycobacterium tuberculosis, M. smegmatis (Tobias et al., 2005), and the biochemical and morphological changes of B. atrophaeus cells during the sporulation process (Tobias et al., 2006). Although no sample preparation such as matrix addition was required, the reagentless BAMS mass spectra of microbial cells were limited to signals under m/z 300. Low‐mass biomarkers for B. atrophaeus have also been identified with isotope incorporation and BAMS (Czerwieniec et al., 2005; Srivastava et al., 2005).
Stowers et al. reported on the real‐time and high‐mass detection of individual airborne pathogens with MALDI aerosol TOFMS (Stowers et al., 2000; van Wuijckhuijse et al., 2005). Aerosol MALDI‐MS can help detect high‐mass biomolecules and identify bacteria or other biological microparticles from their fingerprints. In aerosol MALDI, the matrix is introduced via either condensation or deposition on a matrix‐coated target (Noble & Prather, 2000). Aerosol MALDI differs from classical MALDI in a number of important ways (The differences include optimal laser fluence, matrix‐to‐analyte molar ratio, and choice of matrix.), and not just in the analytes (McJimpsey et al., 2008). Stowers et al. described the analysis of biological aerosol particles with MALDI‐TOFMS, and applied this method to B. subtilis spores. They observed a single biomarker ion at ca. m/z 1225 that was attributed to a peptidoglycan (Stowers et al., 2000). A new aerosol TOFMS instrument, which is used with laser‐induced fluorescence selection and MALDI, has been developed for the real‐time analysis of single bioaerosol particles. MALDI ionization is triggered when fluorescent emission from microorganisms is observed. The instrument can be used to measure the molecular masses of biomarker ions of bacteria and aerosolized proteinaceous materials up to 20 kDa (van Wuijckhuijse et al., 2005). In more recent studies, Kleefsman et al. used single‐particle MALDI to detect E. coli (Kleefsman et al., 2008) and Erwinia herbicola cells (Kleefsman et al., 2007). They stated that the instrument efficiency could be improved by the selective ionization of biological particles, following the observation of single‐particle fluorescence (Stowers et al., 2006; Kleefsman et al., 2007). Although useful spectra of a few thousands of particles containing bacteria such as E. herbicola have been obtained (Kleefsman et al., 2007), improvements in detection limit are still required for the analysis of real‐world samples.
SELDI‐MS
Surface‐enhanced laser desorption/ionization (SELDI), a modified version of MALDI‐TOFMS, has been successfully used for biomarker discovery and protein fingerprinting of bacterial species (Barzaghi et al., 2004; Lancashire et al., 2005; Lundquist et al., 2005; Schmid et al., 2005; Al Dahouk et al., 2006). Hutchens et al. first described the original concept of SELDI (Hutchens & Yip, 1992; Hutchens et al., 1992). SELDI‐MS provided protein expression patterns from hundreds of samples in a single experiment (Thulasiraman et al., 2000; Diamond et al., 2003; Barzaghi et al., 2004). It is an affinity‐based MS method in which proteins are selectively adsorbed onto a chemically or biochemically modified surface. Seo, Kim, and Chai (2004) studied the protein‐expression profile in human macrophages that were infected by B. anthracis spores with SELDI‐TOFMS. Lundquist et al. (2005) demonstrated that SELDI‐TOFMS can generate unique and reproducible protein profiles for F. tularensis subspecies, to allow its subspecies to be distinguished from each other. Similarly, Seibold et al. (2007) identified single strains of the subspecies F. tularensis with SELDI‐MS. Huang and co‐workers proposed a method based on SELDI‐MS to identify Klebsiella pneumoniae and other related microorganisms by directly analyzing bacterial colonies without any protein extraction (Xiao et al., 2009).
Because SELDI might yield many ion signals per bacterial sample, computer algorithms used in MALDI protein fingerprinting are also employed to identify useful biomarkers for bacterial identification. Seibold et al. (2007) differentiated single strains within the subspecies F. tularensis by combining SELDI‐TOFMS with cluster analysis and PCA. The artificial neural network (ANN) algorithm has been combined with SELDI‐MS to identify N. meningitides (Lancashire et al., 2005; Schmid et al., 2005) and Neisseria gonorrhoeae (Schmid et al., 2005). Schmid et al. analyzed over 350 strains of N. gonorrhoeae, other neisseriae, and closely related species such as Kingella denitrificans and Moraxella osloensis. They performed comparative 16S rDNA sequence analysis and standard biochemical tests to establish the identity of the strains prior to SELDI‐MS analysis (Schmid et al., 2005). ANN is an algorithm for machine learning, and represents a mathematical method that is not based on multivariate statistics. In the ANN method, the relative abundances at all m/z values are input to the input layer of the model. The model is trained, tested, and validated with bacterial samples. This approach has been applied to a blind dataset of 188 samples, and correctly identified 184 out of 188 samples (Lancashire et al., 2005). Yates et al. analyzed the volatile compounds of pathogens with quadrupole MS. Radial‐basis function neural networks successfully identified the unknown bacterial samples (Yates et al., 2005). SELDI‐MS allows more selective analysis of protein profiles than does direct MALDI‐MS. Useful markers might be selectively extracted and analyzed. The surface capacity of a SELDI probe plays an important role in the detection of markers. The capacity depends on the number of interacting groups and even the size of the markers. The markers that the SELDI surface captures are usually the abundant ones possessing specific interacting functional groups. Further, the ionization efficiencies of various molecules also determine the molecules detected in a mass spectrum. In microbial analysis, because SELDI is generally used to obtain proteomic fingerprints from microbial samples, the fingerprint data are useful as long as they are reproducible. However, just as for MALDI analysis, spectral reproducibility remains a key challenge in this approach.
Other Techniques
Ambient Mass Spectrometric Methods
Ambient mass spectrometric methods such as DESI (Takats et al., 2004) and DART (Cody, Laramee, & Durst, 2005) have recently been applied to examine microbial samples with little or no sample preparation in an attempt accurately and rapidly to type closely related strains of bacteria. DART‐MS has been successfully applied to the analysis of fatty‐acid methyl ester profiles from bacterial cells (Pierce et al., 2007). The ionization process involves an interaction between electronically excited atoms or vibronically excited molecules and the analytes that are obtained by the thermal hydrolysis and methylation of bacterial lipids. Takats et al. used the DESI method to identify microorganisms by spraying microbial samples with electrosprayed solvent droplets. This technique has been used to differentiate among several bacteria species based on their DESI‐mass spectral profiles (Meetani et al., 2007; Song et al., 2009). The bacteria include E. coli, S. aureus, Enterococcus sp., Bordetella bronchiseptica, B. thuringiensis, B. subtilis, and Salmonella typhimurium. High‐quality mass spectra have been obtained in positive‐ and negative‐ion modes when whole bacteria were subjected to DESI (Meetani et al., 2007). The same approach has also been applied to the phospholipid profiling of intact bacteria (Song et al., 2007). Recently, Song et al. (2009) applied DESI‐MS to the analysis of untreated B. subtilis in an in vivo experiment.
Pyrolysis‐GC‐MS
Pyrolysis mass spectrometry (Py‐MS) analyzes microorganisms from their pyrolysate fingerprint after decomposition of their biochemical components by heating to high temperature (Wilkes et al., 2005). In Curie point pyrolysis, pure microbial cultures are dried in a suitable alloy foil and heated rapidly to the Curie point of the foil. The pyrolysates are immediately swept into a mass spectrometer and identified based on their m/z ratio. Then, the fingerprint or chemical profile of the pyrolysis mass spectrum is analyzed by suitable mathematic methods to differentiate pathogens. The first automated Curie‐point Py‐MS was developed by Meuzelaar et al. specifically for fingerprinting complex non‐volatile biological samples such as bacteria (Meuzelaar & Kistemaker, 1973; Meuzelaar et al., 1976). The mass spectra of pyrolysates are usually complicated because many large biomolecules decompose into small fragments. The cell envelopes of many bacteria have been analyzed, and various separation methods, such as HPLC, GC, and thin layer chromatography, have been developed for use with Py‐MS. So far, however, only Py‐GC‐MS has been commercially developed into a microbial identification system. Py‐GC and Py‐GC‐MS techniques allow for rapid volatilization, separation, and identification of pyrolysis products (Snyder et al., 2004; Sobeih, Baron, & Gonzalez‐Rodriguez, 2008). In Py‐GC and Py‐GC‐MS, high‐resolution gas‐chromatographic separation is carried out in a capillary column, and mass spectrometric identification can be improved with either soft‐ionization methods or tandem MS (Sobeih, Baron, & Gonzalez‐Rodriguez, 2008).
Pyrolysis products that derive from carbohydrates (Abbas‐Hawks, Voorhees, & Miketova, 2006), lipids (Voorhees et al., 2006b), nucleic acids (Abbas‐Hawks, Voorhees, & Miketova, 2006), proteins (Voorhees, Abbas‐Hawks, & Miketova, 2006a), and other components, such as dipicolinic or poly(3‐hydroxyalkanoic) acids, have been utilized to differentiate bacteria. Goodacre et al. (2000) detected the dipicolinic acid biomarker in 36 Bacillus species with Py‐MS. An ion‐mobility spectrometer (IMS) has been employed as a detector in the Py‐GC analysis of bacteria in the on‐site monitoring of transient plumes of aerosols that contain B. subtilis (Snyder et al., 2004). Dworzanski et al. (2005) reported on the use of the Py‐GC‐IMS system to identify Gram‐negative Pantoea agglomerans and Gram‐positive B. anthracis strain Texas and B. atrophaeus. They identified pyridine‐2‐carboxamide (2‐picolinamide) from the cell walls of Gram‐positive bacteria. They characterized the envelopes of Gram‐negative bacteria by the presence of a second membrane, with the outer leaflet composed mainly of LPS molecules anchored with a lipid A moiety. These biomarkers include pyrolysis products of the 3‐hydroxymyristate fatty‐acid residues, such as 1‐tridecene, dodecanal, and methylundecylketone. The same group detected and classified deliberately released bioaerosols (Gram‐positive and ‐negative bacteria) in outdoor‐field scenarios. They identified 2‐pyridinecarboxamide in Bacillus samples, including B. anthracis, whose origin was traced to the peptidoglycan macromolecule in the cell wall. Py‐GC‐MS analyses of Gram‐negative E. coli revealed significant amounts of 3‐hydroxymyristic acid derivatives and degradation products (Snyder et al., 2004). Voorhees et al. used high‐resolution Py‐MS to identify different Gram‐type whole‐cell microorganisms. Twelve bacterial species were analyzed in triplicate. Gram‐positive bacteria (B. cereus, B. subtilis, B. anthracis, E. faecalis, S. epidermidis, and S. pyogenes) were identified mainly by their carbohydrate biomarker peaks, whereas Gram‐negative bacteria (E. aerogenes, Proteus mirabilis, P. aeruginosa, Serratia marcescens, Brucella neotomae, and F. tularensis) yielded mainly lipid‐biomarker peaks (Miketova et al., 2003). In many of the studies referred to above, multivariate statistics were used to analyze the pyrolysis mass spectra. For instance, PCA has been applied to differentiate Salmonella and Vibrio species from their pyrolysis mass spectra (Wilkes et al., 2006).
Pyrolysis methods, such as thermally assisted hydrolysis and methylation (THM) in the presence of tetramethylammonium hydroxide [TMAH; (CH3)4NOH], have been widely used in the direct analysis of fatty‐acid components of lipids in whole‐bacterial cells (David, Tienpont, & Sandra, 2008; Cha et al., 2009). Recently, phospholipids were directly identified on whole cells of E. coli with THM‐GC in the presence of TMAH and MALDI‐MS, with on‐probe sample pretreatment without the need for any tedious sample preparation (Ishida et al., 2006).
ICP‐MS/SIMS
Inductively coupled plasma mass spectrometry (ICP‐MS) has been used in the chemical characterization of trace and ultratrace elements in biological materials, such as bacteria, fungi, and viruses (Zhang et al., 2003; Gikunju et al., 2004; Jackson, Ranville, & Neal, 2005; Li, Armstrong, & Houk, 2005; Beauchemin, 2006). Knowledge of the amounts of these trace elements and their speciation is important to understand the toxicological behavior of organisms. ICP‐MS has several attractive features for trace element studies, including rapid multi‐element analysis and very good detection limits of bacteria in suspension (Gikunju et al., 2004). The detection and identification of B. subtilis spores, B. subtilis vegetative cells, and B. thuringiensis with an inorganic‐chemical fingerprint obtained with direct injection ICP‐MS might be useful to detect biological‐warfare agents (Gikunju et al., 2004). This method reveals unique chemical signatures that reflect the processing history of each Bacillus organism.
Cliff et al. demonstrated the use of TOF secondary‐ion mass spectrometry (SIMS) to identify B. subtilis spores that were grown in various media, based on their elemental signatures. The TOF‐SIMS signatures consist of 16 elemental intensities (Cliff et al., 2005). Thompson et al. used TOF‐SIMS to distinguish between spores and vegetative bacterial cells of B. megaterium. The differentiation was based on the surface‐lipid profiles (Thompson et al., 2004).
MS of Nucleic Acids
Nucleic acid‐based techniques for microbial analysis rely on the genetic conservation within a species and genetic variability among species. Although conventional biochemical analysis remains an important method in clinical microbiology laboratories, nucleic acid‐based methods have become popular in diagnostic microbiology. Genotyping methods to analyze nucleic acids might involve hybridization, primer extension, ligation, and cleavage, or a combination thereof (Monis & Giglio, 2006; Mothershed & Whitney, 2006; Klouche & Schroder, 2008). The device to read out the measurements can be a gel reader, a plate reader, or an array reader, among others. MALDI‐MS is considered to be an alternative tool to sequence DNA. However, some technical problems, such as adduct formation and limited sequence length, have led to the use of MS primarily to analyze DNA fragment profiles or single nucleotide polymorphisms (SNPs). ESI‐MS can detect large and multiply charged PCR products (Mayr et al., 2005). Therefore, accurate masses of the PCR products, obtained with high‐resolution ESI‐MS, have been used to determine their base compositions (Ecker et al., 2005). Generally, the mass spectra of nucleic acid products or their fragments are matched with theoretical ones in nucleic acid sequence databases to identify the species. The advantage and disadvantages of genotyping methods have been reviewed elsewhere (Sobrino, Brion, & Carracedo, 2005). PCR‐amplification methods are able to detect a few tens of microbial cells and might be applied to the analysis of non‐culturable microorganisms. The major procedures for microbial analysis include cell lysis, DNA extraction, amplification, and PCR‐product analysis. The sample workup time may be less than that for conventional culturing methods. Notably, some procedures are labor‐intensive and the PCR techniques might require additional steps to remove potential inhibitors from samples. The major advantage of using a mass spectrometer as a read‐out device, in addition to the speed of analysis, is its ability to measure masses of oligonucleotides. The molecular mass that is directly related to the nucleotide composition is more accurate than other sequence‐related parameters such as migration times.
Because the 16 S rRNA gene is universally distributed and highly conserved, it has been widely used to differentiate microbial species. Restriction‐fragment patterns are obtained from digestion of the PCR products with restriction enzymes. The reduced size of the digested PCR products also favors ionization and mass analysis. MALDI‐MS has been successfully applied to differentiate microbial species by profiling the restriction digests of DNA (Taranenko et al., 2002). This method can detect hepatitis B and C viruses (HBV and HCV) in human‐serum samples (Hong et al., 2004; Kim et al., 2005; Oh et al., 2008). It has been used to analyze as few as 100 copies of hepatitis B virus gene per milliliter of serum and differentiated among wild‐type and variant viruses (Ho et al., 2004). The limitation of these approaches in accurate microbial identification is the resolution of length heterogeneities of marker genes among species. von Wintzingerode et al. (2002) developed a method of microbial identification with the base‐specific cleavage of PCR products. Amplification of 16S rDNA marker sequences was followed by enzyme‐mediated fragmentation at T‐specific sites. The base‐specific cleavage yielded useful species‐specific fragments, and allowed differentiation of several cultured Bordetella species and as‐yet‐uncultured bacteria. Another comparative‐sequencing method, multilocus sequence typing (MLST), was used to analyze N. meningitides by comparing the MALDI spectra of MLST loci to reference sequences in the public MLST database (Honisch et al., 2007). This method is based on PCR of several housekeeping genes. The variations in the sequences of multiple loci that are derived from base‐specific RNA cleavage support the identification of pathogens.
The homogeneous base‐specific cleavage of PCR‐amplified and transcribed 16S rRNA gene was analyzed with MALDI‐MS to identify mycobacteria at the species level (Lefmann et al., 2004). The MALDI‐MS analysis of RNA is superior to that of DNA because RNA that is transcribed from DNA is more stable. The 2′ OH group on the sugar ring reduces N‐glycosylic bond fragmentation (Tang, Zhu, & Smith, 1997; Tost & Gut, 2006).
Single nucleotide polymorphisms (SNPs) represent single base changes that occur at a specific position in a genome. The MALDI mass spectra obtained from eight SNPs in the precore/basal core promoter of HBV were used to differentiate wild‐type and mutant samples (Lau et al., 2007). The PCR extension of primers that were designed to be annealed at the polymorphic site yielded distinguishable genotype‐specific SNPs, even though their mass differences were in a narrow range of 9–24 Da. An SNP within the fumC gene was found to differentiate between the hypervirulent ET‐15 strain and other ET‐37 complex strains of N. meningitidis (Lowe, Diggle, & Clarke, 2004). Ilina et al. (2005) employed a similar MALDI‐MS approach to genotype HCV from HCV‐positive blood sera or plasma. They designed three oligonucleotide primers to detect two sets of genotype‐specific SNPs. The proposed method was an accurate and efficient method for HCV genotyping based on minisequencing. Although the occurrence of novel mutations limits the use of genotypic methods based on single nucleotide differences between strains, genotypic assays with base‐specific cleavage strategies detect new strains.
A method called Triangulation Identification for the Genetic Evaluation of Risks (TIGER), to analyze microbial mixtures, has been proposed (Ecker et al., 2008). The bacterium B. anthracis, the Poxyviridae family, Alphaviruses (Hofstadler et al., 2005), Acinetobacter species (Ecker et al., 2006), adenovirus (Russell et al., 2006), Campylobacter species (Hannis et al., 2008), and the Enterobacteriaceae family (Baldwin et al., 2009) were successfully identified with this approach. It uses high‐resolution ESI‐FT‐ICR/‐TOF MS to analyze multiple PCR products to allow the base compositions (A, T, G, and C, base counts) obtained from multiple primer pairs to be accurately deduced. Figure 5 shows the process. The first step involves extraction of all nucleic acids that are present in a sample. Aliquots of the nucleic‐acid solution are amplified with various primers. The PCR primers target universally distributed and highly conserved regions of microbial genes (such as 16S and 23S DNA). The second step is to use MS to measure accurately the masses of the PCR products in a size range of around 100 bp (and a mass of ca. 30 kDa). These base compositions are employed to “triangulate” the identities of most pathogens. Additional primers that are targeted to variable regions of specific microbial genomes are used in the high‐resolution genotyping of specific species. To deduce the base compositions based on the mass of PCR products, use of mass spectrometers with high mass accuracy is a must.
Figure 5.
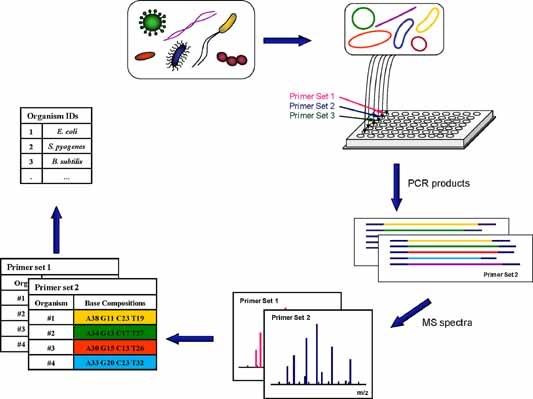
PCR‐MS approach‐TIGER: Aliquots of nucleic acids present in a sample are deposited into wells of a micro‐titer plate to begin PCR. Each well contains a pair of broad‐range primers that target a selected domain of microorganisms. PCR products are desalted and electrosprayed into a high‐resolution mass spectrometer to determine their base compositions. The combined base compositions from multiple PCR reactions (multiple primer sets) support the identification of microorganisms in a sample. [Color figure can be viewed in the online issue, which is available at wileyonlinelibrary.com]
This PCR‐ESI‐MS approach has also been used to detect and type the strains of S. aureus isolates (Hall et al., 2009; Wolk et al., 2009), a diverse collection of human and avian influenza viruses (Sampath et al., 2007b), orthopoxviruses (Eshoo et al., 2009), and more recently, Ehrlichia species from patients suspected of having ehrlichiosis (Eshoo et al., 2010).
APPLICATIONS
Mass spectrometry (MS) is poised to take an increasingly important role in clinical chemistry (Ho & Reddy, 2010; Marvin, Roberts, & Fay, 2003), environmental monitoring, and biodefense (Demirev & Fenselau, 2008b). Because mass analyzers provide flexibility, sensitivity, specificity, and rich information (qualitative/quantitative), various MS‐based methods have been used for accurate microbial identification. As mentioned above, each method has its strength and weaknesses. MALDI‐MS is a rapid, sensitive, simple method. Therefore, it is very suitable for direct biomarker profiling of microorganisms. However, experimental parameters should be carefully controlled to obtain reproducible spectra. MALDI‐MS/MS (top‐down or bottom‐up approaches) might avoid the reproducibility problems by analyzing sequence information of specific biomarkers. LC (CE)‐MS/MS separates and analyzes biomarkers such as proteins or peptides belonging to a microorganism and provides accuracy and selectivity. Although the speed of analysis is reduced, microbial mixtures can be analyzed without culture isolation. PCR‐MS provides the best detection limit and might indentify non‐culturable microorganisms. However, designing primers requires knowledge of target nucleic acid sequences and the sample workup steps can be labor‐intensive. In general, the MS‐based approaches require less time for microbial analysis than most conventional methods. This section provides some examples of MS application.
Direct MALDI‐TOFMS analysis of intact bacteria cells might differentiate different bacterial species or subspecies in many clinical‐microbiology laboratories (Carbonnelle et al., 2007; Eigner et al., 2009; La Scola & Raoult, 2009; Reich et al., 2009). Degand et al. (2008) identified non‐fermenting bacilli that were recovered from cystic‐fibrosis patients with protein fingerprinting. MALDI‐MS protein profiles obtained have been used to differentiate methicillin‐resistant S. aureus (MRSA) and methicillin‐susceptible S. aureus (MSSA), which are responsible for various hospital‐acquired infections (Edwards‐Jones et al., 2000; Du et al., 2002). The strain‐specific MALDI‐TOFMS differentiation has been demonstrated with intact cells from 20 Staphylococcal isolates, to rapidly distinguish between the MRSA and MSSA and, therefore, to support the proper treatment of S. aureus infections in light of their resistance to antibiotics (Edwards‐Jones et al., 2000). The direct MALDI‐MS analysis of bacterial colonies has been used for the routine identification of 1,660 bacterial isolates collected from clinical specimens. Identification was quick; 95.4% of isolates were correctly identified with MALDI‐TOFMS; 84.1% were identified at the species level, and 11.3% were identified at the genus level. The average delay and cost of MALDI‐MS identification for routine use in clinics have been evaluated in detail (Seng et al., 2009). The delay was less than 10 min, and excluded the cultivation time in agar media.
Fenselau et al. (2008) detected beta‐lactamase in antibiotic‐resistant strain B. cereus spores with MALDI‐TOFMS. This protein marker might be used for the rapid preliminary detection of the resistance of B. cereus spores to antibiotics. Demirev et al. (2001) obtained positive‐ and negative‐ion spectra of proteins that were desorbed from Helicobacter pylori 26995 cells, a strain of bacteria that has been implicated in the development of gastrointestinal ulcers. Seventeen clinical and two laboratory strains of H. pylori have been analyzed from the direct protein‐fingerprinting method for quick species identification (Ilina et al., 2010). MALDI‐TOFMS has also been used to detect and identify Legionella species (which cause Legionellosis disease) (Pennanec et al., 2010) and human pathogens such as Bacteroides fragilis, which is frequently misidentified with phenotypical identification procedures (Nagy et al., 2009). SELDI‐TOF MS has been used to analyze 273 strains of staphylococci and other species isolated in a clinical‐microbiology laboratory (Yang et al., 2009). The authors demonstrated that SELDI‐TOFMS protein profiles of microorganisms include protein peaks that can be used to identify bacteria. Laser desorption ionization (LDI) MS has been applied to the detection of Plasmodium falciparum in blood samples from pregnant women (Nyunt et al., 2005). P. falciparum is a malaria‐causing protozoan. LDI of hemozoin inside the parasites generated heme ion and its fragment ions. MS detection of these marker ions represents malaria infection (Demirev et al., 2002; Demirev, 2004; Scholl et al., 2004).
Tuberculosis (TB) is an infectious disease that is caused by the Gram‐positive bacteria M. tuberculosis. M. tuberculosis is often associated with the human immunodeficiency virus (HIV) and acquired immunodeficiency syndrome (AIDS), which has led to the increased prevalence of pulmonary TB worldwide. Recently, GC‐MS analysis of derivatized fatty acids obtained from microbial cells has been used for the rapid diagnosis of pulmonary TB in clinical‐microbiology laboratories (Stopforth et al., 2005; Cha et al., 2009). GC‐MS has also been used for the fast and accurate identification of M. tuberculosis in cultures and sputum samples that were collected from patients who were suspected to be suffering from TB (Cha et al., 2009; Kaal et al., 2009). The results show that tuberculosis stearic acid was detected only in the sputum specimens from patients who were clinically diagnosed with TB. Hu et al. applied selective CE‐MS/MS to identify specific pathogens in clinical specimens that had been collected from pus, wound, sputum, and urine samples. The bacteria in these clinical specimens were cultivated directly, without prior isolation of a pure colony, before the selective MS/MS analyses were performed. The total time taken to perform the analysis, including fast protein digestion and MS analysis, was 30 min, and the cultivation time was 6 hr. The identified pathogens included many species such as P. aeruginosa, S. aureus, and S. agalactiae (Hu et al., 2006).
Polymerase chain reaction‐mass spectrometry (PCR‐MS) has been used to detect/identify infectious pathogens (Fox, 2006; Sampath et al., 2007a; Eshoo et al., 2010; Fabris, 2010). The detection of SNPs with a MALDI‐MS‐based minisequencing method has been used to identify hepatitis B virus in HBsAg‐positive patients with chronic hepatitis B (Malakhova et al., 2009) and to detect drug resistance‐related mutations in N. gonorrhoeae (Vereshchagin et al., 2005) and M. tuberculosis (Ikryannikova et al., 2007). The same method has been successfully applied to the rapid detection of clinically significant TEM‐type extended‐spectrum beta‐lactamases in clinical strains of E. coli and Klebsiella pneumonia (Ikryannikova et al., 2008). Faix, Sherman, and Waterman (2009) used PCR and ESI‐MS to classify swine‐origin influenza A (H1N1) viruses (S‐OIV). Data from numerous outbreak sites indicate that the novel influenza A/H1N1 virus is currently the dominant influenza strain in most parts of the world.
Ecker's research group identified the genotypes of bacteria in complex mixtures of clinical samples, by performing a base‐composition analysis of PCR‐amplification products with high‐resolution ESI‐MS. They employed this approach to identify quinolone resistance in Acinetobacter spp., whose quinolone resistance is mediated by mutations in the quinolone resistance‐determining DNA sequences of two essential housekeeping genes (Hujer et al., 2009). The results provide important information for the therapeutic treatment of Acinetobacter spp. infection. Analysis of respiratory samples collected during respiratory disease outbreaks revealed high concentrations of pathogenic respiratory species, including Haemophilus influenzae, N. meningitidis, and S. pyogenes (Ecker et al., 2005). This approach has been used to identify 14 isolates of nine diverse Coronavirus spp., including the severe acute respiratory syndrome (SARS)‐associated coronavirus. The detection limit was one plaque‐forming‐unit per mL of human serum (Sampath et al., 2005).
CONCLUSIONS
Recent outbreaks, including the SARS outbreak that was caused by coronavirus and the H1N1 flu outbreak that was caused by a novel influenza A virus, as well as some biothreat incidents, reveal the importance to develop more rapid, sensitive, and accurate real‐time detection methods. MS has been successfully applied to the analysis of biomarkers from microbial samples. Many advanced methods for microbial analysis have been proposed. The MALDI‐MS fingerprinting of microorganisms has a number of advantages, including rapidity and ease of implementation. Construction of a large reference spectral library and the use of a fingerprint‐selection algorithm are critical to the success of the fingerprinting approach because of the complexity and the lack of reproducibility of microbial mass spectra obtained from real‐world samples. Identification of microorganisms through the sequence analysis of peptide or proteins markers might solve the problems associated with spectral reproducibility. Top‐down or bottom‐up protein identification methods can be used to analyze sequence information. Although the proteomic methods are limited by the number of available proteome databases, more and more microbial proteomes have been revealed and should broaden the applicability of these approaches in microbial analysis. Top‐down methods directly characterize proteins, and are, therefore, quick and simple. In bottom‐up approaches, the complexity of microbial biomarkers might be simplified with various chromatography‐based methods; although separation processes reduce the speed of identification, they provide significantly improved accuracy and selectivity. Furthermore, because the dynamic range is also increased, even a small amount of microorganisms in complex sample matrices can be identified. Most current microbial analysis methods require the culturing of the target cells to obtain detectable signals. The culturing time is by far the rate‐limiting step in rapid microbial identification. Reducing the detection threshold for microbial cells will be one of the major challenges in the future. Methods and instrumentation must both be improved to reach this goal. Cell enrichment through affinity techniques will also be important. Selective biomarker analysis with multiple reaction monitoring approaches coupled with affinity techniques will enhance the sensitivity and accuracy of microbial identification. The MS detection of PCR products from microbial genes might be an alternative means to improve the detection limit, especially in analyses of non‐culturable microorganisms. Advances in MS instrumentation and methods shall support a simple and accurate means of pathogen identification for environmental monitoring and clinical diagnosis.
ABBREVIATIONS
- 2DGE
two‐dimensional gel electrophoresis
- ANN
artificial neural network
- BAMS
bioaerosol mass spectrometry
- BHPs
bacteriohopanoids or bacteriohopanepolyols
- CFU
colony forming unit
- DART
direct analysis in real time
- DESI
desorption electrospray ionization
- ELDI
electrospray‐assisted laser desorption ionization mass spectrometry
- ESI
electrospray ionization
- FA
ferulic acid
- HBV
hepatitis B virus
- HCCA
α‐cyano‐4‐hydroxycinnamic acid
- HCV
hepatitis C virus
- ICP
inductively coupled plasma mass spectrometry
- IgG
immunoglobulin G
- LDI
Laser desorption ionization
- MALDI
matrix‐assisted laser desorption/ionization
- MLST
multilocus sequence typing
- MRSA
methicillin‐resistant S. aureus
- MS
mass spectrometry
- MSSA
methicillin‐susceptible S. aureus
- MVA
multivariate analysis
- PCA
principal component analysis
- PCR
polymerase chain reaction
- Py‐MS
Pyrolysis mass spectrometry
- SA
sinapinic acid
- SARS
severe acute respiratory syndrome
- SELDI
surface‐enhanced laser desorption/ionization
- SIMS
secondary ion mass spectrometry
- SNPs
single nucleotide polymorphisms
- SPA
selective proteotypic peptide analysis
- TB
tuberculosis
- THM
thermally assisted hydrolysis and methylation
- TIGER
Triangulation Identification for the Genetic Evaluation of Risks
- TMAH
tetramethylammonium hydroxide
Acknowledgements
We thank the National Science Council of the Republic of China for financially supporting part of the work mentioned in this review.
REFERENCES
- Abbas‐Hawks C, Voorhees KJ, Miketova P. 2006. Identification of carbohydrate and nucleic acid biomarkers in the pyrolysis electron ionization‐high‐resolution mass spectrum of Brucella neotomae . J Anal Appl Pyrol 76: 6–13. [Google Scholar]
- Adams KL, Steele PT, Bogan MJ, Sadler NM, Martin SI, Martin AN, Frank M. 2008. Reagentless detection of mycobacteria tuberculosis H37RA in respiratory effluents in minutes. Anal Chem 80: 5350–5357. [DOI] [PubMed] [Google Scholar]
- Afonso C, Fenselau C. 2003. Use of bioactive glass slides for matrix‐assisted laser desorption/ionization analysis: Application to microorganisms. Anal Chem 75: 694–697. [DOI] [PubMed] [Google Scholar]
- Al Dahouk S, Nockler K, Scholz HC, Tomaso H, Bogumil R, Neubauer H. 2006. Immunoproteomic characterization of Brucella abortus 1119‐3 preparations used for the serodiagnosis of Brucella infections. J Immunol Methods 309: 34–47. [DOI] [PubMed] [Google Scholar]
- Anhalt JP, Fenselau C. 1975. Identification of bacteria using mass spectrometry. Anal Chem 47: 219–225. [Google Scholar]
- Baldwin CD, Howe GB, Sampath R, Blyn LB, Matthews H, Harpin V, Hall TA, Drader JJ, Hofstadler SA, Eshoo MW, Rudnick K, Studarus K, Moore D, Abbott S, Janda JM, Whitehouse CA. 2009. Usefulness of multilocus polymerase chain reaction followed by electrospray ionization mass spectrometry to identify a diverse panel of bacterial isolates. Diagn Microbiol Infect Dis 63: 403–408. [DOI] [PubMed] [Google Scholar]
- Banoub JH, Newton RP, Esmans E, Ewing DF, Mackenzie G. 2005. Recent developments in mass spectrometry for the characterization of nucleosides, nucleotides, oligonucleotides, and nucleic acids. Chem Rev 105: 1869–1915. [DOI] [PubMed] [Google Scholar]
- Barzaghi D, Isbister JD, Lauer KP, Born TL. 2004. Use of surface‐enhanced laser desorption/ionization‐time of flight to explore bacterial proteomes. Proteomics 4: 2624–2628. [DOI] [PubMed] [Google Scholar]
- Beauchemin D. 2006. Inductively coupled plasma mass spectrometry. Anal Chem 78: 4111–4135. [DOI] [PubMed] [Google Scholar]
- Berger B, Hölzl G, Oberacher H, Niederstätter H, Huber CG, Parson W. 2002. Single nucleotide polymorphism genotyping by on‐line liquid chromatography‐mass spectrometry in forensic science of the y‐chromosomal locus m9. J Chromatogr B 782: 89–97. [DOI] [PubMed] [Google Scholar]
- Berry CC, Curtis ASG. 2003. Functionalisation of magnetic nanoparticles for applications in biomedicine. J Phys D: Appl Phys 36: R198–R206. [Google Scholar]
- Bodzon‐Kulakowska A, Bierczynska‐Krzysik A, Dylag T, Drabik A, Suder P, Noga M, Jarzebinska J, Silberring J. 2007. Methods for samples preparation in proteomic research. J Chromatogr B 849: 1–31. [DOI] [PubMed] [Google Scholar]
- Bundy J, Fenselau C. 1999. Lectin‐based affinity capture for MALDI‐MS analysis of bacteria. Anal Chem 71: 1460–1463. [DOI] [PubMed] [Google Scholar]
- Bundy JL, Fenselau C. 2001. Lectin and carbohydrate affinity capture surfaces for mass spectrometric analysis of microorganisms. Anal Chem 73: 751–757. [DOI] [PubMed] [Google Scholar]
- Cain TC, Lubman DM, Weber WJ. 1994. Differentiation of bacteria using protein profiles from matrix‐assisted laser desorption ionization time‐of‐flight mass spectrometry. Rapid Commun Mass Spectrom 8: 1026–1030. [Google Scholar]
- Carbonnelle E, Beretti J‐L, Cottyn S, Quesne G, Berche P, Nassif X, Ferroni A. 2007. Rapid identification of staphylococci isolated in clinical microbiology laboratories by matrix‐assisted laser desorption ionization‐time of flight mass spectrometry. J Clin Microbiol 45: 2156–2161. [DOI] [PMC free article] [PubMed] [Google Scholar]
- Castanha ER, Vestal M, Hattan S, Fox A, Fox KF, Dickinson D. 2007. Bacillus cereus strains fall into two clusters (one closely and one more distantly related) to Bacillus anthracis according to amino acid substitutions in small acid‐soluble proteins as determined by tandem mass spectrometry. Mol Cell Probes 21: 190–201. [DOI] [PubMed] [Google Scholar]
- Cha D, Cheng D, Liu M, Zeng Z, Hu X, Guan W. 2009. Analysis of fatty acids in sputum from patients with pulmonary tuberculosis using gas chromatography‐mass spectrometry preceded by solid‐phase microextraction and post‐derivatization on the fiber. J Chromatogr A 1216: 1450–1457. [DOI] [PubMed] [Google Scholar]
- Chen HY, Chen YC. 2005. Characterization of intact Penicillium spores by matrix‐assisted laser desorption/ionization mass spectrometry. Rapid Commun Mass Spectrom 19: 3564–3568. [DOI] [PubMed] [Google Scholar]
- Chen P, Lu Y, Harrington PB. 2008. Biomarker profiling and reproducibility study of MALDI‐MS measurements of Escherichia coli by analysis of variance‐principal component analysis. Anal Chem 80: 1474–1481. [DOI] [PubMed] [Google Scholar]
- Chen WJ, Tsai PJ, Chen YC. 2008. Functional Fe3O4/TiO2 core/shell magnetic nanoparticles as photokilling agents for pathogenic bacteria. Small 4: 485–491. [DOI] [PubMed] [Google Scholar]
- Chen WJ, Tsai PJ, Chen YC. 2008. Functional nanoparticle‐based proteomic strategies for characterization of pathogenic bacteria. Anal Chem 80: 9612–9621. [DOI] [PubMed] [Google Scholar]
- Chong BE, Kim J, Lubman DM, Tiedje JM, Kathariou S. 2000. Use of non‐porous reversed‐phase high‐performance liquid chromatography for protein profiling and isolation of proteins induced by temperature variations for Siberian permafrost bacteria with identification by matrix‐assisted laser desorption lionization time‐of‐flight mass spectrometry and capillary electrophoresis‐electrospray ionization mass spectrometry. J Chromatogr B 748: 167–177. [DOI] [PubMed] [Google Scholar]
- Cliff JB, Jarman KH, Valentine NB, Golledge SL, Gaspar DJ, Wunschel DS, Wahl KL. 2005. Differentiation of spores of Bacillus subtilis grown in different media by elemental characterization using time‐of‐flight secondary ion mass spectrometry. Appl Environ Microbiol 71: 6524–6530. [DOI] [PMC free article] [PubMed] [Google Scholar]
- Cody RB, Laramee JA, Durst HD. 2005. Versatile new ion source for the analysis of materials in open air under ambient conditions. Anal Chem 77: 2297–2302. [DOI] [PubMed] [Google Scholar]
- Curtis A, Wilkinson C. 2001. Nantotechniques and approaches in biotechnology. Trends Biotechnol 19: 97–101. [DOI] [PubMed] [Google Scholar]
- Czerwieniec GA, Russell SC, Tobias HJ, Pitesky ME, Fergenson DP, Steele P, Srivastava A, Horn JM, Frank M, Gard EE, Lebrilla CB. 2005. Stable isotope labeling of entire Bacillus atrophaeus spores and vegetative cells using bioaerosol mass spectrometry. Anal Chem 77: 1081–1087. [DOI] [PubMed] [Google Scholar]
- David F, Tienpont B, Sandra P. 2008. Chemotaxonomy of bacteria by comprehensive GC and GC‐MS in electron impact and chemical ionisation mode. J Sep Sci 31: 3395–3403. [DOI] [PubMed] [Google Scholar]
- Degand N, Carbonnelle E, Dauphin B, Beretti JL, Le Bourgeois M, Sermet‐Gaudelus I, Segonds C, Berche P, Nassif X, Ferroni A. 2008. Matrix‐assisted laser desorption ionization‐time of flight mass spectrometry for identification of nonfermenting Gram‐negative bacilli isolated from cystic fibrosis patients. J Clin Microbiol 46: 3361–3367. [DOI] [PMC free article] [PubMed] [Google Scholar]
- Delahunty C, Yates JR. 2005. Protein identification using 2D‐LC‐MS/MS. Methods 35: 248–255. [DOI] [PubMed] [Google Scholar]
- Demirev PA. 2004. Mass spectrometry for malaria diagnosis. Expert Rev Mol Diagn 4: 821–829. [DOI] [PubMed] [Google Scholar]
- Demirev PA, Fenselau C. 2008a. Mass spectrometry for rapid characterization of microorganisms. Annu Rev Anal Chem 1: 3.1–3.23. [DOI] [PubMed] [Google Scholar]
- Demirev PA, Fenselau C. 2008b. Mass spectrometry in biodefense. J Mass Spectrom 43: 1441–1457. [DOI] [PubMed] [Google Scholar]
- Demirev PA, Ho YP, Ryzhov V, Fenselau C. 1999. Microorganism identification by mass spectrometry and protein database searches. Anal Chem 71: 2732–2738. [DOI] [PubMed] [Google Scholar]
- Demirev PA, Lin JS, Pineda FJ, Fenselau C. 2001. Bioinformatics and mass spectrometry for microorganism identification: Proteome‐wide post‐translational modifications and database search algorithms for characterization of intact H. pylori . Anal Chem 73: 4566–4573. [DOI] [PubMed] [Google Scholar]
- Demirev PA, Feldman AB, Kongkasuriyachai D, Scholl P, Sullivan D, Kumar N. 2002. Detection of malaria parasites in blood by laser desorption mass spectrometry. Anal Chem 74: 3262–3266. [DOI] [PubMed] [Google Scholar]
- Demirev PA, Feldman AB, Lin JS. 2004. Bioinformatics‐based strategies for rapid microorganism identification by mass spectrometry. Johns Hopkins Apl Tech Dig 25: 27–37. [Google Scholar]
- Demirev PA, Feldman AB, Kowalski P, Lin JS. 2005. Top‐down proteomics for rapid identification of intact microorganisms. Anal Chem 77: 7455–7461. [DOI] [PubMed] [Google Scholar]
- Diamond DL, Zhang Y, Gaiger A, Smithgall M, Vedvick TS, Carter D. 2003. Use of proteinchip(™) array surface enhanced laser desorption/ionization time‐of‐flight mass spectrometry (SELDI‐TOFMS) to identify thymosin [beta]‐4, a differentially secreted protein from lymphoblastoid cell lines. J Am Soc Mass Spectrom 14: 760–765. [DOI] [PubMed] [Google Scholar]
- Dickinson DN, La Duc MT, Haskins WE, Gornushkin I, Winefordner JD, Powell DH, Venkateswaran K. 2004. Species differentiation of a diverse suite of Bacillus spores by mass spectrometry‐based protein profiling. Appl Environ Microbiol 70: 475–482. [DOI] [PMC free article] [PubMed] [Google Scholar]
- Donohue MJ, Smallwood AW, Pfaller S, Rodgers M, Shoemaker JA. 2006. The development of a matrix‐assisted laser desorption/ionization mass spectrometry‐based method for the protein fingerprinting and identification of Aeromonas species using whole cells. J Microbiol Methods 65: 380–389. [DOI] [PubMed] [Google Scholar]
- Du Z, Yang R, Guo Z, Song Y, Wang J. 2002. Identification of Staphylococcus aureus and determination of its methicillin resistance by matrix‐assisted laser desorption/ionization time‐of‐flight mass spectrometry. Anal Chem 74: 5487–5491. [DOI] [PubMed] [Google Scholar]
- Dworzanski JP, Snyder AP, Chen R, Zhang H, Wishart D, Li L. 2004. Identification of bacteria using tandem mass spectrometry combined with a proteome database and statistical scoring. Anal Chem 76: 2355–2366. [DOI] [PubMed] [Google Scholar]
- Dworzanski JP, Tripathi A, Snyder AP, Maswdeh WM, Wick CH. 2005. Novel biomarkers for gram‐type differentiation of bacteria by pyrolysis‐gas chromatography‐mass spectrometry. J Anal Appl Pyrol 73: 29–38. [Google Scholar]
- Dworzanski JP, Deshpande SV, Chen R, Jabbour RE, Snyder AP, Wick CH, Li L. 2006. Mass spectrometry‐based proteomics combined with bioinformatic tools for bacterial classification. J Proteome Res 5: 76–87. [DOI] [PubMed] [Google Scholar]
- Dworzanski JP, Dickinson DN, Deshpande SV, Snyder AP, Eckenrode BA. 2010. Discrimination and phylogenomic classification of Bacillus anthracis‐cereus‐thuringiensis strains based on LC‐MS/MS analysis of whole cell protein digests. Anal Chem 82: 145–155. [DOI] [PubMed] [Google Scholar]
- Ecker DJ, Sampath R, Blyn LB, Eshoo MW, Ivy C, Ecker JA, Libby B, Samant V, Sannes‐Lowery KA, Melton RE, Russell K, Freed N, Barrozo C, Wu JG, Rudnick K, Desai A, Moradi E, Knize DJ, Robbins DW, Hannis JC, Harrell PM, Massire C, Hall TA, Jiang Y, Ranken R, Drader JJ, White N, McNeil JA, Crooke ST, Hofstadler SA. 2005. Rapid identification and strain‐typing of respiratory pathogens for epidemic surveillance. Proc Natl Acad Sci USA 102: 8012–8017. [DOI] [PMC free article] [PubMed] [Google Scholar]
- Ecker JA, Massire C, Hall TA, Ranken R, Pennella TTD, Ivy CA, Blyn LB, Hofstadler SA, Endy TP, Scott PT, Lindler L, Hamilton T, Gaddy C, Snow K, Pe M, Fishbain J, Craft D, Deye G, Riddell S, Milstrey E, Petruccelli B, Brisse S, Harpin V, Schink A, Ecker DJ, Sampath R, Eshoo MW. 2006. Identification of Acinetobacter species and genotyping of Acinetobacter baumannii by multilocus PCR and mass spectrometry. J Clin Microbiol 44: 2921–2932. [DOI] [PMC free article] [PubMed] [Google Scholar]
- Ecker DJ, Sampath R, Massire C, Blyn LB, Hall TA, Eshoo MW, Hofstadler SA. 2008. Innovation—Ibis T5000: A universal biosensor approach for microbiology. Nat Rev Microbiol 6: 553–558. [DOI] [PMC free article] [PubMed] [Google Scholar]
- Edwards‐Jones V, Claydon MA, Evason DJ, Walker J, Fox AJ, Gordon DB. 2000. Rapid discrimination between methicillin‐sensitive and methicillin‐resistant Staphylococcus aureus by intact cell mass spectrometry. J Med Microbiol 49: 295–300. [DOI] [PubMed] [Google Scholar]
- Eigner U, Holfelder M, Oberdorfer K, Betz‐Wild U, Bertsch D, Fahr AM. 2009. Performance of a matrix‐assisted laser desorption ionization‐time‐of‐flight mass spectrometry system for the identification of bacterial isolates in the clinical routine laboratory. Clin Lab 55: 289–296. [PubMed] [Google Scholar]
- English RD, Warscheid B, Fenselau C, Cotter RJ. 2003. Bacillus spore identification via proteolytic peptide mapping with a miniaturized MALDI TOF mass spectrometer. Anal Chem 75: 6886–6893. [DOI] [PubMed] [Google Scholar]
- Eshoo MW, Whitehouse CA, Nalca A, Zoll S, Ecker JA, Hall TA, Pennella TTD, Duncan DD, Desai A, Moradi EK, Rudnick K, Libby B, Ranken R, Sampath R, Hofstadler SA, Ecker DJ, Blyn LB. 2009. Rapid and high‐throughput pan‐orthopoxvirus detection and identification using PCR and mass spectrometry. PLoS ONE 4: 6. [DOI] [PMC free article] [PubMed] [Google Scholar]
- Eshoo MW, Crowder CD, Li HJ, Matthews HE, Meng SF, Sefers SE, Sampath R, Stratton CW, Blyn LB, Ecker DJ, Tang YW. 2010. Detection and identification of Ehrlichia species in blood by use of PCR and electrospray ionization mass spectrometry. J Clin Microbiol 48: 472–478. [DOI] [PMC free article] [PubMed] [Google Scholar]
- Everley RA, Mott TM, Wyatt SA, Toney DM, Croley TR. 2008. Liquid chromatography/mass spectrometry characterization of Escherichia coli and Shigella species. J Am Soc Mass Spectrom 19: 1621–1628. [DOI] [PubMed] [Google Scholar]
- Everley RA, Mott TM, Toney DM, Croley TR. 2009. Characterization of Clostridium species utilizing liquid chromatography/mass spectrometry of intact proteins. J Microbiol Methods 77: 152–158. [DOI] [PubMed] [Google Scholar]
- Fabris D. 2010. A role for the ms analysis of nucleic acids in the post‐genomics age. J Am Soc Mass Spectrom 21: 1–13. [DOI] [PubMed] [Google Scholar]
- Fagerquist CK, Garbus BR, Miller WG, Williams KE, Yee E, Bates AH, Boyle S, Harden LA, Cooley MB, Mandrell RE. 2010. Rapid identification of protein biomarkers of Escherichia coil O157:H7 by matrix‐assisted laser desorption ionization‐time‐of‐flight‐time‐of‐flight mass spectrometry and top‐down proteomics. Anal Chem 82: 2717–2725. [DOI] [PubMed] [Google Scholar]
- Faix DJ, Sherman SS, Waterman SH. 2009. Rapid‐test sensitivity for novel swine‐origin influenza a (H1N1) virus in humans. N Engl J Med 361: 728–729. [DOI] [PubMed] [Google Scholar]
- Fenselau C, Demirev PA. 2001. Characterization of intact microorganisms by MALDI mass spectrometry. Mass Spectrom Rev 20: 157–171. [DOI] [PubMed] [Google Scholar]
- Fenselau C, Russell S, Swatkoski S, Edwards N. 2007. Proteomic strategies for rapid characterization of micro‐organisms. Eur J Mass Spectrom 13: 35–39. [DOI] [PubMed] [Google Scholar]
- Fenselau C, Havey C, Teerakulkittipong N, Swatkoski S, Laine O, Edwards N. 2008. Identification of beta‐lactamase in antibiotic‐resistant Bacillus cereus spores. Appl Environ Microbiol 74: 904–906. [DOI] [PMC free article] [PubMed] [Google Scholar]
- Fergenson DP, Pitesky ME, Tobias HJ, Steele PT, Czerwieniec GA, Russell SC, Lebrilla CB, Horn JM, Coffee KR, Srivastava A, Pillai SP, Shih M‐TP, Hall HL, Ramponi AJ, Chang JT, Langlois RG, Estacio PL, Hadley RT, Frank M, Gard EE. 2004. Reagentless detection and classification of individual bioaerosol particles in seconds. Anal Chem 76: 373–378. [DOI] [PubMed] [Google Scholar]
- Fox A. 2006. Mass spectrometry for species or strain identification after culture or without culture: Past, present, and future. J Clin Microbiol 44: 2677–2680. [DOI] [PMC free article] [PubMed] [Google Scholar]
- Franco CF, Mellado MCM, Alves PM, Coelho AV. 2010. Monitoring virus‐like particle and viral protein production by intact cell MALDI‐TOF mass spectrometry. Talanta 80: 1561–1568. [DOI] [PubMed] [Google Scholar]
- Gikunju CM, Lev SM, Birenzvige A, Schaefer DM. 2004. Detection and identification of bacteria using direct injection inductively coupled plasma mass spectroscopy. Talanta 62: 741–744. [DOI] [PubMed] [Google Scholar]
- Goodacre R, Heald JK, Kell DB. 1999. Characterisation of intact microorganisms using electrospray ionisation mass spectrometry. FEMS Microbiol Lett 176: 17–24. [Google Scholar]
- Goodacre R, Shann B, Gilbert RJ, Timmins EM, McGovern AC, Alsberg BK, Kell DB, Logan NA. 2000. Detection of the dipicolinic acid biomarker in Bacillus spores using curie‐point pyrolysis mass spectrometry and Fourier transform infrared spectroscopy. Anal Chem 72: 119–127. [DOI] [PubMed] [Google Scholar]
- Grosse‐Herrenthey A, Maier T, Gessler F, Schaumann R, Bohnel H, Kostrzewa M, Kruger M. 2008. Challenging the problem of clostridial identification with matrix‐assisted laser desorption and ionization‐time‐of‐flight mass spectrometry (MALDI‐TOFMS). Anaerobe 14: 242–249. [DOI] [PubMed] [Google Scholar]
- Gu H, Ho P‐L, Tsang KWT, Wang L, Xu B. 2003a. Using biofunctional magnetic nanoparticles to capture vancomycin‐resistant Enterococci and other Gram‐positive bacteria at ultralow concentration. J Am Chem Soc 125: 15702–15703. [DOI] [PubMed] [Google Scholar]
- Gu HW, Ho PL, Tsang KWT, Yu CW, Xu B. 2003b. Using biofunctional magnetic nanoparticles to capture gram‐negative bacteria at an ultra‐low concentration. Chem Commun 1966–1967. [DOI] [PubMed] [Google Scholar]
- Gu H, Xu K, Xu C, Xu B. 2006. Biofunctional magnetic nanoparticles for protein separation and pathogen detection. Chem Commun: 941–949. [DOI] [PubMed] [Google Scholar]
- Guo ZX, Liu Y, Li SP, Yang ZG. 2009. Interaction of bacteria and ion‐exchange particles and its potential in separation for matrix‐assisted laser desorption/ionization mass spectrometric identification of bacteria in water. Rapid Commun Mass Spectrom 23: 3983–3993. [DOI] [PubMed] [Google Scholar]
- Hall TA, Sampath R, Blyn LB, Ranken R, Ivy C, Melton R, Matthews H, White N, Li F, Harpin V, Ecker DJ, McDougal LK, Limbago B, Ross T, Wolk DM, Wysocki V, Carroll KC. 2009. Rapid molecular genotyping and clonal complex assignment of Staphylococcus aureus isolates by PCR coupled to electrospray ionization‐mass spectrometry. J Clin Microbiol 47: 1733–1741. [DOI] [PMC free article] [PubMed] [Google Scholar]
- Hannis JC, Manalili SM, Hall TA, Ranken R, White N, Sampath R, Blyn LB, Ecker DJ, Mandrell RE, Fagerquist CK, Bates AH, Miller WG, Hofstadler SA. 2008. High‐resolution genotyping of Campylobacter species by use of PCR and high‐throughput mass spectrometry. J Clin Microbiol 46: 1220–1225. [DOI] [PMC free article] [PubMed] [Google Scholar]
- Hathout Y, Setlow B, Cabrera‐Martinez R‐M, Fenselau C, Setlow P. 2003. Small, acid‐soluble proteins as biomarkers in mass spectrometry analysis of Bacillus spores. Appl Environ Microbiol 69: 1100–1107. [DOI] [PMC free article] [PubMed] [Google Scholar]
- Hernychova L, Toman R, Ciampor F, Hubalek M, Vackova J, Macela A, Skultety L. 2008. Detection and identification of Coxiella burnetii based on the mass spectrometric analyses of the extracted proteins. Anal Chem 80: 7097–7104. [DOI] [PubMed] [Google Scholar]
- Hettick JM, Green BJ, Buskirk AD, Kashon ML, Slaven JE, Janotka E, Blachere FM, Schmechel D, Beezhold DH. 2008a. Discrimination of Aspergillus isolates at the species and strain level by matrix‐assisted laser desorption/ionization time‐of‐flight mass spectrometry fingerprinting. Anal Biochem 380: 276–281. [DOI] [PubMed] [Google Scholar]
- Hettick JM, Green BJ, Buskirk AD, Kashon ML, Slaven JE, Janotka E, Blachere FM, Schmechel D, Beezhold DH. 2008b. Discrimination of Penicillium isolates by matrix‐assisted laser desorption/ionization time‐of‐flight mass spectrometry fingerprinting. Rapid Commun Mass Spectrom 22: 2555–2560. [DOI] [PubMed] [Google Scholar]
- Ho YP, Hsu PH. 2002. Investigating the effects of protein patterns on microorganism identification by high‐performance liquid chromatography‐mass spectrometry and protein database searches. J Chromatogr A 976: 103–111. [DOI] [PubMed] [Google Scholar]
- Ho Y‐P, Reddy PM. 2010. Identification of pathogens using mass spectrometry. Clin Chem 56: 525–536. [DOI] [PMC free article] [PubMed] [Google Scholar]
- Ho KC, Tsai PJ, Lin YS, Chen YC. 2004. Using biofunctionalized nanoparticles to probe pathogenic bacteria. Anal Chem 76: 7162–7168. [DOI] [PubMed] [Google Scholar]
- Hofstadler SA, Sampath R, Blyn LB, Eshoo MW, Hall TA, Jiang Y, Drader JJ, Hannis JC, Sannes‐Lowery KA, Cummins LL, Libby B, Walcott DJ, Schink A, Massire C, Ranken R, Gutierrez J, Manalili S, Ivy C, Melton R, Levene H, Barrett‐Wilt G, Li F, Zapp V, White N, Samant V, McNeil JA, Knize D, Robbins D, Rudnick K, Desai A, Moradi E, Ecker DJ. 2005. Tiger: The universal biosensor. Int J Mass Spectrom 242: 23–41. [Google Scholar]
- Hong SP, Kim NK, Hwang SG, Chung HJ, Kim S, Han JH, Kim HT, Rim KS, Kang MS, Yoo W, Kim SO. 2004. Detection of hepatitis B virus YMDD variants using mass spectrometric analysis of oligonucleotide fragments. J Hepatol 40: 837–844. [DOI] [PubMed] [Google Scholar]
- Honisch C, Chen Y, Mortimer C, Arnold C, Schmidt O, van den Boom D, Cantor CR, Shah HN, Gharbia SE. 2007. Automated comparative sequence analysis by base‐specific cleavage and mass spectrometry for nucleic acid‐based microbial typing. Proc Natl Acad Sci USA 104: 10649–10654. [DOI] [PMC free article] [PubMed] [Google Scholar]
- Hsieh SY, Tseng CL, Lee YS, Kuo AJ, Sun CF, Lin YH, Chen JK. 2008. Highly efficient classification and identification of human pathogenic bacteria by MALDI‐TOF MS. Mol Cell Proteomics 7: 448–456. [DOI] [PubMed] [Google Scholar]
- Hu A, Tsai PJ, Ho YP. 2005. Identification of microbial mixtures by capillary electrophoresis/selective tandem mass spectrometry. Anal Chem 77: 1488–1495. [DOI] [PubMed] [Google Scholar]
- Hu A, Chen CT, Tsai PJ, Ho YP. 2006. Using capillary electrophoresis‐selective tandem mass spectrometry to identify pathogens in clinical samples. Anal Chem 78: 5124–5133. [DOI] [PubMed] [Google Scholar]
- Hu A, Lo AAL, Chen CT, Lin KC, Ho YP. 2007. Identifying bacterial species using CE‐MS and SEQUEST with an empirical scoring function. Electrophoresis 28: 1387–1392. [DOI] [PubMed] [Google Scholar]
- Hujer KM, Hujer AM, Endimiani A, Thomson JM, Adams MD, Goglin K, Rather PN, Pennella TTD, Massire C, Eshoo MW, Sampath R, Blyn LB, Ecker DJ, Bonomo RA. 2009. Rapid determination of quinolone resistance in Acinetobacter spp. J Clin Microbiol 47: 1436–1442. [DOI] [PMC free article] [PubMed] [Google Scholar]
- Hutchens TW, Yip T‐T. 1992. Synthetic metal‐binding protein surface domains for metal ion‐dependent interaction chromatography: II. Immobilization of synthetic metal‐binding peptides from metal ion transport proteins as model bioactive protein surface domains. J Chromatogr A 604: 133–141. [DOI] [PubMed] [Google Scholar]
- Hutchens TW, Nelson RW, Li CM, Yip T‐T. 1992. Synthetic metal‐binding protein surface domains for metal ion‐dependent interaction chromatography: I. Analysis of bound metal ions by matrix‐assisted UV laser desorption time‐of‐flight mass spectrometry. J Chromatogr A 604: 125–132. [DOI] [PubMed] [Google Scholar]
- Ikryannikova LN, Afanas'ev MV, Akopian TA, Il'ina EN, Kuz'min AV, Larionova EE, Smirnova TG, Chernousova LN, Govorun VM. 2007. Mass‐spectrometry based minisequencing method for the rapid detection of drug resistance in Mycobacterium tuberculosis . J Microbiol Methods 70: 395–405. [DOI] [PubMed] [Google Scholar]
- Ikryannikova LN, Shitikov EA, Zhivankova DG, Il'ina EN, Edelstein MV, Govorun VM. 2008. A MALDI TOF MS‐based minisequencing method for rapid detection of tem‐type extended‐spectrum beta‐lactamases in clinical strains of Enterobacteriaceae . J Microbiol Methods 75: 385–391. [DOI] [PubMed] [Google Scholar]
- Ilina EN, Malakhova MV, Generozov EV, Nikolaev EN, Govorun VM. 2005. Matrix‐assisted laser desorption ionization‐time of flight (mass spectrometry) for hepatitis C virus genotyping. J Clin Microbiol 43: 2810–2815. [DOI] [PMC free article] [PubMed] [Google Scholar]
- Ilina EN, Borovskaya AD, Malakhova MM, Vereshchagin VA, Kubanova AA, Kruglov AN, Svistunova TS, Gazarian AO, Maier T, Kostrzewa M, Govorun VM. 2009. Direct bacterial profiling by matrix‐assisted laser desorption‐ionization time‐of‐flight mass spectrometry for identification of pathogenic neisseria. J Mol Diagn 11: 75–86. [DOI] [PMC free article] [PubMed] [Google Scholar]
- Ilina EN, Borovskaya AD, Serebryakova MV, Chelysheva VV, Momynaliev KT, Maier T, Kostrzewa M, Govorun VM. 2010. Application of matrix‐assisted laser desorption/ionization time‐of‐flight mass spectrometry for the study of Helicobacter pylori . Rapid Commun Mass Spectrom 24: 328–334. [DOI] [PubMed] [Google Scholar]
- Ishida Y, Madonna AJ, Rees JC, Meetani MA, Voorhees KJ. 2002. Rapid analysis of intact phospholipids from whole bacterial cells by matrix‐assisted laser desorption/ionization mass spectrometry combined with on‐probe sample pretreatment. Rapid Commun Mass Spectrom 16: 1877–1882. [DOI] [PubMed] [Google Scholar]
- Ishida Y, Kitagawa K, Nakayama A, Ohtani H. 2005. On‐probe sample pretreatment for direct analysis of lipids in gram‐positive bacterial cells by matrix‐assisted laser desorption ionization mass spectrometry. Appl Environ Microbiol 71: 7539–7541. [DOI] [PMC free article] [PubMed] [Google Scholar]
- Ishida Y, Kitagawa K, Nakayama A, Ohtani H. 2006. Complementary analysis of lipids in whole bacteria cells by thermally assisted hydrolysis and methylation‐GC and MALDI‐MS combined with on‐probe sample pretreatment. J Anal Appl Pyrol 77: 116–120. [Google Scholar]
- Jackson BP, Ranville JF, Neal AL. 2005. Application of flow field flow fractionation‐ICPMS for the study of uranium binding in bacterial cell suspensions. Anal Chem 77: 1393–1397. [DOI] [PubMed] [Google Scholar]
- Jegorov A, Haiduch M, Sulc M, Havlicek V. 2006. Nonribosomal cyclic peptides: Specific markers of fungal infections. J Mass Spectrom 41: 563–576. [DOI] [PubMed] [Google Scholar]
- Jelinek D, Miketova P, Khailova L, Schram KH, Moore IM, Vytrasova J. 2006. Identification of Arcobacter species using phospholipid and total fatty acid profiles. Folia Microbiol 51: 329–336. [DOI] [PubMed] [Google Scholar]
- Johnson EM, Ellis WR, Powers LS, Wysocki VH. 2009. Affinity capture mass spectrometry of biomarker proteins using peptide ligands from biopanning. Anal Chem 81: 5999–6005. [DOI] [PMC free article] [PubMed] [Google Scholar]
- Jones JJ, Stump MJ, Fleming RC, Lay JO, Wilkins CL. 2003. Investigation of MALDI‐TOF and FT‐MS techniques for analysis of Escherichia coli whole cells. Anal Chem 75: 1340–1347. [DOI] [PubMed] [Google Scholar]
- Jones JJ, Stump MJ, Fleming RC, Lay JO, Wilkins CL. 2004. Strategies and data analysis techniques for lipid and phospholipid chemistry elucidation by intact cell MALDI‐FTMS. J Am Soc Mass Spectrom 15: 1665–1674. [DOI] [PubMed] [Google Scholar]
- Kaal E, Kolk AHJ, Kuijper S, Janssen HG. 2009. A fast method for the identification of Mycobacterium tuberculosis in sputum and cultures based on thermally assisted hydrolysis and methylation followed by gas chromatography‐mass spectrometry. J Chromatogr A 1216: 6319–6325. [DOI] [PubMed] [Google Scholar]
- Kemptner J, Marchetti‐Deschmann M, Kubicek CP, Allmaier G. 2009. Mixed volume sample preparation method for intact cell mass spectrometry of Fusarium spores. J Mass Spectrom 44: 1622–1624. [DOI] [PubMed] [Google Scholar]
- Kemptner J, Marchetti‐Deschmann M, Mach R, Druzhinina IS, Kubicek CP, Allmaier G. 2009. Evaluation of matrix‐assisted laser desorption/ionization (MALDI) preparation techniques for surface characterization of intact Fusarium spores by MALDI linear time‐of‐flight mass spectrometry. Rapid Commun Mass Spectrom 23: 877–884. [DOI] [PubMed] [Google Scholar]
- Keys CJ, Dare DJ, Sutton H, Wells G, Lunt M, McKenna T, McDowall M, Shah HN. 2004. Compilation of a MALDI‐TOF mass spectral database for the rapid screening and characterisation of bacteria implicated in human infectious diseases. Infect Genet Evol 4: 221–242. [DOI] [PubMed] [Google Scholar]
- Kim YJ, Kim SO, Chung HJ, Jee MS, Kim BG, Kim KM, Yoon JH, Lee HS, Kim CY, Kim S, Yoo W, Hong SP. 2005. Population genotyping of hepatitis C virus by matrix‐assisted laser desorption/ionization time‐of‐flight mass spectrometry analysis of short DNA fragments. Clin Chem 51: 1123–1131. [DOI] [PubMed] [Google Scholar]
- Kleefsman I, Stowers MA, Verheijen PJT, Van Wuijckhuijse AL, Kientz CE, Marijnissen JCM. 2007. Bioaerosol analysis by single particle mass spectrometry. Part Part Syst Character 24: 85–90. [Google Scholar]
- Kleefsman WA, Stowers MA, Verheijen PJT, Marijnissen JCM. 2008. Single particle mass spectrometry—Bioaerosol analysis by MALDI MS. Kona Powder Part 26: 205–214. [Google Scholar]
- Klouche M, Schroder U. 2008. Rapid methods for diagnosis of bloodstream infections. Clin Chem Lab Med 46: 888–908. [DOI] [PubMed] [Google Scholar]
- Kolch W, Neususs C, Peizing M, Mischak H. 2005. Capillary electrophoresis—Mass spectrometry as a powerful tool in clinical diagnosis and biomarker discovery. Mass Spectrom Rev 24: 959–977. [DOI] [PubMed] [Google Scholar]
- Krishnamurthy T, Davis MT, Stahl DC, Lee TD. 1999. Liquid chromatography microspray mass spectrometry for bacterial investigations. Rapid Commun Mass Spectrom 13: 39–49. [DOI] [PubMed] [Google Scholar]
- Krishnamurthy T, Hewel J, Bonzagni NJ, Dabbs J, Bull RL, Yates JR. 2006. Simultaneous identification and verification of Bacillus anthracis . Rapid Commun Mass Spectrom 20: 2053–2056. [DOI] [PubMed] [Google Scholar]
- Krishnamurthy T, Deshpande S, Hewel J, Liu HB, Wick CH, Yates JR. 2007. Specific identification of Bacillus anthracis strains. Int J Mass Spectrom 259: 140–146. [Google Scholar]
- La Scola B, Raoult D. 2009. Direct identification of bacteria in positive blood culture bottles by matrix‐assisted laser desorption ionisation time‐of‐flight mass spectrometry. PLoS ONE 4: e8041. [DOI] [PMC free article] [PubMed] [Google Scholar]
- Lancashire L, Schmid O, Shah H, Ball G. 2005. Classification of bacterial species from proteomic data using combinatorial approaches incorporating artificial neural networks, cluster analysis and principal components analysis. Bioinformatics 21: 2191–2199. [DOI] [PubMed] [Google Scholar]
- Lasch P, Beyer W, Nattermann H, Stammler M, Siegbrecht E, Grunow R, Naumann D. 2009. Identification of Bacillus anthracis by using matrix‐assisted laser desorption ionization‐time of flight mass spectrometry and artificial neural networks. Appl Environ Microbiol 75: 7229–7242. [DOI] [PMC free article] [PubMed] [Google Scholar]
- Lau CC, Yue PYK, Chui SH, Chui AKK, Yam WC, Wong RNS. 2007. Detection of single nucleotide polymorphisms in hepatitis B virus precore/basal core promoter region by matrix‐assisted laser desorption/ionization time‐of‐flight mass spectrometry. Anal Biochem 366: 93–95. [DOI] [PubMed] [Google Scholar]
- Lay JO. 2001. MALDI‐TOF mass spectrometry of bacteria. Mass Spectrom Rev 20: 172–194. [DOI] [PubMed] [Google Scholar]
- Lefmann M, Honisch C, Bocker S, Storm N, von Wintzingerode F, Schlotelburg C, Moter A, van den Boom D, Gobel UB. 2004. Novel mass spectrometry‐based tool for genotypic identification of mycobacteria. J Clin Microbiol 42: 339–346. [DOI] [PMC free article] [PubMed] [Google Scholar]
- Leuschner RGK, Beresford‐Jones N, Robinson C. 2004. Difference and consensus of whole cell Salmonella enterica subsp enterica serovars matrix‐assisted laser desorption/ionization time‐of‐flight mass spectrometry spectra. Lett Appl Microbiol 38: 24–31. [DOI] [PubMed] [Google Scholar]
- Levy L, Sahoo Y, Kim K‐S, Bergey EJ, Prasad PN. 2002. Nanochemistry: Synthesis and characterization of multifunctional nanoclinics for biological applications. Chem Mater 14: 3715–3721. [Google Scholar]
- Li TY, Liu BH, Chen YC. 2000. Characterization of Aspergillus spores by matrix‐assisted laser desorption/ionization time‐of‐flight mass spectrometry. Rapid Commun Mass Spectrom 14: 2393–2400. [DOI] [PubMed] [Google Scholar]
- Li F, Armstrong DW, Houk RS. 2005. Behavior of bacteria in the inductively coupled plasma: Atomization and production of atomic ions for mass spectrometry. Anal Chem 77: 1407–1413. [DOI] [PubMed] [Google Scholar]
- Li SP, Guo ZX, Liu Y, Yang ZG, Hui HK. 2009. Integration of microfiltration and anion‐exchange nano particles‐based magnetic separation with MALDI mass spectrometry for bacterial analysis. Talanta 80: 313–320. [DOI] [PubMed] [Google Scholar]
- Lin C‐C, Yeh Y‐C, Yang C‐Y, Chen C‐L, Chen G‐F, Chen C‐C, Wu Y‐C. 2002. Selective binding of mannose‐encapsulated gold nanoparticles to type 1 pili in Escherichia coli . J Am Chem Soc 124: 3508–3509. [DOI] [PubMed] [Google Scholar]
- Lin YS, Tsai PJ, Weng MF, Chen YC. 2005. Affinity capture using vancomycin‐bound magnetic nanoparticles for the MALDI‐MS analysis of bacteria. Anal Chem 77: 1753–1760. [DOI] [PubMed] [Google Scholar]
- Liu HH, Du ZM, Wang J, Yang RF. 2007. Universal sample preparation method for characterization of bacteria by matrix‐assisted laser desorption ionization‐time of flight mass spectrometry. Appl Environ Microbiol 73: 1899–1907. [DOI] [PMC free article] [PubMed] [Google Scholar]
- Liu JC, Tsai PJ, Lee YC, Chen YC. 2008. Affinity capture of uropathogenic Escherichia coli using pigeon ovalbumin‐bound Fe3O4@Al2O3 magnetic nanoparticles. Anal Chem 80: 5425–5432. [DOI] [PubMed] [Google Scholar]
- Liu JC, Chen WJ, Li CW, Mong KKT, Tsai PJ, Tsai TL, Lee YC, Chen YC. 2009. Identification of Pseudomonas aeruginosa using functional magnetic nanoparticle‐based affinity capture combined with MALDI MS analysis. Analyst 134: 2087–2094. [DOI] [PubMed] [Google Scholar]
- Lo AAL, Hu A, Ho YP. 2006. Identification of microbial mixtures by LC‐selective proteotypic‐peptide analysis (SPA). J Mass Spectrom 41: 1049–1060. [DOI] [PubMed] [Google Scholar]
- Lowe CA, Diggle MA, Clarke SC. 2004. A single nucleotide polymorphism identification assay for the genotypic characterisation of Neisseria meningitidis using MALDI‐TOF mass spectrometry. Br J Biomed Sci 61: 8–10. [DOI] [PubMed] [Google Scholar]
- Lundquist M, Caspersen MB, Wikstrom P, Forsman M. 2005. Discrimination of Francisella tularensis subspecies using surface enhanced laser desorption ionization mass spectrometry and multivariate data analysis. FEMS Microbiol Lett 243: 303–310. [DOI] [PubMed] [Google Scholar]
- Madonna AJ, Basile F, Furlong E, Voorhees KJ. 2001. Detection of bacteria from biological mixtures using immunomagnetic separation combined with matrix‐assisted laser desorption/ionization time‐of‐flight mass spectrometry. Rapid Commun Mass Spectrom 15: 1068–1074. [DOI] [PubMed] [Google Scholar]
- Madonna AJ, Van Cuyk S, Voorhees KJ. 2003a. Detection of Escherichia coli using immunomagnetic separation and bacteriophage amplification coupled with matrix‐assisted laser desorption/ionization time‐of‐flight mass spectrometry. Rapid Commun Mass Spectrom 17: 257–263. [DOI] [PubMed] [Google Scholar]
- Madonna AJ, Voorhees KJ, Taranenko NI, Laiko VV, Doroshenko VM. 2003b. Detection of cyclic lipopeptide biomarkers from Bacillus species using atmospheric pressure matrix‐assisted laser desorption/ionization mass spectrometry. Anal Chem 75: 1628–1637. [DOI] [PubMed] [Google Scholar]
- Malakhova MV, Ilina EN, Govorun VM, Shutko SA, Dudina KR, Znoyko OO, Klimova EA, Iushchuk ND. 2009. Hepatitis b virus genetic typing using mass‐spectrometry. Bull Exp Biol Med 147: 220–225. [DOI] [PubMed] [Google Scholar]
- Mandrell RE, Harden LA, Bates A, Miller WG, Haddon WF, Fagerquist CK. 2005. Speciation of Campylobacter coli, C‐jejuni, C‐helveticus, C‐lari, C‐sputorum, and C‐upsaliensis by matrix‐assisted laser desorption ionization‐time of flight mass spectrometry. Appl Environ Microbiol 71: 6292–6307. [DOI] [PMC free article] [PubMed] [Google Scholar]
- Marinach‐Patrice C, Lethuillier A, Marly A, Brossas JY, Gene J, Symoens F, Datry A, Guarro J, Mazier D, Hennequin C. 2009. Use of mass spectrometry to identify clinical Fusarium isolates. Clin Microbiol Infect 15: 634–642. [DOI] [PubMed] [Google Scholar]
- Marinach‐Patrice C, Fekkar A, Atanasova R, Gomes J, Djamdjian L, Brossas JY, Meyer I, Buffet P, Snounou G, Datry A, Hennequin C, Golmard JL, Mazier D. 2010. Rapid species diagnosis for invasive candidiasis using mass spectrometry. PLoS ONE 5: 5. [DOI] [PMC free article] [PubMed] [Google Scholar]
- Marklein G, Josten M, Klanke U, Muller E, Horre R, Maier T, Wenzel T, Kostrzewa M, Bierbaum G, Hoerauf A, Sahl HG. 2009. Matrix‐assisted laser desorption ionization‐time of flight mass spectrometry for fast and reliable identification of clinical yeast isolates. J Clin Microbiol 47: 2912–2917. [DOI] [PMC free article] [PubMed] [Google Scholar]
- Marvin LF, Roberts MA, Fay LB. 2003. Matrix‐assisted laser desorption/ionization time‐of‐flight mass spectrometry in clinical chemistry. Clin Chim Acta 337: 11–21. [DOI] [PubMed] [Google Scholar]
- Mayr BM, Kobold U, Moczko M, Nyeki A, Koch T, Huber CG. 2005. Identification of bacteria by polymerase chain reaction followed by liquid chromatography‐mass spectrometry. Anal Chem 77: 4563–4570. [DOI] [PubMed] [Google Scholar]
- Mazzella N, Molinet J, Syakti AD, Dodi A, Doumenq P, Artaud J, Bertrand JC. 2004. Bacterial phospholipid molecular species analysis by ion‐pair reversed‐phase HPLC/ESI/MS. J Lipid Res 45: 1355–1363. [DOI] [PubMed] [Google Scholar]
- Mazzella N, Molinet J, Syakti AD, Dodi A, Bertrand JC, Doumenq P. 2005. Use of electrospray ionization mass spectrometry for profiling of crude oil effects on the phospholipid molecular species of two marine bacteria. Rapid Commun Mass Spectrom 19: 3579–3588. [DOI] [PubMed] [Google Scholar]
- Mazzeo MF, Sorrentino A, Gaita M, Cacace G, Di Stasio M, Facchiano A, Comi G, Malorni A, Siciliano RA. 2006. Matrix‐assisted laser desorption ionization‐time of flight mass spectrometry for the discrimination of food‐borne microorganisms. Appl Environ Microbiol 72: 1180–1189. [DOI] [PMC free article] [PubMed] [Google Scholar]
- McJimpsey EL, Jackson WM, Lebrilla CB, Tobias H, Bogan MJ, Gard EE, Frank M, Steele PT. 2008. Parameters contributing to efficient ion generation in aerosol MALDI mass spectrometry. J Am Soc Mass Spectrom 19: 315–324. [DOI] [PubMed] [Google Scholar]
- Meetani MA, Shin YS, Zhang SF, Mayer R, Basile F. 2007. Desorption electrospray ionization mass spectrometry of intact bacteria. J Mass Spectrom 42: 1186–1193. [DOI] [PubMed] [Google Scholar]
- Mellmann A, Cloud J, Maier T, Keckevoet U, Ramminger I, Iwen P, Dunn J, Hall G, Wilson D, LaSala P, Kostrzewa M, Harmsen D. 2008. Evaluation of matrix‐assisted laser desorption ionization‐time‐of‐flight mass spectrometry in comparison to 16s rRNA gene sequencing for species identification of nonfermenting bacteria. J Clin Microbiol 46: 1946–1954. [DOI] [PMC free article] [PubMed] [Google Scholar]
- Meuzelaar HLC, Kistemaker PG. 1973. Technique for fast and reproducible fingerprinting of bacteria by pyrolysis mass spectrometry. Anal Chem 45: 587–590. [DOI] [PubMed] [Google Scholar]
- Meuzelaar HLC, Kistemaker PG, Eshuis W, Boerboom HA. 1976. Automated pyrolysis mass‐spectrometry: Application to the differentiation of microorganisms. Adv Mass Spectrom 7B: 1452–1456. [Google Scholar]
- Miketova P, Abbas‐Hawks C, Voorhees KJ, Hadfield TL. 2003. Microorganism gram‐type differentiation of whole cells based on pyrolysis high‐resolution mass spectrometry data. J Anal Appl Pyrol 67: 109–122. [Google Scholar]
- Moe MK, Anderssen T, Strøm MB, Jensen E. 2005. Total structure characterization of unsaturated acidic phospholipids provided by vicinal di‐hydroxylation of fatty acid double bonds and negative electrospray ionization mass spectrometry. J Am Soc Mass Spectrom 16: 46–59. [DOI] [PubMed] [Google Scholar]
- Monis PT, Giglio S. 2006. Nucleic acid amplification‐based techniques for pathogen detection and identification. Infect Genet Evol 6: 2–12. [DOI] [PMC free article] [PubMed] [Google Scholar]
- Mothershed EA, Whitney AM. 2006. Nucleic acid‐based methods for the detection of bacterial pathogens: Present and future considerations for the clinical laboratory. Clin Chim Acta 363: 206–220. [DOI] [PubMed] [Google Scholar]
- Nagy E, Maier T, Urban E, Terhes G, Kostrzewa M. 2009. Species identification of clinical isolates of bacteroides by matrix‐assisted laser‐desorption/ionization time‐of‐flight mass spectrometry. Clin Microbiol Infect 15: 796–802. [DOI] [PubMed] [Google Scholar]
- Noble CA, Prather KA. 2000. Real‐time single particle mass spectrometry: A historical review of a quarter century of the chemical analysis of aerosols. Mass Spectrom Rev 19: 248–274. [DOI] [PubMed] [Google Scholar]
- Nyunt M, Pisciotta J, Feldman AB, Thuma P, Scholl PF, Demirev PA, Lin J, Shi LR, Kumar N, Sullivan DJ. 2005. Detection of Plasmodium falciparum in pregnancy by laser desorption mass spectrometry. Am J Trop Med Hyg 73: 485–490. [PubMed] [Google Scholar]
- Oberacher H, Krajete A, Parson W, Huber CG. 2000. Preparation and evaluation of packed capillary columns for the separation of nucleic acids by ion‐pair reversed‐phase high‐performance liquid chromatography. J Chromatogr A 893: 23–35. [DOI] [PubMed] [Google Scholar]
- Ochoa ML, Harrington PB. 2005. Immunomagnetic isolation of enterohemorrhagic Escherichia coli O157: H7 from ground beef and identification by matrix‐assisted laser desorption/ionization time‐of‐flight mass spectrometry and database searches. Anal Chem 77: 5258–5267. [DOI] [PubMed] [Google Scholar]
- Oh HB, Kim SO, Cha CH, Hong SP, Folk WR, Kim KM, Suh DJ. 2008. Identification of hepatitis c virus genotype 6 in Korean patients by analysis of 5′ untranslated region using a matrix assisted laser desorption/ionization time of flight‐based assay, restriction fragment mass polymorphism. J Med Virol 80: 1712–1719. [DOI] [PubMed] [Google Scholar]
- Ohtani H, Ishida Y. 2007. Direct analysis of minor organic components in various polymers and biomaterials by matrix‐assisted laser desorption/ionization mass spectrometry. Bunseki Kagaku 56: 299–315. [Google Scholar]
- Parisi D, Magliulo M, Nanni P, Casale M, Forina M, Roda A. 2008. Analysis and classification of bacteria by matrix‐assisted laser desorption/ionization time‐of‐flight mass spectrometry and a chemometric approach. Anal Bioanal Chem 391: 2127–2134. [DOI] [PubMed] [Google Scholar]
- Pennanec X, Dufour A, Haras D, Rehel K. 2010. A quick and easy method to identify bacteria by matrix‐assisted laser desorption/ionisation time‐of‐flight mass spectrometry. Rapid Commun Mass Spectrom 24: 384–392. [DOI] [PubMed] [Google Scholar]
- Petr J, Ryparova O, Ranc V, Hinnerova P, Znaleziona J, Kowalska M, Knob R, Maier V, Frebort I, Lemr K, Sevcik J. 2009. Assessment of CE for the identification of microorganisms. Electrophoresis 30: 444–449. [DOI] [PubMed] [Google Scholar]
- Pierce CY, Barr JR, Cody RB, Massung RF, Woolfitt AR, Moura H, Thompson HA, Fernandez FM. 2007. Ambient generation of fatty acid methyl ester ions from bacterial whole cells by direct analysis in real time (DART) mass spectrometry. Chem Commun: 807–809. [DOI] [PubMed] [Google Scholar]
- Pribil PA, Patton E, Black G, Doroshenko V, Fenselau C. 2005. Rapid characterization of Bacillus spores targeting species‐unique peptides produced with an atmospheric pressure matrix‐assisted laser desorption/ionization source. J Mass Spectrom 40: 464–474. [DOI] [PubMed] [Google Scholar]
- Price NPJ, Rooney AP, Swezey JL, Perry E, Cohan FM. 2007. Mass spectrometric analysis of lipopeptides from Bacillus strains isolated from diverse geographical locations. FEMS Microbiol Lett 271: 83–89. [DOI] [PubMed] [Google Scholar]
- Qian J, Cutler JE, Cole RB, Cai Y. 2008. MALDI‐TOF mass signatures for differentiation of yeast species, strain grouping and monitoring of morphogenesis markers. Anal Bioanal Chem 392: 439–449. [DOI] [PubMed] [Google Scholar]
- Rajakaruna L, Hallas G, Molenaar L, Dare D, Sutton H, Encheva V, Culak R, Innes I, Ball G, Sefton AM, Eydmann M, Kearns AM, Shah HN. 2009. High throughput identification of clinical isolates of Staphylococcus aureus using MALDI‐TOF‐MS of intact cells. Infect Genet Evol 9: 507–513. [DOI] [PubMed] [Google Scholar]
- Reich M, Stark M, Huesgen G, Beyser K, Borgmann S. 2009. Rapid identification of bacteria in clinical microbiology routine diagnostics using MALDI‐TOF mass spectrometry. Int J Med Microbiol 299: 3. [Google Scholar]
- Russell SC. 2009. Microorganism characterization by single particle mass spectrometry. Mass Spectrom Rev 28: 376–387. [DOI] [PubMed] [Google Scholar]
- Russell KL, Broderick MP, Franklin SE, Blyn LB, Freed NE, Moradi E, Ecker DJ, Kammerer PE, Osuna MA, Kajon AE, Morn CB, Ryan MAK. 2006. Transmission dynamics and prospective environmental sampling of adenovirus in a military recruit setting. J Infect Dis 194: 877–885. [DOI] [PMC free article] [PubMed] [Google Scholar]
- Russell SC, Edwards N, Fenselau C. 2007. Detection of plasmid insertion in Escherichia coli by MALDI‐TOF mass spectrometry. Anal Chem 79: 5399–5406. [DOI] [PubMed] [Google Scholar]
- Sampath R, Hofstadler SA, Blyn LB, Eshoo MW, Hall TA, Massire C, Levene HM, Hannis JC, Harrell PM, Neuman B, Buchmeier MJ, Jiang Y, Ranken R, Drader JJ, Samant V, Griffey RH, McNeil JA, Crooke ST, Ecker DJ. 2005. Rapid identification of emerging pathogens: Coronavirus. Emerg Infect Dis 11: 373–379. [DOI] [PMC free article] [PubMed] [Google Scholar]
- Sampath R, Hall TA, Massire C, Li F, Blyn LB, Eshoo MW, Hofstadler SA, Ecker DJ. 2007a. Rapid identification of emerging infectious agents using PCR and electrospray ionization mass spectrometry. Ann NY Acad Sci 1102: 109–120. [DOI] [PMC free article] [PubMed] [Google Scholar]
- Sampath R, Russell KL, Massire C, Eshoo MW, Harpin V, Blyn LB, Melton R, Ivy C, Pennella T, Li F, Levene H, Hall TA, Libby B, Fan N, Walcott DJ, Ranken R, Pear M, Schink A, Gutierrez J, Drader J, Moore D, Metzgar D, Addington L, Rothman R, Gaydos CA, Yang S, George KS, Fuschino ME, Dean AB, Stallknecht DE, Goekjian G, Yingst S, Monteville M, Saad MD, Whitehouse CA, Baldwin C, Rudnick KH, Hofstadler S, Lemon M, Ecker DJ. 2007b. Global surveillance of emerging influenza virus genotypes by mass spectrometry. PLoS ONE 2: e489. [DOI] [PMC free article] [PubMed] [Google Scholar]
- Santos C, Paterson RRM, Venancio A, Lima N. 2010. Filamentous fungal characterizations by matrix‐assisted laser desorption/ionization time‐of‐flight mass spectrometry. J Appl Microbiol 108: 375–385. [DOI] [PubMed] [Google Scholar]
- Sauer S, Kliem M. 2010. Mass spectrometry tools for the classification and identification of bacteria. Nat Rev Microbiol 8: 74–82. [DOI] [PubMed] [Google Scholar]
- Schilling B, McLendon MK, Phillips NJ, Apicella MA, Gibson BW. 2007. Characterization of lipid a acylation patterns in Francisella tularensis, Francisella novicida, and Francisella philomiragia using multiple‐stage mass spectrometry and matrix‐assisted laser desorption/ionization on an intermediate vacuum source linear ion trap. Anal Chem 79: 1034–1042. [DOI] [PMC free article] [PubMed] [Google Scholar]
- Schmid O, Ball G, Lancashire L, Culak R, Shah H. 2005. New approaches to identification of bacterial pathogens by surface enhanced laser desorption/ionization time of flight mass spectrometry in concert with artificial neural networks, with special reference to Neisseria gonorrhoeae . J Med Microbiol 54: 1205–1211. [DOI] [PubMed] [Google Scholar]
- Scholl PF, Kongkasuriyachai D, Demirev PA, Feldman AB, Lin JS, Sullivan DJ, Kumar N. 2004. Rapid detection of malaria infection in vivo by laser desorption mass spectrometry. Am J Trop Med Hyg 71: 546–551. [PubMed] [Google Scholar]
- Seibold E, Bogumil R, Vorderwulbecke S, Al Dahouk S, Buckendahl A, Tomaso H, Splettstoesser W. 2007. Optimized application of surface‐enhanced laser desorption/ionization time‐of‐flight ms to differentiate Francisella tularensis at the level of subspecies and individual strains. FEMS Immunol Med Microbiol 49: 364–373. [DOI] [PubMed] [Google Scholar]
- Seng P, Drancourt M, Gouriet F, La Scola B, Fournier PE, Rolain JM, Raoult D. 2009. Ongoing revolution in bacteriology: Routine identification of bacteria by matrix‐assisted laser desorption ionization time‐of‐flight mass spectrometry. Clin Infect Dis 49: 543–551. [DOI] [PubMed] [Google Scholar]
- Seo GM, Kim SJ, Chai YG. 2004. Rapid profiling of the infection of Bacillus anthracis on human macrophages using SELDI‐TOF mass spectroscopy. Biochem Biophys Res Commun 325: 1236–1239. [DOI] [PubMed] [Google Scholar]
- Sharon N. 2006. Carbohydrates as future anti‐adhesion drugs for infectious diseases. Biochim Biophys Acta 1760: 527–537. [DOI] [PubMed] [Google Scholar]
- Shiea J, Huang MZ, HSu HJ, Lee CY, Yuan CH, Beech I, Sunner J. 2005. Electrospray‐assisted laser desorption/ionization mass spectrometry for direct ambient analysis of solids. Rapid Commun Mass Spectrom 19: 3701–3704. [DOI] [PubMed] [Google Scholar]
- Smole SC, King LA, Leopold PE, Arbeit RD. 2002. Sample preparation of gram‐positive bacteria for identification by matrix assisted laser desorption/ionization time‐of‐flight. J Microbiol Methods 48: 107–115. [DOI] [PubMed] [Google Scholar]
- Snyder AP, Dworzanski JP, Tripathi A, Maswadeh WM, Wick CH. 2004. Correlation of mass spectrometry identified bacterial biomarkers from a fielded pyrolysis‐gas chromatography‐ion mobility spectrometry biodetector with the microbiological gram stain classification scheme. Anal Chem 76: 6492–6499. [DOI] [PubMed] [Google Scholar]
- Sobeih KL, Baron M, Gonzalez‐Rodriguez J. 2008. Recent trends and developments in pyrolysis‐gas chromatography. J Chromatogr A 1186: 51–66. [DOI] [PubMed] [Google Scholar]
- Sobrino B, Brion M, Carracedo A. 2005. SNPs in forensic genetics: A review on SNP typing methodologies. Forensic Sci Int 154: 181–194. [DOI] [PubMed] [Google Scholar]
- Song YS, Talaty N, Tao WA, Pan ZZ, Cooks RG. 2007. Rapid ambient mass spectrometric profiling of intact, untreated bacteria using desorption electrospray ionization. Chem Commun: 61–63. [DOI] [PubMed] [Google Scholar]
- Song Y, Talaty N, Datsenko K, Wanner BL, Cooks RG. 2009. In vivo recognition of Bacillus subtilis by desorption electrospray ionization mass spectrometry (DESI‐MS). Analyst 134: 838–841. [DOI] [PubMed] [Google Scholar]
- Srivastava A, Pitesky ME, Steele PT, Tobias HJ, Fergenson DP, Horn JM, Russell SC, Czerwieniec GA, Lebrilla CB, Gard EE, Frank M. 2005. Comprehensive assignment of mass spectral signatures from individual Bacillus atrophaeus spores in matrix‐free laser desorption/ionization bioaerosol mass spectrometry. Anal Chem 77: 3315–3323. [DOI] [PubMed] [Google Scholar]
- Stevenson LG, Drake SK, Murray PR. 2010. Rapid identification of bacteria in positive blood culture broths by matrix‐assisted laser desorption ionization‐time of flight mass spectrometry. J Clin Microbiol 48: 444–447. [DOI] [PMC free article] [PubMed] [Google Scholar]
- Stopforth A, Tredoux A, Crouch A, Helden PV, Sandra P. 2005. A rapid method of diagnosing pulmonary tuberculosis using stir bar sorptive extraction‐thermal desorption‐gas chromatography‐mass spectrometry. J Chromatogr A 1071: 135–139. [DOI] [PubMed] [Google Scholar]
- Stowers MA, van Wuijckhuijse AL, Marijnissen JCM, Scarlett B, van Baar BLM, Kientz CE. 2000. Application of matrix‐assisted laser desorption/ionization to on‐line aerosol time‐of‐flight mass spectrometry. Rapid Commun Mass Spectrom 14: 829–833. [DOI] [PubMed] [Google Scholar]
- Stowers MA, van Wuijckhuijse AL, Marijnissen JCM, Kientz CE, Ciach T. 2006. Fluorescence preselection of bioaerosol for single‐particle mass spectrometry. Appl Opt 45: 8531–8536. [DOI] [PubMed] [Google Scholar]
- Swatkoski S, Russell S, Edwards N, Fenselau C. 2007. Analysis of a model virus using residue‐specific chemical cleavage and MALDI‐TOF mass spectrometry. Anal Chem 79: 654–658. [DOI] [PubMed] [Google Scholar]
- Takats Z, Wiseman JM, Gologan B, Cooks RG. 2004. Mass spectrometry sampling under ambient conditions with desorption electrospray ionization. Science 306: 471–473. [DOI] [PubMed] [Google Scholar]
- Talbot HM, Squier AH, Keely BJ, Farrimond P. 2003a. Atmospheric pressure chemical ionisation reversed‐phase liquid chromatography/ion trap mass spectrometry of intact bacteriohopanepolyols. Rapid Commun Mass Spectrom 17: 728–737. [DOI] [PubMed] [Google Scholar]
- Talbot HM, Summons R, Jahnke L, Farrimond P. 2003b. Characteristic fragmentation of bacteriohopanepolyols during atmospheric pressure chemical ionisation liquid chromatography/ion trap mass spectrometry. Rapid Commun Mass Spectrom 17: 2788–2796. [DOI] [PubMed] [Google Scholar]
- Talbot HM, Rohmer M, Farrimond P. 2007a. Rapid structural elucidation of composite bacterial hopanoids by atmospheric pressure chemical ionisation liquid chromatography/ion trap mass spectrometry. Rapid Commun Mass Spectrom 21: 880–892. [DOI] [PubMed] [Google Scholar]
- Talbot HM, Rohmer M, Farrimond P. 2007b. Structural characterisation of unsaturated bacterial hopanoids by atmospheric pressure chemical ionisation liquid chromatography/ion trap mass spectrometry. Rapid Commun Mass Spectrom 21: 1613–1622. [DOI] [PubMed] [Google Scholar]
- Tang W, Zhu L, Smith LM. 1997. Controlling DNA fragmentation in MALDI‐MS by chemical modification. Anal Chem 69: 302–312. [DOI] [PubMed] [Google Scholar]
- Tao L, Yu X, Snyder AP, Li L. 2004. Bacterial identification by protein mass mapping combined with an experimentally derived protein mass database. Anal Chem 76: 6609–6617. [DOI] [PubMed] [Google Scholar]
- Taranenko NI, Hurt R, Zhou JZ, Isola NR, Huang H, Lee SH, Chen CH. 2002. Laser desorption mass spectrometry for microbial DNA analysis. J Microbiol Methods 48: 101–106. [DOI] [PubMed] [Google Scholar]
- Therisod H, Labas V, Caroff M. 2001. Direct microextraction and analysis of rough‐type lipopolysaccharides by combined thin‐layer chromatography and MALDI mass spectrometry. Anal Chem 73: 3804–3807. [DOI] [PubMed] [Google Scholar]
- Thompson CE, Jungnickel H, Lockyer NP, Stephens GM, Vickerman JC. 2004. TOF‐SIMS studies as a tool to discriminate between spores and vegetative cells of bacteria. Appl Surf Sci 231: 420–423. [Google Scholar]
- Thulasiraman V, McCutchen‐Maloney SL, Motin VL, Garcia E. 2000. Detection and identification of virulence factors in Yersinia pestis using SELDI ProteinChip System. BioTechniques 30: 428–432. [DOI] [PubMed] [Google Scholar]
- Tirsoaga A, El Hamidi A, Perry MB, Caroff M, Novikov A. 2007. A rapid, small‐scale procedure for the structural characterization of lipid a applied to Citrobacter and Bordetella strains: Discovery of a new structural element. J Lipid Res 48: 2419–2427. [DOI] [PubMed] [Google Scholar]
- Tobias HJ, Schafer MP, Pitesky M, Fergenson DP, Horn J, Frank M, Gard EE. 2005. Bioaerosol mass spectrometry for rapid detection of individual airborne Mycobacterium tuberculosis H37RA particles. Appl Environ Microbiol 71: 6086–6095. [DOI] [PMC free article] [PubMed] [Google Scholar]
- Tobias HJ, Pitesky ME, Fergenson DP, Steele PT, Horn J, Frank M, Gard EE. 2006. Following the biochemical and morphological changes of Bacillus atrophaeus cells during the sporulation process using bioaerosol mass spectrometry. J Microbiol Methods 67: 56–63. [DOI] [PubMed] [Google Scholar]
- Tost J, Gut IG. 2006. DNA analysis by mass spectrometry—Past, present and future. J Mass Spectrom 41: 981–995. [DOI] [PubMed] [Google Scholar]
- Vaidyanathan S, Rowland JJ, Kell DB, Goodacre R. 2001. Discrimination of aerobic endospore‐forming bacteria via electrospray‐ionization mass spectrometry of whole cell suspensions. Anal Chem 73: 4134–4144. [DOI] [PubMed] [Google Scholar]
- Vaidyanathan S, Kell DB, Goodacre R. 2002. Flow‐injection electrospray ionization mass spectrometry of crude cell extracts for high‐throughput bacterial identification. J Am Soc Mass Spectrom 13: 118–128. [DOI] [PubMed] [Google Scholar]
- Vaidyanathan S, O'Hagan S, Goodacre R. 2006. Direct infusion electrospray ionization mass spectra of crude cell extracts for microbial characterizations: Influence of solvent conditions on the detection of proteins. Rapid Commun Mass Spectrom 20: 21–30. [DOI] [PubMed] [Google Scholar]
- Valentine NB, Wahl JH, Kingsley MT, Wahl KL. 2002. Direct surface analysis of fungal species by matrix‐assisted laser desorption/ionization mass spectrometry. Rapid Commun Mass Spectrom 16: 1352–1357. [DOI] [PubMed] [Google Scholar]
- Valentine N, Wunschel S, Wunschel D, Petersen C, Wahl K. 2005. Effect of culture conditions on microorganism identification by matrix‐assisted laser desorption ionization mass spectrometry. Appl Environ Microbiol 71: 58–64. [DOI] [PMC free article] [PubMed] [Google Scholar]
- van Baar BLM, Hulst AG, de Jong AL, Wils ERJ. 2002. Characterisation of botulinum toxins type A and B, by matrix‐assisted laser desorption ionisation and electrospray mass spectrometry. J Chromatogr A 970: 95–115. [DOI] [PubMed] [Google Scholar]
- van Baar BLM, Hulst AG, Roberts B, Wils ERJ. 2002. Characterization of tetanus toxin, neat and in culture supernatant, by electrospray mass spectrometry. Anal Biochem 301: 278–289. [DOI] [PubMed] [Google Scholar]
- van Baar BLM, Hulst AG, de Jong AL, Wils ERJ. 2004. Characterisation of botulinum toxins type C, D, E, and F by matrix‐assisted laser desorption ionisation and electrospray mass spectrometry. J Chromatogr A 1035: 97–114. [DOI] [PubMed] [Google Scholar]
- van Wuijckhuijse AL, Stowers MA, Kleefsman WA, van Baar BLM, Kientz CE, Marijnissen JCM. 2005. Matrix‐assisted laser desorption/ionisation aerosol time‐of‐flight mass spectrometry for the analysis of bioaerosols: Development of a fast detector for airborne biological pathogens. J Aerosol Sci 36: 677–687. [Google Scholar]
- Vargha M, Takáts Z, Konopka A, Nakatsu CH. 2006. Optimization of MALDI‐TOF MS for strain level differentiation of arthrobacter isolates. J Microbiol Methods 66: 399–409. [DOI] [PubMed] [Google Scholar]
- Varshney M, Yang L, Su X‐L, Li Y. 2005. Magnetic nanoparticle‐antibody conjugates for the separation of Escherichia coli O157:H7 in ground beef. J Food Prot 68: 1804–1811. [DOI] [PubMed] [Google Scholar]
- Vereshchagin VA, Il'ina EN, Zubkov MM, Priputnevich TV, Kubanova AA, Govorun VM. 2005. Detection of fluoroquinolone resistance SNPS in gyrA and parC genes of Neisseria gonorrhoeae using MALDI‐TOF mass‐spectrometry. Mol Biol (Mosk) 36: 806–814. [PubMed] [Google Scholar]
- von Wintzingerode F, Bocker S, Schlotelburg C, Chiu NHL, Storm N, Jurinke C, Cantor CR, Gobel UB, van den Boom D. 2002. Base‐specific fragmentation of amplified 16s rRNA genes analyzed by mass spectrometry: A tool for rapid bacterial identification. Proc Natl Acad Sci USA 99: 7039–7044. [DOI] [PMC free article] [PubMed] [Google Scholar]
- Voorhees KJ, Abbas‐Hawks C, Miketova P. 2006a. Identification of protein biomarkers in the pyrolysis electron ionization high‐resolution mass spectrum of Brucella neotomae . J Anal Appl Pyrol 75: 90–96. [Google Scholar]
- Voorhees KJ, Miketova P, Abbas‐Hawks C, Hadfield TL. 2006b. Identification of lipid‐based biomarkers in the high‐resolution pyrolysis/mass spectrum of Brucella neotomae . J Anal Appl Pyrol 75: 33–42. [Google Scholar]
- Walker J, Fox AJ, Edwards‐Jones V, Gordon DB. 2002. Intact cell mass spectrometry (ICMS) used to type methicillin‐resistant Staphylococcus aureus: Media effects and inter‐laboratory reproducibility. J Microbiol Methods 48: 117–126. [DOI] [PubMed] [Google Scholar]
- Wang H, Hanash S. 2005. Intact‐protein based sample preparation strategies for proteome analysis in combination with mass spectrometry. Mass Spectrom Rev 24: 413–426. [DOI] [PubMed] [Google Scholar]
- Wang Z, Dunlop K, Long SR, Li L. 2002. Mass spectrometric methods for generation of protein mass database used for bacterial identification. Anal Chem 74: 3174–3182. [DOI] [PubMed] [Google Scholar]
- Warscheid B, Fenselau C. 2003. Characterization of Bacillus spore species and their mixtures using postsource decay with a curved‐field reflectron. Anal Chem 75: 5618–5627. [DOI] [PubMed] [Google Scholar]
- Warscheid B, Fenselau C. 2004. A targeted proteomics approach to the rapid identification of bacterial cell mixtures by matrix‐assisted laser desorption/ionization mass spectrometry. Proteomics 4: 2877–2892. [DOI] [PubMed] [Google Scholar]
- Warscheid B, Jackson K, Sutton C, Fenselau C. 2003. MALDI analysis of bacilli in spore mixtures by applying a quadrupole ion trap time‐of‐flight tandem mass spectrometer. Anal Chem 75: 5608–5617. [DOI] [PubMed] [Google Scholar]
- Welham KJ, Domin MA, Johnson K, Jones L, Ashton DS. 2000. Characterization of fungal spores by laser desorption/ionization time‐of‐flight mass spectrometry. Rapid Commun Mass Spectrom 14: 307–310. [DOI] [PubMed] [Google Scholar]
- White DC, Lytle CA, Gan YDM, Piceno YM, Wimpee MH, Peacock AD, Smith CA. 2002. Flash detection/identification of pathogens, bacterial spores and bioterrorism agent biomarkers from clinical and environmental matrices. J Microbiol Methods 48: 139–147. [DOI] [PubMed] [Google Scholar]
- Whiteaker JR, Warscheid B, Pribil P, Hathout Y, Fenselau C. 2004. Complete sequences of small acid‐soluble proteins from Bacillus globigii . J Mass Spectrom 39: 1113–1121. [DOI] [PubMed] [Google Scholar]
- Wilkes JG, Rushing L, Nayak R, Buzatu DA, Sutherland JB. 2005. Rapid phenotypic characterization of Salmonella enterica strains by pyrolysis metastable atom bombardment mass spectrometry with multivariate statistical and artificial neural network pattern recognition. J Microbiol Methods 61: 321–334. [DOI] [PubMed] [Google Scholar]
- Wilkes JG, Rafii F, Sutherland JB, Rushing LG, Buzatu DA. 2006. Pyrolysis mass spectrometry for distinguishing potential hoax materials from bioterror agents. Rapid Commun Mass Spectrom 20: 2383–2386. [DOI] [PubMed] [Google Scholar]
- Williams TL, Leopold P, Musser S. 2002. Automated postprocessing of electrospray LC/MS data for profiling protein expression in bacteria. Anal Chem 74: 5807–5813. [DOI] [PubMed] [Google Scholar]
- Williams TL, Andrzejewski D, Lay JO, Musser SM. 2003. Experimental factors affecting the quality and reproducibility of MALDI TOF mass spectra obtained from whole bacteria cells. J Am Soc Mass Spectrom 14: 342–351. [DOI] [PubMed] [Google Scholar]
- Williams TL, Musser SM, Nordstrom JL, DePaola A, Monday SR. 2004. Identification of a protein biomarker unique to the pandemic o3: K6 clone of Vibrio parahaemolyticus . J Clin Microbiol 42: 1657–1665. [DOI] [PMC free article] [PubMed] [Google Scholar]
- Williams TL, Monday SR, Edelson‐Mammel S, Buchanan R, Musser SM. 2005. A top‐down proteomics approach for differentiating thermal resistant strains of Enterobacter sakazakii . Proteomics 5: 4161–4169. [DOI] [PubMed] [Google Scholar]
- Williamson YM, Moura H, Woolfitt AR, Pirkle JL, Barr JR, Carvalho MDG, Ades EP, Carlone GM, Sampson JS. 2008. Differentiation of Streptococcus pneumoniae conjunctivitis outbreak isolates by matrix‐assisted laser desorption ionization‐time of flight mass spectrometry. Appl Environ Microbiol 74: 5891–5897. [DOI] [PMC free article] [PubMed] [Google Scholar]
- Wolk DM, Blyn LB, Hall TA, Sampath R, Ranken R, Ivy C, Melton R, Matthews H, White N, Li F, Harpin V, Ecker DJ, Limbago B, McDougal LK, Wysocki VH, Cai M, Carroll KC. 2009. Pathogen profiling: Rapid molecular characterization of Staphylococcus aureus by PCR/electrospray ionization‐mass spectrometry and correlation with phenotype. J Clin Microbiol 47: 3129–3137. [DOI] [PMC free article] [PubMed] [Google Scholar]
- Wunschel SC, Jarman KH, Petersen CE, Valentine NB, Wahl KL, Schauki D, Jackman J, Nelson CP, White E. 2005. Bacterial analysis by MALDI‐TOF mass spectrometry: An inter‐lab oratory comparison. J Am Soc Mass Spectrom 16: 456–462. [DOI] [PubMed] [Google Scholar]
- Wynne C, Fenselau C, Demirev PA, Edwards N. 2009. Top‐down identification of protein biomarkers in bacteria with unsequenced genomes. Anal Chem 81: 9633–9642. [DOI] [PubMed] [Google Scholar]
- Xiang F, Anderson GA, Veenstra TD, Lipton MS, Smith RD. 2000. Characterization of microorganisms and biomarker development from global ESI‐MS/MS analyses of cell lysates. Anal Chem 72: 2475–2481. [DOI] [PubMed] [Google Scholar]
- Xiao DW, Yang YC, Liu H, Yu H, Yan YJ, Huang WF, Jiang W, Liao WJ, Hu Q, Huang B. 2009. Development of a method based on surface enhanced laser desorption and ionization time of flight mass spectrometry for rapid identification of Klebsiella pneumoniae . J Microbiol 47: 646–650. [DOI] [PubMed] [Google Scholar]
- Yang YC, Yu H, Xiao DW, Liu H, Hu Q, Huang B, Liao WJ, Huang WF. 2009. Rapid identification of Staphylococcus aureus by surface enhanced laser desorption and ionization time of flight mass spectrometry. J Microbiol Methods 77: 202–206. [DOI] [PubMed] [Google Scholar]
- Yao Z‐P, Demirev PA, Fenselau C. 2002. Mass spectrometry‐based proteolytic mapping for rapid virus identification. Anal Chem 74: 2529–2534. [DOI] [PubMed] [Google Scholar]
- Yates JWT, Gardner JW, Chappell MJ, Dow CS. 2005. Identification of bacterial pathogens using quadrupole mass spectrometer data and radial basis function neural networks. IEE Proceedings: Science, Measurement and Technology 152: 97–102. [Google Scholar]
- Zhang B, Li F, Houk RS, Armstrong DW. 2003. Pore exclusion chromatography‐inductively coupled plasma‐mass spectrometry for monitoring elements in bacteria: A study on microbial removal of uranium from aqueous solution. Anal Chem 75: 6901–6905. [DOI] [PubMed] [Google Scholar]
- Zhang CL, Huang ZY, Li YL, Romanek CS, Mills GL, Gibson RA, Talbot HM, Wiegel J, Noakes J, Culp R, White DC. 2007. Lipid biomarkers, carbon isotopes, and phylogenetic characterization of bacteria in California and Nevada hot springs. Geomicrobiol J 24: 519–534. [Google Scholar]
- Zhou X, Gonnet G, Hallett M, Münchbach M, Folkers G, James P. 2001. Cell fingerprinting: An approach to classifying cells according to mass profiles of digests of protein extracts. Proteomics 1: 683–690. [DOI] [PubMed] [Google Scholar]