Abstract
Severe acute respiratory syndrome (SARS) is a highly infectious disease caused by a coronavirus. Screening to detect a potential SARS infected person plays an important role in preventing the spread of SARS. The use of infrared thermal imaging cameras has been proposed as a noninvasive, speedy, cost effective and fairly accurate means for mass blind screening of potential SARS infected persons. Infrared thermography provides a digital image showing temperature patterns. This has been previously utilized in the detection of inflammation and nerve dysfunctions. It is believed that IR cameras can potentially be used to detect subjects with fever, the cardinal symptom of SARS, and avian influenza. The accuracy of the infrared system can, however, be affected by human, environmental, and equipment variables. It is also limited by the fact that the thermal imager measures the skin temperature and not the core body temperature. As known, the body determines a temperature as its so‐called “set point” at any one time during the body temperature regulation. Fever happens if the hypothalamus detects pyrogens and then raises the set point. The time course of a typical fever can be divided into three stages. When the fever initiates, the body attempts to raise its temperature but vasoconstriction occurs to prevent heat loss through the skin. With this reason, some individuals at this stage of fever (at the rising slope and immediately after fever begins or falling slope after the fever breaks) will not be detected by the scanner if it is not designed to detect subject at the plateau of the fever (with her/his high core temperature) in particular. This paper aims to study the effectiveness of infrared systems for its application in mass blind screening to detect subjects with elevated body temperature. For this application, it is critical for thermal imagers to be able to identify febrile from normal subjects accurately. Minimizing the number of false positive and false negative cases, improves the efficiency of the screening stations. False negative results should be avoided at all costs, as letting a SARS infected person through the screening process may result in potentially catastrophic results. Various statistical methods such as linear regression, Receiver Operating Characteristics analysis, and neural networks based classification were used to analyze the temperature data collected from various sites on the face on both the frontal and side profiles. Two important conclusions were drawn from the analysis: the best region on the face to obtain temperature readings and the optimal preset threshold temperature for the thermal imager. To conclude, the current research application will remain an interest and useful for reference by both local and overseas manufacturers of thermal scanners, users, and various government and private establishments. As elevation of body temperature is a common presenting symptom for many illnesses including infectious diseases, thermal imagers are useful tools for mass screening of body temperature not only for SARS but also during other public health crisis where widespread transmission of infection is a concern.
Keywords: Thermography, Diseases, Biothermics and thermal processes in biology, Neural networks and synaptic communication, Computer simulation, Non‐ionizing radiation equipment and techniques, General statistical methods
Keywords: infrared imaging, biomedical optical imaging, diseases, skin, biothermics, neurophysiology, microorganisms, regression analysis, neural nets, medical computing, biomedical equipment, sensitivity analysis
Keywords: SARS, avian flu, IR system, bio‐statistics, NN, ROC, fever, threshold temperature
Keywords: Thermal imaging, Medical imaging, Skin, Image scanners, Data analysis, Thermal analysis, Image analysis, Infrared detectors, Cameras, Thermography
I. BACKGROUND
By July 11 2003, the flu‐like severe acute respiratory syndrome (SARS) infected more than 8437 people worldwide, causing 813 deaths. 1 Most cases were in mainland China, 2 Hong Kong, 3 and Taiwan. In Singapore, 238 people were infected and 33 died. The disease was severe, transmissible from person to person, and has caused clusters of disease among health‐care workers in particular. SARS outbreaks also happened in South‐East Asia, North America, Europe, and became the first pandemic of the 21st century. As of the time of writing, 13 more people (with 1 dead) were diagnosed with SARS in Beijing and Anhui (May 2004). It is estimated that SARS has caused a financial loss over U.S. $35 billion worldwide.
Hitherto, the diagnosis of SARS is based on clinical and epidemiologic considerations. Interestingly, the criteria for confirmed or suspected diagnosis are not perfect as yet. Fever, which is often thought essential for diagnosis, is also seen in patients with common cold; thus, it is problematic to define “suspected cases” on the basis of fever. Sending the suspected cases to hospital for specific laboratory tests is thus necessary after confirmation of the person's actual body temperature reading with usual clinical thermometer. As quoted in the Canada National Post: 4 “SARS scanners praised as placebo. Health Canada report: Cost $2‐million, of the 462 000 people screened in the first month of operation, 341 had fevers, but no SARS cases, yet ‘build confidence’.” Current infrared (IR) systems in use at various boarder checkpoints have not been scientifically validated particularly in regards to the false negative rate. 4 , 5 , 6 , 7 As a result they may create a false sense of security by underestimating the number of febrile (and possibly infected) individuals. The unadjusted mode threshold temperature setting in a thermal imager needs to correct for the difference between the skin and core body temperatures. It then has to take into account the effects of ambient conditions and the thermal imager's performance parameters.
Presently, there is a lack of empirical data in correlating facial skin with body temperature. Obtaining a meaningful temperature for the human body therefore requires identifying a suitable facial site that will provide reliable data across a large population since skin temperature does not solely depend on body temperature and may be affected by other physiological and environmental factors. Besides, the use of skin temperature as a proxy to the body temperature may be inaccurate at some stages of fever. When the fever starts, the body intends to raise its temperature and vasoconstriction happens to prevent a reduction heat loss through the skin. The skin temperature will, hence, be cold at that moment where the IR radiation may not reach the set threshold for the thermal scanner to pick out. As also known, a few patients who have underling diseases (such as cancer, diabetes, hypertension, or chronic obstructive pulmonary disease) or in the postoperative state would present without fever at the early stage of SARS infection. Thus, the thermal scanner and even the clinical diagnostic criteria have important limitations that might lead to false positive or negative diagnoses in the worse case. This technical note aims to discuss the effectiveness of thermal scanner for blind screening of fever subjects.
II. METHODS
Biostatistics with regression analysis, 8 Receiver Operating Characteristics (ROC), 9 and neural networks based classification 13 is applied to analyze the blind data collected (502 without duplicate measurements, confirmed later 86 febrile and 416 healthy cases with ear thermometer) from the SARS hospital [A & E Dept., Tan Tock Seng Hospital (TTSH)] and the Civil Defense Force Academy (SCDF) in Singapore (screening ambient temperature is , humidity around 60%) in which thermal imagers are used as a first line tool for the blind screening of hyperthermia. The subjects are considered febrile if his/her mean ear temperature is for adult ( for children) using Braun Thermoscan IRT . Results are drawn for the two important pieces of information: the best and yet practical region on the face to screen and guidance on optimal preset threshold temperature for the handheld radiometric IR ThermaCAM S60 FLIR system. 10 , 11 , 12 , 13 The focal length from the subject to scanner was fixed at and the duration of time patients must be scanned was . The detector was a focal plane array, uncooled microbolometer pixels with a thermal sensitivity of at , spectral range of and measurement accuracy at of the real‐time reading. 14 The average temperature of the skin surface was measured from the field of view of the thermal imager with an appropriate adjustment for skin emissivity. Human skin emissivity may vary from site to site ranging from 0.94 to 0.99 (0.98 was used here). The following spots were logged and analyzed from the frontal profiles: forehead; eye region; average cheeks; nose; mouth (closed); and average temples. The images were further processed to obtain readings from both frontal and side profiles from some of the subjects. Figures 1, 2 present an example of the processed thermal images of both frontal and side (left) profiles from the same subject. The following spots were logged from the subjects with frontal and side profiles: forehead; eye region; average cheeks; nose; mouth (closed); average temple; side face; ears; and side temple. Figure 3 further illustrates an example of temperature profiles from a temperature operation using thermal imager with temperature reading. Reproducibility of both the instrument and physiological assumptions was established by comparing paired left‐right readings of the temples and cheeks. 12
Figure 1.
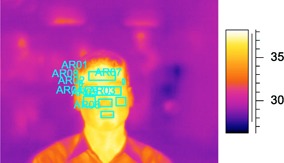
Processed thermal image of the frontal profile.
Figure 2.
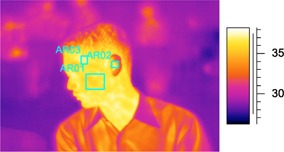
Processed thermal images of the side profile.
Figure 3.
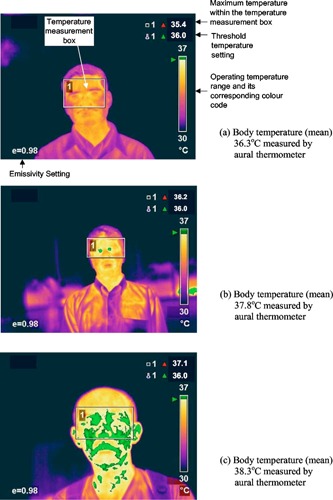
Examples of temperature profiles using thermal imager with temperature reading.
III. FINDINGS AND INTERPRETATION
Figure 4 shows an example of the regression line obtained with skin temperatures extracted from the near inner eye range. Table I indicates that the thermal imagers hold much promise for mass screening when the readings from the front averaged temples region have good correlation with the ear temperature, followed by maximum temperature in near‐eye and forehead regions. Figure 5 presents the ROC curve obtained and Table II is the ROC report. A randomly selected individual from the fever group has a test value larger than that for a randomly selected individual from the normal group in 90.7% of the time. The ROC test can distinguish between the normal and febrile groups and an optimum threshold temperature (marked as * in Table II) for the thermal imager, to detect an adult aural temperature of and above, is and this allows sensitivity of 90.7% and specificity of 75.8%. (In fact, by drawing a vertical line in Fig. 4 at skin and a horizontal line at body , one can quickly assess the sensitivity and specificity that matches the prediction from ROC with MedCalc. Note that there are as many data points in the lower left box than in the top left box due to overlapping of operating points for normal temperature range.) This setting is dependent on the values of sensitivity and specificity (both to be high) from the ROC analysis results. Any temperature readings that exceed this setting will trigger off the alarm and there is need to verify the fact.
Figure 4.
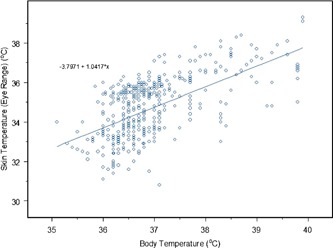
Temperature distribution of body vs skin (near inner eye range with
Table I.
Regression analysis performed on body and skin temperatures measured from different facial sites.
| Description | Regression ratio | Intercept |
|
||
|---|---|---|---|---|---|
| Frontal | Forehead | 0.4206 | 22.5443 | 0.3495 | |
| Eye range | 0.5175 | 19.2068 | 0.4005 | ||
| Ave cheeks | 0.3896 | 23.8133 | 0.3582 | ||
| Nose | 0.1846 | 30.6197 | 0.1295 | ||
| Mouth | 0.2997 | 26.7337 | 0.1374 | ||
| Ave temples | 0.5490 | 18.1076 | 0.4532 | ||
| Side | Side face | 0.4065 | 23.1397 | 0.4731 | |
| Ear | 0.4880 | 20.0523 | 0.4205 | ||
| Side temples | 0.5407 | 18.2503 | 0.4509 |
Figure 5.
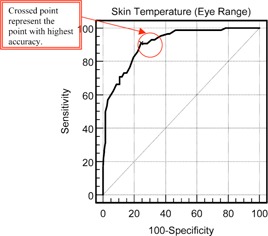
ROC curve of skin temperature (near inner eye range) at cutoff
Table II.
ROC report of skin temperature (near inner eye range).
| temperature (eye range) | ||||||
| Classification Variable: Diagnosis | ||||||
| Positive Group | ||||||
|
| ||||||
| Sample | ||||||
| Negative Group | ||||||
|
| ||||||
| Sample | ||||||
| Disease prevalence unknown | ||||||
| Area under the ROC | ||||||
| Standard | ||||||
| 95% confidence to 0.934 | ||||||
| Criterion | Sens. (95% C.I.) | Spec. (95% C.I.) |
|
|
||
|
|
100.0 (95.8‐100.0) | 0.0 (0.0‐ 1.2) | 1.00 | |||
| >30.8 | 100.0 (95.8‐100.0) | 0.6 (0.1‐ 2.3) | 1.01 | 0.00 | ||
| >31.1 | 100.0 (95.8‐100.0) | 1.0 (0.2‐ 2.8) | 1.01 | 0.00 | ||
| >34.4 | 90.7 (82.5‐ 95.9) | 71.7 (66.3‐ 76.6) | 3.20 | 0.13 | ||
| >34.5 | 90.7 (82.5‐ 95.9) | 72.9 (67.7 ‐77.8) | 3.35 | 0.13 | ||
| >34.6 * | 90.7 (82.5‐ 95.9) | 75.8 (70.7‐ 80.4) | 3.75 | 0.12 | ||
| >34.7 | 86.0 (76.9‐ 92.6) | 77.7 (72.7‐ 82.2) | 3.86 | 0.18 | ||
| >34.8 | 82.6 (72.9‐ 89.9) | 80.6 (75.8‐ 84.8) | 4.25 | 0.22 | ||
| >34.9 | 76.7 (66.4‐ 85.2) | 82.8 (78.2‐ 86.8) | 4.46 | 0.28 | ||
| >35 | 74.4 (63.9‐ 83.2) | 84.1 (79.6‐ 87.9) | 4.67 | 0.30 | ||
| >36.7 | 38.4 (28.1‐ 49.5) | 98.4 (96.3‐ 99.5) | 24.10 | 0.63 | ||
| >36.8 | 36.0 (26.0‐ 47.1) | 98.4 (96.3‐ 99.5) | 22.64 | 0.65 | ||
| >36.9 | 31.4 (21.8‐ 42.3) | 98.4 (96.3‐ 99.5) | 19.72 | 0.70 | ||
| >37 | 30.2 (20.8‐ 41.1) | 98.7 (96.8‐ 99.6) | 23.73 | 0.71 | ||
|
| ||||||
|
| ||||||
| likelihood ratio | ||||||
| likelihood ratio | ||||||
In the single layer perception backpropagation neural network (NN) experiment, 15 different parameters are tested at each time to choose the best parameter for multilayer perception evaluation in order to achieve a good score with different numbers of hidden neurons. In Kohonen network, the Kohonen Layer has a better performance to classify the classes. Increasing the number of hidden neurons will improve the performance but the score will descend if the number of hidden neurons is exceeded. Thus, from the NN results, 13 it shows that such type of neural network 15 can be used as clinical decision support system for mass screening of febrile subjects.
The current data are only valid for the groups on which it was taken in the indoor control environment, and that further work will be necessary to verify whether this approach yields reasonable sensitivity and specificity for actual mass‐screening tests in airports where factors such as environmental factors (if without aerobridge), 10 the physiological site offset, 11 and the performance characteristics of thermal imager 12 are crucial to warrant the most accurate and reliable screening operation. Such tests will have to be carefully planned and conducted, since the number of febrile subjects walking through airports, for example, is probably quite low. This step is thus essential, however, if we are to rely on IR imaging for SARS screening, since there is already general criticism that the method produces a false sense of security. Generally, different people do not always measure success in the same way. In the case of SARS, thermography probably did play a positive role during the SARS crisis, as far as psychological warfare (political) was concerned. The lesson is that we could have done a much better job of actually finding SARS cases if the methodology used had been correct implemented.
In all, SARS is an evil affecting all humanity, not just some country or region. The mortality of SARS patients is considerable (4%–10%). Early detection and recognition of patients with severe involvement, and timely prevention and management, are critical in reducing mortality should there be any future outbreak. To prevent the spread of the infectious agent in SARS across the country boarder effectively, one should thus emphasize the importance of international collaboration as an effective strategy to control emerging diseases in people, particularly for those diseases with the potential to become pandemic such as SARS and avian‐flu in which fever is one of the main symptom, etc.
ACKNOWLEDGMENTS
The author would like to express his appreciation to members of the Technical Reference Committee on Thermal Imagers under Medical Technology Standards Division by SPRING, Dr. K. H. Pwee, Director of CSTA, Ministry of Health, Dr. G. J. L. Kaw, Consultant Radiologist, TTSH of National Health Group, Singapore for sharing of their views and interests on “Thermal Imagers for Fever Screening—Selection, Usage and Testing.”
REFERENCES
- 1.WHO, Cumulative number of reported probable cases of severe acute respirator syndrome (SAILS). http://www.who.int/csr/sarscountr2003-07-11/en (accessed 17 Sept. 2004).
- 2.Guangdong Public Health Office, 2003 Document No. 2: Summary report of investigating an atypical pneumonia outbreak in Zhongshan, Jan. 21, 2003.
- 3. Lee N. et al., “A major outbreak of severe acute respirator syndrome in Hong Kong,” N. Engl. J. Med. 0028‐4793 348, 198–94 (2003). [DOI] [PubMed] [Google Scholar]
- 4.Canada National Post, “SARS scanners praised as placebo,” tblackwell@nationalpost.com, Sept. 24, 2003.
- 5.The Manila Times, “Airport SARS screener defective,” May 17, 2003.
- 6.The Malaysian Berita Harian, “Checkpoints’ thermal scanners unsuitable,” May 24, 2003;; “Our neighbor is not serious in containing SARS,” May 26, 2003.
- 7.The Strait Times, “Singapore rebuts criticism of its thermal scanners,” http://straitstimes.asia1.com.sg/sars/story/0,4395,191573,00.html? May 29, 2003. (accessed 17 Sept. 2004).
- 8. Golberg M. A. and Cho H. A., Introduction to Regression Analysis (WIT, Southampton, 2004). [Google Scholar]
- 9. Shapiro David E., “The interpretation of diagnostic tests,” Stat. Methods Med. Res. 0962‐2802 8, 113–134 (1999). [DOI] [PubMed] [Google Scholar]
- 10. Ng E. Y.‐K., Kaw G., and Chang W. M., “Analysis of IR thermal imager for mass blind fever screening,” Microvasc. Res. 0026‐2862 68, 104–109 (2004). [DOI] [PubMed] [Google Scholar]
- 11. Ng E. Y.‐K. and Kaw G. J. L., “IR Scanners as Fever Monitoring Devices: Physics, Physiology and Clinical Accuracy,” in Biomedical Engineering Handbook, CRC Press, Editor: Diakides Nicholas. (July 2005). [Google Scholar]
- 12. Ng E. Y.‐K., Wiryani M., and Wong B. S., “Study of Facial Skin and Aural Temperature using IR with and w/o TRS, IEEE Engineering in Medicine and Biology Magazine (2004) (in press). [DOI] [PubMed]
- 13. Ng E. Y.‐K. and Chong C., “ANN based Mapping of Febrile Subjects in Mass Thermogram Screening: Facts and myths, International Journal of Medical Engineering & Technology, Taylor & Francis; (2004) (in press). [DOI] [PubMed] [Google Scholar]
- 14.FLIR Systems: http://www.flir.com (accessed 17 Sept. 2004).
- 15.NeuralWorks software by NeuralWare, Inc., Carnegie, Pennsylvania, USA. URL: http://www.neuralware.com (accessed 19 Aug. 2004).


