Abstract
The identification of glycosylation sites in proteins is often possible through a combination of proteolytic digestion, separation, mass spectrometry (MS) and tandem MS (MS/MS). Liquid chromatography (LC) in combination with MS/MS has been a reliable method for detecting glycopeptides in digestion mixtures, and for assigning glycosylation sites and glycopeptide sequences. Direct interfacing of LC with MS relies on electrospray ionization, which produces ions with two, three or four charges for most proteolytic peptides and glycopeptides. MS/MS spectra of such glycopeptide ions often lead to ambiguous interpretation if deconvolution to the singly charged level is not used. In contrast, the matrix‐assisted laser desorption/ionization (MALDI) technique usually produces singly charged peptide and glycopeptide ions. These ions require an extended m/z range, as provided by the quadrupole‐quadrupole time‐of‐flight (QqTOF) instrument used in these experiments, but the main advantages of studying singly charged ions are the simplicity and consistency of the MS/MS spectra. A first aim of the present study is to develop methods to recognize and use glycopeptide [M+H]+ ions as precursors for MS/MS, and thus for glycopeptide/glycoprotein identification as part of wider proteomics studies. Secondly, this article aims at demonstrating the usefulness of MALDI‐MS/MS spectra of N‐glycopeptides. Mixtures of diverse types of proteins, obtained commercially, were prepared and subjected to reduction, alkylation and tryptic digestion. Micro‐column reversed‐phase separation allowed deposition of several fractions on MALDI plates, followed by MS and MS/MS analysis of all peptides. Glycopeptide fractions were identified after MS by their specific m/z spacing patterns (162, 203, 291 u) between glycoforms, and then analyzed by MS/MS. In most cases, MS/MS spectra of [M+H]+ ions of glycopeptides featured peaks useful for determining sugar composition, peptide sequence, and thus probable glycosylation site. Peptide‐related product ions could be used in database search procedures and allowed the identification of the glycoproteins. Copyright © 2004 John Wiley & Sons, Ltd.
High‐throughput analysis in proteomics using mass spectrometry (MS), tandem MS (MS/MS) and database searching is possible even though several post‐translational modifications are usually present in proteins from a given cell. Acetylation, phosphorylation and glycosylation, among other possibilities, do change the masses of peptides and thus it is often necessary or inevitable to omit modified proteolytic peptides from a search, and rather work with the remaining peptides. Protein identification can be accomplished without knowledge about the types of modifications present, which is satisfactory at the early stages of characterization. It is important to characterize post‐translational modifications when details are needed on specific proteins relevant to disease or other physiological variations, because they reflect the conditions of expression of the proteins. Whether protein identification is based on de novo sequencing, sequence analogy or database matching, quick detection and characterization of post‐translationally modified peptides are helpful because they avoid false peptide assignments based solely on mass and result in enhanced sequence coverage.
To date, most analyses involving glycopeptide characterization by MS have been conducted using electrospray ionization (ESI) with MS/MS. A useful approach developed by Carr, Huddleston et al. in 19931, 2 consists of monitoring HexNAc+ (m/z 204) or Hex‐HexNAc+ (m/z 366) product ions during an on‐line high‐performance liquid chromatography (HPLC) ESI‐MS/MS experiment. Also, more recently, Ritchie et al. used precursor ion scans for ions of high m/z values rather than product ion scans to detect glycoforms of different N‐glycopeptides by HPLC/MS/MS.3 Further characterization of glycopeptides has been conducted by several research groups using MS/MS of doubly or triply charged precursor ions generated by ESI.4, 5, 6, 7, 8
Overall, product‐ion spectra vary considerably depending on the type of mass spectrometer and on the conditions used. Some MS/MS spectra of glycopeptides exhibit successive characteristic losses of monosaccharide units6, 7, 8, 9, 10 and also show high abundance mono‐ and disaccharide ions at lower m/z values.6, 7, 8, 9 Other cases show, in addition to the sugar‐related ions mentioned above, peptide backbone fragments that can be used for sequencing.4, 5 With ESI‐MS, the most useful information in terms of localization of glycosylation sites has been obtained by performing MS/MS on the [Peptide+GlcNAc]+ ions obtained by in‐source fragmentation of the corresponding glycopeptides, at high declustering voltage values. The resulting MS/MS spectra provided very unambiguous sequence information, plus assignment of the glycosylation site(s).5, 7 Whether by in‐source fragmentation or collision‐induced dissociation (CID) in a cell, [Peptide+GlcNAc]+ or [Peptide+GlcNAc]2+ ions generated from glycopeptides are always abundant and constitute a good signature for these modified peptides. Due to frequent ESI formation of doubly, triply or quadruply charged glycopeptide precursor ions, deconvolution to the singly charged level is often useful to ease interpretation4, 8 and would be a necessary step for automated detection or identification of glycopeptides among other mixture components.
Matrix‐assisted laser desorption/ionization (MALDI) MS generally produces [M+H]+ ions for peptides and glycopeptides, which makes preliminary assignments of peptide/glycopeptide peaks more amenable than by ESI‐MS. Reverse‐phase LC separation followed by direct sample deposition on a multi‐well MALDI target11, 12 greatly decreases the number of compounds per MALDI spot. The proteomic analysis is then performed on many static samples rather than dynamically on‐line, using an HPLC system. Glycopeptide‐containing fractions are usually identified via the observation of singly charged glycoform peaks corresponding to the same peptide, i.e. spaced by 162 u (galactose, Gal), 203 u (N‐acetylglucosamine, GlcNAc) or 291 u (N‐acetylneuraminic or sialic acid, NeuNAc) in the spectrum.13 Interestingly, MS/MS analysis of glycopeptide [M+H]+ ions generated by MALDI in our laboratory led to consistent fragmentation patterns,13 with losses of saccharide residues at higher m/z values and observation of a dominant group of four peaks near the mass of the peptide itself, namely, [Peptide+H–17]+, [Peptide+H]+, [Peptide+GlcNAc+H]+, and [Peptide+CHCHNHAc]+ (see Scheme 1), the latter corresponding to a 0,2X0 cross‐ring fragmentation of the connecting GlcNAc residue.14 At m/z values lower than this quadruplet, y or b ions provided most of the peptide sequence information, and no abundant sugar‐residue ions were present, as reported before in ESI‐MS/MS analyses of doubly or triply charged precursors.6, 7, 8, 9 CID‐MS/MS spectra of non‐glycosylated peptides obtained under similar conditions using the MALDI‐quadrupole‐quadrupole time‐of‐flight (QqTOF) instrument15 usually consist of y and b ions with no particular species displaying high or low abundances except for y fragments corresponding to cleavages at the Asp C‐terminal side in Arg‐terminated peptides. In contrast, for glycopeptides, the abundance of ions forming the group of four peaks discussed above is easily traceable and thus conducive to the recognition of glycopeptides. Moreover for most glycopeptides analyzed, the MS/MS spectrum at and below the m/z value of the [Peptide+H–17]+ ions resembled that of the peptide without any sugar, and could therefore be interpreted automatically using a sequencing algorithm. This routine led to database assignment of peptide identity within a protein, as if there had been no glycan attached to the peptide. Recently, Demelbauer et al. showed that a MALDI‐Q‐ion trap reflectron TOF instrument (QIT‐rTOF) could produce similar features when operated in the MS2 mode.16
Scheme 1.
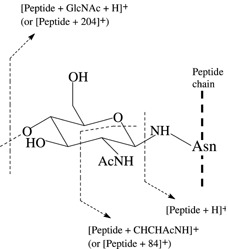
Fragmentation pattern observed in the MS/MS spectra of precursor ions of glycopeptides generated by MALDI. The tryptic peptide chain is represented by a vertical dashed line. The first N‐acetylglucosamine residue of a glycan attached to asparagine (Asn) is shown, with corresponding fragment ions observed.
In this article, a fast method for detection, identification and sequencing of N‐glycopeptides is presented, based on MS and MS/MS measurements using a prototype MALDI‐QqTOF instrument.15 This method was developed and tested using a mixture of proteins and glycoproteins, all obtained commercially, which were reduced, alkylated, and digested with trypsin all together. Peptides were then separated by micro‐column reverse‐phase HPLC into several fractions, each of which was analyzed by MALDI‐MS and MS/MS. The aims of this study were to integrate glycopeptide precursor ion signals as part of wider range proteomics studies,17, 18 and to use glycopeptide MS/MS fragments to determine peptide sequences, sugar contents, and glycosylation sites.
EXPERIMENTAL
Reagents
Proteins (unless otherwise noted), dithiothreitol, iodoacetamide, trifluoroacetic acid (TFA), and 2,5‐dihydroxybenzoic acid (DHB) were obtained from Sigma Chemicals (St. Louis, MO, USA). Sequencing‐grade modified trypsin (Promega, Fitchburg Center, WI, USA) was used for all digestion procedures.
Preparation of digests for HPLC/MS analysis
Several commercially available proteins were digested using trypsin and then mixtures of the digests were prepared. Proteins are listed here in alphabetical order: Acylase (porcine), alcohol dehydrogenase (horse), alcohol dehydrogenase (yeast), aldolase (rabbit), alpha‐lactalbumin (bovine), apoferritin (horse), apo‐transferrin (bovine), apo‐transferrin (human), asparaginase (E. coli), beta‐galactosidase (E. coli), beta‐lactoglobulin (bovine), carbonic anhydrase (bovine), carbonic anhydrase (human), catalase (bovine), chymotrypsinogen (bovine), citrate syntase (E. coli), conalbumin (chicken), concavalin (jack bean), creatinine kinase (rabbit), cytochrome C (horse), fetuin (bovine), fibronectin (human), fibrinogen (bovine), fibrinogen (human), fumarase (porcine), glucose oxidase (aspergillus niger), glucose‐6‐phosphate dehydrogenase (yeast), glutamate dehydrogenase (bovine), glyceraldehyde‐3‐phosphate dehydrogenase (rabbit), glucoamylase (Aspergillus niger), glucuronidase (E. coli), hexokinase (yeast), isocitric dehydrohenase (bovine), lactoferrin (bovine), lactoferrin (human), luciferase (fire fly), lysozyme (chicken), myoglobin (horse), ovalbumin (chicken), pepsinogen (porcine), peroxidase (horse radish), phosphorylase B (rabbit), protein A (Staphylococcus aureus), protein disulfide isomerase (bovine), rennin (bovine), ribonuclease A (bovine), serum albumin (bovine), serum albumin (human), serum albumin (porcine), serum albumin (rat), serum albumin (sheep), streptavidin (Streptomyces avidinii), superoxide dismutase (bovine), tropomyosin (bovine), and trypsin (porcine).
These mixtures were first prepared for the study of chromatographic retention of tryptic peptides without preliminary consideration of possible glycosylation patterns. The same in‐solution proteolytic digestion protocol was used in all experiments. Proteins were reduced (10 mM dithiothreitol, 30 min, 57°C), alkylated (50 mM iodoacetamide, 30 min in the dark at room temperature), dialyzed against 100 mM NH4HCO3 (6 h, 7 kDa MWCO, Pierce), and digested overnight with (sequencing‐grade) modified trypsin (Promega, 1:50 enzyme/substrate weight ratio, 12 h, 37°C). First, digests of each individual protein (1 mg/mL) were analyzed separately by MALDI‐MS to confirm protein identity. Mixtures of these protein digests (0.4 pmol/μL of each protein) were prepared by appropriate dilution in 0.2% trifluoroacetic acid (TFA) aqueous solution. The mixture (5 μL, 2 pmol of each protein) was injected into the μ‐HPLC system. In total five different mixtures were prepared, each containing 300–400 potential tryptic fragments in the 560–5000 u mass range.
One example of application of site‐specific N‐glycosylation analysis presented here was of interest during the study of the glycosylation pattern of human α5β1 integrin. The integrin was affinity purified from placenta19 and subjected to a peptide mapping study, as for all proteins listed above.
Chromatography and fraction collection
Deionized (18 MΩ) water and HPLC‐grade acetonitrile were used for the preparation of eluents. Column temperature was maintained at 30°C throughout all experiments. Chromatographic separations were performed using a micro‐Agilent 1100 series system (Agilent Technologies, Wilmington, DE, USA). Samples (5 μL) were injected directly onto a 150 μm × 150 mm column (Vydac 218 TP C18, 5 μm; Grace Vydac, Hesperia, CA, USA) and eluted with a linear gradient of 1–80% acetonitrile (0.1% TFA) in 120 min or 0.66% acetonitrile/min at 4 μL/min flow rate. PEEK 65 μm i.d. and fused‐silica 50 μm i.d. tubings were used for pre‐ and post‐column liquid connections. The column effluent (4 μL/min) was mixed on‐line with 2,5‐dihydroxybenzoic acid (DHB) MALDI matrix solution (0.5 μL/min), and deposited by a computer‐controlled robot12 onto a movable gold target at 0.5‐min intervals. A Microtee P775 (Upchurch Scientific) was used for on‐line mixing in the micro‐flow version. Fractions (120) were collected, as most tryptic peptides were eluted within 60 min. Fractions were air‐dried and subjected to MALDI‐MS analysis.
TOF‐MS
The identity of each of the digested proteins was confirmed by peptide mass fingerprinting. Each protein digest was mixed 1:1 with matrix solution (150 mg/mL of dihydroxybenzoic acid in 1:1 water/acetonitrile), deposited on a gold‐plated MALDI target, air‐dried and subjected to MALDI‐MS analysis.
The spots from each individual digest as well as the chromatographic fractions were analyzed by single mass spectrometry (MS) with m/z range 560–5000, and by tandem mass spectrometry (MS/MS) using the Manitoba/Sciex prototype quadrupole/TOF (QqTOF) mass spectrometer.15 In this instrument, ions are produced by irradiation of the sample with photon pulses from a 20‐Hz nitrogen laser (VCL 337ND; Spectra‐Physics, Mountain View, CA, USA) with 300 mJ energy per pulse. Orthogonal injection of ions from the quadrupole into the TOF section normally produces a mass resolving power of ∼10 000 FWHM, and accuracy within a few mu in the TOF spectra in both MS and MS/MS modes.
During low‐energy CID MS/MS, positive ions exiting from the first quadrupole are accelerated by a drop in voltage before entering the collision cell. The extent of voltage drop depended on the m/z of the peptide considered, and was ∼50 V per 1000 u. Because the maximum value of voltage drop is 160 V, large analytes could not be fragmented efficiently over the whole m/z range. Thus, for precursor ions with m/z >3500 u, it was difficult to observe significant peptide fragmentation in MS/MS spectra of glycopeptides.
Peak assignments and MS/MS identification of peptides
‘M/z’ and ‘SonarMS/MS’ programs (Manitoba Centre for Proteomics20) were used for peak assignment and MS/MS identification of peptides, respectively. Signal‐to‐noise ratios of 2.5 and 1.3 were used as criteria for peak assignment in MS and MS/MS spectra, respectively. ‘SonarMS/MS’ requires an entry of the m/z value of the precursor ions. This value corresponds to the bare non‐modified peptide and consequently is different from the actual m/z of the glycosylated species used for ion selection. Tandem mass spectra were inspected manually for a characteristic signature pattern for glycopeptides, i.e. the quadruplet [Peptide+H–17]+, [Peptide+H]+, [Peptide+GlcNAc+H]+, and [Peptide+CHCHNHAc]+ ion peaks. The [Peptide+H]+ value was determined in each case and used together with the m/z values of product ions, which were assigned automatically in the m/z region below [Peptide+H]+. A ‘SonarMS/MS’ search was performed using 0.1 and 1 u mass tolerances for product and precursor ions, respectively.
RESULTS AND DISCUSSION
The intent of this study was to demonstrate approaches to identifying and characterizing glycopeptides by MALDI‐MS in complex peptide mixtures, instead of omitting and discarding their precursor ion signals in global proteomics analyses. The aim was not to attempt identification of all glycopeptides in a mixture, but rather to use signals that were left unidentified in a proteomics search,17, 18 and relate these to glycopeptides through signature MALDI‐MS and MS/MS patterns. A component of the research involved MALDI‐MS spectra derived from the analysis of HPLC fractions containing many peptides and glycopeptides. Under these conditions it was still possible, in some cases, to quickly detect glycoforms of peptides based on the characteristic patterns of peaks separated by 162 u (mannose, galactose), 203 u (N‐acetylglucosamine) or 291 u (N‐acetylneuraminic acid). They are also easy to distinguish from bare (non‐modified) peptides by their high m/z values relative to those of coeluting peptides. Reverse‐phase HPLC elutes unmodified peptides in order of increasing hydrophobicity. The elution order, to some extent, correlates with peptide molecular mass because larger peptides are more likely to contain more hydrophobic amino acids. Therefore, early HPLC fractions were enriched with low molecular mass species and, conversely, the later fractions contained an increased proportion of large peptides. The addition of glycans results in an accelerated elution rate, i.e. a glycopeptide has a shorter retention time, but higher mass, than its unmodified analog. Typical mass spectra of HPLC fractions therefore exhibit mostly non‐glycosylated peptides at the lower m/z end, and glycopeptide ions at the higher end. The latter are somewhat isolated in the spectrum, and are thus easy to distinguish from unmodified peptide [M+H]+ ions. Figure 1 shows two examples of such results in the higher m/z sections of spectra for high‐mannose glycoforms (Fig. 1(a)) and for complex/sialylated glycoforms (Fig. 1(b)).
Figure 1.
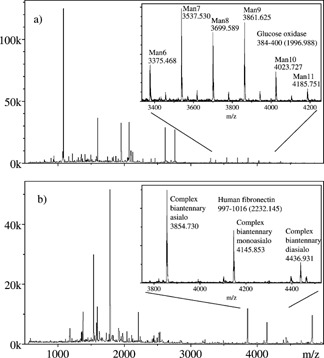
Portions of MALDI spectra showing (a) high‐mannose glycosylated forms of GGFHNTTALLIQYENYR, corresponding to residues 384–400 of glucose oxidase, and (b) complex glycosylated forms of LDAPTNLQFVNETDSTVLVR, i.e. residues 997–1016 of human fibronectin.
The central column of Table 1 lists the m/z values of 10 groups of arbitrarily MS‐selected glycopeptides that were analyzed by MS/MS. In each case, MS/MS of the [M+H]+ ions of these glycopeptides allowed unambiguous identification of the respective masses of the bare peptide and carbohydrate portions. MS/MS spectra of glycopeptides were readily distinguishable from those of bare peptides. In the latter cases there was a uniform distribution of ions corresponding to the stepwise fragmentation of the backbone, whereas for glycopeptides the spectra displayed a characteristic pattern where [Peptide+H–17]+, [Peptide+H]+, [Peptide+84]+, and [Peptide+204]+ ions were the most abundant product species besides ions corresponding to losses of sialic acid residues.
Table 1.
Detection of glycopeptides from various glycoproteins and identification by MS/MS and ‘SonarMS/MS’ search
| Peptide sequence Calculated m/z, [Peptide+H]+ Peptide identification (protein) | [Peptide+H]+ | [Glycopeptide+H]+ | Sonar score | Glycan composition |
|---|---|---|---|---|
| fr.56 | ||||
| ndtvwentdgestadwak | 2038.867 | 3255.291 | 4.2 × 10⁻³ | (GlcNAc)2(Man)5 |
| 2038.863 | 3417.333 | (GlcNAc)2(Man)6 | ||
| Bovine lactoferrin (545–562) | 3579.391 | (GlcNAc)2(Man)7 | ||
| 3741.441 | (GlcNAc)2(Man)8 | |||
| 3903.500 | (GlcNAc)2(Man)9 | |||
| fr.63 | ||||
| cglvpvlaenynk(s) | 1476.767 | 3099.334 | 2.1 × 10⁻⁹ | (GlcNAc)4(Man)3(Gal)2 |
| 1476.752 | 3390.443 | (GlcNAc)4(Man)3(Gal)2(NeuAc)1 | ||
| Human transferrin (421–433) | 3681.534 | (GlcNAc)4(Man)3(Gal)2(NeuAc)2 | ||
| fr.70 | ||||
| Previous fragments −17 | 1459.739 | 3082.328 | (GlcNAc)4(Man)3(Gal)2 | |
| 3373.415 | (GlcNAc)4(Man)3(Gal)2(NeuAc)1 | |||
| 3664.514 | (GlcNAc)4(Man)3(Gal)2(NeuAc)2 | |||
| fr.73 | ||||
| dqcivdditynvndtfhk | 2196.986 | 3819.582 | 5.5 × 10⁻¹⁵ | (GlcNAc)4(Man)3(Gal)2 |
| 2196.987 | 4110.676 | (GlcNAc)4(Man)3(Gal)2(NeuAc)1 | ||
| Human fibronectin 516–533 | 4401.788 | (GlcNAc)4(Man)3(Gal)2(NeuAc)2 | ||
| fr.74 | ||||
| ldaptnlqfvnetdstvlvr | 2232.145 | 3854.731 | 3.4 × 10⁻² | (GlcNAc)4(Man)3(Gal)2 |
| 2232.151 | 4145.851 | (GlcNAc)4(Man)3(Gal)2(NeuAc)1 | ||
| Human fibronectin 997–1016 | 4436.932 | (GlcNAc)4(Man)3(Gal)2(NeuAc)2 | ||
| fr.74 | ||||
| No identification | 3203.39 | 4825.975 | — | (GlcNAc)4(Man)3(Gal)2 |
| 5117.020 | (GlcNAc)4(Man)3(Gal)2(NeuAc)1 | |||
| fr.76,77. | ||||
| qqqhlfgsnvtdcsgnfclfr | 2515.151 | 4137.763 | Manual | (GlcNAc)4(Man)3(Gal)2 |
| 2515.125 | 4428.844 | sequencing | (GlcNAc)4(Man)3(Gal)2(NeuAc)1 | |
| Human transferrin 622–642 | 4719.939 | (GlcNAc)4(Man)3(Gal)2(NeuAc)2 | ||
| fr.78 | ||||
| Previous fragment −17 | 2498.101 | 4120.693 | — | (GlcNAc)4(Man)3(Gal)2 |
| 4411.794 | (GlcNAc)4(Man)3(Gal)2(NeuAc)1 | |||
| 4702.828 | (GlcNAc)4(Man)3(Gal)2(NeuAc)2 | |||
| fr.72 | ||||
| ggfhnttalliqyenyr | 1996.986 | 3375.468 | (GlcNAc)2(Man)6 | |
| 1996.988 | 3537.53 | 1.1 × 10⁻¹² | (GlcNAc)2(Man)7 | |
| Glucose oxidase asp. niger 384–400 | 3699.589 | (GlcNAc)2(Man)8 | ||
| 3861.625 | (GlcNAc)2(Man)9 | |||
| 4023.727 | (GlcNAc)2(Man)10 | |||
| 4185.751 | (GlcNAc)2(Man)11 | |||
| fr.73 | ||||
| Same precursor ion | 1996.986 | 3213.423 | (GlcNAc)2(Man)5 | |
| 3375.476 | (GlcNAc)2(Man)6 | |||
| 3537.545 | (GlcNAc)2(Man)7 | |||
| 3699.563 | (GlcNAc)2(Man)8 | |||
| 3861.626 | (GlcNAc)2(Man)9 | |||
| fr.85 | ||||
| itsagagqgqaawfatfnetfgdysek | 2854.590 | 4070.732 | 9.1 × 10⁻¹⁷ | (GlcNAc)2(Man)5 |
| 2854.596 | 4232.762 | (GlcNAc)2(Man)6 | ||
| Glucose oxidase asp. niger 338–364 | 4394.839 | (GlcNAc)2(Man)7 | ||
| fr.101 | ||||
| vvhavevalatfnaesngsylqlveisr* | No MS/MS | 5004.344 | No MS/MS | (GlcNAc)5(Man)3(Gal)3 |
| 3016.574 | 5925.438 | (GlcNAc)5(Man)3(Gal)3(NeuAc)1 | ||
| Bovine fetuin 160–187 | ||||
| fr.67 | ||||
| lcpdcpllaplndsr* | No MS/MS | 3728.554 | No MS/MS | (GlcNAc)5(Man)3(Gal)3 |
| 1740.841 | 4019.684 | (GlcNAc)5(Man)3(Gal)3(NeuAc)1 | ||
| Bovine fetuin 145–159 | 4310.732 | (GlcNAc)5(Man)3(Gal)3(NeuAc)2 | ||
| 4601.827 | (GlcNAc)5(Man)3(Gal)3(NeuAc)3 |
These assignments were added after the search and are based on knowledge of the protein sequence.
It is possible to determine the oligosaccharide composition in terms of [GlcNAc]v[Man]w[Gal]x[NeuNAc]y by subtracting the m/z value of [Peptide+H]+ ions from that of [Glycopeptide+H]+ precursors. Above the m/z value of [Peptide+204]+ ions, only fragments corresponding to the loss of saccharide units were observed. The presence of sialic acid was clearly identified through facile losses of these residues (−291 u). Successive losses of 162 u from the precursors indicated high‐mannose glycan structures, whereas mixed losses of 162 and 203 u indicated the presence of complex oligosaccharides. For all glycoforms of a given peptide, below the m/z value of [Peptide+H–17]+ ions, b and y ions corresponding to fragmentation of the bare peptide provided information on its sequence. In fact, this portion of the MS/MS spectra was exploited in this study for automated peptide identification and database search for the protein of origin. This feature makes MALDI‐MS/MS of glycopeptide ions more useful than ESI‐MS/MS, where the peptide composition must be known in order to establish oligosaccharide composition.21
A representative example is given in Fig. 2, with MS/MS spectra of five different glycoforms of a peptide originating from glucose oxidase. In all five spectra, the quadruplet of ions [Peptide+H–17]+, [Peptide+H]+, [Peptide+84]+, [Peptide+204]+ was observed (m/z 1980, 1997, 2080 and 2200, respectively), allowing unambiguous assignment of the peptide mass, i.e. 1997 u, and of the oligosaccharide attachments. The latter corresponded to 1216.4, 1378.4, 1540.5, 1702.5, and 1864.6 u, from top to bottom in Fig. 2. These masses correspond to within 0.003% accuracy to compositions [GlcNAc]2[Man]x, with x = 5–9. In some other cases, [Peptide+H–17]+ and [Peptide+H]+ ions had very low abundances; however, dominant [Peptide+84]+ and [Peptide+204]+ ion peaks were always observed and by deduction allowed measurement of the peptide mass. Figure 3 shows an expanded view of the peptide fragmentation portion of Fig. 2(b). Interestingly this portion of the spectrum did not vary with the size of the glycan attached to the peptide, i.e. from (a) to (e) in Fig. 2. The larger the glycan, the less abundant the ions, which indicates that for several glycoforms of the same peptide it is advantageous to perform MS/MS on the smallest glycoform in order to obtain the most complete peptide sequence information. Interestingly, the partial spectrum of Fig. 3 seems to correspond to that of hypothetical [Peptide+H]+ precursors and, when entered in the ‘Sonar MS/MS’ search algorithm, it allowed unambiguous identification of the sequence of this peptide as GGFHNTTALLIQYENYR, and thus of the protein, glucose oxidase (residues 384–400). This result, among other identifications, is reported in Table 1, first column on the left. The fourth column contains the scores assigned by ‘Sonar MS/MS’ in which a lower numerical score represents an increased level of confidence.
Figure 2.
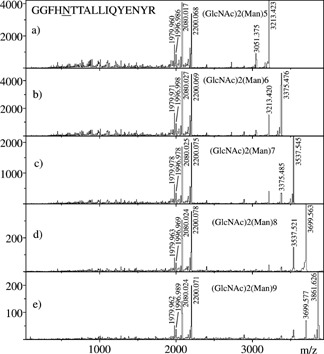
MALDI‐MS/MS spectra of five high‐mannose glycoforms of GGFHNTTALLIQYENYR, corresponding to residues 384–400 of glucose oxidase.
Figure 3.
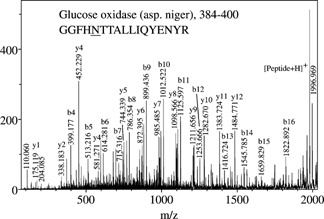
Detail of Fig. 2(b), with peaks labeled according to the fragmentation of the peptide.
Figure 4 shows three MS/MS spectra of biantennary glycoforms of a peptide of mass 2197 u, which was later identified by ‘Sonar MS/MS’ as belonging to human fibronectin. The largest glycoform analyzed corresponds to a disialylated oligosaccharide (bottom), the middle one to a monosialylated form (center), and the smallest to the asialo form (top) of the same glycan. Features observed in the top spectrum are repeated in the center and bottom spectra after loss of one and two sialic acid residues (−291 u per unit). Spectral portions above m/z 2400 exhibit successive losses of hexose (−162 u) and N‐acetylglucosamine (−203 u), showing that fragmentation occurs in both chains of the biantennary glycans. In all three spectra, the [Peptide+GlcNAc]+ ions are abundant at m/z 2400, along with [Peptide+84]+ (m/z 2280), [Peptide+H]+(m/z 2197), and [Peptide+H–17]+ (m/z 2180) species. Figure 5 displays a close‐up of the low m/z section of Fig. 4(a), which again varies in intensity but is the same for all three MS/MS spectra in terms of ions observed. In spite of three major unidentified peaks, ‘SonarMS/MS’ found a matching peptide with no ambiguity, DQCIVDDITYNVNDTFHK from human fibronectin. Knowing the sequence, the unidentified peaks were quickly recognized as [y+GlcNAc] fragments, with the GlcNAc residue adding 203 u to the masses of the predicted y and b fragments. Also, [y+83] and [b+83] fragments were identified, the 83 u portion corresponding to [CH—CH—NH‐acetyl] originating from 0,2X0 cross‐ring fragmentations of the connecting GlcNAc residues.14 Table 2 lists all b‐ or y‐related product ions observed in the MS/MS spectrum of Fig. 5. At this stage, these ions had to be identified and labeled manually, as the database search does not include variants of b and y ions. The observation of these ions is not surprising, given the high abundances of [Peptide+84] and [Peptide+204] ions in the MS/MS spectra of glycopeptides. Also, the [y or b+203] ions have demonstrated utility in locating glycosylation sites by MS/MS of [Peptide+204] precursors.5, 7
Figure 4.
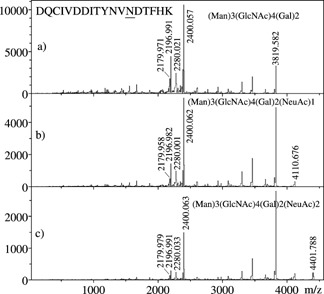
MALDI‐MS/MS spectra of three complex glycoforms of DQCIVDDITYNVNDTFHK, corresponding to residues 516–533 of human fibronectin.
Figure 5.
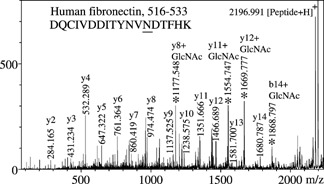
Detail of Fig. 4(a), with peaks labeled according to the fragmentation of the peptide; for a complete list of the fragments detected, see Table 2.
Table 2.
MS/MS peaks assignments for the peptide DQCIVDDITYNVNDTFHK from human fibronectin. Corresponding MS/MS spectra are shown in Fig. 4(a) (glycosylated peptide, m/z 3819.582) and the expanded section below m/z 2197 in Fig. 5
| Residue | b (calc.), u. | b (meas.) u. | b+83 | b+203 | y (calc.), u. | y (meas.), u. | y+83 | y+203 |
|---|---|---|---|---|---|---|---|---|
| D | 1 116.035 | — | — | — | 18 2196.987 | 2196.991 | 2280.021 | 2400.057 |
| Q | 2 244.093 | 244.094 | — | — | 17 2081.960 | 2081.959 | — | — |
| C | 3 404.124 | 404.127 | — | — | 16 1953.902 | 1953.891 | — | — |
| I | 4 517.208 | 517.205 | — | — | 15 1793.871 | — | — | — |
| V | 5 616.276 | 616.284 | — | — | 14 1680.787 | 1680.787 | — | 1883.889 |
| D | 6 731.303 | 731.304 | — | — | 13 1581.719 | 1581.700 | — | 1784.770 |
| D | 7 846.330 | 846.344 | — | — | 12 1466.692 | 1466.689 | 1549.721 | 1669.777 |
| I | 8 959.414 | 959.418 | — | — | 11 1351.665 | 1351.666 | 1434.696 | 1554.747 |
| T | 9 1060.462 | 1060.464 | — | — | 10 1238.581 | 1238.575 | 1321.607 | 1441.652 |
| Y | 10 1223.526 | 1223.545 | — | — | 9 1137.533 | 1137.525 | 1220.579 | 1340.61 |
| N | 11 1337.568 | 1337.556 | — | — | 8 974.470 | 974.474 | 1057.495 | 1177.548 |
| V | 12 1436.637 | 1436.619 | — | 7 860.427 | 860.419 | — | 1063.509 | |
| N | 13 1550.680 | — | 1633.737 | 1753.78 | 6 761.358 | 761.364 | 844.393 | 964.431 |
| D | 14 1665.707 | 1665.742 | 1748.749 | 1868.797 | 5 647.315 | 647.322 | — | — |
| T | 15 1766.755 | 1766.775 | — | 1969.9 | 4 532.289 | 532.289 | — | — |
| F | 16 1913.823 | 1913.831 | — | — | 3 431.241 | 431.234 | — | — |
| H | 17 2050.882 | 2050.867 | 2133.942 | 2254.001 | 2 284.172 | 284.165 | — | — |
| K | 18 2178.977 | — | — | — | 1 147.113 | — | — | — |
All peptides identified by ‘SonarMS/MS’ contain consensus NXT or NXS sequences (highlighted in Table 1), thus simplifying determination of the glycosylation site. These conclusions can be confirmed, however, by assignment of [y,b+83] and [y,b+203] fragments. Thus, for the peptide DQCIVDDITYNVNDTFHK, [y+83] and [y+203] ions were found starting from y6, and the complementary ion pairs [b+83] and [b+203] were observed starting from b13 (Table 1). This unambiguously indicates glycosylation at Asn‐13. A similar situation was observed (not labeled in Fig. 3) in the case of GGFHNTTALLIQYENYR from glucose oxidase; among the bn fragments only those with n ≥ 5 showed [b+83], [b+203] pairs.
Overall, MS and MS/MS analyses showed glycoforms of 10 different peptides originating from four glycoproteins present in the original mixture. Table 1 summarizes these results. According to the list presented in the Experimental section, other glycoproteins in the mixtures should have been identified. Possible explanations for the absence of their glycopeptides from the MALDI mass spectra include incomplete tryptic digestion or generation of tryptic glycopeptides outside the mass range considered in this study, discrimination in ionization efficiency due to coelution of several peptides/glycopeptides in single HPLC fractions, inability to distinguish glycopeptide from peptide signals in some fractions, etc. For example, hen ovalbumin, which is well known to be N‐glycosylated, was not detected as part of this glycomics analysis. Inspection of the sequence of hen ovalbumin reveals that the smallest possible glycosylated peptide has a mass of 3293 Da (291–322, YNLTSVLMAMGITDVFSSSANLSGISSAESLK) without counting the glycan portion. The addition of a small hypothetical biantennary glycan would bring the mass to above 5000 Da, i.e. beyond the limit of our range of observation in this study. Bovine fetuin is another glycoprotein which in theory should have been readily identified. Only two predicted tryptic peptides from this protein with consensus sequence NXS are within the range of our study once sugars are included, 145–159 (LCPDCPLLAPLNDSR, 1740 u, alkylated) and 160–187 (VVHAVEVALATFNAESNGSYLQLVEISR, 3016 u). Glycoforms of both peptides were observed (see bottom of Table 1), but no MS/MS analysis was performed to ascertain their identification, which was based on previous knowledge of the sequence of fetuin. Two other fetuin peptides, 651–682 and 72–103, could also be glycosylated, but are outside our observation range.
It is important to note that identification of all possible glycopeptides was not the primary goal of this study, which rather focused on utilizing MALDI‐MS peaks left unidentified following peptide mapping experiments17, 18 and assigning these peaks to glycopeptides using their typical MS and MS/MS patterns. The identification of all proteins and glycoproteins in similar mixtures was performed previously without making use of glycopeptide signals,17, 18 which become useful when information on glycosylation is required. Here, precursor ions were chosen arbitrarily for MS/MS analysis based on easy visual recognition of glycosylated patterns. Identification of six peptides from four glycoproteins was achieved using an automatic ‘SonarMS/MS’ search. The corresponding scores are indicated in the fourth column of Table 1. At present, our laboratory is working on developing an algorithm to recognize the presence of glycopeptide ions through their characteristic mass differences (162, 203, 291 u) and to flag such ions for further MS/MS work. This automated process will surely increase the number of glycopeptides found and broaden the scope of proteomics analyses by including glycosylation data.
Two peptides contained a modification other than glycosylation, which led to a decrease of 17 u from the masses of the predicted peptides. In the first case, QQQHLFGSNVTDCSGNFCLFR from human transferrin, the modification was due to formation of pyroglutamic acid at the N‐terminal, as is always observed during proteolytic digestion.22 Glycoforms with this modification eluted in the fraction next to their analogs with intact glutamic acid at the N‐terminal. The other source of mass loss of 17 u was observed for CGLVPVLAENYNK, also from human transferrin, where cysteine at the N‐terminal was alkylated with iodoacetamide and converted into 5‐oxo‐thiomorpholine‐3‐carboxylic acid in a manner similar to N‐terminal Gln.22 Figure 6 shows the m/z 4000–5000 portions of the MALDI spectra obtained for fractions 76, 77 and 78 of a separation of the digested mixture. As observed, whether the glycosylated peptide is intact (Figs. 6(a) and 6(b)) or modified by formation of pyroglutamic acid at the N‐terminal (Fig. 6(c)), it maintains a similar glycosylation pattern.
Figure 6.
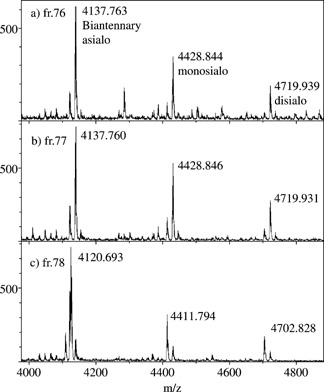
Glycosylation profile of peptide QQQHLFGSNVTDCSGNFCLFR, i.e. residues 622–642 of human transferrin, according to order of elution in reversed‐phase HPLC. In (c), a global m/z decrease by 17 u denotes the formation of pyroglutamic acid at the N‐terminal of the peptide.22
Only one glycopeptide could not be sequenced either automatically or manually, owing to the low extent of fragmentation of very large precursor ions, i.e. m/z 4825.975, although it was possible by MS/MS to determine the relative masses of glycans vs. peptide (see Table 1). Indeed, [Peptide+H]+ ions had m/z 3203.39 and the observed glycoforms corresponded to asialo biantennary and monosialo biantennary structures. Another glycopeptide, QQQHLFGSNVTDCSGNFCLFR, which was discussed above, had to be sequenced manually from MS/MS data due to low intensity fragments not assigned by ‘M/z’. These two particular cases show the importance of maximizing the sensitivity of MS/MS analyses by either selecting the most abundant glycoform as a parent species, optimizing the collision energy, or selecting the smallest glycoform, if abundant enough, to conduct the experiment.
Some of the glycoproteins included in the mixtures have already been the object of detailed studies on glycosylation, and our results agree with previously reported glycosylation types and sites. In the case of human transferrin, Tomiya et al.23 reported complex‐type biantennary and high‐mannose N‐glycans in the overall oligosaccharide pool of recombinant glycoproteins grown in Trichoplusia ni insect cells. In our study, two glycopeptides were detected and corresponded to residues 421–433 (glycosylation on Asn 432) and to 622–642 (Asn 630). Both Asn residues were found to bear complex‐type biantennary sialylated glycans with no detectable fucosylation, whereas, in Tomiya's study,23 several biantennary glycans were fucosylated and all were digalactosylated, but none were sialylated. Here the source of human transferrin was commercial (Sigma Chemicals), and the protein was obtained by purification from cell culture, human rather than insect, and thus with different transferase activity levels that possibly explain these differences. Our study did not detect high‐mannose glycans for this protein. For the purposes of database search and protein identifications, both glycopeptides observed here and sequenced by MS/MS were sufficient to point to human transferrin. A more detailed glycosylation study would require enzymatic detaching of the glycans followed by separation and structural analysis.23
A second glycoprotein of interest in this study, bovine lactoferrin, has also been the subject of previous investigations;24, 25 five glycosylation sites were found in these studies. Asn‐233 and Asn‐545 had high‐mannose glycans, whereas Asn‐281, Asn‐368 and Asn‐476 had complex‐type glycans. In our study only one glycopeptide from bovine lactoferrin was detected, residues 545–562, with Asn‐545 indeed bearing high‐mannose glycans, as observed by Wei et al.25 Based on MS/MS fragmentation of one glycoform of this peptide, ‘SonarMS/MS’ was able to identify the correct glycoprotein and, once this information was obtained, other predictable glycopeptides could be sought; this was not done as part of this study, which was rather aimed at quickly screening for glycopeptides in MS spectra of tryptic digests of several proteins/glycoproteins. Because glycopeptide signals are easy to distinguish among other peptide ions, these signals can be used efficiently as part of a proteomics study.
The features discussed here have been exploited in other cases in our laboratory, where digests of individual proteins were separated by reversed‐phase HPLC followed by on‐target deposition. For example, nine N‐glycopeptides from the spike protein of the coronavirus associated with the severe acute respiratory syndrome (SARS) have been characterized and sequenced using this approach.13 As another example, integrin α5β1 complexes isolated from human placenta were subjected to this process. A more complete set of data on this complex will be presented in a further paper, but the results presented here as an example are only for one very short glycopeptide, NVTR (269–272) from integrin β1, observed in at least two different N‐glycoforms. The MS/MS spectra shown in Fig. 7 correspond to these glycoforms, which comprise a (Hex)5(HexNAc)4 structure (m/z 2111.9) and a truncated version of the latter, (Hex)4(HexNAc)3 (m/z 1746.7). Even with this short asparagine‐glycosylated peptide, a quadruplet of characteristic ions is observed in each spectrum ([Peptide+H–17]+, [Peptide+H]+, [Peptide+84]+, [Peptide+GlcNAc]+). Peptide sequence ions (y and b) are observed at low mass and allow us to identify the peptide unequivocally as residues 269–272, NVTR, from subunit β1 of the integrin complex, whose precursor is a 798 amino acid chain. A detailed study on the N‐glycosylation patterns of integrin α3β1 complexes has recently been published by Pochec et al.,26 emphasizing their changes with melanoma progression; the types of glycans observed here were also reported by these authors. As for the α5β1, a detailed study on disulfide bonding in this complex has recently been published by Krokhin et al.,27 but more details on site‐specific glycosylation are still needed and will be the object of a further study by our group.
Figure 7.
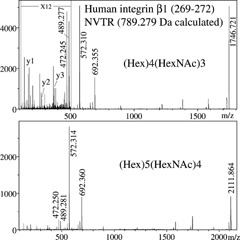
MALDI‐MS/MS spectra of two N‐glycoforms of NVTR, a short peptide from human integrin β1.
CONCLUSIONS
We have shown that MALDI‐MS glycopeptide signals can be usefully integrated into data sets in proteomics studies, because they produce very informative MALDI‐MS/MS fragment ions, allowing sequencing of the peptides and deduction of the sugar composition of each glycoform. The lower mass peptide portions of MS/MS spectra of glycopeptides can be interpreted automatically using a search engine such as ‘SonarMS/MS’. Incorporation of glycopeptide signals in global proteomics studies would constitute a truly complementary asset as it does significantly increase protein coverage. Development of software for automatic assignment of glycopeptide precursor ions is underway and will be discussed in a future publication.
Acknowledgements
The authors wish to acknowledge the Natural Sciences and Engineering Council of Canada (to HP, KGS and WE), the Canadian Foundation for Innovation (to HP and WE, JW), the Canada Research Chair Program (to HP), the Canadian Institutes for Health Research (JW) and the US National Institutes of Health (Grant No. GM59240 to KGS) for funding.
Contributor Information
Oleg Krokhin, Email: krokhino@cc.umanitoba.ca.
Hélène Perreault, Email: perreau@cc.umanitoba.ca.
REFERENCES
- 1. Carr SA, Huddleston MJ, Bean MF. Protein Sci. 1993; 2: 183. [DOI] [PMC free article] [PubMed] [Google Scholar]
- 2. Huddleston MJ, Bean MF, Carr SA. Anal. Chem. 1993; 65: 877. [DOI] [PubMed] [Google Scholar]
- 3. Ritchie MA, Gil ACl, Deery MJ, Lilley K. J. Am. Soc. Mass Spectrom. 2002; 13: 1065. [DOI] [PubMed] [Google Scholar]
- 4. Nemeth JF, Hochgesang GP Jr, Marnett LJ, Caprioli RM. Biochemistry 2001; 40: 3109. [DOI] [PubMed] [Google Scholar]
- 5. Hui JPM, White TC, Thibault P. Glycobiology 2002; 12: 837. [DOI] [PubMed] [Google Scholar]
- 6. Zeng R, Zu Q, Shao XX, Wang KY, Xia QC. Eur. J. Biochem. 1999; 266: 352. [DOI] [PubMed] [Google Scholar]
- 7. Bateman K, White R, Yaguchi M, Thibault P. J. Chromatogr. A 1998; 794: 327. [Google Scholar]
- 8. Zhu X, Borchers C, Bienstock RJ, Tomer KB. Biochemistry 2000; 39: 11194. [DOI] [PubMed] [Google Scholar]
- 9. Sandra K, Devreese B, Van Beeumen J, Stals I, Claeyssens M. J. Am. Soc. Mass Spectrom. 2004; 15: 413. [DOI] [PubMed] [Google Scholar]
- 10. Hirayima K, Yuji R, Yamada N, Kato K, Arata Y, Shimada I. Anal. Chem. 1998; 70: 2718. [DOI] [PubMed] [Google Scholar]
- 11. Chen VC, Cheng K, Ens W, Standing KG, Nagy JI, Perreault H. Anal. Chem. 2004; 76: 1189. [DOI] [PubMed] [Google Scholar]
- 12. Krokhin O, Qian Y, McNabb J, Spicer V, Ens W, Standing KG. Proc. 50th ASMS Conf. Mass Spectrometry and Allied Topics, Orlando, FL, June 2–6, 2002.
- 13. Krokhin O, Li Y, Andonov A, Feldmann H, Flick R, Jones S, Stroeher U, Bastien N, Dasuri KV, Cheng K, Simonsen JN, Perreault H, Wilkins J, Ens W, Plummer F, Standing KG. Mol. Cell. Proteomics 2003; 2: 346. [DOI] [PMC free article] [PubMed] [Google Scholar]
- 14. Domon B, Costello CE. Glycoconjugate J. 1988; 5: 397. [Google Scholar]
- 15. Loboda AV, Krutchinsky AN, Bromirski M, Ens W, Standing KG. Rapid Commun. Mass Spectrom. 2000; 14: 1047. [DOI] [PubMed] [Google Scholar]
- 16. Demelbauer UM, Zehl M, Plematl A, Allmaier G, Rizzi A. Rapid Commun. Mass Spectrom. 2004; 18: 1575. [DOI] [PubMed] [Google Scholar]
- 17. Krokhin O, Ying S, Craig R, Spicer V, Ens W, Standing KG, Beavis RC, Wilkins JA. Proc. 52nd ASMS Conf. Mass Spectrometry and Allied Topics, Nashville, TN, May 23–27, 2004.
- 18. Krokhin O, Craig R, Spicer V, Ens W, Standing KG, Beavis RC, Wilkins JA. Molec. Cell. Proteomics 2004; doi: 10.1074/mcp.M400031/mcp200. [DOI] [PubMed] [Google Scholar]
- 19. Wilkins JA, Li A, Ni H, Stupack DG, Shen C. J. Biol. Chem. 1996; 271: 3046. [PubMed] [Google Scholar]
- 20. Available: http://www.proteome.ca.
- 21. Cooper CA, Gasteiger E, Packer NH. Proteomics 2001; 1: 340. [DOI] [PubMed] [Google Scholar]
- 22. Krokhin OV, Ens W, Standing KG. Rapid Commun. Mass Spectrom. 2003; 17: 2528. [DOI] [PMC free article] [PubMed] [Google Scholar]
- 23. Tomiya N, Howe D, Aumiller JJ, Pathak M, Park J, Palter KB, Jarvis DL, Betenbaugh MJ, Lee YC. Glycobiology 2003; 13: 23. [DOI] [PubMed] [Google Scholar]
- 24. Wei Z, Nishimura T, Yoshida S. J. Dairy Sci. 2000; 83: 683. [DOI] [PubMed] [Google Scholar]
- 25. Wei Z, Nishimura T, Yoshida S. J. Dairy Sci. 2001; 84: 2584. [DOI] [PubMed] [Google Scholar]
- 26. Pochec E, Litynska A, Amoresano A, Casbarra A. Biochim. Biophys. Acta 2003; 1643: 113. [DOI] [PubMed] [Google Scholar]
- 27. Krokhin OV, Cheng K, Sousa SL, Ens W, Standing KG, Wilkins JA. Biochemistry 2003; 42: 12950. [DOI] [PubMed] [Google Scholar]


