

Abstract
Several studies examining the incidence of viral infection in childhood community‐acquired pneumonia (CAP) utilizing polymerase chain reaction (PCR) or real‐time PCR methods have been reported. We systematically searched Pubmed and Embase for studies reporting the incidence of respiratory viral infection in childhood CAP. The pooled incidences of viral infection were calculated with a random‐effects model. Sources of heterogeneity were explored by subgroup analysis and a univariant metaregression analysis. We included 21 eligible reports in our study. We found significant heterogeneity on the incidence of viral infection in childhood CAP. The random effects pooled incidence was 57.4% (95% confidence interval (CI): 50.8–64.1). The pooled incidence of mixed infection was 29.3% (95%CI: 23.0–35.6) with considerable heterogeneity. The pooled incidence of mixed infection was 29.3% (95%CI: 23.0–35.6). Rhinovirus, respiratory syncytial virus (RSV) and bocavirus were found to be the three most common viruses in childhood CAP. We also demonstrated that respiratory viruses were detected in 76.1% of patients aged ≤1 year, 63.1% of patients aged 2–5 years and 27.9% of patients aged ≥ 6 years. We conclude that respiratory viruses are widely detected in paediatric patients with CAP by PCR or real‐time PCR methods. More than half of viral infections are probably concurrent with bacterial infections. Rhinovirus, RSV and bocavirus are the three most frequent viruses identified in childhood CAP; the incidence of viral infection decreased with age.
Keywords: child, community‐acquired pneumonia, incidence, meta‐analysis, respiratory virus
Abbreviations
- CAP
community‐acquired pneumonia
- CI
confidence interval
- PCR
polymerase chain reaction
- RSV
respiratory syncytial virus
Introduction
Childhood community‐acquired pneumonia (CAP) as a common and serious health‐care problem is responsible for one fifth of children's deaths according to the estimates of the World Health Organization.1, 2 Despite the development of antimicrobial agents and vaccines, the morbidity and mortality caused by childhood pneumonia remains substantial in both developing and developed countries.3, 4
The establishment of the aetiological agents is essential for treatment decisions especially when the first‐line antibiotics are ineffective. The contributions of bacterial agents to childhood CAP have been widely investigated. The burden of disease caused by respiratory viruses has probably been underestimated due to the poor sensitivity and specificity of conventional diagnostic methods for respiratory viruses.5 However, recent advances in the molecular diagnostic techniques have improved the identification of respiratory viruses.6 Several studies examining the incidence of viral infection in childhood CAP with polymerase chain reaction (PCR) or real‐time PCR methods have been reported. However, systematic review and meta‐analysis of those studies are lacking to establish the incidence of viral infection in childhood CAP.
We performed a meta‐analysis to determine the incidence of viral infection detected by PCR or real‐time PCR methods in paediatric patients with CAP and to report the incidence of different respiratory virus.
Methods
Search strategy and study selection
We searched Pubmed and Embase for citations published before 31 August 2014 with free‐word, keyword and MeSH retrieval as follows: ‘community‐acquired pneumonia’, ‘virus’, ‘pediatric’, ‘children’, ‘childhood’, ‘PCR’, and ‘polymerase chain reaction’, ‘real‐time PCR’. Two authors independently screened titles and abstracts and retrieved the full text of any that appeared relevant. For inclusion, studies had to meet the following criteria1: being a cross‐sectional, case–control or cohort study2; participants being ≤19 years old3; either reporting viral incidence or providing raw data to enable their calculation4; detecting respiratory viruses with PCR or real‐time PCR methods5; and full text available in English or Chinese literature. We excluded studies in adult or those using conventional methods for viral detection. We also excluded studies that evaluated the incidence of one specific respiratory virus.
Data extraction and classification
All included studies were quality independently assessed by two authors using quality criteria (Supplementary http://onlinelibrary.wiley.com/doi/10.1111/resp.12472/suppinfo) based on the standard principles from Strengthening the Reporting of Observational studies in Epidemiology.7 For each study, one author extracted the information as follows: author name, country, year of publication, participants (number and mean age), specimens, viral detection methods and outcomes (the number of overall viral infection, the number of viral infection mixed with other pathogens and the number of individual viral infection); a second author checked for accuracy.
Statistical analysis
We used DerSimonian–Laird random‐effects meta‐analysis8 to calculate the pooled incidence of viral infection (with 95% confidence intervals (CI)) because of anticipated heterogeneity across studies. We tested for heterogeneity across the studies with Cochran Q (heterogeneity χ2) and I 2 statistic (30–60% for moderate heterogeneity; 50–90% for substantial heterogeneity; 75–100% for considerable heterogeneity).9 We performed subgroup analysis in order to reduce the heterogeneity across studies and conduct further analysis. We also explored potential sources of heterogeneity by applying a univariate metaregression analysis examining: geographical region, specimen, the number of virus detected and detection methods.10 We assessed publication bias in our meta‐analyses with the Egger tests and Begg–Mazumdar tests. We performed all analyses in Stata 12.1 (StataCorp, College Station, TX, USA) with the commands metan (for random‐effects meta‐analysis) and metareg (for metaregression).
Results
Our searches returned a total of 337 records, out of which 46 were excluded as duplicates. After assessing all citations by titles and abstracts, we reviewed 55 papers in full. After exclusion of ineligible reports, 21 studies reporting on 10 196 participants (n = 10196) published between April 2000 and August 2014 were included in our analysis11, 12, 13, 14, 15, 16, 17, 18, 19, 20, 21, 22, 23, 24, 25, 26, 27, 28, 29, 30, 31 (Fig. 1). Quality scores were reported in Table 1.
Figure 1.
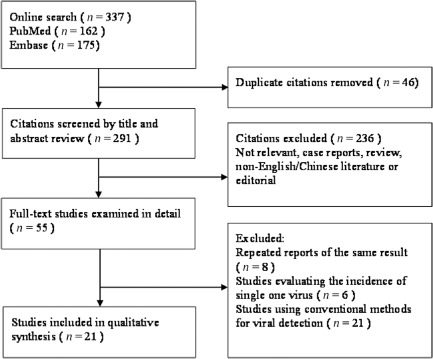
Flow diagram of the study selection process.
Table 1.
Summarized information and quality assessment of the studies included in meta‐analysis
| Study | Year of publication | Country | Patients | Specimens | Methods | Number of viruses detected | Quality scorea |
|---|---|---|---|---|---|---|---|
| Cantais et al.31 | 2014 | France | <16 years | Induced sputum | Real‐time PCR | 15 | 6 |
| Wiemken et al.11 | 2013 | USA | <18 years | Nasopharyngeal swabs | PCR | 12 | 5 |
| Esposito et al.12 | 2013 | Italy | <14 years | Respiratory secretion samples | Real‐time PCR | 17 | 9 |
| Okada et al.13 | 2012 | Japan | <15 years | Nasopharyngeal swabs | Real‐time PCR | 11 | 8 |
| Honkinen et al.14 | 2012 | Finland | <15 years | Induced sputum samples | Fluoroimmunoassay, real‐time PCR | 18 | 7 |
| Ding et al.16 | 2012 | China | <5 years | Nasopharyngeal aspirates | Real‐time PCR | 12 | 6 |
| Garcia‐Garcia et al.15 | 2012 | Spain | <14 years | Nasopharyngeal aspirates | PCR | 16 | 7 |
| De Schutter et al.18 | 2011 | Belgium | <14 years | BALF | Culture, PCR | 10 | 5 |
| O'Callaghan‐Gordo et al.17 | 2011 | Mozambique | <5 years | Nasopharyngeal aspirate | PCR | 12 | 7 |
| Wolf et al.19 | 2010 | Israel | <5 years | Nasopharyngeal wash specimens | DFA, PCR | 8 | 5 |
| Mathisen et al.20 | 2009 | Norway | <3 years | Nasopharyngeal aspirate | PCR | 7 | 6 |
| Lahti et al.21 | 2009 | Finland | 6 months to 15 years | Nasopharyngeal aspirate and induced sputum | Fluoroimmunoassay, real‐time PCR | 11 | 6 |
| Cevey‐Macherel et al.22 | 2009 | Switzerland | 2 months to 5 years | Serum, nasopharyngeal aspirates | Serology, DFA, real‐time PCR | 13 | 7 |
| Samransamruajkit et al.23 | 2008 | Thailand | 1 month to 15 years | Nasopharyngeal samples | Real‐time PCR | 7 | 6 |
| Nascimento‐Carvalho et al.24 | 2008 | Brazil | <5 years | Serum, nasopharyngeal aspirates | Serology, DFA, PCR | 8 | 5 |
| Hamano‐Hasegawa et al.25 | 2008 | Japan | <18 years | Nasopharyngeal samples | Real‐time PCR | 13 | 7 |
| Cilla et al.26 | 2008 | Spain | <3 years | Nasopharyngeal samples | Culture, PCR | 14 | 6 |
| Nakayama et al.27 | 2007 | Japan | <5 years | Serum,nasopharyngeal samples | Serology, PCR | 11 | 7 |
| Tsolia et al.28 | 2004 | Greece | <14 years | nasopharyngeal wash samples | PCR | 10 | 7 |
| Laundy et al.29 | 2003 | UK | <5 years | Nasopharyngeal aspirate | PCR, IFA | 8 | 6 |
| Juven et al.30 | 2000 | Finland | <14 years | Nasopharyngeal sample | Culture, IFA, PCR | 12 | 6 |
Maximum score = 9.
BALF, bronchial alveolar lavage fluid; DFA, direct immunofluorescence assay; IFA, indirect immunofluorescence assay; PCR, polymerase chain reaction.
Of these 21 reports, eight studies enrolled participants aged ≤5 years,16, 17, 19, 20, 24, 26, 27, 29 and the other 13 studies enrolled participants aged ≤19 years.11, 12, 13, 14, 15, 18, 21, 22, 23, 25, 28, 30, 31 Twelve were carried out in Europe,12, 14, 15, 18, 20, 21, 22, 26, 28, 29, 30, 31 five in Asia13, 16, 23, 25, 27 and four in other regions (one in the USA,11 one in Mozambique,17 one in Brazil24 and one in Israel19). Eleven studies detected respiratory viruses solely based on PCR or real‐time PCR11, 12, 13, 15, 16, 17, 20, 23, 25, 28, 31 while the other 10 studies applied PCR or real‐time PCR techniques combined with conventional methods for virus detection.14, 18, 19, 21, 22, 24, 26, 27, 29, 30
Overall incidence of respiratory viral infection in childhood CAP ranged from 18.7% to 91.0% (Fig. 2); heterogeneity was considerable (χ2 = 781.4, P < 0.0001; I 2 = 97.9%). The random effects pooled incidence was 57.4% (95% CI: 50.8–64.1). Due to the significant heterogeneity, pooled incidence of viral infection was calculated stratified by participants (≤5 years old or ≤19 years old, as illustrated in Fig. 2) or by geographical region where each study was carried out (Europe, Asia and other regions) as shown in Table 2. The pooled incidence of overall respiratory viral infection was 56.6% (95% CI: 48.1–65.1, I 2 = 96.8%) in participants ≤5 years old and 57.9% (95% CI: 48.1–67.7, I 2 = 98.1%) in participants ≤19 years old. In the subgroup analysis according to geographical region, the pooled incidence in Europe was similar to that in Asia (59.1%, 95% CI: 47.8–70.3, I 2 = 98.2%; 58.0%, 95% CI: 47.1–68.8). However, considerable heterogeneity persisted in subgroup analysis. In individual variable metaregression analysis, high number of virus for detection was related to high incidence of viral detection (Table 3).
Figure 2.
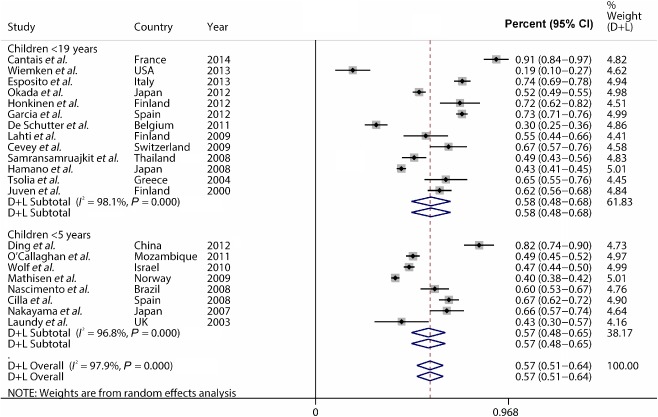
The pooled incidence of viral infection in childhood community‐acquired pneumonia (CAP).
Table 2.
The pooled incidence of viral infection and mixed infection in paediatric patients with CAP stratified by regions where studies were performed
| Incidence (%) | 95% CI | χ2 | P | I 2 (%) | |
|---|---|---|---|---|---|
| The pooled incidence of viral infection | |||||
| Europe | 61.7 | 50.–70.3 | 561.99 | 0.000 | 98.2 |
| Asia | 58.0 | 47.1–68.8 | 116.58 | 0.000 | 96.6 |
| Other regions | 44.2 | 34.6–53.8 | 53.22 | 0.000 | 94.4 |
| The pooled incidence of mixed infection | |||||
| Europe | 33.8 | 18.0–49.5 | 186.46 | 0.000 | 97.3 |
| Asia | 23.7 | 15.8–31.5 | 38.77 | 0.000 | 94.8 |
| Other regions | 29.3 | 23.0–35.6 | 23.7 | 0.000 | 95.8 |
CAP, community‐acquired pneumonia; CI, confidence interval.
Table 3.
Univariate metaregression for incidence of viral infections and mixed infection in pediatric patients with CAP
| Metaregression coefficient | 95% CI | P | |
|---|---|---|---|
| Incidence of respiratory viral infection in childhood CAP | |||
| Specimen | 0.139 | −0.028 to 0.307 | 0.098 |
| Region | −0.082 | −0.177 to 0.013 | 0.087 |
| The number of virus detected | 0.034 | 0.013 to 0.054 | 0.003 |
| Viral detection methods | 0.003 | −0.091 to 0.096 | 0.953 |
| Incidence of respiratory viral infection mixed with other pathogens in childhood CAP | |||
| Specimen | 0.064 | −0.141 to 0.269 | 0.503 |
| Region | −0.109 | −0. 219 to 0.001 | 0.052 |
| The number of virus detected | 0.033 | −0. 001 to 0.068 | 0.049 |
| Viral detection methods | 0.113 | 0. 032 to 0.194 | 0.011 |
CAP, community‐acquired pneumonia; CI, confidence interval.
Among the 21 reports, 11 studies provided raw data to estimate incidence of viral infections mixed with other pathogens (n = 4169).12, 13, 14, 18, 21, 22, 24, 25, 27, 28, 30, 31 Incidence estimates of mixed infections ranged from 6.4% to 66.0%; heterogeneity was considerable (χ2 = 230.3, P < 0.0001; I 2 = 96.1%). The pooled incidence of mixed infection was 29.3% (95% CI: 22.4–36.2, I 2 = 96.1%). Similarly as above, subgroup analysis was carried out according to participants (≤5 years old or ≤19 years old) or the regions. The pooled incidence of mixed infections was 32.8% (95% CI: 13.8–51.7, I 2 = 91.8%) in patients ≤5 years old, 29.4% (95% CI: 21.8–35.2, I 2 = 96.4%) in patients ≤19 years old. Results of subgroup analysis according to regions were demonstrated in Table 2, along with considerable heterogeneity.
We further estimated individual incidence of common respiratory virus. As shown in Figure 3 and Table 4, the pooled incidence of childhood CAP associated with rhinovirus was highest (18.9%, 95% CI: 14.3–23.4, I 2 = 95.8%), followed by respiratory syncytial virus (RSV) (17.5%, 95% CI: 13.3–21.6, I 2 = 97.1%) and bocavirus (12.7%, 95% CI: 8.5–16.9, I 2 = 95.8%). The incidence of virus detected was higher in studies when real‐time PCR was used for virus detection compared with other detection methods (Table 3).
Figure 3.
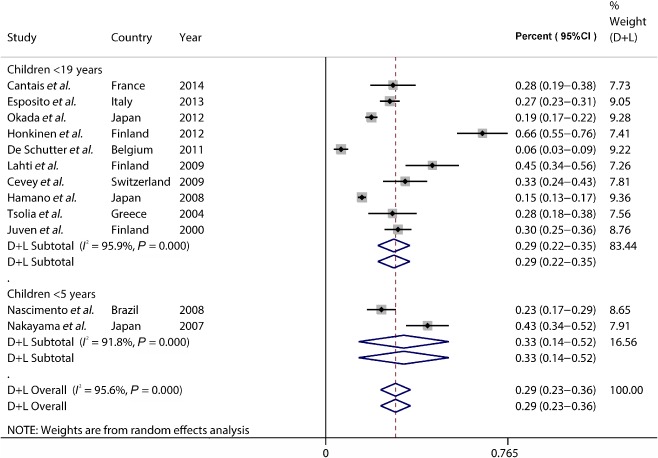
The pooled incidence of viral infection mixed with other pathogens in childhood community‐acquired pneumonia (CAP).
Table 4.
Discrepancies of the pooled incidence among the common respiratory viruses
| Incidence (%) | 95% CI | χ2 | P | I 2 (%) | |
|---|---|---|---|---|---|
| RSV | 17.5 | 13.3–21.6 | 621.22 | 0.000 | 97.1 |
| Rhinovirus | 18.9 | 14.3–23.4 | 306.04 | 0.012 | 95.8 |
| Influenza | 6.3 | 4.7–8.0 | 242.90 | 0.000 | 92.6 |
| hMPV | 6.1 | 4.1–8.1 | 379.59 | 0.003 | 96.0 |
| Bocavirus | 12.7 | 8.5–16.9 | 167.50 | 0.000 | 95.8 |
| Parainfluenza | 7.8 | 6.0–9.5 | 211.04 | 0.001 | 91.5 |
| Adenovirus | 6.0 | 4.4–7.7 | 212.01 | 0.019 | 92.5 |
| Coronavirus | 3.9 | 2.1–5.7 | 40.65 | 0.000 | 82.8 |
CI, confidence interval; RSV, respiratory syncytial virus; hMPV, human metapneumovirus.
Several studies provided incidence of viral infection in patients stratified by age: ≤1 year, 2–5 years, or ≥6 years old.12, 13, 24, 26, 27, 30 The pooled incidence of viral infection was 76.1% (95% CI: 62.8–89.4, I 2 = 95.1%) in patients aged ≤1 year, 63.1% (95% CI: 50.2–75.9, I 2 = 94.1%) in patients aged 2–5 years and 27.9% (95% CI: 4.3–51.5, I 2 = 96.3%) in patients aged ≥6 years old. Our study indicated that the incidence of RSV‐positive CAP in children varied with age as shown in Figure 4. The pooled incidence of RSV‐positive CAP was 35.5% (95% CI: 22.0–49.0, I 2 = 90.2%) in patients aged ≤1 year, 24.8% (95% CI: 14.3–35.3, I 2 = 92.6%) in patients aged 2–6 years and 4.8% (95% CI: 0.0–11.3, I 2 = 86.6%) in patients aged ≥6 years old. The incidence of rhinovirus infections was similar in the three age groups.
Figure 4.
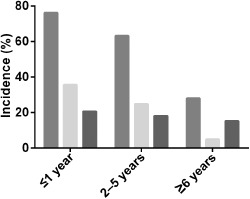
The pooled incidence of childhood community‐acquired pneumonia (CAP) associated with respiratory viruses, rhinovirus or respiratory syncytial virus (RSV) stratified by age. ( ) Overall; (
 ) RSV; (
 ) rhinovirus.
We estimated publication bias with Egger tests and Begg–Mazumdar tests. However, no publication bias was identified (Supplementary http://onlinelibrary.wiley.com/doi/10.1111/resp.12472/suppinfo).
Discussion
Our systematic review and meta‐analysis included 21 previously published reports investigating the incidence of viral infection in childhood CAP. Our main findings are that respiratory viruses could be detected in approximately 55% paediatric patients with CAP, with more than half characterized as mixed infection. Rhinovirus, RSV and bocavirus were the most frequently detected pathogens in childhood CAP. The incidence of viral infection varied with age and in particular was higher in patients aged ≤1 year old than that in patients aged ≥6 years old. The findings elucidate the contributions of respiratory virus in causing childhood CAP.
Rhinovirus, RSV and bocavirus were the three most common viruses associated with childhood CAP, while influenza virus, rhinovirus and coronavirus are the leading viruses in adult patients with CAP.32, 33 Contrary to RSV, which has been clearly defined as an important cause of childhood CAP, rhinoviruses and bocavirus were uncommon findings using conventional methods such as culture, antigen detection or serology. However, with the advent of PCR techniques, rhinoviruses and bocavirus have been detected increasingly in childhood CAP.34, 35 Our findings emphasize the importance of these viruses which are involved in the pathogenesis of childhood CAP and underline the need to address this clinical problem. Up to now, experience with antivirals for CAP caused by these viruses is scarce. Only few case reports and some treatment studies in immunosuppressed patients investigated the efficiency of ribavirin, which is a broad antiviral agent in treatment for bronchiolitis and pneumonia caused by RSV infection.36, 37 More safe and efficient vaccines and agents are needed to be developed in order to prevent and manage these viral infections.
As demonstrated in our study, mixed infection by viruses and other pathogens account for more than half of overall viral infection. Interaction of virus and bacteria in the pathogenesis of pneumonia has been partially explored. One hypothesis is that viral infections are followed by secondary bacterial infection.38, 39 Viral infections disrupt mucosal barriers in the respiratory tracts, which makes hosts susceptible to bacterial infection. Mixed infections may induce more severe clinical diseases than individual bacterial or viral infections alone. One study reported that co‐infection of influenza virus and Staphylococcus aureus can lead to severe fatal pneumonia in children.40, 41
Our heterogeneity analysis generated two key findings. Firstly, the incidence of overall virus infection is reported to be higher in the studies that detect many virus species than the studies which detect fewer species. The yield virus detection is associated with the species viruses identified. Secondly, for mixed infection, real‐time PCR achieve higher yield rate compared with other diagnostic methods. This result highlights the importance to develop standards for identifying respiratory virus in clinical practice.
Our study has several limitations. First of all, only reports in English/Chinese literature were included in our study, which led to the loss of raw data from reports in other languages. Furthermore, many studies indicated that some respiratory viruses present a strong seasonal pattern like influenza viruses. However, those data were not included for the meta‐analysis. Moreover, we did not correlate clinical severity of pneumonia with causative viral pathogens due to the lack of original data.
In conclusion, our results suggest that more attention should be paid to the respiratory viruses as a cause or contributing factor of childhood CAP. Further studies are required to establish a standard method for specimen collection and identification of respiratory viruses.
Supporting information
Supplementary Figure S1 Estimation of publication bias with Egger tests.
Supplementary Table S1 Quality assessment.
(Associate Editor: Marcos Restrepo)
References
- 1. Bryce J, Boschi‐Pinto C, Shibuya K, Black RE. WHO estimates of the causes of death in children. Lancet 2005; 365: 1147–1152. [DOI] [PubMed] [Google Scholar]
- 2. Williams BG, Gouws E, Boschi‐Pinto C, Bryce J, Dye C. Estimates of world‐wide distribution of child deaths from acute respiratory infections. Lancet Infect. Dis. 2002; 2: 25–32. [DOI] [PubMed] [Google Scholar]
- 3. Yorita KL, Holman RC, Sejvar JJ, Steiner CA, Schonberger LB. Infectious disease hospitalizations among infants in the United States. Pediatrics 2008; 121: 244–252. [DOI] [PubMed] [Google Scholar]
- 4. McIntosh K. Community‐acquired pneumonia in children. N. Engl. J. Med. 2002; 346: 429–437. [DOI] [PubMed] [Google Scholar]
- 5. Weinberg GA, Erdman DD, Edwards KM, Hall CB, Walker FJ, Griffin MR, Schwartz B. Superiority of reverse‐transcription polymerase chain reaction to conventional viral culture in the diagnosis of acute respiratory tract infections in children. J. Infect. Dis. 2004; 189: 706–710. [DOI] [PubMed] [Google Scholar]
- 6. Syrmis MW, Whiley DM, Thomas M, Mackay IM, Williamson J, Siebert DJ, Nissen MD, Sloots TP. A sensitive, specific, and cost‐effective multiplex reverse transcriptase‐PCR assay for the detection of seven common respiratory viruses in respiratory samples. J. Mol. Diagn. 2004; 6: 125–131. [DOI] [PMC free article] [PubMed] [Google Scholar]
- 7. von Elm E, Altman DG, Egger M, Pocock SJ, Gotzsche PC, Vandenbroucke JP. The Strengthening the Reporting of Observational Studies in Epidemiology (STROBE) statement: guidelines for reporting observational studies. Lancet 2007; 370: 1453–1457. [DOI] [PubMed] [Google Scholar]
- 8. DerSimonian R, Laird N. Meta‐analysis in clinical trials. Control. Clin. Trials 1986; 7: 177–188. [DOI] [PubMed] [Google Scholar]
- 9. Higgins JP, Thompson SG. Quantifying heterogeneity in a meta‐analysis. Stat. Med. 2002; 21: 1539–1558. [DOI] [PubMed] [Google Scholar]
- 10. Thompson SG, Higgins JP. How should meta‐regression analyses be undertaken and interpreted? Stat. Med. 2002; 21: 1559–1573. [DOI] [PubMed] [Google Scholar]
- 11. Wiemken T, Peyrani P, Bryant K, Kelley RR, Summersgill J, Arnold F, Carrico R, McKinney WP, Jonsson C, Carrico K et al. Incidence of respiratory viruses in patients with community‐acquired pneumonia admitted to the intensive care unit: results from the Severe Influenza Pneumonia Surveillance (SIPS) project. Eur. J. Clin. Microbiol. Infect. Dis. 2013; 32: 705–710. [DOI] [PubMed] [Google Scholar]
- 12. Esposito S, Daleno C, Prunotto G, Scala A, Tagliabue C, Borzani I, Fossali E, Pelucchi C, Principi N. Impact of viral infections in children with community‐acquired pneumonia: results of a study of 17 respiratory viruses. Influenza Other Respir Viruses 2013; 7: 18–26. [DOI] [PMC free article] [PubMed] [Google Scholar]
- 13. Okada T, Morozumi M, Sakata H, Takayanagi R, Ishiwada N, Sato Y, Oishi T, Tajima T, Haruta T, Kawamura N et al. A practical approach estimating etiologic agents using real‐time PCR in pediatric inpatients with community‐acquired pneumonia. J. Infect. Chemother. 2012; 18: 832–840. [DOI] [PubMed] [Google Scholar]
- 14. Honkinen M, Lahti E, Osterback R, Ruuskanen O, Waris M. Viruses and bacteria in sputum samples of children with community‐acquired pneumonia. Clin. Microbiol. Infect. 2012; 18: 300–307. [DOI] [PMC free article] [PubMed] [Google Scholar]
- 15. Garcia‐Garcia ML, Calvo C, Pozo F, Villadangos PA, Perez‐Brena P, Casas I. Spectrum of respiratory viruses in children with community‐acquired pneumonia. Pediatr. Infect. Dis. J. 2012; 31: 808–813. [DOI] [PubMed] [Google Scholar]
- 16. Ding XF, Zhang B, Zhong LL, Xiao NG, Zhou QH, Duan ZJ, Xie ZP, Gao HC. [Viral etiology and risk factors for severe community‐acquired pneumonia in children]. Zhongguo Dang Dai Er Ke Za Zhi 2012; 14: 449–453. [PubMed] [Google Scholar]
- 17. O'Callaghan‐Gordo C, Bassat Q, Morais L, Diez‐Padrisa N, Machevo S, Nhampossa T, Nhalungo D, Sanz S, Quinto L, Alonso PL et al. Etiology and epidemiology of viral pneumonia among hospitalized children in rural Mozambique: a malaria endemic area with high prevalence of human immunodeficiency virus. Pediatr. Infect. Dis. J. 2011; 30: 39–44. [DOI] [PubMed] [Google Scholar]
- 18. De Schutter I, De Wachter E, Crokaert F, Verhaegen J, Soetens O, Pierard D, Malfroot A. Microbiology of bronchoalveolar lavage fluid in children with acute nonresponding or recurrent community‐acquired pneumonia: identification of nontypeable Haemophilus influenzae as a major pathogen. Clin. Infect. Dis. 2011; 52: 1437–1444. [DOI] [PMC free article] [PubMed] [Google Scholar]
- 19. Wolf DG, Greenberg D, Shemer‐Avni Y, Givon‐Lavi N, Bar‐Ziv J, Dagan R. Association of human metapneumovirus with radiologically diagnosed community‐acquired alveolar pneumonia in young children. J. Pediatr. 2010; 156: 115–120. [DOI] [PMC free article] [PubMed] [Google Scholar]
- 20. Mathisen M, Strand TA, Sharma BN, Chandyo RK, Valentiner‐Branth P, Basnet S, Adhikari RK, Hvidsten D, Shrestha PS, Sommerfelt H. RNA viruses in community‐acquired childhood pneumonia in semi‐urban Nepal; a cross‐sectional study. BMC Med. 2009; 7: 35. [DOI] [PMC free article] [PubMed] [Google Scholar]
- 21. Lahti E, Peltola V, Waris M, Virkki R, Rantakokko‐Jalava K, Jalava J, Eerola E, Ruuskanen O. Induced sputum in the diagnosis of childhood community‐acquired pneumonia. Thorax 2009; 64: 252–257. [DOI] [PubMed] [Google Scholar]
- 22. Cevey‐Macherel M, Galetto‐Lacour A, Gervaix A, Siegrist CA, Bille J, Bescher‐Ninet B, Kaiser L, Krahenbuhl JD, Gehri M. Etiology of community‐acquired pneumonia in hospitalized children based on WHO clinical guidelines. Eur. J. Pediatr. 2009; 168: 1429–1436. [DOI] [PMC free article] [PubMed] [Google Scholar]
- 23. Samransamruajkit R, Hiranrat T, Chieochansin T, Sritippayawan S, Deerojanawong J, Prapphal N, Poovorawan Y. Prevalence, clinical presentations and complications among hospitalized children with influenza pneumonia. Jpn. J. Infect. Dis. 2008; 61: 446–449. [PubMed] [Google Scholar]
- 24. Nascimento‐Carvalho CM, Ribeiro CT, Cardoso MR, Barral A, Araujo‐Neto CA, Oliveira JR, Sobral LS, Viriato D, Souza AL, Saukkoriipi A et al. The role of respiratory viral infections among children hospitalized for community‐acquired pneumonia in a developing country. Pediatr. Infect. Dis. J. 2008; 27: 939–941. [DOI] [PubMed] [Google Scholar]
- 25. Hamano‐Hasegawa K, Morozumi M, Nakayama E, Chiba N, Murayama SY, Takayanagi R, Iwata S, Sunakawa K, Ubukata K. Comprehensive detection of causative pathogens using real‐time PCR to diagnose pediatric community‐acquired pneumonia. J. Infect. Chemother. 2008; 14: 424–432. [DOI] [PMC free article] [PubMed] [Google Scholar]
- 26. Cilla G, Onate E, Perez‐Yarza EG, Montes M, Vicente D, Perez‐Trallero E. Viruses in community‐acquired pneumonia in children aged less than 3 years old: high rate of viral coinfection. J. Med. Virol. 2008; 80: 1843–1849. [DOI] [PMC free article] [PubMed] [Google Scholar]
- 27. Nakayama E, Hasegawa K, Morozumi M, Kobayashi R, Chiba N, Iitsuka T, Tajima T, Sunakawa K, Ubukata K. Rapid optimization of antimicrobial chemotherapy given to pediatric patients with community‐acquired pneumonia using PCR techniques with serology and standard culture. J. Infect. Chemother. 2007; 13: 305–313. [DOI] [PMC free article] [PubMed] [Google Scholar]
- 28. Tsolia MN, Psarras S, Bossios A, Audi H, Paldanius M, Gourgiotis D, Kallergi K, Kafetzis DA, Constantopoulos A, Papadopoulos NG. Etiology of community‐acquired pneumonia in hospitalized school‐age children: evidence for high prevalence of viral infections. Clin. Infect. Dis. 2004; 39: 681–686. [DOI] [PMC free article] [PubMed] [Google Scholar]
- 29. Laundy M, Ajayi‐Obe E, Hawrami K, Aitken C, Breuer J, Booy R. Influenza A community‐acquired pneumonia in East London infants and young children. Pediatr. Infect. Dis. J. 2003; 22: S223–227. [DOI] [PubMed] [Google Scholar]
- 30. Juven T, Mertsola J, Waris M, Leinonen M, Meurman O, Roivainen M, Eskola J, Saikku P, Ruuskanen O. Etiology of community‐acquired pneumonia in 254 hospitalized children. Pediatr. Infect. Dis. J. 2000; 19: 293–298. [DOI] [PubMed] [Google Scholar]
- 31. Cantais A, Mory O, Pillet S, Verhoeven PO, Bonneau J, Patural H, Pozzetto B. Epidemiology and microbiological investigations of community‐acquired pneumonia in children admitted at the emergency department of a university hospital. J. Clin. Virol. 2014; 60: 402–407. [DOI] [PMC free article] [PubMed] [Google Scholar]
- 32. Cesario TC. Viruses associated with pneumonia in adults. Clin. Infect. Dis. 2012; 55: 107–113. [DOI] [PMC free article] [PubMed] [Google Scholar]
- 33. Ruuskanen O, Lahti E, Jennings LC, Murdoch DR. Viral pneumonia. Lancet 2011; 377: 1264–1275. [DOI] [PMC free article] [PubMed] [Google Scholar]
- 34. Hayden FG. Rhinovirus and the lower respiratory tract. Rev. Med. Virol. 2004; 14: 17–31. [DOI] [PMC free article] [PubMed] [Google Scholar]
- 35. Fry AM, Lu X, Chittaganpitch M, Peret T, Fischer J, Dowell SF, Anderson LJ, Erdman D, Olsen SJ. Human bocavirus: a novel parvovirus epidemiologically associated with pneumonia requiring hospitalization in Thailand. J. Infect. Dis. 2007; 195: 1038–1045. [DOI] [PMC free article] [PubMed] [Google Scholar]
- 36. Hopkins P, McNeil K, Kermeen F, Musk M, McQueen E, Mackay I, Sloots T, Nissen M. Human metapneumovirus in lung transplant recipients and comparison to respiratory syncytial virus. Am. J. Respir. Crit. Care Med. 2008; 178: 876–881. [DOI] [PubMed] [Google Scholar]
- 37. Empey KM, Peebles RS Jr, Kolls JK. Pharmacologic advances in the treatment and prevention of respiratory syncytial virus. Clin. Infect. Dis. 2010; 50: 1258–1267. [DOI] [PMC free article] [PubMed] [Google Scholar]
- 38. Beigel JH, Farrar J, Han AM, Hayden FG, Hyer R, de Jong MD, Lochindarat S, Nguyen TK, Nguyen TH, Tran TH et al. Avian influenza A (H5N1) infection in humans. N. Engl. J. Med. 2005; 353: 1374–1385. [DOI] [PubMed] [Google Scholar]
- 39. Bautista E, Chotpitayasunondh T, Gao Z, Harper SA, Shaw M, Uyeki TM, Zaki SR, Hayden FG, Hui DS, Kettner JD et al. Clinical aspects of pandemic 2009 influenza A (H1N1) virus infection. N. Engl. J. Med. 2010; 362: 1708–1719. [DOI] [PubMed] [Google Scholar]
- 40. Reed C, Kallen AJ, Patton M, Arnold KE, Farley MM, Hageman J, Finelli L. Infection with community‐onset Staphylococcus aureus and influenza virus in hospitalized children. Pediatr. Infect. Dis. J. 2009; 28: 572–576. [DOI] [PubMed] [Google Scholar]
- 41. Finelli L, Fiore A, Dhara R, Brammer L, Shay DK, Kamimoto L, Fry A, Hageman J, Gorwitz R, Bresee J et al. Influenza‐associated pediatric mortality in the United States: increase of Staphylococcus aureus coinfection. Pediatrics 2008; 122: 805–811. [DOI] [PubMed] [Google Scholar]
Associated Data
This section collects any data citations, data availability statements, or supplementary materials included in this article.
Supplementary Materials
Supplementary Figure S1 Estimation of publication bias with Egger tests.
Supplementary Table S1 Quality assessment.