

Abstract
The purpose of this article was to conduct a risk‐based study based on a linkage of experimental human influenza infections and fluctuation analysis of airway function to assess whether influenza viral infection was risk factor for exacerbations of chronic occupational asthma. Here we provided a comprehensive probabilistic analysis aimed at quantifying influenza‐associated exacerbations risk for occupational asthmatics, based on a combination of published distributions of viral shedding and symptoms scores and lung respiratory system properties characterized by long‐range peak expiratory flow (PEF) dynamics. Using a coupled detrended fluctuation analysis‐experimental human influenza approach, we estimated the conditional probability of moderate or severe lung airway obstruction and hence the exacerbations risk of influenza‐associated occupational asthma in individuals. The long‐range correlation exponent (α) was used as a predictor of future exacerbations risk of influenza‐associated asthma. For our illustrative distribution of PEF fluctuations and influenza‐induced asthma exacerbations risk relations, we found that the probability of exacerbations risk can be limited to below 50% by keeping α to below 0.53. This study also found that limiting wheeze scores to 0.56 yields a 75% probability of influenza‐associated asthma exacerbations risk and a limit of 0.34 yields a 50% probability that may give a representative estimate of the distribution of chronic respiratory system properties. This study implicates that influenza viral infection is an important risk factor for exacerbations of chronic occupational asthma.
Keywords: Asthma, detrended fluctuation analysis, exacerbations risk, influenza, probabilistic risk assessment
1. INTRODUCTION
Recent studies have demonstrated that bronchial asthma and chronic obstructive pulmonary disease (COPD) are the major chronic respiratory diseases causing morbidity and mortality among children and elderly worldwide.( 1 , 2 )
Kondo and Abe( 3 ) indicated that influenza‐induced asthma may continuously deteriorate during the first two days of illness and may require at least seven days to recover. Murphy et al. ( 4 ) reported that influenza in patients with asthma can cause acute exacerbations, whereas in patients with COPD can lead to respiratory distress. Upshur et al. ( 5 ) and Martinello et al. ( 6 ) found that exacerbations of COPD are influenced by influenza. Wilkinson et al.( 7 ) reported that a total of 70% of COPD exacerbations were associated with a bacterial pathogen Haemophilus influenzae and rhinovirus was identified in 20% of exacerbations. They suggested that changes in airway viral load and interactions between multiple pathogens and airway could modulate exacerbations severity. Wilkinson et al.( 8 ) indicated that the consequence of respiratory syncytial virus (RSV) persistence in adult patients with COPD was associated with airway inflammation and could accelerate the decline in forced expiratory volume in 1 second (FEV1).
On assessing the effects of a winter influenza season on patients with COPD, Gorse et al. ( 9 ) found that laboratory‐documented influenza‐caused illness was associated significantly with worsening in FEV1. Ko et al. ( 10 ) reported that the most prevalent viruses detected during acute exacerbations of COPD in Hong Kong were the influenza A viruses and coronavirus. They indicated that among 196 patients with mean age of 76 years, mean FEV1 was 40% of predicted normal and FEV1/FVC (forced vital capacity) ratio was 58%. Singh and Busse( 11 ) and De Derred et al. ( 12 ) also suggested that influenza virus is a frequent contributor of acute exacerbations of asthma and COPD. Therefore, the major viral causes of exacerbations of COPD and chronic asthma include influenza, RSV, and coronavirus.
Diurnal variation in peak expiratory flow (PEF) has been suggested as a surrogate for bronchial hyperreactivity, providing a useful index in the management of bronchial asthma.( 13 , 14 , 15 , 16 , 17 ) Troyanov et al. ( 15 ) indicated that daily variations in PEF and FEV1 were correlated significantly with lung airway caliber, suggesting that PEF is as satisfactory as FEV1 for describing circadian variations among normal subjects and stable asthmatic subjects.
It has been suggested that airborne viral infections have been responsible for the major risk factor for exacerbations of chronic asthma and COPD.( 18 , 19 ) In additional to their well‐characterized role in triggering the exacerbations of COPD and chronic asthma, airborne virus infections enhanced virus‐induced damage and innate inflammation.( 20 , 21 , 22 ) Mallia and Johnston( 18 ) indicated that airborne respiratory viruses are a major cause of exacerbations of both asthma and COPD, suggesting that exacerbations were associated with virus‐induced airway diseases. Papi et al. ( 23 ) indicated that COPD exacerbations were significantly associated with respiratory viral infections that caused reduction of FEV1 and airway inflammation. Donaldson et al. ( 24 ) and Fuhlbrigge et al. ( 25 ) indicated that patients with frequent exacerbations had a significantly faster decline in FEV1 and PEF, suggesting that the frequency of exacerbations contributes to long‐term decline in lung function of patients with moderate to severe COPD or asthma.
Recently, a method used in statistical physics called detrended fluctuation analysis( 26 , 27 ) was used to predict the risk of severe asthma and COPD exacerbations based on the knowledge of the temporal patterns of fluctuations in lung airway function.( 28 , 29 , 30 ) Frey et al. ( 28 ) indicated that chronic asthma could be treated as a dynamic disease of the respiratory system. Frey et al. ( 28 ) employed the detrended fluctuation analysis to predict the risk of worsening airflow obstruction by calculating the conditional probability. Their model can predict a severe obstruction that will occur within 30 days at a given current airway condition characterized by PEF. They also revealed that the detrended fluctuation analysis could characterize the long‐range correlation properties of previous temporal patterns of lung‐function PEF measurements. Therefore, the severe asthma episodes can be monitored by the long‐range correlations that are characterized by the time series of PEF.
Thus, Frey( 29 ) and Frey and Suki( 30 ) suggested that the correlation properties can be used to assess the risk of future asthma episodes and to improve the assessment of asthma severity for children and adults. Little research so far has been done to link lung function analysis and experimental human influenza‐associated chronic respiratory diseases for estimating the exacerbations risk of chronic respiratory diseases. The dynamics of viral shedding and symptoms following influenza virus infections are key factors when considering epidemic control measures.( 31 , 32 , 33 )
Recently, a growing issue concerning the work‐exacerbated asthma caused by occupational exposures has been noticed.( 34 ) Occupational asthma is a disease characterized by variable airflow limitation and/or airway hyper‐responsiveness due to causes and conditions attributable to a particular occupational environment.( 35 ) A longitudinal study reported that nearly 16% of all adult‐onset asthma was caused by occupational exposures.( 34 ) PEF monitoring for periods at work and away from work has proved to be a valuable means for assessing occupational asthma on an individual basis.( 34 ) Thus, in this study we focused our analysis on chronic occupational asthma as the chronic respiratory disease considered.
The purpose of this study was threefold: (1) to construct a relationship between respiratory symptoms scores and PEF in chronic respiratory disease individuals based on a linkage between experimental human influenza data and the effects of influenza virus infection on decrease in PEF, (2) to provide a probabilistic risk assessment framework for integrating viral shedding and symptoms scores data of influenza virus infections and fluctuation analysis of lung function to assess the exacerbations risk of influenza‐associated chronic respiratory diseases, and (3) to develop a detrended fluctuation analysis‐based risk predictive model to predict future influenza‐associated obstructive events.
2. MATERIALS AND METHODS
2.1. Experimental Human Influenza and Influenza‐Induced Asthma Data
Two valuable datasets provided by Carrat et al. ( 33 ) and Kondo and Abe( 3 ) give us the unique opportunity to examine the linkage between experimental human influenza and the effects of influenza virus infections on PEF decreasing in chronic respiratory diseases individuals. Carrat et al. ( 33 ) have reviewed the published studies describing the courses of influenza virus infection in placebo‐treated and untreated volunteers challenged with wild‐type influenza A (H1N1), A (H3N2), A (H2N2), and type B. Overall, the first dataset was reconstructed by taking into account 56 different studies with 1,280 healthy participants aged between 18 and 40 or 50 years. A total of 532 volunteers were challenged with an A (H1N1) virus, 473 with an A (H3N2) virus, 86 with an A (H2N2) virus, and 189 with a type B virus. The inoculum ranged from 103–107.2 TCID50 (50% tissue culture infective dose) ml−1. Most studies included daily follow‐up with daily nasal washing and collection of clinical signs and symptoms.
The proportion of volunteers who developed clinical illness of upper and lower respiratory symptoms after experimental influenza virus infection were estimated to be 58.8% (95% confidential interval (CI): 45.5–70.8) and 21% (95% CI: 14.0–30.3), respectively.( 33 ) In their study, upper respiratory symptoms most frequently appeared as nasal stuffiness, runny nose, sore throat, sneezing, hoarseness, ear pressure, or earache, whereas lower respiratory symptoms defined as cough, breathing difficulty, and chest discomfort, were most frequent.
To investigate the essential time course of bronchial caliber day by day in uncomplicated influenza infection, Kondo and Abe( 3 ) examined FEV1 values from five days before to ten days after the onset of illness in asthmatic children aged 8 to 12 years with tolerable respiratory symptoms. In their study, influenza infection was defined as nasal stuffiness, cough, sore throat, huskiness, throat injection, and headache with fever of >38 °C for at least two days during an influenza epidemic. Kondo and Abe( 3 ) found an insignificant difference in the time course of FEV1 of the acute stage between influenza A and B infections, showing that 15 of 20 patients had decrease in FEV1 more than 20% from baseline during the acute stage.
To ensure data homogeneity in age, we adopted an empirical linear relationship of FEV1 (%) = 0.77 PEF (% predicted) + 5.06 (r 2= 0.83, p < 0.001) based on airflow obstruction measurements( 36 ) for converting FEV1 to PEF (% predicted) values. Table I summarizes used daily viral shedding and respiratory symptoms scores data obtained from the experimental influenza virus infections together with measured decrease in PEF after the onset of influenza in asthmatics.
Table I.
Experimental Influenza Virus Infection Data and Time‐Course of Mean Decrease in FEV1 Values After the Onset of Influenza in Asthmatic Children Used in the Present Study
| Days Post Infection | ||||||||
|---|---|---|---|---|---|---|---|---|
| 1 | 2 | 3 | 4 | 5 | 6 | 7 | 8 | 9 |
| Viral Titer (LogTCID50 mL−1)a | ||||||||
| 1.88 | 2.98 | 2.61 | 2.14 | 1.53 | 1.06 | 0.72 | 0.27 | 0.32 |
| Respiratory Symptoms scoresa,b | ||||||||
| 0.15 | 0.67 | 0.95 | 0.91 | 0.81 | 0.56 | 0.49 | 0.36 | 0.13 |
| Decrease in FEV1 (%)c | ||||||||
| 22.6 ± 16.4 | 30.3 ± 10.9 | 25.4 ± 11.9 | 15.0 ± 6.8 | 19.8 ± 8.4 | 14.1 ± 10.3 | 10.6 ± 11.8 | 8.2 ± 13.0 | 8.2 ± 10.5 |
| (15) | (15) | (15) | (8) | (4) | (10) | (14) | (13) | (13) |
| Decrease in PEF (% Predicted)d | ||||||||
| 29.4 ± 21.4 | 39.4 ± 14.1 | 33.0 ± 15.5 | 19.5 ± 8.9 | 25.7 ± 11.0 | 18.3 ± 13.4 | 13.8 ± 15.3 | 10.6 ± 17.0 | 10.6 ± 13.7 |
aData are adopted from Carrat et al. ( 24 )
bA score of 1 corresponds to the maximum reported score value.
cData are adopted from Kondo and Abe( 3 ) in that value is presented as mean ± SD with sampling numbers in parenthesis.
dConversion of FEV1 (%) to PEF (% predicted) based on the empirical fitted equation (Kelley and Gibson)( 25 ): FEV1= 0.77 PEF (% predicted) + 5.06.
2.2. Time Series of Peak Expiratory Flow
The series of PEF measurement data used in this study were obtained from Malo et al. ( 37 ) Malo et al. ( 37 ) carried out PEF measurements every two hours in 74 occupational asthmatic subjects (most subjects were men and nonsmokers or ex‐smokers). Subjects were asked to record their values approximately every two hours from first thing in the morning until going to bed in the evening. The duration of recording was 23 ± 20 (mean ± SD) days for periods at work and 37 ± 22 days for periods away from work. Smoking habits of all subjects were 14%, 42%, and 44% for smokers, ex‐smokers, and nonsmokers, respectively. Baseline anthropometric, clinical, and functional results of the 74 subjects were assessed before the study, indicating that mean FEV1 value was 91 ± 18% predicted in that 12 subjects (16%) < 80% predicted. The majority were on bronchodilators only at the time of assessment and had a normal FEV1 in that 40 of 66 (61%) showed increased bronchial responsiveness. The graphs of PEF recordings were assessed in a randomized, cross‐over, and double‐blind study.
We reanalyzed the above‐mentioned series PEF measurements in the presence and in the absence of occupational asthmatic individuals and used a time series representation by characterizing PEF as a function of number of measurements. A Monte Carlo technique was performed to best fit the distributions of PEF corresponding to the reanalyzed time series PEF data.
2.3. Detrended Fluctuation Analysis
To detect the long‐range correlations embedded in nonstationary PEF time series, this study applied a detrended fluctuation analysis for minimizing the effect of nonstationary trends present in physiological PEF data. Detrended fluctuation analysis has been applied successfully to detect long‐range correlations in highly complex heart beat time series and other physiological signals.( 26 , 27 , 38 ) A detailed computational algorithm of detrended fluctuation analysis can be found elsewhere.( 26 , 27 , 38 )
The detrended fluctuation function can be described by a power law functional form as:
| (1) |
in that F(n) is the detrended fluctuation function characterizing by a root‐mean‐square fluctuation of the integrated and detrended time series as:
 |
(2) |
where  is the integrated PEF time series, PEF(i) is the PEF at time i (L min−1), PEFave is the average PEF, n is the window size of the integrated time series, yn(k) is the fitted least‐squared line in each window size n representing the trend in that window, N is the number of measurements, and y(k) − yn(k) represents the detrended integrated time series. Typically, F(n) increases with increasing of n. The exponent α characterizes the correlation properties of the entire range of PEF time series. The properties of α indicate that there is no correlation in the time series at α= 0.5, whereas for increasingly higher values of α it shows increasingly stronger long‐range correlations.
Here the calculated long‐range correlation exponent α that indicates the temporal history of the disease can be used as a predictor of future obstructive exacerbations in chronic airway diseases. This implicates that temporal long‐term fluctuation of lung function parameters are not totally random, demonstrating associations between past and present values with weak and measurable long‐range correlation.( 29 , 30 )
2.4. Probabilistic Risk Model
In this study, a biologically based empirical three‐parameter Hill equation was used to reconstruct the dose‐response profile:
 |
(3) |
where y(x) is the response caused by x, a and b are the fitted coefficients, and the exponent c is the fitted Hill coefficient. The cumulative distribution function (cdf) of the predicted dose‐response function of respiratory symptoms scores (RSS) for a given PEF can be expressed as the conditional cdf of P(RSS | PEF).
Risk characterization is the phase of risk assessment where the results of the influenza‐associated chronic respiratory diseases and quantitative effect assessments are integrated to provide the risk estimates resulted from lung airway obstruction measured by PEF fluctuations. The risk at the specific respiratory symptoms scores can be calculated as the probability density functions (pdfs) of PEF multiplied by the conditional probability of P(RSS | PEF). Therefore, a joint probability function (JPF) can be used to calculate the risk probability and can be expressed as:
| (4) |
where P(R RSS) represents the exacerbations risk estimate for an influenza‐associated chronic occupational asthmatic individual.
A risk profile was generated from the cumulative distribution of simulation outcomes. Each point on the risk curve represents both the probability that the chronic respiratory disease will exacerbate and also the frequency with which that level of effect would be exceeded. The x‐axis of the risk curve can be interpreted as a magnitude of effect (i.e., respiratory symptoms scores), and the y‐axis can be interpreted as the probability that an exacerbation effect of at least that magnitude will occur.
To assess the risk of influenza‐associated acute asthma episodes with significant airflow obstruction, we linked the correlation exponent (α) that derived from detrended fluctuation analysis with the conditional probability of P(RSS | PEF) to predict the probability that exacerbations will occur at a given current value of PEF. In view of Equations (3) and (4), a conditional probability of P(R|α) describing the correlation exponent (α)‐based risk prediction can be formulated by relating P(R) to RSS as:
 |
(5) |
in that we related the correlation exponent (α) to PEF as α= f(PEF) using a linear regression model by first establishing certain bins of the PEF values and a window of certain points corresponding to certain time period. Finally, the relationship between exacerbations risk probability of influenza‐associated asthma and the correlation exponent (α) can be established. Because wheezing is the asthma symptom most predictive of the level of airway obstruction, we also used the relationship between wheeze and PEF (% predicted) values to establish a wheeze‐based predictive conditional probability of P(exacerbations risk|wheeze) based on the data from Teeter and Bleecker.( 39 ) Here we normalized the wheeze score of 1 corresponding to the maximum score value based on the original wheeze scores that were rated by patients on 0 (none) and 4 (constant) integer scale.
2.5. Uncertainty and Data Analysis
Optimal statistical models were selected on the basis of least‐squared criterion from a set of generalized linear and nonlinear autoregression models provided by TableCurve 2D packages (AISN Software Inc., Mapleton, OR, USA) fitted to the study data. A value of p < 0.05 was judged significant. To quantify the uncertainty and its impact on the estimation of expected risk, a Monte Carlo (MC) technique was implemented. A MC simulation was also performed with 10,000 iterations to generate 2.5‐ and 97.5‐percentiles as the 95% CI for all fitted models. The Crystal Ball® software (Version 2000.2, Decisionerring, Inc., Denver, CO, USA) was employed to implement MC simulation. Fig. 1 illustrates the computational algorithm implemented in this study.
Figure 1.
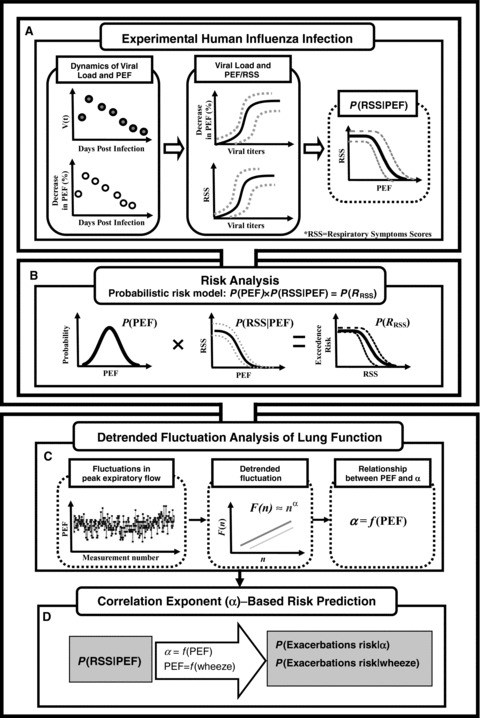
Schematic representation of computational algorithm used in this study (see main text for detailed symbol meanings).
3. RESULTS
3.1. Risk Estimates in Influenza‐Associated Chronic Asthma
We began by combining the respiratory symptoms scores and viral shedding dynamics data in experimental human influenza infections (Fig. 2A). Fig. 2A shows the similar trend for respiratory symptoms scores and viral shedding over time with nearly 1 day delay for respiratory symptoms measured, indicating that as the viral shedding increased, an increase in respiratory symptoms scores was observed. Our result shows that the optimized Hill‐based regression equation y = 1/(1 + (b/x)c) best describes the dose‐response relationship between symptoms scores and viral load with fitted parameter values of b = 0.73 logTCID50 mL−1 and c = 1.45 (r 2= 0.86, p < 0.001) (Fig. 2B). Similar to Fig. 2A, we then integrated the decrease in% PEF and viral shedding over time in experimental human influenza infection to explore the relationship between them (Fig. 3A). The reconstructed decrease in% PEF and viral load profile reveals that the Hill function with a 10,000 MC simulation provided an adequate fit for the data (r 2= 0.90, p < 0.001) with fitted parameter values of b = 6.75 logTCID50 mL−1 and c = 0.77 (Fig. 3B).
Figure 2.
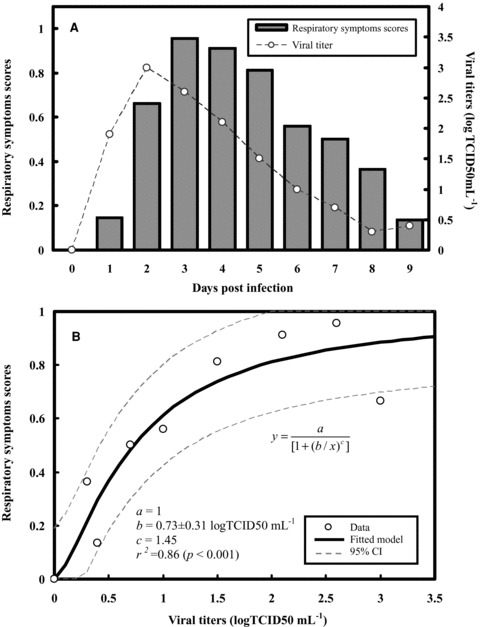
(A) Influenza viral shedding and normalized respiratory symptoms scores dynamics. (B) Reconstructed relationships between respiratory symptoms scores and viral shedding fitted by a three‐parameter Hill equation model with 95% confidence intervals.
Figure 3.
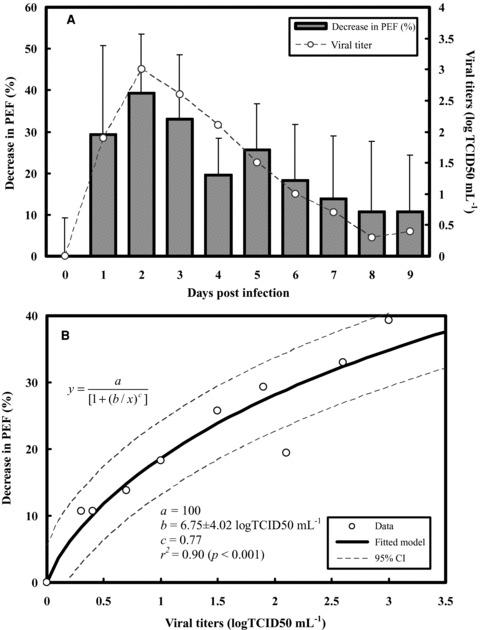
(A) Time course of influenza viral shedding and decrease in% PEF for influenza‐induced asthma individuals. (B) Reconstructed models fitted by a three‐parameter Hill equation model with 95% confidence intervals describing the relationships between decreasing in% PEF and viral shedding.
Given the dose‐response relationships of viral shedding and respiratory symptoms scores together with decrease in% PEF for influenza virus infections in patients with chronic asthma (Figs. 2B and 3B), we can construct a respiratory symptoms scores−PEF profile that explains mechanistically the observed relations. We therefore found out that a best fitted Hill model of y = a/(1 + (x/b)c) describes adequately the relationship between respiratory symptoms scores and PEF with fitted parameter values of a = 0.96, b = 445.81 L min−1, and c = 11.94 (r 2= 0.99, p < 0.001) (Fig. 4A).
Figure 4.
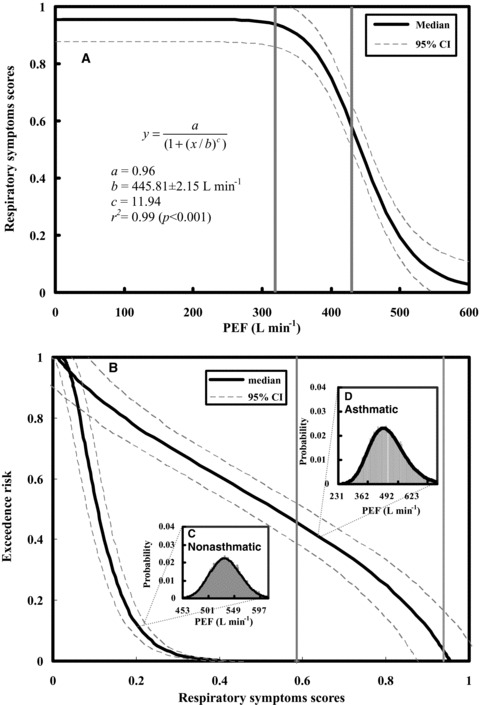
(A) Conditional probability of P(RSS|PEF) that is optimal fitted by a Hill equation where RSS denotes respiratory symptoms scores. (B) The exceedence risk of respiratory symptoms scores in asthmatic and nonasthmatic individuals based on the representative probability density functions of PEF shown in (C) and (D), respectively. Two vertical lines represent 60% and 80% of predicted PEF values (the normal value is estimated to be 628.5 L min−1) to delineate the severe and moderate regions based on GINA.( 2 )
Fig. 4B shows the predicted exceedence risks for both nonasthmatic and asthmatic individuals given the measured PEF distributions (Figs. 4C, 4D) based on respiratory symptoms scores−PEF response profile (Fig. 4A). Our results indicate that the probabilities that 50% or more of the exacerbations risks induced by influenza infection are estimated to be 0.53 (95% CI: 0.45–0.61) and 0.11 (0.08–0.13) for asthmatic and nonasthmatic individuals, respectively (Fig. 4B). On the other hand, for exceedence risks = 0.1 and 0.8, the asthmatic individuals have 0.90 (0.83–0.98) and 0.17 (0.09–0.25) of estimated respiratory symptoms scores caused by influenza infection, respectively (Fig. 4B).
3.2. Quantification of Risk from PEF Fluctuations
To quantify the influenza‐associated exacerbations risk of chronic occupational asthma from PEF fluctuation, the individual time series of 504 consecutive six‐daily PEF values was self‐similarity reproduced for three representative scenarios I, II, and III (Fig. 5A) based on published measurement data (Figs. 5B–5D). Scenario I represents PEF dynamics for individuals with occupational asthma away from work, whereas scenarios II and III show individual values of PEF taken at one week and two weeks work, respectively. In comparison with scenario I (average PEF = 506 L min−1), scenarios II and III had lower estimated PEF values of 422 and 358 L min−1, indicating a sign of increased instability of airway function (Table II). However, the variability (coefficient of variation, COV) of the PEF series was significantly higher in scenarios II and III than in scenario I (Table II). Here COV value can be used to compare the PEF data dispersion among the scenarios I, II, and III.
Figure 5.
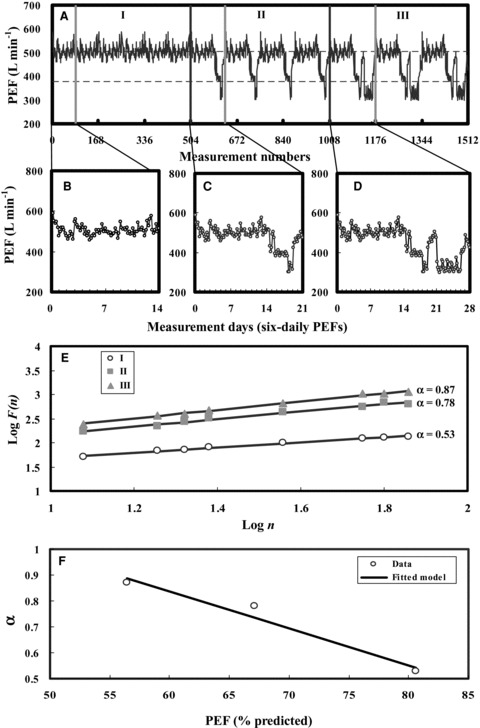
(A) The reproduced time series of PEF measurements in three representative scenarios I, II, and III representing different levels of lung function based on the published measurement data of six‐daily basis PEFs (B–D). (E) Plot of log F(n) vs. log n for three scenarios I, II, and III of PEF time series fitted by power law function. (F) Best fitted linear regression model describing the relationship between predicted PEF and correlation exponents (α).
Table II.
Peak Expiratory Flows and Fitted Correlation Exponents (α) of Occupational Asthmatic Subjects in Three Occupational Scenarios
| Scenario | PEF (L min−1) | PEF (% Predicted) | COVc (%) | Skewness | α |
|---|---|---|---|---|---|
| I | 506.4 ± 26.1a | 80.6%b | 5.2 | 0.68 | 0.53 |
| II | 421.9 ± 59.9 | 67.1% | 14.2 | −0.23 | 0.78 |
| III | 357.7 ± 56.9 | 56.9% | 15.9 | 0.89 | 0.87 |
aMean ± standard deviation.
bAdopted from Nunn and Gregg( 11 ) in that predicted PEF for men: loge PEF (L min−1) = 0.544 loge age − 0.0151age − 74.7/height (cm) + 5.48. An aged 40 years old with a height of 170 cm male was estimated to be 628.5 L min−1 of predicted PEF.
cCoefficient of variation (COV) = standard deviation/mean.
To assess the variability of PEF, the detrended fluctuation function F(n) was calculated from time series of PEF. Results indicate that the fitted power law function exponents (α) were estimated to be 0.53, 0.78, and 0.87 for scenarios I, II, and III, respectively (Fig. 5E; Table II). The present detrended fluctuation analysis also shows that in scenarios II and III, there are strong correlations between past and future PEF values, indicating that past PEF values have significant effect on the current or future values. A linear regression model (α=− 0.014 PEF pred+ 1.696, r2= 0.96, p < 0.05) was found to best describe the relationship between predicted PEF values and correlation exponents (α) (Fig. 5F).
To establish a conditional probability by which the correlation exponent (α) that can be used as a predictor to predict the influenza‐associated exacerbations risk in chronic occupational asthmatics, we converted appropriately the Fig. 4 of P(RSS|PEF) to P(exacerbations risk|α) based on fitted α−PEFpred linear mode (Fig. 5F). We found that influenza‐associated exacerbations risk increased with increasing correlation exponent (α) with a best fitted Hill model of y = 0.96/(1 + ((x − 1.7)/− 1.18))11.08) (r 2= 0.99, p < 0.001) (Fig. 6A). Our results indicate that scenario III had higher influenza‐associated exacerbations risk (0.94, 95% CI: 0.90–0.98) compared with scenarios II (0.91, 95% CI: 0.87–0.95) and I (0.51, 95% CI: 0.47–0.55) (Fig. 6B).
Figure 6.
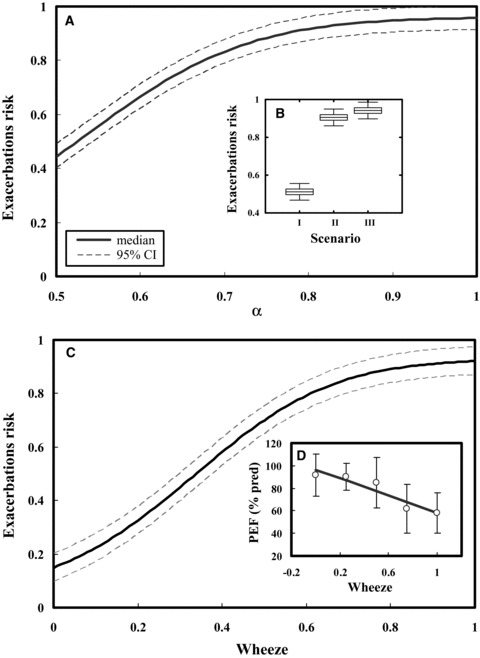
(A, B) Conditional probability of P(exacerbation risk|α) fitted by a Hill model by which the influenza‐induced asthma exacerbations risk for scenarios I, II, and III can be estimated based on correlation exponent (α) in which the box and whisker represent the uncertainty in three scenarios. (C, D) Conditional probability of P(exacerbation risk|wheeze) by which the influenza‐induced asthma exacerbations risk can be predicted from normalized wheeze symptoms scores based on the relationships between wheeze symptoms scores and PEF (% predict).
Here we also used wheezing episodes in occupational asthmatics to predict the influenza‐associated exacerbations risk. Fig. 6C gives a conditional probability of P(exacerbations risk|wheeze) based on a linear regression relationship between wheeze symptoms scores and PEF (% predicted) of the age‐ and height‐predicted normal values as PEF (% predicted) =−38.14wheeze + 96.4 (r 2= 0.87, p < 0.05) (Fig. 6D). Our results show that limiting wheeze scores to 0.56 yields a 75% probability of influenza‐associated asthma exacerbations risk and a limit of 0.34 yields a 50% probability (Fig. 6C)
4. DISCUSSION
In this study, we have conducted a risk‐based study based on a linkage of experimental human influenza infections and fluctuation analysis of airway function to assess whether influenza viral infection was a risk factor for exacerbations of chronic occupational asthma. Here a detrended fluctuation analysis was used to predict influenza‐associated exacerbations risk of chronic occupational asthma based on the long‐range PEF dynamics. This study implicates that influenza viral infection is a major risk factor for exacerbations of chronic occupational asthma. Our results show that viral infection was a highly significant risk factor for adults with chronic occupational asthma (exacerbations risk = 0.53, 95% CI: 0.45–0.61 corresponding to exceedence risk = 0.5) compared with asymptomatic controls (exacerbations risk = 0.11, 95% CI: 0.08–0.13). Overall, this study indicates that severe occupational asthmatics had higher influenza‐associated exacerbations risk (0.94, 95% CI: 0.90–0.98) compared with mild (0.91, 95% CI: 0.87–0.95) and control individuals (0.51, 95% CI: 0.47–0.55).
To test the rationalities of the dataset used in our model, we also adopted related literature to support the explanations as follows. The convex pattern of FEV1 values had been evidenced in association of ages.( 40 , 41 ) We considered that the PEF empirical equation for men (loge PEF (L min−1) = 0.544 loge age − 0.0151 age − 74.7/height (cm) + 5.48) was proper for our study (Table II). On the other hand, the major PEF data adopted from Malo et al. ( 37 ) in our selected three scenarios did not describe the information of age for participant subjects. However, we found that the mean duration of exposure for participant subjects was 9.4 years. Moreover, Leroyer et al. ( 42 ) also reported that the averaged age and duration of exposure were 40.4 and 12.8 years, respectively. Hence, we reasonably assumed that the average participant age and body height was 40 years and 170 cm, respectively. Thus the predicted PEF was estimated to be 628.5 L min−1, resulting in the PEF (% predicted) values in Table II of 80.6%, 67.1%, and 56.9%, respectively. Although Miller( 43 ) proposed the recalculated regression (loge PEF (L min−1) = 0.755 loge age − 0.021 age − 104.1/height (cm) + 5.16) of PEF values for men, the proposed relative standard deviation (46 L min−1) was higher than the difference of two predicted PEF values (660.3 L min−1 by using recalculated regression, difference = 31.8 L min−1). Thus, results showed that the two PEF values were not significantly different. Moreover, if the recalculated PEF values replaced the used one, it did not affect the outcomes in this study.
By focusing on long‐range correlations in daily PEF fluctuations and their probabilistic implications for the likelihood of asthma exacerbations, this study built on an integrating risk assessment approach. Using a coupled detrended fluctuation analysis‐experimental human influenza approach, we estimated the conditional probability of moderate or severe lung airway obstruction and hence the influenza‐associated occupational asthma exacerbations risk in individuals. Here we provided a comprehensive probabilistic analysis aimed at quantifying influenza‐associated exacerbations risk for occupational asthmatics, based on a combination of published distributions of viral shedding and symptoms scores and lung respiratory system properties. We used a pharmacokinetic‐based Hill equation to construct the relationship among respiratory symptoms scores, lung function, and viral dynamic because it is a dose‐dependent biological response model. It also allows us to compare the cooperatively among different dose‐response profiles that can explicitly show the responses are depending on the maximum respiratory symptoms scores/peak expiratory flow and viral titer.( 44 ) We showed that the conditional probability functions of P(respiratory symptoms scores|PEF) and P(exacerbations risk|α) are robust indicators of the probability that severe asthma episodes will occur for influenza‐associated occupational asthmatics. Based on the calculated correlation exponent α, this study found that limiting wheeze scores to 0.56 yields a 75% probability of exacerbations risk of influenza‐associated asthma and a limit of 0.34 yields a 50% probability that may give a representative estimate of the distribution of chronic respiratory system properties.
Teeter et al. ( 39 ) did not clearly describe the wheeze symptom score. They only presented none symptom (score 0) to constant (score 4). Therefore, we adopted Grazzini et al. ( 45 ) to support the definitions of a 5‐score system for wheeze symptoms in our study. Grazzini et al. ( 45 ) used the score from 0 to 4 to present none, 1–2 per year, monthly, weekly, and daily, respectively. In our study, we treated the wheeze symptom scores as normalized values from 0 to 1 for simplified and consistent reasons. Hence, the normalized wheeze values of 0.11, 0.34, and 0.50 could be considered as mild (none to yearly), moderate (yearly to monthly), and severe (monthly to weekly) conditions, respectively. The normalized value greater than 0.75 could be considered as a very severe condition (means episode with daily). Yet Mitra et al. ( 46 ) proposed a 4‐score system (from 0 to 3) for describing the wheeze symptom. However, if future study used the normalized values that we estimated by the 4‐score system of wheeze symptom, the severe conditions of patients should be redefined. That is to say, different score systems for wheeze symptoms decided the clinical cut‐points (such as yearly, monthly, weekly, or daily).
A limitation of the present analysis is the adopted study data. The published data that we used might not all be dependent and not equally likely, and might not be formally combined. They are used here to represent the applicable published observational data whose implications for exacerbations risk prediction of influenza‐associated asthma have not been analyzed before. On the other hand, determining probabilistic exacerbations risk for future occupational asthma episodes caused by influenza virus infection is challenging, as it requires a synthesis of uncertainties along the cause‐effect chain from viral infection to lung function variations. For example, uncertainties may exist in the PEF measurements, viral shedding and symptoms scores, and asthmatic responses. Uncertainties in future exacerbation predictions of influenza‐associated asthma can be quantified by constraining the present risk‐based predictive model parameters to reproduce temporal history of lung function fluctuations, asthma severity and stability, and fluctuating environmental stimuli (e.g., allergens, infections, and pollutants).( 30 ) Future studies can use DFA to quantify the time‐series environmental stimuli data and to correlate the relationships with lung function fluctuations.
To represent current knowledge on future viral infection‐induced severe asthma episodes is difficult, and might be best encapsulated in the wide range of results from the multidimensional approach that includes a combination of several clinical and physiological parameters such as symptoms, behavioral factors, lung function, and inflammatory markers.( 30 ) Frey and Suki( 30 ) suggested that a fluctuation analysis approach can be used to identify dynamic patterns in fluctuations of clinical symptoms of complex chronic diseases. To improve risk assessment of asthma severity, the fluctuation analysis approach can be applied to analyze the correlation properties based on observation of the long‐term temporal fluctuations of clinical and physiological markers. From the perspective point of view toward health surveillance of occupational asthma, we hoped that the proposed DFA‐based PEF scheme would (i) enable the early identification of adverse health effects in individuals, (ii) complement environmental monitoring in assessing control, and (iii) contribute to the process of hazard and risk assessment.
In conclusion, we emulated the detrended fluctuation approach by combining experimental human influenza infection data with influenza‐induced asthmatic respiratory symptoms, and incorporated these associations into occupational asthmatic settings with PEF measurements of lung function responses over time. For our illustrative distribution of PEF fluctuations and influenza‐induced asthma exacerbations risk relations, we found that the probability of exacerbations risk can be limited to below 50% by keeping correlation exponent (α) to below 0.53. If the acceptable exceedence probability were 50%, this would limit a wheeze score of 0.34 or lower. Further theoretical and experimental analyses are required to achieve a better understanding of influenza‐induced asthma exacerbations risk. However, we think there is room for further improvement, especially in better understanding the experimental human influenza infection of respiratory symptoms, the effect of influenza virus infection on PEF/FEV1 in asthmatics, and dynamic disease of respiratory system‐based fluctuation analysis.
ACKNOWLEDGMENTS
The authors acknowledge the financial support of the National Science Council of Republic of China under Grant NSC 97‐2313‐B‐002‐017‐MY3.
REFERENCES
- 1. Pauwels RA, Buist AS, Calverley PMA, Jenkins CR, Hurd SS. Global strategy for the diagnosis, management, and prevention of chronic obstructive pulmonary disease: NHLBI/WHO Global Initiative for Chronic Obstructive Lung Disease (GOLD) Workshop summary. American Journal of Respiratory and Critical Care Medicine, 2001; 163:1256–1276. [DOI] [PubMed] [Google Scholar]
- 2. Global Initiative for Asthma (GINA) . Available at: http://www.ginasthma.com.
- 3. Kondo S, Abe K. The effect of influenza virus infection on FEV1 in asthmatic children: The time‐course study. Chest, 1991; 100:1235–1238. [DOI] [PubMed] [Google Scholar]
- 4. Murphy KR, Eivindson A, Pauksens K, Stein WJ, Tellier G, Watts R, Leophonte P, Sharp SJ, Loeschel E. Efficacy and safety of inhaled zanamivir for the treatment of influenza in patients with asthma or chronic obstructive pulmonary disease—A double‐blind, randomised, placebo‐controlled, multicentre study. Clinical Drug Investigation, 2000; 20:337–349. [Google Scholar]
- 5. Upshur REG, Moineddin R, Crighton EJ, Mamdani M. Interactions of viral pathogens on hospital admissions for pneumonia, croup and chronic obstructive pulmonary diseases: Results of a multivariate time‐series analysis. Epidemiology and Infection, 2006; 134:1174–1178. [DOI] [PMC free article] [PubMed] [Google Scholar]
- 6. Martinello RA, Esper F, Weibel C, Ferguson D, Landry ML, Kahn JS. Human metapneumovirus and exacerbations of chronic obstructive pulmonary disease. Journal of Infection, 2006; 53:248–254. [DOI] [PMC free article] [PubMed] [Google Scholar]
- 7. Wilkinson TMA, Hurst JR, Perera WR, Wilks M, Donaldon GC, Wedzicha JA. Effect of interactions between lower airway bacterial and rhinoviral infection in exacerbations of COPD. Chest, 2006; 129:317–324. [DOI] [PMC free article] [PubMed] [Google Scholar]
- 8. Wilkinson TMA, Donaldson GC, Johnston SL, Openshaw PJM, Wedzicha JA. Respiratory syncytial virus, airway inflammation, and FEV1 decline in patients with chronic obstructive pulmonary disease. American Journal of Respiratory and Critical Care Medicine, 2006; 173:871–876. [DOI] [PubMed] [Google Scholar]
- 9. Gorse GJ, O'Connor TZ, Young SL, Habib MP, Wittes J, Neuzil KM, Nichol KL. Impact of a winter respiratory virus season on patients with COPD and association with influenza vaccination. Chest, 2006; 130:1109–1116. [DOI] [PubMed] [Google Scholar]
- 10. Ko FWS, Ip M, Chan PKS, Fok JPC, Chan MCH, Ngai JC, Chan DPS, Hui DSC. A 1‐year prospective study of the infectious etiology in patients hospitalized with acute exacerbations of COPD. Chest, 2007; 131:44–52. [DOI] [PubMed] [Google Scholar]
- 11. Singh AM, Busse WW. Asthma exacerbations 2: Aetiology. Thorax, 2006; 61:809–816. [DOI] [PMC free article] [PubMed] [Google Scholar]
- 12. De Serres G, Lampron N, La Forge J, Rouleau I, Bourbeau J, Weiss K, Barret B, Boivin G. Importance of viral and bacterial infections in chronic obstructive pulmonary disease exacerbations. Journal of Clinical Virology, 2009; 46:129–133. [DOI] [PMC free article] [PubMed] [Google Scholar]
- 13. Nunn AJ, Gregg I. New regression equations for predicting peak expiratory flow in adults. British Medical Journal, 1989; 298:1068–1070. [DOI] [PMC free article] [PubMed] [Google Scholar]
- 14. Higgins BG, Brittion JR, Chinn S, Lai KK, Burney PGJ, Tattersfield AE. Factors affecting peak expiratory flow variability and bronchial reactivity in a random‐population sample. Thorax, 1993; 48:899–905. [DOI] [PMC free article] [PubMed] [Google Scholar]
- 15. Troyanov S, Ghezzo H, Cartier A, Malo JL. Comparison of circadian variations using FEV1 and peak expiratory flow‐rates among normal and asthmatic subjects. Thorax, 1994; 49:775–780. [DOI] [PMC free article] [PubMed] [Google Scholar]
- 16. Lewis SA, Weiss ST, Britton JR. Airway responsiveness and peak flow variability in the diagnosis of asthma for epidemiological studies. European Respiratory Journal, 2001; 18:921–927. [DOI] [PubMed] [Google Scholar]
- 17. Jindal SL, Aggarwal AN, Gupta D. Diurnal variability of peak expiratory flow. Journal of Asthma, 2002; 39:363–373. [DOI] [PubMed] [Google Scholar]
- 18. Mallia P, Johnston SL. How virus infections cause exacerbation of airway diseases. Chest, 2006; 130:1203–1210. [DOI] [PMC free article] [PubMed] [Google Scholar]
- 19. Varkey JB, Varkey B. Viral infections in patients with chronic obstructive pulmonary disease. Current Opinion in Pulmonary Medicine, 2008; 14:89–94. [DOI] [PubMed] [Google Scholar]
- 20. Busse WW. Role and contribution of viral respiratory‐infections to asthma. Allergy, 1989; 48:57–61. [DOI] [PubMed] [Google Scholar]
- 21. Cameron RJ, De Wit D, Welsh TN, Ferguson J, Grissell TV, Rye PJ. Virus infection in exacerbations of chronic obstructive pulmonary disease requiring ventilation. Intensive Care Medicine, 2006; 32:1022–1029. [DOI] [PMC free article] [PubMed] [Google Scholar]
- 22. Proud D, Chow CW. Role of viral infections in asthma and chronic obstructive pulmonary disease. American Journal of Respiratory Cell and Molecular Biology, 2006; 35:513–518. [DOI] [PubMed] [Google Scholar]
- 23. Papi A, Bellettato CM, Braccioni F, Romagnoli M, Casolari P, Caramori G, Fabbri LM, Johnston SL. Infections and airway inflammation in chronic obstructive pulmonary disease severe exacerbations. American Journal of Respiratory and Critical Care Medicine, 2006; 173:1114–1121. [DOI] [PubMed] [Google Scholar]
- 24. Donaldson GC, Seemungal TAR, Bhowmik A, Wedzicha JA. Relationship between exacerbation frequency and lung function decline in chronic obstructive pulmonary disease. Thorax, 2002; 57:847–852. [DOI] [PMC free article] [PubMed] [Google Scholar]
- 25. Fuhlbrigge AL, Weiss ST, Kuntz KM, Paltiel AD. Forced expiratory volume in 1 second percentage improves the classification of severity among children with asthma. Pediatric, 2006; 118:E347‐E355. [DOI] [PubMed] [Google Scholar]
- 26. Peng CK, Mietus J, Hausdorff JM, Havlin S, Stanley HE, Goldberger AL. Long range anti‐correlations and non‐Gaussian behavior of the heartbeat. Physical Review Letters, 1993; 70:1343–1346. [DOI] [PubMed] [Google Scholar]
- 27. Peng CK, Mietus JE, Liu YH, Lee C, Hausdorff JM, Stanley HE, Goldberger AL, Lipsitz LA. Quantifying fractal dynamics of human respiration: Age and gender effects. Annals of Biomedical Engineering, 2002; 30:683–692. [DOI] [PubMed] [Google Scholar]
- 28. Frey U, Brodbeck T, Majumdar A, Taylor DR, Town GI, Silverman M, Suki B. Risk of severe asthma episodes predicted from fluctuation analysis of airway function. Nature, 2005; 438:667–670. [DOI] [PubMed] [Google Scholar]
- 29. Frey U. Predicting asthma control and exacerbations: Chronic asthma as a complex dynamic model. Current Opinion in Allergy and Clinical Immunology, 2007; 7:223–230. [DOI] [PubMed] [Google Scholar]
- 30. Frey U, Suki B. Complexity of chronic asthma and chronic obstructive pulmonary disease: Implications for risk assessment, and disease progression and control. Lancet, 2008; 372:1088–1099. [DOI] [PMC free article] [PubMed] [Google Scholar]
- 31. Hayden FG, Fritz RS, Lobo MC, Alvord WG, Strober W, Straus SE. Local and systemic cytokine responses during experimental human influenza A virus infection—Relation to symptom formation and host defense. Journal of Clinical Investigation, 1998; 101:643–649. [DOI] [PMC free article] [PubMed] [Google Scholar]
- 32. Baccam P, Beauchemin C, Macken CA, Hayden FG, Perelson AS. Kinetics of influenza A virus infection in humans. Journal of Virology, 2006; 80:7590–7599. [DOI] [PMC free article] [PubMed] [Google Scholar]
- 33. Carrat F, Vergu E, Ferguson NM, Lemaitre M, Cauchemez S, Leach S, Valleron AJ. Time lines of infection and disease in human influenza: A review of volunteer challenge studies. American Journal of Epidemiology, 2008; 167:775–785. [DOI] [PubMed] [Google Scholar]
- 34. Toren K, Blanc PD. Asthma caused by occupational exposures is common—A systematic analysis of estimations of the population‐attributable fraction. BMC Pulmonary Medicine, 2009; 9:7. [DOI] [PMC free article] [PubMed] [Google Scholar]
- 35. Bernstein IL, Chan‐Yeung M, Malo JL, Bernstein DI. Asthma in the Work Place. New York : Marcel Dekker Press, 1993. [Google Scholar]
- 36. Kelly CA, Gibbson GJ. Relation between FEV1 and peak expiratory flow in patients with chronic air‐flow obstruction. Thorax, 1988; 43:335–336. [DOI] [PMC free article] [PubMed] [Google Scholar]
- 37. Malo JL, Cote J, Cartier A, Boulet LP, Larcheveque J, Chanyeung M. How many times per day should peak expiratory flow rates be assessed when investigating occupational asthma. Thorax, 1993; 48:1211–1217. [DOI] [PMC free article] [PubMed] [Google Scholar]
- 38. Peng CK, Havlin S, Hausdorff JM, Mietus JE, Stanley HE, Goldberger AL. Fractal mechanisms and heart rate dynamics—Long‐range correlations and their breakdown with disease. Journal of Electrocardiology, 1995; 28:59–65. [DOI] [PubMed] [Google Scholar]
- 39. Teeter JG, Bleecker ER. Relationship between airway obstruction and respiratory symptoms in adult asthmatics. Chest, 1998; 113:272–277. [DOI] [PubMed] [Google Scholar]
- 40. Berglund E, Birath G, Bjure J, Grimby G, Kjellman I, Sandquist I, Söderholm B. Spirometric studies of normal subjects. 1. Forced expirograms in subjects between 7 and 70 years of age. Acta Med Medica Scandinavica, 1963; 173:185–192. [PubMed] [Google Scholar]
- 41. Cotes JE, Chinn DJ, Miller MR. Lung Function: Physiology, Measurement and Application in Medicine, 6th ed Oxford , UK : Blackwell Press, 2006. [Google Scholar]
- 42. Leroyer C, Perfetti L, Trudeau C, L'Archevêque J, Chan‐Yeung M, Malo JL. Comparison of serial monitoring of peak expiratory flow and FEV1 in the diagnosis of occupational asthma. American Journal of Respiratory Critical Care Medicine, 1998; 158:827–832. [DOI] [PubMed] [Google Scholar]
- 43. Miller MR. Peak expiratory meter scale changes: Implications for patients and health professionals. Airways Journal, 2004; 2:80–82. [Google Scholar]
- 44. Goutelle S, Maurin M, Rougier F, Baarbaut X, Bourguignon L, Ducher M, Maire P. The Hill equation: A review of its capabilities in pharmacological modeling. Fundamental and Clinical Pharmacology, 2008; 22:633–648. [DOI] [PubMed] [Google Scholar]
- 45. Grazzini M, Ottanelli R, Duranti R, Stendardi L, Ronchi MC, Romagnoli I, Scano G. Measures of perception of bronchoconstriction and clinical and functional data are not interrelated in asthma. Respiration, 2002; 69:496–501. [DOI] [PubMed] [Google Scholar]
- 46. Mitra AD, Ogston S, Crighton A, Mukhopadhyay S. Lung function and asthma symptoms in children: Relationships and response to treatment. Acta Paediatrica, 2002; 91:789–792. [DOI] [PubMed] [Google Scholar]