

Abstract
The objective of this study was to link arsenic exposure and influenza A (H1N1) infection‐induced respiratory effects to assess the impact of arsenic‐contaminated drinking water on exacerbation risk of A (H1N1)‐associated lung function. The homogeneous Poisson process was used to approximate the related processes between arsenic exposure and influenza‐associated lung function exacerbation risk. We found that (i) estimated arsenic‐induced forced expiratory volume in 1 second (FEV1) reducing rates ranged from 0.116 to 0.179 mL/μg for age 15–85 years, (ii) estimated arsenic‐induced A (H1N1) viral load increasing rate was 0.5 mL/μg, (iii) estimated A (H1N1) virus‐induced FEV1 reducing rate was 0.10 mL/logTCID50, and (iv) the relationship between arsenic exposure and A (H1N1)‐associated respiratory symptoms scores (RSS) can be described by a Hill model. Here we showed that maximum RSS at day 2 postinfection for Taiwan, West Bengal (India), and the United States were estimated to be in the severe range of 0.83, 0.89, and 0.81, respectively, indicating that chronic arsenic exposure and A (H1N1) infection together are most likely to pose potential exacerbations risk of lung function, although a 50% probability of lung function exacerbations risk induced by arsenic and influenza infection was within the mild and moderate ranges of RSS at day 1 and 2 postinfection. We concluded that avoidance of drinking arsenic‐containing water could significantly reduce influenza respiratory illness and that need will become increasingly urgent as the novel H1N1 pandemic influenza virus infects people worldwide.
Keywords: Arsenic, influenza, lung function, probabilistic, respiratory, risk
1. INTRODUCTION
It has been recognized that tens of millions of people worldwide ingest excessive amounts of arsenic through drinking water and food.( 1 , 2 ) Previous epidemiological studies have indicated that ingested inorganic arsenic is strongly associated with a wide spectrum of adverse health outcomes, primary cancers (lung, bladder, kidney, and skin), and other chronic diseases such as dermal, cardiovascular, neurological, and diabetic effects.( 3 , 4 , 5 , 6 , 7 , 8 , 9 , 10 , 11 , 12 , 13 )
Guha Mazumder et al.,( 14 ) Milton et al. ( 15 ) Milton and Rahman,( 16 ) and Arain et al. ( 17 ) reported that long‐term ingestion of inorganic arsenic in drinking water could cause pulmonary effects manifested by cough, chest sounds in the lung, and shortness of breath in West Bengal (India), Bangladesh, and Pakistan. Von Ehrenstein et al. ( 18 ) further indicated that people consuming high levels of arsenic in drinking water may lead to increased risks of chronic obstructive pulmonary disease (COPD) in an arsenic‐exposed region in West Bengal (India). Smith et al. ( 19 ) reported that children may be particularly susceptible to the respiratory effects due to consuming high levels of arsenic in drinking water in a region of northern Chile.
De et al. ( 20 ) reported that chronic arsenic poisoning from drinking arsenic‐contaminated water was associated with pulmonary diseases in West Bengal (India), indicating that lung functions measured as forced expiratory volume in 1 second (FEV1), forced vital capacity (FVC), and peak expiratory flow rate (PEFR) were averagely reduced 16.73%, 9.58%, and 19.91%, respectively, compared to controls. Von Ehrenstein et al. ( 18 ) reported that consumption of arsenic‐contaminated water was associated with a high risk (odds ratios (ORs): 2.8–3.8) of respiratory symptoms and reduced FEV1 and FVC based on a population‐based investigation. Emerging evidence showed that long‐term ingestion of inorganic arsenic may also lead to nonmalignant respiratory effects, implicating a strong inverse association between urinary arsenic and predictive FEV1, FVC, and FEV1/FVC.( 21 )
Influenza epidemics pose a serious threat on morbidity and mortality on a global scale, with nearly 3–5 million cases of severe illness and a quarter to one‐half a million deaths annually worldwide.( 22 ) A number of influenza‐related treats, showing evidence of seasonality, to both elderly and children in tropical and subtropical regions were identified.( 23 , 24 , 25 , 26 ) The recent outbreak of novel swine‐origin H1N1 influenza first emerged in Mexico in April 2009 and then spread worldwide, resulting in more than 130,000 laboratory‐confirmed cases and 800 deaths in over 100 countries by mid‐July of 2009.( 27 ) The WHO reported that many areas around the world utilize drinking water supplies with arsenic levels in excess of 10 μg/L, including the United States, Mexico, and Southeast Asia.( 28 ) Many geographic areas with confirmed human cases of avian flu or H1N1 include populations that also have elevated arsenic exposures. Therefore, it implies that arsenic exposures may exacerbate health outcomes related to influenza infections.
Recent studies have demonstrated that bronchial asthma and COPD are the major chronic respiratory diseases causing morbidity and mortality among children and elderly worldwide.( 29 ) Kondo and Abe( 30 ) indicated that influenza‐induced asthma may continuously deteriorate during the first 2 days of illness and may require at least 7 days to recover. Murphy et al. ( 31 ) reported that influenza in patients with asthma can cause acute exacerbations, whereas in patients with COPD can lead to respiratory distress. Upshur et al. ( 32 ) and Martinello et al. ( 33 ) found that exacerbations of COPD are influenced by influenza. Gorse et al. ( 34 ) found that laboratory‐documented influenza‐caused illness was associated significantly with worsening in FEV1. Ko et al. ( 35 ) reported that the most prevalent viruses detected during acute exacerbations of COPD in Hong Kong were the influenza A viruses and coronavirus. They indicated that among 196 patients with mean age of 76 years, mean FEV1 was 40% of predicted normal and FEV1/FVC ratio was 58%.
Recently, Kozul et al. ( 36 ) reported that environmentally relevant levels of arsenic (100 μg/L) had a significant impact on the immune system in laboratory animals, resulting in a severe influenza A infection and increased morbidity. Kozul et al. ( 36 ) revealed that mice ingesting arsenic in their drinking water on a daily basis at levels of 100 μg/L were initially unable to initiate a strong immune response to A (H1N1) influenza virus. They found that the arsenic‐exposed mice exhibited a significant 10‐fold increase in viral loads (measured as 50% tissue culture infective dose (TCID50)/mL)) compared with normal ones at day 7 postinfection. Therefore, it appears that arsenic exposure leads to increased susceptibility and severity of respiratory influenza A (H1N1) infection.
The mechanistic links between chronic arsenic exposure and exacerbations of influenza infection, however, are still nebulous and lead us to look for more general principles that might relate arsenic and A (H1N1)‐associated lung function exacerbations risk. Unlike the aforementioned epidemiological approaches, here we examined the linkage between exacerbations risk of respiratory influenza infections and chronic arsenic exposure from a risk‐based mechanistic point of view. The current available data, however, do not provide detailed information of the association between arsenic exposure and influenza infection. The resulting uncertainty in arsenic‐associated influenza infections thus poses a fundamental challenge to quantifying and modeling the linkage of arsenic and influenza. Researchers commonly account for uncertainty or lack of information through stochastic models. In this study, we addressed this challenge using the well‐established statistics methods.
2. MATERIALS AND METHODS
2.1. Arsenic‐Associated Respiratory Symptoms Epidemiological Data
Epidemiological data on the arsenic‐associated respiratory symptoms are limited and scarce. A remarkable data set covering arsenic epidemiology of gender‐specific and age‐adjusted prevalence of arsenic‐related respiratory symptoms in West Bengal (India) gave us the opportunity to test all theoretical considerations of arsenic exposure effects and quantify its strength.( 14 )
The study by Guha Mazumder( 14 ) is the first large population‐based study with individual exposure data, providing critical information to characterize arsenic exposure‐respiratory effect relationships. The data set was reanalyzed based on the cross‐sectional survey conducted between April 1995 and March 1996 to reconstruct quantitatively the pooled arsenic epidemiological data of gender‐ and age‐specific cumulative prevalence ratios. Water arsenic levels were obtained from 7,683 of the participants (4,093 females and 3,590 males). The 6,864 participants with nonsmokers (4,042 females and 2,822 males) were used to comprise the study populations for consideration of respiratory signs and symptoms (n= 6,864).
Guha Mazumder and co‐workers( 14 ) used a standardized questionnaire to collect information, including sources of drinking water and sociodemographic characteristics. A physician interviewer also was involved in the investigation concerning the presence of respiratory problems. The outcomes analyzed included participant‐reported cough, shortness of breath, and weakness, and the presence of chest sounds recorded by the examining physician. Each outcome was examined based on arsenic levels in the tubewell drinking water source used by each participant. The tubewells were categorized based on arsenic concentrations of <50, 50–199, 200–499, 500–799, and ≥800 μg/L. The age groups of the participants in the survey ranged from ≤ 9, 10–19, 20–29, 30–39, 40–49, 50–59, and ≥ 60 years.
Guha Mazumder et al. ( 14 ) indicated that among both males and females, the prevalence of cough, shortness of breath, and chest sound (crepitations and/or rhonchi) in the lungs rose with increasing arsenic concentrations in drinking water. Their study thus provided evidence that ingestion of inorganic arsenic in drinking water was associated strongly with pulmonary effects manifested by cough, chest sounds in the lungs, and shortness of breath, revealing that the prevalence of each outcome rose with increasing arsenic concentrations in the primary drinking water sources.
2.2. Influenza‐Associated Lung Function Data
Two valuable data sets provided by Kondo and Abe( 30 ) and Hayden et al. ( 37 ) gave us the unique opportunity to examine the linkage between experimental human influenza and the effects of influenza virus infections on FEV1 decreasing in chronic respiratory diseases individuals.
To investigate the essential time course of bronchial caliber day by day in uncomplicated influenza infection, Kondo and Abe( 30 ) examined FEV1 values from 5 days before to 10 days after the onset of illness in asthmatic children aged 8 to 12 years with tolerable respiratory symptoms. In their study, influenza infection was defined as nasal stuffiness, cough, sore throat, huskiness, throat injection, and headache with fever of >38 °C for at least 2 days during an influenza epidemic. Kondo and Abe( 30 ) found an insignificant difference in the time course of FEV1 of acute stage between influenza A and B infections, showing that 15 of 20 patients had a decrease in FEV1 more than 20% from baseline during acute stage. Kondo and Abe( 30 ) indicated that there were no significant differences in the time‐course of FEV1 after different types of influenza infection. Therefore, the data of influenza A and B were used to represent influenza A (H1N1) infection. Meanwhile, previous studies ( 36 , 37 ) showed that only influenza A (H1N1) data were available. Here, we focused only on the infection due to influenza A (H1N1) virus.
Hayden et al. ( 37 ) used 19 volunteers experimentally infected with influenza A (H1N1) to investigate the cytokine response in symptom formation and host defenses in influenza infection. The inoculum ranged nearly 105 TCID50/mL and daily nasal washing were collected. A four‐point (0–3 corresponding to absent to severe) symptom assessment was used on a twice‐daily basis. In their study, upper respiratory symptoms most frequently appeared as nasal stuffiness, runny nose, sore throat, sneezing, and earache/pressure, whereas lower respiratory symptoms of cough, breathing difficulty, hoarseness, and chest discomfort were most frequent. Generally, proportions of volunteers who developed clinical illness of upper and lower respiratory symptoms after experimental influenza virus infection were estimated to be 79% and 32%, respectively.
Table I summarizes the used daily viral shedding and respiratory symptoms scores (RSS) data obtained from experimental influenza virus infection together with measured decrease in FEV1 after onset of influenza in asthmatics.
Table I.
Experimental Influenza A Infection Data and Time Course of Mean Decrease in FEV1 Values After Onset of Influenza
| Days Postinfection | Viral Load a (logTCID50/mL) | Respiratory Symptoms Scoresb (−) | Decrease in FEV1 c (%) |
|---|---|---|---|
| 0 | 0 | 0.11 | 7.7 ± 6.6 |
| 1 | 1.88 ± 0.38 | 0.21 | 18.4 ± 10.7 |
| 2 | 3.75 ± 0.53 | 0.57 | 28.9 ± 10.3 |
| 3 | 3.23 ± 0.37 | 0.54 | 26.4 ± 10.3 |
| 4 | 2.6 ± 0.45 | 0.48 | 12.0 ± 6.1 |
| 5 | 2.49 ± 0.36 | 0.34 | 22.5 ± 13.1 |
| 6 | 1.33 ± 0.32 | 0.22 | 18.3 ± 11.8 |
| 7 | 0.82 ± 0.39 | 0.15 | 13.3 ± 12.3 |
| 8 | 0.16 ± 0.11 | 0.11 | 10.9 ± 15.5 |
aData (mean ± standard error) were adopted from Hayden et al. ( 37 )
bData were estimated and normalized based on Hayden et al. ( 37 ) corresponding to mean score for upper and lower respiratory symptoms. A score of 1 corresponds to the maximum reported score value.
cData (mean ± standard deviation) were adopted from Kondo and Abe.( 30 )
2.3. Weibull Prevalence Model
A Weibull probability density function (pdf) was used to account for gender‐ and age‐specific cumulative prevalence ratio of respiratory symptoms for human long‐term exposure to low doses of arsenic in drinking water:
| (1) |
with
| (2) |
where g(t, ɛ (C)) represents the prevalence ratio of respiratory effects for humans exposed to arsenic concentration C (μg/L) at age t (years), ɛ (C) is the concentration‐dependent shape parameter, and k 0, k 1, k 2, and k 3 are the Weibull best‐fitted parameters. The age‐specific cumulative prevalence ratio of arsenic‐related respiratory effects can then be obtained by integral of Equation (1) as:
 |
(3) |
2.4. Arsenic‐Induced FEV1 Reducing Rate
Von Ehrenstein et al. ( 18 ) first investigated the effects of arsenic in drinking water on lung function based on a population aspect, indicating a strong association between reductions of FEV1, FVC, and forced expiratory flow between 25% and 75% of forced vital capacity (FEF25‐75) and long‐term consumption of contaminated drinking water in men. They reported that in men, a 100 μg/L increase in arsenic level was associated with a 45.0 mL decrease (95% CI: 6.2–83.9) in FEV1 (p= 0.02) and a 41.4 mL decrease (95% CI: −0.7 to 83.5) in FVC (p= 0.054).
Here we assumed that the arsenic‐associated lung function (measured as FEV1) reducing patterns within each segment of a 100 μg/L arsenic level were stationary. We can then model the behavior within each 100 μg/L arsenic level with standard techniques. As a first approximation, one might expect that FEV1 reduction at a constant rate μ and that the segment of 100 μg/L arsenic level at which every FEV1 is reduced are independent of each other. Such a point process is one of the simplest stochastic models and is referred to as a homogeneous Poisson process,( 38 ) which gives rise to an exponential C distribution at age t as:
| (4) |
where FEV1(t, C) is the age t‐specific arsenic concentration C‐related FEV1 (L), AUC(t) is the parameter representing area‐under‐the‐curve of FEV1–C profile (L/μgL), and μ(t) is the arsenic‐associated FEV1 reducing rate (L/μg). To convert the individual to the population‐based arsenic‐related lung function change, FEV1(t, C) in the absence of arsenic exposure has a form involving a cumulative Weibull prevalence function (Equation (3)) as:
 |
(5) |
where FEV1(t,0) is the FEV1 in the absence of arsenic at age t (L), FEV1,N(t,0) is the normal FEV1 in the absence of arsenic at age t (L), Δf(t,0) is the FEV1 difference compared to normal FEV1, P(t,0) is the cumulative prevalence ratio of respiratory effects in the absence of arsenic exposure. The conversion of the percent predicted FEV1 into age‐specific FEV1 could be obtained from serial reference equations (see the Appendix). In our study, the age‐associated FEV1 were divided into three age groups of 16–25, 25–65, and 65–85 years old.
2.5. Arsenic‐Induced Pulmonary Influenza Virus Load Increasing Rate
Kozul et al. ( 36 ) investigated the effects of arsenic exposure on respiratory influenza A (H1N1) virus infection. They used a mice model exposed to 100 μg/L sodium arsenite in drinking water for 5 weeks followed by intranasal inoculation with a sublethal dose of influenza A/PuertoRico/8/34 (H1N1) virus. Kozul et al. ( 36 ) found that the arsenic‐exposed mice exhibited a significant 10‐fold increase in viral loads at day 7 postinfection compared to arsenic‐unexposed controls. A homogeneous Poisson model can also be used to describe the arsenic‐associated influenza A (H1N1) virus loads increasing process within each 100 μg/L arsenic level:
| (6) |
where V(C) is the arsenic concentration C‐associated viral load (logTCID50/mL), AUCV is the parameter representing area‐under‐the‐curve of V–C profile (μg/L logTCID50/mL), and μV is the arsenic‐associated A (H1N1) virus loads increasing rate (L/μg). Here an adjusted factor of 10 adopted from USEPA( 39 ) was used for taking into account the interspecies transfer from animals to humans.
2.6. Dose‐Response Relationships Among Arsenic, Lung Function, and A (H1N1)
To link the associations between FEV1 and A (H1N1)‐associated RSS, the published experimental human influenza data of viral load dynamics and FEV1 reducing rate varied with days postinfection have to be investigated. The age‐group‐specific relationship between FEV1 and A (H1N1) viral load can be constructed followed by a homogeneous Poisson process in the absence of arsenic exposure based on the established relations of viral load and FEV1 as:
| (7) |
where FEV1(V, 0) is the viral‐load‐induced FEV1 (L), AUCL is the parameter representing area‐under‐the‐curve of FEV1–V profile (L logTCID50/mL), and μL is the viral‐load‐induced FEV1 reducing rate (mL logTCID50/mL).
Here % FEV1(V, 0) was converted appropriately to RSS(V, 0) based on the published data to represent A(H1N1) virus‐induced lung function exacerbations. In this study, a biologically‐based empirical 4‐parameter Hill equation was used to reconstruct the dose‐response profile describing the relationships between A (H1N1)‐associated RSS and A (H1N1) viral load:
 |
(8) |
where RSS(V, 0) is the RSS response caused by viral load in the absence of arsenic, y min and y max are the minimum and maximum responses of RSS, V50 is the viral load at 50% response of RSS, and n is the Hill coefficient.
By incorporating Equation (6) into Equation (8), a three‐dimensional Hill‐based dose‐response model describing the relationships between arsenic‐exposure‐associated lung function and A (H1N1) virus infection can be constructed:
 |
(9) |
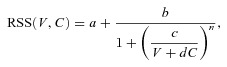
where RSS(V, C) is the arsenic exposure C‐associated RSS response varied with A (H1N1) viral load V (logTCID50/mL), a, b, c, and d are the fitted parameters, and n is the Hill coefficient.
2.7. Probabilistic Risk Model
Risk characterization is the phase of risk assessment where the results of arsenic‐associated A (H1N1) virus infections (measured as RSS) and quantitative effect assessments are integrated to provide risk estimates resulted from chronic arsenic exposure and days postinfection‐dependent viral loads. The risk at specific arsenic‐associated RSS can be calculated as pdfs of arsenic exposure concentration (P(C)) and viral load (P(V)) multiplied by conditional probability of P(RSS (V, C)|V;C). Therefore, a joint probability function (JPF) can be used to calculate the risk probability and can be expressed as:
| (10) |
where P(R RSS(V,C)) represents the risk estimate of arsenic‐exposure‐associated influenza A (H1N1) virus infection at a day‐postinfection‐specific viral load V and an arsenic concentration C.
Optimal statistical models were selected on the basis of least squared criterion from a set of generalized linear and nonlinear autoregression models provided by TableCurve 2D and 3D packages (AISN Software Inc., Mapleton, OR, USA) fitted to the study data. A value of p < 0.05 was judged significant. To quantify the uncertainty and its impact on the estimation of expected risk, a Monte Carlo (MC) technique was implemented. A MC simulation was also performed with 10,000 iterations to generate 2.5 and 97.5 percentiles as the 95% CI for all fitted models. The Crystal Ball® software (Version 2000.2, Decisioneering, Inc., Denver, CO, USA) was employed to implement MC simulation. Furthermore, five representative regions of Taiwan, West Bengal, the United States, Mexico, and Brazil were selected and compared. The first two regions (Taiwan and West Bengal) had been found with high arsenic concentrations in drinking water, whereas the United States and Mexico had the first two laboratory confirmed pandemic H1N1 cases according to WHO.( 27 ) We also selected a relative representative region with low arsenic concentration in Brazil (Southern America) for comparison.
3. RESULTS
3.1. Fitting Weibull Model to Arsenic‐Associated Respiratory Effects Data
Table II shows the best fitted parameters k 0, k 1, k 2, and k 3 in the Weibull dose‐response model obtained by fitting Equation (3) to gender‐ and respiratory‐symptom‐specific cumulative prevalence ratios for the arsenic‐associated respiratory effects in West Bengal (India). The results indicated that the Weibull model could well describe the association between arsenic exposure from drinking water and the prevalence of respiratory effects (r 2= 0.71 − 0.93 for female, r 2= 0.78 − 0.89 for male) (Table II).
Table II.
Gender‐ and Respiratory‐Symptom‐Specific Best Fitted Parameters (Mean with 95% CI) in Weibull Dose‐Response Function
| Respiratory Symptom | Best Fitted Parametersa | ||||
|---|---|---|---|---|---|
| k0 | k1 | k2 | k3 | r 2 | |
| Femaleb | |||||
| Cough | 5.70 × 10⁻⁷ | 1.38 | 3.18 × 10⁻³ | 0.40 | 0.82 |
| (−2.25 to 3.38 × 10⁻⁶) | (0.68 to 2.09) | (0.001 to 0.005) | (0.25 to 0.55) | ||
| Chest sounds | 1.63 × 10⁻⁶ | 1.00 | 1.15 × 10⁻³ | 0.68 | 0.71 |
| (−9.83 to 13.08 × 10⁻⁶) | (0.01 to 1.99) | (−4 × 10⁻⁵ to −0.002) | (0.44 to 0.92) | ||
| Shortness of breath | 2.81 × 10⁻³ | 0.26 | −6.09 × 10⁻³ | 0.59 | 0.93 |
| (−0.008 to 0.013) | (−0.16 to 0.67) | (−0.02 to 0.01) | (−0.39 to 0.79) | ||
| Weakness | 1.02 × 10⁻⁵ | 1.00 | 1.34 × 10⁻³ | 0.59 | 0.93 |
| (−1.44 to 3.48 × 10⁻⁵) | (0.66 to 1.33) | (6 × 10⁻⁵ to 0.003) | (0.46 to 0.73) | ||
| Maleb | |||||
| Cough | 7.77 × 10⁻¹² | 3.13 | 7.26 × 10⁻³ | 0.40 | 0.89 |
| (−6.14 to 7.69 × 10⁻¹¹) | (1.84 to 4.41) | (0.003 to 0.011) | (0.26 to 0.53) | ||
| Chest sounds | 2.02 × 10⁻³ | 0.12 | −1.64 × 10⁻³ | 0.70 | 0.78 |
| (−0.02 to 0.02) | (−0.55 to 0.79) | (−0.02 to 0.02) | (0.49 to 0.91) | ||
| Shortness of breath | 3.17 × 10⁻³ | 0.10 | −3.75 × 10⁻³ | 0.80 | 0.89 |
| (−0.03 to 0.04) | (−0.61 to 0.82) | (−0.04 to 0.03) | (0.54 to 1.05) | ||
| Weakness | 7.50 × 10⁻⁸ | 1.66 | 1.62 × 10⁻³ | 0.56 | 0.83 |
| (−3.50 to 5.00 × 10⁻⁷) | (0.86 to 2.47) | (−5 × 10⁻⁶ to 0.003) | (0.34 to 0.78) | ||
aWeibull dose‐response function:  .
.
bData were adopted from Guha Mazumder et al. ( 14 )
Specifically, arsenic exposure had higher influence than age in cough (k 1= 1.38, k 3= 0.40), chest sounds (k 1= 1.00, k 3= 0.68), and weakness (k 1= 1.00, k 3= 0.59) for females and in cough (k 1= 3.13, k 3= 0.40) and weakness (k 1= 1.66, k 3= 0.56) for males (Table II). The results also revealed that cough had maximum k 1 values of 1.38 and 3.13 with relative higher r 2 values of 0.82 and 0.89, respectively, for females and males, indicating that arsenic exposure has stronger association with cough than other respiratory outcomes for both genders.
3.2. Arsenic‐Induced FEV1 and Influenza Viral Load Changing Rates
Our results indicated that the homogeneous Poisson process well described the arsenic‐induced FEV1 reducing process for three age groups of 15–25, 25–65, and 65–85 years (r 2= 0.99) (Figs. 1(A)–(C)). The resulting arsenic‐induced FEV1 reducing rates were estimated to be 0.116, 0.139, and 0.179 mL/μg for age 15–25, 25–65, and 65–85 years and increased with increasing of age (Fig. 1(D)). However, the fitted AUC parameters decreased with increasing of age (Fig. 1(D)).
Figure 1.

Homogeneous Poisson process describing the reduction of FEV1 in (A) 15‐ to 25‐year, (B) 25‐ to 65‐year, and (C) 65‐ to 85‐year‐old age groups exposed to arsenic. (D) Relationships showing age‐related constant and FEV1 reducing rate varied with age groups.
Here we adjusted the original data from Kozul et al. ( 36 ) by interspecies adjusted factor of 10 along with the experimental human infections data from Hayden et al.,( 37 ) von Ehrenstein et al.,( 18 ) and Kondo and Abe.( 30 ) The resulting arsenic‐induced influenza A (H1N1) viral load increasing behavior also followed a homogeneous Poisson process with an estimated increasing rate of 0.5 mL/μgwith a fitted AUC constant of 3,003.02 logTCID50/mL μg/L (r 2= 0.94) (Fig. 2).
Figure 2.

Homogeneous Poisson process describing the viral load increased with increasing As exposure. Data with diamond represent the estimates based on Kozul et al. ( 36 ) with interspecies adjust factor of 10, whereas data with square represent the estimates from experimental data combining Hayden et al.,( 37 ) Kondo and Abe,( 30 ) and von Ehrenstein et al. ( 18 )
3.3. Dose‐Response Relationships
To construct the relationship of A (H1N1) virus‐induced lung function change, we began by combining the FEV1 and viral shedding dynamics data in the experimental human influenza infections (Figs. 3(A), (B)). Fig. 3(A) indicates that the % predicted FEV1 reducing process at days 0, 1, and 2 postinfection can be well described by the homogeneous Poisson model with an estimated reducing rate of 0.19/day with a fitted AUC parameter of 476.75%/day (r 2= 0.70). Here a homogeneous Poisson process was also used to construct the FEV1–A (H1N1) viral load relations, resulting in an estimated A (H1N1) virus‐induced FEV1 reducing rate of 0.10 mL/logTCID50 for three age groups (r 2= 0.99)(Fig. 3(C)).
Figure 3.

(A) Homogeneous Poisson process describing the reduction of % predicted FEV1 varied with days postinfection. (B) Viral load varied with days postinfection based on Hayden et al. ( 37 ) (C) Homogeneous Poisson process describing the relationships between the decline of FEV1 and viral load varied with age groups of 15–25 years, 25–65 years, and 65–85 years old, respectively. (D) Hill‐based model showing the relationship between respiratory symptoms scores and % predicted FEV1.
Based on the experimental influenza A infection data along with % decrease in FEV1 values for influenza virus infections in patients with respiratory symptoms (Table I; Fig. 3(A)), the RSS % predicted FEV1 profile can be constructed. The result indicated that a best fitted Hill model of y=a/(1 + (x/b)c) +d described adequately the relationship between respiratory symptoms scores and % predicted FEV1with fitted parameter values of a= 0.90, b= 73.24%, c= 13.73, and d= 0.06 (r 2= 0.99, p < 0.001) (Fig. 3(D)).
Given the fitted A (H1N1) virus‐induced FEV1 reduction process along with the respiratory symptoms scores and decrease in % FEV1 relationships (Fig. 3(C), (D)), we can construct a respiratory symptoms scores–viral load profile that explains the observed relations. Here a Hill model y=a/(1 + (b/x)c) +d also well describes the relationships between respiratory symptoms scores and viral load (a= 0.89, b= 3.49 logTCID50/mL, c= 2.45, and d= 0.11, r 2= 0.95, p < 0.001) (Fig. 4(A)).
Figure 4.

(A) Hill‐based model describing the dose‐response relationship between observed respiratory symptoms scores and viral loads. (B) Relationships between predicted respiratory symptoms scores response and viral load varied with arsenic (As) exposures ranging from 0 to 3500 μg/L based on the fitted model in (A).
We linked fitted arsenic–viral load relationship (Fig. 2) with Hill‐based viral load–RSS relationship (Fig. 4(A)) to construct an arsenic concentration‐specific dose‐response model describing the relationships among chronic arsenic exposure, A (H1N1) viral load, and RSS (Fig. 4(B)). Fig. 4(B) indicates that a 500 μg/L increase in arsenic level was associated with a 1 logTCID50/mL increase in viral load. Fig. 5(A) demonstrates the response surface that highlights the relationships of arsenic concentration (C) and viral‐load (V)‐associated respiratory symptoms scores (RSS(V, C)), as a Hill model of RSS (V, C) = 0.11 + 0.89/(1 + (3.49/(V+ 0.002C))2.45).
Figure 5.

(A) Response surface depicting respiratory symptom scores as a function of As exposure concentration and viral load doses. (B) Contour plot showing the severity of respiratory symptoms scores (RSS) in an arsenic exposure–viral load regime delineating RSS < 0.40 as mild, 0.40 < RSS < 0.70 as moderate, and RSS > 0.70 as severe conditions.
A useful classification scheme was proposed for RSS on an arsenic concentration–viral load regime, delineating three regions spanning the range from mild (RSS = 0.1–0.4), moderate (RSS = 0.4–0.7), to severe (RSS = 0.7–1.0) symptoms (Fig. 5(B)).
3.4. Exacerbations Risk Estimates
Fig. 6 shows the synoptic predicted risk profiles for five representative regions of Taiwan, West Bengal (India), the United States, Mexico, and Brazil. The published data on arsenic concentrations in drinking water( 40 ) and published viral loads at day 0, 1, and 2 postinfection( 37 ) were adopted to generate the probability distributions. The probabilities of day‐postinfection‐dependent lung function exacerbations risk based on the estimated dose‐response profile (Fig. 5(A)) can then be estimated (Fig. 6). Here we used the difference between maximum and minimum RSS (ΔRSS = RSSmax−RSSmin) to indicate the potential exacerbations risk of lung function induced by chronic arsenic exposure and A (H1N1) infection (Table III). It is not surprising that the regions of Taiwan, West Bengal (India), and the United States subjected to relatively higher arsenic levels in drinking water had larger changes in RSS at day 2 after infection compared with Brazil and Mexico. Meanwhile, RSS values in West Bengal and the United States ranged from 0.21 to 0.29 compared with Brazil and Mexico, which had less change in RSS of 0.07 and 0.12, respectively (Table III).
Figure 6.
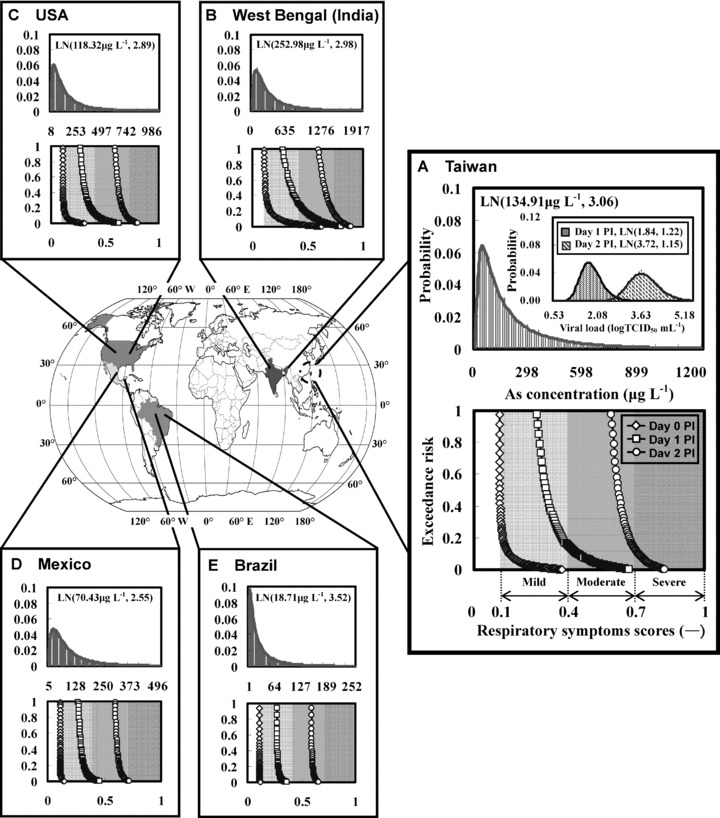
Predicted risk profiles in the major arsenic‐contaminated countries of (A) Taiwan, (B) West Bengal (India), (C) the United States, (D) Mexico, and (E) Brazil subject to estimated arsenic concentration distribution in drinking water and viral load distribution at days 0, 1, and 2 postinfection (PI). LN(a, b) represents lognormal distribution with geometric mean a and geometric standard deviation b.
Table III.
Estimated Respiratory Symptoms Scores at Days 0, 1, and 2 Postinfection (PI) of Influenza A (H1N1) for Selected Regions with Estimated Arsenic Exposure Distributions
| Arsenic Concentration (μg/L) | Respiratory Symptoms Scores (−) | ||
|---|---|---|---|
| Day 0 PI | Day 1 PI | Day 2 PI | |
| Taiwan | |||
| LN(134.91, 3.06)a | 0.27b | 0.41 | 0.23 |
| (0.11–0.38)c | (0.27–0.68) | (0.60–0.83) | |
| West Bengal, India | |||
| LN(252.98, 2.98) | 0.52 | 0.53 | 0.29 |
| (0.11–0.63) | (0.28–0.81) | (0.60–0.89) | |
| USA | |||
| LN(118.32, 2.89) | 0.20 | 0.36 | 0.21 |
| (0.11–0.31) | (0.27–0.63) | (0.60–0.81) | |
| Mexico | |||
| LN(70.43, 2.55) | 0.04 | 0.19 | 0.12 |
| (0.11–0.15) | (0.27–0.46) | (0.60–0.72) | |
| Brazil | |||
| LN(18.71, 3.52) | 0.01 | 0.09 | 0.07 |
| (0.11–0.12) | (0.27–0.36) | (0.59–0.66) | |
aLN(a, b) represents lognormal distribution with geometric mean a and geometric standard deviation b. Data were adopted from Nordstrom.( 40 )
bΔRSS = RSSmax− RSSmin.
cMin–max.
On the other hand, the maximum RSS at day 2 postinfection in Taiwan, West Bengal (India), and the United States were estimated to be 0.83, 0.89, and 0.81, respectively, which all fell within the severe RSS range, indicating that chronic arsenic exposure and A (H1N1) infection together could pose significant exacerbations risk of lung function in those regions. It is noted, however, that the probabilities that 50% or more of the lung function exacerbations risks induced by arsenic and influenza infection were all within the mild and moderate ranges of RSS at day 1 (RSS = 0.27–0.36) and 2 (RSS = 0.59–0.66) postinfection, respectively, giving a representative RSS range estimates (Fig. 6).
4. DISCUSSION
Although chronic arsenic exposure could significantly contribute to the decrements in lung function,( 18 , 20 , 21 , 41 ) quantitative analyses of influenza A (H1N1) susceptibility linked to common levels of arsenic exposure to associate to the respiratory effects have not been fully explored. Fortunately, Kozul et al. ( 36 ) have recently reported that common arsenic exposure levels could inhibit influenza‐fighting ability against A (H1N1), revealing that arsenic in contaminated water increases susceptibility to influenza A (H1N1). This information inspired us to study arsenic‐influenza interactions that exacerbate influenza respiratory infections based on the quantitative models. Our results highlighted the significance of their joint effects in estimating the exacerbations risk of lung function.
This study provided the quantitative analysis by linking the prevalence of arsenic‐associated respiratory effects to variations in arsenic‐induced lung function and influenza viral loads. A dose‐response relationship that revealed the influenza RSS as the function of arsenic exposure concentration and viral loads was derived. This relationship was used to build projections of the potential effect of chronic arsenic exposure on future lung function exacerbations risk. Substantial increases in exacerbations risk of A (H1N1)‐associated lung function when people exposed to elevated arsenic levels in drinking water were found.
To explore the direct role of chronic arsenic exposure in explaining the prevalence of respiratory effects and associated infection risk of A (H1N1), one simple stochastic model called the homogeneous Poisson process was used to approximate the related processes between arsenic exposure and influenza‐associated lung function exacerbations risk. The most important statistical property in homogeneous Poisson processes( 38 ) in relation to arsenic‐induced lung function decrement is the arsenic concentration between consecutive events, the interevent concentration C follows an exponential distribution p(C) =μ exp (−μC) in which independent events occur at a constant rate μ.
In this study, we found that (i) cough is the most common symptom for arsenic‐associated influenza respiratory outcomes, (ii) estimated arsenic‐induced FEV1 reducing rates were 0.116, 0.139, and 0.179 mL/μg for age 15–25, 25–65, and 65–85 years, (iii) estimated arsenic‐induced A (H1N1) viral load increasing rate was 0.5 mL/μg, (iv) estimated A (H1N1) virus‐induced FEV1 reducing rate was 0.10 mL/logTCID50, and (v) the relationships of arsenic concentration and A (H1N1) virus associated RSS can be described by a Hill model.
This study has limitations on data use and links to reality. Combined with accumulating evidence on the potentially adverse effects of chronic arsenic exposure on human health( 41 ) together with arsenic exposures exacerbated health outcomes related to A (H1N1) infections,( 36 ) such findings have encouraged claims that being chronically exposed to arsenic will worsen health outcomes in already arsenic‐enriched regions. Despite a growing research effort, however, quantitative linkage between chronic arsenic exposure and influenza infection remains uncertain. A crucial component of this study is the use of data from earlier studies to estimate parameters or fit model projections to the experimental human infection curves.
Yet because our study cannot definitively rule out other plausible contributing factors, for instance, arsenic‐associated skin lesions and tobacco smoking,( 17 , 18 , 21 ) further elucidating the relative contributions of these factors remains a critical area for future research. Nevertheless, the robustness of the present derived quantitative relationships among arsenic, lung function, and A (H1N1) virus capture the direct role of chronic arsenic exposure in shaping exacerbations of lung function. When combined with projections of exacerbations risk profiles and arsenic exposure scenarios, this arsenic exposure effect provides a coherent and alarming picture of increase in A (H1N1)‐associated respiratory symptoms under chronic arsenic exposure through arsenic‐contaminated drinking water consumption. This result should be viewed with some cautions, however, because skin lesions and smoking variables are clearly endogenous to exacerbations of lung function.
Many studies( 14 , 17 , 18 , 21 ) indicated that skin lesions and tobacco smoking might be affecting factors to arsenic‐induced lung function decrement. So far we still do not fully understand the underlying mechanisms of how the other infectious respiratory diseases (like tuberculosis) affect the lung functions. Therefore, we recommended that the future research could focus on more evaluations of the interaction of arsenic with other interference factors or infectious respiratory diseases (like tuberculosis) commonly found in the arsenic prevalence areas. Looking forward, it is a vital health need to identify environmental risk factors that exacerbate influenza and possibly other respiratory infections, helping to minimize the impact of potential pandemic outbreaks in the future. It is thus needed to conduct more studies to determine the causal relationships of virus‐chemical interactions in water and human disease and to assess the role of other waterborne chemical carcinogens related to infectious diseases manifestation.( 42 , 43 , 44 ) Our findings suggested that avoidance of drinking arsenic‐containing water could reduce influenza respiratory illness and that need will become increasingly urgent as the novel H1N1 pandemic influenza virus infects people worldwide.( 45 , 46 )
In the present study, data gaps are the limitation of the model. The major assumption was that RSS estimates were strongly associated with FEV1 decrements, viral loads, and arsenic exposure levels. The epidemiological data used in this study only considered arsenic‐contaminated drinking‐water‐associated respiratory effects. However, people exposed to arsenic contaminations were also related to ingestion, inhalation, and dermal contact pathways. The prediction might be underestimated in the present study. Furthermore, the different ethnic group, socioeconomic status, and food habits might be the plausible factors for RSS and arsenic accumulation capacities. Based on our model findings, the area‐specific RSS could be predicted. Therefore, area‐based disease impacts could be predicted and even forecasted. Therefore, we could effectively control the plausible impacts due to arsenic and viral infection. The implications of our proposed model might be initiated for risk management. First, our model concept could be used as a paradigm for heterogeneous stress co‐exposure issues where the stress might include heavy metals and/or infectious virus. Second, our model structure might be useful for infection risk estimation if arsenic‐associated infection probability is available. Last, our results might improve the current vaccine and chemoprophylaxis layout (or deployment).
ACKNOWLEDGMENTS
The authors acknowledge the financial support of the National Science Council of Republic of China under grant NSC 97‐2313‐B‐002‐017‐MY3.
APPENDIX: CONVERSION OF THE PERCENT PREDICTED FEV1 INTO AGE‐SPECIFIC FEV1
We treated the age‐associated FEV1 empirical formulas adopted from Cotes et al. ( 47 ) for three selected age groups (16–25, 25–65, 65–85 years) and calculated population‐based age‐specific normal FEV1,N(t, 0) in the absence of arsenic as:
 |
(A.1) |
| (A.2) |
| (A.3) |
where St stands for stature (m). Input age (mean value) and stature, stature‐ and age‐related predicted FEV1 could be calculated accordingly. In the empirical formulas, we assumed that the stature of male is 1.70 m, and the FEV1 of health participants is 100%. After arsenic exposure, one of the lung function indices, FEV1, would decline subsequently; thus the percent predicted FEV1 could be obtained as FEV1(t, 0)/FEV1(t, C)×100%.
REFERENCES
- 1. Polizzotto ML, Kocar BD, Benner SG, Sampson M, Fendorf S. Near‐surface wetland sediments as a source of arsenic release to ground water in Asia. Nature, 2008; 454:505–508. [DOI] [PubMed] [Google Scholar]
- 2. Winkel L, Berg M, Amini M, Hug SJ, Johnson CA. Predicting groundwater arsenic contamination in Southeast Asia from surface parameters. Nature Geoscience, 2008; 1:536–542. [Google Scholar]
- 3. Chen CJ, Chen CW, Wu MM, Kuo TL. Cancer potential in liver, lung, bladder and kidney due to ingested inorganic arsenic in drinking water. British Journal of Cancer, 1992; 66:888–892. [DOI] [PMC free article] [PubMed] [Google Scholar]
- 4. Chen CJ, Chen CL, Hsu LY, Chou WL, Lin YC, Tseng MP, Chiou HY, Hsueh YM. Biological gradient between long‐term arsenic exposure and cancer risk in Taiwan. Toxicology, 2001; 164:17–18. [Google Scholar]
- 5. Chen CJ, Hsu LI, Wang CH, Shih WL, Hsu YH, Tseng MP, Lin YC, Chou WL, Chen CY, Lee CY, Wang LH, Cheng YC, Chen CL, Chen SY, Wang YH, Hsueh YM, Chiou HY, Wu MM. Biomarkers of exposure, effect, and susceptibility of arsenic‐induced health hazards in Taiwan. Toxicology and Applied Pharmacology, 2005; 206:198–206. [DOI] [PubMed] [Google Scholar]
- 6. Smith AH, Lopipero PA, Bates MN, Steinmaus CM. Arsenic epidemiology and drinking water standards. Science, 2002; 296:2145–2146. [DOI] [PubMed] [Google Scholar]
- 7. Hsueh YM, Ko YF, Huang YK, Chen HW, Chiou HY, Huang YL, Yang MH, Chen CJ. Determinants of inorganic arsenic methylation capability among residents of the Lanyang Basin, Taiwan: Arsenic and selenium exposure and alcohol consumption. Toxicology Letters, 2003; 137:49–63. [DOI] [PubMed] [Google Scholar]
- 8. Chiou HY, Chiou ST, Hsu YH, Chou YL, Tseng CH, Wei ML, Chen CJ. Incidence of transitional cell carcinoma and arsenic in drinking water: A follow‐up study of 8,102 residents in an arseniasis‐endemic area in northeastern Taiwan. American Journal of Epidemiology, 2001; 153:411–418. [DOI] [PubMed] [Google Scholar]
- 9. Chiou JM, Wang SL, Chen CJ, Deng CR, Lin W, Tai TY. Arsenic ingestion and increased microvascular disease risk: Observations from the southwestern arseniasis‐endemic area in Taiwan. International Journal of Epidemiology, 2005; 34:936–943. [DOI] [PubMed] [Google Scholar]
- 10. Yang CY, Chang CC, Tsai SS, Chuang HY, Ho CK, Wu TN. Arsenic in drinking water and adverse pregnancy outcome in an arseniasis‐endemic area in northeastern Taiwan. Environmental Research, 2003; 91:29–34. [DOI] [PubMed] [Google Scholar]
- 11. Yang CY, Chiu HF, Chang CC, Ho SC, Wu TN. Bladder cancer mortality reduction after installation of a tap‐water supply system in an arsenious‐endemic area in southwestern Taiwan. Environmental Research, 2005; 98:127–132. [DOI] [PubMed] [Google Scholar]
- 12. Navas‐Acien A, Sharrett AR, Silbergeld EK, Schwartz BS, Nachman KE, Burke TA, Guallar E. Arsenic exposure and cardiovascular disease: A systematic review of the epidemiologic evidence. American Journal of Epidemiology, 2005; 162:1037–1049. [DOI] [PubMed] [Google Scholar]
- 13. Lamm SH, Engel A, Penn CA, Chen R. Feinleib M. Arsenic cancer risk confounder in southwest Taiwan data set. Environmental Health Perspectives, 2006; 114:1077–1082. [DOI] [PMC free article] [PubMed] [Google Scholar]
- 14. Guha Mazumder DN, Haque R, Ghosh N, De BK, Santra A, Chakraborti D, Smith AH. Arsenic in drinking water and the prevalence of respiratory effects in West Bengal, India. International Journal of Epidemiology, 2000; 29:1047–1052. [DOI] [PubMed] [Google Scholar]
- 15. Milton AH, Hasan Z, Rahman A, Rahman M. Chronic arsenic poisoning and respiratory effects in Bangladesh. Journal of Occupational Health, 2001; 43:136–140. [Google Scholar]
- 16. Milton AH, Rahman M. Respiratory effects and arsenic contaminated well water in Bangladesh. International Journal of Environmental Health Research, 2002; 12:175–179. [DOI] [PubMed] [Google Scholar]
- 17. Arain MB, Kazi TG, Baig JA, Jamali MK, Afridi HI, Jalbani N, Sarfraz RA, Shah AQ, Kandhro GA. Respiratory effects in people exposed to arsenic via the drinking water and tobacco smoking in southern part of Pakistan. Science of the Total Environment, 2009; 407:5524–5530. [DOI] [PubMed] [Google Scholar]
- 18. von Ehrenstein OS, Guha Mazumder DN, Yuan Y, Samanta S, Balmes J, Sil A, Ghosh N, Hira‐Smith M, Haque R, Purushothamam R, Lahiri S, Das S, Smith AH. Decrements in lung function related to arsenic in drinking water in West Bengal, India. American Journal of Epidemiology, 2005; 162:533–541. [DOI] [PubMed] [Google Scholar]
- 19. Smith AH, Goycolea M, Haque R, Biggs ML. Marked increase in bladder and lung cancer mortality in a region of northern Chile due to arsenic in drinking water. American Journal of Epidemiology, 1998; 147:660–669. [DOI] [PubMed] [Google Scholar]
- 20. De BK, Majumdar D, Sen S, Guru S, Kundu S. Pulmonary involvement in chronic arsenic poisoning from drinking contaminated ground‐water. Journal of Association of Physicians of India, 2004; 52:395–400. [PubMed] [Google Scholar]
- 21. Parvez F, Chen Y, Brandt‐Rauf PW, Bernard A, Dumont X, Slavkovich V, Argos M, D’Armiento J, Foronjy R, Hasan MR, Eunus H, Graziano JH, Ahsan H. Nonmalignant respiratory effects of chronic arsenic exposure from drinking water among never‐smokers in Bangladesh. Environmental Health Perspectives, 2008; 116:190–195. [DOI] [PMC free article] [PubMed] [Google Scholar]
- 22. World Health Organization (WHO) . Influenza fact sheet. Available at: http://www.who.int/mediacentre/factsheets/fs211/en/index.html, Accessed on June 10, 2009.
- 23. Chow A, Ma S, Ling AE, Chew SK. Influenza‐associated deaths in tropical Singapore. Emerging Infectious Diseases, 2006; 12:114–121. [DOI] [PMC free article] [PubMed] [Google Scholar]
- 24. Wong CM, Yang L, Chan KP, Leung GM, Chan KH, Guan Y, Lam TH, Hedley AJ, Peiris JSM. Influenza‐associated hospitalization in a subtropical city. PLoS Medicine, 2006; 3:485–492. [DOI] [PMC free article] [PubMed] [Google Scholar]
- 25. Viboud C, Alonso WJ, Simonsen L. Influenza in tropical regions. PLoS Medicine, 2006; 3:468–471. [DOI] [PMC free article] [PubMed] [Google Scholar]
- 26. Park AW, Glass K. Dynamic patterns of avian and human influenza in east and southeast Asia. Lancet Infectious Diseases, 2007; 7:543–548. [DOI] [PubMed] [Google Scholar]
- 27. World Health Organization (WHO) . Disease outbreak news: Pandemic (H1N1) 2009—Update 59. Available at: http://www.who.int/mediacentre/factsheets/fs211/en/index.html, Accessed on August 5, 2009.
- 28. World Health Organization (WHO) . Arsenic in drinking water. Available at: http://www.who.int/mediacentre/factsheets/fs210/en/, Accessed on March 7, 2009.
- 29. Global Initiative for Asthma (GINA) . Gina report. Available at: http://www.ginasthma.com, Accessed on January 13, 2009.
- 30. Kondo S, Abe K. The effect of influenza virus infection on FEV1 in asthmatic children: The time‐course study. Chest, 1991; 100:1235–1238. [DOI] [PubMed] [Google Scholar]
- 31. Murphy KR, Eivindson A, Pauksens K, Stein WJ, Tellier G, Watts R, Leophonte P, Sharp SJ, Loeschel E. Efficacy and safety of inhaled Zamamivir for the treatment of influenza in patients with asthma or chronic obstructive pulmonary disease—A double‐blind, randomised, placebo‐controlled, multicentre study. Clinical Drug Investigation, 2000; 20:337–349. [Google Scholar]
- 32. Upshur REG, Moineddin R, Crighton EJ, Mamdani M. Interactions of viral pathogens on hospital admissions for pneumonia, croup and chronic obstructive pulmonary diseases: Results of a multivariate time‐series analysis. Epidemiology and Infection, 2006; 134:1174–1178. [DOI] [PMC free article] [PubMed] [Google Scholar]
- 33. Martinello RA, Esper F, Weibel C, Ferguson D, Landry ML, Kahn JS. Human metapneumovirus and exacerbations of chronic obstructive pulmonary disease. Journal of Infection, 2006; 53:248–254. [DOI] [PMC free article] [PubMed] [Google Scholar]
- 34. Gorse GJ, O’Connor TZ, Young SL, Habib MP, Wittes J, Neuzil KM, Nichol KL. Impact of a winter respiratory virus season on patients with COPD and association with influenza vaccination. Chest, 2006; 130:1109–1116. [DOI] [PubMed] [Google Scholar]
- 35. Ko FWS, Ip M, Chan PKS, Fok JPC, Chan MCH, Ngai JC, Chan DPS, Hui DSC. A 1‐year prospective study of the infectious etiology in patients hospitalized with acute exacerbations of COPD. Chest, 2007; 131:44–52. [DOI] [PubMed] [Google Scholar]
- 36. Kozul CD, Ely KH, Enelow RI, Hamilton JW. Low‐dose arsenic compromises the immune response to influenza A infection in vivo . Environmental Health Perspectives, 2009; 117:1441–1447. [DOI] [PMC free article] [PubMed] [Google Scholar]
- 37. Hayden FG, Fritz RS, Lobo MC, Alvord WG, Strober W, Straus SE. Local and systemic cytokine responses during experimental human influenza A virus infection—Relation to symptom formation and host defense. Journal of Clinical Investigation, 1998; 101:643–649. [DOI] [PMC free article] [PubMed] [Google Scholar]
- 38. Taylor HM, Karlin S. (eds). An Introduction to Stochastic Modeling (rev. ed.). San Diego , CA : Academic Press, Inc., 1994. [Google Scholar]
- 39. USEPA, Science Policy Council Handbook: Risk Characterization . EPA 100‐B‐00‐002, Offices of Science Policy and Research and Development, U.S. Environmental Protection Agency, Washington DC , 2000. [Google Scholar]
- 40. Nordstrom DK. Worldwide occurrences of arsenic in ground water. Science, 2002; 296:2143–2145. [DOI] [PubMed] [Google Scholar]
- 41. Chen Y, Parvez F, Gamble M, Islam T, Ahmed A, Argos M, Graziano JH, Ahsan H. Arsenic exposure at low‐to‐moderate levels and skin lesions, arsenic metabolism, neurological functions, and biomarkers for respiratory and cardiovascular diseases: Review of recent findings from the Health Effects of Arsenic Longitudinal Study (HEALS) in Bangladesh. Toxicology and Applied Pharmacology, 2009; 239:184–192. [DOI] [PMC free article] [PubMed] [Google Scholar]
- 42. Duker AA, Carranza EJM, Hale M. Spatial dependency of Buruli ulcer prevalence on arsenic‐enriched domains in Amansie West District, Ghana: Implications for arsenic mediation in Mycobacterium ulcerans infection. International Journal of Health Geographics, 2004; 3:19. [DOI] [PMC free article] [PubMed] [Google Scholar]
- 43. Haverkos HW. Viruses, chemicals and co‐carcinogenesis. Oncogene, 2004; 23:6492–6499. [DOI] [PubMed] [Google Scholar]
- 44. Reynolds KA. Co‐contaminant calamities: Arsenic and influenza. On Tap, 2009; 51: 66–68. [Google Scholar]
- 45. Fraser C, Donnelly CA, Cauchemez S, Hanage WP, Van Kerkhove MD, Hollingsworth, TD , Griffin J, Baggaley RF, Jenkins HE, Lyons EJ, Jombart T, Hinsley WR, Grassly NC, Balloux F, Ghani AC, Ferguson NM, Rambaut A, Pybus OG, Lopez‐Gatell H, Alpuche‐Aranda CM, Chapela IB, Zavala EP, Guevara DME, Checchi F, Garcia E, Hugonnet S, Roth C, The WHO Rapid Pandemic Assessment Collaboration . Pandemic potential of a strain of influenza A (H1N1): Early findings. Science, 2009; 324:1557–1561. [DOI] [PMC free article] [PubMed] [Google Scholar]
- 46. World Health Organization (WHO) . Pandemic (H1N1) 2009. Available at: http://www.who.int/csr/disease/swineflu/en/index.html, Accessed on November 10, 2009.
- 47. Cotes JE, Chinn DJ, Miller MR. Lung Function—Physiology, Measurement and Application in Medicine (6th ed.) Oxford : Blackwell Publishing, 2006. [Google Scholar]