

Abstract
Air‐space disease is typical in severe acute respiratory syndrome (SARS) and may be indistinguishable from pneumonia of other causes. In the majority of patients, ground glass opacities on chest radiographs progress rapidly to focal, multifocal or diffuse consolidation. Unilateral involvement is common in the early acute phase, becoming bilateral at maximal lung involvement. Generally, radiographic opacities peak between 8 and 10 days after onset of illness, with radiographic scores reflecting temporal changes in clinical and laboratory parameters such as oxygen saturation (SaO2) and liver transaminases. Pleural effusions, cavitating consolidation and mediastinal lymphadenopathy are not typical radiographic features. Pneumomediastinum and pneumothoraces are complications that are associated with extensive disease, with or without assisted ventilation.
The utility of high resolution computed tomography (HRCT) and CT scans lies in the confirmation of airspace opacities in cases with normal initial chest radiographs that have strong contact history and signs and symptoms highly suspicious of SARS during the outbreak, allowing early treatment and prompt isolation. The characteristic HRCT feature in the acute phase is ground‐glass opacities with smooth interlobular septal thickening, sometimes with consolidation in a subpleural location, which progress rapidly to involve other areas of the lungs. Temporal lung changes documented on HRCT suggest that some residual opacities found may not be reversible.
Keywords: airspace opacities, chest radiograph, high resolution computed tomography, severe acute respiratory syndrome
INTRODUCTION
When severe acute respiratory syndrome (SARS) first surfaced in China in November 2002, and later in Hong Kong in February 2003 with devastating reverberations around the world, little was known of its epidemiology, pathogenesis, clinical course and radiological features. As a result, the World Health Organization (WHO) issued case definitions for the diagnosis of probable and suspected cases of SARS. 1 , 2 , 3 Due to the lack of data on the disease, these definitions were rather non‐specific and included anyone who had a febrile respiratory illness since November 1, 2002 with radiographic infiltrates consistent with a pneumonia, had been in close contact with a SARS patient or had a history of travel to an affected area or residence in an affected area, during the 10 days prior to the onset of illness. 3 The aetiological agent of SARS was initially believed to be the human metapneumovirus, the coronavirus, or both, although it is now increasingly evident from molecular and serologic assays, virus isolation techniques and polymerase chain reaction (PCR) tests that a novel coronavirus (SARS‐CoV) is the causative agent. 4 , 5 , 6 , 7 , 8
Retrospective diagnosis of SARS can be made from the detection of anti‐SARS‐CoV IgG in the serum obtained 15–21 days after the onset of symptoms. 4 As seroconversion is a delayed phenomenon, it does not lend itself as a rapid diagnostic test. Viral RNA in nasopharyngeal aspirates/swabs and stool of patients can be detected using a reverse transcriptase (RT‐PCR) assay but is only positive in approximately 50–60% of cases. 4 , 8 As a rapid and reliable diagnostic test for SARS is currently unavailable, the diagnosis of SARS remains a clinical one that depends largely on radiographic evidence of pneumonia, at least in the initial stage of the infection. 3 Therefore, radiological assessment of SARS plays an important role in the management of SARS. 1 , 2 , 9 , 10 , 11 , 12 , 13 , 14 , 15 , 16 , 17 , 18 , 19 , 20 , 21 , 22 , 23
RADIOGRAPHIC FEATURES
Although airspace shadowing is the most common abnormality found on the CXR at presentation and irrespective of age in a patient with probable SARS, 9 , 10 , 11 , 12 , 13 , 14 , 15 , 16 , 17 , 18 , 19 , 20 , 21 10–40% of symptomatic patients in published series have normal initial CXRs. 9 , 14 , 17 , 18 The earliest radiographic abnormalities described are ground glass opacities (Fig. 1a), defined as opacities that do not obscure vascular markings as opposed to consolidation that does, 9 , 11 , 13 which progressed rapidly in the majority of patients, to focal, multifocal (Fig. 1b) or diffuse consolidation (Fig. 1c). 9 , 11 , 13 , 14 , 16 , 17 The consolidation is usually ill defined, and an interstitial pattern is almost never encountered at presentation although nodular opacities have been reported in a few patients. 1 , 11 , 12 , 13 Unilateral lung involvement is found at presentation in approximately two‐thirds of patients 9 , 12 , 14 becoming bilateral at maximal lung involvement (Fig. 1). 9 , 12 The consolidation tends to be peripheral in distribution with lower zone predominance 1 , 2 , 11 , 13 , 14 , 16 although purely upper and midzone (Fig. 2a) distribution is found in a small proportion of patients. 11 , 12 , 14 When diffuse, the consolidation can be indistinguishable from acute respiratory distress syndrome (ARDS) (Fig. 2b).
Figure 1.
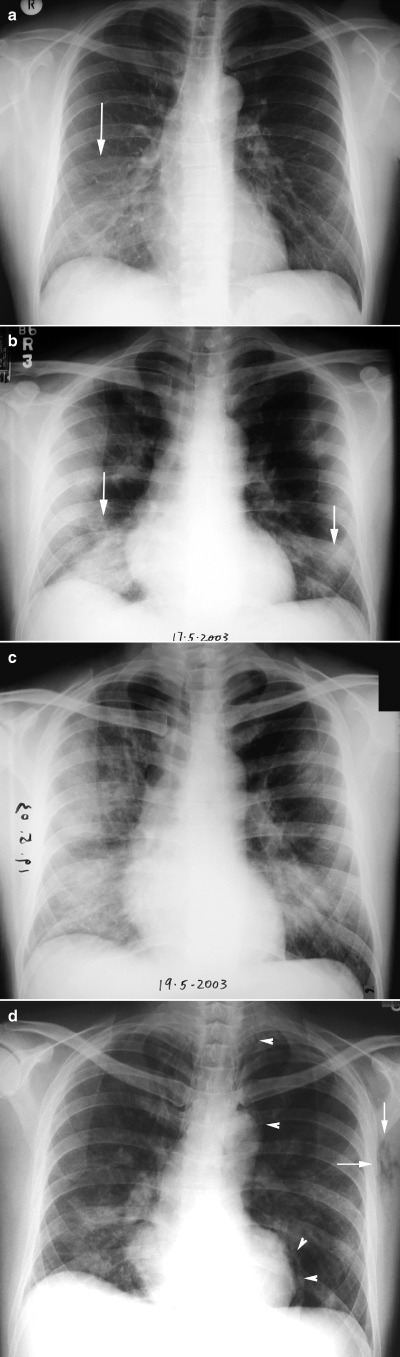
Serial CXRs in a 38‐year‐old male with severe acute respiratory syndrome (SARS). (a) On admission only faint ground glass opacities are present in the right lower zone (arrow). (b) Within 36 h, the ground glass opacities have progressed to multifocal consolidation in both lower zones. (c) On day 4 of admission, diffuse consolidation is noted in the right lung with increase in left lower zone consolidation. (d) On day 8 of admission, pneumomediastinum (arrowheads) and surgical emphysema (arrows) are noted.
Figure 2.
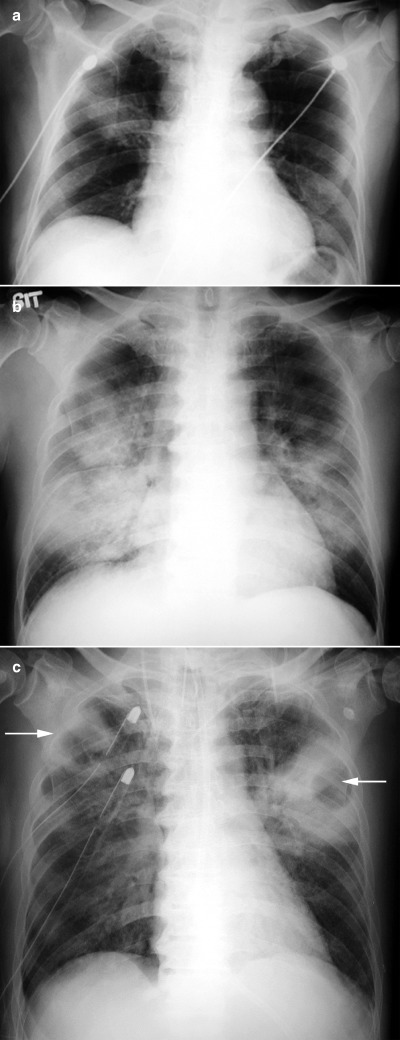
(a) CXR at presentation of a 52‐year‐old male with severe acute respiratory syndrome (SARS) showing focal consolidation in the right upper zone. (b) CXR of a 56‐years‐old male with SARS 1 week after admission showing bilateral diffuse consolidation. (c) CXR of the same patient illustrated in (b) after 3 weeks in the intensive care unit on high dose steroids showing bilateral upper lobe cavitating lesions (arrows). Superadded infection was suspected.
In one series of 40 patients with serologically proven SARS, radiographic opacities continued to deteriorate with radiographic scores peaking at 9.35 ± 4.09 days (median 9 days) from onset of illness and 5 days after treatment before declining. 9 In a larger cohort of 138 probable cases of SARS, Wong et al. showed four different patterns of progression. 14 The majority (70%) of patients shared pattern 1 in which peak radiographic scores occurred 8.6 ± 3.1 days after onset of fever before declining. A smaller proportion of patients (17.4%) showed pattern 2 in which there were two radiographic peaks occurring 6.3 ± 3 and 13.5 ± 3.7 days, respectively, after onset of fever and before improvement. A minority of patients demonstrated one of two patterns: pattern 3, where there was minimal radiographic progression throughout the illness prior to resolution in 10 (7%) patients, and pattern 4, where there was relentless progression of radiographic opacities culminating in death in 6 of 7 (4%) patients at the time of publication. 14 In a separate review of 40 patients with probable SARS, consolidation largely followed two patterns of serial radiographic change that reflected the clinical outcome, whereby the consolidation either improved rapidly or, in the majority of patients (72%), progressed to bilateral extensive pneumonia. 16
The clinical utility of radiographic evaluation, particularly using radiographic scores for clinical correlation in SARS, has been substantiated in several studies. 9 , 10 , 14 , 20 , 21 Changes in radiographic scores in general tended to reflect temporal changes in clinical and laboratory parameters such as oxygen saturation (SaO2) and liver transaminases. 9 , 20 , 21 Significant inverse relationships between radiographic scores and SaO2, and linear correlations with liver aminotransaminases have been reported. 9 , 21 In a study involving a cohort of patients with serologically confirmed SARS, all patients with diffuse consolidation at maximal radiographic change required oxygen supplementation including mechanical ventilation. 10 Similar relationships between oxygen supplementation and two other patterns of consolidation, focal and multifocal (patchy), were not evident. Radiographic parameters that were associated with a poor treatment response in a separate study included high radiographic scores at the time of treatment, high radiographic score at maximal lung changes, and longer time period to develop maximal lung changes. 10
As a general rule, pleural effusions per se and mediastinal lymphadenopathy were not seen on CXR, although small pleural effusions were detected on HRCT scans, and when fluid overload or heart failure supervened. 9 , 10 , 11 , 12 , 13 , 14 , 15 , 16 , 17 , 18 , 19 , 22 Atelectasis was not a presenting radiographic feature in any of the published series, although volume loss has been noted with disease progression and in the convalescent period (Ooi, pers. comms., 2003.) Although CXRs cleared by the time of discharge in most patients, residual opacities were noted in some patients. HRCT scans are helpful in the postdischarge period to further characterise these opacities in order to determine whether they are irreversible or not. Cavitation within areas of consolidation in the acute period has not been reported although this can develop in patients with a protracted course, particularly in those requiring mechanical ventilation, when superadded infection may be a complicating factor (Ooi, pers. comms.) (Fig. 2c). Pneumomediastinum and pneumothoraces (Fig. 1d) are other complications that occur and are associated with extensive disease, with or without assisted ventilation.
HIGH RESOLUTION COMPUTED TOMOGRAPHY
HRCT and CT scans were particularly useful in confirming airspace opacities in cases with normal initial CXRs who had strong contact history and signs and symptoms highly suspicious of SARS during the height of the outbreak, allowing early treatment and more importantly prompt isolation of these patients. 11 , 12 , 13 , 14 , 23 HRCT documented more extensive disease than otherwise suspected, and also identified opacities in regions of the lungs not easily visualized on the chest radiograph, such as the retrocardiac area and the lung bases. The characteristic HRCT feature in the acute phase was ground‐glass opacities, sometimes with consolidation in a subpleural location, which progressed rapidly to involve other areas of the lungs. 11 , 12 , 13 , 15 , 22 , 23 The ground glass opacities were associated with smooth interlobular and intralobular septal thickening (Fig. 3a).
Figure 3.
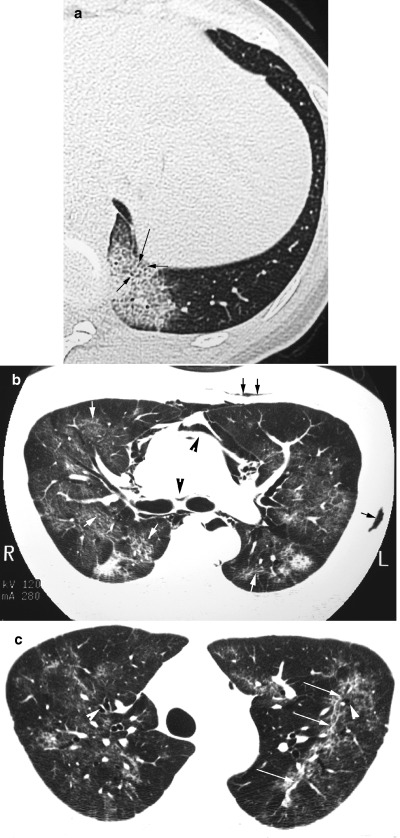
(a) HRCT scan of the thorax in a 28‐year‐old female patient with SARS on admission showing a patch of ground glass opacification in the left lung base with smooth interlobular septal thickening (arrows). (b) HRCT in a 39‐year‐old male with SARS 2 weeks after admission showing irregular reticular opacities superimposed on ground glass opacification (white arrows), pneumomediastinum (black arrowheads) and surgical emphysema (black arrows). (c) HRCT of the same patient illustrated in (b) obtained 5 weeks after admission shows persistent reticular opacities (white arrows) associated with bronchial dilatation (white arrowheads) in both upper lobes.
In a serial review of HRCT scans in 30 patients, irregular reticular opacities superimposed on ground glass opacities (Fig. 3b) appeared in the second week, peaking in the fourth week. 23 Purely reticular (linear) opacities were noted from the second week of illness reaching highest proportions by the fourth week. After the fourth week, 55% patients had features suggestive of early fibrosis: reticular opacities with or without residual ground glass opacities that were associated with architectural distortion and bronchial dilatation (Fig. 3c). In a separate review of 24 cases discharged from hospital, similar appearances were noted in 62% of cases that were older and had more severe disease during treatment than their counterparts. 22 Further follow‐up of discharged SARS patients with HRCT and lung function assessment, particularly those with residual opacities on the CXR, would be required to establish the long‐term outcome of these patients with respect to irreversible fibrosis.
CONCLUSION
In the context of an outbreak or epidemic situation when contact history or exposure is easily established, the radiographic appearance and progression including HRCT characterization are very helpful in aiding diagnosis. However, at the tail end of an outbreak or in situations when contact history is tenuous or difficult to establish, radiographic appearances may not be as helpful in establishing a diagnosis. Similar air‐space opacities are noted in other atypical pneumonias, in particular viral and mycoplasma pneumonias. The peripheral location of the air‐space opacities is also found in conditions such as bronchiolitis obliterans with organizing pneumonia (BOOP) and eosinophilic pneumonia. Similarly, the differential diagnoses for HRCT features include ARDS, CMV pneumonitis, acute interstitial pneumonitis, BOOP and alveolar proteinosis.
Nevertheless the CXR remains the first‐line radiological investigation for diagnosis of SARS. The clinical‐radiological correlations are useful in assisting the clinical management of these patients. The role of HRCT lies in identifying air‐space opacities in normal or questionable radiographs allowing early treatment and isolation; and in the later stages of the disease to detect complications and irreversible changes.
REFERENCES
- 1. Tsang KW, Ho PL, Ooi GC et al. A cluster of cases of severe acute respiratory syndrome in Hong Kong. N. Engl. J. Med. 2003; 348: 1977–85. [DOI] [PubMed] [Google Scholar]
- 2. Lee N, Hui D, Wu A et al. A major outbreak of severe acute respiratory syndrome in Hong Kong. N. Engl. J. Med. 2003; 348: 1986–94. [DOI] [PubMed] [Google Scholar]
- 3. World Health Organization. Case definitions for surveillance of severe acute respiratory syndrome (SARS). Revised May 1, 2003. [Cited 1 May, 2003.] Available from URL: http://www.who.int/csr/sars/casedefinition/en/
- 4. Peiris JS, Lai ST, Poon LL et al. Coronavirus as a possible cause of severe acute respiratory syndrome. Lancet 2003; 361: 1319–25. [DOI] [PMC free article] [PubMed] [Google Scholar]
- 5. Ksiazek TG, Erdman D, Goldsmith CS et al. A novel coronavirus associated with severe acute respiratory syndrome. N. Engl. J. Med. 2003; 348: 1953–66. [DOI] [PubMed] [Google Scholar]
- 6. Drosten C, Gunther S, Preiser W et al. Identification of a novel coronavirus in patients with severe acute respiratory syndrome. N. Engl. J. Med. 2003; 348: 1967–76. [DOI] [PubMed] [Google Scholar]
- 7. Fouchier RA, Kuiken T, Schutten M et al. Aetiology: Koch's postulates fulfilled for SARS virus. Nature 2003; 423 (6937): 240. [DOI] [PMC free article] [PubMed] [Google Scholar]
- 8. Peiris JS, Chu CM, Cheng VC et al. Clinical progression and viral load in a community outbreak of coronavirus‐associated SARS pneumonia: a prospective study. Lancet 2003; 361: 1767–72. [DOI] [PMC free article] [PubMed] [Google Scholar]
- 9. Ooi GC, Khong PL, Lam B et al. Relationship between radiological and clinical parameters in SARS. Radiology 2003; in press.
- 10. Ooi GC, Khong PL, Ho CM et al. Severe acute respiratory syndrome: Radiographic evaluation and clinical outcome measures. Radiology 2003; in press. [DOI] [PubMed]
- 11. Muller NL, Ooi GC, Khong PL, Nicolaou S. Severe acute respiratory syndrome. Radiographic and CT findings. Am. J. Roentgenol. 2003; 181: 3–8. [DOI] [PubMed] [Google Scholar]
- 12. Muller NL, Ooi GC, Khong PL et al. Severe acute respiratory syndrome: Thin section CT at presentation and after admission. Am. J. Roentgenol. 2003; in press. [DOI] [PubMed]
- 13. Wang R., Sun H, Song W et al. Plain radiograph and CT features of 112 patients with SARS in acute stage. Beijing Da Xue Xue Bao, 2003; 35 (S): 29–33. [PubMed] [Google Scholar]
- 14. Wong KT, Antonio GE, Hui DS et al. Severe acute respiratory syndrome: radiographic appearances and pattern of progression in 138 patients. Radiology 2003; 228: 401–6. [DOI] [PubMed] [Google Scholar]
- 15. Antonio GE, Wong KT, Hui DSC et al. Thin‐section CT in patients with severe acute respiratory syndrome following hospital discharge: preliminary experience. Radiology 2003; 228: 810–5. [DOI] [PubMed] [Google Scholar]
- 16. Grinblat L, Shulman H, Glickman A et al. Severe acute respiratory syndrome: Radiographic review of 40 probable cases in Toronto, Canada. Radiology 2003; 228: 802–9. [DOI] [PubMed] [Google Scholar]
- 17. Nicolaou S, Al‐Nakshabandi NAN, Muller. SARS. Imaging of severe acute respiratory syndrome. Am. J. Roentgenol. 2003; 180: 1247–9. [DOI] [PubMed] [Google Scholar]
- 18. Hon KL, Leung CW, Cheng WT et al. Clinical presentations and outcome of severe acute respiratory syndrome in children. Lancet 2003; 361: 1701–3. [DOI] [PMC free article] [PubMed] [Google Scholar]
- 19. Tsou IY, Loh LE, Kaw GJ, Chan I, Chee TS. Severe acute respiratory syndrome (SARS) in a paediatric cluster in Singapore. Ped Radiol 2003. [Published online 20 August 2003.] Available from URL: http://www.springerlink.com/app/home/content.asp?wasp=5f8rkyg30w7rrka137e0&referrer=contribution&format=13&page=1&pagecount=60 [DOI] [PMC free article] [PubMed]
- 20. Ho JC, Ooi GC, Mok TY et al. High dose pulse versus non‐pulse corticosteroid regimens in severe acute respiratory syndrome. Am. J. Respir. Crit. Care Med. 2003.[Published online 28 August, 2003.] Available from URL: http://ajrccm.atsjournals.org/cgi/reprint/200306-766OCv1.pdf [DOI] [PubMed]
- 21. Wong WM, Ho JC, Ooi GC et al. Liver function abnormality correlates with disease activity and severity of severe acute respiratory syndrome. JAMA 2003: in press.
- 22. Wong KT, Antonio GE, Hui DS et al. Thin‐Section CT of Severe Acute Respiratory Syndrome: Evaluation of 74 Patients Exposed to or with the Disease. Radiology 2003; 228: 395–400. [DOI] [PubMed] [Google Scholar]
- 23. Ooi GC, Khong KL, Muller NL et al. Temporal lung changes in SARS. Sequential thin‐section CT findings in 30 patients. Radiology 2003; in press [DOI] [PubMed]