

Abstract
A transformation analogous to the well‐known conversion of an N‐terminal glutamine residue to pyroglutamic acid is the cyclization of an N‐terminal carboxamidomethylated cysteine residue (the normal product of alkylation with iodoacetamide). This yields 5‐oxothiomorpholine‐3‐carboxylic acid, with the same 17 Da mass loss observed in the Gln reaction. Nineteen tryptic peptides with Cys at the N‐terminal were identified for this study, and compared with eight with N‐terminal Gln. When examined by MALDI‐QqTOF and (off‐line HPLC)/MALDI‐QqTOF measurements, these were all found to undergo the cyclization reactions. The average degree of degradation during overnight digestion was found to be ∼51 and ∼34% for Cys and Gln, respectively; more detailed information on the time course of the reactions was obtained for the peptides CCTESLVNR and QYYTVFDR. Taking this modification into account while sequencing is likely to increase the probability of protein identification by peptide mass fingerprinting, especially for cysteine‐rich proteins. Copyright © 2003 John Wiley & Sons, Ltd.
The intensive application of mass spectrometry has revolutionized protein research within the past few decades.1 Several protocols based on proteolytic digestion (in‐solution or in‐gel), followed by electrospray ionization (ESI) or matrix‐assisted laser desorption/ionization (MALDI) mass spectrometry, have been found suitable for high‐throughput protein identification. A number of computer programs have been developed to carry out such identifications efficiently, provided that the complete sequence of the protein is contained in a data bank.
Nevertheless, complete characterization of an unknown protein may still present problems. Quantitation, de novo sequencing, or identification of modifications all usually require a good deal of manual input and considerable expertise. In particular, post‐translational modifications (PTMs)2,3 may not be recognized by the mass spectrometrist (or the computer), unless they are anticipated.
In vivo PTMs such as phosphorylation or glycosylation are important because of their involvement in regulation of many biological processes. However, other PTMs appear as artifacts that can take place during sample preparation or analysis, so they might better be called chemical modifications; common examples include deamidation of Asn, oxidation of Met, conversion of an N‐terminal Gln residue into pyroglutamic acid, and formation of acrylamide adducts for Cys‐containing peptides during separation on polyacrylamide gels.4 The kind and extent of such chemical modifications depend strongly on experimental conditions.5 For example, in‐gel separated and digested proteins in our hands carry almost completely oxidized Met residues and deamidated Asn in ‐Asn‐Gly‐ sequences, whereas typical in‐solution digestion conditions leave methionines almost intact and ‐Asn‐Gly‐ partially deamidated.
Customary sample preparation procedures include reduction, alkylation, and digestion, and modifications can take place during any one of these processes. In particular, Cys residues are all converted to their carboxamidomethyl derivatives during the commonly used alkylation by iodoacetamide, with a corresponding mass increase of 57.021 Da for each. If one of these residues is at the N‐terminus, its structure differs only by an additional ‐S‐ bridge from that of an N‐terminal glutamine. Thus a reaction analogous to the well‐known transformation mentioned above (cyclization of an N‐terminal Gln residue leading to 2‐pyrrolidone‐5‐carboxylic, or pyroglutamic acid, Scheme 1(a)) might be expected to occur during proteolytic digestion. This would lead to the formation of a six‐membered ring of 5‐oxothiomorpholine‐3‐carboxylic acid or (R)‐5‐oxoperhydro‐1,4‐thiazine‐3‐carboxylic acid (Scheme 1(b)), again with a corresponding mass loss of 17 Da. The latter reaction was described nearly 30 years ago,6 but it appears to have been reported only sporadically7,8 until the recent careful measurements by Geoghegan et al.,9 which led to its inclusion in the Delta Mass compilation.3 These authors conducted a detailed investigation of the reaction for three synthetic peptides, as well as for two peptides derived from tryptic digestion of the recombinant protein p25. The measurements included HPLC/electrospray‐MS/MS, solid‐phase peptide synthesis, NMR measurements, and a study of the reaction kinetics.
Scheme 1.
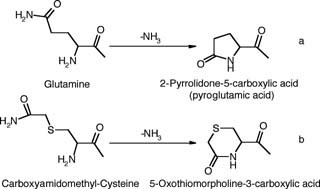
Reaction schemes for conversion of Gln into pyroglutamic acid (a) and carboxyamidomethyl‐Cys into 5‐oxothiomorpholine‐3‐carboxylic acid (b).
Like these authors, we were unaware of this possible modification until we noticed a −17 Da transformation of N‐terminal Cys alkylated with iodoacetamide in our current study of the glycosylation patterns of human integrins. In this work we observed the presence of an unidentified glycosylated peptide at a mass 17 Da less than the human integrin beta1 (477–490) fragment CHEG[N]GTFECGACR, and carrying the same sugar composition. The sample had been processed in the usual way: reduction, alkylation with iodoacetamide and overnight digestion with trypsin, and the modified peptide appeared in a later HPLC fraction than the normal one, showing that the −17 Da fragment was formed prior to ionization. The presence of the N‐terminal Cys in this peptide suggested that the 17 Da loss came from the Cys cyclization reaction mentioned above.
This observation stimulated a search of some of our previous HPLC/MALDI‐TOFMS data for peptides carrying N‐terminal Cys residues, in order to determine the prevalence of the Cys cyclization reaction. This led to the discovery of 18 additional cases of a 17 Da loss from an N‐terminal cysteine. Here we report these results, as well as experiments performed to compare the rate of the Cys degradation with the analogous Gln modification.
EXPERIMENTAL
Sample preparation and digestion
For this investigation we re‐examined mass spectra from previously measured samples including:
-
1
Tryptic digests of 17 proteins (15 commercially available proteins plus two from human α5β1 integrin). For these measurements we first prepared 1 mg/mL solutions of the following commercially available proteins in 100 mM ammonium bicarbonate: human apo‐transferrin, bovine carbonic anhydrase, rabbit phosphorylase B, bovine catalase, bovine alpha‐lactalbumin, porcine pepsinogen, rabbit glyceraldehyde‐3‐phosphate dehydrogenase, horse heart cytochrome C, horse heart myoglobin, bovine chymotrypsinogen, bovine serum albumin, bovine apo‐transferrin, human serum albumin, bovine beta‐lactoglobulin, and bovine ribonuclease A. The human α5β1 integrin (∼300 μg/mL) was affinity‐purified from human placenta.10
Each of the proteins was reduced (10 mM DTT, 30 min, 57°C), alkylated (50 mM iodoacetamide, 30 min in the dark at room temperature), dialyzed against 100 mM NH4HCO3 (6 h, 7000 Da MWCO, Pierce), and digested overnight with (sequencing grade)‐modified trypsin (Promega 1:100 enzyme/substrate ratio, 12 h, 37°C). The human α5β1 samples were processed with and without N‐deglycosylation with N‐glycosidase F (PNGase F; Roche Molecular Biochemicals); deglycosylation of α5β1 integrin was performed between the dialysis and trypsinization steps (0.1 U/μL PNGase F, overnight, 37°C).
2. The SARS virus nucleocapsid protein11 was in‐gel digested according to the procedure described by Shevchenko et al.12
Each digest was mixed 1:1 with MALDI matrix solution (150 mg/mL dihydroxybenzoic acid in 1:1 water/acetonitrile), deposited on the gold surface of a MALDI target, air‐dried, and subjected to MALDI‐MS analysis.
In addition to re‐examining previously recorded MS and MS/MS spectra from the above samples, we also made new measurements on the model peptide CDPGYIGSR13 (C‐0668, Sigma; also examined by Geoghegan et al. by ESI9), to study the accessibility of the N‐terminal amino group to chemical modification, with or without cyclization. The peptide (1 mg/mL in 100 mM NH4HCO3) was alkylated (10 mM iodoacetamide, 30 min, room temperature in the dark) and stored for 12 h at 37°C. The resulting product was treated with the CAF reagent kit (chemically assisted fragmentation; Amersham Biosciences) according to the manufacturer's instructions, in order to modify the N‐terminus with a group containing the ‐SO3H residue.13
(Off‐line HPLC)/orthogonal injection MALDI‐QqTOFMS
Mass spectrometry has great powers of discrimination, but the complexity of biological samples (such as the mixture of 17 protein digests described above) still presents a challenge. HPLC separation is often helpful to alleviate this problem, since the separate HPLC fractions are likely to have much simpler mass spectra than the original sample. In this case it was also essential to show that the modification that we were observing took place prior to entry into the mass spectrometer, since 17 Da losses are commonly observed during ionization.
However, the optimum conditions for operation of the HPLC system and the mass spectrometer are usually different, as are the time scales for the two processes, so on‐line coupling of the HPLC system to the mass spectrometer, as commonly used for ESI, may require undesirable compromises. In contrast, the simplest mode of coupling HPLC to a MALDI system is off‐line, and this has the advantage of completely decoupling the two techniques, enabling separate optimization of each, and removing any time constraints on the mass spectrometric measurements.14 Such off‐line coupling also allows both MS and MS/MS measurements on the same sample,15,16 and makes it possible to re‐examine the sample long after the initial measurements have been completed.
Chromatography
The mixture of 17 protein digests (0.4 pmol/μL of each) was prepared by appropriate dilution in 0.2% trifluoroacetic acid (TFA) aqueous solution, and 5 μL (2 pmol of each) were injected into the HPLC system. Chromatographic separations were performed using a micro‐Agilent 1100 series system (Agilent Technologies, Wilmington, DE, USA). Deionized (18 MΩ) water and HPLC‐grade acetonitrile were used for the preparation of eluents. The 5 μL samples were injected onto a 150 μm × 150 mm column (Vydac 218 TP C18, 5 μm; Grace Vydac, Hesperia, CA, USA) and eluted with a linear gradient of 1–80% acetonitrile (0.1% TFA) in 60 min. The column effluent (4 μL/min) was mixed on‐line with dihydroxybenzoic acid matrix solution (0.5 μL/min) and deposited by a computer‐controlled robot onto a movable gold target at 1‐min intervals.14 Only 40 fractions were collected, since almost all of the tryptic peptides were eluted in 40 min under the chromatographic conditions used.
The extract containing the peptide mixture from in‐gel digestion of the SARS virus nucleocapsid protein was lyophilized and re‐suspended in 5.5 μL of 0.5% TFA; 0.5 μL was used for direct MALDI‐MS analysis and the rest of the 5 μL was analyzed by μ‐HPLC/MALDI‐MS, as just described.
Fractionation of the CDPGYIGSR model peptide reaction mixture was performed using a 1 × 100 mm column (Vydac 218 TP C18, 5 μm), 100 μL/min flow rate, 20 μL injection loop and the same linear gradient of 1–80% acetonitrile (0.1% TFA) in 60 min. The absorbance of the column effluent was monitored at 214 nm. Fractions corresponding to the two main peaks of the chromatogram were collected, lyophilized, re‐suspended in 0.1% TFA and deposited on a target for analysis by MALDI‐MS and MS/MS.
TOFMS
Peptide mass fingerprinting of the individual digests confirmed the identity of the proteins. The chromatographic fractions were analyzed both by single mass spectrometry (MS) with m/z range 570–5000, and by tandem mass spectrometry (MS/MS) in the Manitoba/Sciex prototype quadrupole/TOF (QqTOF) mass spectrometer (commercial model sold as QSTAR by Applied Biosystems/MDS Sciex, Foster City, CA, USA).17 In this instrument, ions are produced by irradiation of the sample with photon pulses from a 20 Hz nitrogen laser (VCL 337ND; Spectra‐Physics, Mountain View, CA, USA) with 300 mJ energy per pulse. Orthogonal injection of ions from the quadrupole into the TOF section normally produces a mass resolving power of ∼10 000 FWHM, and accuracy within a few mDa in the TOF spectra, in both MS and MS/MS modes.
‘M/z’ with a signal‐to‐noise (S/N) ratio 2.5 and the ‘ProFound’ program (both from the Manitoba Centre for Proteomics18) were used for peak assignment and peptide mass fingerprint analysis, respectively.
RESULTS AND DISCUSSION
As mentioned above, two glycosylated peptides with the same sugar composition were found in consecutive fractions during μ‐HPLC/MS analysis of a non‐deglycosylated human integrin α5β1 digest (shown in Figs. 1(a) and 1(b)). MS/MS analysis of the labelled peaks (not shown) allowed us to determine the masses of the peptide parts of the separated species: 1654.615 and 1637.587 Da (MH+), for (a) and (b), respectively. The first one corresponds to a tryptic fragment from human integrin beta1 (477–490) CHEG[N]GTFECGACR (calculated mass 1654.616 Da), and the −17.028 Da mass shift in the one eluting later (Fig. 1b) is in excellent agreement with the loss of ammonia (calculated mass 17.027 Da) predicted by the cyclization reaction illustrated in Scheme 1(b) (see Table 1(B)). We note that the μ‐HPLC fractionation provides complete separation of the two species, showing that the loss occurs prior to MS.
Figure 1.

MALDI‐MS and μ‐HPLC/MALDI‐MS measurements on N‐terminal Gln, carboxyamidomethyl‐Cys, and their −17 Da products. (a, b) Spectra of two consecutive LC fractions containing glycosylated fragments from human integrin beta1 (477–490) CHEG[N]GTFECGACR (fraction 16) and its cyclization product (fraction 17); (c) MALDI‐MS spectra of in‐gel digested SARS virus nucleocapsid protein (1163–1190 Da range); (d, e) spectra of fractions 19 and 21, containing unmodified QYNVTQAFGR peptide and its pyroGlu‐ analog, respectively; (f) MALDI‐MS spectra showing degradation of the CEVFR (6–10) fragment from bovine α‐lactalbumin (1 mg/mL digest); (g, h) μ‐HPLC fractionation of the same peptides (2 pmol injected) from the 17‐protein digest mixture. Note that it was not possible even to examine the latter fragments before chromatographic separation of the 17‐protein digest, because of poor S/N ratios. See experimental for conditions.
Table 1.
MALDI‐MS and μ‐HPLC/MALDI‐MS detection of −17 Da products of peptides having Gln and carboxyamidomethyl‐Cys residues at the N‐termini. All proteins were reduced, alkylated (iodoacetamide), and digested overnight with trypsin in solution, unless otherwise noted. MALDI‐MS spectra were collected for individual digests of 1 mg/mL proteins (0.3 mg/mL for integrin α5β1), or for portion of peptides extract after in‐gel digestion of SARS virus nucleocapsid protein. The data from two μ‐HPLC/MALDI‐MS runs have been analyzed: separation of 17‐protein digest mixture and separation of tryptic peptides from SARS virus nucleocapsid protein (see Experimental). Degree of conversion (%) has been calculated based on the ratio of monoisotopic peaks area (area product/(area product + area original peptide). M*—oxidized Met; D and D —Asn residues converted into Asp due to deamidation and deglycosylation with PNGase F, respectively; n/a—degradation product was not detected due to peak overlapping; δm —measured difference between unmodified and modified peptides
| Protein, peptide (start‐end) | MALDI‐MS | μ‐HPLC‐MALDI‐MS | ||||
|---|---|---|---|---|---|---|
| m/z measured | δm (Da) | Degree of conv. (%) | m/z measured | δm (Da) | Fraction # | |
| (A) N‐terminal Gln | ||||||
| SARS virus nucleocapsid protein, | 1183.585 | −17.027 | 28 | 1183.589 | −17.032 | 19 |
| QYNVTQAFGR (267–276) in‐gel | 1166.558 | 1166.557 | 21 | |||
| SARS virus nucleocapsid protein, | 1892.892 | −17.012 | 45 | 1892.905 | −17.026 | 23 |
| QPTVTLLPAADM*DDFSR (389–405) in‐gel | 1875.880 | 1875.879 | 24 | |||
| Human Integrin α5, | 1628.901 | n/a | n/a | 1628.902 | −17.032 | 22 |
| QATLTQTLLIQDGAR (567–581) | n/a | 1611.870 | 23 | |||
| Human Integrin α5, | 1131.614 | −17.026 | 31 | 1131.612 | −17.023 | 18 |
| QVATAVQWTK (981–990) | 1114.588 | 1114.589 | 20 | |||
| Phosphorylase B, | 1580.832 | −17.022 | 38 | 1580.832 | −17.023 | 26, 27 |
| QIIEQLSSGFFSPK (728–741) | 1563.810 | 1563.809 | 29 | |||
| Phosphorylase B, | 1756.956 | −17.017 | 26 | 1756.954 | −17.023 | 26, 27 |
| QLLNCLHVITLYNR (564–577) | 1739.939 | 1739.931 | 29 | |||
| Pepsinogen, | 1091.519 | −17.025 | 34 | 1091.520 | −17.024 | 20 |
| QYYTVFDR (352–359) | 1074.494 | 1074.496 | 22 | |||
| Bovine serum albumin, | 658.317 | −17.023 | 38 | 658.319 | −17.027 | 4 |
| QEPER (118–122) | 641.294 | 641.292 | 4 | |||
| (B) N‐terminal carboxyamidomethyl‐Cys | ||||||
| Human Integrin α5, | 1068.435 | −17.024 | 35 | 1068.429 | −17.029 | 15 |
| CPEAECFR (911–918) | 1051.409 | 1051.400 | 18 | |||
| Human Integrin α5, | 2307.146 | −17.019 | 45 | 2307.135 | −17.025 | 24 |
| CELGPLHQQESQSLQLHFR (921–939) | 2290.127 | 2290.110 | 25 | |||
| Human Integrin β1, CNEGR (491–495) | — | — | — | 635.260 | −17.025 | 4 |
| 618.235 | 4 | |||||
| Human Integrin β1, | 2242.053 | −17.025 | 51 | 2242.055 | −17.027 | 31 |
| CS D ISIGDEVQFEISITSNK (415–434) | 2225.028 | 2225.028 | 32 | |||
| Human Integrin β1, | 1655.599 | −17.020 | 60 | 1655.601 | −17.025 | 15 |
| CHEG D GTFECGACR (477–490) | 1638.579 | 1638.576 | 16 | |||
| Human serotransferrin, CQSFR (38–42) | — | — | — | 697.314 | −17.026 | 11 |
| 680.288 | 14 | |||||
| Human apo‐transferrin, | — | — | — | 1280.558 | −17.023 | 18 |
| CDEWSVNSVGK (374–384) | 1263.535 | 20 | ||||
| Human apo‐transferrin, | 1531.689 | −17.027 | 43 | 1531.694 | −17.025 | 22 |
| CSTSSLLEACTFR (684–696) | 1514.662 | 1514.669 | 23 | |||
| Bovine α‐lactalbumin, | 710.334 | −17.023 | 58 | 710.332 | −17.023 | 15 |
| CEVFR (6–10) | 693.311 | 693.309 | 17 | |||
| Chymotrypsinogen A bovine, | 1553.842 | −17.023 | 46 | 1553.850 | −17.029 | 25 |
| CGVPAIQPVLSGLSR (1–15) | 1536.819 | 1536.821 | 27 | |||
| Bovine serum albumin, | — | — | — | 706.358 | −17.023 | 10 |
| CASIQK (223–228), or human serum albumin | 689.335 | 12 | ||||
| CASLQK (197–202) | ||||||
| Bovine serum albumin, | 1138. 495 | −17.018 | 63 | 1138.503 | −17.025 | 15 |
| CCTESLVNR (499–507) or human serum albumin (473–481) | 1121.477 | 1121.478 | 16, 17 | |||
| Bovine serum albumin, | — | — | — | 1166.495 | −17.028 | 10, 11 |
| CCTKPESER (460–468) | 1149.467 | 12 | ||||
| Bovine serum albumin, | 1927.812 | n/a | n/a | 1927.798 | −17.028 | 18 |
| CCAADDKEACFAVEGPK (581–597) | n/a | 1910.770 | 19 | |||
| Bovine apo‐transferrin, CASFR (38–42) | — | — | — | 640.290 | −17.023 | 12 |
| 623.267 | 15 | |||||
| Bovine apo‐transferrin, | — | — | — | 1362.715 | −17.030 | 23 |
| CGLVPVLAENYK (424–435) | 1345.685 | 25 | ||||
| Bovine apo‐transferrin, | — | — | — | 1994.841 | −17.029 | 22 |
| CACSNHEPYFGYSGAFK (200–216) | 1977.812 | 23 | ||||
| Human serum albumin, | — | — | — | 1552.606 | −17.026 | 14 |
| CCAAADPHECYAK (357–369) | 1535.580 | 15 | ||||
| Ribonuclease A, | 2517.222 | −17.020 | 57 | 2517.218 | −17.018 | 25, 26 |
| CKPVNTFVHESLADVQAVCSQK (39–60) | 2500.202 | 2500.200 | 27 | |||
Our recent study of SARS virus associated proteins included de novo sequencing of a ∼46 kDa nucleocapsid protein.11 Two tryptic fragments carrying Gln residues on their N‐termini were sequenced along with their degradation products containing N‐terminal pyroglutamic acid residues (Table 1(A)). Figures 1(c), 1(d) and 1(e) show MALDI‐MS and μ‐HPLC/MALDI‐MS detection of the QYNVTQAFGR (267–276) peptide from the SARS virus nucleocapsid protein and its −17 Da derivative.
The use of chromatographic fractionation prior to MALDI‐MS analysis also yields at least a 10‐fold increase in detection sensitivity (Figs. 1(c), 1(d) and (e)). It can resolve peaks with close m/z values, and can also separate peptides with similar chemical structures, which is even more important here. In this case, the −17 Da products elute later for both SARS nucleocapsid peptides.
To investigate these questions further, the μ‐HPLC/MS data for the digests of the 17 proteins (previously obtained for the purpose of calibrating the μ‐HPLC‐MS system) were re‐analyzed. Calculation from the known sequences showed that the mixture theoretically should contain 27 unique tryptic peptides with C‐terminal Cys residues within a mass range of 570–5000 Da. Direct MALDI‐MS measurements of the individual digests followed by automatic peak assignment using the ‘m/z’ program was able to identify 10 of these during ProFound mass fingerprinting, but only one when the digest mixture was examined. In contrast, analysis of the HPLC/MS data for the digest mixture (with the same 2.5 S/N ratio allowed) revealed 19 of the 27 peptides, emphasizing the considerable improvement provided by the HPLC separation. Manual examination of the spectra showed that the other eight peptides were not identified by the program because of poor S/N ratios.
The previously recorded MS and MS/MS spectra for all these 19 identified peptides with N‐terminal Cys residues were then re‐examined, along with the spectra of six peptides with N‐terminal Gln residues for comparison (Table 1). The data in Table 1 include m/z values for these peptides, mass differences between the original peptide and its product, degree of conversion (only for direct MALDI‐MS of the individual digests), and distribution between chromatographic fractions (only for μ‐HPLC/MS). The degree of conversion (%) was calculated based on the ratio of the monoisotopic peak areas, i.e., [area of product/(area of product + area of original peptide)], assuming that the chemical transformation does not change the MALDI response. The parameter was not estimated for the μ‐HPLC/MS data because the MS signal in different fractions could be affected by co‐eluting peptides due to suppression effects.
The −17 Da products eluted later for all the peptides studied, except for two hydrophilic fragments, bovine serum albumin QEPER (118–130) and human integrin β1, CNEGR (491–495). As an example, the separation of bovine α‐lactalbumin CEVFR (6–10) fragments is presented in Figs. 1(f), 1(g) and 1(h). The average mass shifts were calculated for the μ‐HPLC/MS data in Table 1 as −17.0265 and −17.0256 Da for N‐terminal Gln and Cys, respectively, in good agreement with the calculated value for NH3 elimination (−17.02655 Da). MS/MS measurements also confirmed the loss of 17 Da at the N‐terminal carboxamidomethylated Cys, but not at internal cysteines. The MS/MS spectrum of the 693.309 Da fragment from Fig. 1(f) exhibits a complete series of a, b and y product ions, except a1 and b1 (Table 2).
Table 2.
MS/MS fragmentation of 710.332 Da (CEVFR) peptide and its −17 Da degradation product. Series of (y) ions shown only for 710.332 Da, because it was found identical for both peptides
| a fragments m/z | b fragments m/z | y fragments m/z | y fragments calculated (Da) | Δm (mDa) | |||
|---|---|---|---|---|---|---|---|
| Precursor ion (Da) | 693.309 | 710.332 | 693.309 | 710.332 | 710.332 | 710.332 | 710.332 |
| Residue | |||||||
| Cys (1) | not found | 133.042 | not found | 161.035 | 710.330 | 710.330 | 0 |
| Glu (2) | 245.053 | 262.088 | 273.060 | 290.081 | 550.306 | 550.299 | 7 |
| Val (3) | 344.127 | 361.155 | 372.129 | 389.151 | 421.258 | 421.256 | 2 |
| Phe (4) | 491.192 | 508.229 | 519.194 | 536.230 | 322.191 | 322.188 | 3 |
| Arg (5) | 647.275 | 664.313 | 675.291 | 692.327 | 175.116 | 175.119 | −3 |
The average degree of degradation was found to be ∼34 and ∼51% for N‐terminal Gln and Cys, respectively (Table 1). Such a difference indicates somewhat more favorable formation of the six‐membered ring than the five‐membered one. To monitor the time course of these reactions, bovine serum albumin and porcine pepsinogen (0.2 mg/mL) were subjected to digestion for 48 h, during which the degradation of the CCTESLVNR and QYYTVFDR peptides was monitored by MALDI‐MS (Fig. 2). According to the data in Table 1 and Fig. 2, a typical overnight digestion (∼12 h in our case) results in more than 50% transformation of peptides with their N‐terminal Cys residues alkylated with iodoacetamide, in reasonable agreement with the 10 h half‐life obtained for CGYGPKKKRKVGG and CDPGYIGSR by Geoghegan et al.9
Figure 2.
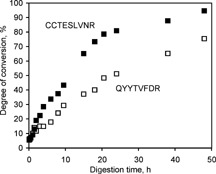
Dependence of degree of peptide conversion on digestion time. Porcine pepsinogen and bovine serum albumin (0.2 mg/mL) were reduced, alkylated with iodoacetamide and digested with trypsin. Two peptides (porcine pepsinogen, QYYTVFDR (352–359), and bovine serum albumin CCTESLVNR (499–507)), as well as their degradation products, were monitored by MALDI‐MS. The degree of conversion (%) has been calculated based on the ratios of monoisotopic peak areas: (area of product)/(area of product + area of original peptide).
To study the accessibility of the N‐terminal amino group, we subjected the mixture of the CDPGYIGSR peptide alkylated with iodoacetamide and its −17 Da derivative to modification with the CAF reagent,13 a procedure that involves coupling a 3‐sulfopropionic acid NHS‐ester to the N‐terminus of the peptide. The resulting product is expected to exhibit a +135.983 Da (calculated) mass shift and preferred formation of the y series of product ions during MS/MS fragmentation.13 Figure 3 shows the MS spectra of the peptide solution after 30 min alkylation at room temperature (Fig. 3(a)), after storage of the reaction mixture overnight at 37°C (Fig. 3(b)) and treatment with the CAF reagent (Fig. 3(c)). Overnight storage of the reaction solution resulted in ∼53% transformation of the 1024.453 Da peptide into a 1007.428 Da product (Fig. 3(b)). This transformation was confirmed by HPLC fractionation of the reaction mixture from Fig. 3(b), after which two prominent peaks were observed in the chromatogram, separated by 2.2 min, corresponding to the unmodified 1024.453 Da peptide and its −17 Da product (Fig. 4). Identity of the peptides was confirmed by MALDI‐MS. Based on the ratio of peak areas in Fig. 4, the calculated degree of conversion is 42% compared with 53% in Fig. 3(b).
Figure 3.
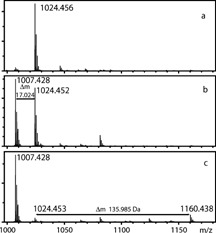
MALDI‐MS measurement of CDPGYIGSR alkylated with iodoacetamide, its degradation product, and the products after N‐terminal modification with the CAF reagent. Mass spectra of (a) CDPGYIGSR peptide after 30 min alkylation with iodoacetamide at room temperature; (b) the same reaction mixture after overnight storage at 37°C; and (c) the reaction mixture after treatment with the CAF reagent.
Figure 4.
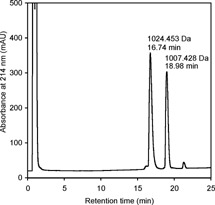
Narrow‐bore HPLC fractionation of the CDPGYIGSR peptide alkylated with iodoacetamide and its cyclization product (mixture from Fig. 3(b)).
Subsequent modification with the CAF reagent showed the appearance of a 1160.438 Da N‐terminally modified product of the 1024.452 Da fragment (135.985 Da mass difference), whereas the −17 Da peptide containing 5‐oxothiomorpholine‐3‐carboxylic acid at the N‐terminus appeared to be intact (Fig. 3(c)). This example provides additional proof of N‐terminal cyclization of carboxamidomethylated Cys and also makes it possible to estimate the decrease in sensitivity caused by the coupling of the strongly acidic ‐SO3H group to the N‐terminus. Here the peak intensity of the 1160.438 Da CAF‐modified peptide was found to be about 12 times less than expected from the ratio of the peak intensities of the non‐modified 1007.428 and 1024.452 Da fragments.
CONCLUSIONS
Coupling of HPLC to mass spectrometric measurement provides a useful method of distinguishing the 17 Da loss described here from similar losses occurring in the mass spectrometer. The modified −17 Da fragments always eluted at different times (usually later) from a C18 column than their unmodified counterparts, both for N‐terminal Gln and Cys. The differences in retention times were found to be 1–2 min for a short 40‐min gradient, indicating a significant influence of the N‐terminal chemistry on the chromatographic behavior of the peptides.
This cyclization of N‐terminal carboxamidomethylated Cys into a 5‐oxothiomorpholine‐3‐carboxylic acid residue was observed in all 19 identified tryptic peptides with Cys at the N‐terminus, suggesting that the reaction will always take place during sample preparation if iodoacetamide is used as the alkylating agent. The reaction could be avoided by the use of iodoacetic acid or 4‐vinylpyridine,9 but these reagents have been found to be less desirable for the purpose, at least in our hands.
Neglect of the reaction leads to a significant decrease in the detection sensitivity of such peptides by mass spectrometry (more than 50% for a typical overnight digestion). However, the characteristic presence of the two fragments, differing in mass by 17 Da and appearing in different chromatographic fractions, may in fact aid in the identification of N‐terminal cysteines, as long as the mass spectrometrist (or the program) is fully aware of the possibility.
Acknowledgements
This work was supported by grants from the US National Institutes of Health (GM 59240), from the Canadian Institutes of Health Research, and from the Natural Sciences and Engineering Research Council of Canada. We thank John Wilkins for providing the integrin samples, and James McNabb and Victor Spicer for invaluable technical support.
REFERENCES
- 1. Mann M, Hendrickson RC, Pandey A. Annu. Rev. Biochem. 2001; 70: 437. [DOI] [PubMed] [Google Scholar]
- 2. Krishna R, Wold F. In Proteins‐Analysis and Design, Angeletti RH (ed). Elsevier‐Academic Press: San Diego, 1998; 121–206. [Google Scholar]
- 3. ‘Delta Mass’. Available: http://www.abrf.org/index.cfm/dm.home.
- 4. Hamdan M, Bordini E, Galvani M, Righetti PG. Electrophoresis 2001; 22: 1633. [DOI] [PubMed] [Google Scholar]
- 5. Thiede B, Lamer S, Mattow J, Siejak F, Dimmler C, Rudel T, Jungblut PR. Rapid Commun Mass Spectrom. 2000; 14: 496. [DOI] [PubMed] [Google Scholar]
- 6. Glazer AN, DeLange RJ, Sigman DS. In Chemical Modification of Proteins. Selected Methods and Analytical Procedures. Elsevier: Amsterdam, 1975; 105. [Google Scholar]
- 7. Hulmes JD, West KA, Crabb JW. An N‐terminal cysteine modification associated with carboxyamidomethylation and enzymatic digestion. In ABRF Meeting Program. 1998; 079.
- 8. Boesen TP, Soni B, Schwartz TW, Halkier T. J. Biol. Chem. 2002; 277: 40335. [DOI] [PubMed] [Google Scholar]
- 9. Geoghegan KF, Hoth LR, Tan DH, Borzilleri KA, Withka JM, Boyd JG. J. Proteome Res. 2002; 1: 181. [DOI] [PubMed] [Google Scholar]
- 10. Wilkins JA, Li A, Ni H, Stupack DG, Shen C. J. Biol. Chem. 1996; 271: 3046. [PubMed] [Google Scholar]
- 11. Krokhin O, Li Y, Andonov A, Feldmann H, Flick R, Jones S, Stroeher U, Bastien N, Dasuri KVN, Cheng K, Simonsen JN, Perreault H, Wilkins J, Ens W, Plummer F, Standing KG, Mol. Cell. Proteomics 2003; 2: 346. [DOI] [PMC free article] [PubMed] [Google Scholar]
- 12. Shevchenko A, Chernushevich I, Ens W, Standing KG, Thomson B, Wilm M, Mann M. Rapid Commun. Mass Spectrom. 1997; 11: 1015. [DOI] [PubMed] [Google Scholar]
- 13. Keough T, Youngquist RS, Lacey MP. Anal. Chem. 2003; 75: 156A. [DOI] [PubMed] [Google Scholar]
- 14. Krokhin O, Qian Y, McNabb JR, Spicer V, Standing KG, Ens W. Proc. 50th ASMS Conf. Mass Spectrometry and Allied Topics, Orlando, FL, USA, 2–6 June, 2002; paper WPP 233.
- 15. Shevchenko A, Loboda A, Shevchenko A, Ens W, Standing KG. Anal. Chem. 2000; 72: 2132. [DOI] [PubMed] [Google Scholar]
- 16. Griffin TJ, Gygi SP, Rist B, Aebersold R, Loboda A, Jilkine A, Ens W, Standing KG. Anal. Chem. 2001; 73: 978. [DOI] [PubMed] [Google Scholar]
- 17. Loboda AV, Krutchinsky AN, Bromirski M, Ens W, Standing KG. Rapid Commun. Mass Spectrom. 2000; 14: 1047. [DOI] [PubMed] [Google Scholar]
- 18. Available: http://www.proteome.ca.