Abstract
Background: The Sysmex XT‐2000iV is a hematology analyzer that combines laser and impedance technology. Its usefulness for determining cell counts in canine and feline intracavitary effusions has not yet been studied.
Objectives: The objectives of this study were to evaluate the analytical performance of the Sysmex XT‐2000iV for cell counts in effusions from dogs and cats, and to assess correlation with an impedance counter and concordance with diagnoses based on cytologic findings.
Methods: Effusions (43 pleural, 23 peritoneal, 6 pericardial) were analyzed from 32 dogs and 34 cats. Total nucleated cell count (TNCC), HCT, and RBC count were determined on the Sysmex and compared with those obtained on an impedance counter (Hemat 8, SEAC). Imprecision, linearity, and limit of detection were determined for the Sysmex. An algorithm was designed using quantitative and qualitative data from the Sysmex to classify the effusions and the results were compared with diagnoses based on cytologic findings.
Results: Intra‐assay and interassay coefficients of variation on the Sysmex were variable. Linearity of TNCC was ≥0.993 for dogs and cats, with the exception of effusions from cats with feline infectious peritonitis, which had delta (Δ) TNC values >3.0. In comparison with the Hemat 8, a proportional error was found for TNCC on the Sysmex. Effusion classification based on the algorithm was concordant with that obtained by cytologic examination in 43/72 (60%) samples. Discordant results usually were due to the misclassification of cells with similar morphology (such as mesothelial and carcinoma cells) in Sysmex scattergrams.
Conclusion: The Sysmex XT‐2000iV provides a precise and accurate TNCC and has moderate concordance with cytologic findings for classifying canine and feline effusions. Although microscopic examination of effusions is necessary to achieve an accurate diagnosis, the Sysmex can provide preliminary information that may be helpful to cytopathologists.
Keywords: Analytical validation, automated cell count, cat, cytology, dog, effusion
Introduction
Effusions are a relatively common manifestation of a wide variety of pathologic processes characterized by altered production and/or removal of fluid in a body cavity. The generally adopted classification system discriminates transudates, modified transudates, and exudates based mainly on protein content and total nucleated cell count (TNCC). 1 This classification is not a diagnosis per se, but is useful for establishing differential diagnoses and for patient management. Usually, transudates develop as a response to increased prehepatic hydrostatic vascular pressure or decreased oncotic pressure; modified transudates can develop from long standing transudates, or can be caused by increased hydrostatic pressure or noninflammatory stimuli; and exudates result from increased capillary permeability occurring during inflammation. 1 Neoplastic, hemorrhagic, and chylous effusions are characterized by variable and overlapping protein concentrations and TNCCs, but have specific cytologic features that are used in their differentiation. Cytologic examination of effusion fluid is usually performed to evaluate the type and morphology of cells present and to look for a possible etiology. Thus, both enumeration and classification of cells in effusions are important in the diagnostic process.
The TNCC can be determined using manual or automated methods. Manual methods (eg, using a hemacytometer) are imprecise, time consuming, and labor intensive. 2 Consequently, an accurate, precise, expeditious, easily performed, and cost‐efficient method would be an attractive alternative, especially if it could also provide information about the cell types present in the effusion. However, using automated methods, debris can be counted as cells, and protein‐rich fluids may clot and obstruct the instrument. 3 Automated differential cell counts are not usually performed on effusions in veterinary laboratories, because microscopic evaluation has been considered necessary for accurate identification of cell type. 1 In human pathology, instruments that use immunophenotyping to identify cells can reliably perform total and differential counts in body fluids. 4 , 5
The Sysmex XT‐2000iV is a veterinary hematology analyzer that provides total and differential counts by combining flow cytometry (laser) and impedance technology. RBC and platelet counts are based on impedance, while the WBC count (corresponding to the TNCC) is based on laser methodology and is measured in the DIFF and BASO channels. 6 The DIFF channel classifies cells based on complexity and nucleic acid content. The BASO channel classifies cells based on volume and the complexity of cellular residues produced after contact with an acidic reagent that collapses all the nucleated cells except basophils. The Sysmex also calculates a delta (Δ) WBC (ratio between DIFF and BASO counts), which should be close to 1. 5 The Sysmex has been validated for canine and feline blood samples 7 ; however, we are unaware of studies on its use to analyze effusion fluid. In 1 study, flow cytometric analysis with the ADVIA 120 was assessed for obtaining a preliminary classification of effusions in dogs and cats. 8
The aims of the present study were to assess the analytical performance of the Sysmex XT‐2000iV for cell counts in canine and feline effusions by evaluating imprecision, linearity, and agreement with counts obtained on an impedance counter. We also evaluated its possible usefulness in classifying the type of effusion by using a diagnostic algorithm of quantitative and qualitative results from the Sysmex and assessing concordance with the diagnoses based on the cytologic findings.
Materials and Methods
Samples and analyzers
Between January and October 2007, 72 samples of cavitary effusions (43 pleural, 23 peritoneal, 6 pericardial) from 32 dogs (5 had bicavitary effusions) and 34 cats (1 had a bicavitary effusion) submitted for routine fluid analysis were prospectively studied. Fluids were placed in EDTA‐containing tubes, refrigerated at 4 °C, and analyzed within 4 hours.
All of the effusions were analyzed both on the Sysmex XT‐2000iV (Sysmex Europe GmbH, Norderstedt, Germany) and subsequently on an impedance counter (Hemat 8, SEAC, Calenzano, Firenze, Italy) to determine TNCC, HCT, and RBC count. For the Sysmex, the TNCCs provided by both the DIFF (TNCC‐DIFF) and BASO (TNCC‐BASO) channels, as well as the ΔWBC, were recorded. Because effusions include cells other than WBCs, the ΔWBC was designated as ΔTNC for the purpose of this study.
Analytical validation of the Sysmex XT 2000iV
Intra‐assay repeatability of TNCC, HCT, and RBC count was determined by analyzing 8 effusion samples (5 canine and 3 feline) 5 consecutive times in 1 day. Interassay repeatability was assessed by analyzing 3 effusion samples (2 canine and 1 feline) on 3 consecutive days. Linearity was assessed using 10 samples (5 canine and 5 feline) that were serially diluted 1:1, 1:3, 1:7, and 1:15 (vol/vol) with isotonic saline and then analyzed on the Sysmex. To determine the limit of detection (LOD), the supernatants of 5 effusion samples (3 canine and 2 feline) were harvested following centrifugation (1000g, 15 min) and then analyzed on the Sysmex analyzer. The LOD corresponds to the lowest concentration of cells that can be distinguished from a blank solution (in this case the supernatant of centrifuged effusion).
Concordance of Sysmex and cytologic findings
Direct and/or cytocentrifuged specimens (30g, 5 min) were prepared within 4 hours of collection, air‐dried, and stained with May‐Grünwald–Giemsa (Merck KGaA, Frankfurt, Germany). Only cytologic findings (not physicochemical or macroscopic data) were used to classify the fluids. Therefore the traditional classification scheme based on transudates, modified transudates, and exudates was not used. Rather, a qualitative cytologic diagnosis was made by 2 independent observers (N.P.C., M.C.) blinded to the Sysmex results. In the case of conflicting classifications, the 2 observers reviewed together the slides to achieve a consensus. Based on the cytologic diagnosis, samples were then grouped into the following categories: transudative (poorly cellular samples, classified cytologically as inconclusive), chylous (samples rich in small lymphocytes), reactive or inflammatory (effusions containing mesothelial cells, macrophages or neutrophils as the predominant cell populations), feline infectious peritonitis (FIP, characterized by increased neutrophils, the presence of mononuclear cells, and a proteinaceous background), round cell neoplasia (including lymphoma), or other neoplasia (carcinoma or mesothelioma).
To assess the utility of Sysmex XT‐2000iV data in the diagnostic approach to effusions, we first examined Sysmex data, at the beginning of the study, from 2 to 5 effusion samples in each of the categories mentioned above. Specifically, we examined ΔTNC, TNCC, HCT, RBC count, and scattergrams, and classified the data as follows:
-
1
ΔTNC
-
a.
Normal: <1.2; this group included samples with ΔTNC values ranging from 0.2 to the upper level of reference values established in our laboratory for blood samples (1.0±0.2);
-
b.
High: >1.2;
-
c.
Very high: >3.0.
-
2
HCT, RBC count, and TNCC
-
a.
Acellular: HCT <10% and TNCC <1000 cells/μL;
-
b.
Cellular: HCT <10% and TNCC >1000 cells/μL;
-
c.
Bloody: HCT >10%, independent of the TNCC.
-
3
DIFF scattergram (Figure 1)
Figure 1.

TNCC‐DIFF scattergrams on the Sysmex XT‐2000iV. (A) A normal scattergram of a peripheral blood sample from a dog showing the location of different cell populations. (B) An acellular scattergram. Only a few scattered cells are seen. (C) A leukocytic scattergram. The scattergram is similar to that of peripheral blood but with more cells in the hf region. This sample contains a large population of neutrophils. (D) A chylous scattergram. A large lymphocyte population can be seen. (E) A neoplastic (round cell) profile. A large number of cells are seen in the lymphocyte/monocyte regions and extending toward the hf region. (F) A neoplastic (epithelial/mesothelial) profile. In this sample from a dog with pulmonary carcinoma a dispersed cell population is seen extending into the hf region. Contrary to what is seen observed in the scattergram of round cell neoplasia, the cells in the hf region are extending into the upper right corner of the scattergram. TNCC indicates total nucleated cell count; n, neutrophils; l, lymphocytes; m, monocytes; e, eosinophils; hf, high fluorescence region (usually occupied by reactive lymphocytes or monocytes).
-
a.
Acellular: scattered and dispersed events;
-
b.
Leukocytic: scattergrams similar to those typically found in blood, but with a cell population elongated up to the higher fluorescence intensity area;
-
c.
Chylous: similar to the leukocytic classification but with a denser and larger lymphocyte cloud;
-
d.
Neoplastic (round cell) profile: prominent and dense cell population in the lymphocyte region extending up to the top of the scattergram;
-
e.
Neoplastic (epithelial/mesothelial) profile: large, dispersed, and tall cell population in the area of medium‐high fluorescence signal, extending toward the upper right corner of the scattergram.
-
4
BASO scattergram (Figure 2)
Figure 2.
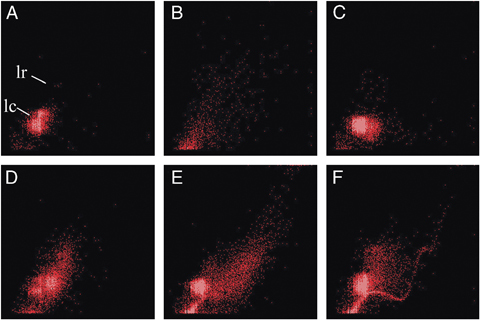
TNCC‐BASO scattergrams on the Sysmex XT‐2000iV. (A) A normal scattergram of a canine peripheral blood sample showing the location of the different cell populations. lc, lysed cells, which in blood correspond to all nucleated cells except basophils; lr, lysis‐resistant cells, which in blood correspond to basophils. (B) An acellular scattergram. Only scattered cells are seen. (C) An enlarged profile. The lc area contains more cells than peripheral blood and is surrounded by scattered cells. (D) A neoplastic (round cell) profile. Many cells are seen in the lc region that extend toward the lr region on the right. (E) A neoplastic (epithelial/mesothelial) scattergram from a pulmonary carcinoma. In addition to the large number of cells in the lc region, many cells are seen extending toward the lr region in the upper right corner of the scattergram. (F) A scattergram from an effusion containing lipid (lipid profile). A curvilinear profile extends from the base of the lc region toward the right of the scattergram. This finding was often associated (as in this case) with the presence of cells in the lr region. TNCC, total nucleated cell count.
-
a.
Acellular: scattered and dispersed events;
-
b.
Enlarged: single cell population in the lower left corner (corresponding to cells nonresistant to lysis), surrounded by scattered events;
-
c.
Neoplastic (round cell) profile: large round cell population in the lower left corner of the scattergram, frequently with an elevated projection of events on its right side;
-
d.
Neoplastic (epithelial/mesothelial) profile: large, dispersed cloud extending into the region corresponding to cells resistant to lysis and also extending toward the upper right corner of the scattergram;
-
e.
Lipid profile: curvilinear profile indicative of the presence of fat, 6 occasionally with scattered events in the area corresponding to lysis‐resistant cells.
Based on our preliminary analysis of this subset of data, we designed an algorithm to classify effusions (Table 1). Using this algorithm, 3 independent observers (N.P.C., A.G., S.P.), blinded to the cytologic diagnosis, evaluated and classified all 72 samples, by integrating interpretation of the quantitative and subjective scattergram data (Figure 3). In the case of conflicting classifications, samples were classified according to the interpretation of the majority (2/3) of the observers.
Table 1.
Diagnostic algorithm for the classification of effusions using the Sysmex XT2000‐iV. *
| Δ TNC | TNCC, RBC, and HCT | DIFF Scattergram | BASO Scattergram | Classification |
|---|---|---|---|---|
| Very high | Variable | Leukocytic | Acellular, normal, or enlarged | Feline infectious peritonitis |
| Normal | Acellular | Acellular | Normal, acellular, enlarged, or lipid profile | Transudative |
| Cellular or hemorrhagic | Chylous | Normal, enlarged, or lipid profile | Chylous | |
| Normal or high | Cellular or hemorrhagic | Leukocytic | Enlarged or lipid profile | Reactive/inflammatory |
| Neoplastic (round cell) profile | Neoplastic (round cell) profile | Round cell neoplasia | ||
| Leukocytic or neoplastic (epithelial/mesothelial) profile | Neoplastic (epithelial/mesothelial) profile | Carcinoma/mesothelioma |
See text for the criteria used to define each category and for abbreviations. Categories were applied sequentially, beginning with Δ TNC and proceeding across to the right. TNC, total nucleated cells; TNCC, total nucleated cell count.
Figure 3.
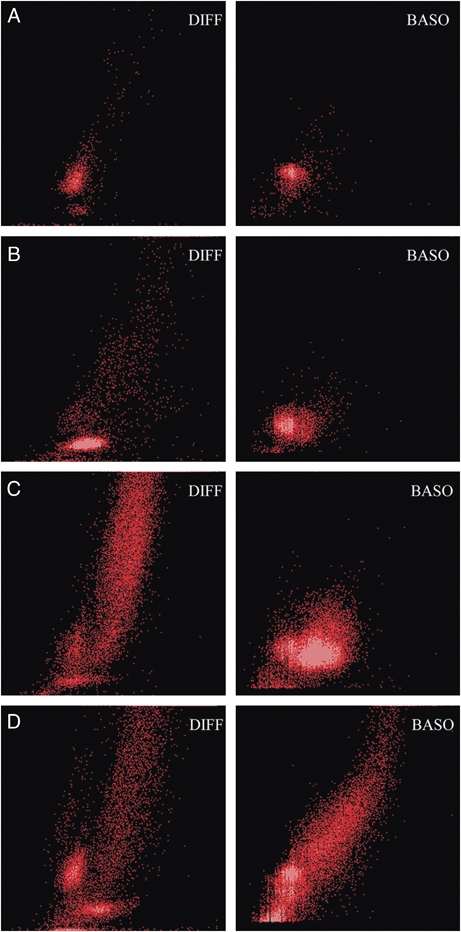
Typical TNCC‐DIFF and TNCC‐BASO scattergrams in different types of effusions. All samples illustrated here had normal ΔTNC, HCT <10%, and TNCC >1000 cells/μL. (A) Chylous effusion. (B) Reactive or inflammatory effusion. (C) Round cell neoplasia. (D) Other neoplasia (carcinoma). The large cell populations in the lymphocyte and neutrophil regions of the TNCC‐DIFF scattergram are likely due to secondary inflammation. TNCC, total nucleated cell count; TNC, total nucleated cells.
Statistical analysis
Validation results were analyzed separately for dogs and cats using Analyse‐it for Microsoft Excel (version 2.00, Analyse‐it Software Ltd., Leeds, UK; Microsoft Corp, Redmond, WA, USA). Coefficients of variation (CVs) were calculated by pooled variance estimates after the exclusion of outliers, which were identified using the Tukey rule. 9 Linearity was determined by comparing the expected values for each dilution to the values obtained, by linear regression analysis. Significant differences between TNCC, HCT, and RBC count from the Sysmex and Hemat 8 were compared using Wilcoxon's paired t‐test, for effusions from dogs and cats separately. Agreement between the methods was assessed by Passing Bablok regression and Bland–Altman difference tests.
Interobserver variability in classifying effusions using the algorithm of Sysmex results was assessed using Cohen's κ coefficient; concordance was estimated as suggested by Landis and Koch. 10 Cohen's κ coefficient also was used to assess concordance between classifications obtained by evaluation of the Sysmex data versus the cytologic diagnosis.
Results
Analytical validation
Of the 8 samples used in evaluation of intra‐assay imprecision, 7 had a low HCT (0–0.5%) and low RBC count (0–0.08 × 10⁶/μL); 1 canine sample had an HCT of 41.3% and a RBC count of 4.49 × 10⁶/μL. The TNCC‐DIFF ranged from 0.1 to 11.4 × 10³/μL and the TNCC‐BASO ranged from 0.7 to 16.1 × 10³/μL. All samples had a ΔTNC close to 1.0 (0.92–1.14), except for 1 sample from a cat with FIP, which had a ΔTNC of 5.70. Intra‐assay CVs for canine samples (n=5) were 10.2% for TNCC‐DIFF, 0.2% for TNCC‐BASO, 0.1% for HCT, and 0.8% for RBC. Intra‐assay CVs for feline samples (n=3) were 94.4% for TNCC‐DIFF, 17.7% for TNCC‐BASO, 5.1% for HCT, and 6.6% for RBC count. The feline sample with the high ΔTNC had an intra‐assay repeatability of 10%; when it was excluded from the calculations for TNCC in feline samples, the intra‐assay CVs were 11.5% for TNCC‐DIFF and 0.5% for TNCC‐BASO. Interassay CVs for canine samples (n=2) were 7.8% for TNCC‐DIFF, 9.5% for TNCC‐BASO, 13.0% for HCT, and 25.3% for RBC count. The interassay CVs for the feline sample, which was the one with the high ΔTNC, were 58.0% for TNCC‐DIFF, 17.9% for TNCC‐BASO, 3.8% for HCT, and 7.0% for RBC count.
Regression coefficients (r 2) for TNCC‐DIFF and TNCC‐BASO were 0.975 and 0.999 for canine effusions and 0.962 and 0.698 for feline effusions, respectively (Figure 4). Regression coefficients for HCT and RBC count were 0.993 and 0.988 for canine samples and 0.852 and 0.990 for feline samples. The correlations for TNCC in feline effusions were affected by 2 samples with outlying values from cats with FIP. These samples had high ΔTNC values (3.75 and 8.72), and dilution did not induce a proportional decrease in values, especially TNCC‐BASO. Exclusion of these 2 samples resulted in r 2 values of 0.990 and 0.996 for TNCC‐DIFF and TNCC‐BASO, respectively, in feline samples. In samples from both dogs and cats, analysis of the supernatant revealed only a few cells, with a LOD of 0.02±0.03 cells/μL for TNCC‐DIFF, 0.07±0.06 cells/μL for TNCC‐BASO, 0.07±0.22% for HCT, and 0.00±0.00 cells/μL for RBC count.
Figure 4.
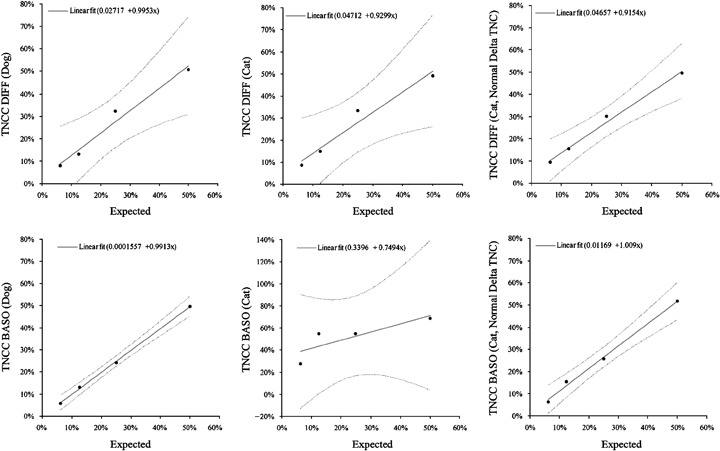
Linearity of TNCC‐DIFF and TNCC‐BASO in effusion fluid from dogs and cats. Feline data also are shown after excluding samples with abnormal ΔTNC (graphs on right). Dotted lines indicate 95% confidence interval. TNC, total nucleated cells, TNCC, total nucleated cell count.
Comparison of data obtained by the 2 instruments occasionally revealed significant differences in both species (Table 2). Difference plots (Figure 5) revealed a slight constant error for HCT and RBC count in dogs and a slight proportional error for TNCC in both dogs and cats. In effusions with TNCCs of >20,000 cells/μL on the Sysmex, the Sysmex counts were generally higher than those on the Hemat 8.
Table 2.
Comparison of effusion data between the Sysmex XT‐2000iV and SEAC Hemat 8.
| Species | Analyte (Units) | Sysmex XT2000iV | SEAC Hemat 8 | P‐Value (Wilcoxon) | ||||
|---|---|---|---|---|---|---|---|---|
| Mean ± SD | Median | 95th Percentile Range | Mean ± SD | Median | 95th Percentile Range | |||
| Dog (n=37) | RBC (× 106/μL) | 0.95 ± 1.88 | 0.09 | 0–5.23 | 0.91 ± 1.74 | 0.11 | 0.01–5.12 | .356 |
| HCT (%) | 6.79 ± 13.11 | 0.65 | 0–42.42 | 6.32 ± 12.34 | 0.6 | 0–35.5 | .200 | |
| TNCC‐DIFF (× 103/μL) | 34.4 ± 86.4 | 8.6 | 0.2–239.8 | 31.8 ± 76.0 | 8.8 | 1.0–305.2 | .064 | |
| TNCC‐BASO (× 103/μL) | 35.1 ± 85.4 | 10.1 | 1.0–212.4 | — | — | — | .004 | |
| Cat (n=35) | RBC (× 106/μL) | 0.10 ± 0.32 | 0.01 | 0–0.99 | 0.1 ± 0.3 | 0.03 | 0.01–1.04 | .001 |
| HCT (%) | 0.53 ± 1.65 | 0.10 | 0–5.31 | 0.49 ± 1.18 | 0.1 | 0–3.7 | .769 | |
| TNCC‐DIFF (× 103/μL) | 7.6 ± 13.7 | 3.0 | 0.2–40.7 | 6.8 ± 12.1 | 2.8 | 0.4–36.7 | .020 | |
| TNCC‐BASO (× 103/μL) | 7.4 ± 14.2 | 2.9 | 0.2–41.4 | — | — | — | .082 | |
TNCC, total nucleated cell count.
Figure 5.
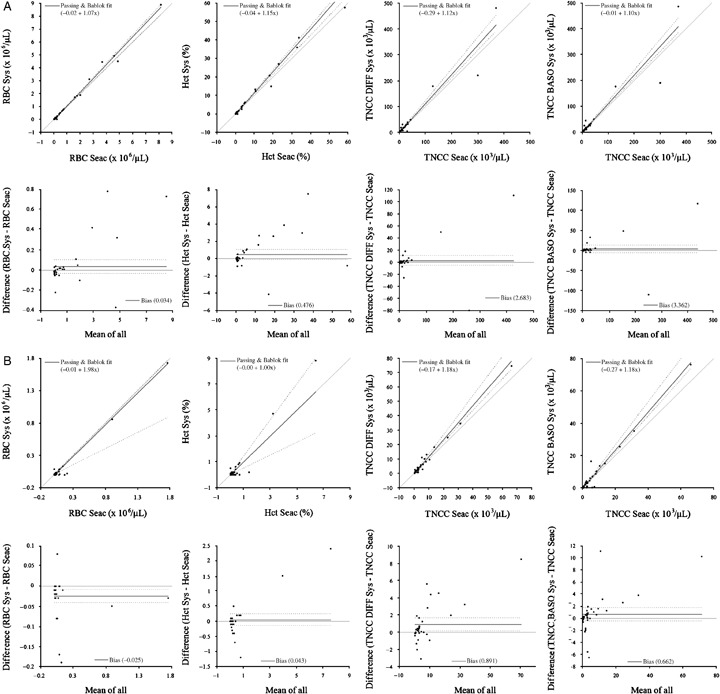
Passing Bablok and Bland–Altman difference plots for RBC counts, HCT, and WBC DIFF and BASO counts on the Sysmex (Sys) as compared with the Hemat 8 (SEAC) for (A) canine and (B) feline effusions. A slight constant error is observed for RBC count in dogs and a proportional error is observed for TNCC‐DIFF and TNCC‐BASO in both species, compared with the total WBC count of the SEAC counter. Dotted lines indicate 95% confidence interval. TNCC, total nucleated cell count.
In 10/72 samples, the ΔTNC was above the reference interval (1.0±0.2, as determined in our laboratory for peripheral blood). This increase was moderate in 4/7 samples (1.28, 1.73, 1.75, and 2.79). Three of these 4 samples were from 2 dogs and 1 cat with neoplasia (2 carcinoma, 1 hemangiosarcoma) and the fourth was from a cat suspected of having FIP based on cytologic examination of the effusion. However, no additional clinicopathological findings consistent with FIP were present in this cat and confirmatory tests were not carried out. Six of the 10 effusions had markedly increased ΔTNC (mean±SD=9.19±5.16; median=9.56; range=3.44–17.09) and all were from cats with clinicopathologic findings compatible with FIP, including positive immunohistochemical results for feline coronavirus and increased concentrations of acute phase proteins in serum and effusion (data not shown). 11 , 12 , 13 , 14 To further evaluate the cause of the high ΔTNC in samples from cats with FIP, we added a drop of effusion fluid from 1 cat with FIP to the BASO reagent in the same proportion used by the instrument (1:51, v:v). This resulted in sudden clotting of the fluid, causing a low to nondetectable TNCC (Figure 6).
Figure 6.
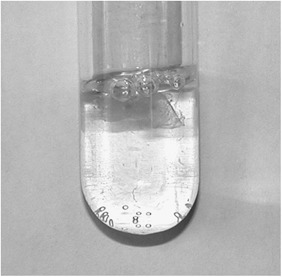
Addition of the BASO reagent to protein‐rich effusion fluid from a cat with confirmed feline infectious peritonitis resulted in the formation of a firm clot.
In 13/72 samples, the ΔTNC was below the reference interval for blood. Microscopic examination of these specimens revealed the presence of noncellular material such as glove powder and ultrasonographic gel in all 13 cases.
Concordance of Sysmex and cytologic diagnoses
Cytologic diagnoses were tabulated (Table 3). In addition to the main groups, 3 samples were classified as eosinophilic and 1 as hemorrhagic (samples only containing erythrocytes and scattered leukocytes). Hemorrhage was also found in 4 samples with increased inflammatory cells (3 samples) or neoplastic cells (1 sample); however, these were classified as reactive/inflammatory and neoplastic (carcinoma), respectively. Hemorrhagic and eosinophilic effusions did not have any particular pattern on the Sysmex.
Table 3.
Classification of effusions from 37 dogs and 35 cats using Sysmex results in a diagnostic algorithm vs the cytologic diagnosis.
| Interpretation of Sysmex Results Using a Diagnostic Algorithm | Consensus Diagnosis Based on Cytologic Findings | ||||||||
|---|---|---|---|---|---|---|---|---|---|
| Acellular (Inconclusive) | Reactive or Inflammatory | Chylous | FIP | Round Cell Neoplasia | Carcinoma/Mesothelioma | Eosinophilic | Hemorrhagic | Total | |
| Transudative | 1 | 5 | 1 | 0 | 1 | 0 | 0 | 0 | 8 |
| Reactive or inflammatory | 0 | 13 | 2 | 0 | 0 | 2 (carcinoma) | 1 | 1 | 19 |
| Chylous | 0 | 1 | 4 | 0 | 0 | 0 | 0 | 0 | 5 |
| FIP | 0 | 0 | 0 | 6 | 0 | 0 | 0 | 0 | 6 |
| Neoplastic (round cell) profile | 0 | 4 (1 mesothelial reactivity in pericardial fluid) | 1 | 0 | 10 | 2 (mesothelioma) | 2 | 0 | 19 |
| Neoplastic (epithelial/mesothelial) profile | 1 | 2 (mesothelial reactivity in pericardial fluid) | 0 | 0 | 1 | 9 | 0 | 0 | 13 |
| No consensus | 0 | 0 | 1 | 0 | 1 | 0 | 0 | 0 | 2 |
| Total | 2 | 25 | 9 | 6 | 13 | 13 | 3 | 1 | 72 |
Bolded numbers indicate concordant results. FIP Indicates feline infectious peritonitis.
Using the diagnostic algorithm, the 3 observers reached a consensus interpretation in 45/72 (62%) effusions, 1 observer was discordant in 25/72 (35%) effusions, and all observers were discordant in 2/72 (3%) effusions. Discordant interpretations were found in all effusion categories except acellular (transudative) effusions. The Cohen's κ coefficient for interobserver agreement using the diagnostic algorithm of Sysmex data was 0.69 (95% confidence interval [CI] 0.62–0.76).
When consensus classifications based on the algorithm of Sysmex data were compared with the diagnoses based on cytologic findings, complete concordance was found in 43/72 (60%) samples (Table 3). Classifications in 29/72 (40%) effusions were discordant, including 2/2 samples on which all observers were discordant using the algorithm and 9/25 cases on which 1 observer was discordant using the algorithm. In 4 of these 9 cases, cytologic findings were in agreement with the interpretation of the discordant observer. In 4/6 pericardial effusions, strongly reactive mesothelial cells were present, and in 3/4 of these cases (75%) a false diagnosis of neoplasia was made, based on the Sysmex scattergrams, where the cells were indistinguishable from carcinoma cells (Figure 7). The Cohen's κ coefficient for agreement between the diagnostic algorithm and cytologic classifications was 0.50 (95% CI=0.36–0.64).
Figure 7.
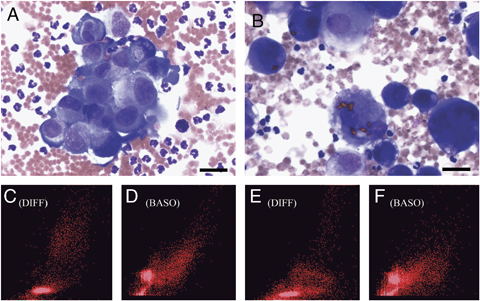
Comparison of automated and cytologic results from (A, C, D) thoracic fluid containing carcinoma cells and (B, E, F) pericardial fluid with reactive mesothelial cells from dogs. The cells are morphologically similar in both cases. The reactive mesothelial cells occasionally contain intracellular hematoidin crystals. (C, E) TNCC‐DIFF scattergrams contain a dispersed cell population close to the neutrophil region and scattered cells extending to the top of the scattergram, characteristic of neoplastic effusions. Both samples contain a large number of neutrophils (see Figure 1A), consistent with the high number of neutrophils seen in the cytologic samples. (D, F) TNCC‐BASO scattergrams have a pattern consistent with neoplastic effusions of epithelial or mesothelial origin (see Figure 2E). May‐Grünwald–Giemsa, bar=25 m. TNCC, total nucleated cell count.
Discussion
In the present study, we showed that analysis of effusions with the Sysmex XT‐2000iV is moderately reliable for the preliminary classification of effusions in dogs and cats, but should be followed by microscopic examination to verify the diagnosis. HCT and RBC count on the Sysmex were precise and accurate in both species, based on the CVs, linearity results, and a negligible LOD. Platelet counts were not evaluated in this study because they are not accurate in fluids other than blood due to the presence of cellular debris that can be erroneously counted as platelets by the instrument. 6
The TNCC is one of the main parameters used to classify an effusion. 1 In this study, the precision and linearity of TNCCs in effusion fluid were acceptable 15 except for samples from cats with FIP, which, based on evaluation of 1 sample, likely clotted when mixed with the BASO reagent. The clots were probably too large to be aspirated by the instrument; however, because analysis of these samples did not obstruct the machine or require particular cleaning procedures. However, clotting precludes evaluation of cell counts in the BASO channel, and DIFF counts are thus probably more accurate in these cases. We hypothesize that clotting resulted from a high content of fibrin and globulins in the effusions, characteristic of FIP. 3 , 12 , 13 , 16 In the present study, all 6 cases of FIP were correctly classified by the very high ΔTNC, suggesting this parameter may have high diagnostic specificity for FIP; however, this result should be confirmed and the cut‐off verified by further studies. A ΔTNC <1 was associated with the erroneous counting of noncellular particles as cells. These particles probably caused a falsely elevated count on the BASO channel, lowering the ΔTNC. The ΔTNC should thus be the first parameter to be evaluated during the analysis of data generated by the instrument. In samples with normal ΔTNCs, the Sysmex TNCCs were precise and accurate.
Comparison of the Sysmex with the Hemat 8 showed some statistical differences that were small and considered clinically insignificant. Overall, good agreement between the 2 methods was found. The proportional error for TNCC also was small and would be unlikely to affect clinical interpretation since a TNCC of >20,000/μL is generally associated with a pathologic condition. 1 , 2 , 3 The low LOD for TNCC indicates that samples with very low cell concentrations can be accurately counted.
The Sysmex was not able to provide accurate differential counts in the majority of samples such that these results were not included in analysis, nor were manual differential counts done on cytologic specimens to verify this. However, the quantification of cell populations in effusions has a secondary importance in classifying fluids, when compared with the TNCC and the identification of neoplastic cell populations. In addition, the Sysmex graphically displays the cells in scattergrams, which allows visual assessment of cell morphology, cellular density, and distribution of predominant cell types. Thus, scattergrams patterns rather than differential cell counts were used in the diagnostic algorithm, even though evaluation of scattergrams may be more subjective.
Leukocytes in effusions appear in a cytogram similar to leukocytes in peripheral blood, although effusions often have different relative cell numbers. For example, chylous effusions had a large cell population in the lymphocyte region of the TNCC‐DIFF scattergram and neoplastic round cells were found in a similar region of the TNCC‐BASO scattergrams as that where neoplastic lymphocytes are found in dogs with chronic lymphocytic leukemia. 17 A major problem was the presence of cells in effusions that are not usually found in blood, such as mesothelial and epithelial cells. Reactive mesothelial cells and neoplastic epithelial cells resulted in similar scattergrams characterized by widely dispersed cells in the region where voluminous cells having high nucleic acid content would be expected (region of intense fluorescence DIFF signal and a high forward scatter BASO signal). Thus, the scattergrams did not allow us to differentiate between carcinoma cells and reactive mesothelial cells, similar to what was reported in a previous study with the ADVIA 120. 8 This was not surprising since the morphology of these cells is often similar. 18
To facilitate the interpretation of information generated by the Sysmex XT‐2000iV we designed a diagnostic algorithm based on evaluation of numerical data and subjective assessment of the scattergrams. Application of this algorithm provided highly repeatable results and substantial interobserver concordance. 10 In only 10 samples did discordance between observers result in a false positive or false negative diagnosis of neoplasia. When the consensus interpretation of Sysmex data was compared with the consensus interpretation of cytologic findings, moderate concordance (60%) was found. 10
A limitation of the study was that the cytologic classification was based only on the morphology of the cells, ie, the cytopathologists were not provided any other data from the sample (ie, color and turbidity, total protein concentration, TNCC). These data usually are essential for classifying effusions and would have provided a “gold standard” for comparison with the Sysmex; however, the focus of this study was on cell type and morphology. Lack of biochemical and macroscopic data likely resulted in many of the discrepancies between the diagnosis based on cytologic findings and the Sysmex data, for example, in identifying chylous effusions. Similarly, discrepancies between automated and microscopic classification of transudates and reactive/inflammatory conditions likely resulted from lack of knowledge of the TNCC by the cytopathologist rather than from true misclassification.
Misclassification of neoplastic effusions by the Sysmex (eg, round cell vs other neoplasia) was considered to be a minor problem because after a preliminary automated classification of “neoplasia,” the type of neoplasia subsequently can be determined by the cytopathologist. In contrast, the clinical consequences of completely discordant diagnoses (eg, inflammation vs neoplasia) could be severe. Cytology is highly specific but not very sensitive for the diagnosis of malignancies in effusions. 19 Thus, the cytologic identification of neoplastic cells supports a diagnosis of neoplasia even in cases where the Sysmex results are not consistent with neoplasia. By contrast, the lack of identification of neoplastic cells in effusions characterized by “neoplastic scattergrams” does not exclude the possibility of neoplasia. Finally, the scattergrams did not correctly classify eosinophilic effusions, likely because cells corresponding to eosinophils were masked by other cells in the scattergrams.
In conclusion, we demonstrated in the present study that the Sysmex XT‐2000iV is precise and accurate for the determination of TNCC, HCT, and RBC count in effusions from dogs and cats. The ΔTNC may provide important information about the protein content of the effusion, with a ΔTNC of >3.0 supporting a diagnosis of FIP. Using a diagnostic algorithm, good interobserver agreement and moderate concordance with the cytologic diagnosis were obtained. In most cases, discrepancies between automated and cytologic results could be resolved with additional information about the effusions, such as macroscopic features and protein concentration. Nevertheless, the instrument was unable to identify eosinophils and in some cases, neoplastic cells, that were detected microscopically. Therefore, automated analysis of effusions with the Sysmex XT‐2000iV can be a valuable, fast, and simple screening tool for effusions, but is not a substitute for microscopic examination.
Acknowledgments
The authors thanks Dr. Tanja Tornow from Sysmex Europe, to Dr. Marco Fontana and Dr. Monia Farina from Dasit S.p.A. for their technical assistance and to Ms. Sara Vaccarezza for her collaboration.
References
- 1. Shelly SM. Body cavity fluids In: Raskin RE, Meyer DJ, eds. Atlas of Canine and Feline Cytology. Philadelphia, PA: W.B. Saunders; 2001:187–206. [Google Scholar]
- 2. Conner BD, Lee YC, Branca P, et al Variations in pleural fluid WBC count and differential counts with different sample containers and different methods. Chest. 2003;123:1181–1187. [DOI] [PubMed] [Google Scholar]
- 3. Cowell RL, Tyler RD, Meinkoth JH. Diagnostic Cytology and Hematology of the Dog and Cat. 2nd ed St. Louis, MO: Mosby; 1998:142–158. [Google Scholar]
- 4. Kresie L, Benavides D, Bollinger P, et al Performance evaluation of the application of body fluids on the Sysmex XE‐2100 series automated hematology analyzer. Lab Hematol. 2005;11:24–30. [PubMed] [Google Scholar]
- 5. De Jonge R, Brouwer R, Van Rijn M, et al Automated analysis of pleural fluid total and differential leukocyte counts with the Sysmex XE‐2100. Clin Chem Lab Med. 2006;44:1367–1371. [DOI] [PubMed] [Google Scholar]
- 6. Sysmex Corporation. Sysmex XT2000iV Operating Manual. Kobe, Japan: Sysmex Corporation; 2006. [Google Scholar]
- 7. Lilliehook I, Tvedten H. Evaluation of the Sysmex XT‐2000iV hematology system for use with canine, feline and equine hematology testing [abstract]. Vet Clin Pathol. 2006;35:474. [Google Scholar]
- 8. Bauer N, Moritz A. Flow cytometric analysis of effusions in dogs and cats with the automated haematology analyser ADVIA 120. Vet Rec. 2005;156:674–678. [DOI] [PubMed] [Google Scholar]
- 9. Solberg HE, Lahti A. Detection of outliers in reference distributions: performance of Horn's algorithm. Clin Chem. 2005;51:2326–2332. [DOI] [PubMed] [Google Scholar]
- 10. Landis JR, Koch GG. The measurement of observer agreement for categorical data. Biometrics. 1977;33:159–174. [PubMed] [Google Scholar]
- 11. Sparkes AH, Gruffydd‐Jones TJ, Harbour DA. Feline infectious peritonitis: a review of clinicopathological changes in 65 cases, and a critical assessment of their diagnostic value. Vet Rec. 1991;129:209–212. [DOI] [PubMed] [Google Scholar]
- 12. Hartmann K. Feline infectious peritonitis. Vet Clin North Am Small Anim Pract. 2005;35:39–79. [DOI] [PMC free article] [PubMed] [Google Scholar]
- 13. Bence LM, Addie DD, Eckersall PD. An immunoturbidimetric assay for rapid quantitative measurement of feline alpha‐1‐acid glycoprotein in serum and peritoneal fluid. Vet Clin Pathol. 2005;34:335–341. [DOI] [PubMed] [Google Scholar]
- 14. Paltrinieri S, Giordano A, Tranquillo V, Guazzetti S. Critical assessment of the diagnostic value of feline α1‐acid glycoprotein for feline infectious peritonitis using likelihood ratios approach. J Vet Diag Invest. 2007;19:266–272. [DOI] [PubMed] [Google Scholar]
- 15. Ricos C, Alvarez V, Cava F, et al Current databases on biological variation: pros, cons and progress. Scand J Clin Lab Invest. 1999;59:491–500. [DOI] [PubMed] [Google Scholar]
- 16. Hartmann K, Binder C, Hirschberger J, et al Comparison of different tests to diagnose feline infectious peritonitis. J Vet Int Med. 2003;17:781–790. [DOI] [PMC free article] [PubMed] [Google Scholar]
- 17. Gelain ME, Rossi G, Paltrinieri S. Use of Sysmex XT‐2000iV hematology analyser to identify hematopoietic neoplasms in dogs [abstract]. Vet Clin Pathol. 2007;36:385–386. [Google Scholar]
- 18. Stepien RL, Whitley NT, Dubielzig RR. Idiopathic or mesothelioma‐related pericardial effusion: clinical findings and survival in 17 dogs studied retrospectively. J Small Anim Pract. 2000;41:342–347. [DOI] [PubMed] [Google Scholar]
- 19. Hirschberger J, DeNicola DB, Hermanns W, Kraft W. Sensitivity and specificity of cytologic evaluation in the diagnosis of neoplasia in body fluids from dogs and cats. Vet Clin Pathol. 1999;28:142–146. [DOI] [PubMed] [Google Scholar]


