

SUMMARY
Genome-wide CRISPR screens enable systematic interrogation of gene function. However, guide RNA libraries are costly to synthesize, and their limited diversity compromises the sensitivity of CRISPR screens. Using the Streptococcus pyogenes CRISPR-Cas adaptation machinery, we developed CRISPR adaptation-mediated library manufacturing (CALM), which turns bacterial cells into “factories” for generating hundreds of thousands of crRNAs covering 95% of all targetable genomic sites. With an average gene targeted by more than 100 distinct crRNAs, these highly comprehensive CRISPRi libraries produced varying degrees of transcriptional repression critical for uncovering novel antibiotic resistance determinants. Furthermore, by iterating CRISPR adaptation, we rapidly generated dual-crRNA libraries representing more than 100,000 dual-gene perturbations. The polarized nature of spacer adaptation revealed the historical contingency in the stepwise acquisition of genetic perturbations leading to increasing antibiotic resistance. CALM circumvents the expense, labor, and time required for synthesis and cloning of gRNAs, allowing generation of CRISPRi libraries in wild-type bacteria refractory to routine genetic manipulation.
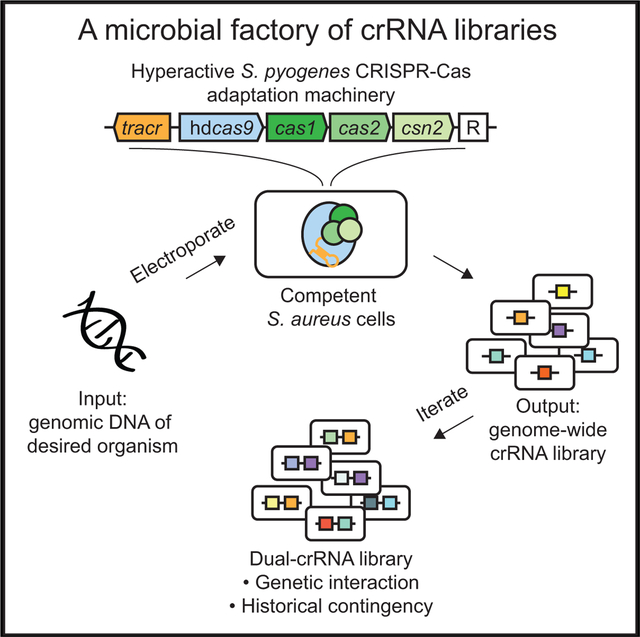
Graphical Abstract
In Brief
Taking advantage of the natural CRISPR adaptation machinery allows for the production of highly comprehensive combinatorial guide RNA libraries in bacterial “factories.”
INTRODUCTION
Functional genetic screens help elucidate the genetic basis of cellular and organismal phenotypes. Recent advances in CRISPR-Cas technology have led to a wealth of discoveries in diverse prokaryotic (Lee et al., 2019; Peters et al., 2016; Rousset et al., 2018; Wang et al., 2018) and eukaryotic systems (Bassett et al., 2015; Gilbert et al., 2014; Sanson et al., 2018; Shalem et al., 2014; Sidik et al., 2016; Wang et al., 2014) by facilitating genome-wide mutation, transcriptional repression (CRISPRi) and activation (CRISPRa). To date, the most widely used CRISPR-Cas technology is the S. pyogenes Cas9 system (Deltcheva et al., 2011). By changing the sequence of a short guide RNA (gRNA) that associates with it, Cas9, the endonuclease, can be easily programmed to cleave any genetic sequence with a protospacer-adjacent motif (PAM), NGG (Jinek et al., 2012). Similarly, a catalytically inactive version of the endonuclease (dCas9) can sterically hinder transcription at these PAM-containing sites that match the targeting gRNAs (Bikard et al., 2013; Qi et al., 2013). The high occurrence of NGG in genomes allows the CRISPR-Cas technology to cleave or bind virtually any genetic locus of interest, achieving sequence-specific genome editing or transcriptional perturbation, respectively.
The simplicity of programming CRISPR-Cas has paved the way for interrogating gene function on a genome-wide scale (Sanjana, 2017). Currently, genome-wide CRISPR libraries are generated by designing multiple gRNAs targeting each gene and synthesizing them in array-based oligonucleotide pools. However, these libraries are costly and contain many faulty guides because our knowledge of molecular rules governing gRNA efficacy is incomplete. Consequently, most genome-wide libraries accommodate 10 or fewer functional gRNAs per gene (Figure S1A and references therein), resulting in limited genome coverage that severely compromises the sensitivity of CRISPR screens.
To address this challenge, we re-purposed the S. pyogenes CRISPR-Cas adaptation machinery as a “factory” to turn externally supplied DNA into hundreds of thousands of unique CRISPR RNAs (crRNAs) in bacteria (Figure 1A). CRISPR-Cas was first discovered in bacteria as an adaptive immune system that utilizes short RNAs to guide degradation of viral DNA (Barrangou et al., 2007). In addition to sequence specificity, a hall-mark of the immune system is spacer adaptation (McGinn and Marraffini, 2019; Sternberg et al., 2016), a process in which the CRISPR machinery integrates foreign DNA, such as fragmented phage DNA, into the associated spacer repeat array, the precursor to crRNAs (Figure S1B). For the S. pyogenes CRISPR-Cas system, the spacer is typically 30–31 nt long, and the processed crRNA contains a 20-nt target-recognizing sequence derived from the spacer and a partial repeat sequence (Figure S1C). For the sake of simplicity, we will here use “spacer” and “crRNA” interchangeably. In addition, the canonical crRNA needs to base-pair with another small RNA, called a trans-activating CRISPR RNA (tracrRNA), for proper processing and targeting (Deltcheva et al., 2011), whereas gRNAs, sometimes referred to as single gRNAs (sgRNAs), are an engineered single RNA species that combines the functional and structural features of both crRNA and tracrRNA (Figure S1C).
Figure 1. A Microbial Factory: Generation of Genome-wide crRNA Libraries by CRISPR-Cas Adaptation.
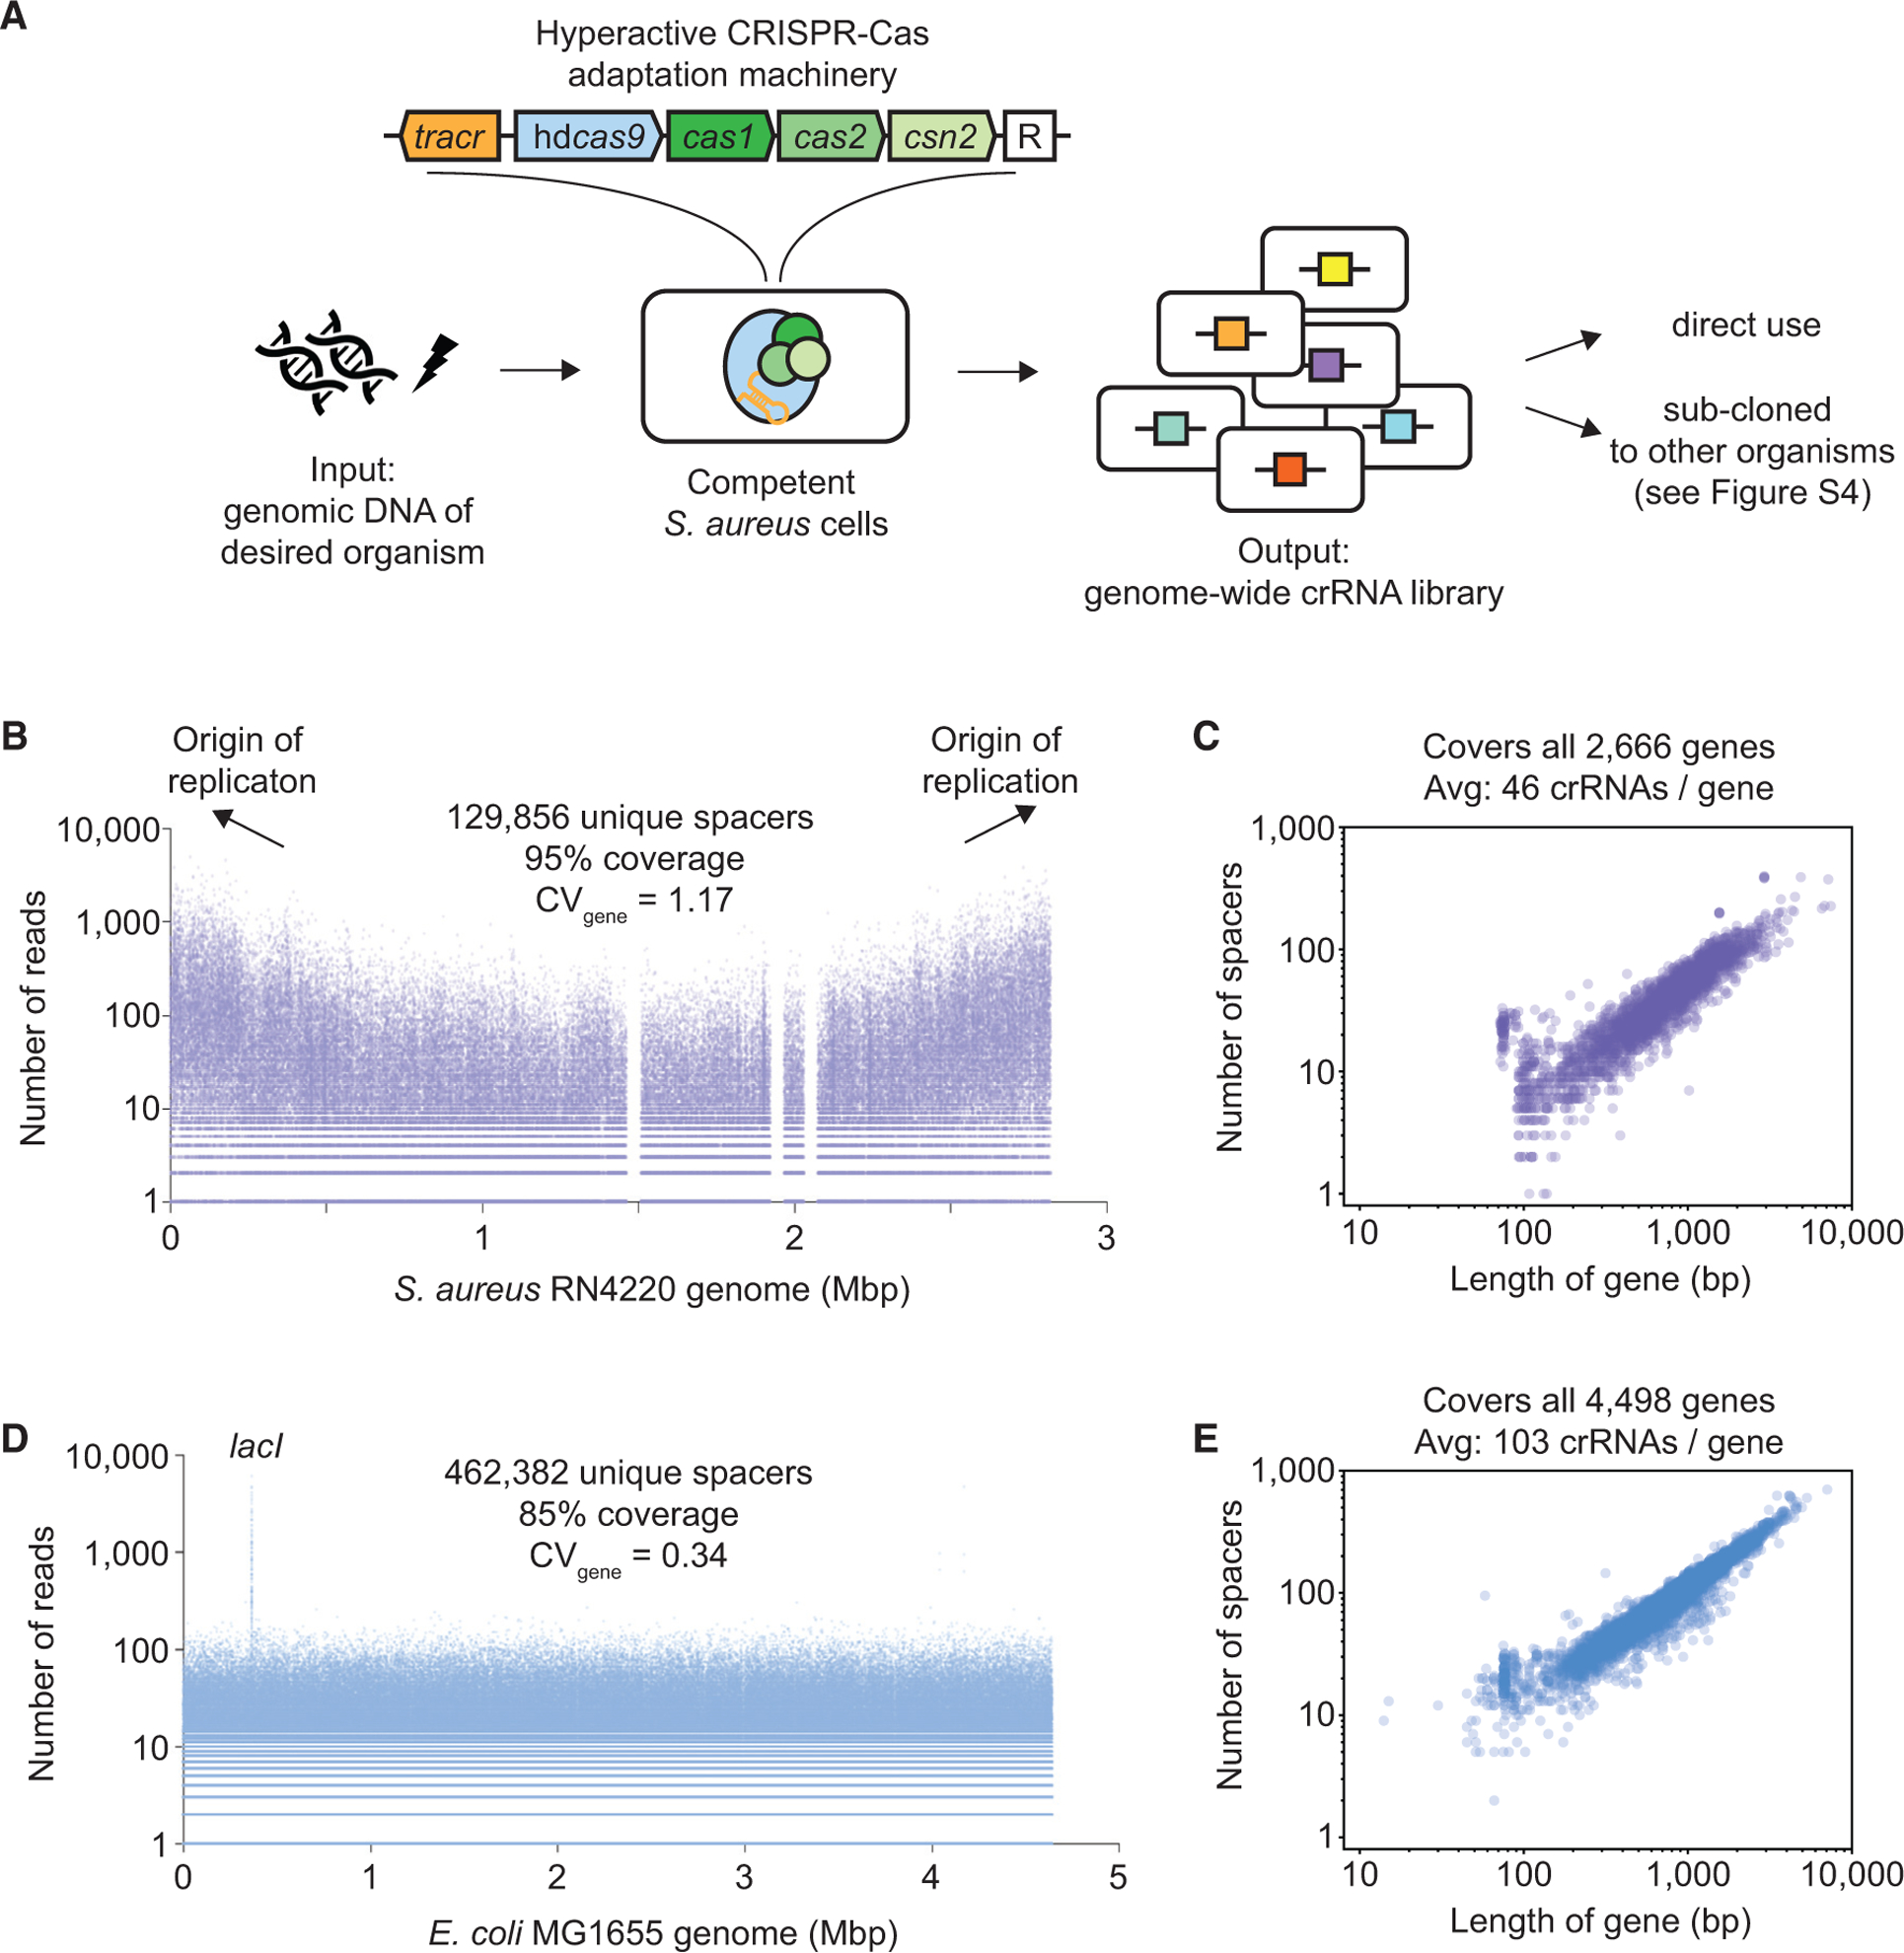
(A) CRISPR adaptation-mediated library manufacturing (CALM). A hyperactive CRISPR-Cas adaptation machinery consists of the 89-nt tracrRNA, hdCas9, Cas1, Cas2, and Csn2. New spacers are integrated into the empty CRISPR array, denoted as “R.” To generate a diverse crRNA library, sheared genomic DNA is electroporated into competent S. aureus cells harboring the adaptation machinery.
(B) A crRNA library was generated by electroporating S. aureus RN4220 genomic DNA as described in (A). The number of reads and location of all 129,856 sequenced spacers matching the genome are shown. The genome contains 136,928 PAMs. Three gap regions correspond to prophages present in the NCBI reference genome (NCTC8325) but missing in RN4220.
(C) Number of spacers mapped to each of all 2,666 annotated genes in S. aureus RN4220 versus gene length.
(D) A crRNA library was generated by electroporating E. coli MG1655 genomic DNA as described in Figure S4A. The number of reads and location of all 462,382 sequenced spacers matching the genome are shown. The genome contains 542,073 PAMs. lacI was preferentially enriched because of an additional presence of the gene in a helper plasmid, pCCC (Figure S4A).
(E) Number of spacers mapped to each of all 4,498 annotated genes in E. coli MG1655 versus gene length.
By externally supplying genomic DNA of interest to Staphylococcus aureus cells harboring hyperactive CRISPR-Cas adaptation machinery (Heler et al., 2017), we generated near-saturating genome-wide crRNA libraries in bacteria with an average gene covered by up to 100 crRNAs. These libraries can be directly used in S. aureus or sub-cloned into other organisms (Figure 1A). Importantly, because this comprehensive pool of crRNAs produced varying degrees of transcriptional repression and significantly raised statistical power, it allowed us to survey a broad fitness landscape, including the mild suppression of essential genes. We discovered novel pathways contributing to antibiotic sensitivity that would have been missed by conventional gRNA libraries with much lower diversity. Furthermore, by iterating the CRISPR-Cas adaptation process, we rapidly constructed an economical dual-spacer library that represented more than 100,000 dual-gene perturbations, identifying pairwise perturbations that strengthened antibiotic resistance. Critically, polarized spacer adaptation, a feature absent in conventional dual-gRNA libraries, revealed how historical contingency among these 1perturbations could constrain adaptive evolution.
We termed this highly efficient, low-cost, and portable technology CRISPR adaptation-mediated library manufacturing (CALM). CALM can generate highly comprehensive genome-wide crRNA libraries with standard lab equipment in as little as 1 day (Figure S2A). Circumventing tedious cloning and transformation steps, CALM allowed us to directly generate diverse crRNA libraries in a few wild-type bacterial strains, including methicillin-resistant S. aureus (MRSA). This is a critical advance because restriction modification and low transformation efficiency render many wild-type species extremely difficult to genetically manipulate. We also demonstrate that CALM is portable, generating genome-wide libraries that could be easily sub-cloned into other microbes, such as Escherichia coli.
RESULTS
Rapid Generation of Genome-wide crRNA Libraries Using Hyperactive CRISPR-Cas Adaptation Machinery
In their seminal study, Levy and colleagues discovered that DNA breaks promote spacer adaptation in the type I E. coli CRISPR-Cas system (Levy et al., 2015). We hypothesized that fragmented DNA may, in general, be a preferred substrate for the CRISPR adaptation machinery—a potential factory for production of crRNA libraries. To test this hypothesis, we employed the type II S. pyogenes CRISPR-Cas adaptation machinery (Heler et al., 2015), which includes a single CRISPR repeat, the minimal tracrRNA (89 nt) required for targeting (Deltcheva et al., 2011), and all four cas genes (Figures 1A and S2A), including hyperdead Cas9 (hdCas9), a nuclease-dead Cas9 variant that enables hyperactive spacer adaptation (Heler et al., 2017). We overexpressed these components in S. aureus RN4220 (Nair et al., 2011), supplied cells with sheared genomic DNA by electroporation, and tested whether they could be “transformed” into functional spacers. Using enrichment primers (Figure S2B) developed previously (Heler et al., 2015), our PCR assay detected that the hyperactive adaption system allowed 0.1%–1% of the cell population to acquire a single spacer (Figure S2C). Given that bacterial cultures at exponential phase contain ~108 cells/mL, creating a diverse crRNA library that covers the entire genome is straightforward in principle.
Deep sequencing of the adapted spacers confirmed that CALM generated comprehensive genome-wide crRNA libraries with many desired properties. In our most optimized protocol, in which we induced CRISPR adaptation during re-growth (Figure S2A), 91% of all adapted spacers matched the host chromosome (Lib-2 in Figure S2D). The great majority of chromosomal spacers had the correct NGG PAM (Figure S2E) and were of the same length as canonical spacers (i.e., 30 or 31 nt; Figure S2F). Our protocol involving competent cell preparation at room temperature, and inducible expression of CRISPR adaptation (Cas1, Cas2, and Csn2) only at re-growth was critical for creating a diverse library (Figure S2A; STAR Methods). For instance, although adaptation occurred in as many as 21% of the population using a constitutively expressed CRISPR machinery, the great majority of the spacers were derived from helper plasmids (Figures S3A–S3C).
Because both spacer adaptation and CRISPR targeting rely on the presence of PAMs (Mojica et al., 2009), the maximum number of targetable sites in a given genome is equal to the total number of PAMs within it. Given that there are 136,928 PAMs (i.e., NGG) in the S. aureus RN4220 genome, Lib-4, the library we sequenced the deepest (~25 million reads), contained at least 129,856 unique chromosomal spacers (Table S1A), representing 95% of all targetable sites in the genome (Figure 1B). All 2,666 annotated genes were targeted by at least one spacer (Figure 1C). Enrichment PCR primers and downstream size exclusion steps ensured that the majority of sequenced reads contained one spacer (Figure S2A) so that 7–25 million sequencing reads provided sufficient coverage for libraries of this scale.
The S. aureus crRNA libraries generated by CALM had a bias toward the origin of replication (Ori) (Figure 1B), suggesting that the replicating genomic DNA inside the cell may compete with externally supplied DNA for CRISPR adaptation. Indeed, upon electroporating E. coli genomic DNA, we observed that only 17% of the spacers were mapped to its genome (Figure S3E), whereas the great majority (78%) belonged to S. aureus with a similar bias toward Ori (Figure S3F).
With the goal to turn S. aureus into a biofactory that generates comprehensive crRNA libraries for any organism of interest (Figure 1A), we restored the catalytic activity of Cas9 (Figure S4A), reasoning that cells that adapt spacers matching the internal S. aureus DNA would die because of chromosomal cleavage. Sure enough, when electroporated with E. coli DNA, 90% of the spacers were mapped to its genome (Figure S4B) with no apparent bias toward Ori (Figure 1D). With 462,382 unique spacers (of 542,073 targetable sites; Table S1B), our E. coli library was more uniform (CVgene = 0.34) and diverse, covering all 4,498 genes with an average gene targeted by 103 spacers (Figures 1D and 1E). Finally, we constituted a functional genome-wide CRISPRi system by successfully sub-cloning 90% of these spacers into E. coli harboring an inducible dCas9 (Figure S4A).
In principle, this strategy can be extended to other bacterial species as long as the sub-cloned library can be efficiently horizontally transferred (i.e., transformation, transduction, and conjugation). In cases where horizontal transfer efficiency is low, such as wild-type species, the preferred strategy would be to directly express the CRISPR adaptation machinery in them, as demonstrated in S. aureus RN4220. Indeed, strong adaptation events have been observed in wild-type, hard-to-transform S. aureus strains (Monk et al., 2012, 2015) harboring the adaptation machinery when electroporated with genomic DNA (Figure S2C). Because the majority of adapted spacers were derived from internal genomic DNA (Figure S3E), we reasoned that our protocol can be further simplified by omitting the introduction of external DNA. This was validated by performing CALM in wild-type S. aureus MW2, a MRSA strain (Figure 2A). Cells were electroporated with either external DNA or a water control (Figure 2B). As revealed by sequencing, these crRNA libraries covered 63% and 55% of all targetable sites (Figure 2E; Table S1C), respectively, lower than libraries made in RN4220 (85%) that were sequenced at a similar depth. Nevertheless, this library covered all but three genes in MW2 (Figure 2F). Interestingly, we found that CRSIPR adaptation was below detection in cells that were merely induced with isopropyl β-d-1-thiogalactopyranoside (IPTG) (Figures 2B and 2C). Therefore, the competent cell-making and/or electroporation steps seemed to be critical for strong CRISPR adaptation. Last, we also detected mild adaptation events when we cloned the CRISPR-Cas machinery into E. coli (Figure S4C), suggesting general applicability of CALM in other bacteria. Because the CRISPR machinery is Gram positive in origin, codon optimization may be necessary for optimal activity. Altogether, these results strongly suggest that CALM can be used in many genetically recalcitrant bacterial species to unravel the genetic basis of various basic and clinically relevant traits.
Figure 2. Generation of crRNA Libraries in Hard-to-Transform Wild-Type S. aureus.
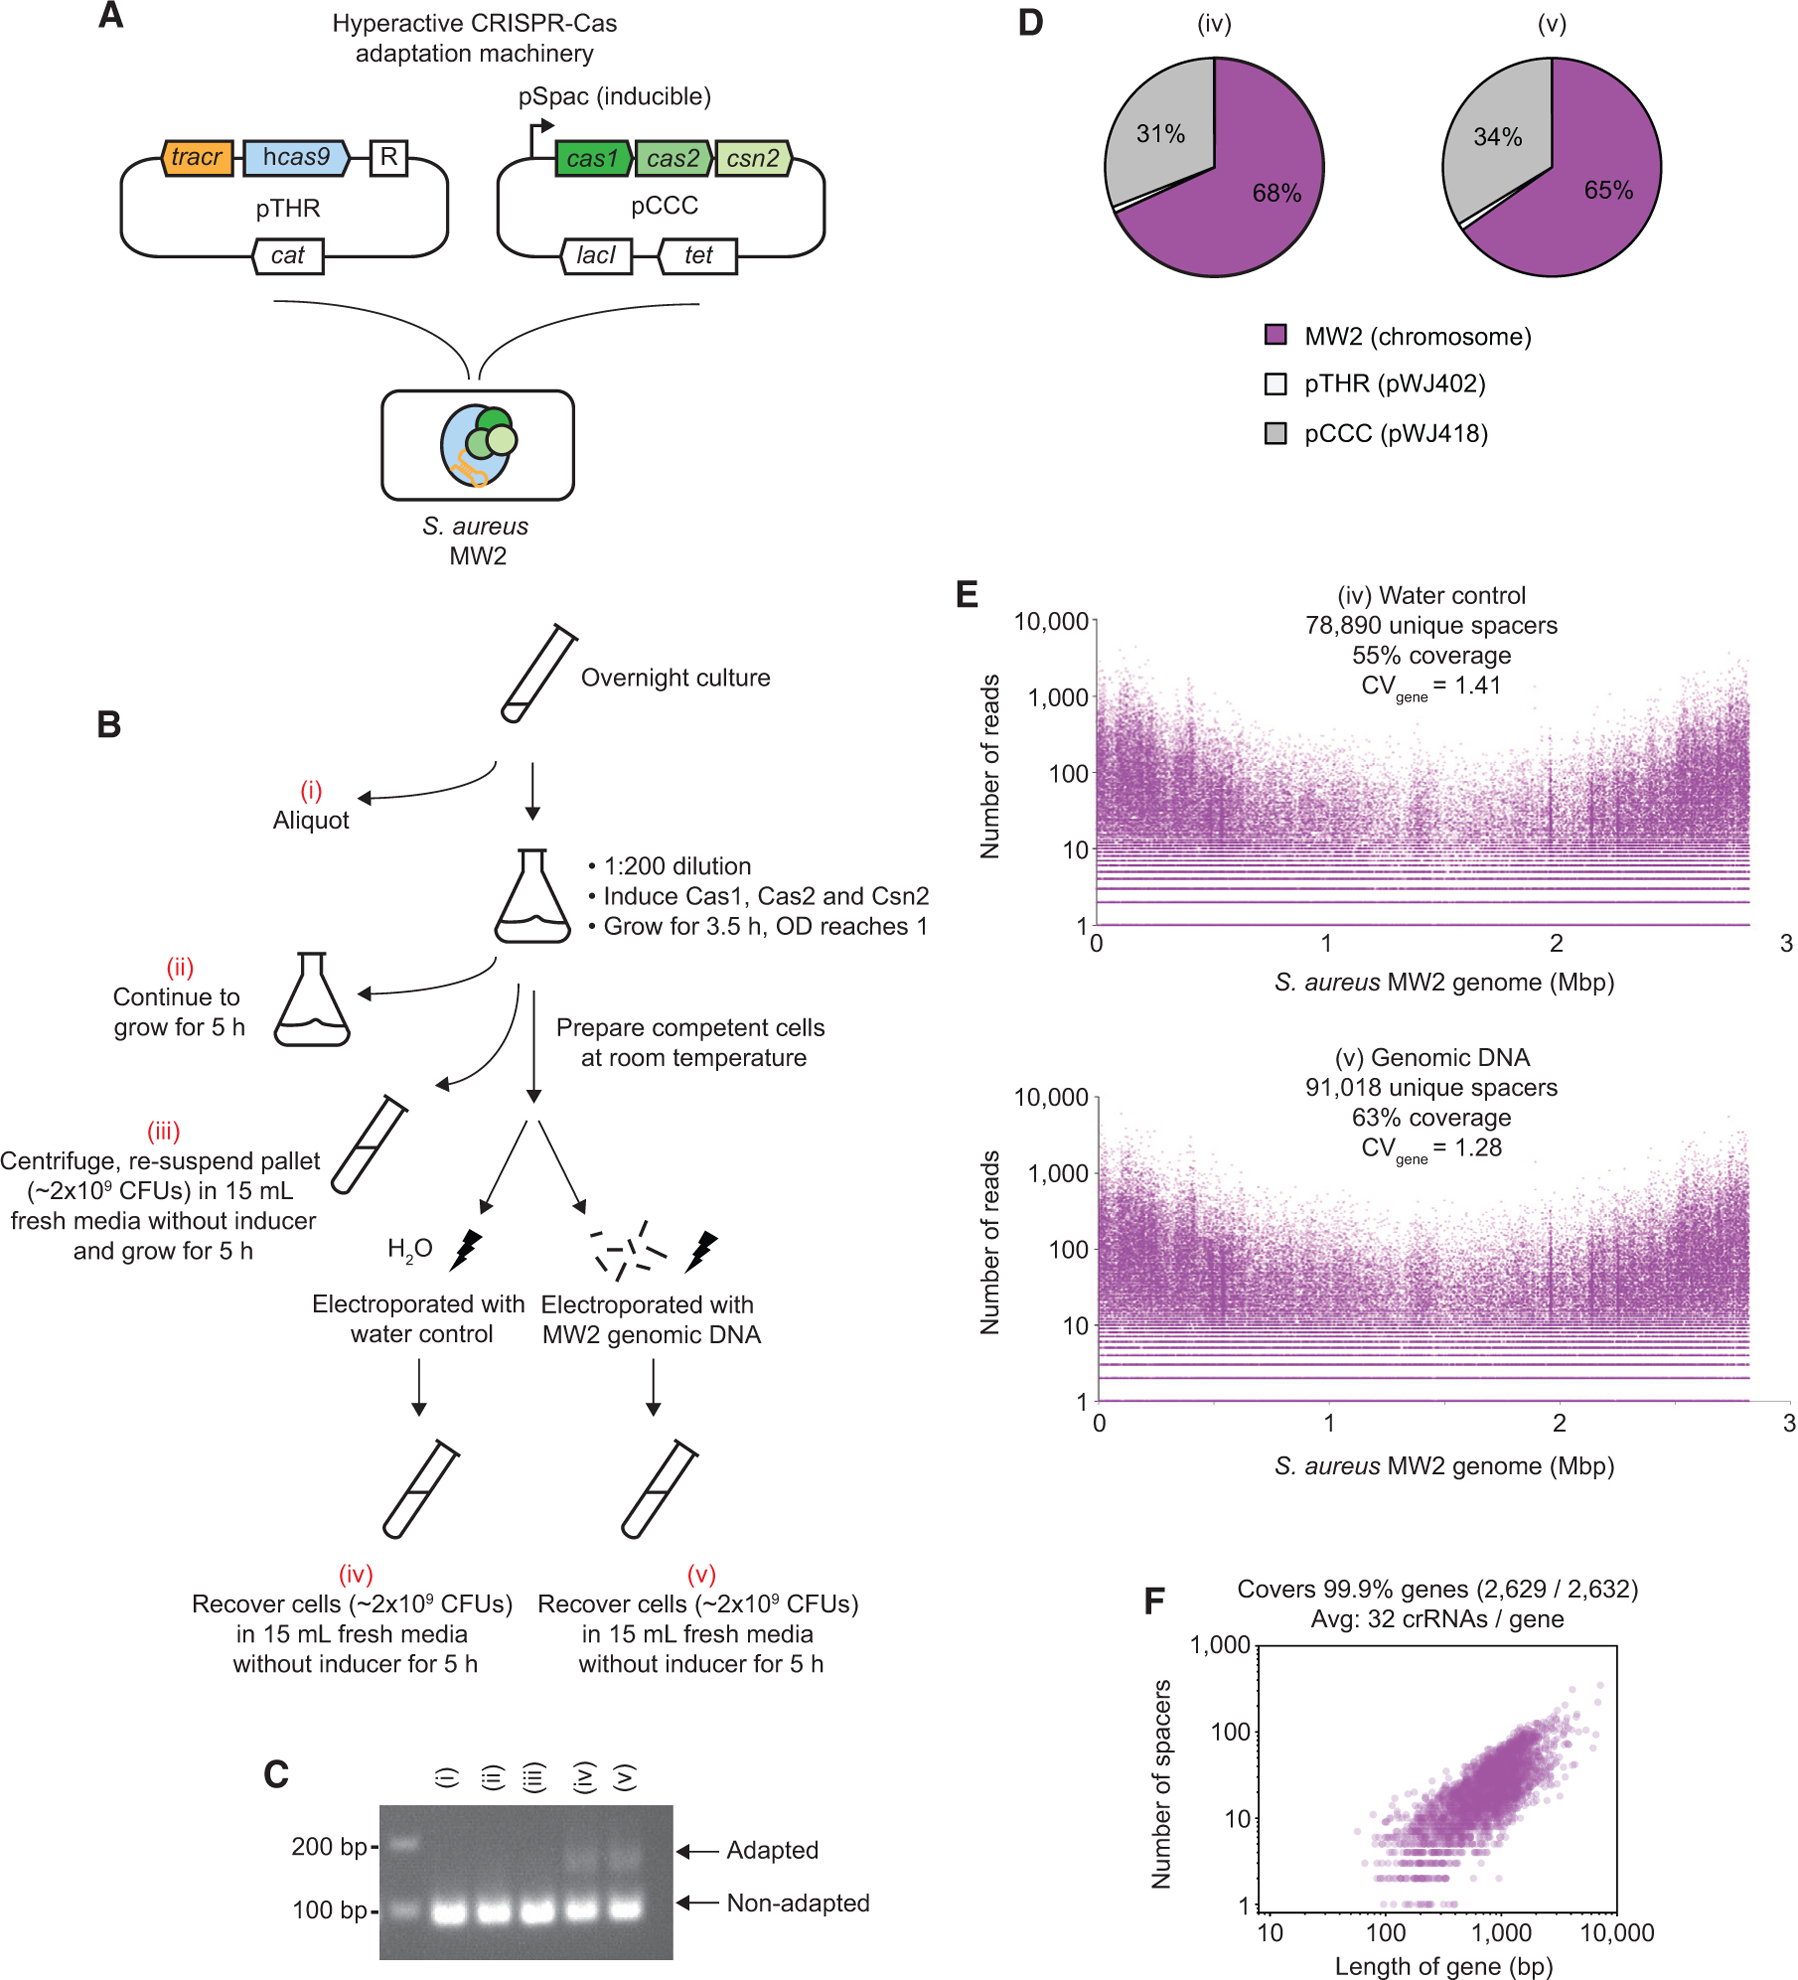
(A) Wild-type S. aureus MW2 (MRSA) harboring hyperactive CRISPR-Cas adaptation machinery carried by two plasmids, pTHR and pCCC.
(B) Schematic of generating genome-wide crRNA libraries in wild-type S. aureus MW2. Overnight cells harboring the two plasmids in (A) were aliquoted to obtain sample (i). The rest were diluted 1:200 in a separate flask with fresh medium containing IPTG to induce expression of Cas1, Cas2, and Csn2 and grown until the optical density 600 (OD600) reached 1.0 (~3.5 h). Cells were split into three parts. The first part was left to continue to grow for 5 h, obtaining sample (ii). The second part was centrifuged, and the pellet (~2 × 10⁹ colony-forming units [CFUs]) was re-suspended in 15 mL fresh medium without IPTG and grown for 5 h, obtaining sample (iii). The third part was used to prepare competent cells at room temperature. Competent cells were electroporated with a water control or MW2 genomic DNA. These cells (~2 × 10⁹ CFUs) were recovered in 15 mL fresh medium without IPTG for 5 h, obtaining samples (iv) and (v), respectively. All five samples were lysed, miniprepped, and subjected to enrichment PCR analysis.
(C) All five samples prepared from (B) were subjected to PCR with enrichment primers (W1201–W1204). 2% agarose gel was used to resolve the upper (~163 bp) and lower (97 bp) bands corresponding to the adapted and non-adapted CRISPR arrays, respectively.
(D) Samples (iv) and (v) were subjected to deep sequencing, which revealed the spacer origin. Spacers were derived from either the host chromosome or two helper plasmids.
(E) Top: a crRNA library was generated by electroporating a water control; sample (iv). The number of reads and location of all 78,890 sequenced spacers matching the genome are shown. Bottom: the same as the top except the crRNA library was generated by electroporating MW2 genomic DNA; sample (v). The MW2 genome contains 143,935 PAMs.
(F) Number of spacers mapped to 2,629 of the 2,632 annotated genes in S. aureus MW2 versus gene length in sample (v).
Highly Comprehensive CRISPRi Libraries Identify Known and Novel Pathways of Aminoglycoside Sensitivity
To explore the utility of CALM, we treated three S. aureus RN4220 CRISPRi libraries with sub-lethal concentrations of gentamicin and uncovered known and novel pathways contributing to aminoglycoside sensitivity (Figure 3A). For each replicate, the fitness effect of each crRNA under antibiotic exposure was determined by its enrichment/depletion relative to the six unselected libraries using the Z score (Girgis et al., 2007), with Z scores of all individual crRNAs targeting a gene averaged into Mean-Z (STAR Methods). As a result, genes involved in oxidative phosphorylation (qoxABCD) and heme biosynthesis (ctaB) had the highest Mean-Zs (Figure S5A), consistent with the established body of work that disruption of the electron transport chain (ETC) changes the membrane potential and reduces uptake of aminoglycosides (Girgis et al., 2009; Taber et al., 1987).
Figure 3. Genome-wide crRNA Libraries Identify Known and Novel Pathways of Aminoglycoside Sensitivity.
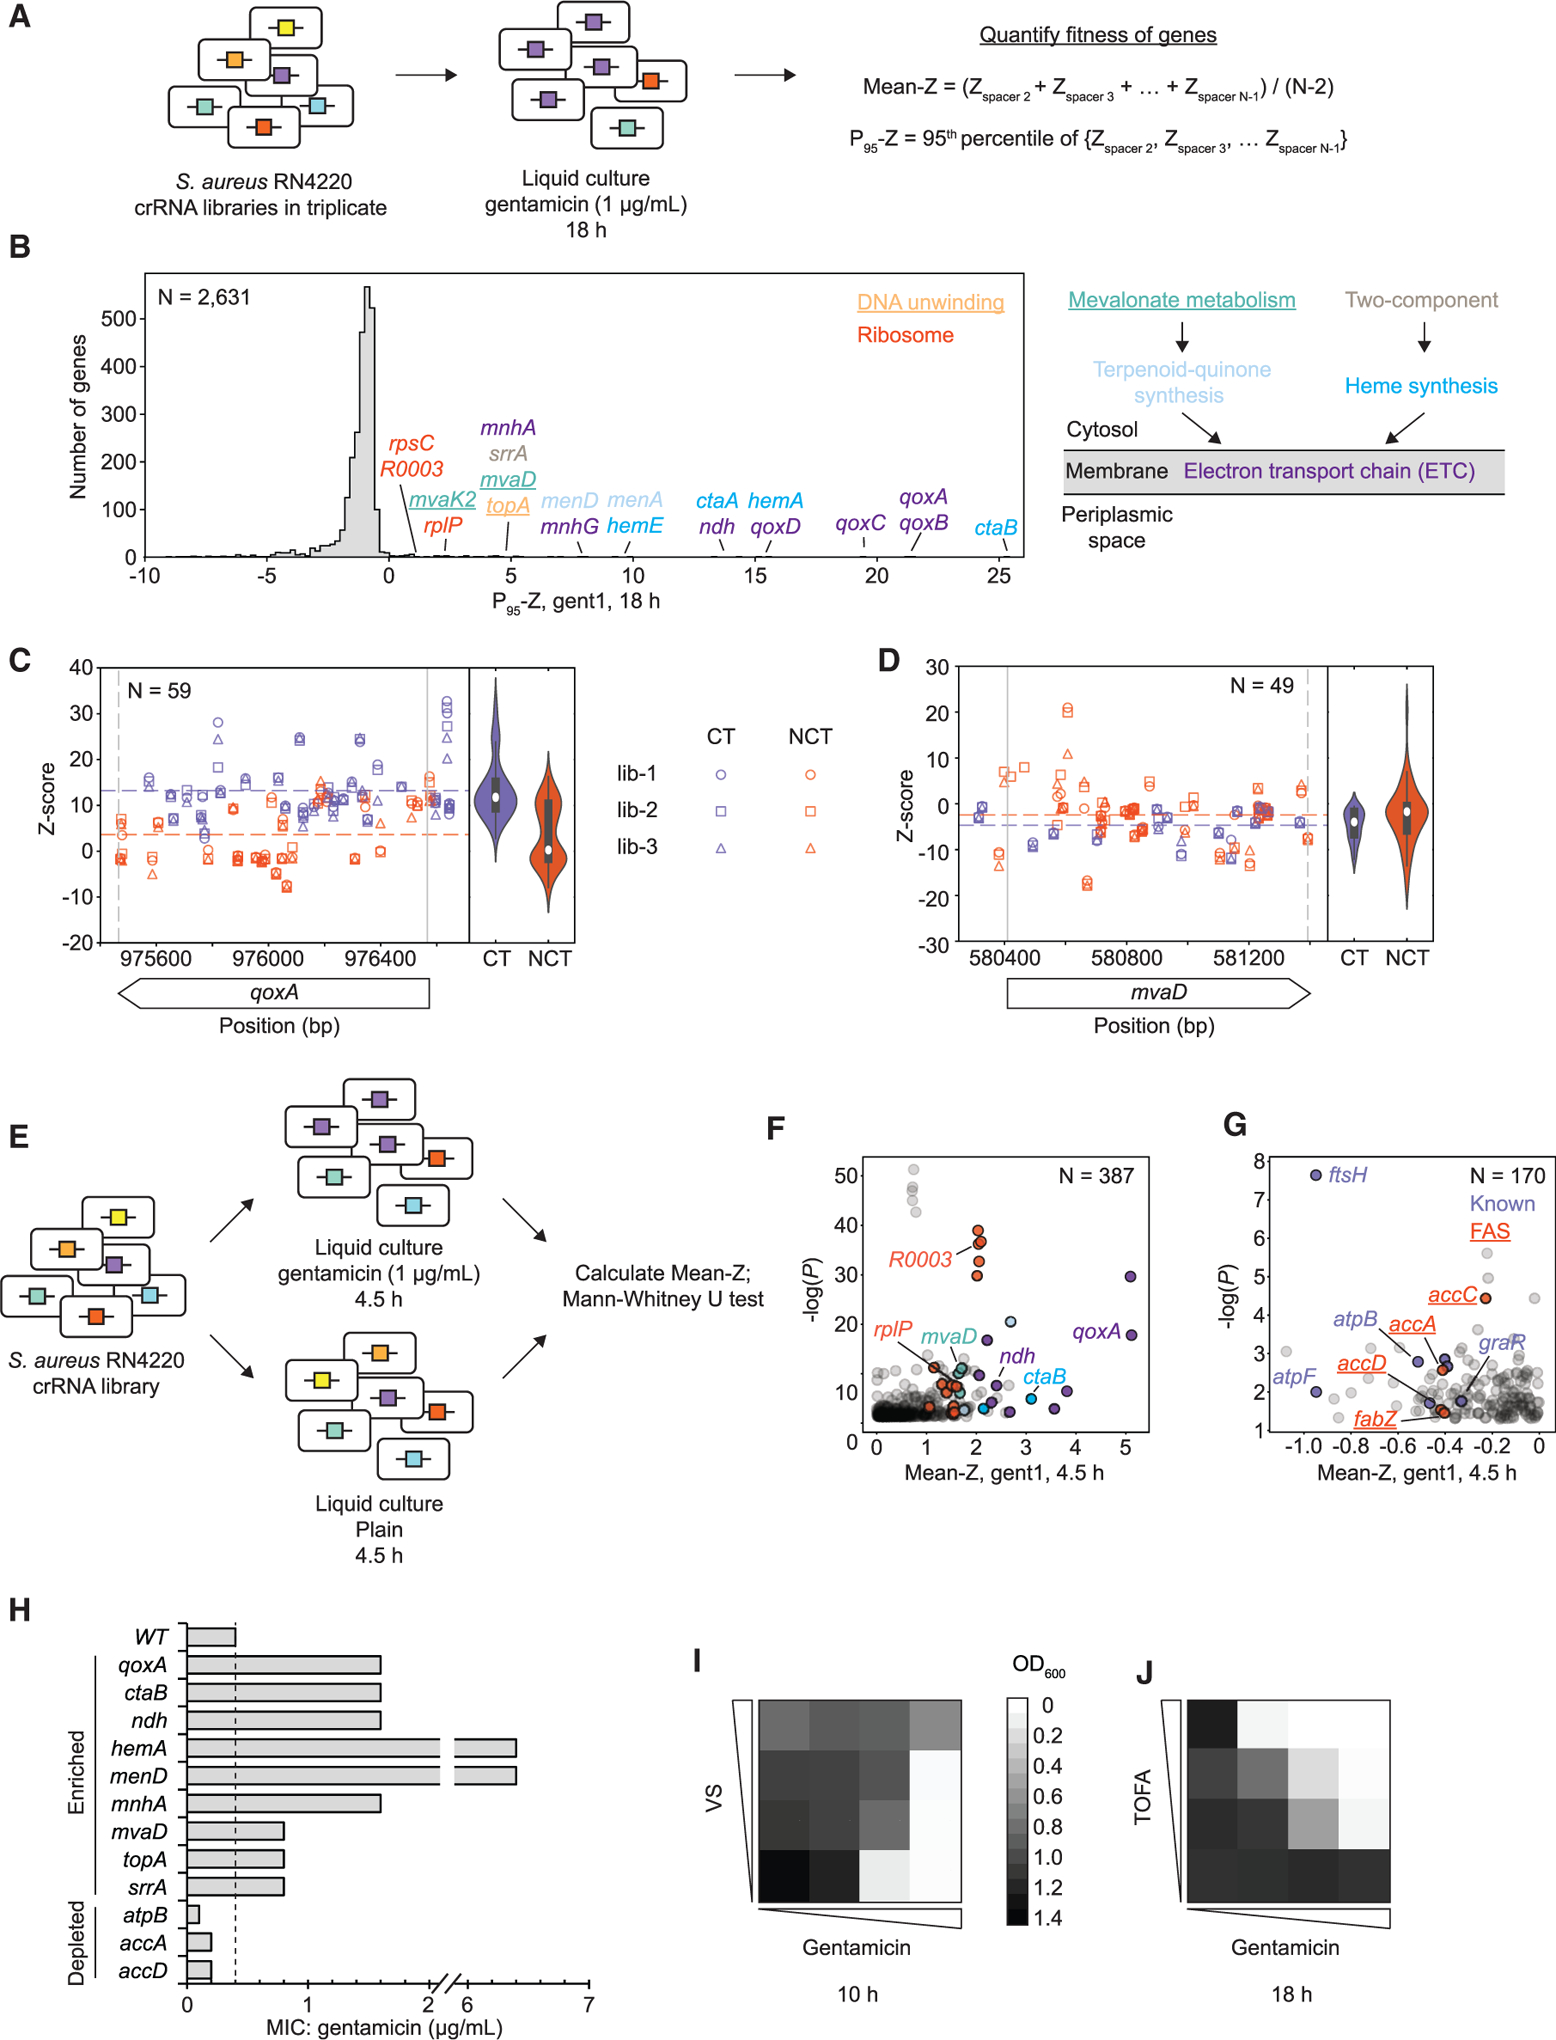
(A) S. aureus RN4220 cells with crRNA libraries generated by CRISPR adaptation were treated with a sub-lethal concentration of gentamicin (1 μg/mL). Only the CRISPR targeting machinery was constitutively expressed at this stage (i.e., Cas1, Cas2, and Csn2 were no longer induced).
(B) Distribution of P95-Zs (mean of P95-Zs from triplicates) for each gene after gentamicin (1 μg/mL) treatment. Genes are color-coded by pathways. Simplified ETC and upstream pathways are shown (see also Figure S5F). Novel genes and pathways are underlined.
(C) Z scores of all individual crRNAs targeting qoxA from triplicates (lib-1 through lib-3) after treatment with gentamicin for 18 h. Purple and orange dotted lines indicate the mean Z scores of all CT and NCT crRNAs, respectively.
(D) Same as (C), except the gene is mvaD.
(E) To better quantify the negative fitness effect, the crRNA library was treated with gentamicin (1 μg/mL) or grown in plain medium for 4.5 h. The Z scores of individual crRNAs targeting each gene measured in gentamicin and plain medium were subjected to a Mann-Whitney U test (STAR Methods).
(F) Scatterplot of all genes with positive Z scores (Mean-Z) and p < 0.05 (Mann-Whitney U test), measured 4.5 h after selection in gentamicin (1 μg/mL). Color codes are the same as those in (B).
(G) Same as (F), except dots represent all genes with negative Z scores (Mean-Z) and p < 0.05 (Mann-Whitney U test). Genes involved in the fatty acid synthesis (FAS) pathway are underlined.
(H) MICs (measured in triplicates) of gentamicin for S. aureus RN4220 cells harboring representative top enriched and depleted spacers.
(I) Vanadyl sulfate (VS), a mevalonate inhibitor, antagonizes the effect of gentamicin, as shown by bacterial growth (OD600 measured at 10 h). [gent]: 0, 0.5, 1, and 2 μg/mL; [VS]: 0, 125, 250, and 500 μg/mL. See also Figures S5J and S5K.
(J) 5-(Tetradecyloxy)-2-furoic acid (TOFA), a FAS inhibitor, potentiates the effect of gentamicin, as shown by bacterial growth (OD600 measured at 18 h). [gent]: 0, 0.125, 0.25, and 0.5 μg/mL; [TOFA]: 0, 0.39, 0.78, and 1.56 μg/mL. See also Figures S5G–S5I.
However, even for genes with the highest Mean-Z, the average crRNAs that target the coding strand were substantially more enriched than those that target the non-coding strand (p < 10−4, Mann-Whitney U test; Figures 3C, S6A, and S6B), consistent with the known strong efficacy of coding-strand-targeting (CT) crRNAs in transcriptional repression (Bikard et al., 2013; Qi et al., 2013). This suggests that Mean-Z could severely underestimate genes’ fitness because of the conflation of ineffective non-coding-strand-targeting (NCT) crRNAs. To better quantify each gene’s contribution to drug resistance while avoiding crRNAs with potential off-target effects (see Estimation of fitness effects using Z score and Consideration of spacers with off-target potentials in STAR Methods), we removed the lowest and highest Z scores of crRNAs for each gene and calculated the 95th percentile of the Z score of the remaining crRNAs (P95-Z). P95-Z showed good correlation with alternative metrics such as High2/3-Z and Log2FC (Log2 of fold change) (Figures S5B and S5C; STAR Methods) as well as within the triplicates (Figure S5D). We prefer the use of Z score (Table S1D) to Log2FC (Table S1F) whenever possible because our six unselected crRNA libraries make the Z score analysis more statistically robust. Of note, the P95-Z metric is principally similar to work published by Gilbert et al. (2014), who used the mean of the three strongest gRNAs to score hit genes.
Use of P95-Z dramatically increased the sensitivity and led to the discovery of many genes involved in pathways that feed into the ETC (Figures 3B and S5F), which have been reported in multiple studies (Bayer et al., 2006; Kinkel et al., 2013), including one involving a transposon library (Rajagopal et al., 2016). Top hits included ctaABM, mnhABCDEFG, and ndh. Multiple CT crRNAs of these genes were highly enriched (Figures S6B–S6D), providing strong evidence of their roles in aminoglycoside resistance. Notably, inactivation of genes in the hem and men operons were also seen in resistant clinical isolates (Kahl et al., 2016; Lannergård et al., 2008). crRNAs targeting essential genes (Bae et al., 2004; Chaudhuri et al., 2009), such as mvaD and mvaK2 (mevalonate pathway) and topA (topoisomerase I), were also enriched (Figure 3B), and, to our knowledge, they are novel loci of aminoglycoside sensitivity. crRNAs targeting many essential ribosomal genes were also significantly enriched, especially after a shorter period of gentamicin selection (Figures 3E, 3F and S5E). The fact that transcriptional inhibition of a few ribosomal components improved gentamicin tolerance suggests that specific compositional or structural perturbations of the ribosome may weaken its normal targeting by aminoglycosides (Taber et al., 1987).
Importantly, although many CT crRNAs were almost always enriched for non-essential genes (Figures S6A–S6D), we observed a tendency that, for essential genes, only a small portion of NCT crRNAs were enriched after long and short periods of gentamicin selection (Figures 3D and S6E–S6G). This is consistent with weak transcriptional inhibition by NCT crRNAs (Bikard et al., 2013; Qi et al., 2013) and the fact that stronger effects on essential genes are expected to be lethal. Indeed, our attempt to clone three crRNAs targeting the coding strand of the essential rplB gene failed (Figure S6G). These results indicate that our comprehensive CRISPRi library produced a broad range of magnitude of transcriptional repression, leading to selection of mildly suppressing NCT crRNAs targeting specific regions of essential genes not easily predictable based on our current knowledge.
The fact that only a handful of these weaker NCT crRNAs were enriched highlights the challenge faced by conventional design-based, low-diversity libraries. To assess the sensitivity of these libraries, we took a computational sampling approach. To simulate a low-diversity library, we randomly selected 10 crRNAs per gene from our comprehensive library and calculated P95-Z as before (Figure 4A). A total of 100 such samplings were performed for the 30 top hit genes. We found that 9 of these top hits identified in the comprehensive library were no longer significantly enriched in more than 50% of the simulated, low-diversity libraries. More severely, novel essential hits such as mvaD and mvaK2 were missed in more than 80% of these libraries.
Figure 4. Comprehensive crRNA Libraries Enhance Screening Sensitivity.
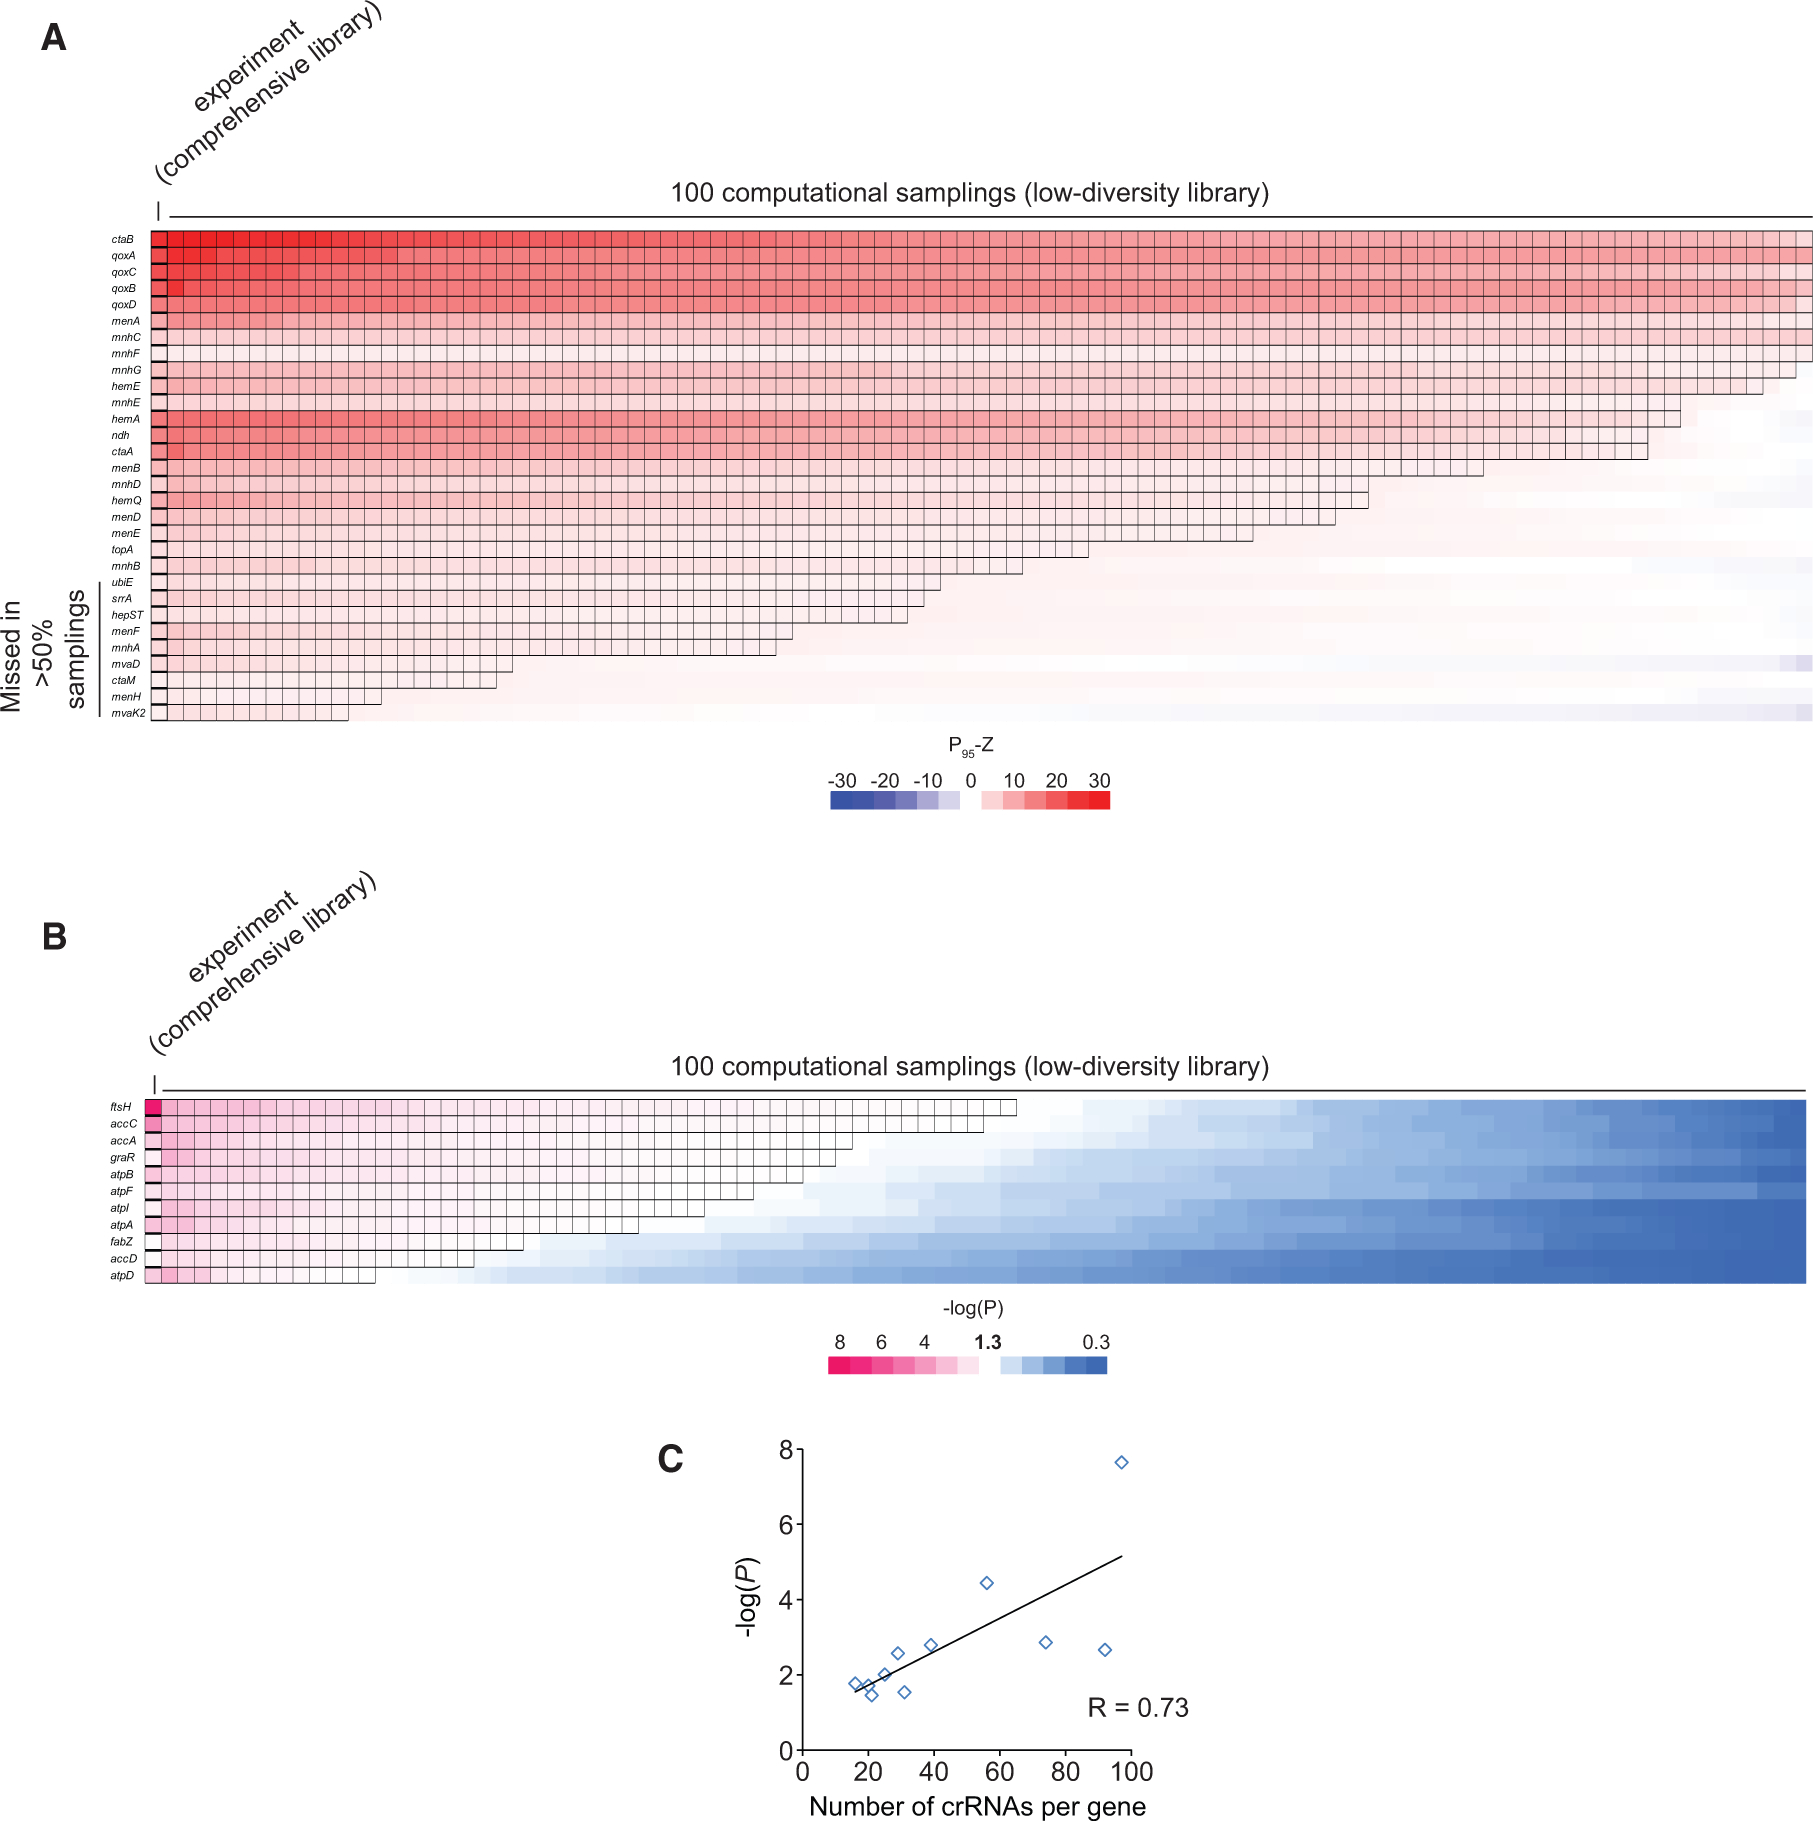
(A) 100 low-diversity crRNA libraries are simulated by computational sampling our comprehensive crRNA library generated by CRISPR adaptation. In each sampling, 10 random crRNAs per gene from the comprehensive crRNA library were selected, and P95-Zs were calculated. The heatmap shows the mean of P95-Zs (from triplicates, 18-h treatment with 1 μg/mL gentamicin) of the top 30 enriched hits identified experimentally from the comprehensive library as well as those from the 100 low-diversity libraries created by computational sampling. A black edge indicates that P95-Z is greater than 1.96 (i.e., p < 0.05). Enriched hits that were missing in more than 50% of the samplings are labeled.
(B) Similar to (A), except the heatmap shows the −log(P) values (Mann-Whitney U test) of the 11 genes (Figure 3G) that were significantly depleted in gentamicin (1.0 μg/mL) after 4.5-h treatment. We focused on these 11 hits because other hits were not well annotated (Table S1G). All 11 hits were missing in more than 50% of the samplings.
(C) Number of crRNAs per gene increases the statistical power of discovery. The scatterplot shows the correlation between the number of unique crRNAs targeting each of the 11 genes that were significantly depleted in gentamicin (Figure 3G) and their −log(P) value of the Mann-Whitney U test (STAR Methods).
Because long-term extreme selection of the CRISPRi library in antibiotics could obscure quantification of negative fitness effects, we also performed a shorter-period (4.5 h) selection (Figure 3E), which identified crRNAs that were either significantly enriched (Figures 3F and S5E) or depleted (Figure 3G). Particularly, crRNA perturbations that potentiated the effect of antibiotics were expected to be significantly depleted in gentamicin but not in plain medium (Figure 3E; STAR Methods). Here we chose to use Mean-Z (Table S1G) instead of P95-Z because the goal was to discover genes exerting negative fitness effects. Top depleted hits (purple dots in Figure 3G) included a membrane protease (ftzH), an ATP synthase (atpABDFI), and a two-component regulatory system (graR), all known to sensitize cells to aminoglycosides when disrupted (Hinz et al., 2011; Vestergaard et al., 2017; Yang et al., 2012). New hits included accACD and fabZ, which belong to the essential fatty acid synthesis (FAS) pathway (red dots in Figures 3G, S5G, and S6H–S6K). Importantly, our computational sampling showed that all of these 11 hits would be missed more than 50% of the time in the simulated, low-diversity libraries (Figure 4B), highlighting the general challenge in capturing depletion events. Therefore, we demonstrated that the comprehensiveness of the crRNA library significantly elevated the sensitivity and statistical power (Figure 4C) necessary for discovery of novel, antibiotic-potentiating pathways in bacteria.
crRNAs targeting representative top enriched and depleted genes were cloned and validated for their effects on drug resistance in liquid culture (Figures S5L–S5O). The great majority of them also showed expected changes in minimal inhibitory concentration (MIC) measured on agar plates (Figure 3H), with the exception of some ribosomal genes (Figure S5M). Importantly, because the newly discovered pathways, such as mevalonate and FAS, are essential, gene knockout experiments were not feasible. Instead, we further validated them by chemical inhibition. Mevalonate and FAS inhibitors strongly antagonized (Figures 3I, S5J, and S5K) and synergized (Figures 3J and S5G–S5I) with gentamicin, respectively, consistent with the enrichment and depletion of the respective crRNAs seen in the screen (Figures 3B and 3G).
Last, we demonstrated that our comprehensive CRISPRi system can effectively identify essential genes. To do so, we grew S. aureus crRNA libraries in plain medium for 9 h. Similar to a previous study (Rousset et al., 2018) and estimated each gene’s fitness by calculating the mean Z score of all matching CT crRNAs (Mean-ZCT) (Figure S7A; Table S1I). We then ranked genes according to their Mean-ZCTs. We found that CT crRNAs of essential genes identified by two previous studies using transposon libraries (Bae et al., 2004; Chaudhuri et al., 2009) were strongly depleted, with the majority of their Mean-ZCTs below an empirically selected threshold (Figure S7B). Furthermore, the majority of essential genes that were identified in both transposon libraries but not in our CRISPRi screen (56 genes in Figure S7C) had negative Mean-ZCTs, suggesting that they impaired growth when repressed. Although our screen was performed in S. aureus RN4220 at 37°C, we noted that the two transposon studies were carried out in two other strains at 43°C–44°C, a temperature necessary for selection of transposon insertion. This could explain some of the differences in the genes identified as essential. Nevertheless, we generated a receiver operating characteristic (ROC) curve (Figure S7D) using genes identified as essential in both transposon studies and found that our CRISPRi screen had a relatively high prediction performance (AUC = 0.921). Notably, because prokaryotic genomes are usually organized in operons producing polycistronic transcripts, silencing one gene in an operon with CRISPRi leads to repression of all downstream genes. It has been shown that such polar effects can cause misidentification of non-essential genes when they are succeeded by at least one essential gene (Rousset et al., 2018; Wang et al., 2018; Figure S7E). Similar to these studies, we indeed found that, among the top 30 genes (of the 101 genes in Figure S7C) identified as essential in our screen, but not by the two transposon studies, 13 were succeeded by one or more essential genes, making them potential false positive hits.
Dual-Spacer Perturbations Reveal Epistasis and Historical Contingency in Acquisition of Antibiotic Resistance
Microbes can adapt to extreme environments through sequential accumulation of mutations. Disruption of the ETC and related pathways (e.g., qoxA and ndh) allowed cells to grow better with a sub-lethal dose of gentamicin (Figure 3B). We wondered whether repression of additional pathways could further strengthen antibiotic resistance. To test this, we first created a comprehensive “one-versus-all” library containing a universal qoxA-targeting spacer (“qoxA-versus-all” library; Figure 5A). After selection with a high dose of gentamicin (4 μg/mL), many spacer pairs targeting the ETC and pathways further upstream of it (Figures 5B, 5C and S5F) as well as novel operons, such as 01269-01271, were significantly enriched (Gent 4, Log2FC(qoxA+X) column in Figure 5C). Again, NCT rather than CT crRNAs tended to be more enriched for essential genes (Figures S6T–S6X). We validated the fitness of some top hits by MIC measurement (Figure S8A) and pairwise competition (Figures S8B–S8F), which was more quantitative. Moreover, with the exception of mnh, most genes were not enriched without the qoxA-targeting spacer under the same condition (Gent 4, Log2FC(X) column in Figure 5C), suggesting positive epistatic interactions with qoxA. We estimated epistasis (ε) using fitness measured by Log2FC (Figure 5C; STAR Methods) because it was highly correlated with fitness as measured by pairwise competition (Figure S8G).
Figure 5. One-versus-All Libraries Identify Genetic Interactions that Strengthen Antibiotic Resistance.
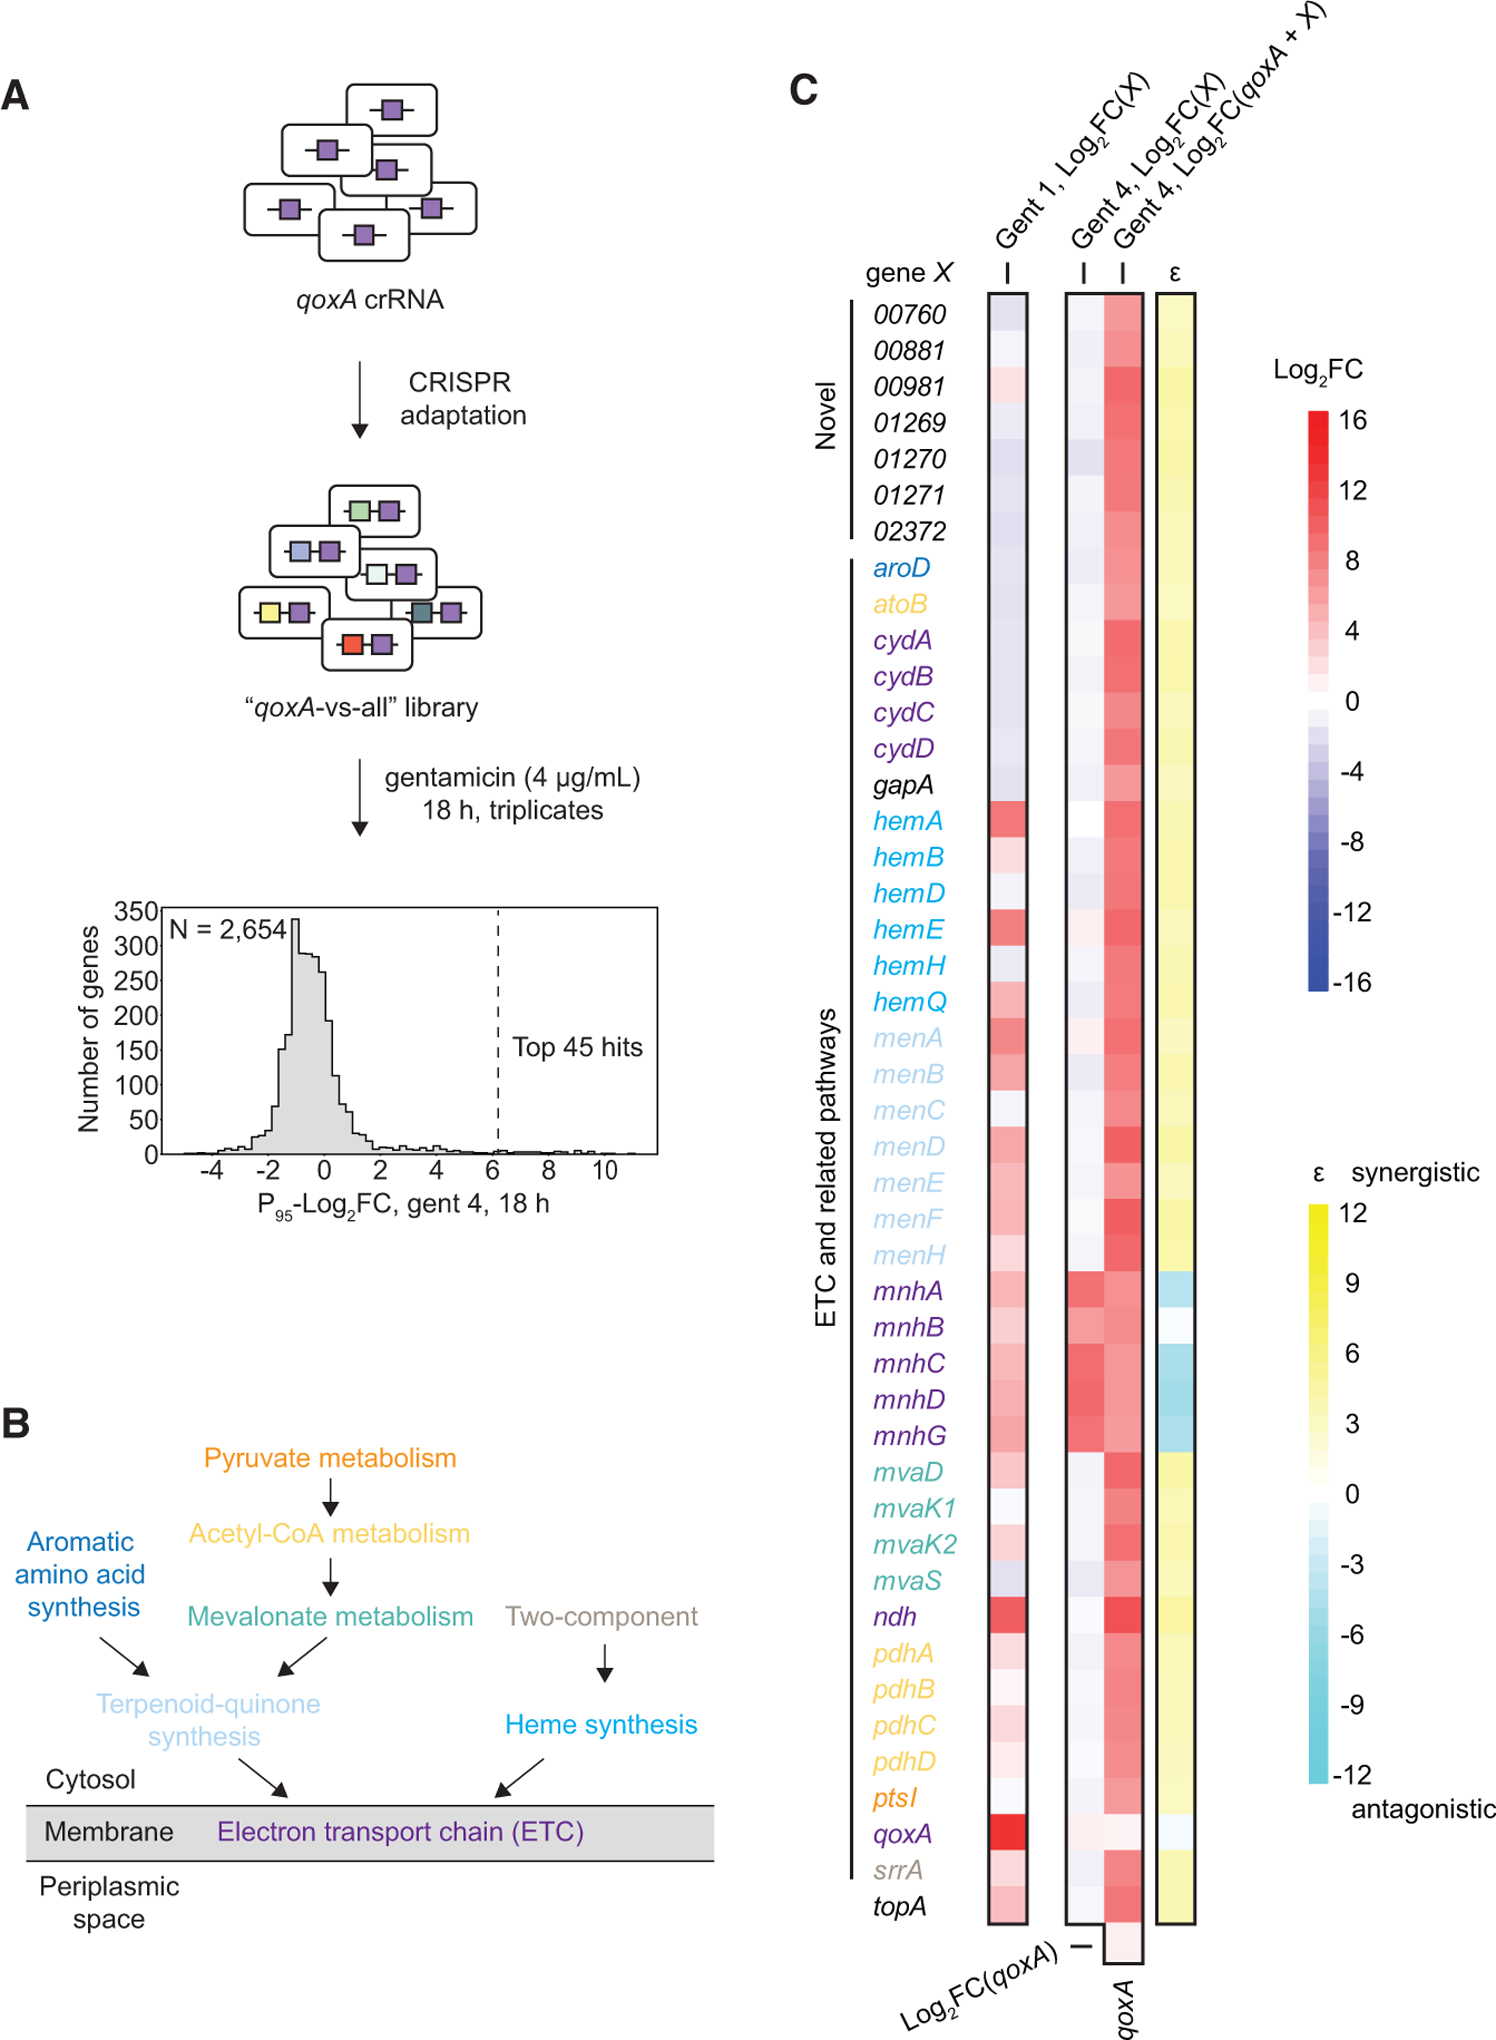
A) S. aureus RN4220 cells harboring a universal qoxA-targeting spacer were subjected to CRISPR adaptation, generating a comprehensive qoxA-versus-all dual-perturbation library. The library was treated with a high concentration of gentamicin (4.0 μg/mL), and the distribution of P95-Log2FC (mean of P95-Log2FCs from triplicates) for each gene after treatment is shown.
(B) Schematic showing simplified ETC and upstream pathways. See also Figure S5F.
(C) The top 45 most enriched dual-spacers targeting qoxA and gene X identified in (A) are shown. For ETC and related genes, the color codes match (B). For every gene X, its P95-Log2FCs measured from 1S libraries subjected to 1 μg/mL or 4 μg/mL gentamicin for 18 h as well as its P95-Log2FC from the qoxA-versus-all library subjected to 4 μg/mL gentamicin for 18 h are shown. See also Tables S1F, S1J, and S1K. Epistasis (ε) between qoxA and gene X in 4 μg/mL gentamicin was estimated using P95-Log2FC as a proxy for fitness.
Beyond simplicity, another unique advantage of the CRISPR-Cas system is its multiplexity and polarity; the combination and order of spacers in the CRISPR array can reveal the effect of multiple genetic perturbations and, potentially, the historical contingency among them. To demonstrate this, we first treated a single-spacer (1S) library with a low concentration of gentamicin (low [gent]) for 9 h to mildly enrich spacers that confer fitness benefits. Next we sub-cloned the resulting spacer pool, generated a dual-spacer (2S) library by iterating CRISPR adaptation, and subjected it to a higher concentration of gentamicin (high [gent]) (Figure 6A). Because CRISPR adaptation only occurred in 0.1%–1% of the population shown earlier (Figure S2C), the sub-cloning step was necessary to vastly increase the proportion of spacer-containing cells in the population. After two rounds of CRISPR adaptation, the great majority of cells contained single-spacers, whereas 0.1%–1% of cells contained dual-spacers (Figure S9A). Only reads containing two spacers were computationally selected for downstream analysis.
Figure 6. Dual-Spacer (2S) Libraries Capture Pairwise Genetic Perturbations that Strengthen Antibiotic Resistance.
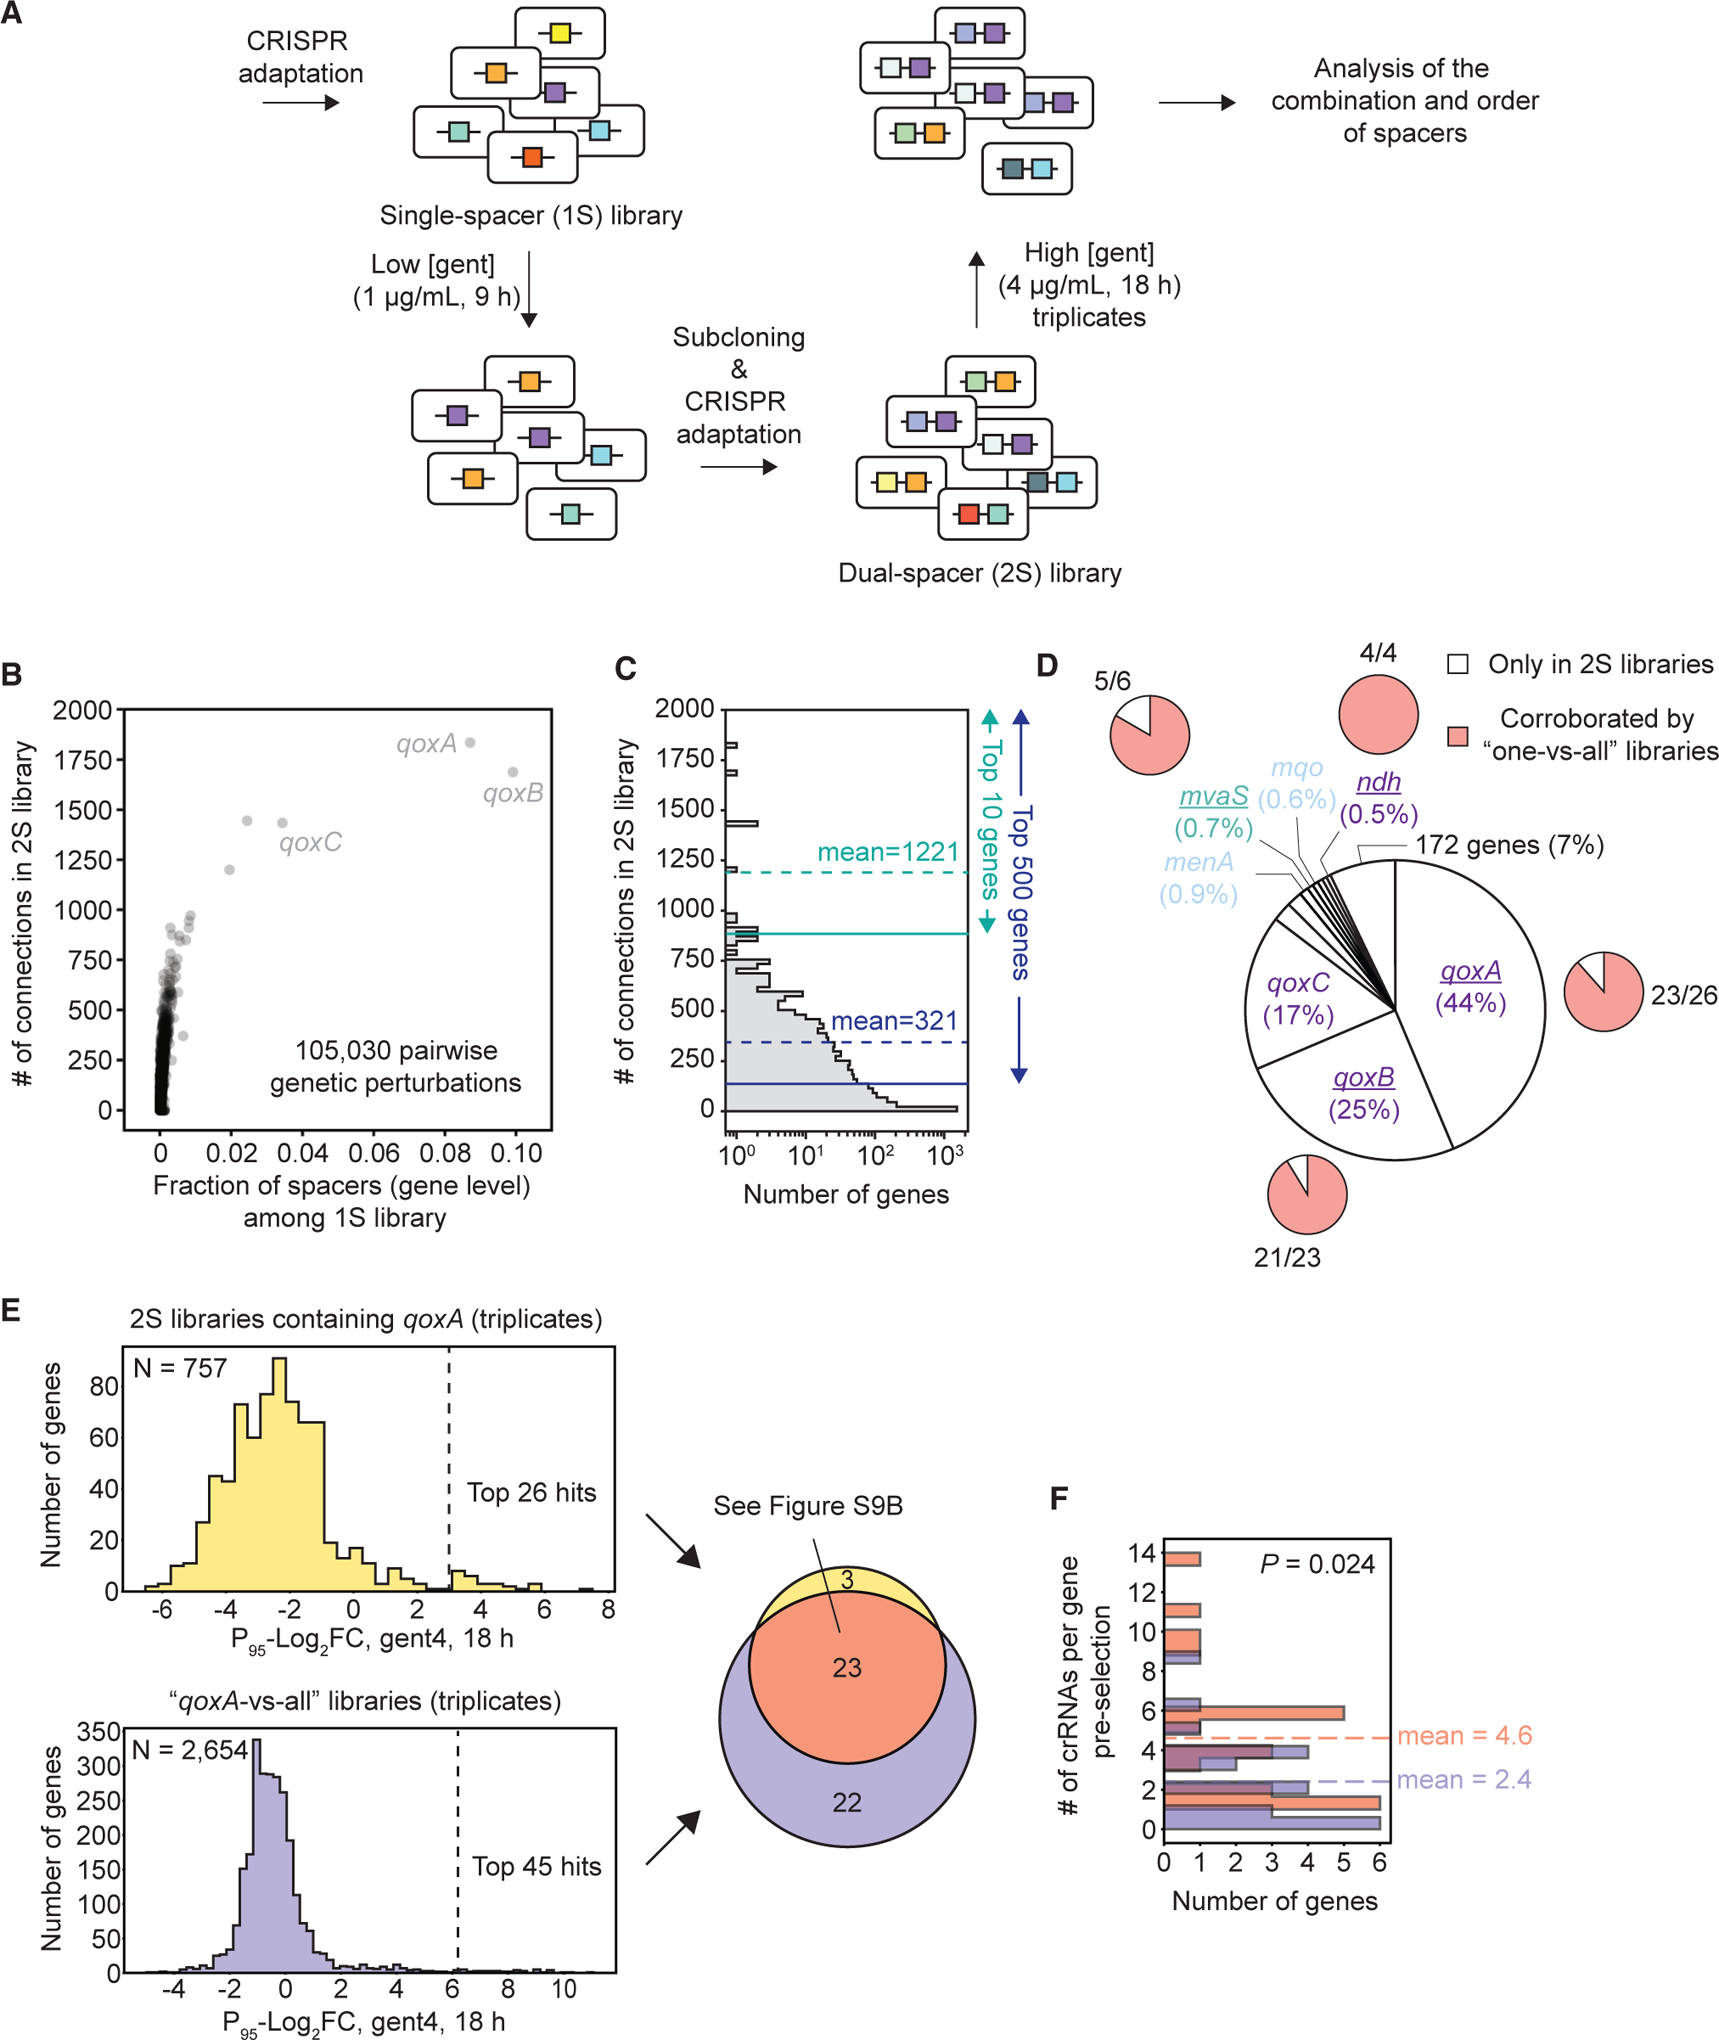
(A) Schematic showing the sequential construction of a 2S library.
(B) Scatterplot showing all spacer pairs detected in a pre-selected 2S library at the gene-gene level. For each gene, the fraction of spacers targeting it among the preceding single-spacer (1S) library (x axis) and number of genes connected to it in the 2S library (y axis) are shown.
(C) Related to (B); histogram showing the distribution of number of connections each gene made in the 2S library.
(D) Central pie chart showing the average abundance of spacers (gene level) in 2S libraries after selection in gentamicin (4.0 μg/mL), calculated from triplicates. We applied a filter so that genes that were targeted by an average of 3.5 unique spacers post-selection (triplicates) were considered (183 genes) to avoid spacers with off-target potential. For each underlined gene, the number of top enriched spacer pairs containing it in 2S libraries as well as pairs that were corroborated by its respective individual one-versus-all libraries are shown in outer pie charts.
(E) Comparison of the top enriched hits (i.e., spacer pairs) containing qoxA in 2S libraries and the qoxA-versus-all libraries generated in Figure 5A. Histograms show the distributions of P95-Log2FC (mean of P95-Log2FCs from triplicates) for each gene after gentamicin (4 μg/mL) treatment for both libraries. The Venn diagram shows the top enriched hits identified from both libraries (Figure S9B).
(F) Distribution of the number of unique crRNAs targeting genes in the pre-selected 2S library. These genes were either identified as top hits in both libraries (red, 23 genes) or in the qoxA-versus-all library alone (purple, 22 genes). Color codes match the Venn diagram in (E). A Mann-Whitney U test was performed between the two groups of genes, and the p value is shown.
This rapid and economical pipeline generated a 2S library with at least 237,650 unique spacer pairs, representing 105,030 non-redundant pairwise genetic perturbations (Figure 6B; Tables S2A and S2B). This diversity is comparable with costly array-synthesized dual-gRNA libraries by recent studies, which included 2,628 and 23,652 pairwise genetic perturbations, respectively (Han et al., 2017; Shen et al., 2017). At the gene level, the greatest number of pairwise connections made in our 2S library skewed toward the more abundant genes in the preceding 1S library (Figures 6B and 6C), which was the result of selection in low [gent] (Figure 6A). In the 2S library, the top 10 genes made an average of 1,221 connections, and the top 500 genes made an average of 321 connections (Figure 6C). crRNAs targeting genes such as qoxABC were the most abundant, making up ~20% of all crRNAs in the preceding 1S library (Figure 6B). The abundance of qoxABC-targeting crRNAs further rose to 86% (Figure 6D) after selection in high [gent], highlighting their roles in strengthening drug resistance. crRNAs targeting other components of the ETC (Figure S5F), such as menA, mvaS, and ndh, were also among the most abundant species.
Importantly, a large proportion of the highly enriched pairwise perturbations after selection in high [gent] were corroborated by their respective one-versus-all libraries (outer pie charts in Figure 6D). For instance, this is the case for 88% (23 of 26) of enriched qoxA-containing (Figures 6E and S9B; Tables S1K and S2D), all (4 of 4) ndh-containing (Figure S9C; Tables S1L and S2E), and 83% (5 of 6) mvaS-containing pairs (Figure S9D; Tables S1M and S2F). 91% (20 of 22) of enriched pairs containing qoxB were also corroborated using hits from the qoxA-versus-all library as a proxy (Figure S9E; Tables S1K and S2G). Notably, genes that were hit only in one-versus-all libraries but missed in the 2S library tended to have significantly fewer crRNAs targeting them in the pre-selected 2S library (Figures 6F and S9C–S9E). This suggests that, although the 2S library contained far more pairwise perturbations (~100,000 pairs) than one-versus-all libraries (2,666 pairs) at the gene level, the crRNAs per gene it contained were significantly fewer than those of one-versus-all libraries (Figures S9F and S9G), limiting its sensitivity. Therefore, although the more diverse 2S libraries could rapidly capture major beneficial pairwise perturbations for given phenotypes, one-versus-all and, potentially, “several-versus-all” libraries (Discussion) were necessary to thoroughly sample every gene in the genome and quantify their fitness.
It is not surprising that operons and genes such as men, mva, and ndh synergized with qoxA to confer resistance to high [gent] because they already boosted fitness in low [gent] (Gent 1, Log2FC(X) column in Figure 5C). In contrast, genes such as the cyd operon, which encodes a second terminal oxidase (Hammer et al., 2013) of the S. aureus ETC in addition to qox (Figure S5F), were not enriched in either low or high [gent] alone (Figure 5C). Thus, enrichment of cyd in the presence of qoxA suggests historical contingency (Blount et al., 2008); under our selection regime, although repression of cyd was clearly a path toward higher resistance to gentamicin, it was not accessible unless repression of qoxA was reached first.
Multiple sequencing rounds are often required to unravel the evolutionary trajectory toward given phenotypes (Good et al., 2017), which could inform strategies to control drug resistance (Palmer et al., 2015). Because CRISPR adaptation is polarized (McGinn and Marraffini, 2019)—new spacers are always added at the leader-proximal end of the array (Figure 7A)—it has the capacity to record the temporal sequence of biological events (Schmidt et al., 2018; Sheth et al., 2017; Shipman et al., 2016). Among spacer pairs containing both qoxA and cydA post-selection in high [gent], cydA was significantly more abundant as the second spacer (Spc2) than as the first spacer (Spc1) (Table S2H), confirming its contingency on qoxA. This is further corroborated by our competition and MIC assays: although cydA-targeting cells showed equally poor fitness as WT cells in low [gent], dual-spacers targeting qoxA and cydA provided significantly higher fitness than qoxA alone in high [gent] (Figures S8A, S8F, and S8H).
Figure 7. Polarized CRISPR Adaptation Reveals Historical Contingency in the Acquisition of Increasing Antibiotic Resistance.
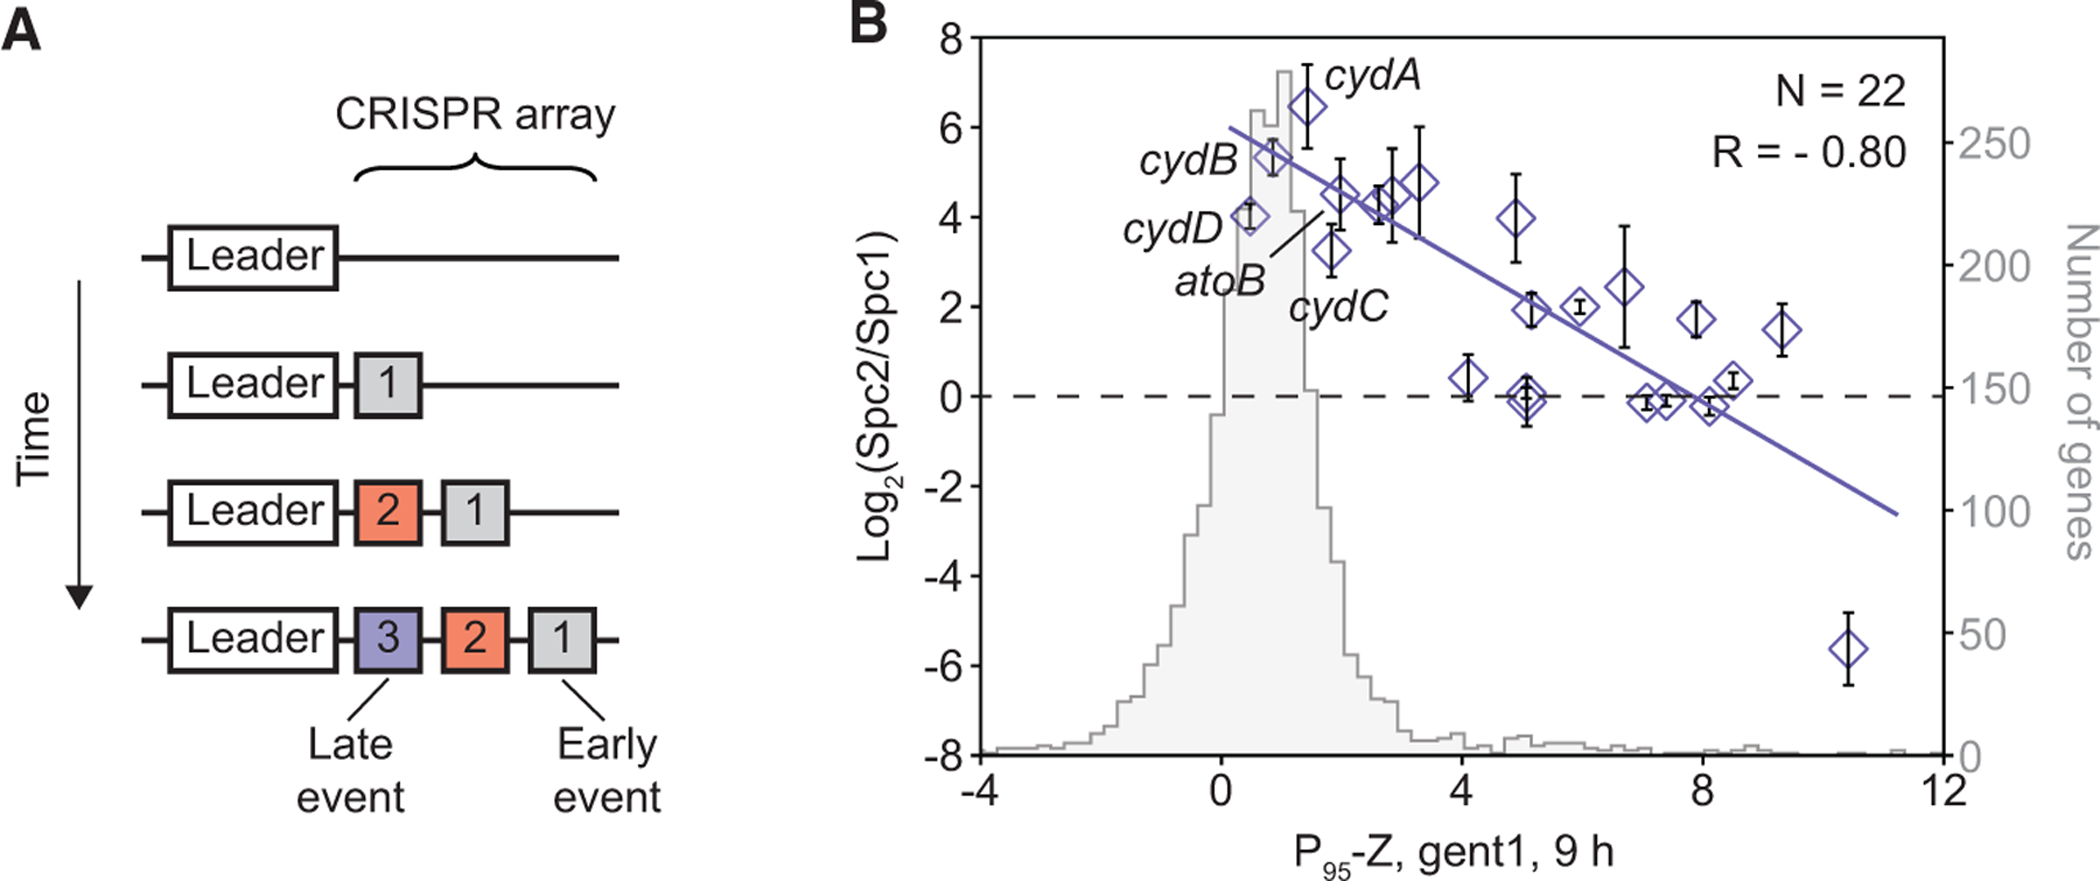
(A) Schematic showing polarized CRISPR adaptation in which new spacers are acquired at the leader-proximal end of the array.
(B) Spc2/Spc1 ratios of spacer pairs containing qoxA in post-selected 2S libraries inversely correlated with Z scores of the non-qoxA gene measured in 1 μg/mL gentamicin at 9 h (P95-Z, gent 1, 9 h), the point at which the second spacer was adapted. Data are represented as mean ± SD from triplicates (Table S2H). Distribution of P95-Zs is also shown.
To investigate whether the order of CRISPR spacers is a good indicator for historical contingency along an evolutionary trajectory, we analyzed spacer pairs that were enriched in both qoxA-versus-all and 2S libraries. Genes that are contingent on qoxA are expected to not confer high fitness by themselves in low [gent] and should therefore have low Z scores and, consequently, high Spc2/Spc1 ratios. Indeed, we found that the Spc2/Spc1 ratios in the post-selected 2S libraries inversely correlated with the Z scores in low [gent] at 9 h (Figure 7B; Tables S1H and S2H), which was when the second spacer was adapted (Figure 6A). This is equally true for dual spacers containing qoxB (Figure S9H; Table S2I), the second most abundant species post-selection (Figure 6D). Thus, by sequencing just a single terminal time point, the order of spacers in the canonical CRISPR array can reveal candidate loci with historical contingency in acquisition of increasing antibiotic resistance. Such chronological information is not present in dual-gRNA libraries generated in the conventional way.
DISCUSSION
Harnessing the natural capacity of a hyperactive CRISPR-Cas adaptation machinery, the current study established CALM, a rapid and economical method that converts exogenous DNA into comprehensive genome-wide crRNA libraries targeting bacterial genomes of interest. With an average gene covered by up to 103 crRNAs, we show that our libraries enabled a broad range of transcriptional perturbations. This comprehensiveness significantly increased the statistical power and led to discovery of novel and essential pathways for aminoglycoside sensitivity in ways that conventional low-diversity libraries miss. Importantly, CALM can be readily adapted to other bacterial species, including wild-type, clinically relevant bacteria that have not been amenable to standard genetic manipulation, and, potentially, higher eukaryotes with further engineering. Using CALM, we also rapidly generated large-scale 2S libraries capable of identifying genetic interactions and recording the sequence of biological events along an evolutionary trajectory.
Libraries generated by CALM contained both CT and NCT crRNAs covering up to 95% of all targetable sites in the S. aureus genome. Because of their known weak efficacy in transcriptional repression, NCT crRNAs were either excluded from computational analysis (Rousset et al., 2018) or simply not designed (Wang et al., 2018) when studying certain prokaryotic phenotypes. However, we found that NCT crRNAs vastly expanded the scope of our survey to mild suppression of essential genes, which is not possible with only CT crRNAs. Our screen also revealed novel antibiotic-potentiating pathways, such as FAS, and many unannotated genes (Table S1G), demonstrating the enhanced sensitivity and statistical power conferred by the comprehensive pool of crRNAs. On a cautionary note, CRISPRi produces a polar effect because silencing one gene in an operon could lead to repression of all downstream genes. It is thus necessary to use independent genetic or chemical methods to validate hits identified in CRISPRi screens.
CALM generates crRNA libraries in situ, which could be directly used in S. aureus or sub-cloned into other organisms. One of the greatest advantages of generating libraries in situ is that it circumvents cloning and transformation, allowing diverse libraries to be made in genetically recalcitrant species such as MRSA. We believe that this strategy could be extended to a variety of other hard-to-transform, wild-type bacterial species. However, because both the externally supplied and internally replicating DNA competed for access to the CRISPR adaptation machinery, these S. aureus libraries made in situ had a bias toward Ori. Nevertheless, in making libraries of other species, such as E. coli, in S. aureus, we restored the catalytic activity of Cas9, resulting in diverse libraries with much higher uniformity. Therefore, crRNA libraries targeting organisms of interest could be “manufactured” in S. aureus, followed by sub-cloning (Figure S4A). Our genome-wide E. coli library consisted of at least 462,382 unique spacers, which would cost nearly $20,000 using conventional synthesis methods. This sub-cloning strategy is preferable as long as crRNA libraries can be efficiently horizontally transferred into the species of interest. The upper limit of library diversity that could be obtained by CALM remains to be tested. For example, yeast genomic DNA (which contains ~1 million PAMs) or PCR products of other eukaryotic open reading frame (ORF) libraries could be utilized. One key difference between gRNA and crRNA is that gRNA is immediately functional, whereas the canonical crRNA needs to be processed by host RNase III to produce an active form (Deltcheva et al., 2011). Because the housekeeping RNase III is instrumental for ribosomal RNA processing and is widely distributed in bacteria (Drider and Condon, 2004), it is likely that the canonical S. pyogenes crRNA will work in many bacterial species. Additionally, it will be of interest to devise cloning strategies to convert crRNA libraries to gRNA libraries, given the structural homology shared between the two.
We envision that CALM could be further improved in a few ways. Optimization by laboratory evolution of the adaptation machinery (Cas9, Cas1, Cas2, and Csn2) could enhance the frequency of spacer adaptation and, thus, library diversity. When making in situ libraries, the bias toward the internal replicating DNA was strong, even when cells were supplied with large amounts of external DNA. This raises the possibility that external DNA may be rapidly degraded by host nucleases, such as the AddAB complex, the Gram-positive ortholog of RecBCD (Wigley, 2013). Small-molecule (Amundsen et al., 2012) or phage-derived (Murphy, 1991) inhibitors of these nucleases may help to slow degradation and reduce the bias of resulting libraries. Alternatively, inducing CRISPR machinery at different growth phases where DNA replication at the Ori is minimal or actively inhibited may also diminish biased spacer adaptation at this location. In addition to the most widely used type II S. pyogenes CRISPR system, the E. coli type I system has also been repurposed as a tool for programmable gene repression (Luo et al., 2015). Given that its adaptation machinery has been well characterized (Levy et al., 2015; Yosef et al., 2012) and engineered as molecular recorders (Sheth et al., 2017; Shipman et al., 2016), it is of interest to test the capacity of type I adaptation system to create comprehensive crRNA libraries.
In all types of CRISPR screens, spacers with off-target potentials may confound gene fitness quantification. In one of our computational pipelines, we filtered out 37% of spacers with off-target potentials (Tables S1A and S1E). Although this filter effectively removed faulty hits, elimination of such a large number of spacers also compromised the sensitivity and statistical power of our 1S and 2S libraries (see Consideration of spacers with off-target potentials in STAR Methods). However, because genes targeted by more than one spacer with true non-neutral off-target site were rare, we showed that removal of crRNAs with the strongest and the weakest fitness effect for each gene alone effectively eliminated faulty hits. More importantly, we found that the bona fide top hit genes validated by us and others were consistently targeted by multiple significantly enriched or depleted crRNAs across multiple replicates, whereas faulty top hit genes contained only one such crRNA (Figures S6O–S6S). For these reasons, we decided to not apply the off-target filter. In future work, one may also consider using Cas9 variants with enhanced DNA-targeting specificity (Chen et al., 2017; Hu et al., 2018) to further reduce off-target effects.
The highly comprehensive libraries generated by CALM may allow us to identify sequence features of crRNAs that correlate with activity. Fortuitously, one E. coli library we created using Cas9 contained 16% of crRNAs targeting S. aureus even after 10 h of outgrowth (Figure S4B; STAR Methods), suggesting that these crRNAs were either inefficient at cleavage or that their targets represented genomic regions that undergo efficient repair. This dataset contained ~8,500 S. aureus crRNAs, and they had a wide range of cleavage activity, as calculated by Log2FC (Figure S10A; Table S3A). We found that mononucleotide composition inside the 20-nt crRNA target is significantly informative of cleavage activity (Figures S10B and S10C). To capture the capacity of such features to predict efficient activity, we trained a logistic regression classifier under three-way cross-validation and found that it can predict crRNA activity in the held-out groups (AUC = 0.81; Figures S10D–S10F). Intriguingly, the classifier trained with Cas9 cleavage data was also able to predict crRNA activity on essential genes performed in our dCas9 screen (Figure S7; Table S3B) with mildly reduced accuracy (Figures S10G–S10I). This suggests that the sequence features of crRNAs are more likely correlated with their activity rather than genomic repair hotspots, although current data cannot entirely rule out the latter possibility. Furthermore, using a de novo motif discovery algorithm we developed previously (Elemento et al., 2007), we uncovered sequence motifs informative of crRNA activity in the first 9 nt of the target sequence (−9 to −1). These motifs highlight a preference against guanines at positions −5 and −6 in combination with specific nucleotide preferences in other positions (Figures S10J and S10K). Our data suggest that future studies could further exploit CALM to comprehensively explore the sequence features affecting crRNA activity in a wide variety of genomes and compare the rules governing the activity of crRNAs and gRNAs (Doench et al., 2014).
By iterating CRISPR adaptation, we created a 2S library (Figure 6) whose diversity is comparable with costly array-synthesized gRNA libraries of recent studies (Han et al., 2017; Shen et al., 2017). Comprised of more than 200,000 unique spacer pairs, our 2S library revealed many pairwise genetic perturbations that enhanced antibiotic resistance, the great majority of which were corroborated by our one-versus-all libraries and fitness measurement. However, we noted that, although the 2S library can capture more pairwise perturbations at the gene level, individual one-versus-all libraries were more quantitative. This is because the crRNAs targeting each gene in the 2S library are significantly fewer than those in one-versus-all libraries, compromising its sensitivity. Therefore, further increasing the activity of the CRISPR adaptation machinery while decreasing its adaptation bias toward Ori would be critical for creating more diverse and sensitive 2S libraries. To balance diversity and quantification, one may also consider creating 2S libraries on the scale of 10-versus-all or 100-versus-all, in which the preceding 1S library could be manually cloned or array synthesized, followed by CRISPR adaptation. Because the number of sequencing reads becomes a limiting factor when studying pairwise perturbation, designing such small-scale 1S libraries, preferably with a validated pool of crRNAs, could significantly benefit downstream quantification.
One unique feature of the canonical CRISPR array is that the order of the acquired spacers in the array can uncover how historical contingency between genetic perturbations constrain adaptive evolution. For instance, our 2S library provided strong genetic evidence that inactivation of the qox operon unlocked multiple contingent adaptive paths toward acquiring higher gentamicin resistance, such as inactivation of cydABCD and atoB (Figures 7B and S5F). We showed that the ratio of the two spacers in the array is a good indicator of such contingency, which can be obtained by sequencing a single sample at the terminal time point. If the activity of CRISPR adaptation can be further improved, then it is possible to iterate adaptation multiple times and, thus, study more complex genetic interactions. The ease with which CALM can generate comprehensive crRNA libraries and reveal epistasis and historical contingency should facilitate rapid determination of genetic architecture for diverse bacterial phenotypes. This foundation will be critical for understanding adaptive evolutionary trajectories, engineering synthetic bacteria for industrial and therapeutic applications, and developing rational antimicrobial strategies that are refractory to resistance.
STAR★METHODS
LEAD CONTACT AND MATERIALS AVAILABILITY
Further information and requests for resources and reagents should be directed to and will be fulfilled by the Lead Contact, Saeed Tavazoie (st2744@columbia.edu). All unique/stable reagents generated in this study are available from the Lead Contact with a completed Materials Transfer Agreement.
EXPERIMENTAL MODEL AND SUBJECT DETAILS
Bacterial strains and Culture Conditions
Cultivation of Staphylococcus aureus strains RN4220 (Nair et al., 2011), Newman (Bae et al., 2006), TB4 (Bae et al., 2006) and MW2 (Baba et al., 2002) were carried out in tryptic soy broth (TSB) medium (BD) at 37°C with shaking (rpm 220). Whenever necessary, tryptic soy agar (TSA) was supplemented with appropriate antibiotics to select for plasmid transformation. In these cases, the concentrations of antibiotics were as follows: chloramphenicol, 10 μg/mL; erythromycin, 10 μg/mL; tetracycline, 5 μg/mL.
Cultivation of Escherichia coli MG1655 was carried out in Luria-Bertani (LB) medium (BD) at 37°C with shaking (rpm 220). Whenever necessary, Luria-Bertani agar was supplemented with chloramphenicol (25 μg/mL) or kanamycin (50 μg/mL) to select for plasmid transformation.
METHOD DETAILS
Preparation of Electrocompetent S. aureus Cells
Preparation of S. aureus competent cells and DNA transformation was performed as previously described (Goldberg et al., 2014). Briefly, S. aureus RN4220 cells were grown overnight in TSB medium, diluted 1:100 in fresh medium, and allowed to grow until OD600 reached 1.0. Cells were pelleted at 4°C and washed two times using one volume of ice-cold sterile water. Cells were ultimately re-suspended in 1/100th volume of ice-cold 15% glycerol and 50 μL aliquots were stored at − 80°C.
Measurement of MICs
A single colony (106–107 CFUs) of S. aureus RN4220 cells harboring single- or dual-spacers was suspended in 100 μL of TSB and 2.5 uL of the suspended cells were spotted on TSA containing a 2-fold dilution series of gentamicin (0.1 – 6.4 μg/mL). Cells were allowed to grow for 16 h at 37°C and the MIC was determined as the minimum antibiotic concentration where no bacterial growth was seen. All measurements were performed in triplicates.
Measurement of Bacterial Growth
Overnight cultures of S. aureus RN4220 cells harboring single- or dual-spacers were diluted 1:200 in 200 μL of fresh TSB medium supplemented with gentamicin (1 or 4 μg/mL) in 96-well flat bottom plates (Costar). Chloramphenicol (5 μg/mL) was always added to maintain plasmid pTHR (carrying tracr, hdcas9 and the spacer).
To check the effect of mevalonate and FAS inhibitors on gentamicin, overnight cultures of S. aureus RN4220 cells harboring pTHR (i.e., pWJ402) were diluted 1:200 in 200 μL of fresh TSB medium supplemented with various concentrations of gentamicin, mevalonate inhibitor (vanadyl sulfate) and FAS inhibitors (5-(tetradecyloxy)-2-furoic acid and cerulenin).
In all cases, cells were grown in a Biotek Synergy MX plate reader shaking continuously for 18 h at 37°C. The absorbance at 600nm (OD600) was measured every 10 minutes.
Extraction and Sonication of Genomic DNA
10 – 30 mL of S. aureus or E. coli or culture grown to saturation were pelleted and washed with 1 volume of TE buffer (pH 8.0). Pellets were re-suspended in ~3 mL of ice-cold TE buffer (pH 8.0). Every 500 μL of re-suspended cells was mixed with 500 μL of ice-cold Phenol/Chloroform/Isoamyl alcohol (25:24:1) (Fisher Scientific). The mixture was transferred into a 2 mL microtubes pre-filled with ~0.25 cm3 of glass beads (0.1 mm) on ice. Cells were disrupted using FastPrep-24 5G™ Homogenizer (MPBio) at 4°C. The default S. aureus or E. coli setting was used. The homogenized mixture was centrifuged at 16,000 rcf. for 10 min at room temperature. The aqueous phase was collected and mixed with 500 μL of chloroform and centrifuged as above. The aqueous phase was collected again, mixed with 1 mL of isopropanol, gently inverted several times, incubated for 10 min at room temperature and centrifuged. Precipitated genomic DNA was washed with 1 mL of 75% ethanol, air-dried and dissolved in 50–300 μL of water.
Genomic DNA was sonicated in 130 μL total volume in microTUBE AFA Fiber Pre-Slit Snap-Cap 6 × 16 mm tubes (Covaris) using the Covaris S220 Focused-ultrasonicator to a fragment size of 150 bp. The sonicated DNA was dialysed before electroporation.
Cloning
Key plasmid sequences are available on https://tavazoielab.c2b2.columbia.edu/CALM/
Plasmid pWJ402 was constructed by Gibson assembly of two PCR products. One PCR was performed using plasmid pRH154 and primers JW756 and W1301. Another PCR was performed using plasmid pGG32 and primers W1302 and JW755.
Plasmid pWJ406 was constructed by Gibson assembly of two PCR products. One PCR was performed using plasmid pDB114 and primers W1309 and W1310. Another PCR was performed using plasmid pT181 and primers W1311 and W1312.
Plasmid pWJ411 was constructed by Gibson assembly of two PCR products. One PCR was performed using plasmid pWJ402 and primers W1523 and W1778. Another PCR was performed using plasmid pJW105 and primers W1777 and W1524.
Plasmid pWJ418 was constructed by Gibson assembly of two PCR products. One PCR was performed using plasmid pAV112B and primers W1339 and W1340. Another PCR was performed using plasmid pLM9 and primers W1341 and W1342.
Plasmid pWJ420 was constructed by Gibson assembly of two PCR products. One PCR was performed using plasmid pE194 and primers W795 and W1011. Another PCR was performed using plasmid pWJ418 and primers W1363 and W1364.
Plasmid pWJ424 was constructed by Gibson assembly of two PCR products. One PCR was performed using plasmid pWJ402 and primers W852 and W1374. Another PCR was performed using plasmid pDB182 and primers W1373 and W614.
Plasmid pWJ444 was constructed by Gibson assembly of two PCR products. One PCR was performed using plasmid pWJ424 and primers W852 and W1540. Another PCR was performed using plasmid pWJ402 and primers W1541 and W614.
Plasmid pWJ445 was constructed by Gibson assembly of two PCR products. One PCR was performed using plasmid pWJ40 (Goldberg et al., 2014) and primers W1581 and W1582. Another PCR was performed using plasmid pdcas9-bacteria (Qi et al., 2013) and primers W1583 and W1584.
Plasmid pWJ450 was constructed by Gibson assembly of two PCR products. One PCR was performed using plasmid pJW104 and primers W1789 and W1792. Another PCR was performed using plasmid pWJ104 and primers W1790 and W1791.
Plasmid pWJ571 was constructed by Gibson assembly of two PCR products. One PCR was performed using plasmid pZE21-MCS-1 (Lutz and Bujard, 1997) and primers W1578 and W1668. Another PCR was performed using plasmid pWJ402 and primers W1879 and W1880.
Similar to a previous study (Bikard et al., 2013), spacer cloning was performed by ligation of annealed oligonucleotide pairs and BsaI-digested parent vector, pWJ444 or pWJ406. The spacer sequences are shown in Table S4.
All PCRs and Gibson assembly reactions were performed using Q5® High-Fidelity DNA Polymerase and NEBuilder® HiFi DNA Assembly Master Mix supplied by NEB, respectively. Cloning used S. aureus RN4220 or E. coli MG1655 electrocompetent cells. Name and content of all plasmids, and oligonucleotide sequences are shown in Table S4.
S. aureus Harboring CRISPR Adaptation Machinery (hdcas9) Generates Single-spacer (1S) Libraries Targeting S. aureus
As explained in the main text, the terms “crRNA” and “spacer” are used interchangeably throughout.
Generation of crRNA libraries by CRISPR-Cas adaptation
The crRNA libraries generated in the following protocol are intended to be used directly in S. aureus. First, a single colony of S. aureus RN4220 or wild-type strains (e.g., MW2) harboring the chloramphenicol-resistant pTHR (i.e., plasmid pWJ402, which carries tracr, hdcas9 and an empty CRISPR array) and the tetracycline-resistant pCCC (i.e., pWJ418, which carries cas1, cas2 and csn2 under an IPTG-inducible promoter, pSpac) was grown overnight in 4 mL of TSB with chloramphenicol (5 μg/mL) and tetracycline (2.5 μg/mL). Culture was diluted 1:200 in 15 mL of fresh TSB (no antibiotics) with 2 mM IPTG to induce the expression of Cas1, Cas2 and Csn2 and grown until OD600 reached 1.0 (typically 3 – 4 h). To make competent cells, cells were pelleted and washed two times using one volume of sterile water at room temperature. (Cells prepared at 4°C contained libraries with considerably more spacers matching the two helper plasmids.) Cells were ultimately re-suspended in 1/100th volume of sterile water.
50 μL of competent cells were mixed with 20 μg (usually in 10 μL) of sheared genomic DNA prepared from the same host and incubated 5 min at room temperature. Electroporation was performed using MicroPulser (Bio-Rad) with the default staph program (2 mm, 1.8 kV and 2.5 ms). Of note, we found ~50% of the cells were killed by electroporation, which was moderate. After electroporation, cells were immediately re-suspended in 500 μL of TSB and recovered at 37°C for 15 min with shaking. Next, 200 μL of recovered cells were transferred to 15 mL of pre-warmed TSB with chloramphenicol (5 μg/mL) and recovered for an additional 5 h at 37°C with shaking. CRISPR adaptation happened during this recovery period. Recovery less than 5 h was not tested but may have still worked.
Essentially, a crRNA library was made after the 5-hour CRISPR adaptation/recovery phase. At this point, this library culture was typically at OD600 = 3.0 or 109 CFU/mL. As estimated by enrichment PCR assays, 0.1 – 1% of cells had adapted one spacer. Typically, 15 mL of the library culture was pelleted, lysed, amplified by PCR and sent for Illumina sequencing while 6 mL of library culture was subjected to experimental procedures (e.g., gentamicin treatment).
Exposure of single-spacer (1S) libraries to gentamicin
S. aureus RN4220 1S library generated with a hyperactive CRISPR adaptation machinery carrying hdCas9 was subjected to treatment of low or high concentration of gentamicin (1.0 μg/mL or 4.0 μg/mL, respectively).
For long-term exposure to gentamicin, 6 mL of library (i.e., cells recovered after CRISPR adaptation) was transferred to 500 mL of TSB (pre-warmed at 37°C) with chloramphenicol (5 μg/mL) and appropriate concentration of gentamicin and grown for 18 h at 37°C, 220 rpm. After selection, 12 mL of culture were pelleted, lysed, amplified by PCR and sent for Illumina sequencing. Selection in both low and high concentration of gentamicin was performed three times.
For short-term exposure to gentamicin, 20 mL of library was transferred to 500 mL of TSB (pre-warmed at 37°C) with chloramphenicol (5 μg/mL) and gentamicin (1 μg/mL) and grown for 4.5 h at 37°C, 220 rpm. After selection, 400 mL of culture were pelleted, lysed, amplified by PCR and sent for Illumina sequencing. As a control, 20 mL of library was also transferred to 500 mL TSB (pre-warmed at 37°C) with chloramphenicol (5 μg/mL) but no gentamicin (plain control) and grown for 4.5 h at 37°C, 220 rpm. After growth, 200 mL of culture were pelleted, lysed, amplified by PCR and sent for Illumina sequencing.
Outgrowing single-spacer (1S) libraries for identifying essential genes
To identify essential genes, 6 mL of S. aureus RN4220 1S library was transferred to 500 mL of TSB (pre-warmed at 37°C) with chloramphenicol (5 μg/mL) and grown for 9 h at 37°C, 220 rpm. After outgrowth, 12 mL of culture were pelleted, lysed, amplified by PCR and sent for Illumina sequencing. Outgrowth was performed in triplicates.
Illumina sequencing
S. aureus RN4220 crRNA libraries (15 mL) or cells after gentamicin treatment (12 mL) were pelleted and re-suspended in 5 mL of P1 buffer (QIAGEN) supplemented with lysostaphin (1 μg/mL). Mixture was incubated for 1 h at 37°C. Next, Miniprep was performed following the QIAGEN protocol. To note, one column was used per sample and 70 – 120 μL of H2O was used to elute plasmid DNA. The final concentration of DNA ranged from 100 to 400 ng/uL.
As CRISPR adaptation is of low frequency, to detect adaptation, enrichment PCR was performed similar to our previous study (Modell et al., 2017) with slight modifications. For each sample, a 60 μL reaction mix was prepared by adding 100 ng of plasmid DNA as template, 0.5 uM of forward primer (W1201), 0.5 uM of reverse enrichment primers (equimolar mixture of W1202, W1203, W1204) and Q5® High-Fidelity DNA polymerase (NEB). PCR was performed using a C1000™ Thermal Cycler (Bio-Rad) with the following settings. Initial denaturation: 98°C for 30 s; 18–29 cycles (depending on rate of CRISPR adaptation): 98°C for 10 s, 61°C for 20 s and 72°C for 30 s; final extension: 72°C for 2 min. PCR products were either visualized on a 2% agarose gel or purified with AMPure XP beads (Beckman Coulter). The amount of the beads used was adjusted to maximize the removal of the smaller non-adapted amplicons and retention of the larger adapted ones. Beads were eluted in 1 volume of H2O.
To prepare samples for sequencing, a second PCR was performed to introduce the Illumina adaptor sequences to the purified amplicons from the previous PCR. A 150 μL reaction mix was prepared by adding 3 μL of the purified amplicons as template, 0.5 uM of forward primer, 0.5 uM of reverse primer and Q5® High-Fidelity DNA polymerase (NEB). One forward primer was chosen from the following: W1407, W1409, W1410, W1411, W1417, W1418 and W1419, all containing the Illumina universal adaptor sequences and various customized internal barcodes. One reverse primer was chosen from the following: W1408 and W1426, both containing the Illumina adaptor and index sequences. All these primers were PAGE purified (IDT). PCR was performed using a C1000™ Thermal Cycler (Bio-Rad) with the following settings. Initial denaturation: 98°C for 30 s; 6 cycles: 98°C for 10 s, 55°C for 20 s and 72°C for 20 s; final extension: 72°C for 2 min. PCR products were purified with AMPure XP beads (Beckman Coulter) two times. The amount of the beads used was adjusted to maximize the removal of non-adapted amplicons and retention of adapted ones. Purified amplicons were subjected to the Illumina NextSeq platform.
S. aureus Harboring CRISPR Adaptation Machinery (hcas9) Generates Single-spacer (1S) Libraries Targeting E. coli Generation of crRNA libraries by CRISPR-Cas adaptation
As hdCas9 was replaced by hCas9 to avoid CRISPR adaptation from self-DNA, the crRNA libraries generated in the following protocol are intended to be sub-cloned to other organisms (e.g., E. coli). First, a single colony of S. aureus RN4220 harboring the chloramphenicol-resistant pTHR (i.e., plasmid pWJ411, which carries tracr, hcas9 and an empty CRISPR array) and the tetracycline- or erythromycin-resistant pCCC (i.e., pWJ418 or pWJ420, respectively. Both plasmids carry cas1, cas2 and csn2 under an IPTG-inducible promoter, pSpac.) was grown overnight in 4 mL of TSB with chloramphenicol (5 μg/mL) and tetracycline (2.5 μg/mL) or erythromycin (5 μg/mL). Culture was diluted 1:200 in 15 mL of fresh TSB (no antibiotics) with 2 mM IPTG to induce the expression of Cas1, Cas2 and Csn2 and grown until OD600 reached 1.0 (typically 3 – 4 h). To make competent cells, cells were pelleted and washed two times using one volume of sterile water at room temperature. (Cells prepared at 4°C contained libraries with considerably more spacers matching the two helper plasmids.) Cells were ultimately re-suspended in 1/100th volume of sterile water.
50 μL of competent cells were mixed with 20 μg (usually in 10 μL) of sheared genomic DNA prepared from organisms of interest (e.g., E. coli) and incubated 5 min at room temperature. Electroporation was performed using MicroPulser (Bio-Rad) with the default staph program (2 mm, 1.8 kV and 2.5 ms). After electroporation, cells were immediately re-suspended in 500 μL of TSB and recovered at 37°C for 15 min with shaking. Next, 400 μL of recovered cells were transferred to 30 mL of pre-warmed TSB with chloramphenicol (5 μg/mL) and recovered for an additional 5 h at 37°C with shaking. At this point, the culture was typically at OD600 = 3.0 or 109 CFU/mL. An aliquot (15 mL) was pelleted, lysed and minipreped, generating M2140 (if pCCC is pWJ418) and M2143 (if pCCC is pWJ420). To further eliminate undesired crRNAs targeting S. aureus or the helper plasmids, 7 mL of the culture was transferred to 500 mL TSB with chloramphenicol (5 μg/mL) and tetracycline (2.5 μg/mL) or erythromycin (5 μg/mL), and grown for 10 h. Typically, 15 mL of this resulting library culture was pelleted, lysed and minipreped (QIAGEN), generating M2141 (if pCCC is pWJ418) and M2144 (if pCCC is pWJ420). These minipreped DNAs were later PCR amplified for sub-cloning (see below). Additionally, samples M2143 and M2144 were used to predict crRNA cleavage activity (see section “Predictive Model of crRNA Activity”)
Notice that we constructed two different pCCCs here, pWJ418 and pWJ420, each with a different origin of replication and antibiotic resistant marker. In our experience, we found crRNA libraries generated with pWJ418 had larger percentage of spacers matching the genome (pWJ418: 90% versus pWJ420: 83%, Figure S4B), while libraries generated with pWJ420 had greater spacer diversity (pWJ418: 386,032 unique spacers versus pWJ420: 424,473 unique spacers, Table S1B). As the growth rate of cells harboring either plasmid was indistinguishable from each other, we recommend mixing these two cell types at a 1:1 ratio and preparing competent cells together in order to generate more diverse crRNA libraries.
Sub-cloning
To sub-clone this library to the organism of interest (e.g., E. coli), enrichment primers were necessary as only 0.1 – 1% of cells contained an adapted spacer after CRISPR adaptation. Sub-cloning was done by Gibson assembly of an insert PCR and a backbone PCR.
For the insert PCR, every 50 μL reaction mix was prepared by adding 375 ng of equimolar mixture of M2141 and M2144 as template, 0.5 uM of forward enrichment primers (equimolar mixture of W1397, W1398 and W1399), 0.5 uM of reverse primer (W1887) and Q5® High-Fidelity DNA polymerase (NEB). PCR was performed using a C1000™ Thermal Cycler (Bio-Rad) with the following settings. Initial denaturation: 98°C for 30 s; 26 cycles: 98°C for 10 s, 65°C for 20 s and 72°C for 30 s; final extension: 72°C for 2 min. PCR products were subjected to a 2-step purification with AMPure XP in order to remove the large-sized plasmid template and the small-sized non-adapted amplicons. Briefly, PCR products were mixed with 0.5X volume of beads, let settled and supernatant was transferred to 0.3X volume of beads and proceeded with purification. Beads were eluted in H2O, generating C2185.
For the backbone PCR, every 50 μL reaction mix was prepared by adding 0.4 ng of plasmid pWJ571 as template, 0.2 uM of forward primer (W1889), 0.2 uM of reverse primers (W1891) and OneTaq® DNA polymerase (NEB). PCR was performed with the following settings. Initial denaturation: 94°C for 30 s; 30 cycles: 94°C for 20 s, 55°C for 20 s and 68°C for 2 min; final extension: 68°C for 5 min. PCR products were purified with QIAquick PCR purification kit (QIAGEN), generating C2184.
10 μL of Gibson reaction was performed by mixing 100 ng of insert PCR (in 2 μL), 800 ng of backbone PCR (in 3 μL) and NEBuilder HiFi DNA Assembly Master Mix (NEB) and incubating 30 min at 50°C. The insert PCR was at ~1.7X excess. Ligated products were dialyzed, and 5 μL of it was transformed into electro-competent E. coli MG1655 cells harboring pWJ445 (plasmid with inducible dCas9). Electroporation was performed using MicroPulser (Bio-Rad) with the default E. coli program 1 (1 mm, 1.8 kV and 6.1 ms) and cells were recovered in 500 μL of SOC medium for 1.5 h at 37°C. Transformation efficiency was routinely at 5% ± 2% of the population.
To select for transformants, recovered cells (500 μL) were transferred to 250 mL LB with kanamycin (50 μg/mL) and grown for 4.5 h at 37°C (OD600 reached ~0.3, equivalent to ~108 CFU/mL). This extent of selection was sufficient as ~100% of cells were kanamycin-resistant at this point.
Illumina sequencing
100 mL of cells selected in liquid medium containing kanamycin were pelleted and minipreped (QIAGEN). Since sub-cloning was done and the majority of plasmids extracted from cells contained a spacer, enrichment PCR was not necessary. For each sample, a 60 μL reaction mix was prepared by adding 100 ng of plasmid DNA as template, 0.5 uM of forward primers (equimolar mixture of W1397, W1398, W1399 and W1400), 0.5 uM of reverse primer (W1699) and Q5® High-Fidelity DNA polymerase (NEB). PCR was performed using a C1000™ Thermal Cycler (Bio-Rad) with the following settings. Initial denaturation: 98°C for 30 s; 12 cycles: 98°C for 10 s, 55°C for 20 s and 72°C for 30 s; final extension: 72°C for 2 min. PCR products were either visualized on a 2% agarose gel or purified with AMPure XP beads (Beckman Coulter). The amount of the beads used was adjusted to maximize the removal of the smaller non-adapted amplicons and retention of the larger adapted ones. Beads were eluted in 1 volume of H2O.
To prepare samples for sequencing, a second PCR was performed to introduce the Illumina adaptor sequences to the purified amplicons from the previous PCR. A 150 μL reaction mix was prepared by adding 3 μL of the purified amplicons as template, 0.5 uM of forward primer, 0.5 uM of reverse primer and Q5® High-Fidelity DNA polymerase (NEB). The forward primer was either W1434 or W1435, both containing the Illumina universal adaptor sequences and customized internal barcodes. The reverse primer was W1427, which contained the Illumina adaptor and index sequences. All these primers were PAGE purified (IDT). PCR was performed using a C1000™ Thermal Cycler (Bio-Rad) with the following settings. Initial denaturation: 98°C for 30 s; 6 cycles: 98°C for 10 s, 55°C for 20 s and 72°C for 30 s; final extension: 72°C for 2 min. PCR products were purified with AMPure XP beads (Beckman Coulter) two times. The amount of the beads used was adjusted to maximize the removal of the smaller non-adapted amplicons and retention of the larger adapted ones. Purified amplicons were subjected to the Illumina NextSeq platform.
E. coli Harboring CRISPR Adaptation Machinery (dcas9) Generates Single-spacer (1S) Libraries Targeting E. coli
A single colony of E. coli MG1655 harboring plasmid pWJ450 (which carries tracr, dcas9, cas1, cas2, csn2 and an empty CRISPR array) was grown overnight in 4 mL of LB with chloramphenicol (25 μg/mL). Culture was diluted 1:200 in 15 mL of fresh LB (no antibiotics) and grown until OD600 reached 0.5 – 0.6. Cells were pelleted and washed two times using one volume of sterile water at room temperature. Cells were ultimately re-suspended in 1/200th volume of sterile water.
50 μL of cells were mixed with 20 μg (usually in 10 μL) of sheared genomic DNA prepared from MG1655. Electroporation was performed using MicroPulser (Bio-Rad) with the default E. coli program 1 (1 mm, 1.8 kV and 6.1 ms). After electroporation, cells were immediately re-suspended in 500 μL of LB and recovered at 37°C for 15 min with shaking. Next, 200 μL of recovered cells were transferred to 15 mL of pre-warmed LB with chloramphenicol (12.5 μg/mL) and recovered for an additional 9 h at 37°C with shaking.
Generation of “One-vs-all” Libraries by CRISPR-Cas Adaptation in S. aureus with hdCas9
Generation of “one-vs-all” libraries by CRISPR-Cas adaptation
Three spacers targeting qoxA, ndh and mvaS were cloned into pTHR, generating plasmids pWJ451, pWJ455 and pWJ578, respectively. All plasmids carried tracr, hdcas9 and the respective spacer targeting the gene of interest.
A single colony of S. aureus RN4220 harboring the chloramphenicol-resistant pTHR (e.g., pWJ451, targeting qoxA) and the tetracycline-resistant pCCC (i.e., pWJ418, which carries cas1, cas2 and csn2 under an IPTG-inducible promoter, pSpac) was grown overnight in 4 mL of TSB with chloramphenicol (5 μg/mL) and tetracycline (2.5 μg/mL). Culture was diluted 1:200 in 15 mL of fresh TSB with 2 mM IPTG to induce the expression of Cas1, Cas2 and Csn2 and grown until OD600 reached 1. TSB was further supplemented with low concentration of gentamicin (0.5 μg/mL) for cells harboring either qoxA- or ndh-targeting plasmids. Cells were pelleted and washed two times using one volume of sterile water at room temperature. Cells were ultimately re-suspended in 1/100th volume of sterile water.
50 μL of competent cells were mixed with 20 μg (usually in 10 μL) of sheared genomic DNA prepared from RN4220 and incubated 5 min at room temperature. Electroporation was performed using MicroPulser (Bio-Rad) with the default staph program (2 mm, 1.8 kV and 2.5 ms). After electroporation, cells were immediately re-suspended in 500 μL of TSB and recovered at 37°C for 15 min with shaking. Next, 200 μL of recovered cells were transferred to 15 mL of pre-warmed TSB with chloramphenicol (5 μg/mL) and recovered for an additional 5–7 h at 37°C with shaking. For cells harboring either qoxA- or ndh-targeting plasmids, TSB was further supplemented with gentamicin (1 μg/mL) during recovery.
Exposure of “one-vs-all” libraries to high dose of gentamicin
After recovery, the “one-vs-all” library culture was typically at OD600 = 3.0 or 109 CFU/mL. 15 mL of the library culture was pelleted, lysed, amplified by PCR and sent for Illumina sequencing. 6 mL of library culture was transferred to 500 mL of TSB (pre-warmed at 37°C) with chloramphenicol (5 μg/mL) and high dose of gentamicin (4 μg/mL) and grown for 18 h at 37°C, 220 rpm. After selection, 12 mL of culture were pelleted, lysed, amplified by PCR and sent for Illumina sequencing. Selection of the “qoxA-vs-all” library in high dose of gentamicin was performed in triplicates, while that of the “ndh-vs-all” and “mvaS-vs-all” libraries were each performed once.
Illumina sequencing
As CRISPR adaptation is of low frequency, to detect adaptation, enrichment PCR was performed similar to our previous study (Modell et al., 2017) with slight modifications. For each sample, a 60 μL reaction mix was prepared by adding 100 ng of plasmid DNA as template, 0.5 uM of forward primer, 0.5 uM of reverse primers and Q5® High-Fidelity DNA polymerase (NEB). The forward enrichment primers were an equimolar mixture of W1397, W1398 and W1399. The reverse primer was W1542 (for “qoxA-vs-all”), W1688 (for “ndh-vs-all”) and W1892 (for “mvaS-vs-all”), respectively. PCR was performed using a C1000™ Thermal Cycler (Bio-Rad) with the following settings. Initial denaturation: 98°C for 30 s; 18–29 cycles (depending on rate of CRISPR adaptation): 98°C for 10 s, 61°C for 20 s and 72°C for 30 s; final extension: 72°C for 2 min. PCR products were either visualized on a 2% agarose gel or purified with AMPure XP beads (Beckman Coulter). The amount of the beads used was adjusted to maximize the removal of non-adapted amplicons and retention of adapted ones. Beads were eluted in 1 volume of H2O.
To prepare samples for sequencing, a second PCR was performed to introduce the Illumina adaptor sequences to the purified amplicons from the previous PCR. A 150 μL reaction mix was prepared by adding 3 μL of the purified amplicons as template, 0.5 uM of forward primer, 0.5 uM of reverse primer and Q5® High-Fidelity DNA polymerase (NEB). One forward primer was chosen from the following: W1412, W1420, W1421, W1422, W1423, W1424, W1434 and W1435, all containing the Illumina universal adaptor sequences and various customized internal barcodes. One reverse primer was chosen from the following: W1425, W1427 and W1428, all containing the Illumina adaptor and index sequences. All these primers were PAGE purified (IDT). PCR was performed using a C1000™ Thermal Cycler (Bio-Rad) with the following settings. Initial denaturation: 98°C for 30 s; 6 cycles: 98°C for 10 s, 55°C for 20 s and 72°C for 20 s; final extension: 72°C for 2 min. PCR products were purified with AMPure XP beads (Beckman Coulter) two times. The amount of the beads used was adjusted to maximize the removal of non-adapted amplicons and retention of adapted ones. Purified amplicons were subjected to the Illumina NextSeq platform.
Generation of Dual-spacer (2S) Libraries in S. aureus with hdCas9
Generation of a 1S library
Generation of the dual-spacer (2S) library is schematized in Figure 6A. First, a single-spacer (1S) library was generated by CRISPR-Cas adaptation in S. aureus RN4220 with hdCas9 as described above. After CRISPR adaptation and recovery, 20 mL of this library culture was transferred to 500 mL of TSB (pre-warmed at 37°C) with chloramphenicol (5 μg/mL) and gentamicin (1 μg/mL) and grown for 9 h at 37°C, 220 rpm. After this mild selection, plasmid DNA was prepared from 30 mL of culture, generating M1906, which represented the 1S library.
Sub-cloning
After CRISPR adaptation, since only 0.1 – 1% of cells contained an adapted spacer, sub-cloning of the 1S library using enrichment primers was necessary in order to substantially increase DNA with adapted spacers in the library. Sub-cloning was done by Gibson assembly of an insert PCR and a backbone PCR.
For the insert PCR, a 140 μL reaction mix was prepared by adding 800 ng of M1906 as template, 0.5 uM of forward primer (W1521), 0.5 uM of reverse enrichment primers (equimolar mixture of W1202, W1203, W1204) and Q5® High-Fidelity DNA polymerase (NEB). PCR was performed using a C1000™ Thermal Cycler (Bio-Rad) with the following settings. Initial denaturation: 98°C for 30 s; 40 cycles: 98°C for 10 s, 65°C for 20 s and 72°C for 30 s; final extension: 72°C for 2 min. PCR products were subjected to a 2-step purification with AMPure XP in order to remove the large-sized plasmid template and the small-sized non-adapted amplicons. Briefly, PCR products were mixed with 0.8X volume of beads, let settled and supernatant was transferred to 0.3X volume of beads and proceeded with purification. Beads were eluted in H2O, generating C1976.
For the backbone PCR, a 50 μL reaction mix was prepared by adding 10 ng of plasmid pWJ402 as template, 0.5 uM of forward primer (W1522), 0.5 uM of reverse primer (W1525) and Q5® High-Fidelity DNA polymerase (NEB). PCR was performed using a C1000™ Thermal Cycler (Bio-Rad) with the following settings. Initial denaturation: 98°C for 30 s; 30 cycles: 98°C for 10 s, 55°C for 20 s and 72°C for 7 min; final extension: 72°C for 15 min. PCR products were purified with QIAquick PCR purification kit (QIAGEN), generating C1542.
10 μL of Gibson reaction was performed by mixing 70 ng of insert PCR, ~1 μg of backbone PCR and NEBuilder HiFi DNA Assembly Master Mix (NEB) and incubating 30 min at 50°C. The insert PCR was at ~2.5X excess. Ligated products were transformed into electro-competent S. aureus RN4220 cells.
Transformants were selected on TSA with chloramphenicol. After 16 h incubation at 37°C, a total of 20,000 CFU (in two plates) were obtained (5,000 – 10,000 CFU for every 10 μL Gibson reaction). These colonies were scraped using an L-shaped spreader and suspended in 1X PBS, lysed with lysostaphin and minipreped, generating the sub-cloned 1S library (sub1–1S). As estimated by PCR, ~70% of the sub1–1G library contained an adapted spacer while the rest had an empty array.
The sub1–1S library was concentrated by evaporation and transformed into electro-competent S. aureus RN4220 cells harboring pCCC (i.e., pWJ418). Transformed cells were selected on TSA with chloramphenicol and tetracycline. After 16 h incubation at 37°C, a total of 63,000 CFU (in three plates) were obtained. These colonies were scraped using an L-shaped spreader and suspended in 45 mL of 1X PBS. 10 mL of the suspended cells were lysed with lysostaphin and minipreped, generating M1983, which represented the sub-cloned 1S library immediately before the second round of CRISPR adaptation (sub2–1S).
Generation of a 2S library
For the second round of CRISPR adaptation, 450 μL of suspended cells (1.8 × 10⁹ CFU) were transferred to 90 mL of TSB with 2 mM IPTG and gentamicin (0.5 μg/mL) and grown until OD600 reached 1 (~3.5 h). Cells were washed and electroporated with genomic DNA prepared from RN4220 as described above. 200 μL of electroporated cells were re-suspended in 2 mL of TSB (scaled-up four times) and recovered at 37°C for 15 min with shaking. Next, 800 mL of recovered cells were transferred to 60 mL of pre-warmed TSB with chloramphenicol (5 μg/mL) and gentamicin (0.5 μg/mL) and recovered for an additional 6.5 h at 37°C with shaking.
After recovery, this library culture was at 2 × 10⁹ CFU/mL. 30 mL of the culture was pelleted, lysed and minipreped, generating M1984 which represented the 2S library. On the other hand, 10 mL × 3 of the 2S library culture were transferred to three different Erlenmeyer flasks each containing 500 mL of TSB (pre-warmed at 37°C) with chloramphenicol (5 μg/mL) and gentamicin (4 μg/mL), respectively. After 18 h growth at 37°C, 220 rpm, 25 mL of cells from each flask were pelleted, lysed and minipreped, generating M1985, M1986 and M1987, each representing the 2S library post-selection in high concentration of gentamicin (4 μg/mL).
Illumina sequencing
Three types of libraries were being prepared for sequencing: sub2–1S (i.e., M1983), pre-selected 2S (i.e., M1984) and post-selected 2S libraries (i.e., M1985, M1986 and M1987). These library cultures were pelleted and re-suspended in P1 buffer (QIAGEN) supplemented with lysostaphin (1 μg/mL). Mixture was incubated for 1 h at 37°C. Next, Miniprep was performed following the QIAGEN protocol. To note, one column was used per sample and 70 – 120 μL of H2O was used to elute plasmid DNA. The final concentration of DNA ranged from 500 to 900 ng/uL.
Sub2–1S library
To prepare the sub2–1S library (i.e., M1983) for sequencing, a 50 μL reaction mix was prepared by adding 50 ng of plasmid DNA as template, 0.5 uM of forward primer (W1782), 0.5 uM of reverse primer (M1783) and Q5® High-Fidelity DNA polymerase (NEB). PCR was performed using a C1000™ Thermal Cycler (Bio-Rad) with the following settings. Initial denaturation: 98°C for 30 s; 22 cycles: 98°C for 10 s, 55°C for 20 s and 72°C for 20 s; final extension: 72°C for 2 min. PCR products were purified with QIAquick PCR purification kit (QIAGEN) and eluted in 50 μL of H2O.
To prepare samples for sequencing, a second PCR was performed to introduce the full Illumina adaptor sequences to the purified amplicons from the previous PCR. A 250 μL reaction mix was prepared by adding 1 μL of the purified amplicons as template, 0.5 uM of forward primer, 0.5 uM of reverse primer and Q5® High-Fidelity DNA polymerase (NEB). The forward primer was P067, which contained a portion of the Illumina universal adaptor sequence. The reverse primer was P072, which contained the Illumina adaptor and index sequences. PCR was performed using a C1000™ Thermal Cycler (Bio-Rad) with the following settings. Initial denaturation: 98°C for 30 s; 5 cycles: 98°C for 10 s, 55°C for 20 s and 72°C for 20 s; final extension: 72°C for 2 min. PCR products were purified with AMPure XP beads (Beckman Coulter). The amount of the beads used was adjusted to maximize the removal of non-adapted amplicons and retention of adapted ones. Purified amplicons were subjected to the Illumina NextSeq platform (150 cycles).
Pre- and post-selected 2S libraries
To prepare the 2S libraries (i.e., M1984, M1985, M1986 and M1987) for sequencing, a 50 μL reaction mix was prepared by adding 500 ng of plasmid DNA as template, 0.5 uM of forward primer, 0.5 uM of reverse primer and Q5â High-Fidelity DNA polymerase (NEB) for each of these libraries. One forward primer was chosen from the following: W1779, W1780, W1781 and W1782, all containing a portion of Illumina universal adaptor sequences and various customized internal barcodes. The reverse primer was W1783, which contained a portion of an Illumina adaptor sequence. PCR was performed using a C1000™ Thermal Cycler (Bio-Rad) with the following settings. Initial denaturation: 98°C for 30 s; 25 cycles: 98°C for 10 s, 55°C for 20 s and 72°C for 35 s; final extension: 72°C for 2 min. PCR products were subjected to electrophoresis on a 2% agarose gel. Bands corresponding to amplicons with two spacers were excised and purified using an Ultrafree-DA Centrifugal Filter Unit (Millipore) and concentrated in 10 μL of H2O using DNA Clean & Concentrator (DCC-5, Zymo Research).
To prepare samples for sequencing, a second PCR was performed to introduce the full Illumina adaptor sequences to the purified amplicons from the previous PCR. A 250 μL reaction mix was prepared by adding 1.5 μL of the purified amplicons as template, 0.5 uM of forward primer, 0.5 uM of reverse primer and Q5® High-Fidelity DNA polymerase (NEB). The forward primer was P067, which contained a portion of the Illumina universal adaptor sequence. The reverse primer was either P071 or P072, both containing the Illumina adaptor and index sequences. All these primers were PAGE purified (IDT). PCR was performed using a C1000™ Thermal Cycler (Bio-Rad) with the following settings. Initial denaturation: 98°C for 30 s; 5 cycles: 98°C for 10 s, 55°C for 20 s and 72°C for 40 s; final extension: 72°C for 2 min. PCR products were purified with AMPure XP beads (Beckman Coulter) two times. The amount of the beads used was adjusted to maximize the removal of non-adapted amplicons (i.e., amplicons with one or no spacer) and retention of adapted ones (i.e., amplicons with two spacers). Purified amplicons were subjected to either the Illumina MiSeq platform (300 cycles) or NextSeq platform (150 cycles).
For sequencing 2S libraries, we found that the MiSeq platform generated data of consistently better quality than the NextSeq platform. Since the amplicon of our 2S libraries contained three CRISPR repeat sequences, we speculated that this may cause problems for the NextSeq platform. Notably, Illumina MiSeq and NextSeq platforms use different sequencing chemistry.
QUANTIFICATION AND STATISTICAL ANALYSIS
Data Analysis of Single-spacer (1S) and “One-vs-all” Libraries
Spacer identification and sequence alignment
First, for any genome, a list of all functional spacers (i.e., spacers with an “NGG” PAM) was created. Each spacer was uniquely identified by its strandedness and location in the genome. For instance, there are 136,928 unique functional spacers (i.e., occurrence of “NGG” on both strands of the DNA) in the S. aureus RN4220 genome.
From the FASTQ file generated by Illumina sequencing (NextSeq, 75 cycles), spacer sequences were identified by locating the two direct repeats flanking them. Spacers were aligned to chromosomal and plasmid genomes using “aln” and “samse” functions of the Burrows-Wheeler Alignment tool (Li and Durbin, 2009). The NCBI Staphylococcus aureus subsp. aureus NCTC8325 chromosome (NC_007795.1), Staphylococcus aureus subsp. aureus MW2 chromosome (BA000033.2) and Escherichia coli str. K-12 substr. MG1655 (NC_000913.3) were used as reference genomes.
From the output SAM file, only functional spacers (i.e., spacers with an “NGG” PAM) were considered for downstream analysis. The number of times each unique functional spacer appeared was recorded. The frequency of each spacer was calculated by dividing its number by the total number of chromosomal spacers.
Genome-wide spacer distribution at gene level
To assess the genome-wide spacer distribution at a gene level, the number of reads of all spacers matching each gene was summed and normalized to the gene length, getting Rgene 1, Rgene 2. Rgene N, where N is the number of genes in the genome. We then calculated the coefficient of variation (CVgene):
where σgene and μgene are the standard deviation and mean of all Rgenes, respectively. For E. coli, gene lacI was excluded due to its abnormal enrichment caused by the presence of a helper plasmid (Figure 1D).
Estimation of fitness effects using Z-score
The terms “crRNA” and “spacer” are used interchangeably throughout. The fitness effect of each spacer under antibiotic exposure was determined by its enrichment/depletion relative to the initial unselected library using the Z-score (Girgis et al., 2007). In the current study, at least six single-spacer (1S) libraries were made independently via a single round of CRISPR adaptation. The frequency of each spacer was log10 transformed (F) and its corresponding Z-score was calculated by:
where Fpost is the log-transformed frequency of the spacer in the post-selected sample, and Fm, pre and σpre are the mean and the standard deviation of the log-transformed frequency of the spacer in the six pre-selected 1S libraries.
Next, all Zspacers were grouped based on the genes they target (The region within 100 bp upstream of the start codon is also considered as part of the gene). To calculate the mean Z-score for each gene (Mean-Z), Z-scores of all individual spacers matching the gene were averaged after the removal of the lowest and highest Z-scores:
where spacers are ranked with their Z-scores from the lowest to the highest and N is the total number of spacers matching the gene. Removal of the lowest and highest Z-scores effectively eliminated spacers with off-target potentials (see below).
However, as Mean-Z severely underestimated fitness effects due to the conflation of ineffective spacers, we used two other metrics: High2/3-Z by averaging the second and third most enriched spacers (similar to work by Gilbert and colleagues who used the three strongest gRNAs (Gilbert et al., 2014)), or the 95th percentile of the Z-score of all spacers (except the lowest and the highest) targeting each gene:
The two metrics showed good correlation (R = 0.92, Figure S5B) and shared 96% of the top 25 most enriched genes (Table S1D). We chose P95-Z to represent the fitness effect of genes, as it was less prone to outliers than High2/3-Z while still effectively eliminated spacers with off-target potentials (see below).
1S libraries that were treated for 18 h with low (1.0 μg/mL) and high (4.0 μg/mL) concentration of gentamicin had three experimental replicates. Thus, for each gene, the mean of the Mean-Z, High2/3-Z and P95-Z from the triplicates were calculated and reported (Table S1D).
1S libraries that were treated for 4.5 h with no or low concentration of gentamicin (1.0 μg/mL) were performed once. Here we chose Mean-Z to represent the fitness effects, as the goal was to quantify the negative fitness effects (i.e., depletion of crRNAs) and neither High2/3-Z nor P95-Z was relevant. crRNA perturbations that potentiate the effect of antibiotics are expected to be significantly depleted in gentamicin but not in plain medium. Thus, we applied a filter so that we only considered genes whose Mean-Z was greater than −0.2 in plain medium and less than 0 in gentamicin (1 μg/mL). Next, for each gene, Z-score of all individual crRNAs from the two conditions were subjected to a Mann-Whitney U test in order to determine whether a significant portion of Zspacers were lower in gentamicin. See also Table S1G.
1S library treated for 9 h with low (1.0 μg/mL) concentration of gentamicin was performed once (Table S1H).
To identify essential genes, 1S library was outgrown for 9 h in plain media three times. For each gene, the mean of the Mean-ZCT from triplicates were calculated (Table S1I). To note, CT crRNAs of essential genes were depleted to some degree in the initial pre-selected 1S libraries but were further depleted after 9-hour outgrowth.
Consideration of spacers with off-target potentials
In all the aforementioned metrics (Mean-Z, High2/3-Z and P95-Z), we eliminated spacers with the lowest and highest Z-scores for each gene. Doing so effectively reduced the probability of including faulty spacers with potential off-target effect when quantifying each gene’s fitness effect. Indeed, when ranking genes by the highest Z-score (High-Z) targeting them, we found many top hits were faulty, as they were targeted by only one spacer with high Z-score (Table S1D). These genes included SAOUHSC_01257, SAOUHSC_00628, SAOUHSC_03037, SAOUHSC_03016 and SAOUHSC_00266 (see Figures S6O–S6S) and “Mean of High-Zs” column in Table S1D). Further examination revealed that these spacers had extensive seed-sequence homology (10-nt or more from the PAM-proximal end) and correct PAMs to non-neutral off-target sites within genes such as qoxA, qoxC and mnhA. Here, a gene is defined as non-neutral if repression of it by CRISPRi increases cell’s fitness in gentamicin.
In order to exclude off-target spacers, we applied a filter in which spacers with 10-nt or more of their seed sequence matching another genomic site with a correct PAM were excluded from analysis. As a result, 37% spacers from the library were excluded by this filter, which effectively reduced the number of genes that were targeted by only one spacer with high Z-score. However, when comparing the P95-Zs obtained with and without this off-target filter, we found that 29 out of 30 top hits were the same (compare the “Mean of P95-Zs” columns in Tables S1D and S1E), suggesting that the off-target filter may not be necessary.
Taken together, we decided to not apply the off-target filter because: (i) The similarity between the results from these two pipelines indicates elimination of the highest Z-score for each gene alone effectively excluded spacers with off-target potentials; (ii) Genes containing more than one spacer with off-target potential on other non-neutral genes are extremely rare. Plus, top enriched hits (e.g., top 30) identified with either pipeline contained multiple spacers with high Z-score (column “ranked Zs” in Table S1D), suggesting they were bona fide hits. (iii) The off-target filter excluded 37% of spacers (in our case the vast majority of these spacers have neutral off-targets), compromising the coverage and sensitivity of our 1S and 2S CRISPRi screens. For instance, our pipeline with off-target filter failed to identify the essential gene, mvaK2 as a hit after gentamicin (1 μg/mL) treatment (compare Tables S1D and S1E).
Computational sampling
100 low-diversity crRNA libraries were simulated by computational sampling our comprehensive crRNA libraries (either 18-h or 4.5-h selection) generated by CRISPR adaptation. In each sampling, 10 random crRNAs per gene from these comprehensive crRNA libraries were selected. P95-Zs and -log(P) values (Mann-Whitney U test) were calculated as previously.
Estimation of fitness effects using Log2FC (for 1S and “one-vs-all libraries)
The fold-change between post-selected and pre-selected libraries was also used as a measure of fitness effect. Log2 of the fold-change (Log2FC) of each spacer was calculated by:
where fpost and fpre are the frequency of the spacer in the post-selected and pre-selected libraries, respectively. P95-Log2FC was calculated similar to the P95-Z. For each gene, the mean of the P95-Log2FCs from the triplicates were reported, and a one-sample t test (one-tailed) between the triplicates of P95-Log2FCs and 0 (i.e., fold-change of 1) was performed. In cases where the P95-Log2FC value was not present in triplicates post-selection, a t test could not be performed and P value was assigned “N/A.”
The fold-change and Z-score calculations showed good cor relation for enriched genes (R = 0.96, Figure S5C) and shared 92% (23/25) of the top enriched genes (Compare Tables S1D and S1F). However, we preferred using P95-Z to P95-Log2FC whenever possible as we had six pre-selected 1S libraries, making Z-score analysis more statistically robust.
Estimating epistasis
In the absence of a genetic interaction, the fitness of a double mutant is expected to be the product of the individual fitness of the two single mutants (Phillips, 2008; Segrèt al., 2005). Epistasis (ε) measures the deviation from this expectation:
where WX, Y is the fitness of the double genetic perturbation, and WX and WY are the fitness of the single genetic perturbations in genes X and Y, respectively.
We selected 10 representative strains harboring single- and dual-spacers and measured their fitness by pairwise competition assays in gentamicin (See “Pairwise competition assay” below). As the measured fitness and Log2FC of individual spacers from deep sequencing exhibited a high correlation (Figure S8G), we used Log2FC as a proxy to estimate epistasis between qoxA and gene X:
where Log2FCqoxA, X is the Log2FC of gene X measured in the “qoxA-vs-all” library, representing the combined fitness effect of repressing qoxA and gene X, Log2FCqoxA and Log2FCX are the Log2FCs measured in the 1S library, representing the fitness effect of repressing either qoxA or gene X, respectively. All measurements were performed in gentamicin (4.0 μg/mL).
Pairwise competition assay
S. aureus RN4220 cells harboring no spacer (pWJ402, representing wild-type) and single spacers targeting qoxA, ndh, mvaD, atoB, cydA and SAOUHSC_01269 were constructed. All these spacers were cloned into the pWJ402 backbone with a chloramphenicol-resistant (cmR) marker. Cells harboring these plasmids were also co-transformed with a tetracycline-resistant (tetR) plasmid harboring an empty CRISPR array.
S. aureus RN4220 cells harboring dual-spacers were generated by co-transforming the cmR pWJ451 (qoxA-targeting) and a tetR plasmid harboring a spacer that targets one of the following genes: ndh, mvaD, atoB, cydA and SAOUHSC_01269.
All strains harboring single-spacers and dual-spacers were competed with an RN4220 strain harboring two plasmids, pWJ451 (qoxA-targeting, cmR) and pE194, an empty erythromycin-resistant (ermR) plasmid. This strain rather than the wild-type was chosen as the common competitor because measurements are more precise when the two competitors have similar fitness than when one is substantially more fit than the other (Wiser and Lenski, 2015).
Importantly, the presence of all resistance cassettes (cmR, tetR and ermR) did not change the MIC of gentamicin (data not shown). Additionally, we determined that plasmids carrying the tetR and ermR cassettes (i.e., pT181 and pE194) were stable without selection, as 100/100 colonies we checked by replica plating maintained the plasmid after growing in plain medium for 11 h (the same amount of time used for pairwise competition). Detailed experimental procedures of the pairwise competition assay are as follows.
A single colony of S. aureus RN4220 harboring a cmR plasmid (e.g., pWJ451, qoxA-targeting) and tetR plasmid (e.g., pWJ481, ndh-targeting) was grown overnight in 4 mL of TSB with chloramphenicol (5 μg/mL) and tetracycline (2.5 μg/mL). A single colony of the common competitor, S. aureus RN4220 harboring pWJ451 (qoxA-targeting, cmR) and pE194 (ermR) was grown overnight in 4 mL of TSB with chloramphenicol (5 μg/mL) and erythromycin (5 μg/mL). The two overnight cultures were washed in 1X PBS and equal CFU of the two cultures were mixed based on OD600. Next, the OD600 of the mixed culture was measured and 375 units of cells (e.g., if OD600 = 3.75, use 100 μL) were transferred to 7.5 mL of TSB with chloramphenicol (5 μg/mL). Cultures were grown for 11 h and aliquots of cells at T = 0 and T = 11 h were plated onto TSA with chloramphenicol (10 μg/mL) and tetracycline (5 μg/mL) or TSA with chloramphenicol (10 μg/mL) and erythromycin (10 μg/mL). Agar plates were incubated 16–24 h at 37°C and colonies were enumerated.
Fitness of strain X (WX) was calculated as relative to that of the common competitor:
where NX and NC are the population sizes of strain X and the common competitor, and subscripts f and i indicate the final and initial time points, respectively.
Data Analysis of Dual-spacer (2S) Libraries
Spacer identification and sequence alignment
First, for any genome, a list of all functional spacers (i.e., spacers with an “NGG” PAM) was created. Each spacer was uniquely identified by its strandedness and location in the genome. For instance, there are 136,928 unique functional spacers (i.e., occurrence of “NGG” on both strands of the DNA) in the S. aureus RN4220 genome.
From the FASTQ file generated by Illumina sequencing (Miseq, 300 cycles), the two spacer sequences were identified by locating the three direct repeats flanking them. Spacers were aligned to chromosomal and plasmid genomes using “aln” and “samse” functions of the Burrows-Wheeler Alignment tool (Li and Durbin, 2009). From the output SAM file, only functional spacers (i.e., spacers with an “NGG” PAM) were considered for downstream analysis.
Quantification of spacer frequency at a gene level
Only reads containing two spacers were considered for this analysis. After selection in high [gent], spacer frequencies at a gene level from triplicates were calculated. For this analysis, we applied a more stringent filter in which we only considered genes that were targeted by an average of 3.5 unique spacers across triplicates, in order to avoid spacers with off-target potential. A total of 183 genes remained after this filter (Figure 6D).
Estimation of fitness effects using Log2FC
In order to estimate the fitness effect of spacer pairs containing qoxA (or qoxB, ndh, etc) in high [gent], the pairs containing qoxA were first sorted out from the pre- and post-selected 2S libraries (Tables S2A and S2C). Then, the log2 of the fold-change (Log2FC) of each qoxA-containing spacer pair was calculated:
where qoxA∷Spacer K denotes a spacer pair in which one spacer matched qoxA and Spacer K was any one of all 136,928 possible spacers targeting the genome. fpost and fpre are the frequency of the spacer pair in the post- and pre-selected 2S libraries, respectively.
Similar to the 1S libraries, all Log2FCqoxA∷Spacer Ks were grouped based on the non-qoxA gene Spacer K targeted, ranked, and P95-Log2FC for each gene was calculated. For each gene, the mean of the P95-Log2FCs from the triplicates were reported, and a one-sample t test (one-tailed) between the triplicates of P95-Log2FCs and 0 (i.e., fold-change of 1) was performed. In cases where the P95-Log2FC value was not present in all triplicates post-selection, a t test could not be performed and the P-value was assigned “N/A.” We only considered genes that were present in at least two of the three replicates. See Tables S2D–S2G.
When analyzing spacer pairs that were significantly enriched, we further applied a filter in which only genes that were targeted by more than 2 crRNAs post-selection were included. This was to avoid spacers with off-target potential. See column “Number of all crRNAs (combined from lib1,2,3 post-selection)” in Tables S2D–S2G.
Spacer order
For all post-selected gene pairs containing qoxA (i.e., qoxA∷gene X) or qoxB, the number of times gene X appeared as the first and the second spacer (N1 and N2, respectively) were recorded. To be stringent, we applied a filter such that we only analyzed pairs in which gene X was targeted by more than one unique spacer at the dominant spacer position from triplicates. In other words, if gene X appeared more often as Spacer 2 than as Spacer 1, Spacer 2 is the dominant position and our filter demanded that there were more than one unique spacer targeting gene X at the Spacer 2 position.
For each gene, the ratio of Spacer 2 to Spacer 1 (Spc2/Spc1) was calculated as N2/N1. N1 and N2 from triplicates were subjected to a Mann-Whitney U test to determine whether one spacer was significantly more abundant than the other.
We analyzed spacer order for pairs containing qoxA and qoxB, which were the two most abundant crRNA species among the 2S library after selection in high [gent] (Figure 6D). For the most enriched pairs containing qoxC, the third most abundant crRNA species, sequencing coverage dropped to a level (e.g., median number of reads for Spacer 2 was 8.5) where quantification of spacer ratio was no longer accurate (Figures S9I–S9K).
Predictive Model for crRNA Activity
Libraries M2143 (0-hour) and M2144 (10-hour outgrowth) were made using hCas9 as described in section “S. aureus Harboring CRISPR Adaptation Machinery (hcas9) Generates Single-spacer (1S) Libraries Targeting E. coli.” Log2FC of 8,491 crRNAs (with raw reads > 20) from these libraries were calculated as a proxy for cleavage activity and sorted (Table S3A). We then retained two categories for the most efficient (lowest 40% Log2FC) and least efficient crRNAs (top 10% Log2FC). As features for prediction, we considered the individual bases in the 20 nucleotides of the crRNA as well as 10 nucleotides upstream and downstream the target sequence on the genome. The nucleotide space was represented with one-hot encoding allowing for independent weights for each possible base (Doench et al., 2014). To predict whether a given crRNA has efficient cleavage activity or not, we trained a logistic regression model using Biopython’s LogisticRegression module. We estimated the overall performance of logistic regression under 3-fold cross-validation to prevent over-fitting the model. The model’s weights may be used to estimate the predictive score p seqi for any crRNA sequence:
where seqi is the 40-nt sequence used for prediction represented by features Fi(k,j);Fi(k,j) = 1 when j matches the nucleotide present in position k of seqi, otherwise Fi(k,j) = 0. The intercept is wo and wk,j are the feature weights for position k and base j. Parameters for a model trained on all available data are provided in Table S3C.
De novo Motif Discovery for crRNA Target Libraries
To systematically explore the space of sequence features within the first 9 nucleotides of the target sequence (positions −9 to −1) we used FIRE, a computational framework for the discovery of regulatory elements (Elemento et al., 2007). crRNAs were sorted with respect to their cleavage activity in the Cas9 assay into 7 bins, and examined for sequence features that are significantly informative of the cleavage activity for crRNAs that harbor them. We started by considering all possible 3-mers immediately upstream of the PAM (−3 to −1). The most informative 3-mers were retained as seeds, and optimized into more general motif representations (Elemento et al., 2007). FIRE was run with 3-fold cross-validation, whereby the dataset is partitioned into 3 sets − 2 parts are used as the training set for motif discovery and 1 set is set aside as a test set to evaluate the results (Vejnar et al., 2019). Motifs discovered on the training set were considered only if they exhibit significant mutual information in the test set (Z-score > 5) and have a pattern of over- and under-representation across categories that is similar to the representation pattern in the training set (correlation > 0.5). Source code for the FIRE algorithm with the cross-validation option is available at: https://tavazoielab.c2b2.columbia.edu/FIRE/
DATA AND CODE AVAILABILITY
The data that support the findings of this study are available from the Lead Contact upon reasonable request. The SRA accession number for NGS data is PRJNA595000. See also https://tavazoielab.c2b2.columbia.edu/CALM/
Supplementary Material
KEY RESOURCES TABLE
| REAGENT or RESOURCE | SOURCE | IDENTIFIER |
|---|---|---|
| Bacterial Strains | ||
| S. aureus RN4220 | Nair et al., 2011 | N/A |
| S. aureus Newman | Bae et al., 2006 | N/A |
| S. aureus TB4 | Bae et al., 2006 | N/A |
| S. aureus MW2 | Baba et al., 2002 | N/A |
| E. coli MG1655 | ATCC | ATCC® 700926 |
| Chemicals, Peptides, and Recombinant Proteins | ||
| Tryptic Soy Agar | Becton Dickinson | BD236950 |
| Tryptic Soy Broth | Becton Dickinson | BD211825 |
| Luria-Bertani Agar | Becton Dickinson | BD244520 |
| Luria-Bertani Broth | Becton Dickinson | BD244620 |
| Lysostaphin | Ambi Products | LSPN-50 |
| Gentamicin | GIBCO | Cat#15710064 |
| Chloramphenicol | Sigma-Aldrich | C0378 |
| Erythromycin | Sigma-Aldrich | E5389 |
| Tetracycline | Sigma-Aldrich | T3383 |
| Kanamycin | Sigma-Aldrich | K1637 |
| IPTG | Invitrogen | Cat#15529019 |
| Q5® High-Fidelity DNA polymerase | NEB | M0491L |
| NEBuilder® HiFi DNA Assembly Master Mix | NEB | E2621L |
| AMPure XP beads | Beckman Coulter | A63880 |
| Critical Commercial Assays | ||
| QIAprep Spin Miniprep Kit | QIAGEN | Cat#27104 |
| MiSeq Reagent Kit v2 (300-cycles) | Illumina | MS-102–2002 |
| NextSeq 500/550 High Output Kit v2.5 (75 Cycles) | Illumina | Cat#20024906 |
| Deposited Data | ||
| Next-generation sequencing FASTQ files | This paper | SRA: PRJNA595000 |
| Oligonucleotides | ||
| See Table S4 | This paper | N/A |
| Recombinant DNA | ||
| See Table S4 | This paper | N/A |
| Software and Algorithms | ||
| Burrows-Wheeler Alignment tool(BWA) | Li and Durbin, 2009 | http://bio-bwa.sourceforge.net/ |
| Python version 2.7 | Python Software Foundation | https://www.python.org |
| FIRE | Elemento et al., 2007 | https://tavazoielab.c2b2.columbia.edu/FIRE/ |
Highlights.
CRISPR adaptation converts genomic DNA into economical genome-wide crRNA libraries
Highly comprehensive libraries reveal genetic determinants of antibiotic sensitivity
Generation of diverse crRNA libraries in genetically recalcitrant bacteria
Dual-crRNA libraries reveal genetic interaction and historical contingency
ACKNOWLEDGMENTS
We thank the Tavazoie laboratory for insightful comments on the project. We are indebted to L. Marraffini (Rockefeller University) and J. Modell (Johns Hopkins University) for reagents and experimental assistance. W.J. is a Fellow of the Jane Coffin Childs Memorial Fund for Medical Research. This work was supported by a grant from NIH/NIAID (R01AI077562 to S.T.).
Footnotes
SUPPLEMENTAL INFORMATION
Supplemental Information can be found online at https://doi.org/10.1016/j.cell.2020.02.007.
DECLARATION OF INTERESTS
We declare the following provisional patent related to the manuscript: “Generation of Genome-wide CRISPR RNA Libraries Using CRISPR Adaptation in Bacteria.”
REFERENCES
- Amundsen SK, Spicer T, Karabulut AC, Londoño LM, Eberhart C, Fernandez Vega V, Bannister TD, Hodder P, and Smith GR (2012). Small-molecule inhibitors of bacterial AddAB and RecBCD helicase-nuclease DNA repair enzymes. ACS Chem. Biol 7, 879–891. [DOI] [PMC free article] [PubMed] [Google Scholar]
- Baba T, Takeuchi F, Kuroda M, Yuzawa H, Aoki K, Oguchi A, Nagai Y, Iwama N, Asano K, Naimi T, et al. (2002). Genome and virulence determinants of high virulence community-acquired MRSA. Lancet 359, 1819–1827. [DOI] [PubMed] [Google Scholar]
- Bae T, Banger AK, Wallace A, Glass EM, Aslund F, Schneewind O, and Missiakas DM (2004). Staphylococcus aureus virulence genes identified by bursa aurealis mutagenesis and nematode killing. Proc. Natl. Acad. Sci. USA 101, 12312–12317. [DOI] [PMC free article] [PubMed] [Google Scholar]
- Bae T, Baba T, Hiramatsu K, and Schneewind O (2006). Prophages of Staphylococcus aureus Newman and their contribution to virulence. Mol. Microbiol 62, 1035–1047. [DOI] [PubMed] [Google Scholar]
- Barrangou R, Fremaux C, Deveau H, Richards M, Boyaval P, Moineau S, Romero DA, and Horvath P (2007). CRISPR provides acquired resistance against viruses in prokaryotes. Science 315, 1709–1712. [DOI] [PubMed] [Google Scholar]
- Bassett AR, Kong L, and Liu JL (2015). A genome-wide CRISPR library for high-throughput genetic screening in Drosophila cells. J. Genet. Genomics 42, 301–309. [DOI] [PMC free article] [PubMed] [Google Scholar]
- Bayer AS, McNamara P, Yeaman MR, Lucindo N, Jones T, Cheung AL, Sahl HG, and Proctor RA (2006). Transposon disruption of the complex I NADH oxidoreductase gene (snoD) in Staphylococcus aureus is associated with reduced susceptibility to the microbicidal activity of thrombin-induced platelet microbicidal protein 1. J. Bacteriol 188, 211–222. [DOI] [PMC free article] [PubMed] [Google Scholar]
- Bikard D, Jiang W, Samai P, Hochschild A, Zhang F, and Marraffini LA (2013). Programmable repression and activation of bacterial gene expression using an engineered CRISPR-Cas system. Nucleic Acids Res. 41, 7429–7437. [DOI] [PMC free article] [PubMed] [Google Scholar]
- Blount ZD, Borland CZ, and Lenski RE (2008). Historical contingency and the evolution of a key innovation in an experimental population of Escherichia coli. Proc. Natl. Acad. Sci. USA 105, 7899–7906. [DOI] [PMC free article] [PubMed] [Google Scholar]
- Chaudhuri RR, Allen AG, Owen PJ, Shalom G, Stone K, Harrison M, Burgis TA, Lockyer M, Garcia-Lara J, Foster SJ, et al. (2009). Comprehensive identification of essential Staphylococcus aureus genes using Transposon-Mediated Differential Hybridisation (TMDH). BMC Genomics 10, 291. [DOI] [PMC free article] [PubMed] [Google Scholar]
- Chen JS, Dagdas YS, Kleinstiver BP, Welch MM, Sousa AA, Harrington LB, Sternberg SH, Joung JK, Yildiz A, and Doudna JA (2017). Enhanced proofreading governs CRISPR-Cas9 targeting accuracy. Nature 550, 407–410. [DOI] [PMC free article] [PubMed] [Google Scholar]
- Cui L, Vigouroux A, Rousset F, Varet H, Khanna V, and Bikard D (2018). A CRISPRi screen in E. coli reveals sequence-specific toxicity of dCas9. Nat. Commun 9, 1912. [DOI] [PMC free article] [PubMed] [Google Scholar]
- Deltcheva E, Chylinski K, Sharma CM, Gonzales K, Chao Y, Pirzada ZA, Eckert MR, Vogel J, and Charpentier E (2011). CRISPR RNA maturation by trans-encoded small RNA and host factor RNase III. Nature 471, 602–607. [DOI] [PMC free article] [PubMed] [Google Scholar]
- Doench JG, Hartenian E, Graham DB, Tothova Z, Hegde M, Smith I, Sullender M, Ebert BL, Xavier RJ, and Root DE (2014). Rational design of highly active sgRNAs for CRISPR-Cas9-mediated gene inactivation. Nat. Biotechnol 32, 1262–1267. [DOI] [PMC free article] [PubMed] [Google Scholar]
- Drider D, and Condon C (2004). The continuing story of endoribonuclease III. J. Mol. Microbiol. Biotechnol 8, 195–200. [DOI] [PubMed] [Google Scholar]
- Elemento O, Slonim N, and Tavazoie S (2007). A universal framework for regulatory element discovery across all genomes and data types. Mol. Cell 28, 337–350. [DOI] [PMC free article] [PubMed] [Google Scholar]
- Gharehbeglou M, Arjmand G, Haeri MR, and Khazeni M (2015). Nonselective mevalonate kinase inhibitor as a novel class of antibacterial agents. Cholesterol 2015, 147601. [DOI] [PMC free article] [PubMed] [Google Scholar]
- Gilbert LA, Horlbeck MA, Adamson B, Villalta JE, Chen Y, Whitehead EH, Guimaraes C, Panning B, Ploegh HL, Bassik MC, et al. (2014). Genome-Scale CRISPR-Mediated Control of Gene Repression and Activation. Cell 159, 647–661. [DOI] [PMC free article] [PubMed] [Google Scholar]
- Girgis HS, Liu Y, Ryu WS, and Tavazoie S (2007). A comprehensive genetic characterization of bacterial motility. PLoS Genet. 3, 1644–1660. [DOI] [PMC free article] [PubMed] [Google Scholar]
- Girgis HS, Hottes AK, and Tavazoie S (2009). Genetic architecture of intrinsic antibiotic susceptibility. PLoS ONE 4, e5629. [DOI] [PMC free article] [PubMed] [Google Scholar]
- Goldberg GW, Jiang W, Bikard D, and Marraffini LA (2014). Conditional tolerance of temperate phages via transcription-dependent CRISPR-Cas targeting. Nature 514, 633–637. [DOI] [PMC free article] [PubMed] [Google Scholar]
- Good BH, McDonald MJ, Barrick JE, Lenski RE, and Desai MM (2017). The dynamics of molecular evolution over 60,000 generations. Nature 551, 45–50. [DOI] [PMC free article] [PubMed] [Google Scholar]
- Hammer ND, Reniere ML, Cassat JE, Zhang Y, Hirsch AO, Indriati Hood M, and Skaar EP (2013). Two heme-dependent terminal oxidases power Staphylococcus aureus organ-specific colonization of the vertebrate host. MBio 4. [DOI] [PMC free article] [PubMed] [Google Scholar]
- Han K, Jeng EE, Hess GT, Morgens DW, Li A, and Bassik MC (2017). Synergistic drug combinations for cancer identified in a CRISPR screen for pairwise genetic interactions. Nat. Biotechnol 35, 463–474. [DOI] [PMC free article] [PubMed] [Google Scholar]
- Heler R, Samai P, Modell JW, Weiner C, Goldberg GW, Bikard D, and Marraffini LA (2015). Cas9 specifies functional viral targets during CRISPR-Cas adaptation. Nature 519, 199–202. [DOI] [PMC free article] [PubMed] [Google Scholar]
- Heler R, Wright AV, Vucelja M, Bikard D, Doudna JA, and Marraffini LA (2017). Mutations in Cas9 Enhance the Rate of Acquisition of Viral Spacer Sequences during the CRISPR-Cas Immune Response. Mol. Cell 65, 168–175. [DOI] [PMC free article] [PubMed] [Google Scholar]
- Hinz A, Lee S, Jacoby K, and Manoil C (2011). Membrane proteases and aminoglycoside antibiotic resistance. J. Bacteriol 193, 4790–4797. [DOI] [PMC free article] [PubMed] [Google Scholar]
- Hu JH, Miller SM, Geurts MH, Tang W, Chen L, Sun N, Zeina CM, Gao X, Rees HA, Lin Z, and Liu DR (2018). Evolved Cas9 variants with broad PAM compatibility and high DNA specificity. Nature 556, 57–63. [DOI] [PMC free article] [PubMed] [Google Scholar]
- Jinek M, Chylinski K, Fonfara I, Hauer M, Doudna JA, and Charpentier E (2012). A programmable dual-RNA-guided DNA endonuclease in adaptive bacterial immunity. Science 337, 816–821. [DOI] [PMC free article] [PubMed] [Google Scholar]
- Kahl BC, Becker K, and Löffler B (2016). Clinical Significance and Pathogenesis of Staphylococcal Small Colony Variants in Persistent Infections. Clin. Microbiol. Rev 29, 401–427. [DOI] [PMC free article] [PubMed] [Google Scholar]
- Kinkel TL, Roux CM, Dunman PM, and Fang FC (2013). The Staphylococcus aureus SrrAB two-component system promotes resistance to nitrosative stress and hypoxia. MBio 4, e00696–13. [DOI] [PMC free article] [PubMed] [Google Scholar]
- Lannergård J, von Eiff C, Sander G, Cordes T, Seggewiss J, Peters G, Proctor RA, Becker K, and Hughes D (2008). Identification of the genetic basis for clinical menadione-auxotrophic small-colony variant isolates of Staphylococcus aureus. Antimicrob. Agents Chemother 52, 4017–4022. [DOI] [PMC free article] [PubMed] [Google Scholar]
- Lee HH, Ostrov N, Wong BG, Gold MA, Khalil AS, and Church GM (2019). Functional genomics of the rapidly replicating bacterium Vibrio natriegens by CRISPRi. Nat. Microbiol 4, 1105–1113. [DOI] [PubMed] [Google Scholar]
- Levy A, Goren MG, Yosef I, Auster O, Manor M, Amitai G, Edgar R, Qimron U, and Sorek R (2015). CRISPR adaptation biases explain preference for acquisition of foreign DNA. Nature 520, 505–510. [DOI] [PMC free article] [PubMed] [Google Scholar]
- Li H, and Durbin R (2009). Fast and accurate short read alignment with Burrows-Wheeler transform. Bioinformatics 25, 1754–1760. [DOI] [PMC free article] [PubMed] [Google Scholar]
- Luo ML, Mullis AS, Leenay RT, and Beisel CL (2015). Repurposing endogenous type I CRISPR-Cas systems for programmable gene repression. Nucleic Acids Res. 43, 674–681. [DOI] [PMC free article] [PubMed] [Google Scholar]
- Lutz R, and Bujard H (1997). Independent and tight regulation of transcriptional units in Escherichia coli via the LacR/O, the TetR/O and AraC/I1–I2 regulatory elements. Nucleic Acids Res. 25, 1203–1210. [DOI] [PMC free article] [PubMed] [Google Scholar]
- Marraffini LA (2015). CRISPR-Cas immunity in prokaryotes. Nature 526, 55–61. [DOI] [PubMed] [Google Scholar]
- McGinn J, and Marraffini LA (2019). Molecular mechanisms of CRISPR-Cas spacer acquisition. Nat. Rev. Microbiol 17, 7–12. [DOI] [PubMed] [Google Scholar]
- Modell JW, Jiang W, and Marraffini LA (2017). CRISPR-Cas systems exploit viral DNA injection to establish and maintain adaptive immunity. Nature 544, 101–104. [DOI] [PMC free article] [PubMed] [Google Scholar]
- Mojica FJM, Díez-Villaseñor C, García-Martínez J, and Almendros C (2009). Short motif sequences determine the targets of the prokaryotic CRISPR defence system. Microbiology 155, 733–740. [DOI] [PubMed] [Google Scholar]
- Monk IR, Shah IM, Xu M, Tan MW, and Foster TJ (2012). Transforming the untransformable: application of direct transformation to manipulate genetically Staphylococcus aureus and Staphylococcus epidermidis. MBio 3. [DOI] [PMC free article] [PubMed] [Google Scholar]
- Monk IR, Tree JJ, Howden BP, Stinear TP, and Foster TJ (2015). Complete Bypass of Restriction Systems for Major Staphylococcus aureus Lineages. MBio 6, e00308–e00315. [DOI] [PMC free article] [PubMed] [Google Scholar]
- Murphy KC (1991). Lambda Gam protein inhibits the helicase and chi-stimulated recombination activities of Escherichia coli RecBCD enzyme. J. Bacteriol 173, 5808–5821. [DOI] [PMC free article] [PubMed] [Google Scholar]
- Nair D, Memmi G, Hernandez D, Bard J, Beaume M, Gill S, Francois P, and Cheung AL (2011). Whole-genome sequencing of Staphylococcus aureus strain RN4220, a key laboratory strain used in virulence research, identifies mutations that affect not only virulence factors but also the fitness of the strain. J. Bacteriol 193, 2332–2335. [DOI] [PMC free article] [PubMed] [Google Scholar]
- Palmer AC, Toprak E, Baym M, Kim S, Veres A, Bershtein S, and Kishony R (2015). Delayed commitment to evolutionary fate in antibiotic resistance fitness landscapes. Nat. Commun 6, 7385. [DOI] [PMC free article] [PubMed] [Google Scholar]
- Peters JM, Colavin A, Shi H, Czarny TL, Larson MH, Wong S, Hawkins JS, Lu CHS, Koo BM, Marta E, et al. (2016). A Comprehensive, CRISPR-based Functional Analysis of Essential Genes in Bacteria. Cell 165, 1493–1506. [DOI] [PMC free article] [PubMed] [Google Scholar]
- Phillips PC (2008). Epistasis–the essential role of gene interactions in the structure and evolution of genetic systems. Nat. Rev. Genet 9, 855–867. [DOI] [PMC free article] [PubMed] [Google Scholar]
- Qi LS, Larson MH, Gilbert LA, Doudna JA, Weissman JS, Arkin AP, and Lim WA (2013). Repurposing CRISPR as an RNA-guided platform for sequence-specific control of gene expression. Cell 152, 1173–1183. [DOI] [PMC free article] [PubMed] [Google Scholar]
- Rajagopal M, Martin MJ, Santiago M, Lee W, Kos VN, Meredith T, Gilmore MS, and Walker S (2016). Multidrug Intrinsic Resistance Factors in Staphylococcus aureus Identified by Profiling Fitness within High-Diversity Transposon Libraries. MBio 7. [DOI] [PMC free article] [PubMed] [Google Scholar]
- Rousset F, Cui L, Siouve E, Becavin C, Depardieu F, and Bikard D (2018). Genome-wide CRISPR-dCas9 screens in E. coli identify essential genes and phage host factors. PLoS Genet. 14, e1007749. [DOI] [PMC free article] [PubMed] [Google Scholar]
- Sanjana NE (2017). Genome-scale CRISPR pooled screens. Anal. Biochem 532, 95–99. [DOI] [PMC free article] [PubMed] [Google Scholar]
- Sanson KR, Hanna RE, Hegde M, Donovan KF, Strand C, Sullender ME, Vaimberg EW, Goodale A, Root DE, Piccioni F, and Doench JG (2018). Optimized libraries for CRISPR-Cas9 genetic screens with multiple modalities. Nat. Commun 9, 5416. [DOI] [PMC free article] [PubMed] [Google Scholar]
- Schmidt F, Cherepkova MY, and Platt RJ (2018). Transcriptional recording by CRISPR spacer acquisition from RNA. Nature 562, 380–385. [DOI] [PubMed] [Google Scholar]
- Segrè D, Deluna A, Church GM, and Kishony R (2005). Modular epistasis in yeast metabolism. Nat. Genet 37, 77–83. [DOI] [PubMed] [Google Scholar]
- Shalem O, Sanjana NE, Hartenian E, Shi X, Scott DA, Mikkelson T, Heckl D, Ebert BL, Root DE, Doench JG, and Zhang F (2014). Genome-scale CRISPR-Cas9 knockout screening in human cells. Science 343, 84–87. [DOI] [PMC free article] [PubMed] [Google Scholar]
- Shen JP, Zhao D, Sasik R, Luebeck J, Birmingham A, Bojorquez-Gomez A, Licon K, Klepper K, Pekin D, Beckett AN, et al. (2017). Combinatorial CRISPR-Cas9 screens for de novo mapping of genetic interactions. Nat. Methods 14, 573–576. [DOI] [PMC free article] [PubMed] [Google Scholar]
- Sheth RU, Yim SS, Wu FL, and Wang HH (2017). Multiplex recording of cellular events over time on CRISPR biological tape. Science 358, 1457–1461. [DOI] [PMC free article] [PubMed] [Google Scholar]
- Shipman SL, Nivala J, Macklis JD, and Church GM (2016). Molecular recordings by directed CRISPR spacer acquisition. Science 353, aaf1175. [DOI] [PMC free article] [PubMed] [Google Scholar]
- Sidik SM, Huet D, Ganesan SM, Huynh MH, Wang T, Nasamu AS, Thiru P, Saeij JPJ, Carruthers VB, Niles JC, et al. (2016). A Genome-wide CRISPR Screen in Toxoplasma Identifies Essential Apicomplexan Genes. Cell 166, 1423–1435.e12. [DOI] [PMC free article] [PubMed] [Google Scholar]
- Sternberg SH, Richter H, Charpentier E, and Qimron U (2016). Adaptation in CRISPR-Cas Systems. Mol. Cell 61, 797–808. [DOI] [PubMed] [Google Scholar]
- Taber HW, Mueller JP, Miller PF, and Arrow AS (1987). Bacterial uptake of aminoglycoside antibiotics. Microbiol. Rev 51, 439–457. [DOI] [PMC free article] [PubMed] [Google Scholar]
- Vejnar CE, Abdel Messih M, Takacs CM, Yartseva V, Oikonomou P, Christiano R, Stoeckius M, Lau S, Lee MT, Beaudoin JD, et al. (2019). Genome wide analysis of 3′ UTR sequence elements and proteins regulating mRNA stability during maternal-to-zygotic transition in zebrafish. Genome Res. 29, 1100–1114. [DOI] [PMC free article] [PubMed] [Google Scholar]
- Vestergaard M, Nøhr-Meldgaard K, Bojer MS, Krogsgård Nielsen C, Meyer RL, Slavetinsky C, Peschel A, and Ingmer H (2017). Inhibition of the ATP Synthase Eliminates the Intrinsic Resistance of Staphylococcus aureus towards Polymyxins. MBio 8. [DOI] [PMC free article] [PubMed] [Google Scholar]
- Wang T, Wei JJ, Sabatini DM, and Lander ES (2014). Genetic screens in human cells using the CRISPR-Cas9 system. Science 343, 80–84. [DOI] [PMC free article] [PubMed] [Google Scholar]
- Wang T, Guan C, Guo J, Liu B, Wu Y, Xie Z, Zhang C, and Xing XH (2018). Pooled CRISPR interference screening enables genome-scale functional genomics study in bacteria with superior performance. Nat. Commun 9, 2475. [DOI] [PMC free article] [PubMed] [Google Scholar]
- Wigley DB (2013). Bacterial DNA repair: recent insights into the mechanism of RecBCD, AddAB and AdnAB. Nat. Rev. Microbiol 11, 9–13. [DOI] [PubMed] [Google Scholar]
- Wiser MJ, and Lenski RE (2015). A Comparison of Methods to Measure Fitness in Escherichia coli. PLoS ONE 10, e0126210. [DOI] [PMC free article] [PubMed] [Google Scholar]
- Yang SJ, Bayer AS, Mishra NN, Meehl M, Ledala N, Yeaman MR, Xiong YQ, and Cheung AL (2012). The Staphylococcus aureus two-component regulatory system, GraRS, senses and confers resistance to selected cationic antimicrobial peptides. Infect. Immun 80, 74–81. [DOI] [PMC free article] [PubMed] [Google Scholar]
- Yosef I, Goren MG, and Qimron U (2012). Proteins and DNA elements essential for the CRISPR adaptation process in Escherichia coli. Nucleic Acids Res. 40, 5569–5576. [DOI] [PMC free article] [PubMed] [Google Scholar]
- Zhang YM, White SW, and Rock CO (2006). Inhibiting bacterial fatty acid synthesis. J. Biol. Chem 281, 17541–17544. [DOI] [PubMed] [Google Scholar]
Associated Data
This section collects any data citations, data availability statements, or supplementary materials included in this article.
Supplementary Materials
Data Availability Statement
The data that support the findings of this study are available from the Lead Contact upon reasonable request. The SRA accession number for NGS data is PRJNA595000. See also https://tavazoielab.c2b2.columbia.edu/CALM/