

Abstract
Glycopeptide-level mass spectrometry (MS) and tandem mass spectrometry (MS/MS) analyses are commonly performed to establish site-specific protein glycosylation profiles that are of central importance to gaining structure-function insights on glycoproteins. Confoundingly, the complete characterization of glycopeptide connectivity usually requires the acquisition of multiple MS/MS fragmentation spectra. Complementary ion fragmentation techniques such as collision-induced dissociation (CID) and electron transfer dissociation (ETD) are often applied in concert to address this need. While structurally informative, the requirement for acquisition of two MS/MS spectra per analyte places considerable limitations upon the breadth and depth of large-scale glycoproteomic inquiry. Here, a previously developed method of multiplexing CID and ETD is applied to the study of glycopeptides for the first time. Integration of the two dissociation methods was accomplished through addition of an ion mobility (IM) dimension that disperses the two stages of MS/MS in time. This allows the two MS/MS spectra to be acquired within a few milliseconds of one another, and to be deconvoluted in post-processing. Furthermore, the method allows both fragmentation readouts to be obtained from the same precursor ion packet, thus reducing the inefficiencies imposed by separate CID and ETD acquisitions and the relatively poor precursor ion to fragment ion conversion typical of ETD. N-linked glycopeptide ions ranging in molecular weight from 1800 to 6500 u were generated from four model glycoproteins that collectively encompassed paucimannosidic, high mannose, and complex types of N-glycosylation. In each case, IM-resolved CID and ETD events provided complete coverage of the glycan topology and peptide sequence coverages ranging from 48.4% (over 32 amino acid residues) to 85.7% (over eight amino acid residues). The potential of this method for large-scale glycoproteomic analysis is discussed.
Graphical Abstract

One packet of N-glycopeptide precursors can be successively probed by CID and ETD, with fragmentation spectra deconvoluted via IM.
Introduction
Glycosylation is the most ubiquitous, diverse, and elaborate form of protein modification; accordingly, glycans enzymatically linked to proteins serve highly varied and indispensable functions of life.1–4 These include vital contributions to the folding and stability of glycoproteins, involvement as essential elements of intermolecular recognition, and action as agents of cellular signaling pathways.5–10 Altered protein glycosylation is also a hallmark of numerous human diseases, where perturbations in the structures or compositions of protein-modifying oligosaccharides can either indicate or instigate an unhealthy condition.11–20 The foregoing considerations have served to motivate great interest in the detailed characterization of glycoproteomic systems; nevertheless, the protein-specific and site-specific determination of glycosylation profiles is fraught with complexities – both biological and technical – and remains well outside the realm of routine analysis.21–24
Despite the challenges involved, mass spectrometry (MS) of proteolytic glycopeptides provides a means of associating specific glycan compositions and structures with defined positions on the corresponding glycoprotein.25–34 These experiments rely on tandem mass spectrometry (MS/MS) methods in order to establish the composition and topology of the oligosaccharide, the sequence of the polypeptide, and the site of glycosylation; however, the entirety of the glycopeptide connectivity is seldom apparent from any single MS/MS spectrum. Thus, the complementarity of multiple ion dissociation methods is frequently leveraged in order to garner a more complete structural view.35–42 While the photodissociation methods of infrared multiphoton dissociation (IRMPD)43–45 and ultraviolet photodissociation (UVPD)46–48 have shown significant potential to acquire highly informative MS/MS spectra for glycopeptides, a more common and more widely available approach is to pair collision-induced dissociation (CID) and electron transfer dissociation (ETD).49–52 This pairing affords a convenient means of capturing both glycan connectivity information (via the CID spectrum), as well as peptide sequence and glycosite (via the ETD spectrum). When used together to collect complementary fragmentation spectra, CID and ETD are generally performed separately, yielding two separate MS/MS spectra. Unfortunately, this comes with the penalty of increased sample consumption and reduced duty cycle per analyte characterized.
One approach to multiplexing multiple MS/MS acquisitions involves the incorporation of an ion mobility (IM) dimension. In one experiment of this type, IM-resolved precursor ions can be subjected to CID as they exit the collision cell. In this so-called “time-aligned parallel” dissociation, the ions resulting from post-IM fragmentation appear at the same IM drift time as their corresponding precursor ion. This general approach has been applied to an assortment of MS/MS analyses, ranging from small molecules to non-covalent protein complexes.53–57 Subsequent reports have suggested a similar strategy which integrates CID and ETD by IM separation of mass-selected precursor ions that had either undergone an electron transfer (ET) reaction or no reaction (NR), followed by vibrational activation (VA).58, 59 Our laboratory recently reported on the application of this approach to unmodified polypeptides of varying molecular weights, and found that complementary sequence information could be gathered in much the same manner as acquiring separate CID and ETD spectra, yet with higher overall precursor ion utilization efficiency and improved instrument duty cycle.60 Given these characteristics, IM-based multiplexed acquisition of CID and ETD spectra is rendered a compelling option for high-throughput analysis.
Here, we report the first example of IM-resolved CID and ETD of protonated N-linked glycopeptide ions. The analytes considered encompass a wide range of molecular weights, charge states, peptide compositions, and glycan structures. In each case, complementary fragmentation information was conveyed by high-quality CID and ETD spectra which were acquired from the same mass-selected packet of precursor ions. These results suggest that the approach is generalizable and provides access to orthogonal structural information for even highly challenging N-glycopeptide analyte ions. While these analyses returned similar advantages as previously described for analysis of unmodified peptides, we also note that this combination of analytical dimensions is capable of delivering additional benefits – particularly as IM continues to mature in the areas of oligosaccharide and glycoconjugate analysis.61–70
Experimental
Model N-Glycopeptide Preparation.
Four well-characterized glycoproteins were chosen as sources of N-glycopeptides for this study: horseradish peroxidase (HRP), bovine ribonuclease B (BRB), coral tree lectin (CTL), and bovine serum fetuin (BSF). Proteomics grade trypsin, HRP, BRB, and BSF were purchased from Sigma-Aldrich (St. Louis, MO, USA). CTL was purchased from Vector Laboratories (Burlingame, CA, USA). For each glycoprotein, a 2 mg/mL solution was prepared in 8 M urea with 50 mM ammonium bicarbonate (pH 7.5). A 50 μL portion of this denatured glycoprotein solution was combined with 10 μL dithiothreitol (450 mM in 50 mM ammonium bicarbonate, pH 7.5; incubated at 55°C for 1 h) followed by 10 μL iodoacetamide (500 mM in 50 mM ammonium bicarbonate, pH 7.5; incubated in the dark at 25°C for 1 h) for disulfide reduction and cysteine alkylation. The mixture was next diluted to a total volume of 250 μL with 50 mM ammonium bicarbonate (pH 7.5) to reduce the urea concentration to 1.6 M, and treated with 5 μL proteomics grade trypsin (0.5 μg/μL; incubated at 37°C for 18 h). Glycoprotein digests were reduced in volume to approximately 10 μL by vacuum centrifugation (Speed Vac SC110; Thermo Savant, Holbrook, NY, USA), then brought to a final volume of 100 μL by reconstituting in 0.1% formic acid.
Glycopeptides in the reconstituted preparations were desalted and enriched by solid-phase extraction (SPE) using a zwitterionic hydrophilic interaction liquid chromatography (ZIC-HILIC) stationary phase in a micropipette tip format (Protea Biosciences, Somerset, NJ, USA). Formic acid was acquired from Sigma-Aldrich; HPLC grade acetonitrile was acquired from Fisher Scientific (Fair Lawn, NJ, USA); and HPLC grade water was acquired from Burdick and Jackson (Muskegon, MI, USA). SPE was carried out by first wetting the ZIC-HILIC tips in water, then equilibrating in 80% acetonitrile with 0.1% formic acid. Next, 4 μL of reconstituted aqueous digest was added to 16 μL of acetonitrile, and the resulting mixture of reconstituted digest in 80% acetonitrile was loaded onto the ZIC-HILIC SPE tip. The stationary phase was then rinsed in 80% acetonitrile with 0.1% formic acid. Finally, the desalted and enriched glycopeptides were eluted into 0.1% formic acid.
Mass Spectrometry and Ion Mobility.
All MS, MS/MS, and IM experiments were performed using a quadrupole time-of-flight mass spectrometer (Q-TOF-MS) equipped with a traveling wave IM cell71–74 and the capability to perform both CID and ETD based MS/MS experiments75, 76 (Synapt G2-S HDMS; Waters Corporation, Manchester, UK). For sample introduction by nano-electrospray ionization (nESI), tapered glass emitters were fabricated in-house from melting point capillaries (1.5 – 1.8 × 100 mm; Corning Pyrex, Corning, NY, USA) using a vertical micropipette puller (David Kopf Instruments, Tujunga, CA, USA). Approximately 5 – 10 μL of each purified N-glycopeptide preparation was transferred to an emitter using a fine-point syringe (Hamilton, Reno, NV, USA). The emitter was then placed on a home-built holder designed to mate to the commercial nESI source of the instrument, while also placing the sample solution within the emitter in contact with a platinum wire that delivered the necessary DC potential. An emitter voltage of 0.6 – 1.2 kV was applied to initiate nESI. The sampling cone potential and the source DC offset were each set to 10 V, the ion source block temperature was held at 80 – 100°C, and the flow of nitrogen cone gas was maintained at 50 L/h.
Negatively charged radical reagent ions for ET reactions were generated by glow discharge ionization of 1,4-dicyanobenzene (Sigma-Aldrich) as previously described.75, 76 Vapors of the reagent were swept from a reservoir and through the hollow discharge pin by a 25 mL/min flow of nitrogen make-up gas, and the discharge current was set to 30 – 50 μA. Quadrupole-selected reagent ions were stored in the trap region (i.e., pre-IM) stacked ring ion guide (SRIG) with a refill duration of 0.1 s and a refill interval of 1.0 s. The pressure in the trap cell was maintained at 5.0 – 6.0 × 10⁻² mbar by a 12 – 14 mL/min flow of helium bath gas, and the RF amplitude applied to the trap cell SRIG was set to 450 – 500 V. Quadrupole-selected analyte ions were then directed to the trap cell. The trap cell traveling DC wave velocity was set to 300 m/s, while the height of this pulse was adjusted to modulate the reagent ion / analyte ion co-confinement time. The ion-ion interaction time was minimized by application of a 1.5 V wave height (thus preventing ET reactions), or maximized by application of a 0.1 V wave height (thus facilitating ET reactions).
Separation of unreacted precursor ions and their corresponding charge-reduced ET products was carried out in the IM cell SRIG, which was held at a pressure 3.1 – 3.5 mbar by a 40 mL/min flow of nitrogen drift gas to the main body of the cell. The entrance interface region of the cell was maintained at a pressure of 1.2 – 1.4 × 10⁻³ mbar by a 150 mL/min flow of helium. The RF amplitude applied to the IM SRIG was set to 250 – 300 V, while the IM cell traveling DC wave velocity was set between 650 – 1200 m/s with a wave height between 25 – 40 V, depending on the analyte. Ion packets were delivered to the IM cell from the trap cell using a 200 – 500 μs gating pulse and a trap DC bias (i.e., the potential difference between trap cell and the IM cell) of 25 – 35 V, depending on the analyte.
IM-separated precursor ions and ET product ions were caused to undergo CID and ETD, respectively, through vibrational activation in the transfer region (i.e., post-IM) SRIG. Ions exiting the IM cell were accelerated into the transfer cell through a potential difference (ΔUVA) of 25 – 45 V, depending on the analyte. The pressure in the transfer cell was maintained at 1.6 – 1.8 × 10⁻² mbar by a 0.5 – 0.6 mL/min flow of argon collision gas, and the RF amplitude applied to the transfer cell SRIG was set to 350 – 380 V. The traveling DC wave applied to the transfer SRIG had a velocity of between 110 – 200 m/s and a height of 4.0 – 5.0 V. Ions exiting the transfer cell were then analyzed by TOF-MS over the range of m/z 50 – 3000.
Data Processing and Presentation.
MassLynx 4.1 (Waters) was used for instrument control, data acquisition, and rudimentary MS data processing (summing scans, smoothing spectra, etc.). DriftScope 2.7 (Waters) was used for basic handling of IM data, including extraction of mass spectra corresponding to selected drift time windows. Further analysis and visualization of IM and MS data was carried out using purpose-built software tools written and executed in IGOR Pro 6 (WaveMetrics, Lake Oswego, OR, USA). Peak assignment and annotation of MS/MS spectra was conducted in accord with the Roepstorff / Fohlman and Domon / Costello nomenclatures for polypeptide and oligosaccharide fragmentations, respectively.77, 78 When applying these fragment ion naming systems, glycan fragments were assigned using uppercase letters, while peptide fragments were assigned using lowercase letters. Precursor ion cleavage maps were rendered using standard one-letter amino acid abbreviations and the monosaccharide symbology promulgated by Varki et al. and the Consortium for Functional Glycobiology.79, 80 Non-symbolic monosaccharide abbreviations were also used for the monosaccharides xylose (Xyl), fucose (Fuc), mannose (Man), galactose (Gal), N-acetylglucosamine (GlcNAc), and N-acetylneuraminic acid (NeuAc).
Results
Overview.
The schematic flowchart shown in Figure 1 briefly illustrates the sequence of events employed to obtain IM-resolved CID and ETD spectra from a single packet of N-glycopeptide ions. In short, quadrupole-selected analyte and reagent ions were allowed to interact such that a portion of the initial analyte ion population was converted to charge-reduced radical analyte ions. The resulting mixture of analyte ions undergoing either no reaction (NR) or electron transfer (ET) was then pulsed into the IM cell, where the two components were readily separated in drift time due to their different charge states. As the NR and ET ions exited the IM cell, they were subjected to vibrational activation (VA) by acceleration through a DC offset (ΔUVA) and subsequent collisions with argon gas. This resulted in the generation of two fragment ion populations detected by TOF-MS: those arising from CID of the initial, unreacted analyte ions; and those resulting from supplementally-activated ETD of the charge-reduced radical analyte ions. Because the two intact ion populations were temporally resolved by IM, the corresponding groups of fragment ions were likewise formed at different times. This ET-IM-VA sequence of events thus allowed the two distinct dissociation spectra to be disentangled according to apparent drift time.
Figure 1.

A pictorial representation of the ET-IM-VA experiment as applied to a model N-linked glycopeptide from HRP (a key to the monosaccharide symbols provided in the inset). The initial precursor ion with n positive charges is quadrupole (Q) selected, then transiently co-confined with negatively charged radical reagent ions (not shown). The precursor ions undergoing either no reaction (NR) or an electron transfer (ET) reaction are then separated by ion mobility (IM), which partitions the unreacted precursor ions (higher mobility) from the charge-reduced ET products (lower mobility). The two mobility-sorted ion populations, having drift times of dt1 and dt2 respectively, are next subjected to vibrational activation (VA) as they exit the mobility cell. This results in collision-induced dissociation (CID) of the unreacted precursor ions, while also providing supplemental activation that brings about electron transfer dissociation (ETD) of the charge-reduced species. Due to the distinct drift times of the NR and ET ion packets, the two dissociation experiments are temporally resolved. All resulting fragment ions are analyzed by time-of-flight mass spectrometry (TOF-MS).
HRP, BRB, CTL, and BSF were chosen as model glycoproteins for this study because each has been well studied with respect to their glycosylation, which collectively encompasses a wide range of N-glycan types including paucimannosidic (HRP and CTL), high mannose (BRB), and complex-type (BSF) N-glycans. Additionally, trypsinolysis of these glycoproteins results in glycopeptides with well-varied amino acid sequences about the glycosylation site, both in terms of length and composition. Finally, N-glycopeptides from the model glycoproteins discussed here have been previously studied by other research groups using both CID and ETD, thus allowing the present approach to be compared to relevant published examples as discussed in the succeeding sections. Taken together, the chosen analytes provided a diverse set attributes of well-suited to a proof-of-concept study on the application of IM-resolved CID and ETD for the analysis of N-linked glycopeptides.
Analysis of an N-Glycopeptide from HRP.
The first N-glycopeptide studied by sequential IM-resolved stages of CID and ETD was derived from HRP (UniProtKB P00433). This glycopeptide harbored a paucimannosidic N-glycan, and had the overall composition 184NVGLNR189 + GlcNAc2 Man3 Fuc1 Xyl1 (1841.79 u). The corresponding [M+2H]2+ ion (m/z = 921.89) was quadrupole selected and subjected to ET-IM-VA as described above. ET to the initial precursor ion generated a population of the charge-reduced product [M+2H]+• (m/z = 1843.79). Ions exiting the IM cell were then energized using ΔUVA = 25 V. The resultant IM-MS heat map shown in Figure 2a exhibited two major drift time bands corresponding to CID of the [M+2H]2+ ion (the region labeled dt1) and ETD of the [M+2H]+• ion (the region labeled dt2). Some ion signal was also noted outside of the two major drift time bands (i.e., between drift times of about 4–8 ms). This was attributed to some proportion of the ion population undergoing direct ETD, prior to IM separation. While this should be acknowledged as a potential complication, these pre-IM fragments represented a small fraction of the total ion intensity and did not obscure clear delineation of the CID and ETD spectra according to drift time. Extraction of the m/z and relative intensity data from the dt1 band resulted in the mass spectrum provided in Figure 2b. The spectrum was consistent with the expected CID behavior of this glycopeptide, providing complete coverage of the glycan connectivity through a series of 11 fragment ions arising from Y-type glycosidic cleavages. Complementarily, extraction of m/z and intensity data from the dt2 region of the heat map provided the mass spectrum shown in Figure 2c. This ETD spectrum covered four of the five possible N-Cα peptide backbone cleavages (i.e., 80% sequence coverage) by virtue of the z2 through z5 fragments. Interestingly, the ETD behavior of this glycopeptide deviates from a general trend noted by Desaire and coworkers, in which c-series ions tend to be predominant in the ETD spectra of N-glycopeptides harboring the glycan near the C-terminus (and likewise for z-series ions when the glycan is located near the N-terminus).81 In the present case, the low initial charge state of the HRP glycopeptide ion (z = 2+), coupled with the absence of basic amino acid side chains N-terminal of the glycosylation site, may have preferentially favored the formation of fragments that retained the highly basic C-terminal arginine residue (i.e., z ions). Cleavage of the oligosaccharide moiety was not apparent in the ETD spectrum. The observed CID and ETD fragment ions were mapped onto diagrams of the HRP N-glycopeptide in Figures 2d and 2e, respectively. The overall MS/MS coverage of the glycopeptide structure was found to be quite consistent with previously published CID and ETD spectra for the same precursor ion (including the abundant series of z-type ions present in the ETD spectrum).82
Figure 2.
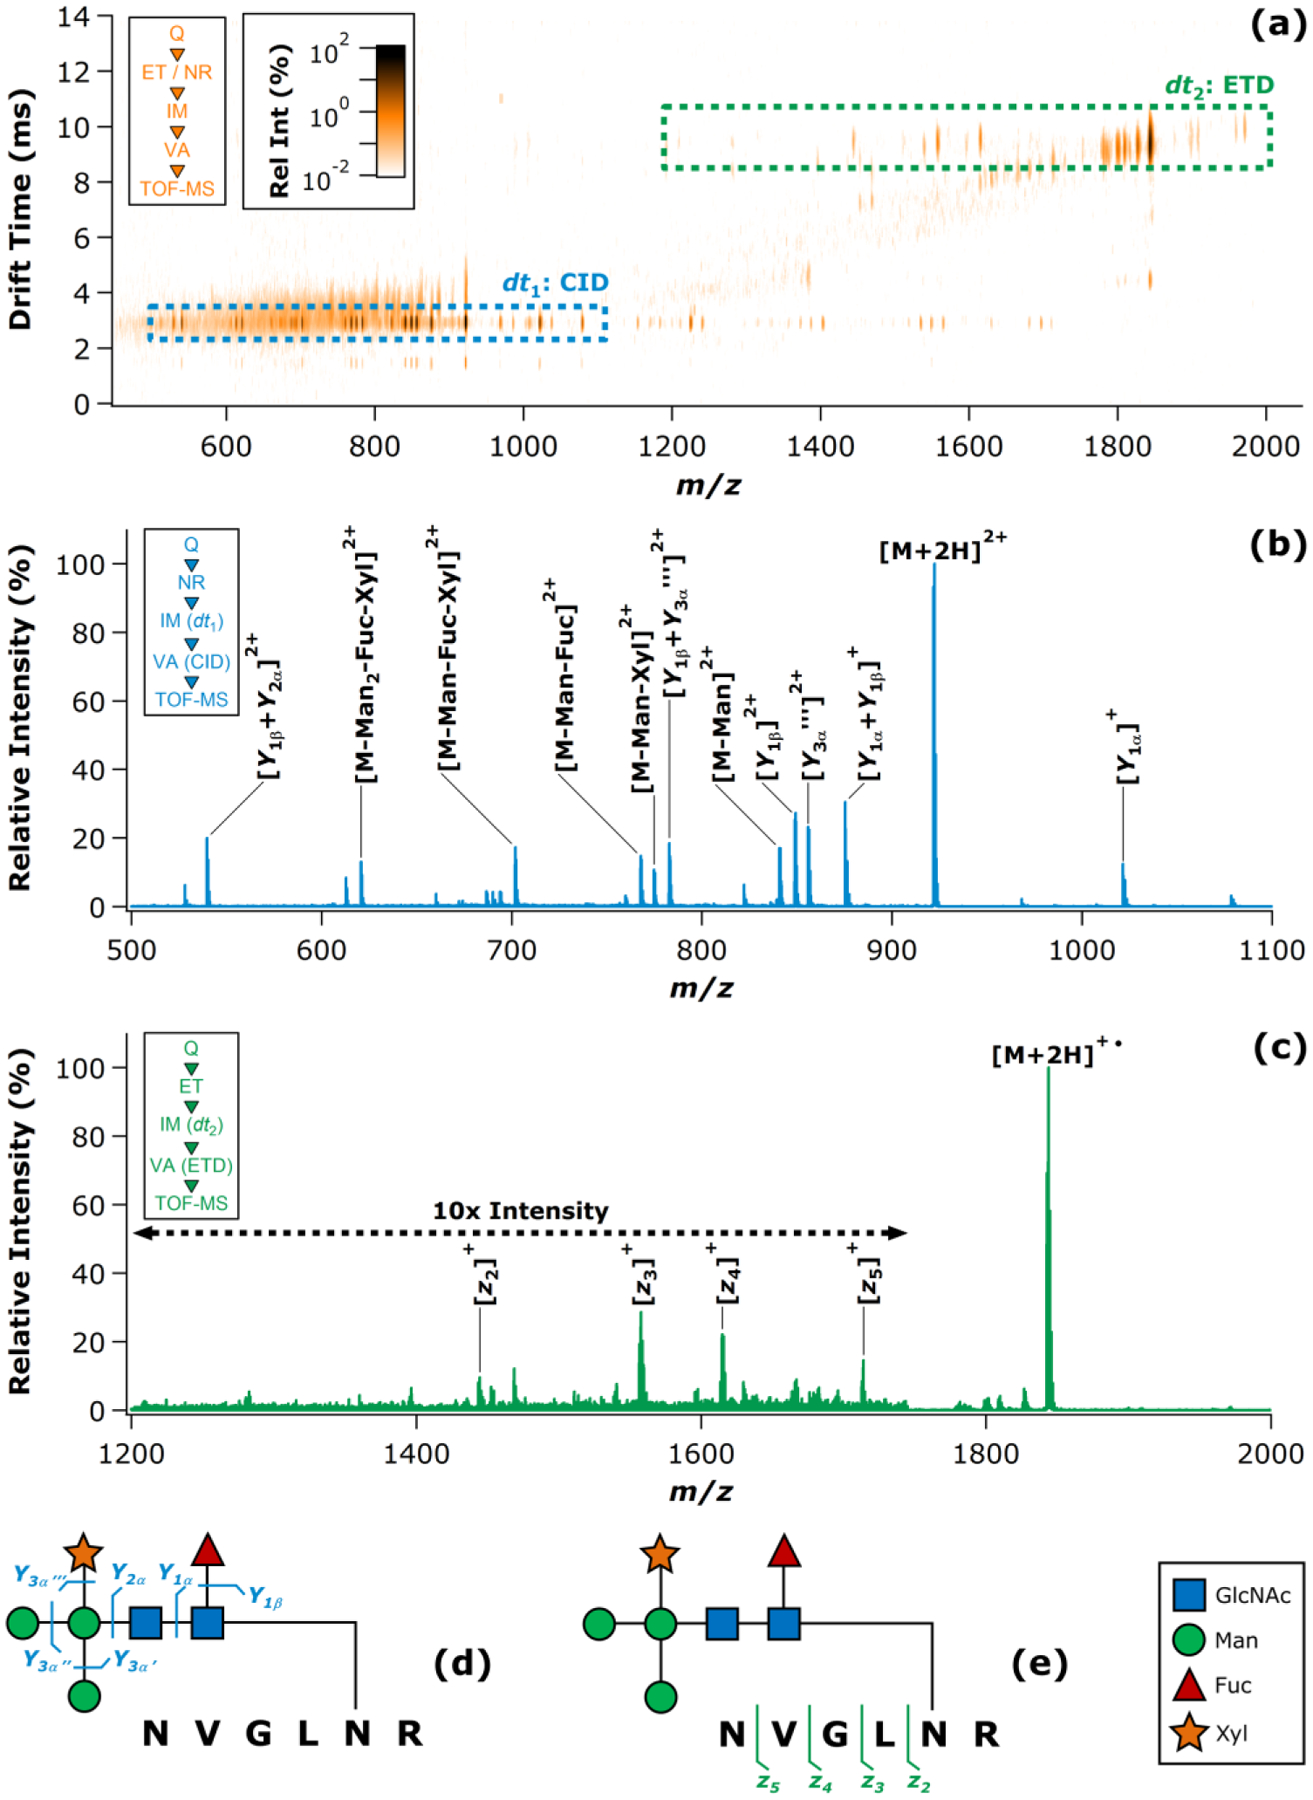
ET-IM-VA analysis of the model N-glycopeptide derived from HRP. The IM-MS heat map is shown in (a), with dashed boxes highlighting the fragment ion populations arising from CID (dt1) and ETD (dt2). The CID spectrum extracted from the boxed dt1 region is given in (b), while the ETD spectrum extracted from the boxed dt2 region is given in (c). Insets in (a) – (c) summarize the experimental sequence corresponding to each plot. Cleavage maps summarizing the observed CID (d) and ETD (e) fragments are also provided, and are accompanied by a key to the monosaccharide symbols (inset). Note that in (a) the fragment ions aligned with the dt1 band at m/z > 1100 are the singly-charged equivalents of their doubly-charged analogs seen at m/z < 1100. These redundant fragment ions were omitted from (b) for clarity.
Analysis of an N-Glycopeptide from BRB.
A high mannose N-glycopeptide generated by trypsinolysis of BRB (UniProtKB P61823) was next considered. With an overall composition of58SRNLTKDR65 + GlcNAc2 Man5 (2204.96 u), this glycopeptide bore an N-glycan consisting of seven neutral monosaccharide residues. While in this respect the oligosaccharide moiety was similar to that of the HRP glycopeptide, the two glycans also differed in that the HRP glycan was comprised of four different monosaccharides (GlcNAc, Man, Fuc, and Xyl), while the BRB glycan was comprised of only two different monosaccharides (GlcNAc and Man). This rendered the BRB glycan of greater molecular weight, yet lower compositional complexity. The BRB and HRP glycopeptides also differed in the lengths of their polypeptide chains (eight vs. six amino acid residues, respectively). The [M+3H]3+ ion (m/z = 735.99) was quadrupole selected and underwent sub-stoichiometric ET reaction to yield a mixture of the unreacted precursor ion and the [M+3H]2+• ion (m/z = 1103.99). IM separation and collisional activation of these ions (ΔUVA = 25 V) produced the results summarized in Figure 3. The two major drift time bands appearing in the IM-MS heat map (Figure 3a) were well-resolved, readily allowing extraction of the individual fragmentation spectra arising from CID (Figure 3b) and ETD (Figure 3c). As in the previous example, some ETD product ions formed prior to introduction to the IM separator were apparent in the heat map (i.e., in the drift time region of 7 ms and greater); however, these again accounted for a relatively minor fraction of the total ion signal and did not materially complicate the analysis. Among these, a low abundance yet noticeable grouping of signals observed in Figure 3a with drift times in the 12 – 14 ms range and m/z values of 1500 – 1600. One potential explanation for these fragments is that they arose from dissociation of a lower mobility (i.e., doubly charge-reduced) ET product; however, no direct evidence for the [M+3H]+•• ion was found. Alternatively, this grouping of fragments may simply have similar mobilities and arose from pre-IM ETD. Regardless of the origin of these minor fragments, they also appeared in the dt2 band ETD spectrum, and thus did not provide any additional analytical information. The CID spectrum afforded complete glycosidic coverage of the GlcNAc2 Man5 N-glycan (Figure 3d). This was realized through a series of Y ions involving sequential loss of all five Man residues, eventually leading to the Y2 fragment. This series of fragments was observed in both the triply-charged and doubly-charged states. The Y1 fragment (SRNLTKDR + GlcNAc) was also observed as a doubly-charged ion. Meanwhile, the ETD spectrum furnished 10 peptide backbone fragment ions (c2-c3; c5; c7; z1-z6) that collectively covered six of the seven possible N-Cα cleavages for 85.7% sequence coverage (Figure 3e). The consecutive fragment ion pairs c2-c3 and z5-z6 allowed explicit site localization of the N-glycan, while no evidence of glycan fragmentation was detected in the ETD spectrum. This duplexed approach yielded CID and ETD spectra that conveyed essentially the same structural information as those found in previous, more conventional studies of BRB glycopeptides.49, 50, 83–85 The cited examples for comparison included analytes in which the GlcNAc2 Man5 N-glycan was linked to the SRNLTKDR peptide chain (as studied here), as well as the SRNLTK peptide chain (as more frequently noted in the literature), and also encompasses precursor ions in the z = 2+ and z = 3+ charge states.
Figure 3.
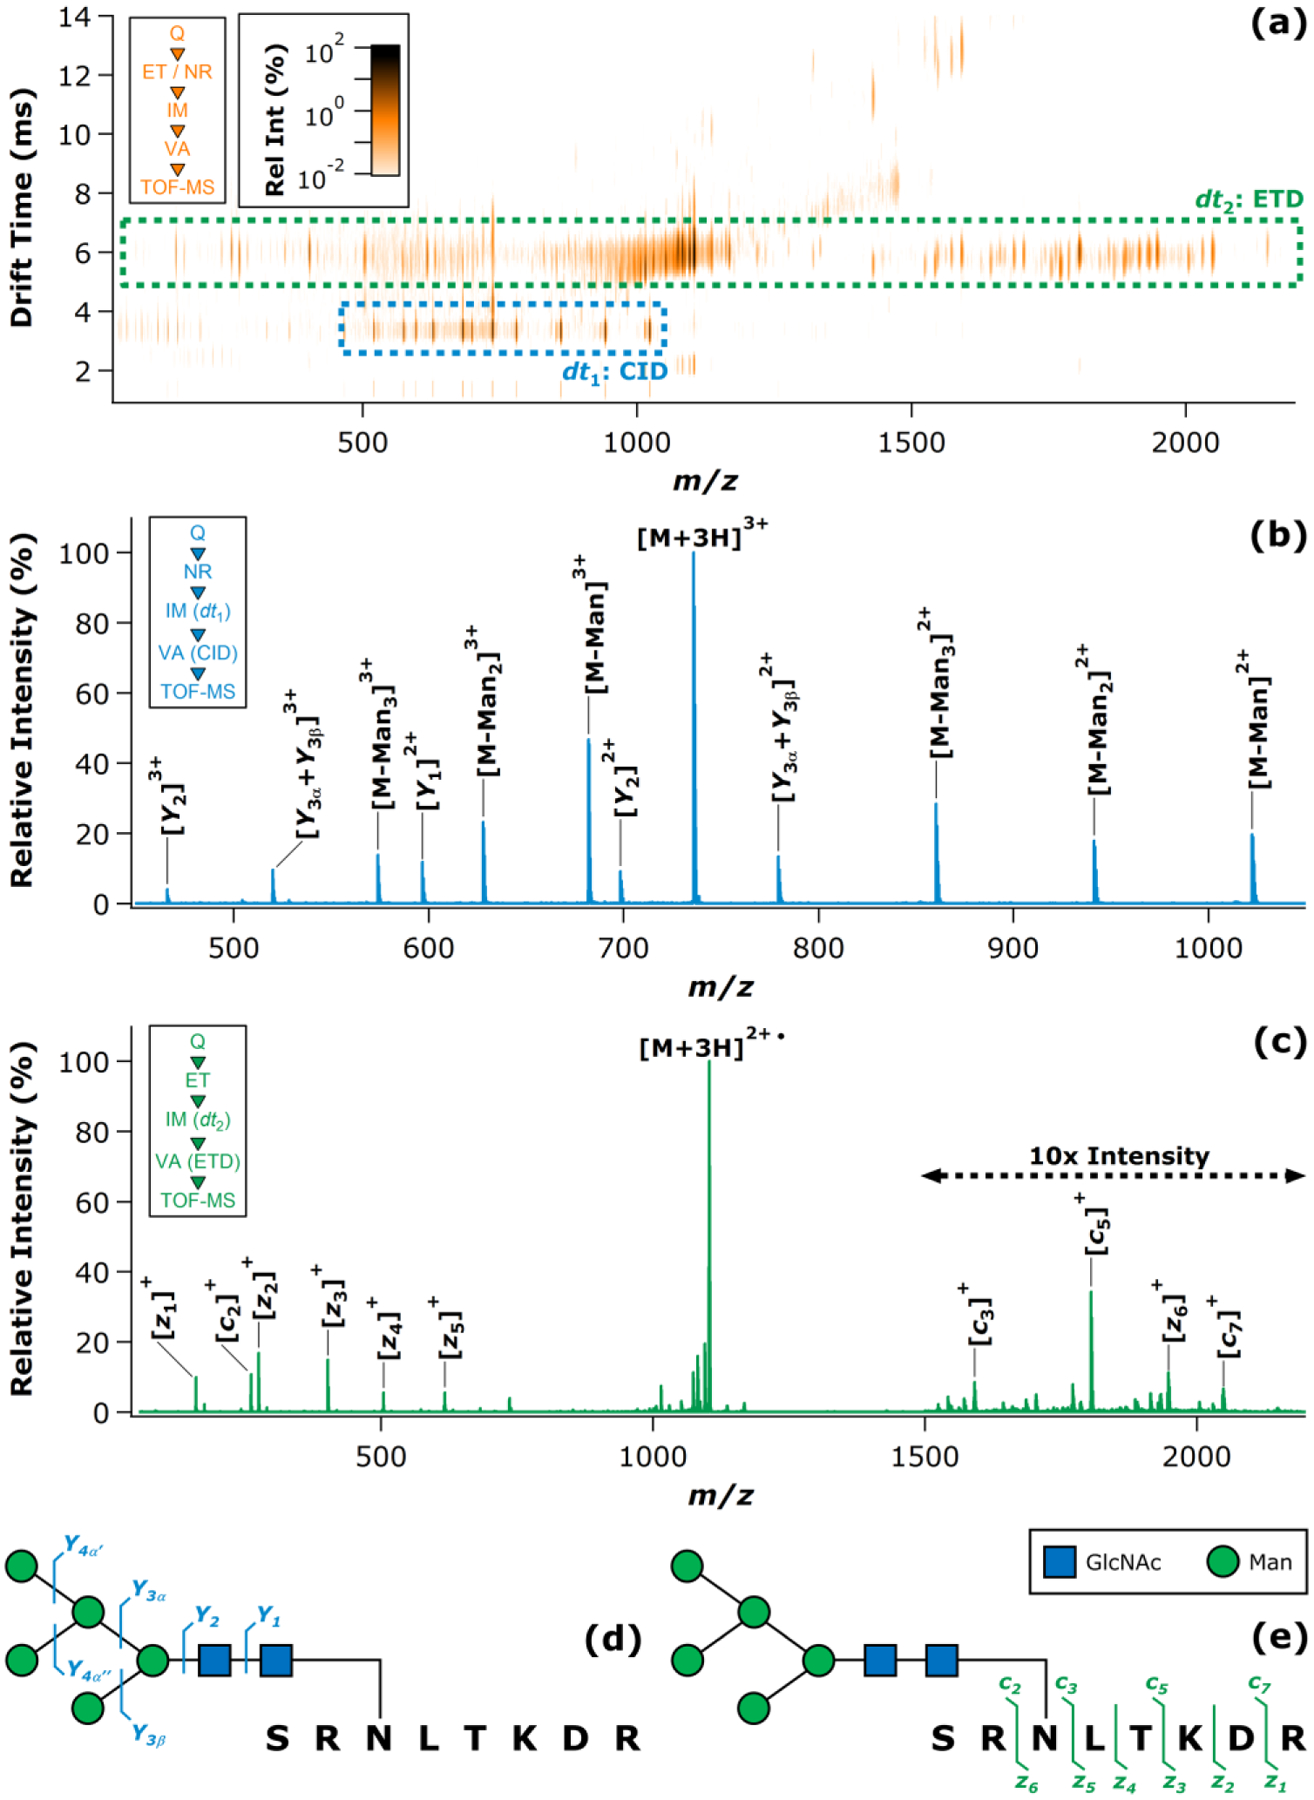
ET-IM-VA analysis of the model N-glycopeptide derived from BRB. The IM-MS heat map is shown in (a), with dashed boxes highlighting the fragment ion populations arising from CID (dt1) and ETD (dt2). The CID spectrum extracted from the boxed dt1 region is given in (b), while the ETD spectrum extracted from the boxed dt2 region is given in (c). Insets in (a) – (c) summarize the experimental sequence corresponding to each plot. Cleavage maps summarizing the observed CID (d) and ETD (e) fragments are also provided, and are accompanied by a key to the monosaccharide symbols (inset).
Analysis of an N-Glycopeptide from CTL.
The next tryptic N-glycopeptide for study was obtained from CTL (UniProtKB P83410). With the overall composition 100 SKPAQGYGYLGVFNNSK116 + GlcNAc2 Man3 Fuc1 Xyl1 (2999.33 u), this analyte was considerably larger than the previously considered examples; however, the paucimannosidic oligosaccharide modifying this glycopeptide was identical in structure to that present on the HRP glycopeptide. Thus, the CTL glycopeptide primarily differed from the HRP and BRB glycopeptides in the substantially greater length of the polypeptide chain (17 amino acid residues). Importantly, while there were two asparagine residues present within the peptide sequence of this analyte, only one of these occurred in the context of a consensus sequon for N-glycosylation (NXS or NXT, where X is any amino acid, proline excepted). Thus, N113 was the only site of glycosylation. Quadrupole selection of the [M+3H]3+ ion (m/z = 1000.78) followed by reaction with ET reagent ions resulted in the formation of charge-reduced [M+3H]2+• product ions (m/z = 1501.17). Post-activation of the IM-resolved NR and ET ions (ΔUVA = 40 V) yielded the characteristic IM-MS drift time vs. m/z heat map with two horizontal bands of fragment ions, each occurring within a unique region of apparent ion mobility space (Figure 4a). Unlike the comparatively smaller glycopeptides previously examined, this IM-MS heat map was free of any appreciable pre-IM ETD fragmentation. The glycosidic topology of the glycan group was fully represented in the CID spectrum (Figure 4b), with a series of doubly-charged fragments demonstrating stepwise monosaccharide losses which ultimately revealed the unmodified peptide as the Y0 fragment. While not shown in Figure 4b, a comparable series of triply-charged Y ions was observed over a lower range of m/z, but provided no new information (and have thus been omitted from Figure 4b in the interest of clarity). The ETD spectrum (Figure 4c) was largely comprised of a contiguous series of c-type ions (c3-c13), collectively accounting for 11 of the 15 available N-Cα cleavage products (i.e., not considering the c2 cleavage N-terminal to the proline residue, which does not yield a fragment upon scission). This corresponds to production of 73.3% of the possible c ions, or an overall peptide sequence coverage of 68.8%. The presence of a predominant series of c ions was consistent with a general trend noticed by Desaire and coworkers, in which c-type ions were found to be the major ETD fragments for peptides with N-linked glycosites localized to the C-terminus.81 As in the previous examples, the ETD spectrum was devoid of any ions corresponding to glycan cleavage or loss. A diagram of the fragments observed in both the CID and ETD spectra is provided in Figure 4d, where the information obtained by means of the ET-IM-VA experimental sequence can be seen to compare favorably with those obtained by other researchers using separate stages of CID and ETD.86, 87
Figure 4.

ET-IM-VA analysis of the model N-glycopeptide derived from CTL. The IM-MS heat map is shown in (a), with dashed boxes highlighting the fragment ion populations arising from CID (dt1) and ETD (dt2). The CID spectrum extracted from the boxed dt1 region is given in (b), while the ETD spectrum extracted from the boxed dt2 region is given in (c). Insets in (a) – (c) summarize the experimental sequence corresponding to each plot. A cleavage map summarizing the observed CID and ETD fragments is given in (d), and is accompanied by a key to the monosaccharide symbols (inset).
Analysis of an N-Glycopeptide from BSF.
The final model N-glycopeptide studied here was a tryptic fragment of BSF (UniProtKB P12763) that harbored a triantennary, trisialylated complex-type N-linked oligosaccharide structure. The overall composition of this glycopeptide was 72RPTGEVYDIEIDTLETTCHVLDPTPLANCSVR103 + GlcNAc5 Man3 Gal3 NeuAc3 (6,531.77 u). With 14 monosaccharide residues and 32 amino acid residues, this analyte was significantly more massive and compositionally heterogeneous than any of the model N-glycopeptides discussed in the preceding sections. Selection and ET reaction of the [M+5H]5+ (m/z = 1307.36) led to the formation of a charge-reduced ET product ion, [M+5H]4+• (m/z = 1634.20), as well as a doubly charge-reduced, even-electron ET product ion, [M+5H]3+•• (m/z = 2178.94). IM sorting of the resultant ion population was carried out, with subsequent vibrational activation accomplished with ΔUVA = 45 V. While the band of fragment ions generated by CID of the NR precursor ions was well-isolated, the single ET and double ET products were somewhat overlapped in drift time. This result was not entirely unexpected, as the relative difference in charge between two successive charge states (and the corresponding contribution to differences in mobility) decreases as the charge state increases. Regardless of this overlap in drift time, two distinct regions of IM drift time were defined which contained either unreacted precursor ions and fragments thereof (dt1), or a mixture of single and double ET products (dt2) and their resulting fragments (Figure 5a). No apparent contribution from direct ETD prior to IM separation was noted. The CID spectrum (Figure 5b) was prominently populated by a series of 14 triply-charged Y-type fragmentation products that were informative as to the stepwise deconstruction of the N-glycan, down to the reducing terminal GlcNAc residue (Y1 fragment). Some of the same fragments were also observable as quadruply-charged ions at lower m/z (though for clarity these are not shown in Figure 5b). Examination of the ETD spectrum (Figure 5c) allowed assignment of 15 c and z fragment ions (c2-c12; c15; z1-z3), which in aggregate covered 15 out of 27 (or, 55.6%) of the N-Cα bonds able to be productively cleaved (i.e., ignoring cleavages N-terminal to the three proline residues). The overall sequence coverage was 48.4%. The cleavage map provided in Figure 5d summarizes the information conveyed by both the CID and ETD spectra. Notably, the ETD spectrum of the BSF glycopeptide also exhibited a single Y-type loss of a NeuAc residue. Among the analytes studied here, this was the only example of a CID-like glycan fragmentation occurring as a result of supplementally-activated ETD; however, this result is perhaps unsurprising given the tendency of NeuAc residues to undergo facile elimination under even gentle activation conditions.88, 89 Ultimately, the appearance of this fragment did not interfere with interpretation of the ETD spectrum. This example also illustrates that the ET-IM-VA scheme can be applied to even large N-glycopeptides containing particularly labile terminal monosaccharides with minimal complication of the ETD spectrum by purely vibrational activation / dissociation processes.
Figure 5.

ET-IM-VA analysis of the model N-glycopeptide derived from BSF. The IM-MS heat map is shown in (a), with dashed boxes highlighting the fragment ion populations arising from CID (dt1) and ETD (dt2). The CID spectrum extracted from the boxed dt1 region is given in (b), while the ETD spectrum extracted from the boxed dt2 region is given in (c). Insets in (a) – (c) summarize the experimental sequence corresponding to each plot. A cleavage map summarizing the observed CID and ETD fragments is given in (d), and is accompanied by a key to the monosaccharide symbols (inset).
Notably, previous efforts to obtain useful ETD spectra for this glycopeptide, and other glycoforms thereof, have generally met with limited success. For instance, attempts by Novotny and coworkers to generate ETD fragments from the same glycopeptide as the [M+4H]4+ precursor ion yielded no peptide backbone fragments upon ETD.49 Another effort by Desaire and coworkers focused on the non-sialylated analog of this glycopeptides in the [M+4H]4+, [M+5H]5+, and [M+6H]6+ charge states.81 While the [M+6H]6+ precursor ion with the highest of these charges states yielded a rich ETD spectrum covering the majority of the peptide sequence, significant cleavage of the glycan moiety through collisionally-activated processes was also reported. ETD of the [M+5H]5+ ion produced eight peptide c and z fragments along the peptide backbone (though several or the ions assigned had very low signal-to-noise ratios), as well as eight generally more abundant fragments arising from cleavage or loss of the glycan due to vibrational activation / dissociation. In the same study, the [M+4H]4+ yielded no useful product ions when ETD was attempted. Given this context, the ability ET-IM-VA results for the BSF glycopeptide are particularly encouraging. Not only was this approach able to produce an informative CID spectrum, but also an ETD spectrum with 55.6% peptide sequence coverage and only a single sialic acid loss. This improved performance apparent in the present work is likely attributable to the added vibrational activation step, which is likely to bring about informative dissociation processes in cases where a pure ETD experiment (i.e., with no vibrational activation) might not succeed.
Conclusions
Here, we demonstrate the use of IM to temporally disperse mass-selected precursor ions and their corresponding ET products and thus enable rapid sequential acquisition of high-quality CID and ETD spectra for protonated N-linked glycopeptide ions. The IM dimension allows the two fragmentation spectra to be cleanly disentangled from one another, thus simplifying interpretation. Moreover, this approach allows the large fraction of precursor ions that fail to undergo ET reactions to be productively utilized for acquiring a CID spectrum, rather than being sacrificed to the generally low conversion efficiency and fragmentation efficiency of typical ETD experiments. The model N-glycopeptide ions examined spanned a range of polypeptide sequences, oligosaccharide compositions and structures, charge states, and molecular weights. The capacity to successfully address this gamut of analytes suggests that the method could be generalized to an even greater assortment of N-glycopeptides.
This analytical approach takes advantage of two key characteristics of the ET product ions. First, under the conditions of these experiments, the ET product ions are sufficiently stable to survive the approximately 10 ms IM separation with little or no direct ETD – an advantage from the standpoint of partitioning the CID and ETD fragmentation events in time. The significant lifetime of the charge-reduced radical species may be attributable in part to collisional cooling in the trap region SRIG, which is operated at elevated pressure when ET reactions are desired (this relaxes analyte and reagent ions to the radial center of the cell, thus increasing the opportunity for ion-ion chemistry to occur). Second, the ΔUVA values suitable for supplemental activation of ET product ions conveniently coincide with those that result in rich and informative CID spectra for the unreacted precursor ions. While the two processes have different vibrational energy requirements, these can be simultaneously satisfied by a single ΔUVA since the different charge states of the NR and ET ions result in different kinetic energies prior to collisional activation (i.e., the NR ions with n charges experience more energetic collisions than the ET ions with n-1 charges). Furthermore, the optimum ΔUVA appears to scale roughly with precursor ion m/z. This suggests that the approach could be extensible to glycoproteomic workflows including on-line chromatographic separations. One conceivable workflow would involve mass selection of putative glycopeptide ions in a manner independent of fragmentation information (such as carbohydrate oxonium ions produced by CID) using mass defect targeting.90–95 The ΔUVA could then be set in a data-dependent manner according the precursor ion m/z. Such multiplexed approaches that take advantage of useful physicochemical properties of glycopeptides while efficiently leveraging complementary dissociation pathways will be essential to expanding the accessible scope of glycoproteomic research. The use of IM to duplex the acquisition of CID and ETD spectra demonstrates significant potential to contribute to these endeavors.
Acknowledgements
The authors extend special thanks to Maia I. Kelly for a critical reading of the manuscript, and to Kurt W. Wulser and Rebecca E. Jarratt for their efforts in developing software for extraction and visualization of ion mobility mass spectrometry heat maps. This work was supported in part by funding from the National Science Foundation, Division of Chemistry, through the Chemical Measurement and Imaging Program (Award Number 1507989). Support from the University of Nebraska - Lincoln through the Center for Integrated Biomolecular Communication Research Cluster Development Grant is also acknowledged.
Footnotes
Conflicts of Interest
There are no conflicts of interest to declare.
References
- 1.Varki A, Glycobiology, 1993, 3, 97–130. [DOI] [PMC free article] [PubMed] [Google Scholar]
- 2.Dwek RA, Chem. Rev, 1996, 96, 683–720. [DOI] [PubMed] [Google Scholar]
- 3.Spiro RG, Glycobiology, 2002, 12, 43R–56R. [DOI] [PubMed] [Google Scholar]
- 4.Weerapana E and Imperiali B, Glycobiology, 2006, 16, 91R–101R. [DOI] [PubMed] [Google Scholar]
- 5.Rudd PM and Dwek RA, Crit. Rev. Biochem. Mol. Biol, 1997, 32, 1–100. [DOI] [PubMed] [Google Scholar]
- 6.Roth J, Zuber C, Park S, Jang I, Lee Y, Kysela KG, Le Fourn V, Santimaria R, Guhl B and Cho JW, Mol. Cells, 2010, 30, 497–506. [DOI] [PubMed] [Google Scholar]
- 7.Kolarich D, Lepenies B and Seeberger PH, Curr. Opin. Chem. Biol, 2012, 16, 214–220. [DOI] [PubMed] [Google Scholar]
- 8.Kreisman LSC and Cobb BA, Glycobiology, 2012, 22, 1019–1030. [DOI] [PMC free article] [PubMed] [Google Scholar]
- 9.Zhao YY, Takahashi M, Gu JG, Miyoshi E, Matsumoto A, Kitazume S and Taniguchi N, Cancer Sci., 2008, 99, 1304–1310. [DOI] [PMC free article] [PubMed] [Google Scholar]
- 10.Hart GW, Slawson C, Ramirez-Correa G and Lagerlof O, Annu. Rev. Biochem,2011, 80, 825–858. [DOI] [PMC free article] [PubMed] [Google Scholar]
- 11.Christiansen MN, Chik J, Lee L, Anugraham M, Abrahams JL and Packer NH, Proteomics, 2014, 14, 525–546. [DOI] [PubMed] [Google Scholar]
- 12.Stowell SR, Ju T and Cummings RD, Annu. Rev. Pathol. Mech. Dis, 2015, 10, 473–510. [DOI] [PMC free article] [PubMed] [Google Scholar]
- 13.Ceciliani F and Pocacqua V, Curr. Protein Pept. Sci, 2007, 8, 91–108. [DOI] [PubMed] [Google Scholar]
- 14.McCarthy C, Saldova R, Wormald MR, Rudd PM, McElvaney NG and Reeves EP, J. Proteome Res, 2014, 13, 3131–3143. [DOI] [PubMed] [Google Scholar]
- 15.Marklova E and Albahri Z, Clin. Chim. Acta, 2007, 385, 6–20. [DOI] [PubMed] [Google Scholar]
- 16.Schachter H and Freeze HH, Biochim. Biophys. Acta, 2009, 1792, 925–930. [DOI] [PMC free article] [PubMed] [Google Scholar]
- 17.Freeze HH, J. Biol. Chem, 2013, 288, 6936–6945. [DOI] [PMC free article] [PubMed] [Google Scholar]
- 18.Ohtsubo K and Marth JD, Cell, 2006, 126, 855–867. [DOI] [PubMed] [Google Scholar]
- 19.An HJ, Kronewitter SR, de Leoz MLA and Lebrilla CB, Curr. Opin. Chem. Biol, 2009, 13, 601–607. [DOI] [PMC free article] [PubMed] [Google Scholar]
- 20.Schumacher KN and Dodds ED, Glycoconj. J, 2016, 33, 377–385. [DOI] [PubMed] [Google Scholar]
- 21.Morelle W and Michalski JC, Nat. Protoc, 2007, 2, 1585–1602. [DOI] [PubMed] [Google Scholar]
- 22.Clowers BH, Dodds ED, Seipert RR and Lebrilla CB, J. Proteome Res, 2007, 6, 4032–4040. [DOI] [PubMed] [Google Scholar]
- 23.Dodds ED, Seipert RR, Clowers BH, German JB and Lebrilla CB, J. Proteome Res, 2009, 8, 502–512. [DOI] [PMC free article] [PubMed] [Google Scholar]
- 24.An HJ, Froehlich JW and Lebrilla CB, Curr. Opin. Chem. Biol, 2009, 13, 421–426. [DOI] [PMC free article] [PubMed] [Google Scholar]
- 25.Morelle W, Canis K, Chirat F, Faid V and Michalski JC, Proteomics, 2006, 6, 3993–4015. [DOI] [PubMed] [Google Scholar]
- 26.Dalpathado DS and Desaire H, Analyst, 2008, 133, 731–738. [DOI] [PubMed] [Google Scholar]
- 27.Tissot B, North SJ, Ceroni A, Pang PC, Panico M, Rosati F, Capone A, Haslam SM, Dell A and Morris HR, FEBS Lett., 2009, 583, 1728–1735. [DOI] [PMC free article] [PubMed] [Google Scholar]
- 28.Lazar IM, Lazar AC, Cortes DF and Kabulski JL, Electrophoresis, 2011, 32, 3–13. [DOI] [PMC free article] [PubMed] [Google Scholar]
- 29.Leymarie N and Zaia J, Anal. Chem, 2012, 84, 3040–3048. [DOI] [PMC free article] [PubMed] [Google Scholar]
- 30.Novotny MV and Alley WR Jr, Curr. Opin. Chem. Biol, 2013, 17, 832–840. [DOI] [PMC free article] [PubMed] [Google Scholar]
- 31.Schiel JE, Anal. Bioanal. Chem, 2012, 404, 1141–1149. [DOI] [PubMed] [Google Scholar]
- 32.Alley WR Jr., Mann BF and Novotny MV, Chem. Rev, 2013, 113, 2668–2732. [DOI] [PMC free article] [PubMed] [Google Scholar]
- 33.Desaire H, Mol. Cell. Proteomics, 2013, 12, 893–901. [DOI] [PMC free article] [PubMed] [Google Scholar]
- 34.Kolli V, Schumacher KN and Dodds ED, Bioanalysis, 2015, 7, 113–131. [DOI] [PubMed] [Google Scholar]
- 35.Zubarev RA, Zubarev AR and Savitski MM, J. Am. Soc. Mass Spectrom, 2008, 19, 753–761. [DOI] [PubMed] [Google Scholar]
- 36.Coon JJ, Anal. Chem, 2009, 81, 3208–3215. [DOI] [PMC free article] [PubMed] [Google Scholar]
- 37.McLuckey SA and Mentivona M, J. Am. Soc. Mass Spectrom, 2011, 22, 3–12. [DOI] [PMC free article] [PubMed] [Google Scholar]
- 38.Rathore D, Aboufazeli F, Huang Y, Kolli V, Fernando GS and Dodds ED, Encycl. nal. Chem, 2015, 1–26. [Google Scholar]
- 39.Wuhrer M, Catalina MI, Deelder AM and Hokke CH, J. Chromatogr. B, 2007, 849, 115–128. [DOI] [PubMed] [Google Scholar]
- 40.Dodds ED, Mass Spectrom. Rev, 2012, 31, 666–682. [DOI] [PubMed] [Google Scholar]
- 41.Thaysen-Andersen M and Packer NH, Biochim. Biophys. Acta, 2014, 1844, 1437–1452. [DOI] [PubMed] [Google Scholar]
- 42.Nilsson J, Glycoconj. J, 2016, 33, 261–272. [DOI] [PubMed] [Google Scholar]
- 43.Adamson JT and Hakansson K, J. Proteome Res, 2006, 5, 493–501. [DOI] [PubMed] [Google Scholar]
- 44.Seipert RR, Dodds ED, Clowers BH, Beecroft SM, German JB and Lebrilla CB, Anal. Chem, 2008, 80, 3684–3692. [DOI] [PMC free article] [PubMed] [Google Scholar]
- 45.Seipert RR, Dodds ED and Lebrilla CB, J. Proteome Res, 2009, 8, 493–501. [DOI] [PMC free article] [PubMed] [Google Scholar]
- 46.Madsen JA, Ko BJ, Xu H, Iwashkiw JA, Robotham SA, Shaw JB, Feldman MF and Brodbelt JS, Anal. Chem, 2013, 85, 9253–9261. [DOI] [PMC free article] [PubMed] [Google Scholar]
- 47.Zhang L and Reilly JP, J. Proteome Res, 2009, 8, 734–742. [DOI] [PMC free article] [PubMed] [Google Scholar]
- 48.Ko BJ and Brodbelt JS, Int. J. Mass Spectrom, 2015, 377, 385–392. [DOI] [PMC free article] [PubMed] [Google Scholar]
- 49.Alley WR Jr., Mechref Y and Novotny MV, Rapid Commun. Mass Spectrom, 2009, 23, 161–170. [DOI] [PubMed] [Google Scholar]
- 50.Singh C, Zampronio CG, Creese AJ and Cooper HJ, J. Proteome Res, 2012, 11, 4517–4525. [DOI] [PubMed] [Google Scholar]
- 51.Perdivara I, Petrovich R, Allinquant B, Deterding LJ, Tomer KB and Przybylski M, J. Proteome Res, 2009, 8, 631–642. [DOI] [PMC free article] [PubMed] [Google Scholar]
- 52.Darula Z, Chalkley RJ, Baker P, Burlingame AL and Medzihradszky KF, Eur. J. Mass Spectrom, 2010, 16, 421–428. [DOI] [PMC free article] [PubMed] [Google Scholar]
- 53.Damen CW, Chen W, Chakraborty AB, van Oosterhout M, Mazzeo JR, Gebler JC, Schellens JH, Rosing H and Beijnen JH, J. Am. Soc. Mass Spectrom, 2009, 20, 2021–2033. [DOI] [PubMed] [Google Scholar]
- 54.D’Agostino PA and Chenier CL, Rapid Commun. Mass Spectrom, 2010, 24, 1617–1624. [DOI] [PubMed] [Google Scholar]
- 55.Castro-Perez J, Roddy TP, Nibbering NM, Shah V, McLaren DG, Previs S, Attygalle AB, Herath K, Chen Z, Wang SP, Mitnaul L, Hubbard BK, Vreeken RJ, Johns DG and Hankemeier T, J. Am. Soc. Mass Spectrom, 2011, 22, 1552–1567. [DOI] [PMC free article] [PubMed] [Google Scholar]
- 56.Sun J, Baker A and Chen P, Rapid Commun. Mass Spectrom, 2011, 25, 2591–2602. [DOI] [PubMed] [Google Scholar]
- 57.Rathore D and Dodds ED, J. Am. Soc. Mass Spectrom, 2014, 25, 1600–1609. [DOI] [PubMed] [Google Scholar]
- 58.Lermyte F, Verschueren T, Brown JM, Williams JP, Valkenborg D and Sobott F, Methods, 2015, 89, 22–29. [DOI] [PubMed] [Google Scholar]
- 59.Massonnet P, Upert G, Smargiasso N, Gilles N, Quinton L and De Pauw E, Anal. Chem, 2015, 87, 5240–5246. [DOI] [PubMed] [Google Scholar]
- 60.Rathore D, Aboufazeli F and Dodds ED, Analyst, 2015, 140, 7175–7183. [DOI] [PubMed] [Google Scholar]
- 61.Huang Y, Gelb AS and Dodds ED, Curr. Metabolomics, 2013, 1, 291–305. [Google Scholar]
- 62.Hofmann J and Pagel K, Angew. Chem, 2017, 56, 8342–8349. [DOI] [PubMed] [Google Scholar]
- 63.Huang Y and Dodds ED, Anal. Chem, 2013, 85, 9728–9735. [DOI] [PubMed] [Google Scholar]
- 64.Pagel K and Harvey DJ, Anal. Chem, 2013, 85, 5138–5145. [DOI] [PubMed] [Google Scholar]
- 65.Huang Y and Dodds ED, Anal. Chem, 2015, 87, 5664–5668. [DOI] [PubMed] [Google Scholar]
- 66.Huang Y and Dodds ED, Analyst, 2015, 140, 6912–6921. [DOI] [PubMed] [Google Scholar]
- 67.Creese AJ and Cooper HJ, Anal. Chem, 2012, 84, 2597–2601. [DOI] [PMC free article] [PubMed] [Google Scholar]
- 68.Li H, Bendiak B, Siems WF, Gang DR and Hill HH Jr., Int. J. Ion Mobil. Spec, 2013, 16, 105–115. [DOI] [PMC free article] [PubMed] [Google Scholar]
- 69.Both P, Green AP, Gray CJ, Sardzik R, Voglmeir J, Fontana C, Austeri M, Rejzek M, Richardson D, Field RA, Widmalm G, Flitsch SL and Eyers CE, Nat. Chem, 2014, 6, 65–74. [DOI] [PubMed] [Google Scholar]
- 70.Glaskin RS, Khatri K, Wang Q, Zaia J and Costello CE, Anal. Chem, 2017, 89, 4452–4460. [DOI] [PMC free article] [PubMed] [Google Scholar]
- 71.Giles K, Pringle SD, Worthington KR, Little D, Wildgoose JL and Bateman RH, Rapid Commun. Mass Spectrom, 2004, 18, 2401–2414. [DOI] [PubMed] [Google Scholar]
- 72.Pringle SD, Giles K, Wildgoose JL, Williams JP, Slade SE, Thalassinos K, Bateman RH, Bowers MT and Scrivens JH, Int. J. Mass Spectrom, 2007, 261, 1–12. [Google Scholar]
- 73.Giles K, Williams JP and Campuzano I, Rapid Commun. Mass Spectrom, 2011, 25, 1559–1566. [DOI] [PubMed] [Google Scholar]
- 74.Shvartsburg AA and Smith RD, Anal. Chem, 2008, 80, 9689–9699. [DOI] [PMC free article] [PubMed] [Google Scholar]
- 75.Williams JP, Pringle S, Richardson K, Gethings L, Vissers JPC, De Cecco M, Houel S, Chakraborty AB, Yu YQ, Chen W and Brown JM, Rapid Commun. Mass Spectrom, 2013, 27, 2383–2390. [DOI] [PubMed] [Google Scholar]
- 76.Campuzano I, Brown J, Williams J, Langridge J and Compson K, J. Biomol. Tech, 2010, 21, S36. [Google Scholar]
- 77.Roepstorff P and Fohlman J, Biomed. Mass Spectrom, 1984, 11, 601. [DOI] [PubMed] [Google Scholar]
- 78.Domon B and Costello CE, Glycoconj. J, 1988, 5, 397–409. [Google Scholar]
- 79.Varki A, Cummings RD, Esko JD, Freeze HH, Stanley P, Marth JD, Bertozzi CR, Hart GW and Etzler ME, Proteomics, 2009, 9, 5398–5399. [DOI] [PMC free article] [PubMed] [Google Scholar]
- 80.Varki A, Cummings RD, Aebi M, Packer NH, Seeberger PH, Esko JD, Stanley P, Hart G, Darvill A, Kinoshita T, Prestegard JJ, Schnaar RL, Freeze HH, Marth JD, Bertozzi CR, Etzler ME, Frank M, Vliegenthart JFG, Lütteke T, Perez S, Bolton E, Rudd P, Paulson J, Kanehisa M, Toukach P, Aoki-Kinoshita KF, Dell A, Narimatsu H, York W, Taniguchi N and Kornfeld S, Glycobiology, 2015, 25, 1323–1324. [DOI] [PMC free article] [PubMed] [Google Scholar]
- 81.Zhu Z, Hua D, Clark DF, Go EP and Desaire H, Anal. Chem, 2013, 85, 5023–5032. [DOI] [PMC free article] [PubMed] [Google Scholar]
- 82.Catalina MI, Koeleman CA, Deelder AM and Wuhrer M, Rapid Commun. Mass Spectrom, 2007, 21, 1053–1061. [DOI] [PubMed] [Google Scholar]
- 83.Kolli V and Dodds ED, Analyst, 2014, 139, 2144–2153. [DOI] [PubMed] [Google Scholar]
- 84.Aboufazeli F, Kolli V and Dodds ED, J. Am. Soc. Mass Spectrom, 2015, 26, 587–595. [DOI] [PubMed] [Google Scholar]
- 85.Kolli V, Roth HA, De La Cruz G, Fernando GS and Dodds ED, Anal. Chim. Acta, 2015, 896, 85–92. [DOI] [PubMed] [Google Scholar]
- 86.Hogan JM, Pitteri SJ, Chrisman PA and McLuckey SA, J. Proteome Res, 2005, 4, 628–632. [DOI] [PMC free article] [PubMed] [Google Scholar]
- 87.Han H, Xia Y, Yang M and McLuckey SA, Anal. Chem, 2008, 80, 3492–3497. [DOI] [PMC free article] [PubMed] [Google Scholar]
- 88.Zaia J, Mass Spectrom. Rev, 2004, 23, 161–227. [DOI] [PubMed] [Google Scholar]
- 89.An HJ and Lebrilla CB, Mass Spectrom. Rev, 2011, 30, 560–578. [DOI] [PubMed] [Google Scholar]
- 90.Sleno L, J. Mass Spectrom, 2012, 47, 226–236. [DOI] [PubMed] [Google Scholar]
- 91.Dodds ED, An HJ, Hagerman PJ and Lebrilla CB, J. Proteome Res, 2006, 5, 1195–1203. [DOI] [PubMed] [Google Scholar]
- 92.Dodds ED, Clowers BH, Hagerman PJ and Lebrilla CB, Anal. Biochem, 2008, 372, 156–166. [DOI] [PMC free article] [PubMed] [Google Scholar]
- 93.Desaire H and Hua D, Int. J. Mass Spectrom, 2009, 287, 21–26. [Google Scholar]
- 94.Toumi ML and Desaire H, J. Proteome Res, 2010, 9, 5492–5495. [DOI] [PMC free article] [PubMed] [Google Scholar]
- 95.Froehlich JW, Dodds ED, Wilhelm M, Serang O, Steen JA and Lee RS, Mol. Cell. Proteomics, 2013, 12, 1017–1025. [DOI] [PMC free article] [PubMed] [Google Scholar]