

Abstract
Background:
Laquinimod is an anti-inflammatory agent with good central nervous system (CNS) bioavailability, and neuroprotective and myelorestorative properties. A clinical trial in patients with multiple sclerosis demonstrated that laquinimod significantly reduced loss of brain volume. The cellular substrate or molecular events underlying that treatment effect are unknown. In this study, we aimed to explore laquinimod’s potential effects on brain volume, animal behavior, cellular numbers and composition of CNS-intrinsic cells and mononuclear cells within the CNS, amyloid beta (Aβ) accumulation and tau phosphorylation in the F1 3xTg-AD/C3H mouse model of Alzheimer’s disease.
Methods:
Utilizing a dose response study design, four months old F1 3xTg-AD/C3H mice were treated for 10 months between ages 4 and 14 months with laquinimod (5, 10, or 25 mg/kg), or PBS administered by oral gavage. Brain volumes were measured in a 7 Tesla magnetic resonance imager (MRI) at ages 4 and 14 months. Behavioral testing included locomotor and rearing activity and the Morris water maze task. Cell numbers and immunophenotypes were assessed by multiparameter flow cytometry. Aβ deposition and tau phosphorylation were determined by immunohistochemistry.
Results:
In the F1 3xTg-AD/C3H animal model of AD, there was no detectable reduction of brain volume over a period of 10 months of treatment, as there was not brain atrophy in any of the placebo or treatment groups. Laquinimod had no detectable effects on most neurobehavioral outcomes. The number or composition of CNS intrinsic cells and mononuclear subsets isolated from the CNS were not altered by laquinimod.
Conclusion:
This is the first demonstration that there are no age-associated brain volume changes in the F1 3xTg-AD/C3H mouse model of Alzheimer’s disease. Consequently, laquinimod had no effect on that outcome of this study. Most secondary outcomes on the effects of laquinimod on behavior and the number and composition of CNS-intrinsic cells and mononuclear cells within the CNS were also negative.
1. Introduction
Laquinimod is a quinoline-3-carboxamide small-molecule derivative of the parent compound linomide (roqinimex) (Karussis et al., 1995; Kieseier, 2014). Laquinimod was developed as a therapy for patients with multiple sclerosis (MS), the most prevalent inflammatory and neurodegenerative disorder of the central nervous system (CNS). Laquinimod can be administered orally, and may lack some of the potential safety concerns of linomide, including cardiotoxicity.
The biological effects of laquinimod are multi-fold. However, it remains incompletely understood which mechanisms of action may benefit patients with human disorders. Like its parent compound linomide, laquinimod has been shown to modulate numerous cell types of the innate and adaptive immune system. Much of this work was conducted in experimental autoimmune encephalomyelitis (EAE), an animal model for MS that is mostly T cell-mediated (Zamvil & Steinman, 1990). In a rat model of EAE, laquinimod diminished the migration of proinflammatory T lymphocytes into the CNS, consequently decreasing the expression of proinflammatory cytokines, including tumor necrosis factor alpha (TNFα) and interleukin (IL)-12 in that compartment (Bruck & Wegner, 2011). In addition, expression of the anti-inflammatory cytokines transforming growth factor beta (TGFβ) and IL-4 was upregulated. The reduction in the number of CNS lymphocytes associated with laquinimod therapy may be the result of a downregulation of very late activating antigen (VLA-4) (Wegner et al., 2010). and the interaction of VLA-4 with its main ligand vascular cell adhesion molecule (VCAM)-1. Laquinimod also reduced the ability of VLA-4 to integrate chemokine signaling. Laquinimod treatment was associated with an increase in regulatory T cells (Tregs) in the EAE model, (Mishra et al., 2012; Schulze-Topphoff et al., 2012) and it modulates B lymphocytes and their regulatory effects on T cells. Toubi and colleagues demonstrated that laquinimod administration diminishes levels of IL-4, while increasing regulatory B-cell markers (CD25, IL-10, and CD86) (Toubi et al., 2012).
Effects of laquinimod on the innate immune system have also been demonstrated. Bjork et al. showed that quinolone-3-carboxamides bind to the S100A9 protein, which is expressed on the surface of various myeloid cells (Bjork et al., 2009). The quinolone-3-carboxamides interfere with the interaction of S100A9 with toll-like receptor (TLR)-4 and receptor of advanced glycation end products (RAGE), and reduces the downstream release of inflammatory cytokines, including TNFα and IL-1. Laquinimod reduced the capacity of human monocyte-derived dendritic cells to induce CD4+ T-cell proliferation and secretion of proinflammatory cytokines in murine models (Jolivel et al., 2013). Furthermore, it decreased chemokine production in mature dendritic cells. As shown in the EAE animal model, laquinimod may reduce the entry of proinflammatory monocytes into the CNS by lowering their expression of matrix metalloproteinase (MMP)-9, a protease that facilitates the migration of cells across biological membranes (Mishra et al., 2012). In laquinimod-treated patients, reduced chemokine and cytokine secretion by conventional CD11c+ dendritic cells (DC) was found upon lipopolysaccharide (LPS) stimulation, and the number of conventional CD11c+ and plasmacytoid CD303+ (DC) was decreased in peripheral blood (Jolivel et al., 2013).
Laquinimod has good CNS bioavailability and has been shown to have diverse effects on CNS-intrinsic cells (Bruck & Wegner, 2011; Toubi et al., 2012; Ruffini et al., 2013). Brück and Wegner demonstrated that laquinimod reduces the activation of microglia (Bruck & Wegner, 2011). In a model of chemical CNS demyelination with cuprizone, laquinimod reduced microglial density, and the density of apoptotic oligodendrocytes in the corpus callosum (Bruck et al., 2012). In this model, a downregulation of the astrocytic proinflammatory response and a preservation of myelin and axons were also observed (Bruck et al., 2012).
The molecular events associated with laquinimod treatment that result in these myelorestorative and axonoprotective effects remain to be elucidated. In one study, laquinimod attenuated astrocytic NFκB activation by 46% (Bruck et al., 2012). In the EAE model, laquinimod prevented alterations of GABAergic synapses (Ruffini et al., 2013). Synaptic transmission was also regulated by increasing inhibitory postsynaptic currents and, at the same time, reducing excitatory postsynaptic currents (Ruffini et al., 2013). Finally, laquinimod therapy may increase expression of the neurotrophin brain-derived neurotrophic factor (BDNF) by myeloid cells (Thone et al., 2012). Interestingly, the beneficial effect of laquinimod was reduced in mice with a conditional deficiency in BDNF in immune cells. Moreover, in blood samples from patients with MS treated with laquinimod, more than 75% showed a significant increase in BDNF serum levels compared with baseline and with samples from placebo-treated patients (Thone et al., 2012)
The clinical development of laquinimod has advanced through one phase II, one phase IIb, and two phase III clinical studies (Polman et al., 2005; Comi et al., 2012; Vollmer et al., 2014). The phase III placebo-controlled BRAVO study determined effects of laquinimod in patients with relapsing-remitting MS (RRMS), and descriptively compared laquinimod with interferon beta (IFNβ)-1a (Avonex®) (Vollmer et al., 2014). The primary endpoint was annualized relapse rate (ARR); secondary endpoints included percent brain volume change (PBVC) and 3-month confirmed disability worsening. Laquinimod significantly reduced PBVC by 28% (p ≤ 0.001) compared to placebo in this two year study. The cellular substrate or molecular events underlying that treatment effect are unknown and may include neurons, oligodendrocytes, astrocytes, and microglia cells.
Given these observations and results from animal studies on its potentially neuroprotective and anti-inflammatory properties, we hypothesized that laquinimod diminishes neurodegeneration within the CNS. As proof of principle, we decided to test our hypothesis in the F1 3xTg-AD/C3H mouse model of Alzheimer’s disease (AD), (Oddo et al., 2003) a progressive human neurodegenerative disorder. The neuropathological correlates of AD include the progressive loss of neurons and synapses in the cerebral cortex and subcortical regions, plaques consisting of mostly insoluble amyloid-beta (Aβ) depositions, as well as neurofibrillary tangles that are aggregates of the microtubule-associated protein tau, which has become hyperphosphorylated and subsequently accumulate inside neurons.
Specifically, we assessed effects of laquinimod on brain volume by magnetic resonance imaging (MRI), behavioral outcomes, amyloid beta (Aβ) accumulation, tau phosphorylation, cell numbers of leukocytes, neurons, glial cells, and microglia in the brain, as well as microglial activation.
2. Results
2.1. Laquinimod does not reduce brain atrophy in an animal model of AD
In Alzheimer’s disease patients, brain atrophy is associated with neurologic dysfunction. The phase III placebo-controlled BRAVO study showed that laquinimod significantly reduced PBVC by 28% (p < 0.001) compared to placebo. Although a late biomarker of AD, we wanted to test if laquinimod treatment reduces brain atrophy in the F1 3xTg-AD/C3H model of AD. Long-term treatment for 10 months with laquinimod (5 mg/kg, 10 mg/kg, or 25 mg/kg) did not alter the total brain volume of the treated mice compared to the PBS control group between the ages of 4 and 14 months (Fig. 2A). In fact, there was a non-significant increase in brain volume that may correlate with growth and weight gain during this age period (http://www.hilltoplabs.com/public/mice.html.)
Fig. 2.

Long-term treatment with laquinimod at different concentrations did not affect total brain volume versus PBS-vehicle control treatment in an animal model of Alzheimer’s disease (A) Serial cross sectional MRI analyses were utilized to measure the total brain volume of F1 3xTg-AD/C3H mice treated with PBS (n = 9), laquinimod 5 mg/kg (n = 5), or laquinimod 25 mg/kg (n = 4). Representative 3-D rendering of mouse brains showing (B) coronal, (C) sagittal (D), and axial views (E).
2.2. Laquinimod treatment results in differential outcomes in open field and locomotor testing
To assess whether treatment with laquinimod has an effect on anxiety and motor activity in mice we conducted an open field test and observed mice in locomotor activity boxes (Fig. 3A). In the open field test we observed that F1 3xTg-AD/C3H mice treated with 5 mg/kg laquinimod spent significantly less time in the central anxiogenic region of the open field compared to the PBS treated control group (Fig. 3B). The laquinimod treated group also spent a significant longer amount of time in the thigmotaxis zone of the open field compared to the PBS treated group (Fig. 3C), and entered the central anxiogenic less frequently (Fig. 3D). Both groups displayed similar frequencies of entering the thigmotaxis zone in the open field test (Fig. 3E). Experimental animals in both groups also displayed similar distances traveled in the central anxiogenic region of the open field (Fig. 3F). In the locomotor test, both groups displayed similar habituation of locomotor activity as measured by beam breaks over a 2 h time period (Fig. 3G). The total beam breaks over the 2-h time period were also similar between the two mouse groups (Fig. 3H).
Fig. 3.
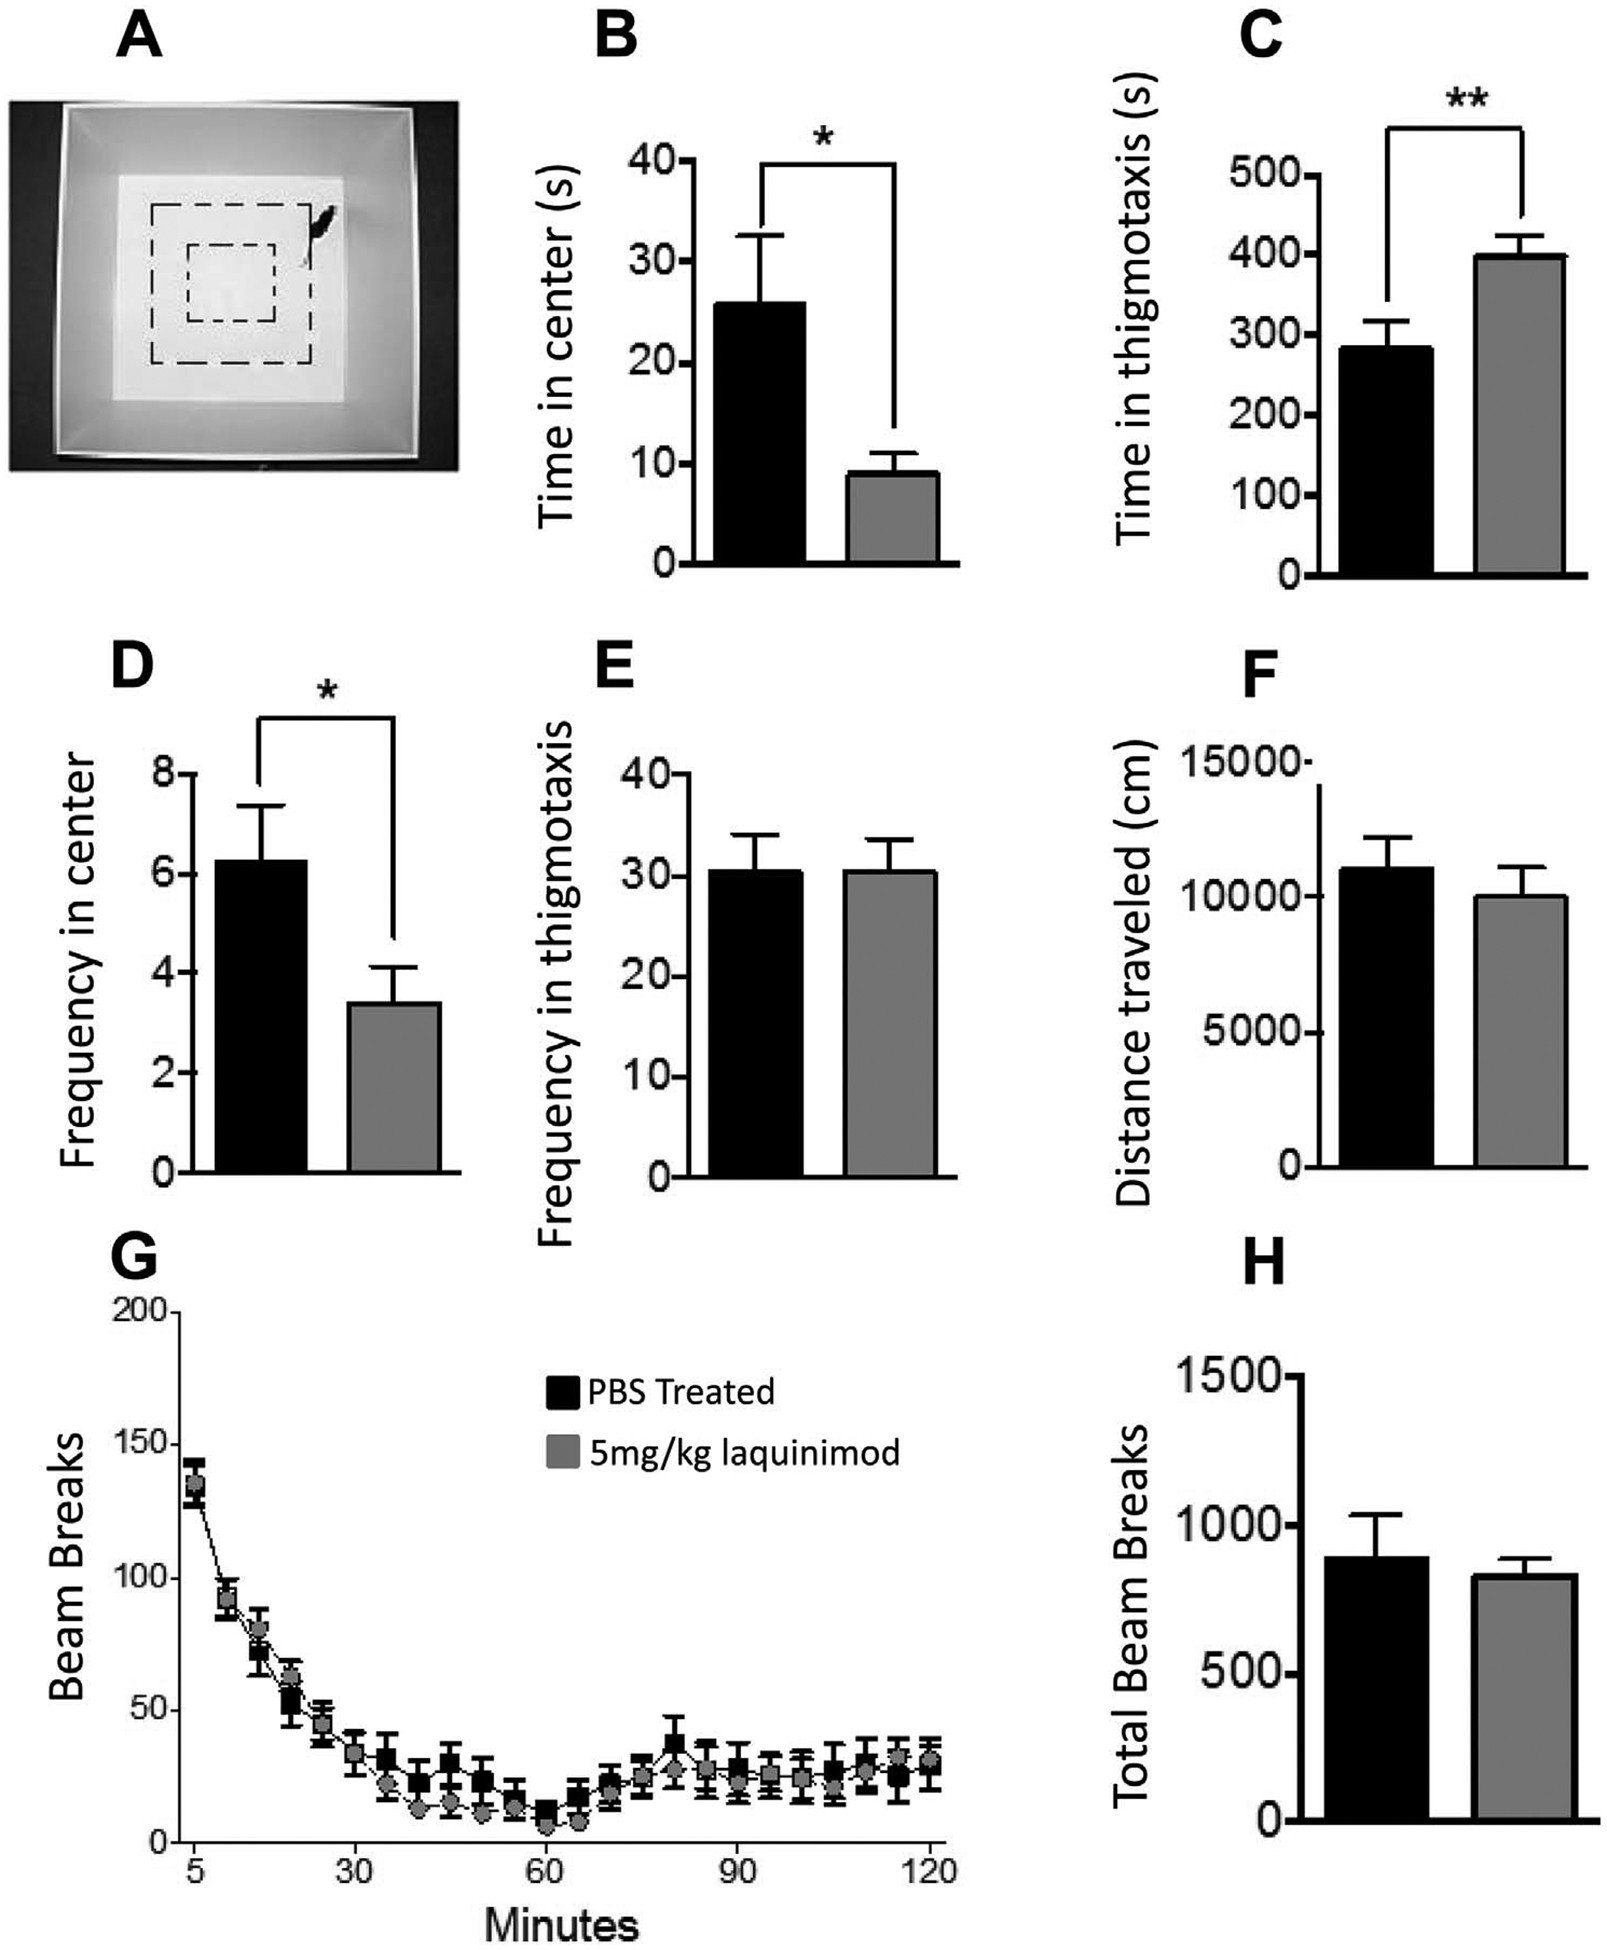
Laquinimod treatment results in differential outcomes in open field and locomotor testing (A) Shows the locomotor activity box used in these experiments (B) In the open field test, F1 3xTg-AD/C3H mice treated with 5 mg/kg laquinimod (n = 22) spent significantly less time in the central anxiogenic region of the open field compared to the PBS treated control group (n = 21) (C) The laquinimod treated group also spent a significant longer amount of time in the thigmotaxis zone of the open field compared to the PBS treated group, (D) and entered the central anxiogenic less frequently (E) Both groups displayed similar frequencies of entering the thigmotaxis zone in the open field test (F) Experimental animals in both groups also displayed similar distances traveled in the central anxiogenic region of the open field (G) In the locomotor test, both groups displayed similar habituation of locomotor activity as measured by beam breaks over a period of 2 h (H) The total beam breaks over the 2-h period were also similar between the two mouse groups. Other laquinimod treatment groups were not tested, as a minimum of 20 mice per group was considered meaningful for these studies.
2.3. Laquinimod has no effect on spatial memory in an animal model of Alzheimer’s disease
Spatial memory was assessed in laquinimod treated mice and control animals using the Morris water maze test. During a 10-day training period, F1 3xTg-AD/C3H mice treated with 5 mg/kg laquinimod and PBS displayed similar latencies to reach platform (Fig. 4A). Both treatment groups also displayed similar percent time in the thigmotaxis zone (Fig. 4B), distance traveled (Fig. 4C), and swam at similar speeds (Fig. 4D). In the probe test, both laquinimod-treated and PBS-treated mice showed a significant preference for the target quadrant when compared to the other quadrants (Fig. 4E).
Fig. 4.

Laquinimod has no effect on spatial memory in and animal model of Alzheimer’s disease (A) In the water maze test, both, F1 3xTg-AD/C3H mice treated with 5 mg/kg laquinimod (n = 22) and PBS (n = 21) displayed similar latencies to reach platform during the 10-day training period (B) Both groups also displayed similar percent time in the thigmotaxis zone, (C) distance traveled, and (D) swam at similar speeds (E) In the probe test both laquinimod-treated and PBS-treated mice showed a significant preference for the target quadrant when compared to the other quadrants. Other laquinimod treatment groups were not tested, as a minimum of 20 mice per group was considered meaningful for these studies.
2.4. Laquinimod does not affect cell numbers and composition of CNS intrinsic cells
To determine whether laquinimod alters the frequency of different cell populations in the brain of these mice we performed multiparameter flow cytometry to immunophenotype and quantitate cells in the CNS.
In AD, there is progressive neuronal loss. As stated above, laquinimod significantly reduced the rate of brain atrophy in a phase III clinical trial in patients with MS (Vollmer et al., 2014). The cellular substrate of that effect is unknown and may include neurons, oligodendrocytes, astrocytes, and microglia cells.
There was no difference in the frequency of neurons (CD45−CD11b−NeuN+) (Fig. 5A), or oligodendrocytes (CD45−CD11b−O4+) (Fig. 5B) between the laquinimod treatment groups and the PBS control group in F1 3xTg-AD/C3H mice. Activated astrocytes have been associated with AD plaques (Griffin et al., 1998). We found no effect of laquinimod therapy on astrocyte cell numbers (CD45−CD11b−ASCA-2+) in the (Fig. 5C). Microglia, macrophage-like cells resident to the brain, have been spatially associated with AD plaques. We hypothesized that laquinimod, which is capable of inhibiting microglial/macrophage activation might be able to reduce the numbers of microglia/macrophages in the brain of treated mice (Mishra et al., 2012; Bruck et al., 2012). However, there was no significant difference in the number of total microglia cells (CD11b+F4/80+CCR2−CD68−) (Fig. 5D), or MHC II+ activated microglia cells (Fig. 5E) between laquinimod or PBS-treated F1 3xTg-AD/C3H mice.
Fig. 5.

Treatment with laquinimod does not significantly alter the frequency of neurons, glial cells, or microglia in the central nervous system (CNS) compared to PBS treatment in an animal model of Alzheimer’s disease (A) Flow cytometric analysis of frequency of neurons (CD45−CD11b−NeuN+), (B) oligodendrocytes (CD45−CD11b−O4+), (C) astrocytes (CD45−CD11b−ASCA-2+), (D) microglia (CD11b+F4/80+CCR2−CD68−), and (E) activated microglia (CD11b+F4/80+CCR2−CD68−MHC II+) in brains of F1 3xTg-AD/C3H mice dosed with incremental concentrations of laquinimod, or PBS control are shown. Experimental animals were treated with laquinimod 5 mg/kg (n = 7), 10 mg/kg (n = 5), 25 mg/kg (n = 5), or PBS (n = 9).
2.5. Laquinimod therapy does not significantly alter the frequency of lymphocytes types in the central nervous system in an animal model of Alzheimer’s disease
Compared to other naïve mouse strains that we evaluated with similar methods, we detected a similar number of lymphocytes in the brain of F1 3xTg-AD/C3H mice. However, flow cytometric analysis showed no difference between the different laquinimod treatment groups and the PBS control group with regards to the frequency of CD45+ lymphocytes (Fig. 6A), CD3+ T-cells (Fig. 6B), CD4+ T-cells (Fig. 6C), CD8+ T-cells (Fig. 6D), and CD19+ B-cells (Fig. 6E) per live/singlet cells of brains of F1 3xTg-AD/C3H mice.
Fig. 6.
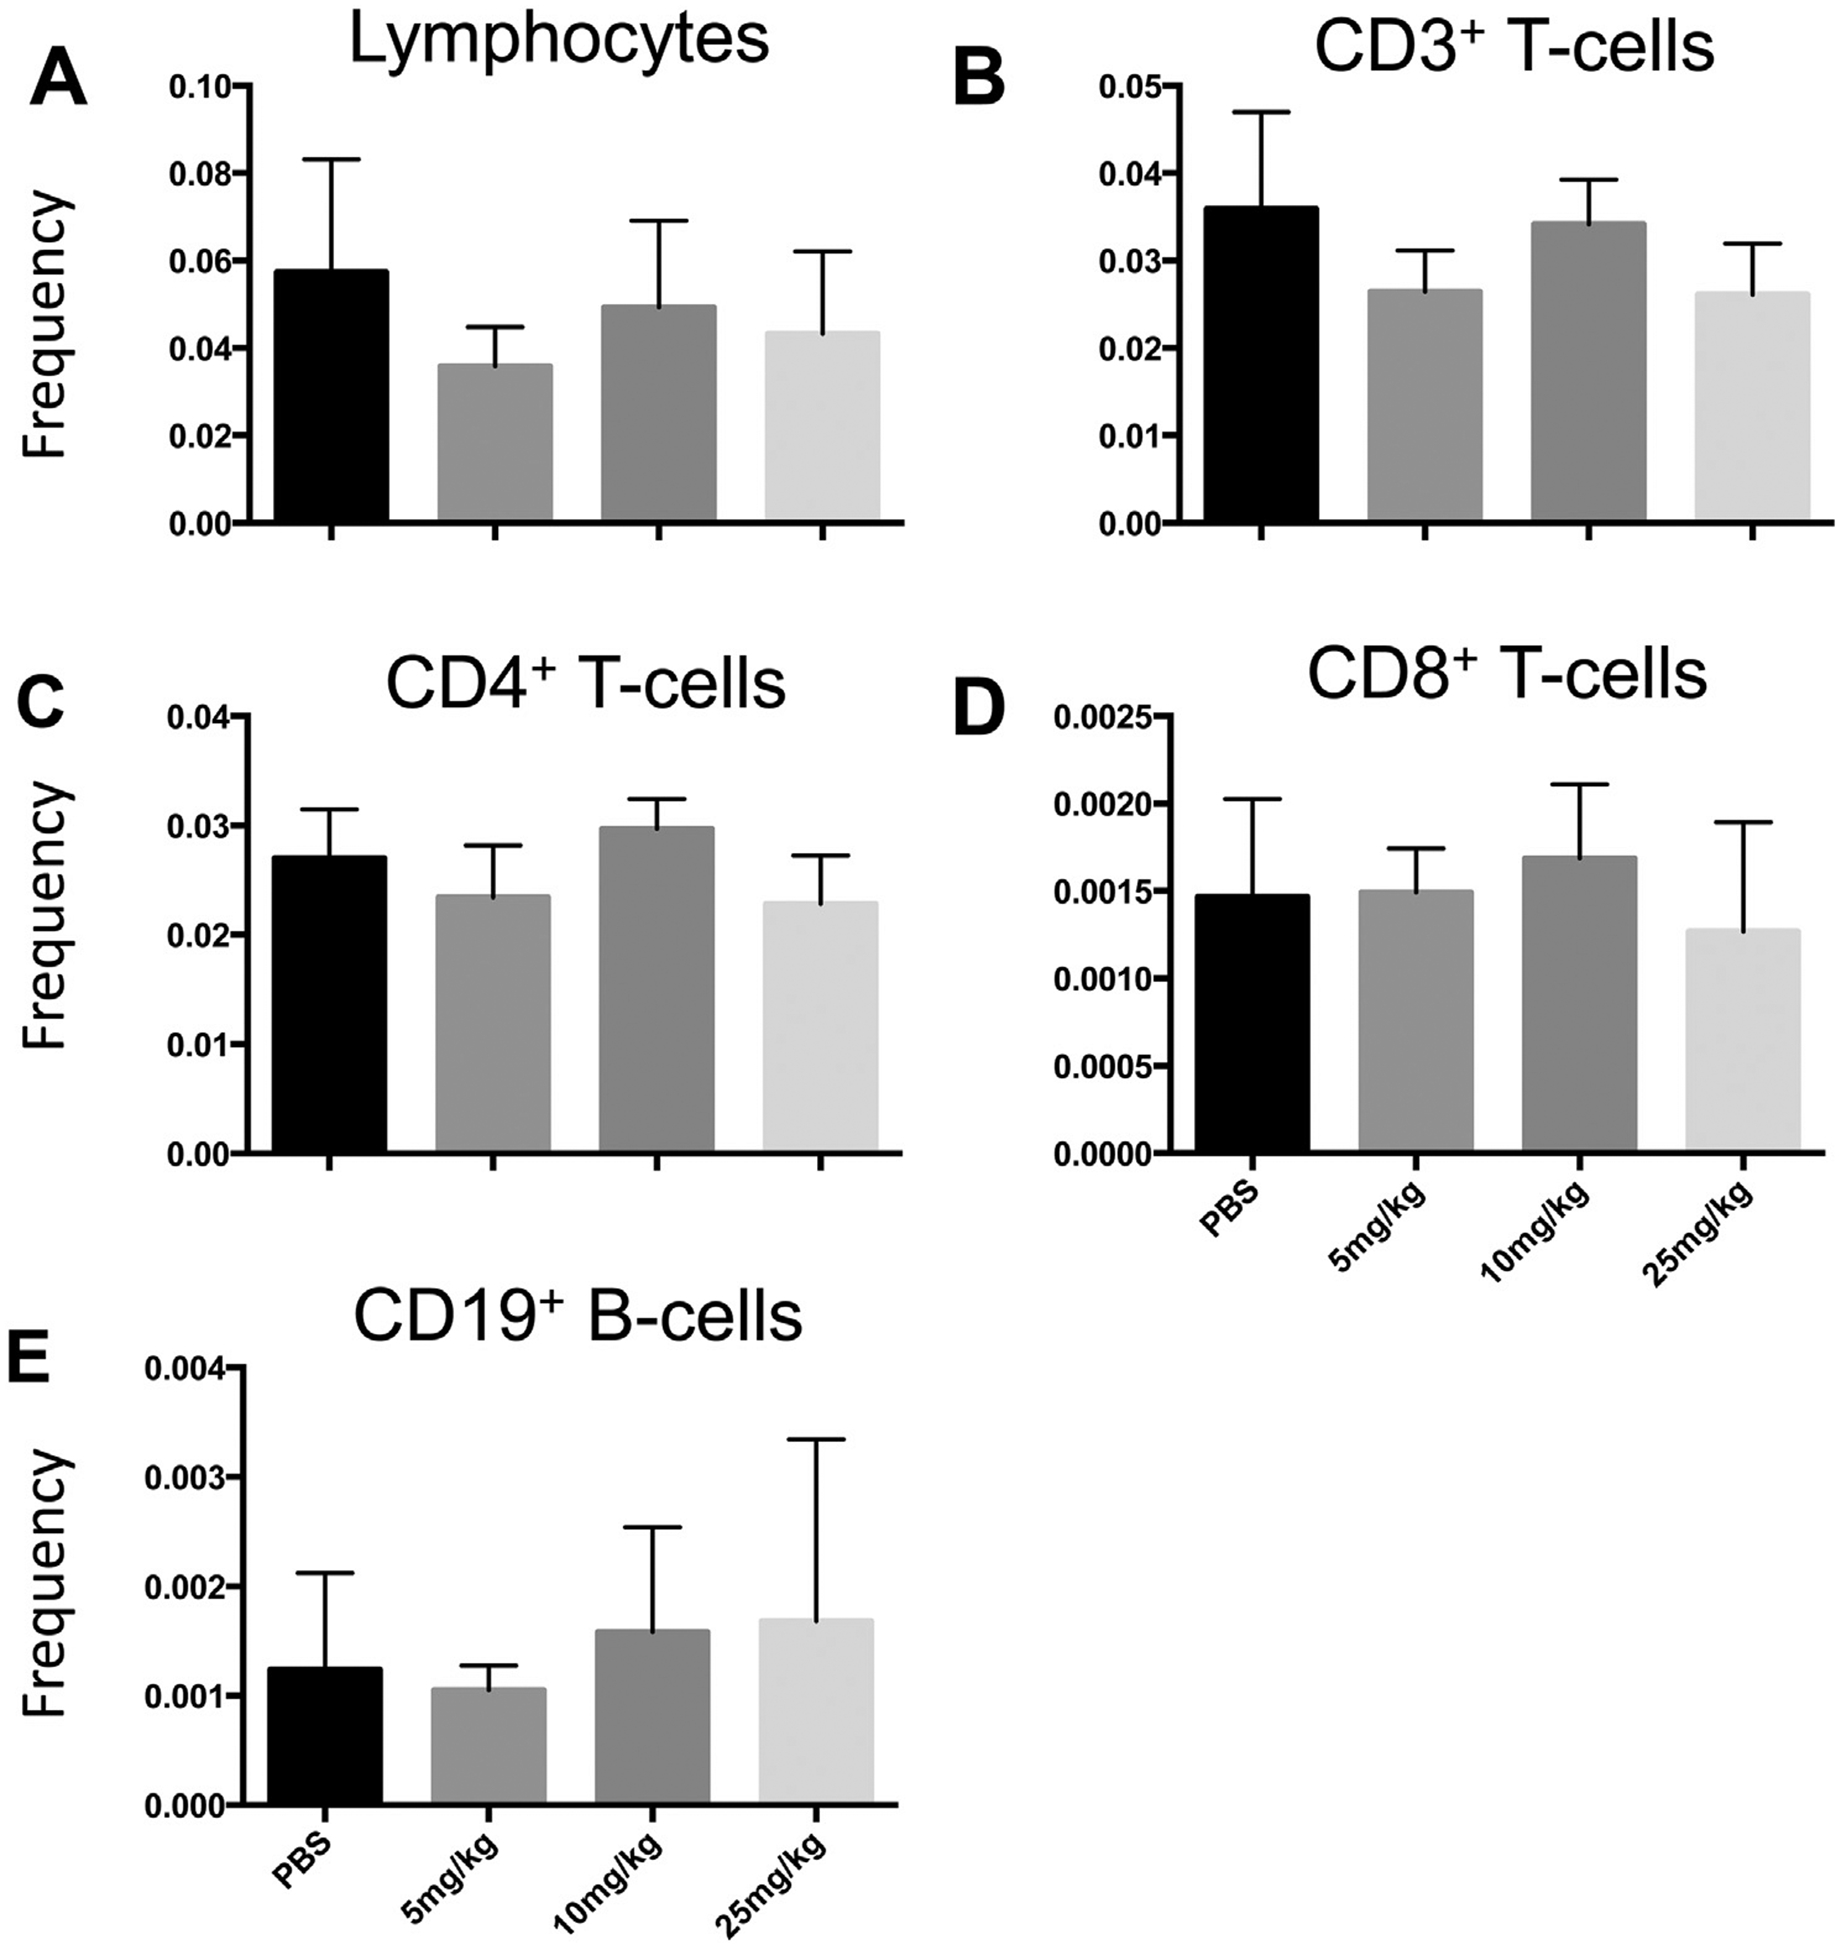
Laquinimod therapy does not significantly alter the frequency of lymphocytes types in the central nervous system (CNS) compared to PBS treatment in an animal model of Alzheimer’s disease (A) Flow cytometric analysis of frequency of total lymphocytes, (B) total CD3+ T-cells, (C) CD4+ T-cells, (D) CD8+ T-cells, and (E) CD19+ B-cells in brains of F1 3xTg-AD/C3H mice. Experimental animals were treated with laquinimod 5 mg/kg (n = 7), 10 mg/kg (n = 5), 25 mg/kg (n = 5), or PBS (n = 9).
2.6. Intraneuronal amyloid beta and phosphorylated tau are detectable in brain tissue of F1 3xTg-AD/C3H mice
Brains from laquinimod-treated mice and control mice were stained with a panel of antibodies detecting amyloid and tau pathology, as well as microglial activation. Since F1 3xTg-AD/C3H mice were utilized instead of 3xTg-AD mice, the extent of CNS pathology had to be established. Intraneuronal Aβ was clearly visible in neurons of hippocampus and cortex (brown color, Fig. 7A–D). Laquinimod had no effect on Aβ immunoreactivity. The number of microglia cells, which were stained in the same sections with a different labelled secondary antibody (blue color, Fig. 7A–D), was similar among the treatment groups. All mice had a dense network of ramified resting microglia consistent with a surveillance phenotype throughout the different brain areas.
Fig. 7.

Tau pathology is abundantly present in frontal cortex and amygdala of F1 3xTg-AD/C3H mice. A to F show human Tau positive neurons in frontal cortex of PBS treated mice (A to C), and Laquinimod treated mice (D to F). Tau tangles were also found in the amygdala and are positive of human Tau (G, HT7), pT231 (H, AT180), and pS199/pS202/pT205 (I, AT8)
Next, different forms of tau were analyzed. In a hyperphosphorylated state, binding of tau to microtubules is reduced, and tau can aggregate in neurofibrillary tangles. In 3xTg mice, tau pathology occurs early at around 2 months of age (Oddo et al., 2003) Hyperphosphorylated tau is first visible in the CA1 pyramidal neurons and subiculum and amygdala, later becoming apparent in the hippocampus and cortex. To assess the effect of long-term laquinimod therapy on total tau expression in hippocampi of experimental mice, histological staining with the monoclonal antibody HT7 antibody was performed. Again, we did not observe any difference between the laquinimod treatment groups and the PBS control (Fig. 7). Major differences, however, were found between male and female mice, in that there was detectable hyperphosphorylated tau in female animals (Fig. 8E & F). Therefore, we used the females for the comparisons of staining with the phosphotau antibodies. To determine specifically the expression of hyperphosphorylated tau, monoclonal antibodies specific for pT231 (AT180), pS214 and pS199/pS202/pT205 (AT8) were utilized. Specifically, pT231 is a marker for early tau phosphorylation, whereas pS199, pS202, and pT205 are considered markers of late tau phosphorylation sites. All these phosphotau epitopes were clearly present in brains from mice used in this study (Fig. 7).
Fig. 8.

A trend towards decreased tau phosphorylation in hippocampi of laquinimod-treated experimental animals. Immunohistochemical analyses of brains from PBS-treated control F1 3xTg-AD/C3H mice (A, C, E, and F), and Laquinimod treated F1 3xTg-AD/C3H mice (B, D, G, and H) revealed intraneuronal Aβ42 (A–D; brown color) and microglia staining (A–D; blue color). Panels A and B show the subiculum area of the hippocampus (40× magnification). Panels C and D show an area of the frontal cortex (80× magnification). Panels E–H show staining with the monoclonal antibody AT180 that detects pT231 in the subiculum and CA1 of hippocampi (10× magnification). Panel E is an example of a PBS-treated female mouse, panel F is a PBS treated male mouse, and panels G and H are laquinimod-treated female mice. In panel I, Image J analyses for the total area of AT80 positive neurons are shown in arbitrary units. While there no significant differences for the total AT180 positive area were found between the treatment groups, there was a strong trend towards decreased tau phosphorylation in hippocampi of laquinimod-treated experimental animals
Further immunohistochemistry analyses of brains from PBS-treated control F1 3xTg-AD/C3H mice (Fig. 8A, C, E, & F), and laquinimod-treated F1 3xTg-AD/C3H mice (Fig. 8B, D, G, & H) revealed intraneuronal Aβ42 (Fig. 8 A–D; brown color) and microglia staining (Fig. 8A–D; blue color). In order to obtain a semiquantitative assessment of tau hyperphosphorylation in the subiculum of laquinimod-treated and PBS-treated F1 3xTg-AD/C3H mice, the amount of pT231 (AT180) positive neurons was assessed with NIH Image J software. While there were no significant differences for the total AT180 positive area were found between the treatment groups, there was a strong trend towards decreased tau phosphorylation in hippocampi of laquinimod-treated experimental animals (Fig. 8I).
3. Discussion
The primary purpose of this project was to test whether laquinimod can diminish tissue loss in an animal model of a progressive human neurodegenerative disorder. Data generated by other investigators provided numerous biologically plausible arguments to advance these studies. As stated above, laquinimod penetrates the CNS after systemic administration, and has been shown to have diverse effects on CNS-intrinsic cells (Wegner et al., 2010). This pharmacological property is likely an absolute requirement to successfully treat CNS neurodegenerative disorders. There is also evidence that laquinimod is neuroprotective in the EAE model of MS, where it prevented alterations of GABAergic synapses and reduced excitatory postsynaptic currents (Ruffini et al., 2013). While the mechanisms that underlie potential neuroprotective properties of laquinimod are not fully understood, laquinimod therapy increased the expression of BDNF by myeloid cells (Thone et al., 2012). Perhaps most importantly, laquinimod significantly reduced PBVC by 28% compared to placebo in patients with RRMS in the phase III BRAVO trial (Vollmer et al., 2014). In the ALLEGRO phase III trial, a prespecified exploratory analysis also revealed that patients receiving laquinimod had a lower percentage of brain-volume loss from baseline to 24 months, as compared with patients receiving placebo (Comi et al., 2012). Taken together, these data suggest a potentially neuroprotective effect in patients with a CNS disorder that is associated with an accelerated brain volume loss (Miller et al., 2002).
We assessed effects of laquinimod on brain volume by magnetic resonance imaging (MRI), neurobehavioral outcomes, Aβ accumulation, tau phosphorylation, cell numbers and of leukocytes, neurons, glial cells, and microglia in the brain, as well as microglial activation. Following 10 months of oral treatment with laquinimod, our study was negative for the primary endpoint, in that we did not see any volumetric changes in brains of mice treated with laquinimod versus those treated with PBS. The F1 3xTg-AD/C3H mouse model of AD lacks a cardinal feature of AD: Brain volume loss. Therefore, laquinimod could not show a treatment effect.
We also did not find any difference in the number of CNS intrinsic cells and lymphocytes between treatment groups. At first glance, these results appear to contradict many published reports on the biological effects of laquinimod in animals. However, almost all previously published animal experiments were conducted in actively or passively induced EAE, or in chemical demyelination models with cuprizone. We purposefully did not attempt to utilize these models as it is currently unclear how well they reproduce human neurodegeneration of the CNS. In fact, almost all EAE model are driven by T cell and B cell attacks on the CNS myelin sheet, and neurodegeneration is either absent or not routinely assessed.
Results from behavioral studies were partially positive in that they showed differences between laquinimod treated-mice and PBS-treated controls. To summarize, F1 3xTg-AD/C3H mice treated with 5 mg/kg laquinimod spent significantly less time in the central anxiogenic region of the open field compared to the PBS treated control group (Fig. 3B). The laquinimod treated group also spent a significantly longer amount of time in the thigmotaxis zone of the open field compared to the PBS treated group (Fig. 3C), and entered the central anxiogenic less frequently (Fig. 3D). Most behavioral experts view this test as just an initial screening for numerous behaviors, including anxiety. It can also show difference in locomotor and exploratory activity. To interpret the tru impact of laquinimod in this specific mouse model, the differences shown between treatment groups would need to be followed up with tests that directly assess anxiety, including the dark/light test and elevated plus maze test with larger sample sizes.
We alos observed a trend towards decreased tau phosphorylation in hippocampi of laquinimod-treated experimental animals (Fig. 8I), although these differences were not statistically significant.
The current dogma is that accumulation of Aβ in CNS tissue results in an innate inflammatory response, and release of soluble inflammatory mediators, leading to tau phosphorylation and loss of neurons (Zheng et al., 2002) Kitazawa and colleagues have shown that innate immune responses may lead to tau hyperphosphorylation and accumulation, identifying a possible mechanism for laquinimod to affect tau accumulation without increasing Aβ expression (Kitazawa et al., 2005). Specifically, these investigators showed that the administration of lipopolysaccharide (LPS) to 3xTg-AD mice left Aβ accumulation unaffected, but significantly induced tau hyperphosphorylation at specific sites in the brain that were mediated by the activation of cyclin-dependent kinase 5 (cdk5) through increased formation of the p25 fragment (Kitazawa et al., 2005). These investigators further showed that administration of a selective and potent inhibitor of cdk5 markedly blocked the LPS-induced tau phosphorylation in the hippocampus. Laquinimod has modest anti-inflammatory properties, and many of its molecular targets have yet to be defined. It is currently unknown whether laquinimod affects the cdk5 pathway, or whether other molecular pathways affected by laquinimod may have similar effects. Our own studies did not show a difference in the frequency of activated microglia cells in whole brain by flow cytometry (Fig. 5E), and a histological examination also did not show a significant difference in the frequency of ramified hippocampal microglia (Fig. 7A–D). It may still be possible that laquinimod alters the regulation of soluble mediators that regulate tau phosphorylation.
Failure of laquinimod to reach secondary study outcomes may be the result of treatment dosing, frequency, and duration, as well as relatively small treatment groups. However, much lower cumulative doses of laquinimod showed detectable biological effects in the EAE model of MS (Wegner et al., 2010; Thone et al., 2012; Brunmark et al., 2002; Yang et al., 2004; Moore et al., 2013; Berg et al., 2016).
4. Methods
4.1. Animals
To study the interaction between Aβ and tau and their effect on synaptic function, Oddo et al. generated a triple-transgenic (Tg) animal model (3xTg-AD mouse) (Oddo et al., 2003). 3xTg-AD mice express the following transgenes: (1) The presenilin mutation PS1M146V that leads to dominant inheritance of early onset familial AD (Duff et al., 1996). This mutation alters the γ-secretase digestion of the amyloid precursor protein (APP), resulting in increased ratio of A42/A40 and accelerated amyloid plaque accumulation. (2) The mutant amyloid precursor protein APPSwe, which also results in an increased accumulation of Aβ plaques in the brain of transgenic mice (Lewis et al., 2001). (3) A transgene of the human mutant P301 tau gene (tauP301L transgene) (Terwel et al., 2005) that is associated with frontotemporal dementia with Parkinsonism. The 3xTg-AD mice develop an age-related and progressive neuropathological phenotype that includes Aβ plaques and neurofibrillary tangles. At 6 months of age, synaptic dysfunction and long-term potentiation (LTP) deficits are typically apparent. Many pyramidal cells in the CA1 hippocampal subfield are immunoreactive for different Aβ epitopes at that age. 3xTg-AD mice also express human tau approximately 6-fold over endogenous mouse tau neurofibrillary (Oddo et al., 2003). 3xTg-AD males were crossed with C3H females to generate an F1 mouse model (F1 3xTg-AD/C3H).
All experimental animals were maintained in a specific pathogen-free facility at the University of Texas (UT) Southwestern Medical Center. All protocols involving the handling of mice were approved by the UT Southwestern animal care facility.
4.2. Treatment
A dose response study was conducted as shown in Fig. 1. In experiment 1200 μl of laquinimod (5 mg/kg) dissolved in PBS was administered to 22 F1 3xTg-AD/C3H mice (11 males, and 11 females), and PBS alone was administered to 21 F1 3xTg-AD/C3H control mice (10 males, and 11 females). In experiment 2, additional higher doses of laquinimod were tested. Specifically, experimental mice were treated with laquinimod 10 mg/kg (7 males, and 7 females), or 25 mg/kg (7 males, and 7 females) on alternate days for 10 months. In order to ensure that controls were contemporaneous, we include a concurrent PBS control (5 males, and 7 females).
Fig. 1.

Experimental outline of project. Utilizing a dose response study design, two experiments were conducted in parallel. In experiment 1200 μl of laquinimod (5 mg/kg) dissolved in PBS, or PBS alone was administered directly to F1 3xTg-AD/C3H mice by oral gavage, so that a pre-defined volume and concentration could be achieved. Four months old mice were treated on alternate days using 18–20 gauge feeding tubes with a rounded tip for 10 months. In experiment 2, experimental mice were treated with laquinimod 10 mg/kg, 25 mg/kg, or PBS on alternate days for 10 months. The set of two studies were analyzed as a dose response study with 5 mg, 10 mg, 25 mg and both control groups combined to increase the power of the assessments.
Therapy was given by oral gavage, so that a pre-defined volume and concentration could be achieved. Four months old mice were treated on alternate days using 18–20 gauge feeding tubes with a rounded tip for 10 months. Mice were firmly restrained by grasping the loose skin of the neck and back, to immobilize the head but not such that the animal vocalized or showed other signs of distress. While holding experimental animals in an upright position, the gavage needle was passed along the side of the oral cavity. Following the roof of the mouth, the needle was advanced into the esophagus and towards the stomach. If there was any resistance, instead of forcing the needle it was removed and reat-tempted. After the needle was passed to the correct length, the agent was slowly injected. After dosing, the needle was removed gently following the same angle as insertion.
4.3. MRI imaging
Serial cross-sectional MRI were conducted using a 7-Tesla small animal MRI system (Varian Inc., Palo Alto, CA) with a 40 mm (i.d.) millipede volume coil and a 400mT/m gradient coil set. Under anesthesia by inhalation of 1.5–3% isoflurane mixed in medical-grade oxygen via nose-cone, the animals were placed supine with the respiratory sensor, head first with the head centered with respect to the center of a RF coil. Through the imaging session, animals were monitored for respiration rate with an MRI compatible monitoring system from SA Instruments (Stony Brook, NY) to adjust anesthesia depth.
Two-dimensional (2D) fast spin-echo (FSE) images on three orthogonal planes (transverse, coronal and sagittal) were first acquired to ensure the orientation of the head as a localizer imaging. For the brain volume measurements, three-dimensional (3-D) fast spin-echo images were acquired. The major imaging parameters were: TR/TEeff = 1500/80 msec, echo train (ETL) = 16, field of view (FOV) = 30×30×22.5 mm, matrix size = 128×128×96, 1 average, fat suppression, affording 234.4 μm isotropic resolution and a total scan time of 19 min and 15 s.
The mouse brain volumes were measured using a free software, so-called ITK-SNAP Medical Image Segmentation Tool (http://sourceforge.net/projects/itk-snap/), with the rejection competition force of 0.8 and the smooth force (curvature) of 0.4, the variable minimum threshold of ~4000–5000, the multiple bubbles been manually placed within the 3-dimentional brain region, and the iteration number ~ 1000. With the volume-rendered images generated through the 3D segmentation, the brain volume was calculated with the built-in volumes and Statistics function (Kubo et al., 2006).
4.4. Open field testing
The open field test was conducted as described previously (Etherton et al., 2009). Briefly, mice were placed along the edge of an open arena (“locomotor activity box”; 44 × 44 × 44 cm, ~7 lux) and allowed to freely explore for 10 min. Mice were monitored using CleverSys TopScan Software (Reston, VA).
4.5. Locomotor and rearing activity
Locomotor activity was measured as described previously (Etherton et al., 2009; Powell et al., 2004; Tabuchi et al., 2007). Mice were placed in novel cages (a clean cage with the same dimensions as their home cage; L × W × H = 27.3 cm × 16.5 cm × 12.7 cm) with minimal bedding and allowed to freely explore for 2 h under red lighting. Horizontal locomotor activity (i.e. the number of photobeam breaks) was measured by computer software (San Diego Instruments; San Diego, CA), and data were analyzed in 5 min bins.
4.6. Morris water maze testing
The Morris water maze task was conducted as previously described (Powell et al., 2004). Briefly, in a 120 cm diameter pool a 10-cm diameter circular platform was submerged ~1 cm below the surface of the water (22 ± 1 °C) made opaque with white, non-toxic tempra paint. After finding the platform or being guided by the experimenter to the platform if the 60 s trial elapsed, mice remained on the platform for 15 s before being removed and returned to their home cage. Training was conducted over 10 consecutive days, followed by a probe trial on day 11 (60 s swim with no platform).
4.7. Multiparameter flow cytometry
Mice were anesthetized with tribromoethanol, and perfused via the left ventricle with cold PBS. Brains were then harvested and cells were collected using the Miltenyi Neural dissociation kit (San Diego, CA). Cells were then blocked with Anti CD16/CD32 (15 min, 4 °C). Cells were then stained with the following monoclonal antibodies at 4 °C for 45 min: Anti-CD11b PE, anti-CD8 Pac Blue, anti-CD19 Percp-cy5.5, anti-CD4 Pe-cy7, anti CD45 PE-Dazzle594, anti-CD86 FITC, anti-CD45 Alexa Flour 700, anti-Ly6G PE, anti-CD11c Pacific Blue, anti-MHC II Percpcy5.5, anti-CD11b Bv650 all purchased from Biolegend (San Diego, CA), and anti-Ly6C PEtxRed (BD Biosciences, San Jose, CA), anti-F4/80 APC-cy7, anti-O4 Alexa Flour 488 (R & D Systems), anti-ASCA-2 APC (Miltenyi), anti-CD3 V500 (BD Biosciences), and anti-CD192 APC (R & D Systems, Minneapolis, MN). Cells were then fixed, permeabilized, (Fixation Buffer and Permeabilization wash buffer; Biolegend) and stained with intracellular stains anti-CD68 PEcy7 (Biolegend), anti-NeuN Alexa Flour 700 (Novus Biologicals, Littleton, CO) (4 °C 45 min). Cells were then washed twice and resuspended. Samples were run on an LSRFORTESSA flow cytometer (BD Biosciences). Data was analyzed with Flowjo v10.1 (Flowjo, Ashland, OR).
4.8. Immunohistochemistry
Sagittal parallel sections of paraformaldehyde fixed mouse brains were stained with antibodies specific for Aβ1–42 (McSA1, Medimabs, Canada) to detect intraneuronal Aβ42 deposition and plaques in hippocampus and cortex of the mice. Mouse antibodies HT7, AT8, AT180 (ThermoFisher Scientific, Walthamn, MS), and rabbit antibodies (pT231, pS214, Abcam, Cambridge, MA) were used to stain for tangle pathology. NeuN antibodies (ABN78, EMD Millipore, Billerica MA; 1B7, Abcam) were used to stain neurons. Microglia was analyzed by staining with the anti-MHC class II antibody (clone NIMR-4, Southern Biotech, Birmingham, AL). The stained tissues were scanned using a NanoZoomer digital pathology system and analyzed with NDP viewer software (Hamamatzu, Japan).
4.9. Phospho-tau+ area quantification
The AT180+ immunoreactive area was quantified using the “Area Measure” tool in Image J (NIH Software, Bethesda, MD). Immunostained sections (sagittal sections of mouse brain) were imaged with a 20× objective and were converted into 8-bit gray. The Analyze > Measure tool was utilized to measure the total area occupied by AT180+ cells in each image. The total AT180+ area was averaged for the sections per mouse group. Values are arbitrary units expressed as mean ± SEM per area.
4.10. Statistical analysis
Groups were compared using the Mann–Whitney U test. For parametric tests, data were checked for normality by using the Kolmogorov–Smirnov test. Normally distributed values were compared using the unpaired two-sided Student t-test. For data analyses the 2 PBS control group were compared and shown to behave the same with regard to all outcomes that were tested. The set of two studies were analyzed as a dose response study with 5 mg, 10 mg, 25 mg and both control groups combined to increase the power of the assessments. For all behavioral and memory testing, only the 5 mg/kg laquinimod and PBS treatment groups were included, as a minimum of 20 mice per group was considered meaningful for these studies. All values are presented as mean ± SEM.
Acknowledgements
This study was supported by a research grant from Teva Pharmaceuticals(OTD-104705). Dr. Stuve is funded by a Merit Review grant (federal award document number (FAIN) I01BX001674) from the U.S. Department of Veterans Affairs, Biomedical Laboratory Research and Development.
References
- Berg J, Mahmoudjanlou Y, Duscha A, et al. , 2016. The immunomodulatory effect of laquinimod in CNS autoimmunity is mediated by the aryl hydrocarbon receptor. J. Neuroimmunol 298, 9–15. [DOI] [PubMed] [Google Scholar]
- Bjork P, Bjork A, Vogl T, et al. , 2009. Identification of human S100A9 as a novel target for treatment of autoimmune disease via binding to quinoline-3-carboxamides. PLoS Biol. 7 (4), e97. [DOI] [PMC free article] [PubMed] [Google Scholar]
- Bruck W, Wegner C, 2011. Insight into the mechanism of laquinimod action. J. Neurol. Sci 306 (1–2), 173–179. [DOI] [PubMed] [Google Scholar]
- Bruck W, Pfortner R, Pham T, et al. , 2012. Reduced astrocytic NF-kappaB activation by laquinimod protects from cuprizone-induced demyelination. Acta Neuropathol. 124 (3), 411–424. [DOI] [PMC free article] [PubMed] [Google Scholar]
- Brunmark C, Runstrom A, Ohlsson L, et al. , 2002. The new orally active immunoregulator laquinimod (ABR-215062) effectively inhibits development and relapses of experimental autoimmune encephalomyelitis. J. Neuroimmunol 130 (1–2), 163–172. [DOI] [PubMed] [Google Scholar]
- Comi G, Jeffery D, Kappos L, et al. , 2012. Placebo-controlled trial of oral laquinimod for multiple sclerosis. N. Engl. J. Med 366 (11), 1000–1009. [DOI] [PubMed] [Google Scholar]
- Duff K, Eckman C, Zehr C, et al. , 1996. Increased amyloid-beta42(43) in brains of mice expressing mutant presenilin 1. Nature 383 (6602), 710–713. [DOI] [PubMed] [Google Scholar]
- Etherton MR, Blaiss CA, Powell CM, Sudhof TC, 2009. Mouse neurexin-1alpha deletion causes correlated electrophysiological and behavioral changes consistent with cognitive impairments. Proc. Natl. Acad. Sci. U. S. A 106 (42), 17998–18003. [DOI] [PMC free article] [PubMed] [Google Scholar]
- Griffin WS, Sheng JG, Royston MC, et al. , 1998. Glial-neuronal interactions in Alzheimer’s disease: the potential role of a ‘cytokine cycle’ in disease progression. Brain Pathol. 8 (1), 65–72. [DOI] [PMC free article] [PubMed] [Google Scholar]
- Jolivel V, Luessi F, Masri J, et al. , 2013. Modulation of dendritic cell properties by laquinimod as a mechanism for modulating multiple sclerosis. Brain 136 (Pt 4), 1048–1066. [DOI] [PubMed] [Google Scholar]
- Karussis DM, Lehmann D, Slavin S, et al. , 1995. Immunomodulation of autoimmunity by linomide. Isr. J. Med. Sci 31 (1), 38–41. [PubMed] [Google Scholar]
- Kieseier BC, 2014. Defining a role for laquinimod in multiple sclerosis. Ther. Adv. Neurol. Disord 7 (4), 195–205. [DOI] [PMC free article] [PubMed] [Google Scholar]
- Kitazawa M, Oddo S, Yamasaki TR, Green KN, LaFerla FM, 2005. Lipopolysaccharide-induced inflammation exacerbates tau pathology by a cyclin-dependent kinase 5-mediated pathway in a transgenic model of Alzheimer’s disease. J. Neurosci 25 (39), 8843–8853 the official journal of the Society for Neuroscience. [DOI] [PMC free article] [PubMed] [Google Scholar]
- Kubo S, Levantini E, Kobayashi S, et al. , 2006. Three-dimensional magnetic resonance microscopy of pulmonary solitary tumors in transgenic mice. Magn. Reson. Med 56 (3), 698–703 official journal of the Society of Magnetic Resonance in Medicine/Society of Magnetic Resonance in Medicine. [DOI] [PubMed] [Google Scholar]
- Lewis J, Dickson DW, Lin WL, et al. , 2001. Enhanced neurofibrillary degeneration in transgenic mice expressing mutant tau and APP. Science 293 (5534), 1487–1491. [DOI] [PubMed] [Google Scholar]
- Miller DH, Barkhof F, Frank JA, Parker GJ, Thompson AJ, 2002. Measurement of atrophy in multiple sclerosis: pathological basis, methodological aspects and clinical relevance. Brain 125 (Pt 8), 1676–1695. [DOI] [PubMed] [Google Scholar]
- Mishra MK, Wang J, Silva C, Mack M, Yong VW, 2012. Kinetics of proinflammatory monocytes in a model of multiple sclerosis and its perturbation by laquinimod. Am. J. Pathol 181 (2), 642–651. [DOI] [PubMed] [Google Scholar]
- Moore S, Khalaj AJ, Yoon J, et al. , 2013. Therapeutic laquinimod treatment decreases inflammation, initiates axon remyelination, and improves motor deficit in a mouse model of multiple sclerosis. Brain Behav. 3 (6), 664–682. [DOI] [PMC free article] [PubMed] [Google Scholar]
- Oddo S, Caccamo A, Shepherd JD, et al. , 2003. Triple-transgenic model of Alzheimer’s disease with plaques and tangles: intracellular Abeta and synaptic dysfunction. Neuron 39 (3), 409–421. [DOI] [PubMed] [Google Scholar]
- Polman C, Barkhof F, Sandberg-Wollheim M, et al. , 2005. Treatment with laquinimod reduces development of active MRI lesions in relapsing MS. Neurology 64 (6), 987–991. [DOI] [PubMed] [Google Scholar]
- Powell CM, Schoch S, Monteggia L, et al. , 2004. The presynaptic active zone protein RIM1alpha is critical for normal learning and memory. Neuron 42 (1), 143–153. [DOI] [PMC free article] [PubMed] [Google Scholar]
- Ruffini F, Rossi S, Bergamaschi A, et al. , 2013. Laquinimod prevents inflammation-induced synaptic alterations occurring in experimental autoimmune encephalomyelitis. Mult. Scler 19 (8), 1084–1094. [DOI] [PubMed] [Google Scholar]
- Schulze-Topphoff U, Shetty A, Varrin-Doyer M, et al. , 2012. Laquinimod, a quinoline-3-carboxamide, induces type II myeloid cells that modulate central nervous system autoimmunity. PLoS One 7 (3), e33797. [DOI] [PMC free article] [PubMed] [Google Scholar]
- Tabuchi K, Blundell J, Etherton MR, et al. , 2007. A neuroligin-3 mutation implicated in autism increases inhibitory synaptic transmission in mice. Science 318 (5847), 71–76. [DOI] [PMC free article] [PubMed] [Google Scholar]
- Terwel D, Lasrado R, Snauwaert J, et al. , 2005. Changed conformation of mutant tau-P301L underlies the moribund tauopathy, absent in progressive, nonlethal axonopathy of tau-4R/2N transgenic mice. J. Biol. Chem 280 (5), 3963–3973. [DOI] [PubMed] [Google Scholar]
- Thone J, Ellrichmann G, Seubert S, et al. , 2012. Modulation of autoimmune demyelination by laquinimod via induction of brain-derived neurotrophic factor. Am. J. Pathol 180 (1), 267–274. [DOI] [PubMed] [Google Scholar]
- Toubi E, Nussbaum S, Staun-Ram E, et al. , 2012. Laquinimod modulates B cells and their regulatory effects on T cells in multiple sclerosis. J. Neuroimmunol 251 (1–2), 45–54. [DOI] [PubMed] [Google Scholar]
- Vollmer TL, Sorensen PS, Selmaj K, et al. , 2014. A randomized placebo-controlled phase III trial of oral laquinimod for multiple sclerosis. J. Neurol 261 (4), 773–783. [DOI] [PubMed] [Google Scholar]
- Wegner C, Stadelmann C, Pfortner R, et al. , 2010. Laquinimod interferes with migratory capacity of T cells and reduces IL-17 levels, inflammatory demyelination and acute axonal damage in mice with experimental autoimmune encephalomyelitis. J. Neuroimmunol 227 (1–2), 133–143. [DOI] [PubMed] [Google Scholar]
- Yang JS, Xu LY, Xiao BG, Hedlund G, Link H, 2004. Laquinimod (ABR-215062) suppresses the development of experimental autoimmune encephalomyelitis, modulates the Th1/Th2 balance and induces the Th3 cytokine TGF-beta in Lewis rats. J. Neuroimmunol 156 (1–2), 3–9. [DOI] [PubMed] [Google Scholar]
- Zamvil SS, Steinman L, 1990. The T lymphocyte in experimental allergic encephalomyelitis. Annu. Rev. Immunol 8, 579–621. [DOI] [PubMed] [Google Scholar]
- Zheng WH, Bastianetto S, Mennicken F, Ma W, Kar S, 2002. Amyloid beta peptide induces tau phosphorylation and loss of cholinergic neurons in rat primary septal cultures. Neuroscience 115 (1), 201–211. [DOI] [PubMed] [Google Scholar]