

Abstract
Pulmonary SP‐D is a defence lectin promoting clearance of viral infections. SP‐D is recognized to bind the S protein of SARS‐CoV and enhance phagocytosis. Moreover, systemic SP‐D is widely used as a biomarker of alveolar integrity. We investigated the relation between plasma SP‐D, SARS‐type pneumonia and the SARS‐specific IgG response. Sixteen patients with SARS, 19 patients with community‐acquired pneumonia (CAP) (Streptococcus pneumonia) and 16 healthy control subjects were enrolled in the study. Plasma SP‐D and anti‐SARS‐CoV N protein IgG were measured using ELISA. SP‐D was significantly elevated in SARS‐type pneumonia [median (95% CI), 453 (379–963) ng/ml versus controls 218 (160–362) ng/ml, P < 0.05] like in patients with CAP. SP‐D significantly correlated with anti‐SARS‐CoV N protein IgG (r 2 = 0.5995, P = 0.02). The possible re‐emergence of SARS or SARS‐like infections suggests a need for minimal traumatic techniques for following the alveolar compartment, e.g. during testing of antivirals. We suggest that monitoring systemic SP‐D may be useful in monitoring the alveolar integrity in SARS‐type pneumonia. The significant correlation between plasma SP‐D and anti‐SARS‐CoV‐specific antibodies support the role for SP‐D in interlinking innate and adaptive immune pathways.
Introduction
Severe acute respiratory syndrome (SARS) coronavirus (SARS‐CoV) caused the first major pandemic of the new millennium starting in 2002 resulting in a major outbreak in 2003 [1, 2, 3, 4]. Great achievements in understanding and controlling SARS were undertaken during the first years after the outbreak. On this basis, the development of diagnostic tests, antivirals and vaccines were initiated. However, it is argued that there is a lack of screening tests for proven effective treatment regimes [4]. Moreover, the pathogenesis of SARS is not understood in detail. Innate immunity is the first line of defence against viral infections and also plays a critical role in SARS‐CoV clearance and immune evasion [5] warranting further study of innate immune mechanisms of the disease development.
Surfactant protein D (SP‐D) is a member of the collectin family of proteins participating in innate immune responses. This family consists of pulmonary collectins SP‐A and SP‐D as well as mannose‐binding lectin (MBL). Termed collectins, for collagen‐like lectin, the primary function of these proteins is anti‐microbial clearance through direct agglutination and opsonization, and modulation of inflammatory cells like alveolar macrophages, T cells and dendritic cells [6, 7, 8]. SP‐D is recognized to modulate the antigen presentation to specific major histocompatibility complex class II T‐cell hybridomas in vitro in a dose‐dependent fashion. However, the direction of the effect may be tissue specific [9, 10]. SP‐D is involved in the clearance of virus, such as influenza A virus [11, 12] and HIV [8]. Both MBL and SP‐D are further suggested to play a role in SARS. Genetic variation in mannan‐binding lectin (MBL) is associated with the disease, and in vitro infectivity is reduced by direct MBL–SARS‐CoV interaction [13]. SP‐D is previously suggested to aggregate the virus through direct interaction with the viral spike glycoprotein [14].
Severe acute respiratory syndrome lung injury is associated with diffuse alveolar damage and air space oedema and is accompanied by interstitial infiltrates of inflammatory cells, coagulation activation and fibrin deposition [5, 15, 16, 17]. Potential biomarkers for SARS thus include elevation of several endothelial, coagulation, fibrinolysis and inflammatory plasma markers [18, 19]. This is in line with features of acute lung injury (ALI) or acute respiratory distress syndrome (ARDS). Suggested biomarkers for ALI and ARDS further include SP‐D [20, 21, 22, 23]. During the course of infectious lung injury, increased circulatory SP‐D levels are demonstrated to correlate with human lung function [24, 25].
The primary function of the SARS‐CoV particle nucleocapsid (N) protein is to encapsidate the viral genome. The N protein also interferes with the host cell cycle in vitro and reduces the host interferon production. N protein is one of the predominantly expressed proteins at the early stage of SARS‐CoV infection and a strong antibody response is initiated against N protein by the host. Recombinantly expressed N protein has been used for the detection of the N‐specific antibodies in the host as part of diagnostic testing [26], but the detection of viral N protein may hold more promise for early diagnosis [27].
Here, we present details of our anti‐SARS IgG‐specific assay using recombinant N protein as capture antigen in ELISA. We address the possible role of systemic SP‐D as a biomarker in SARS‐associated lung injury, and the relation between systemic SP‐D and SARS‐CoV N protein‐specific antibodies.
Materials and methods
SARS patients. Sixteen patients, with the SARS type of pneumonia (7 male, 9 female, mean age 40.5 years, range 7–76 years), who were newly hospitalized and diagnosed with the modified WHO definition of SARS [28] in the medical intensive care unit of the Xuanwu Hospital of the Capital University of Medical Sciences, China between April and June 2003, were enrolled in the study. One SARS‐infected patient died. The case definition was presence of a fever (temperature >38 °C), a chest radiograph showing evidence of consolidation with or without respiratory symptoms and a history of exposure to an index patient suspected to have SARS or direct contact with a person who became ill after exposure to an index patient.
Unilateral or bilateral involvement of lung opacities on every radiograph was noted. Maximal chest radiographs were scored according to the per cent of lung involvement in each lung (0 = normal, 1 = 10%, 2 = 20%, 10 = 100% involvement). Summation of scores from both lungs provided the radiographical score for a particular chest radiograph for each patient as described previously [29, 30]. Demographic factors: age, sex, nursing home resident, coexisting illnesses, findings on physical examination, altered mental status, respiratory rate, systolic blood pressure, temperature pulse and laboratory findings were recorded.
All patients with SARS were reported and confirmed using PCR and SARS‐CoV testing as described by Wu et al. [31] in the Chinese Center for Disease Control and Prevention, Institute for Viral Disease Control and Prevention, Beijing, using PCR and an ELISA test kit from the Center for Disease Control and Prevention, Atlanta, GA, USA. The ELISA helped assess the level of anti‐SARS coronavirus‐specific IgG antibody (cut‐off value >0.313). The diagnosis was further confirmed using the ELISA assay for plasma SARS‐CoV protein N IgG measurement (described below).
The initial investigations further included a complete blood count (with a differential count), clotting profile [18, 19] and serum biochemical measurements. All patients received oxygen supplementation. One patient required mechanical ventilation. The study was approved by appropriate institutional ethical review board and the protocol was consistent with the principles of the Declaration of Helsinki.
Patients with community‐acquired pneumonia (Streptococcus pneumonia). Nineteen patients with community‐acquired pneumonia (CAP) (Streptococcus pneumonia) (15 male, 4 female, mean age 50.5 years, range 14–90 years) were included in this study. The patients were presented with a new and persistent initial radiographic manifestation and also associated with at least one of the following: purulent tracheal secretions, body temperature >38.3 °C and leucocytosis (>10 000 leucocytes per microlitre). The maximal chest radiographic scores were also calculated. Nasoparyngeal aspirate or minibronchoalveolar lavage sampling and processing of microbiological specimens were performed to confirm the diagnosis of S. pneumonia. All patients received oxygen supplementation. One patient required mechanical ventilation. The patients had no history of contact with SARS patients.
Healthy volunteer controls. Sixteen healthy volunteer controls (8 male, 8 female, mean age 44.7 years, range 22–61 years) were included in the study. Study participants did not have major chronic medical illnesses and were not taking any medication known to influence this experiment. No clinically significant abnormalities were found during physical examination; participants were not anaemic and had normal liver and kidney function. They did not have any history of contact with SARS patients.
Blood sampling. Blood was collected into 110 mmol/l trisodium citrate (ratio 1:10). After centrifugation at 500 g for 10 min, platelet‐poor plasma was immediately deactivated (56 °C, 30 min) and stored at −70 °C.
Expression and purification of recombinant SARS‐CoV N protein. Ni‐NTA agarose and Escherichia coli strain M15‐competent cells were purchased from Qiagen GmbH (Hilden, Germany). p GEM2‐T Easy Vector Systems was purchased from Promega (Madison, WI, USA). The PQ E30 expression vector was purchased from Qiagen GmbH. The restriction endonucleases (Pst I, Bam H I) and T4 DNA ligase were purchased from Ta KaRa Shuzo Co. (Kyoto, Japan). All other reagents were of research grade or better.
Coronavirus isolated from a patient with SARS‐CoV pneumonia in Beijing was inoculated into Vero cells. After 48 h, the cell culture supernatant was centrifuged at 12,000 g for 15 min at 4 °C. Viral RNA was extracted with TRIzol reagent (GIBCO BRL, Invitrogen, Gaitherburg, MD, USA). Primers were designed for RT‐PCR amplification of N gene using GenBank AY274119 SARS. Primers were designed to separate N1 (681 bp) and N2 (576 bp) segments and include restriction sites; coroN‐1‐1, 5′‐gc gga tcc ATG TCT GAT AAT GGA CCC CAA T‐3′ (BAM H I); coroN‐1‐2, 5′‐gc ctg cag cta TCT GTC TAG CAG CAA TAG C‐3′ (Pst I); coroN‐2‐1, 5′‐gc gga tcc CTT GAG AGC AAA GTT TCT GGT‐3′ (Bam H I); coroN‐2‐2, 5′‐gc aag ctt cta TGC CTG AGT TGA ATC AGC AG‐3′ (Hind III). N1 and N2 segments cover the sequence of the full length molecule.
RNA was amplified using RT‐PCR and ligated into the p GEM‐2 T Easy Vector (cloning vector), and then transformed into E. coli strain M15 cells using standard molecular biology techniques. The expected 681‐ and 576‐bp fragments encoding partial segments of SARS‐CoV N protein were isolated using gel electrophoresis and were subcloned into the PQ E230 expression vector adding a (His)6 tag to the recombinant peptides The resulting E. coli culture supernatant was mixed with Ni‐NTA agarose by shaking for 1 h at room temperature and loaded into an empty column. The column was washed and eluted with a gradient of imidazole. The eluted fractions were analysed using SDS‐PAGE.
Plasma SARS‐CoV protein N IgG measurement. Anti‐SARS‐CoV N protein IgG was quantified using ELISA measurement. Briefly, microtiter wells were coated with 1:1 recombinant SARS coronavirus N1 and N2 protein mixture by overnight incubation at 4 °C at 0.4 mg/ml in 0.05 m bicarbonate buffer, pH 9.5. This incubation and all the following steps were carried out in a volume of 100 μl per well unless otherwise stated. Washes and incubations were carried out with Tris‐buffered saline, 0.05% (v/v) Tween 20. The coated plates were washed and incubated with 200 μl of 10% BSA buffer for 30 min at 37 °C. Then the plates were washed again and incubated with dilutions of samples [1:100 dilute by 5% BSA Tris‐buffered saline, 0.05% (v/v) Tween 20] for 30 min at 37 °C. Then the plates were washed again and incubated with 1:200 diluted horseradish peroxidase‐labelled anti‐human IgG antibody for 30 min at 37 °C. After the final wash, the bound enzyme was estimated by addition of 3,3′,5,5′‐tetramethylbenzidine (TMB, Zymed, CA, USA) substrate solution. The colour reaction was stopped after 15‐min incubation in the dark by the addition of 50 μl of 1 m H2SO4. The absorbance was read at 450 nm using a multichannel spectrophotometer. Each sample was tested in duplicate. Negative samples were the normal controls. A sample was considered positive if its adjusted optical density (OD) value (OD of test − OD of control) exceeds the mean +3 SD of the normal controls and its titer is >1:400. The cut‐off value for a positive sample corresponded to the lowest measurement of 0.219.
Plasma SP‐D measurement. SP‐D in plasma was quantified as previously described [32] using ELISA. Briefly, microtiter wells were coated with F(ab′)2 anti‐human SP‐D IgG (K477) at 4 °C. Washed and blocked plates were incubated overnight at 4 °C with dilutions of plasma, calibrator and control samples. Primary antibodies were 0.5 μg/ml of biotinylated monoclonal antibody anti‐human SP‐D (Hyb 246–4). Detection was carried out using horseradish peroxidase‐conjugated streptavidin (43‐4323; Zymed, South San Francisco, CA, USA) o‐phenylenediamine (Kem‐En‐Tec, Copenhagen, Denmark) in citrate–phosphate buffer, pH 5, containing 0.014% H2O2.
Statistical analysis. Odds ratios were calculated for comparison of characteristics between SARS patients and patient with other CAP. One‐way analysis of variance (ANOVA) and Tukey–Kramer Multiple Comparisons Test were employed for comparison of plasma SP‐D between controls, patients with SARS and patients with other CAP (S. pneumonia). Linear regression was used to assess the relationship for the increased levels of plasma SP‐D and anti‐SARS‐CoV N protein IgG in SARS patients. All analyses were performed using GraphPad, Prism and Instat, software, version 4.00, San Diego, CA, USA. A value of P < 0.05 was considered statistically significant.
Results
Expression of SARS‐CoV N proteins
(His)6‐tagged recombinant N proteins of SARS‐CoV were expressed in E. coli and purified from the bacterial culture supernatant. Initial studies had shown that the expression of the full‐length N molecule resulted in the formation of products with very low solubility. Instead, N1 and N2 proteins, together covering the full‐length molecule, were produced. The expressed N proteins were analysed using SDS PAGE, showing a 31‐kDa band for the N1 protein and a 27‐kDa band for the N2 protein. The majority of both N1 and N2 target proteins was found in the culture supernatant (Fig. 1). The purity of the N proteins was examined using SDS PAGE and single bands corresponding to the two N proteins were observed after (His)6 tag purification (Fig. 2).
Figure 1.

Solubility of recombinant SARS‐CoV N proteins expressed in Escherichia coli. SDS‐PAGE was performed under reducing conditions and Comassie Brilliant Blue was used for detection. Lanes 1–3 contain induced E. coli M15 expression vector N1 and lanes 4–6 contain induced expression vector N2. M = molecular weight marker; 1 = N1 crude extract; 2 = N1 supernatant; 3 = N1 pellet; 4 = N2 crude extract; 5 = N2 supernatant; 6 = N2 pellet.
Figure 2.
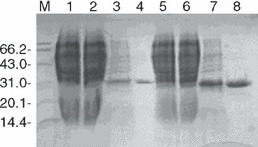
Purity of expressed SARS‐CoV N proteins. SDS‐PAGE was performed under reducing conditions and Comassie Brilliant Blue was used for detection. M = molecular weight marker; 1 = total protein from E. coli M15; 2 = total protein from Escherichia coli M15 transformed with expression vector N1, uninduced; 3 = E. coli M15 transformed with expression plasmid N1, induced; 4 = (His)6 tag‐purified N1 protein; 5 = total protein from E. coli M15; 6 = total protein from E. coli M15 transformed with expression plasmid N2, uninduced; 7 = induced E. coli M15 transformed with expression plasmid N2; 8 = (His)6 tag‐purified N2 protein.
Recombinant N protein‐based assays for indirect ELISA detection of anti‐SARS‐CoV protein N IgG
Confirmation of SARS‐CoV infection was performed by assessing the level of anti‐SARS‐CoV N protein IgG. The assay was based on ELISA technology with recombinant N1 and N2 proteins coupled to microtiter plates and following incubation with patient or control plasma. Anti‐SARS‐CoV N protein IgG levels were [median (95% CI)] 0.97 (0.81–1.58) versus 0.05 (0.04–0.06) and 0.05 (0.04–0.07) units (OD450) in patients with SARS‐type pneumonia, patients with CAP (S. pneumonia) and in controls respectively (Fig. 3). Detection was specific to patients already diagnosed for SARS and the background of the assay corresponded to the readings from the controls. No false‐positive detection was observed. The anti‐SARS‐CoV N protein IgG titer approximated 1:100. Validation of the assay was performed using a commercial ELISA kit (BEL diagnostic kit). It was confirmed that, these two diagnostic tests were in substantial agreement using kappa statistics (data not shown).
Figure 3.

Anti‐SARS‐CoV N protein IgG levels. Anti‐SARS‐CoV N protein IgG was quantified using ELISA. Box plots represent the distribution of anti‐SARS coronavirus nucleocapsid (N) protein‐specific IgG levels found in SARS patients, patients with CAP (Streptococcus pneumonia) and healthy controls (the box plots show the smallest observation, lower quartile, median, upper quartile and largest observation).
Characteristics of the patients with SARS‐type pneumonia and patients with CAP (S. pneumonia).
The severity of the SARS disease compared with CAP (S. pneumonia) was estimated by clinical and paraclinical measurements describing respiratory distress syndrome and also typical of SARS [28]. The chest radiograph typically showed patchy shadowing, which might become confluent and more generalized. The measured characteristics for SARS and CAP (S. pneumonia) patients are summarized in Table 1 and besides chest radiography measurements of thrombocytopenia and leucocytosis are also included. The manifestation of SARS did not allow ready distinction from CAP (S. pneumonia).
Table 1.
Characteristics of SARS patients versus patients with Streptococcus pneumonia CAP [18].
| Patient summaries | ||||
|---|---|---|---|---|
| SARS | S. pneumonia | Odds ratio (95% CI) | P ‐value | |
| Mean age | 40.5 | 50.5 | 1.25 (0.26–6.07) | 0.78 |
| Male gender | 7 | 15 | 0.21 (0.05–0.91) | 0.07 |
| Fever (%) | 15/16 | 15/19 | 4.00 (0.40–40) | 0.45 |
| Pulmonary infiltrate involvement | 16/16 | 16/19 | 7.45 (0.36–156) | 0.26 |
| Bilateral pulmonary infiltrate involvement | 9/16 | 9/19 | 1.61 (0.41–6.2) | 0.73 |
| Chest radiographic score | 5.6 ± 2.9 | 5.4 ± 4.1 | 16.7 (0.75–371) | 0.90 |
| Thrombocytopenia (platelet count (<150,000 per mm3) | 5/16 | 4/19 | 1.71 (0.37–7.86) | 0.76 |
| Leucocytosis (>10,000 per mm3) | 7/16 | 8/19 | 1.07 (0.26–4.49) | 0.92 |
| Death in ICU (%) | 1/16 | 1/19 | 1.20 (0.07–20.9) | 0.90 |
Elevated plasma levels of the alveolar injury bio‐marker, SP‐D, in SARS patients
Analysis of variance (ANOVA) showed that the plasma SP‐D levels were increased in SARS patients compared with those found in healthy controls [median (95% CI)], 453 (379–963) ng/ml versus 218 (160–362) ng/ml respectively (P = 0.026). The plasma SP‐D levels did not differ significantly between SARS patients and patients with CAP (S. pneumonia): 453 (379–963) ng/ml versus 302 (94–459) ng/ml respectively (P = 0.360) (Fig. 4).
Figure 4.

Plasma levels of SP‐D. SP‐D in plasma was quantified using ELISA. Box plots represent the distribution of plasma SP‐D found in SARS patients, patients with CAP (Streptococcus pneumonia) and healthy controls (the box plots show the smallest observation, lower quartile, median, upper quartile and largest observation).
Plasma SP‐D positively correlated with anti‐SARS‐CoV N protein IgG
A significant correlation between plasma SP‐D and anti‐SARS‐CoV N protein IgG measured in SARS patients was observed using linear regression (r 2 = 0.5995, P = 0.02) (Fig. 5). SP‐D did not correlate significantly with any other measured disease marker (data not shown).
Figure 5.

Direct correlation between elevated plasma SP‐D and anti‐SARS‐CoV N protein IgG. ELISA was used to quantify anti‐SARS‐CoV N protein IgG and plasma SP‐D. The solid line and the dotted lines indicate the regression line and the 95% confidence intervals respectively.
Discussion
The clinical presentation of SARS lung injury is reported to resemble that of other aetiologies of CAP [33]. This was further confirmed by the measures of lung injury reported in the present study showing no significant differences in pulmonary infiltrate, chest radiographic score, thrombocytopenia and leucocytopenia between SARS patients and the bacterial‐type pneumonia patients.
Significant increments in systemic SP‐D are reported to take place during the course of pneumonia [32], a notion which is supported by an animal model [34]. Because of the general similarities between SARS and other types of pneumonia, we likewise investigated systemic SP‐D as a candidate marker for SARS alveolar integrity.
While the amount of data/patients presented here is limited, the data are the first to demonstrate elevation of plasma SP‐D levels in SARS patients and a clear direct correlation between SP‐D concentration and SARS‐CoV‐specific antibodies.
As the lungs constitute the major source of SP‐D production, the significantly high levels of plasma SP‐D in SARS are considered to be due to the leakage of pulmonary proteins into the circulation [35, 36, 37]. Pulmonary leakage may cause a rise in serum SPD, even in the presence of decreased lung production, an observation that is supported by mouse experiments [36, 38]. Systemic SP‐D is previously reported to increase within the first 5 days after hospitalization of CAP and afterwards slowly decline with resolution of infection [32]. The rise in systemic SP‐D is further associated with a greater risk of death and fewer organ failure‐free days in patients with ALI/ARDS [20].
In the present study, an indirect ELISA was developed using two fragments of SARS‐CoV N protein. The results indicated that the expressed N protein fragments reacted with antibodies present in SARS patient plasma and not with plasma from patients with S. pneumonia infection or normal controls. N protein was chosen because it is one of the predominantly expressed proteins in SARS‐CoV infection, against which a strong antibody response is initiated by the host [39]. Furthermore, a comparative study has shown that the sensitivity of recombinant N protein‐based IgG ELISA was significantly higher than that of recombinant S protein IgG ELISA despite that S‐protein is a surface molecule [40]. The limitation to the use of such an assay includes that SARS‐N protein shares some homology with N proteins of other human CoV (HCoV) and anti‐sera against SARS‐CoV may be cross‐reactive with other HCoV [41, 42]. Moreover, indirect ELISA is not adequate for the early diagnosis of SARS, because the median time to seroconversion in SARS patients is 17–20 days after the onset of symptoms [43].
The observed SP‐D/anti‐SARS‐CoV N IgG correlation may represent a convergence of the expansion of the humoral immune response and the increasing alveolar permeability after SARS‐CoV infection. Another simple explanation includes SP‐D augmentation of antigen presentation by dendritic cells as previously demonstrated for bone marrow‐derived dendritic cells in vitro [9]. By contrast, inhibitory effect of SP‐D on antigen presentation by lung antigen‐presenting cells was found in a similar study [10], indicating that the role of SP‐D antigen presentation and thus B‐cell activation may be highly complex and the relation between the antibody response and SP‐D levels in the lungs or in the circulation is difficult to predict from these models.
The present data confirm that there is a large variation in the SARS‐specific antibody response in newly diagnosed patients. It is previously demonstrated that plasma levels of IgG rise in a biphasic fashion from the time of seroconversion and to approximately 80 days from onset of symptoms. Patients who died appeared with low Ig responses, which were not sufficient for the determination of seroconversion using indirect ELISA in the early phase of infection. SARS‐specific Ig measurement was therefore suggested as a prognostic marker [43]. The measured IgG level in the patient who died in the present study was also low. The optical density at 450 nm was 0.282 and 24% of the mean. The measured variation in IgG levels in this study may partly represent the time elapsed since infection and may partly represent the individual capability of mounting a humoral immune response.
Despite an extensive literature reporting on SARS treatments, it is argued that it has not been possible to determine whether treatments benefited patients during the SARS outbreak [44] and serological markers for the management of SARS may be highly desirable in possible future outbreaks.
The increase in systemic SP‐D implies that SP‐D measurements may help monitoring alveolar injury during the course of SARS and suggests that measurements of SP‐D may help treatment decisions. We hypothesize that a combination of low and stable anti‐SARS‐CoV N IgG and increasing plasma SP‐D in early SARS may predict a worse clinical outcome. By contrast, a declining systemic SP‐D may be associated with a better clinical outcome as recently demonstrated for chronic obstructive pulmonary disease [37].
Limitations to this study included the small sample size, increasing the risk of false‐negative associations. Secondly, the disease stage of patients in the study was not classified. Thus, these data cannot be applied to subgroups of patients with mild, moderate or severe disease. Thirdly, we did not measure SP‐D in bronchoalveolar samples and as such it is uncertain why serum SPD levels were increased. Although systemic SP‐D was increased in SARS patients and correlated with SARS‐specific antibodies, SP‐D failed to correlate with other measures of SARS disease, including leucocytopenia, thrombocytosis or chest radiographic score. One possibility is that these variables are not causally related. However, potential associations may be weak and a larger study with a wider variation in scores among study participants are needed to investigate these relationships in further detail. Some measures of disease activity, e.g. leucocytopenia and thrombocytosis, may reflect aspects of disease development which are not directly associated with alveolar damage and are not expected to follow the development of systemic SP‐D. In this regard, previous studies of CAP demonstrated that there is no correlation between measures of SP‐D and CRP or leucocyte counts in patients with pneumonia [32].
In summary, SP‐D is a well‐known biomarker for alveolar damage. In line with this, the present study demonstrated increased plasma SP‐D in SARS patients. The present results warrant further studies to consolidate that measurements of systemic SP‐D may assess the progression of SARS‐associated lung injury providing a means for monitoring alveolar integrity, e.g. in trials of antiviral therapy during possible re‐emergence. Direct correlation between systemic SP‐D and anti‐SARS‐CoV‐specific antibodies further proposes a role for SP‐D in interlinking innate and adaptive immune pathways in patients with SARS.
Acknowledgment
This work was supported in part by The Dutch Thrombosis Foundation, Natural Science Foundation of Shandong, National Natural Science Foundation of China, the Danish Medical Research Council, the Novo‐Nordic Foundation, The Lundbeck Foundation, Fonden til Lægevidenskabens Fremme, the Danish Heart Foundation, The Benzon Foundation, The Augustinus Foundation and the Becket Foundation.
Y. P. Wu, Z. H. Liu, R. Wei, S. D. Pan, N. Y. Mao, W. B. Xu and G. L. Sorensen contributed equally to this study.
References
- 1. Drosten C, Gunther S, Preiser W et al. Identification of a novel coronavirus in patients with severe acute respiratory syndrome. N Engl J Med 2003;348:1967–76. [DOI] [PubMed] [Google Scholar]
- 2. Ksiazek TG, Erdman D, Goldsmith CS et al. A novel coronavirus associated with severe acute respiratory syndrome. N Engl J Med 2003;348:1953–66. [DOI] [PubMed] [Google Scholar]
- 3. Peiris JS, Lai ST, Poon LL et al. Coronavirus as a possible cause of severe acute respiratory syndrome. Lancet 2003;361:1319–25. [DOI] [PMC free article] [PubMed] [Google Scholar]
- 4. Cheng VC, Lau SK, Woo PC, Yuen KY. Severe acute respiratory syndrome coronavirus as an agent of emerging and reemerging infection. Clin Microbiol Rev 2007;20:660–94. [DOI] [PMC free article] [PubMed] [Google Scholar]
- 5. Chen J, Subbarao K. The Immunobiology of SARS*. Annu Rev Immunol 2007;25:443–72. [DOI] [PubMed] [Google Scholar]
- 6. Holmskov U, Thiel S, Jensenius JC. Collections and ficolins: humoral lectins of the innate immune defense. Annu Rev Immunol 2003;21:547–78. [DOI] [PubMed] [Google Scholar]
- 7. Wright JR. Immunoregulatory functions of surfactant proteins. Nat Rev Immunol 2005;5:58–68. [DOI] [PubMed] [Google Scholar]
- 8. Meschi J, Crouch EC, Skolnik P et al. Surfactant protein D binds to human immunodeficiency virus (HIV) envelope protein gp120 and inhibits HIV replication. J Gen Virol 2005;86:3097–107. [DOI] [PubMed] [Google Scholar]
- 9. Brinker KG, Martin E, Borron P et al. Surfactant protein D enhances bacterial antigen presentation by bone marrow‐derived dendritic cells. Am J Physiol Lung Cell Mol Physiol 2001;281:L1453–63. [DOI] [PubMed] [Google Scholar]
- 10. Hansen S, Lo B, Evans K, Neophytou P, Holmskov U, Wright JR. Surfactant protein D augments bacterial association but attenuates major histocompatibility complex class II presentation of bacterial antigens. Am J Respir Cell Mol Biol 2007;36:94–102. [DOI] [PMC free article] [PubMed] [Google Scholar]
- 11. Hartshorn KL, Crouch EC, White MR et al. Evidence for a protective role of pulmonary surfactant protein D (SP‐D) against influenza A viruses. J Clin Invest 1994;94:311–9. [DOI] [PMC free article] [PubMed] [Google Scholar]
- 12. LeVine AM, Whitsett JA, Hartshorn KL, Crouch EC, Korfhagen TR. Surfactant protein D enhances clearance of influenza A virus from the lung in vivo. J Immunol 2001;167:5868–73. [DOI] [PubMed] [Google Scholar]
- 13. Ip WK, Chan KH, Law HK et al. Mannose‐binding lectin in severe acute respiratory syndrome coronavirus infection. J Infect Dis 2005;15:191. [DOI] [PMC free article] [PubMed] [Google Scholar]
- 14. Leth‐Larsen R, Zhong F, Chow VT, Holmskov U, Lu J. The SARS coronavirus spike glycoprotein is selectively recognized by lung surfactant protein D and activates macrophages. Immunobiology 2007;212:201–11. [DOI] [PMC free article] [PubMed] [Google Scholar]
- 15. Lee N, Hui D, Wu A et al. A major outbreak of severe acute respiratory syndrome in Hong Kong. N Engl J Med 2003;348:1986–94. [DOI] [PubMed] [Google Scholar]
- 16. Wu YP, Wei R, De Groot PG. SARS in Hong Kong. N Engl J Med 2003;349:708–9. [DOI] [PubMed] [Google Scholar]
- 17. Ng KH, Wu AK, Cheng VC et al. Pulmonary artery thrombosis in a patient with severe acute respiratory syndrome. Postgrad Med J 2005;81:e3. [DOI] [PMC free article] [PubMed] [Google Scholar]
- 18. Wu YP, Wei R, Liu ZH et al. Analysis of thrombotic factors in severe acute respiratory syndrome (SARS) patients. Thromb Haemost 2006;96:100–1. [DOI] [PubMed] [Google Scholar]
- 19. Liu ZH, Wei R, Wu YP et al. Elevated plasma tissue‐type plasminogen activator (t‐PA) and soluble thrombomodulin in patients suffering from severe acute respiratory syndrome (SARS) as a possible index for prognosis and treatment strategy. Biomed Environ Sci 2005;18:260–4. [PubMed] [Google Scholar]
- 20. Eisner MD, Parsons P, Matthay MA, Ware L, Greene K. Plasma surfactant protein levels and clinical outcomes in patients with acute lung injury. Thorax 2003;58:983–8. [DOI] [PMC free article] [PubMed] [Google Scholar]
- 21. Sorensen GL, Husby S, Holmskov U. Surfactant protein A and surfactant protein D variation in pulmonary disease. Immunobiology 2007;212:381–416. [DOI] [PubMed] [Google Scholar]
- 22. Greene KE, Wright JR, Steinberg KP et al. Serial changes in surfactant‐associated proteins in lung and serum before and after onset of ARDS. Am J Respir Crit Care Med 1999;160:1843–50. [DOI] [PubMed] [Google Scholar]
- 23. Endo S, Sato N, Nakae H et al. Surfactant protein A and D (SP‐A, AP‐D) levels in patients with septic ARDS. Res Commun Mol Pathol Pharmacol 2002;111:245–51. [PubMed] [Google Scholar]
- 24. Haczku A, Atochina EN, Tomer Y et al. Aspergillus fumigatus‐induced allergic airway inflammation alters surfactant homeostasis and lung function in BALB/c mice. Am J Respir Cell Mol Biol 2001;25:45–50. [DOI] [PubMed] [Google Scholar]
- 25. Krane M, Griese M. Surfactant protein D in serum from patients with allergic bronchopulmonary aspergillosis. Eur Respir J 2003;22:592–5. [DOI] [PubMed] [Google Scholar]
- 26. Surjit M, Lal SK. The SARS‐CoV nucleocapsid protein: a protein with multifarious activities. Infect Genet Evol 2008;8:397–405. [DOI] [PMC free article] [PubMed] [Google Scholar]
- 27. Fujimoto K, Chan KH, Takeda K, Lo KF, Leung RH, Okamoto T. Sensitive and specific enzyme‐linked immunosorbent assay using chemiluminescence for detection of severe acute respiratory syndrome viral infection. J Clin Microbiol 2008;46:302–10. [DOI] [PMC free article] [PubMed] [Google Scholar]
- 28. World Health Organization (WHO) . Severe acute respiratory syndrome (SARS). Wkly Epidemiol Rec 2003;78:81–3. [PubMed] [Google Scholar]
- 29. Ho PL, Chau PH, Yip PS et al. A prediction rule for clinical diagnosis of severe acute respiratory syndrome. Eur Respir J 2005;26:474–9. [DOI] [PubMed] [Google Scholar]
- 30. Ooi CG, Khong PL, Lam B et al. Severe acute respiratory syndrome: relationship between radiologic and clinical parameters. Radiology 2003;229:492–9. [DOI] [PubMed] [Google Scholar]
- 31. Wu HS, Chiu SC, Tseng TC et al. Serologic and molecular biologic methods for SARS‐associated coronavirus infection, Taiwan. Emerg Infect Dis 2004;10:304–10. [DOI] [PMC free article] [PubMed] [Google Scholar]
- 32. Leth‐Larsen R, Nordenbaek C, Tornoe I et al. Surfactant protein D (SP‐D) serum levels in patients with community‐acquired pneumonia. Clin Immunol 2003;108:29–37. [DOI] [PubMed] [Google Scholar]
- 33. Muller MP, Tomlinson G, Marrie TJ et al. Can routine laboratory tests discriminate between severe acute respiratory syndrome and other causes of community‐acquired pneumonia? Clin Infect Dis 2005;40:1079–86. [DOI] [PMC free article] [PubMed] [Google Scholar]
- 34. Hobo S, Niwa H, Anzai T. Evaluation of serum amyloid A and surfactant protein D in sera for identification of the clinical condition of horses with bacterial pneumonia. J Vet Med Sci 2007;69:827–30. [DOI] [PubMed] [Google Scholar]
- 35. Hartl D, Griese M. Surfactant protein D in human lung diseases. Eur J Clin Invest 2006;36:423–35. [DOI] [PubMed] [Google Scholar]
- 36. Fujita M, Shannon JM, Ouchi H, Voelker DR, Nakanishi Y, Mason RJ. Serum surfactant protein D is increased in acute and chronic inflammation in mice. Cytokine 2005;31:25–33. [DOI] [PubMed] [Google Scholar]
- 37. Sin DD, Man SF, Marciniuk DD et al. The effects of fluticasone with or without salmeterol on systemic biomarkers of inflammation in chronic obstructive pulmonary disease. Am J Respir Crit Care Med 2008;177:1207–14. [DOI] [PubMed] [Google Scholar]
- 38. Cheng IW, Ware LB, Greene KE, Nuckton TJ, Eisner MD, Matthay MA. Prognostic value of surfactant proteins A and D in patients with acute lung injury. Crit Care Med 2003;31:20–7. [DOI] [PubMed] [Google Scholar]
- 39. Che XY, Hao W, Wang Y et al. Nucleocapsid protein as early diagnostic marker for SARS. Emerg Infect Dis 2004;10:1947–9. [DOI] [PMC free article] [PubMed] [Google Scholar]
- 40. Woo PC, Lau SK, Wong BH et al. Differential sensitivities of severe acute respiratory syndrome (SARS) coronavirus spike polypeptide enzyme‐linked immunosorbent assay (ELISA) and SARS coronavirus nucleocapsid protein ELISA for serodiagnosis of SARS coronavirus pneumonia. J Clin Microbiol 2005;43:3054–8. [DOI] [PMC free article] [PubMed] [Google Scholar]
- 41. Woo PC, Lau SK, Wong BH et al. False‐positive results in a recombinant severe acute respiratory syndrome‐associated coronavirus (SARS‐CoV) nucleocapsid enzyme‐linked immunosorbent assay due to HCoV‐OC43 and HCoV‐229E rectified by Western blotting with recombinant SARS‐CoV spike polypeptide. J Clin Microbiol 2004;42:5885–8. [DOI] [PMC free article] [PubMed] [Google Scholar] [Retracted]
- 42. Sun ZF, Meng XJ. Antigenic cross‐reactivity between the nucleocapsid protein of severe acute respiratory syndrome (SARS) coronavirus and polyclonal antisera of antigenic group I animal coronaviruses: implication for SARS diagnosis. J Clin Microbiol 2004;42:2351–2. [DOI] [PMC free article] [PubMed] [Google Scholar]
- 43. Woo PC, Lau SK, Wong BH et al. Longitudinal profile of immunoglobulin G (IgG), IgM, and IgA antibodies against the severe acute respiratory syndrome (SARS) coronavirus nucleocapsid protein in patients with pneumonia due to the SARS coronavirus. Clin Diagn Lab Immunol 2004;11:665–8. [DOI] [PMC free article] [PubMed] [Google Scholar]
- 44. Stockman LJ, Bellamy R, Garner P. SARS: systematic review of treatment effects. PLoS Med 2006;3:e343. [DOI] [PMC free article] [PubMed] [Google Scholar]