

Abstract
Rapid and simultaneous detection of multiple potential pathogens by portable devices can facilitate early diagnosis of infectious diseases, and allow for rapid and effective implementation of disease prevention and treatment measures. The development of a ZnO nanorod integrated microdevice as a multiplex immunofluorescence platform for highly sensitive and selective detection of avian influenza virus (AIV) is described. The 3D morphology and unique optical property of the ZnO nanorods boost the detection limit of the H5N2 AIV to as low as 3.6 × 10³ EID50 mL−1 (EID50: 50% embryo infectious dose), which is ≈22 times more sensitive than conventional enzyme‐linked immunosorbent assay. The entire virus capture and detection process could be completed within 1.5 h with excellent selectivity. Moreover, this microfluidic biosensor is capable of detecting multiple viruses simultaneously by spatial encoding of capture antibodies. One prominent feature of the device is that the captured H5N2 AIV can be released by simply dissolving ZnO nanorods under slightly acidic environment for subsequent off‐chip analyses. As a whole, this platform provides a powerful tool for rapid detection of multiple pathogens, which may extent to the other fields for low‐cost and convenient biomarker detection.
Keywords: avian influenza virus, fluorescence detection, infectious pathogen, microfluidic chip, multiplexed detection, ZnO nanorods
A nanostructured ultrasensitive immunoassay platform is reported by integrating zinc oxide nanorods into a microfluidic chip for infectious pathogen detection. This platform can detect avian influenza virus with great specificity and ≈22 times better sensitivity compared with conventional enzyme‐linked immunosorbent assay method. By using spatial encoding, it shows the potential for multiplexed pathogen detection in complex samples.

1. Introduction
Emerging viral infectious pathogens, for example, human immunodeficiency virus (HIV), Ebola virus, severe acute respiratory syndrome (SARS) virus, avian influenza virus (AIV), and Zika virus have threatened human health, caused catastrophes on economic development, and became one of the major public health concerns.1, 2, 3 Among them, the AIV, a lipid enveloped RNA virus of type A avian influenza virus in the orthomyxoviridae family, can cause acute respiratory infection in birds.4, 5 The highly pathogenic (HP) H5N1 AIV has caused deadly outbreaks of domestic poultry in China, Southeast Asian, Middle East, and European countries since early 2000. In the United States, an HP H5N2 AIV epidemic resulted in depopulations of more than 30.7 million birds in 15 affected states between 2014 and 2015.6 Moreover, pandemic human influenza is at high risk due to the continuing mutations of the avian origin AIVs.5, 7 Therefore, it is critically urgent to develop fast and sensitive methods to closely monitor the presence of the AIV in vulnerable host population and quickly detect it during the early stage of the infection,3, 5 so that immediate prevention and control procedures can be adopted to prevent virus spread and disease outbreaks. In this work, AIV was used as the diagnostic target, although the platform itself is applicable to all pathogens with available antibodies.
Currently, many methods have been developed to detect the AIV, including the traditional virus isolation method in chicken embryos, immunological methods such as enzyme‐linked immunosorbent assay (ELISA), molecular assays using reverse transcription polymerase chain reaction (RT‐PCR) and its real time version, and more recent nanoparticles based biosensors with some signal amplification strategies.2, 7, 8, 9, 10, 11, 12, 13 The existing virus detection approaches face some notable challenges, for example, poor sensitivity and specificity, time‐consuming and complicated procedures, and sophisticated sample pretreatment. These drawbacks limit the accessibility and usability of the quantitative diagnostics. A viable solution to these problems is to develop a rapid, robust, selective, and sensitive system that does not depend on signal amplification and yet sensitive enough for routine AIV screening.
In the past decades, microfluidic devices have demonstrated their potentials in integrating multiplexed functional units into single devices and enabling miniaturization of whole analysis systems, which has become attractive tools for many biological and biomedical applications.14, 15, 16, 17, 18 They have many benefits such as system integration,18, 19, 20 portability,21, 22, 23, 24 low sample consumption and waste generation,20, 25 reagents and time saving,2, 18, 26 fast mass transfer, and convenience and suitability for portable applications.14, 21, 22, 23, 27 Microfluidic devices can be employed in the detection of pathogens for practical samples and medical diagnosis.2, 5, 28, 29 Meanwhile, multiplexed detection is feasible in microfluidic chips with spatial encoding technique.23, 29, 30 Although there are some microfluidic‐based sensing platforms for the detection of pathogens.31, 32 However, most of the biosensors are focused on the single detection in microfluidic chip.5, 22 Some microfluidic‐based sensing platforms for pathogens are using the signal amplification methods in order to obtain quantitative performance such as microfluidics‐based PCR platform,2 loop‐mediated isothermal amplification (LAMP),33 and rolling circle amplification (RCA).34 In general, these methods require sophisticated fabrication process, complex operations, circular DNA template, and specifically designed primer pairs or enzymes. Therefore, the highly sensitive and multiplex pathogen detection in the microfluidic chips without complex signal amplification is still much needed.
Rough 3D nanostructured surfaces have garnered much interest for microfluidics and biosensor development.28, 30, 31, 32, 33, 34, 35, 36 For the same apparent surface area, the 3D nanostructured surfaces provide more binding sites for capture probes and targets, generate different surface properties (e.g., superhydrophobicity) from the flat surface,37 enhance detection signals, and supply topological and morphological features to encourage the interaction between device surface and nanoscale objects, such as proteins, nucleic acid molecules, and the microfilament/pseudopodium of cells.30, 38, 39, 40, 41, 42, 43, 44 Meanwhile, the diffusion distance is efficiently reduced for antibodies and pathogens within the nanostructures,30, 45 which accelerates the diffusion‐dependent steps in pathogen capture and detection. Silicon pillars etched by hydrofluoric acid with the aid of Ag+ are commonly used for bioassays, such as circulating tumor cell enrichment,46, 47 virus capture,48 and bacterial detection.49 However, the substrate for silicon pillars is not transparent, which limits its applications in the biosensor platforms that use optical detection. ZnO is a semiconductor material and is widely applied in energy harvesting and conversion.50, 51 The controllable growth of the semitransparent ZnO nanostructures (ZnO nanowires or nanorods) directly on glass substrate is more feasible for biosensors based on optical detection. Previous reports suggest that ZnO nanostructures can enhance the biomolecular fluorescence intensity.52, 53 We hypothesize that the high surface‐to‐volume ratio and intensified fluorescence of the ZnO nanostructure can significantly improve the sensitivity of the immunoassays for pathogen detection. Furthermore, the integration of the nanomaterials into microfluidic chips not only provides the capability for pathogen capture and detection but also enables portable multiplex pathogen assays by spatial encoding. In this paper, we report a new ZnO nanorods integrated microchip (ZnO‐NIM) that captures AIV on immunologically functionalized ZnO nanorod surface and detect viruses by multiplexed sandwich immunoassay. To improve the interaction on the ZnO nanorod surface, herringbone structures were incorporated inside the microfluidic device for enhanced mixing.54, 55 Highly selective detection of H5N2 subtype AIV is achieved by fast continuous flow in the microfluidic channels that effectively minimizes nonspecific adsorption.2, 29, 56 The entire detection process could be completed within 1.5 h, while the limit of detection (LOD) for the H5N2 AIV was measured as 3.6 × 10³ EID50 mL−1. This platform shows the capability for simultaneous detection of multiple viral pathogens by spatial encoding different antibodies onto the same ZnO‐NIM. Moreover, we further demonstrated the captured H5N2 AIV could be released by simply dissolving the ZnO nanorods in acidic environment and the released H5N2 AIV could be detected by the real‐time RT‐PCR (rRT‐PCR). The successful virus release enables subsequent off‐chip analyses of the captured viruses by ZnO‐NIM, which complements to the on‐chip multiplexed sandwich immunoassay and greatly expands its capability.
2. Results and Discussion
2.1. Characterization of the ZnO Nanorods Fabricated on the Glass Slides
The ZnO nanorods were synthesized on the KMnO4 activated glass slides in a batch process using a hydrothermal deposit method (Section S1, Supporting Information),57, 58 which is a low‐cost process and can easily be scaled up. Figure 1 A,B and Figure S3 (Supporting Information) depict the scanning electron microscopy (SEM) images of high‐density ZnO nanorods fabricated on the surface of a glass slide. The ZnO nanorods on the glass slides do not have a preferred growth direction, which is different from the seed‐induced methods of ZnO growth.50, 59 The morphology of the ZnO nanorod surface exhibits a nanostructure with high roughness as well as large surface‐to‐volume ratio. More binding sites can be used to conjugate capture antibodies, DNA aptamers, peptides, and so on.
Figure 1.

Characterization of ZnO nanorods synthesized on glass slides. SEM images of the ZnO nanorods on glass slides under A) low and B) high magnification. C) Optical photography of the ZnO nanorods on a glass slide showing the semitransparency of the ZnO nanorod modified glass. D) XRD pattern of the ZnO nanorods synthesized on a glass slide. E) Optical microscope image of the ZnO nanorods synthesized on a glass slide. F) FTIR spectrum of the ZnO nanorods synthesized on a glass slide.
The ZnO nanorod slides are translucent (Figure 1C) and can be directly used for the fluorescence imaging under transmitted light illumination, which is impossible for the opaque silicon nanopillars. Although the ZnO nanorod slides are translucent, they provide a better surface for fluorescence detection compared with bare glass slides. The fluorescence enhancement property of the semitransparent ZnO nanostructured glass substrate helps to boost up the overall detection sensitivity (Section S4, Figure S4, Supporting Information) by 70% for 100 nm fluorescent beads and 30% for fluorophores. The effect is purely optical and caused by neither larger surface area nor more fluorophores. It agrees with previous reports on the fluorescence enhancement effect randomly aligned ZnO nanorods, which is better than the vertical growth ZnO nanowires.60, 61 Interfacial electron transfer and evanescence waveguide of the ZnO nanostructures may attribute to the fluorescence enhancement effect we observed.62, 63
The X‐ray diffraction (XRD) spectra pattern of the ZnO nanorods modified glass (Figure 1D) reveals characteristic peaks at (100), (002), (101), (102), (110), (103), (200), (112), and (201), in agreement with standard ZnO XRD pattern as in the JCPDS card (No. 5‐0664).64 The XRD pattern contains no impurity peaks, indicating the high purity of the ZnO nanorods and perfect phase transformation. Observing under optical microscope, the ZnO nanorod slide has a homogeneous roughness, which is highly desirable in fluorescence imaging detection (Figure 1E). The Fourier transform infrared (FT‐IR) spectrum of the ZnO nanorod slide (Figure 1F) contains a broad adsorption band around 3376 cm−1 that can be assigned to the stretching vibration mode of hydroxyl group, a peak at 1585 cm−1 that may be attributed to the first overtone of the crucial stretching mode of hydroxyl group, and peaks at 1388 and 876 cm−1 that can be ascribed to the incorporated carbonate. The hydroxyl group could be easily modified with various silane reagents with functional groups, such as —NH2, —SH, —C=C, and so on.35, 49, 58
2.2. Design of the ZnO‐NIM for Pathogen Capture and Detection
Figure 2 depicts the design principle of immunological capture and on‐chip sandwich immunoassay for pathogen detection in a ZnO‐NIM. Details on the design and fabrication of the device are described in the Experimental Section and Section S1 (Supporting Information) (Figures S1 and S2, Supporting Information). The ZnO‐NIM adopts regular hexagon geometry for multiplexed detection of a maximum of six pathogens. Each side of the hexagon corresponds to one potential pathogen. Before the immunoassays, different capture monoclonal antibodies (mAbs) are conjugated to the ZnO nanorod surface on different hexagonal sides of the ZnO‐NIM. First loading reagents and the sample, the target pathogens can be captured on the mAb‐ZnO surface of one or multiple branched channels (Figure 2B). After washing with buffer, the interfering pathogens and contaminants are washed out of the device by the continuous high‐speed flow. The herringbone structure in the ZnO‐NIM increases the liquid mixing thus enhances the chances of interactions between the target pathogen and the mAb on the ZnO surface. After pathogen capture, biotin‐labeled detection monoclonal antibodies (detection mAb‐biotin) are loaded into the ZnO‐NIM device and allowed to react with the captured pathogen to generate the sandwich immune complexes (Figure 2C). Fluorescence signal is generated using cyanine dye‐conjugated streptavidin (Cy3‐SA) by utilizing the high affinity between biotin and streptavidin5, 65 (dissociation constant on the order of ≈10−14 m). The large and rough ZnO nanostructured surface provides a large number of binding sites for pathogen capture and shortens the diffusion distance for the target and reagents.
Figure 2.
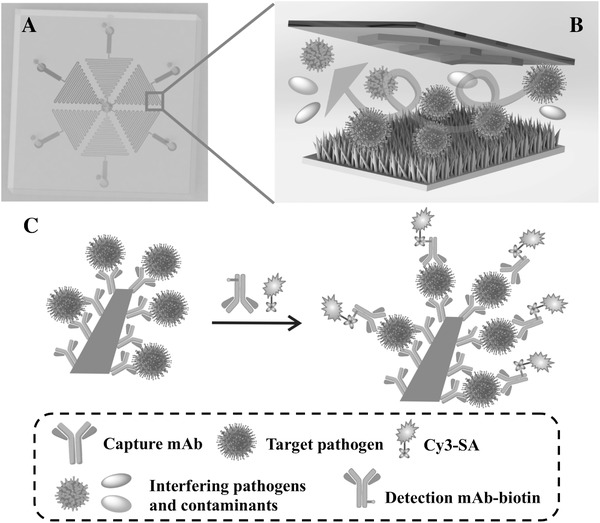
Principle of the multiplexed pathogen capture and detection on the ZnO‐NIM (not drawn to scale). A) Top view of a 3D illustration showing the layout of the microfluidic chip. The six branched microchannels are arranged in hexagon and can be loaded with six different samples (highlighted as different colors), respectively. B) Illustration showing the process of the pathogen capture on the 3D nanostructured ZnO surface conjugated with capture mAb on the ZnO surface inside the ZnO‐NIM. The ceiling of the microfluidic channels contains herringbone‐shaped structures to enhance mixing. C) Illustration of the sandwich immunoassay for pathogen detection on a single ZnO nanorod inside the ZnO‐NIM. Biotin‐labeled detection monoclonal antibodies (mAb‐biotin) bind to pathogens. Fluorescence signal is produced by Cy3‐SA.
2.3. On‐Chip mAb Modification and Its Stability
Figure 3 A shows the process of on‐chip surface functionalization of the ZnO nanorod surface with H5 mAb for virus capture. After ZnO‐NIM fabrication, surface modification was performed in situ inside the microfluidic channels by flowing in various solutions. The nanostructured ZnO nanorod surface was first treated with (3‐glycidyloxypropyl)trimethoxysilane (GPTMS) to obtain the epoxy groups that can react with the —NH2, —SH, or —OH group at different pH conditions. After the GPTMS modification, the adsorption band for hydroxyl group around 3376 cm−1 in the FT‐IR spectrum disappeared, suggesting the successful modification with epoxysilane (Section S5, Figure S5, Supporting Information). Then the H5 mAb was conjugated to the GPTMS‐modified ZnO nanorod surfaces through epoxy ring‐opening reaction. Unreacted epoxy groups on the ZnO nanorod surfaces were blocked with the methoxy polyethylene glycol thiol (mPEG–SH) and the bovine serum albumin (BSA). Figure 3B,C provides SEM images of the ZnO nanorods on the glass slides after modification of the H5 mAb for H5N2 AIV. The H5 mAb‐modified area on the ZnO slide was darker than unmodified area that lies outside of the microfluidic channel with the same imaging process and condition (Figure 3B), which implied the H5 mAb were conjugated onto the ZnO nanorods. As it is well known that ZnO nanoparticles or ZnO nanorods can dissolve at the acidic condition, the stability of ZnO nanorods on the microfluidic channel should be characterized after the modification of H5 mAb. The morphology of H5 mAb modified ZnO nanorods remained the same after surface modification as the pure ZnO nanorods, which confirmed that the ZnO nanorods were stable during the neutral pH condition of H5 mAb modification. Surface functionalization with other capture antibodies follows the same procedure.
Figure 3.

On‐chip surface functionalization of ZnO nanorods with H5 mAb specific for H5N2 AIV. A) Scheme of the ZnO nanorods modified with H5 mAb through GPTMS and blocked by mPEG‐SH and BSA. B) SEM image of the H5 mAb modified ZnO nanorod surfaces. The white dotted line separates the ZnO nanorods modified surface with the H5 mAb (bottom right) and that without antibody functionalization (top left). C) High‐magnification SEM image of the H5 mAb modified ZnO nanorods area.
2.4. Comparing mAb Modification on ZnO Nanostructured Surface and that on Bare Flat Glass Substrate
We investigated the increase of binding sites on the ZnO‐nanostructured surface over those on the bare glass substrates and the effects of physical adsorption versus chemical conjugation. First, ZnO‐nanostructured glass slides and bare glass slides were H5 mAb modified with or without the covalent linker GPTMS. Then DyLight‐conjugated goat antimouse IgG was used to react with the primary H5 mAb. Fluorescence images were recorded under exactly the same conditions and analyzed to evaluate the performance of H5 mAb surface modification. As shown in Figure 4 , after the DyLight‐conjugated goat antimouse IgG reacted with the H5 mAb, the fluorescence intensities of the bare glass slides, GPTMS‐modified glass slides, ZnO‐nanostructured glass slides, and GPTMS‐modified ZnO nanostructured glass slides were 6170 ± 158, 12 852 ± 787, 51 110 ± 3456, and 58 966 ± 2060 (A.U.), respectively. The GPTMS‐modified ZnO nanostructured glass slides show 9.56‐fold, 4.59‐fold, and 1.15‐fold higher fluorescence than the bare glass slides, GPTMS‐modified glass slides, and ZnO‐nanostructured glass slides, respectively. The ZnO nanorods significantly increase fluorescence signal intensity. It is worth to note that, even without the GMPTS modification, the ZnO slides show a high fluorescence after incubated with the H5 mAb overnight. The statistical significance between the H5 mAb conjugation on the GMPTS‐modified ZnO and that on unmodified ZnO (p value = 0.0382) is much lower than that of others (p values < 0.001, Figure 4), indicating the physical adsorption of the H5 mAb dominates the enhanced antibody surface modification on the ZnO nanorod surface. Although the more specific chemical adsorption mediated by GMPTS seems to play a minor role, the GMPTS‐modified ZnO slide shows higher and more stable fluorescence intensity than that of the ZnO nanorods without the GMPTS modification. Therefore, we use the GPTMS‐modified ZnO nanorod glass slides for the subsequent virus detection.
Figure 4.

Fluorescence intensities after second antibody (DyLight conjugated goat antimouse IgG) binding to different surfaces modified by the mAb under different conditions. A) Bare glass; B) GPTMS‐modified glass; C) ZnO nanostructured glass; D) GPTMS‐modified ZnO nanostructured glass. Error bars represent standard deviations of three samples each.
2.5. Specificity of the H5N2 AIV Detection
The specificity is one of the most important performance parameters for a biosensor, which reflects the anti‐interference capability of the biosensor. To test the specificity of our ZnO‐NIM for the H5N2 AIV, we tested seven samples including one negative control of allantoic fluid (AF), one target H5N2 AIV, three nontarget AIV subtypes of H1N1, H3N2, and H7N2, and two other viruses of infectious bursal disease virus (IBDV) and Nebraska‐calf‐diarrhea virus (NCDV). As shown in Figure 5 , the fluorescence intensities from the detection of the negative AF control and five nontarget virus samples were all around 4900 (A.U). For the target H5N2 AIV of 3.6 × 10⁶ EID50 mL−1, the fluorescence intensity increased to 52 013 (A.U.), which was tenfold higher than that of the negative AF control and nontarget virus samples. The high specificity of this method for the H5N2 AIV could be attributed to the high specificity of H5 mAb for the H5N2 AIV,7 minimized nonspecific interactions on the ZnO nanorod surfaces due to BSA and mPEG‐SH blocking, and the continuous washing under high flow rate (120 µL min−1). Previous reports suggest continuous washing at a high flow velocity is more efficient to remove the nonspecific adsorptive substances than the fixed volume bath method.2, 29, 56
Figure 5.

Specificity of the H5N2 AIV detection by ZnO‐NIMs. The fluorescence intensities are plotted for negative AF control and virus suspensions containing IBDV, NCDV, H1N1 virus, H3N2 virus, H7N2 AIV, and H5N2 AIV. Error bars represent standard deviations of three parallel experiments each.
2.6. Sensitivity for the H5N2 AIV Quantitative Assay
We studied whether the sandwich ELISA implemented inside the ZnO‐NIM can improve the sensitivity over the conventional immunoassay for H5N2 AIV detection. The H5N2 AIVs were cultured in embryonated chicken eggs and the concentration of the AIVs was calculated to 3.6 × 10⁶ EID mL−1 as our previous report.28 Serial dilutions of H5N2 AIV samples were prepared for final virus titers of 3.6 × 10², 3.6 × 10³, 3.6 × 10⁴, 1.8 × 10⁵, 3.6 × 10⁵, and 3.6 × 10⁶ EID50 mL−1. Viruses were detected inside ZnO‐NIM by sandwich immunoassay using H5 specific mAb for H5N2 AIV. The fluorescence images of on‐chip H5N2 AIV detection with different virus concentrations are shown in Figure 6 A–H. As summarized in the dose–response curve of Figure 6I, the fluorescence intensity increased as the virus concentration increased. The negative AF control from healthy chicken showed negligible fluorescence, even though it was a complex sample itself. Although the fluorescence intensity for 3.6 × 10² EID50 mL−1 of the H5N2 AIV sample is slightly higher than the negative AF control, based on the criteria that fluorescence intensity needs to be at least threefold of the standard deviation higher than that of the negative control,29 the LOD for the sandwich immune assay implemented in ZnO‐NIM for H5N2 AIV is determined as 3.6 × 10³ EID50 mL−1. Therefore, the H5N2 AIV sample above this concentration can be statistically detectable by our method that does not implement any signal amplification strategy. Our results show that the sandwich immunoassay implemented in the ZnO‐NIM is ≈22 times more sensitive than the conventional sandwich ELISA method for the H5N2 AIV using the same H5 mAb (Section S6, Figure S6, Supporting Information). There are several reasons for the high sensitivity of this ZnO‐nanostructure‐based immunoassay platform. First, compared to flat bare glass surface, the 3D ZnO nanorods modified surface has more binding sites for the mAbs. Second, the diffusion distance between the surface and species in the flow (virus samples, mAb, and other reagents) is decreased. Compared to previous reports, our biosensor shows a higher or at the same range of the sensitivity without any signal amplification and good specificity (Section S9, Table S1, Supporting Information). The high sensitivity could partially be attributed to the enhanced fluorescence by ZnO nanorods. Furthermore, we believe that ZnO‐NIM can be used for other biosensing applications such as superbugs, nucleic acids, proteins, and other microorganisms with available reagents. Although the fluorescence enhancement and semitransparency benefit fluorescence detection on ZnO nanostructured glass device, the ZnO‐NIM itself is not limited by fluorescence detection and can be potentially used with other detection methods.22, 30, 65
Figure 6.

H5N2 AIV detection by sandwich ELISA implemented on ZnO‐NIM. A) Optical microscope image of the top view of microchannels for the H5N2 AIV detection. B–H) Fluorescence images of on‐chip sandwich ELISA detection of H5N2 AIV in samples of H5N2 AIV concentrations of 0 (labeled as ctrl), 3.6 × 10², 3.6 × 10³, 3.6 × 10⁴, 1.8 × 10⁵, 3.6 × 10⁵, and 3.6 × 10⁶ EID50 mL−1. I) The fluorescence intensity versus the H5N2 AIV concentration in logarithmic scale. Error bars represent standard deviations of three parallel experiments each.
2.7. Multiplexed Pathogen Detection
To demonstrate multiplexed pathogen detection, we designed the current ZnO‐NIM with six microfluidic channels on each hexagonal side that branches to the same outlet, so that a maximum of six different mAbs can be conjugated in spatially separated channels. This concept is demonstrated in Figure 7 A, where food dye solutions with various colors were introduced to different microfluidic branch channels of a ZnO‐NIM. We performed simultaneous detection of two AIV subtypes (H5N2 and H7N2) in a single ZnO‐NIM (Figure 7B). As summarized in Figure 7C, the branched channels I, II, and III were modified with the H5 mAb specific for H5N2 AIV and the branched channels IV, V, and VI were modified with the H7 mAb specific for H7N2 AIV. After washing with phosphate buffered saline with 0.05% Tween 20 (PBST), the branched channels I and VI were loaded with PBS without virus, while H5N2 and H7N2 AIVs were introduced to branched channels II, IV and branched channels III, V, respectively. After incubation and washing, a mixture of H5 mAb‐biotin and H7 mAb‐biotin was loaded into all the branched microchannels to generate sandwich immune complexes. Followed by additional washing, secondary labeling reagent Cy3‐SA was then loaded and reacted with the biotin on the primary mAb. The results showed that only branched microchannels that had matching capture mAb and virus subtype (e.g., channel II: H5 mAb and H5N2 AIV sample; channel V: H7 mAb and H7N2 AIV sample) presented strong fluorescence. This proof‐of‐concept experiment suggests that our method has a good specificity for complicated scenario of simultaneous detection of multiple pathogens. With the advantages of multiplexed detection, high sensitivity, and high specificity, the ZnO‐NIM provides a promising portable tool for diagnosis of viral infectious diseases.
Figure 7.

Multiplexed detection of two AIV subtypes of H5N2 and H7N2 in one ZnO‐NIM. A) Each of the six branched microfluidic channels were operated as demonstrated by flowing in solutions of various color dyes into different branches. B) Scheme of three cases in the table below: microchannel II that was conjugated with H5 mAb for H5N2 AIV detection, microchannel III that was conjugated with H5 mAb but failed in H7N2 AIV detection, and microchannel V that was conjugated with H7 mAb for H7N2 AIV detection. C) Specific detection of H5N2 and H7N2 AIV inside the microchannels of each side of the ZnO‐NIM.
2.8. Release of Captured Viruses from ZnO‐NIM
ZnO nanomaterials can be dissolved under low pH (acidic) condition.66, 67 With this advantage, we tested if we could release the captured AIV from ZnO‐NIM by dissolving the ZnO nanorods for off‐chip virus assays. The captured H5N2 AIV in ZnO‐NIM were incubated with PBS (pH 6.0) and the viruses in the collected solution were measured by the real‐time RT‐PCR to confirm that the viruses could be successfully released from ZnO‐NIM. After incubation with low pH buffer solution, the ZnO nanorods disappeared under the microscope (Figure 8 A,B) and the microfluidic channel became more transparent than before, which indicated that the H5N2 AIV was probably released from ZnO‐NIM under this acidic environment. The rRT‐PCR results confirmed that the releasing solution contained H5N2 AIV in all three experimental groups with the mean cycle threshold (Ct) value of ≈28, while the negative control experiment generated no positive signal (Figure 8C). At 25 °C, ZnO dissolves in acidic buffer with pH lower than 6.7 and becomes Zn2+.68 With this unique property of ZnO, the captured targets can be released from ZnO‐NIM. This significantly expands the usability of the platform well beyond the ELISA demonstrated in this current work. For emerging viruses, the released viruses can be isolated and cultured. Furthermore, the virus titer can be quantified by more sensitive molecular assay like the rRT‐PCR. More importantly, the whole genomes of released viruses can be determined by various next‐generation sequencing (NGS) methods for studies important for viral pathogenesis, adaptability and genetic diversity of viruses, and epidemiology and transmission dynamics during disease outbreaks. Furthermore, the ZnO nanorods integrated microdevice is easily fabricated, cheap, and disposable. The ZnO‐NIM might be regenerated by using complex chemical method, such as DNA strand displacement,69 which needs the DNA modified on the surface and the DNA conjugated antibodies. In this paper, we proved that the 3D nanostructured surfaces could be integrated into the microfluidic chips for highly sensitive pathogen detection. The composing elements of the 3D nanostructured surfaces are not only limited to the ZnO nanorods, but also other nanomaterials, such as TiO2,44 which can be self‐cleaned by UV treatment and regenerated by simple method. This nanostructured surface based on TiO2 might be used in microfluidics for pathogen detection in the future. On the other hand, in this paper, we show a simple method by changing the pH to release the capture pathogens.
Figure 8.

Release of the captured H5N2 AIV by dissolving the ZnO nanorods. A) Optical image of the ZnO nanorods on the as‐fabricated ZnO‐NIM. B) Optical image of the microfluidic channel after the ZnO nanorods dissolved at 1× PBS buffer (pH 6.0). C) The rRT‐PCR results for H5N2 AIV detection in three experimental replicates of virus released from ZnO‐NIM and one negative control using the collected solution after dissolving of the ZnO nanorods from a ZnO‐NIM without virus.
3. Conclusion
A highly sensitive and selective fluorescence pathogen detection platform was designed, ZnO‐NIM, based on unique properties of ZnO nanorods and their microfluidic integration for the first time. The ZnO nanorods are synthesized on the KMnO4 activated glass slides in a low‐cost and scalable batch process that does not depend on cleanroom facilities. We implemented a multiplex ELISA assay on ZnO‐NIM. We can detect H5N2 AIV at virus concentration as low as 3.6 × 10³ EID50 mL−1 using ZnO‐NIM, which is ≈22‐fold more sensitive compared with conventional ELISA. This high sensitivity could be attributed to more conjugation sites on rough 3D ZnO nanorod surface and the reduction of the diffusion distance between mAb‐ZnO and pathogens. In addition, although the glass substrate becomes semitransparent after ZnO nanorod growth, the rough nanostructure does not interfere with fluorescence detection, yet enhances it optically by 30%–70%. Although immunoassays in general have lower sensitivity than molecular assays like rRT‐PCR, their flexibility, portability, and low price still make them a preferred method in many practical applications for pathogen detection. The specificity of ZnO‐NIM was validated by distinguishing the target virus from negative AF sample and several samples containing nontarget viruses. Furthermore, by conjugating different mAb on different branched microchannels of the same ZnO‐NIM, the device can be used for multiplexed detection of pathogens in complex samples. By dissolving the ZnO nanorods at a slightly acidic buffer (pH 6.0), the captured H5N2 AIV can be released and recovered for the subsequent analyses. This sensitive, selective, multiplex portable technology and the integrated fluorescence sandwich immunoassay can be expanded to detect other pathogens and disease biomarkers.
4. Experimental Section
Large‐Scale Growth of ZnO Nanorods on the Glass Slides: The hydrothermal method was used for bottom‐up large‐scale growth of ZnO nanorods on glass slides (denoted as ZnO slides) following previous reports.57, 58 Briefly, glass slides were first activated with freshly prepared KMnO4. The glass slides were then put into the ZnO growth media under elevated temperature (detailed information in Section S2, Supporting Information). By using this approach, ZnO nanorods were obtained on the whole surfaces of 75 × 25 mm or 75 × 50 mm glass slides without defects. This nanomaterial synthesis step is scalable, fast, and low cost.
Microfluidic Chip Design and Fabrication: The design of the microfluidic chip is shown in Figure 2A and Section S1 (Supporting Information). The six‐branched microchannels of the ZnO‐NIM were designed for multiplexed pathogen detection in one sample. Each branched microchannel contains herringbone structures for enhanced mixing. The height and width of the main microchannels are 40 µm and 100 µm, respectively. The two‐layer structure of the polydimethylsiloxane (PDMS) slab with the herringbone structure was fabricated as previous report.70, 71 The detailed fabrication process is described in Section S1 (Supporting Information). The PDMS slab was bonded to the ZnO slide by using stamp‐and‐stick room‐temperature bonding technique.72, 73 For the comparison experiments, PDMS slabs were reversibly bonded to the glass slides without ZnO nanorods synthesis.
Characterization of the ZnO Nanorods Synthesized on Glass Slides: The ZnO nanorods synthesized on glass slides were carefully characterized by many analytical means. SEM images were obtained on a field‐emission scanning electron microscope (NanoSEM 630, NOVA). Fourier transform infrared spectra were measured by a Bruker Vertex V70 FT‐IR spectrometer scanning from 400 to 4000 cm−1. The powder X‐ray diffraction (PXRD) patterns were obtained by a PANalytical Empyrean X‐ray powder diffractometer with Cu target (45 kV, 40 mA) from 20° to 70°.
Conjugation of the mAbs onto the ZnO‐NIM Chip: The 3D ZnO nanorod surfaces in the ZnO‐NIM were functionalized with 4% (v/v) GPTMS in ethanol for 2 h. After washing with ethanol and ultrapure water, the capture antibody was introduced into the microchannels of specific hexagonal sides at 120 µL min−1. The antibody can be conjugated to a specific hexagonal side of ZnO‐NIM by introducing the antibody to the corresponding inlet while keeping the rest inlets sealed. The whole microfluidic chip was placed in a glass container with controlled humidity. The antibody was coated on the microchannel surfaces by overnight incubation to allow epoxy ring‐opening reaction to happen. Then the ZnO‐NIM was washed with 50 × 10−3 m Tris buffer and incubated with 1% (w/w) mPEG‐SH for 1 h to block the unreacted epoxy group. Finally, the antibody conjugated surfaces were blocked with 5% (w/w) BSA solution for 30 min to reduce nonspecific adsorption. For multiplex virus detection, the procedure was repeated for the branched microchannels on different hexagonal sides of ZnO‐NIM using different antibodies.
Functionalization of mAb‐H5N2 and mAb‐H7N2 with Biotin Reagent: The H5 mAb and H7 mAb were labeled with biotin using commercial kits (EZ‐Link sulfo‐NHS‐LC‐Biotin, Thermo Fisher Scientific). Briefly, 100 µg of antibodies were reacted with freshly prepared sulfo NHS‐LC‐Biotin solution for 1 h in PBS. The excessive biotin label reagent was removed by NAP‐5 dextran column and centrifugal ultrafiltration with 3.5 kD molecular weight cut‐off. The biotin labeled mAb were kept in PBS containing 1% BSA and 0.05% NaN3 at −20 °C.
Sandwich Immune Assay for Pathogen Detection in the ZnO‐NIM Chip: The pathogen detection on the ZnO‐NIM was based on sandwich immunoassay. The AIV‐containing sample was introduced into the main channel from different branched channels at a flow rate of 120 µL min−1 for 2 min, then the flow rate was reduced to 6 µL min−1. The dynamic virus capture and enrichment process were carried on for 1 h in the microfluidic chips. After washing with PBS‐Tween buffer (PBST: 0.01% of tween‐20 in PBS, pH 7.2) for 2 min at 120 µL min−1, 10 µg mL−1 of H5 mAb‐biotin and H7 mAb‐biotin were loaded into the microfluidic chip and incubated for 10 min. After a 2 min PBST wash, Cy3‐SA was introduced into the microfluidic chip and incubated for 5 min. Finally, the ZnO‐NIM was washed with PBST for 2 min at 120 µL min−1 and then ready for the fluorescence imaging. The bright field fluorescence images were taken by an Olympus IX71 microscope equipped with a digital sCMOS camera (Hamamatsu Photonics, Japan). The fluorescence images were processed and analyzed with HC Imagelive software.
Specificity of H5N2 AIV Virus Detection: To evaluate the selectivity of this method, on‐chip virus detection was performed with various samples: a negative control of AF sample, five nontarget viruses of H7N2, NCDV, IBDV, H1N1, H3N2, and the target H5N2. The procedures for these samples were similar to the procedure described above for H5N2 AIV detection. All the fluorescence images were recorded using a same 20× objective.
Simultaneous Detection of Multiplexed Pathogens: In order to test the capability of this microfluidic chips for multiplexed detection, two AIV subtypes of H5N2 and H7N2 were simultaneously detected in a single ZnO‐NIM. The H5 mAb and H7 mAb were conjugated to the branched channels on different hexagonal sides of ZnO‐NIM. After the similar procedure as the H5N2 AIV detection described above, the fluorescent images from different branched channels were recorded. The detailed process was described in Section S7 (Supporting Information).
Release of the H5N2 AIV and the rRT‐PCR Assay: The captured H5N2 AIV in the ZnO‐NIM was released in PBS buffer (pH 6.0). The released H5N2 AIVs were identified by rRT‐PCR. The detail processes of the virus releasing process and the rRT‐PCR process are described in Section S8 (Supporting Information).
Conflict of Interest
The authors declare no conflict of interest.
Supporting information
Supplementary
Acknowledgements
The authors thank the Penn State Materials Research Institute and Huck Institute of Life Sciences for their support. This work was partially supported by the Pennsylvania State University start‐up fund to S.Y.Z. and the National Institutes of Health under Award No. DP2CA174508.
Yu X., Xia Y., Tang Y., Zhang W.‐L., Yeh Y.‐T., Lu H., Zheng S.‐Y., Small 2017, 13, 1700425 10.1002/smll.201700425
References
- 1. Peiris J. S., de Jong M. D., Guan Y., Clin. Microbiol. Rev. 2007, 20, 243. [DOI] [PMC free article] [PubMed] [Google Scholar]
- 2. Ferguson B. S., Buchsbaum S. F., Wu T. T., Hsieh K., Xiao Y., Sun R., Soh H. T., J . Am. Chem. Soc. 2011, 133, 9129. [DOI] [PMC free article] [PubMed] [Google Scholar]
- 3. Wang J. J., Jiang Y. Z., Lin Y., Wen L., Lv C., Zhang Z. L., Chen G., Pang D. W., Anal. Chem. 2015, 87, 11105. [DOI] [PubMed] [Google Scholar]
- 4. Sidorenko Y., Reichl U., Biotechnol. Bioeng. 2004, 88, 1. [DOI] [PubMed] [Google Scholar]
- 5. Zhang R. Q., Liu S. L., Zhao W., Zhang W. P., Yu X., Li Y., Li A. J., Pang D. W., Zhang Z. L., Anal. Chem. 2013, 85, 2645. [DOI] [PubMed] [Google Scholar]
- 6. Hvistendahl M., Science 2015, 348, 741. [DOI] [PubMed] [Google Scholar]
- 7. Lu H., Xie Z., Liu J., Lin L., J. Vet. Sci. Med. 2013, 1, 5. [Google Scholar]
- 8. Liu D., Wang Z., Jin A., Huang X., Sun X., Wang F., Yan Q., Ge S., Xia N., Niu G., Liu G., Walker A. R. H., Chen X., Angew. Chem. Int. Ed. 2013, 52, 14065. [DOI] [PMC free article] [PubMed] [Google Scholar]
- 9. Cao C., Dhumpa R., Bang D. D., Ghavifekr Z., Hogberg J., Wolff A., Analyst 2010, 135, 337. [DOI] [PubMed] [Google Scholar]
- 10. Li C. Y., Cao D., Kang Y. F., Lin Y., Cui R., Pang D. W., Tang H. W., Anal. Chem. 2016, 88, 4432. [DOI] [PubMed] [Google Scholar]
- 11. Wu Z., Hu J., Zeng T., Zhang Z. L., Chen J., Wong G., Qiu X., Liu W., Gao G. F., Bi Y., Pang D. W., Anal. Chem. 2017, 89, 2039. [DOI] [PubMed] [Google Scholar]
- 12. Zhou C. H., Zhao J. Y., Pang D. W., Zhang Z. L., Anal. Chem. 2014, 86, 2752. [DOI] [PubMed] [Google Scholar]
- 13. Zhao W., Zhang W. P., Zhang Z. L., He R. L., Lin Y., Xie M., Wang H. Z., Pang D. W., Anal. Chem. 2012, 84 , 2358. [DOI] [PubMed] [Google Scholar]
- 14. Fan R., Vermesh O., Srivastava A., Yen B. K., Qin L., Ahmad H., Kwong G. A., Liu C. C., Gould J., Hood L., Heath J. R., Nat. Biotechnol. 2008, 26, 1373. [DOI] [PMC free article] [PubMed] [Google Scholar]
- 15. Sackmann E. K., Fulton A. L., Beebe D. J., Nature 2014, 507, 181. [DOI] [PubMed] [Google Scholar]
- 16. Mu X., Zheng W., Sun J., Zhang W., Jiang X., Small 2013, 9, 9. [DOI] [PubMed] [Google Scholar]
- 17. Sun J. S., Xianyu Y. L., Jiang X. Y., Chem. Soc. Rev. 2014, 43, 6239. [DOI] [PubMed] [Google Scholar]
- 18. He S., Yu X., Wang X., Tan J., Yan S., Wang P., Huang B. H., Zhang Z. L., Li L., Lab Chip 2014, 14, 1410. [DOI] [PubMed] [Google Scholar]
- 19. Unger M. A., Science 2000, 288, 113. [DOI] [PubMed] [Google Scholar]
- 20. Yu X., Wen C. Y., Zhang Z. L., Pang D. W., RSC Adv. 2014, 4, 17660. [Google Scholar]
- 21. Song Y., Xia X., Wu X., Wang P., Qin L., Angew. Chem. Int. Ed. 2014, 53, 12451. [DOI] [PMC free article] [PubMed] [Google Scholar]
- 22. Zhu Z., Guan Z., Jia S., Lei Z., Lin S., Zhang H., Ma Y., Tian Z. Q., Yang C. J., Angew. Chem. Int. Ed. 2014, 53, 12503. [DOI] [PubMed] [Google Scholar]
- 23. Song Y., Zhang Y., Bernard P. E., Reuben J. M., Ueno N. T., Arlinghaus R. B., Zu Y., Qin L., Nat. Commun. 2012, 3, 1283. [DOI] [PMC free article] [PubMed] [Google Scholar]
- 24. Harouaka R. A., Zhou M. D., Yeh Y. T., Khan W. J., Das A., Liu X., Christ C. C., Dicker D. T., Baney T. S., Kaifi J. T., Belani C. P., Truica C. I., El‐Deiry W. S., Allerton J. P., Zheng S. Y., Clin. Chem. 2014, 60, 323. [DOI] [PubMed] [Google Scholar]
- 25. Feng X., Yi Y., Yu X., Pang D. W., Zhang Z. L., Lab Chip 2010, 10, 313. [DOI] [PubMed] [Google Scholar]
- 26. Zheng S., Lin H., Liu J. Q., Balic M., Datar R., Cote R. J., Tai Y. C., J. Chromatogr. A 2007, 1162, 154. [DOI] [PubMed] [Google Scholar]
- 27. Gervais L., de Rooij N., Delamarche E., Adv. Mater. 2011, 23, H151. [DOI] [PubMed] [Google Scholar]
- 28. Yeh Y. T., Tang Y., Sebastian A., Dasgupta A., Perea‐Lopez N., Albert I., Lu H., Terrones M., Zheng S. Y., Sci. Adv. 2016, 2, e1601026. [DOI] [PMC free article] [PubMed] [Google Scholar]
- 29. Yu X., Xia H. S., Sun Z. D., Lin Y., Wang K., Yu J., Tang H., Pang D. W., Zhang Z. L., Biosens. Bioelectron. 2013, 41, 129. [DOI] [PubMed] [Google Scholar]
- 30. Li Y., Xuan J., Song Y., Qi W., He B., Wang P., Qin L., ACS Nano 2015, 10, 1640. [DOI] [PMC free article] [PubMed] [Google Scholar]
- 31. Rahong S., Yasui T., Kaji N., Baba Y., Lab Chip 2016, 16, 1126. [DOI] [PubMed] [Google Scholar]
- 32. Su W., Gao X., Jiang L., Qin J., J. Chromatogr. A 2015, 1377, 13. [DOI] [PubMed] [Google Scholar]
- 33. Hu Y., Xu P., Luo J., He H., Du W., Anal. Chem. 2017, 89, 745. [DOI] [PubMed] [Google Scholar]
- 34. Lin X., Chen Q., Liu W., Li H., Lin J. M., Biosens. Bioelectron. 2014, 56, 71. [DOI] [PubMed] [Google Scholar]
- 35. Shen Q., Xu L., Zhao L., Wu D., Fan Y., Zhou Y., Ouyang W. H., Xu X., Zhang Z., Song M., Lee T., Garcia M. A., Xiong B., Hou S., Tseng H. R., Fang X., Adv. Mater. 2013, 25, 2368. [DOI] [PMC free article] [PubMed] [Google Scholar]
- 36. Zhang F., Jiang Y., Liu X., Meng J., Zhang P., Liu H., Yang G., Li G., Jiang L., Wan L. J., Hu J. S., Wang S., Nano Lett. 2016, 16, 766. [DOI] [PubMed] [Google Scholar]
- 37. Xu L. P., Chen Y. X., Yang G., Shi W. X., Dai B., Li G. N., Cao Y. H., Wen Y. Q., Zhang X. J., Wang S. T., Adv. Mater. 2015, 27, 6878. [DOI] [PubMed] [Google Scholar]
- 38. Zhang N., Deng Y., Tai Q., Cheng B., Zhao L., Shen Q., He R., Hong L., Liu W., Guo S., Liu K., Tseng H. R., Xiong B., Zhao X. Z., Adv. Mater. 2012, 24, 2756. [DOI] [PubMed] [Google Scholar]
- 39. Li Y. Y., Lu Q. H., Liu H. L., Wang J. F., Zhang P. C., Liang H. G., Jiang L., Wang S. T., Adv. Mater. 2015, 27, 6848. [DOI] [PubMed] [Google Scholar]
- 40. Liu X. L., Wang S. T., Chem. Soc. Rev. 2014, 43, 2385. [DOI] [PubMed] [Google Scholar]
- 41. Zhang P. C., Chen L., Xu T. L., Liu H. L., Liu X. L., Meng J. X., Yang G., Jiang L., Wang S. T., Adv. Mater. 2013, 25, 3566. [DOI] [PubMed] [Google Scholar]
- 42. Liu H. L., Li Y. Y., Sun K., Fan J. B., Zhang P. C., Meng J. X., Wang S. T., Jiang L., J. Am. Chem. Soc. 2013, 135, 7603. [DOI] [PubMed] [Google Scholar]
- 43. Wang L. Y., Liu H. L., Zhang F. L., Li G. N., Wang S. T., Small 2016, 12, 4697.27295294 [Google Scholar]
- 44. Meng J. X., Zhang P. C., Zhang F. L., Liu H. L., Fan J. B., Liu X. L., Yang G., Jiang L., Wang S. T., ACS Nano 2015, 9, 9284. [DOI] [PubMed] [Google Scholar]
- 45. Kim D., Herr A. E., Biomicrofluidics 2013, 7, 41501. [DOI] [PMC free article] [PubMed] [Google Scholar]
- 46. Wang S., Wang H., Jiao J., Chen K. J., Owens G. E., Kamei K., Sun J., Sherman D. J., Behrenbruch C. P., Wu H., Tseng H. R., Angew. Chem. Int. Ed. 2009, 48, 8970. [DOI] [PMC free article] [PubMed] [Google Scholar]
- 47. Wang S. T., Liu K., Liu J. A., Yu Z. T. F., Xu X. W., Zhao L. B., Lee T., Lee E. K., Reiss J., Lee Y. K., Chung L. W. K., Huang J. T., Rettig M., Seligson D., Duraiswamy K. N., Shen C. K. F., Tseng H. R., Angew. Chem. Int. Ed. 2011, 50, 3084. [DOI] [PMC free article] [PubMed] [Google Scholar]
- 48. Xia Y., Tang Y., Yu X., Wan Y., Chen Y., Lu H., Zheng S. Y., Small 2017, 13, 1603135. [DOI] [PMC free article] [PubMed] [Google Scholar]
- 49. Li Y. Q., Zhu B., Li Y., Leow W. R., Goh R., Ma B., Fong E., Tang M., Chen X., Angew. Chem. Int. Ed. 2014, 53, 5837. [DOI] [PubMed] [Google Scholar]
- 50. Greene L. E., Law M., Goldberger J., Kim F., Johnson J. C., Zhang Y., Saykally R. J., Yang P., Angew. Chem. Int. Ed. 2003, 42, 3031. [DOI] [PubMed] [Google Scholar]
- 51. Xu S., Ding Y., Wei Y., Fang H., Shen Y., Sood A. K., Polla D. L., Wang Z. L., J. Am. Chem. Soc. 2009, 131, 6670. [DOI] [PubMed] [Google Scholar]
- 52. Dorfman A., Kumar N., Hahm J., Adv. Mater. 2006, 18, 2685. [Google Scholar]
- 53. Singh M., Song S., Hahm J. I., Nanoscale 2014, 6, 308. [DOI] [PMC free article] [PubMed] [Google Scholar]
- 54. Stroock A. D., Dertinger S. K., Ajdari A., Mezic I., Stone H. A., Whitesides G. M., Science 2002, 295, 647. [DOI] [PubMed] [Google Scholar]
- 55. Stott S. L., Hsu C. H., Tsukrov D. I., Yu M., Miyamoto D. T., Waltman B. A., Rothenberg S. M., Shah A. M., Smas M. E., Korir G. K., Floyd F. P. Jr., Gilman A. J., Lord J. B., Winokur D., Springer S., Irimia D., Nagrath S., Sequist L. V., Lee R. J., Isselbacher K. J., Maheswaran S., Haber D. A., Toner M., Proc. Natl. Acad. Sci. USA 2010, 107, 18392. [DOI] [PMC free article] [PubMed] [Google Scholar]
- 56. Yu X., Feng X., Hu J., Zhang Z. L., Pang D. W., Langmuir 2011, 27, 5147. [DOI] [PubMed] [Google Scholar]
- 57. Kokotov M., Hodes G., J. Mater. Chem. 2009, 19, 3847. [Google Scholar]
- 58. Fang Q., Wang J., Gu S., Kaspar R. B., Zhuang Z., Zheng J., Guo H., Qiu S., Yan Y., J. Am. Chem. Soc. 2015, 137, 8352. [DOI] [PubMed] [Google Scholar]
- 59. Pan C. F., Dong L., Zhu G., Niu S. M., Yu R. M., Yang Q., Liu Y., Wang Z. L., Nat. Photonics 2013, 7, 752. [Google Scholar]
- 60. Hu W., Liu Y., Zhu Z., Yang H., Li C. M., ACS Appl. Mater. Interfaces 2010, 2, 1569. [DOI] [PubMed] [Google Scholar]
- 61. Hu W., Liu Y., Yang H., Zhou X., Li C. M., Biosens. Bioelectron. 2011, 26, 3683. [DOI] [PubMed] [Google Scholar]
- 62. Fu Y., Zhang J., Lakowicz J. R., Int. J. Mol. Sci. 2012, 13, 12100. [DOI] [PMC free article] [PubMed] [Google Scholar]
- 63. Sirbuly D. J., Law M., Pauzauskie P., Yan H., Maslov A. V., Knutsen K., Ning C. Z., Saykally R. J., Yang P., Proc. Natl. Acad. Sci. USA 2005, 102, 7800. [DOI] [PMC free article] [PubMed] [Google Scholar]
- 64. Singh B. N., Rawat A. K., Khan W., Naqvi A. H., Singh B. R., PloS One 2014, 9, e106937. [DOI] [PMC free article] [PubMed] [Google Scholar]
- 65. Yu X., Zhang Z. L., Zheng S. Y., Biosens. Bioelectron. 2015, 66, 520. [DOI] [PMC free article] [PubMed] [Google Scholar]
- 66. Zhou J., Xu N. S., Wang Z. L., Adv. Mater. 2006, 18, 2432. [Google Scholar]
- 67. Muller K. H., Kulkarni J., Motskin M., Goode A., Winship P., Skepper J. N., Ryan M. P., Porter A. E., ACS Nano 2010, 4, 6767. [DOI] [PubMed] [Google Scholar]
- 68. Goux A., Pauporté T., Chivot J., Lincot D., Electrochim. Acta 2005, 50, 2239. [Google Scholar]
- 69. Palla K. S., Hurlburt T. J., Buyanin A. M., Somorjai G. A., Francis M. B., J. Am. Chem. Soc. 2017, 139, 1967. [DOI] [PubMed] [Google Scholar]
- 70. Duffy D. C., McDonald J. C., Schueller O. J., Whitesides G. M., Anal. Chem. 1998, 70, 4974. [DOI] [PubMed] [Google Scholar]
- 71. Yu X., Cheng G., Zhou M. D., Zheng S. Y., Langmuir 2015, 31, 3982. [DOI] [PubMed] [Google Scholar]
- 72. Satyanarayana S., Karnik R. N., Majumdar A., J. Microelectromech. Syst. 2005, 14, 392. [Google Scholar]
- 73. Ning R., Wang S., Wu J., Wang F., Lin J. M., Small 2014, 10, 4113. [DOI] [PubMed] [Google Scholar]
Associated Data
This section collects any data citations, data availability statements, or supplementary materials included in this article.
Supplementary Materials
Supplementary