

Summary
The present study describes the prevalence of haematological and electrophoretic changes consistent with the diagnosis of feline infectious peritonitis (FIP) in cats without FIP living in six multicat environments with different prevalence of FIP and of other diseases. The results allow designing haematological and electrophoretic profiles typical of each group, most likely depending on the management and on the health status of the group rather than on the prevalence of FIP. In fact, many cats from the colonies with open management and frequent outbreaks of infectious diseases other than FIP had one or more haematological and/or electrophoretical changes consistent with FIP, compared with the reference ranges. In the case of non‐specific clinical signs such as fever or neurological signs because of diseases other than FIP, these cats would be erroneously considered as affected by FIP and euthanasized. The use of internal ranges designed on the basis of repeated samplings from non‐symptomatic cats allows avoiding these misinterpretations. Results from cats with symptoms consistent with FIP living in the same colonies were also compared with both the reference ranges and the internal ones: such a comparison demonstrated that the use of internal ranges rarely affected the possibility to correctly diagnose the disease in cats with symptoms suggestive of FIP.
Introduction
Feline infectious peritonitis (FIP) is caused by the feline infectious peritonitis virus (FIPV), a feline coronavirus (FCoV) that arises by a mutation from the feline enteric coronavirus (FECV) (Vennema et al., 1995). When FCoV is present in a cattery, it is likely to infect 90–100% of the cats and all the cats are likely to be seropositive (Addie et al., 2000). The poor specificity of serological tests often induces use of other clinico‐pathological changes as diagnostic markers of FIP. Clinical findings are often non‐specific, especially in dry forms, and the diagnosis of FIP needs to be supported by the presence of non‐regenerative anaemia, neutrophilic leucocytosis, lymphopenia, hyperproteinaemia, increased total‐, α 2‐ and γ‐globulins (Pedersen, 1995). Unfortunately, some of these changes can also appear in cats as a consequence of chronic inflammation, stress or crowding (Kristensen and Barsanti, 1977; Jain, 1993): in the case of fever, neurological signs, hepatic or renal failure because of diseases other than FIP, cats with the above‐mentioned laboratory alterations may be erroneously suspected to have FIP and isolated from the colony (Addie and Jarrett, 1995) or euthanasized.
In this paper, the prevalence of haematological and electrophoretic changes in multicat environments was determined by a retrospective analysis of data obtained from blood samples collected during 1999 from cats without symptoms consistent with FIP living in catteries with different prevalence of FIP. Based on these data, internal ranges of each parameter were calculated in all the colonies (Lumsden, 2000) in order to design the laboratory profile of each cattery and to look for any possible difference between these ranges and the reference ones. Results from cats with symptoms suggestive of FIP recorded in the same catteries since 1997 were also examined in order to check if the use of internal ranges would affect the possibility to correctly diagnose the disease.
Material and Methods
Animals and study design
This study was performed on six catteries with different characteristics of management, health status and prevalence of FIP, according to the clinical and pathological data recorded since 1997 (Table 1). In particular, the management was considered as open, closed or mixed in case of frequent (more than once a month), rare (less than once a year) or occasional (about once every 3 or 4 months) contacts with other cats, respectively; the health status was classified as good or poor, based on the occurrence of sporadic cases or of repeated outbreaks of infectious diseases (rhinoconjunctivitis, gastroenteritis); the prevalence of FIP was considered as low or high if less or more than 10% of the cats living in the colony died because of FIP since 1997.
Table 1.
Characteristics of the six groups of cats examined
| Cattery number | ||||||
|---|---|---|---|---|---|---|
| 1 | 2 | 3 | 4 | 5 | 6 | |
| Number of cats since 1997 | 36 | 11 | 21 | 40 | 31 | 12 |
| Number of cats during 1999 | 30 | 11 | 15 | 30 | 20 | 9 |
| Cases of FIP since 1997 | 5 | 0 | 6 | 10 | 3 | 1 |
| Prevalence of FIP since 1997 | High | Low | High | High | Low | Low |
| Management | Mixed | Mixed | Open | Open | Closed | Closed |
| Health status | Good | Good | Poor | Poor | Good | Good |
| Group A (cat no.‐breed, sex, age) | 1‐P, M, 12 y | 11‐P, F, 13 ya | 18‐P, F, 1 y | 25‐D, F, 4 yb | 35‐D, M, 9 y | 41‐S, F, 2 y |
| 2‐P, F, 8 y | 12‐P, M, 9 y | 19‐P, F, 3 y | 26‐D, M, 3 yc | 36‐D, F, 8 y | 42‐O, F, 2 y | |
| 3‐P, F, 8 y | 13‐P, F, 11 y | 20‐P, F, 2 y | 27‐D, M, 1 y | 37‐D, F, 3 y | 43‐O, M, 1 y | |
| 4‐P, F, 6 y | 14‐P, M, 3 y | 21‐E, M, 4 yd | 28‐D, F, 2 y | 38‐D, F, 2 y | 44‐B, M, 2 y | |
| 5‐P, M, 1 y | 15‐P, F, 4 y | 22‐P, M, 5 yd | 29‐D, M, 4 y | 39‐D, F, 2 y | ||
| 16‐P, F, 5 y | ||||||
| 17‐P, M, 1 y | ||||||
| Group B (cat no.‐breed, sex, age) | 6‐P, F, 8 m | 23‐P, F, 1 y | 30‐D, F, 7 m | 40‐D, F, 2 y | 45‐S, F, 3 m | |
| 7‐P, F, 6 m | 24‐P, F, 3 y | 31‐D, F, 1 y | ||||
| 8‐P, M, 1 y | 32‐D, F, 2 y | |||||
| 9‐P, F, 5 y | 33‐D, M, 5 y | |||||
| 10‐P, M, 1 y | 34‐D, F, 7 y | |||||
Group A: no symptoms consistent with FIP; Group B: symptoms consistent with FIP.
Management: open, frequent (more than once a month) contacts with other cats; Closed, rare (less than once a year) contacts with other cats; Mixed, occasional (about once every three or four months) contacts with other cats.
Prevalence of FIP since 1997: low, less than 10% of the cats living in the colony died of FIP; high, more than 10% of the cats living in the colony died of FIP.
Health status: good, sporadic cases of infectious diseases (rhinoconjunctivitis, viral gastroenteritis); poor, repeated outbreaks of infectious diseases.
P, persian; E, exotic; D, domestic shorthair; S, siamese; O, oriental; B, balinese; F, female; M, male; y, years; m, months.
a Non‐steroidal anti‐inflammatory therapy at T0.
b Transient upper respiratory infection at T30.
c Haemorragic diarrhoea most likely because of parvovirus at T30.
d Rhinoconjunctivitis at T30.
In each cattery, two groups of animals were sampled.
Group A
Four to seven cats without symptoms consistent with FIP were chosen in each cattery in order to sample a representative population of the whole group in terms of breed, sex and age. Cats with symptoms not consistent with FIP (ocular discharges, coughing, haemorragic diarrhoea, vomiting, gengivitis) were included in this group.
From each cat, blood was drawn from the jugular vein at the beginning of the study (T0) and after 30 (T30) and 60 days (T60). During each sampling, all the cats of the cattery were visited and the owners were asked about any change in the management (e.g. introduction of new cats, participation to cat shows, etc.), about pathopysiological (e.g. pregnancies, parturitions) or pathological changes that occurred since the previous sampling, with particular emphasis on symptoms consistent with FIP.
Group B
Fourteen cats with symptoms consistent with FIP (fever, weakness, ocular or neurological signs, cavitary effusions), recorded by us since 1997 to date, were included in this group. In all these cases, the final diagnosis was obtained by serological tests, cytology of the effusions, post‐mortem examinations or by complete recovery after antibiotic therapies.
Haematology
Blood collected in ethylenediaminetetraacetic acid‐coated tubes was used to perform a complete cell blood count using an automatic cell counter (SEAC, Firenze, Italy), a differential leucocyte count on May‐Grünwald Giemsa stains and a reticulocyte count on brilliant cresyl blue stained smears (Jain, 1993).
Serology and serum protein electrohporesis
Serum was obtained by centrifugation (15 min, 450 × g) of blood samples collected in tubes without anticoagulant. Serology for feline immunodeficiency virus (FIV) and for feline leukaemia virus (FeLV) were performed by means of an ELISA test kit (SNAP, IDEXX Lab, Westbrook, MA, USA). Serology for Toxoplasma gondii was assessed using a latex agglutination test (Eiken Chemical Co. Ltd., Tokyo, Japan).
Total proteins were measured by a discrete analyser (Abbott VP, Abbott Lab, Irving, TX, USA) by the biuret method (Abbott Lab, Abbott Park, IL, USA). Serum protein electrophoresis was performed using the semi‐micro method with cellulose polyacetate strips in a barbitone and Tris buffer. The strips were run (40 min, 150 V), stained for 15 min in Red Ponceau (0.5 g in 100 ml of 5% trichloroacetic acid), destained in 5% acetic acid and put in a diaphanizing solution (Helena Lab Italia Spa, Assago, MI, Italy). The gels were scanned in a densitometer (BT512, Biotecnica Instruments, Roma, Italy).
Cytology of the effusions
About 50–100 μl of fluid was cytocentrifuged at 130 × g for 10 min as previously described (Paltrinieri et al., 1999). The slides were stained with May Grünwald‐Giemsa and examined by light microscopy.
Post‐mortem examinations
All the animals that died with symptoms consistent with FIP were necropsied. Samples (approximately 1 cm3) of each affected organ were fixed in 10% iso‐osmotic formalin and embedded in paraffin. Microthomic sections (5 μm) were stained with haematoxilin and eosin and by immunohistochemistry, using a monoclonal antibody against the FCoV, kindly provided by Prof. N. C. Pedersen, Davis, USA. The avidin–biotin complex (ABC) method with a commercially available kit (Vectastain Elite, Vector Labs Inc, Burlingame, CA, USA) was used to detect the positive reaction, as previously described (Hsu et al., 1980), after inhibition of the endogenous peroxidase (H2O2 1% in methanol) and antigen unmasking using microwave pre‐treatment (two cycles of 5 min in citrate‐buffered solution, 0.01 m, pH 6.2). 3‐Amino‐9‐ethyl‐carbazole or diaminobenzidine served as chromogen for the reaction and the slides were counterstained with Mayer's haematoxilin. Some sections of each sample were used as negative controls, with the primary antibody substituted by an equal amount of normal mouse serum (DAKO A/S, Glostrup, Denmark). In each session of immunohistochemical test, a section of liver with a fibrinous perihepatitis from a cat with FIP was used as a positive control.
Statistical analyses
Using a specific software (Statsoft Inc., Tulsa, OK, USA), mean values recorded in the six catteries at each time of sampling were compared with each other by one‐way anova or, when a normality test showed that data did not have a normal distribution, by Kruskall–Wallis test. The same tests were used to compare the mean values calculated in the six catteries on the basis of the results recorded in all the samplings.
The lowest and the highest values observed both at each time of sampling and during the whole study period were used to establish internal ranges of each parameter in each cattery as suggested by Lumdsen (2000) for small groups of animals.
Results
Clinical and pathological findings
Group A
Serology for FIV, FeLV and T. gondii was negative in all the cats from this group. Moreover, none of them showed symptoms consistent with FIP and all subjects were still alive 2 years after the samplings, thus excluding that they were developing a clinical form of FIP when sampled. However, cat no. 11 received an anti‐inflammatory therapy (serratio peptidase, Danzen®, Takeda) at T0, because of a traumatic lameness. An outbreak of rhinoconjunctivitis occurred in cattery 3 at T30, and cat nos. 21 and 22 were affected. In cattery 4, an outbreak of upper respiratory infection, which affected cat no. 25 at T30, and an outbreak of haemorragic diarrhoea between T0 and T30 were recorded: the latter affected cat no. 26, which was treated with fluid therapy and bacithracine (Bimixin®, Sanofi), and caused the death of two kittens. Although results from these two kittens were not included in this study, they were necropsied: a severe haemorragic gastroenteritis, with histological findings consistent with the diagnosis of parvoviral infection, was detected.
Group B
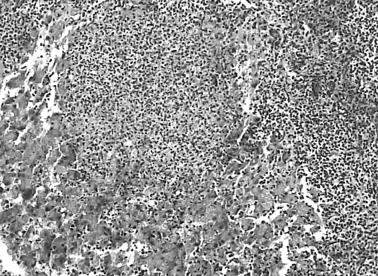
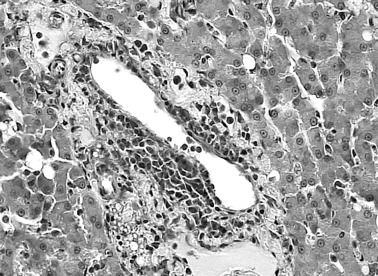
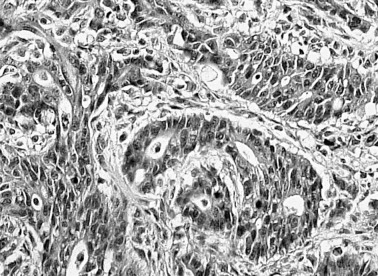
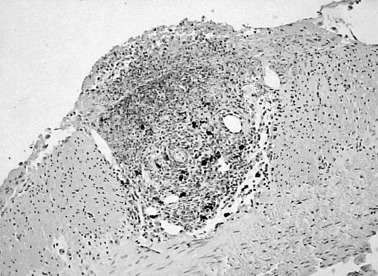
Cat no. 24 had ataxia, repeated convulsive crisis and a high anti‐T. gondii antibody titre (1:1024). This cat was treated with sulfamethopyrazine (Vetkefizina®, Ceva Vetem) and had a complete recovery. Cat nos.10 and 40 had fever of unknown origin (FUO) that persisted for about 1 month in spite of different antibiotic therapies. Fever disappeared using Cefazoline (Cefamezin®, Pharmacia) and Enrofloxacin (Baytril®, Bayer), respectively. Both these cats were still alive after 2 years (cat no.10) and 4 years (cat no. 40) and did not show any other symptoms consistent with FIP: the observed FUO can thus be interpreted as a consequence of some bacterial infection responsive only to Cefazoline and Enrofloxacin, respectively. Cat no. 9 had fever, jaundice and a peritoneal effusion on which neutrophils, many of which degenerated, and lymphocytes were detectable. At the necropsy, a multi‐focal to coalescing severe necrotizing and suppurative hepatitis was detectable (Fig. 1). Cat no. 33 had fever, weakness and a progressive paralysis of the leg: large and immature myeloid cells were detectable in both peripheral blood and bone marrow (Fig. 2) suggesting the diagnosis of acute myeloid leukaemia (AML), most likely myelomonocytic. Histology confirmed this diagnosis (Fig. 3). Cat no. 34 had a thoracic effusion on which clusters of epithelial cells with cytologic patterns consistent with the diagnosis of neoplasia were detectable (Fig. 4). At the necropsy, pulmonary carcinoma was diagnosed (Fig. 5). Immunohistochemistry for FCoVs was negative in all these cats.
Figure 1.
Cat no. 9, liver: multifocal to coalescing necrotizing and suppurative hepatitis. Haematoxilin and eosin stain, 250×.
Figure 2.
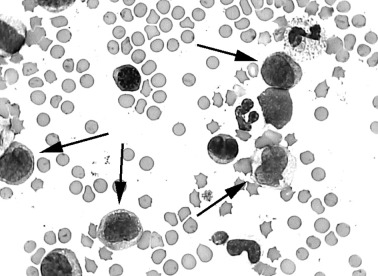
Cat no. 33, blood: atypical circulating myeloid cells (arrows), most likely myeloblasts. May Grünwald‐Giemsa stain, 1000×.
Figure 3.
Cat no. 33, liver: perivascular infiltration of neoplastic myeloid cells. Haematoxilin and eosin stain, 400×.
Figure 4.
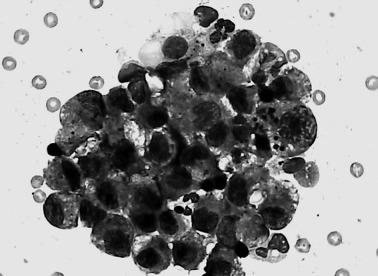
Cat no. 34, cytocentrifuged abdominal effusion: cluster of malignant cohesive epithelial cells, May Grünwald‐Giemsa stain, 1000×.
Figure 5.
Cat no. 34, lung: malignant neoplastic epithelial cells arranged in tubular structures. Haematoxilin and eosin stain, 400×.
The other eight cats died with symptoms consistent with the diagnosis of effusive FIP. This diagnosis was confirmed by both histology (Fig. 6) and immunohistochemistry (Fig. 7).
Figure 6.
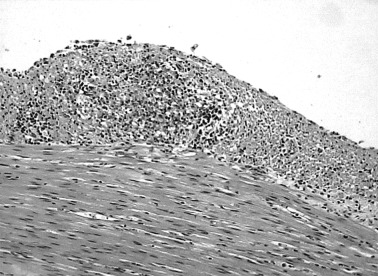
Cat no. 23, intestine: pyogranulomatous lesion in the perivisceral fibrin, Haematoxilin and eosin stain, 250×.
Figure 7.
Cat no. 45, intestine: FCoV positive cells in a pyogranulomatous lesion. Immunohistochemical stain, Mayer's haematoxilin counterstain, 250×.
Haematological and electrophoretic findings
Group A
Data regarding the parameters commonly used to support a clinical diagnosis of FIP (Pedersen, 1995) are reported in Table 2.
Table 2.
Mean ± SD (and internal ranges) from the six catteries and statistical comparison among mean values recorded in each cattery
| Cattery | Erythrocytes × 106/μl | Leucocytes × 103/μl | Neutrophils × 103/μl | Lymphocytes × 103/μl | Total proteins (g/dl) | Total globulins (g/dl) | α 2 ‐Globulins (g/dl) | γ ‐Globulins (g/dl) | |
|---|---|---|---|---|---|---|---|---|---|
| 1 | T0 | 8.9 ± 1.1 (7.3–10.4) | 9.8 ± 1.9 (7.9–12.4) | 5.7 ± 1.0 (4.4–6.8) | 2.5 ± 0.8 (1.2–3.1) | 7.3 ± 0.5 (6.7–8.1) | 3.6 ± 0.6 (3.0–4.6) | 0.6 ± 0.1 (0.5–0.7) | 1.9 ± 0.6 (1.4–2.8) |
| T30 | 9.3 ± 2.0 (7.3–12.6) | 11.1 ± 1.3 (8.9–12.5) | 6.2 ± 1.2 (5.1–8.0) | 3.4 ± 1.3 (2.0–5.4) | 7.2 ± 0.4 (6.8–7.7) | 3.3 ± 0.4 (2.8–3.8) | 0.4 ± 0.2 (0.2–0.6) | 1.7 ± 0.5 (1.3–2.6) | |
| T60 | 8.7 ± 1.1 (7.4–9.8) | 9.9 ± 1.2 (8.8–11.9) | 5.3 ± 1.4 (3.3–7.0) | 2.9 ± 1.1 (1.6–4.6) | 6.7 ± 0.3 (6.3–7.2) | 2.9 ± 0.5 (2.3–3.6) | 0.4 ± 0.2 (0.3–0.7) | 1.5 ± 0.7 (0.8–2.4) | |
| Mean | 8.9 ± 1.4 (7.3–12.6) | 10.3 ± 1.5 (7.9–12.5) | 5.7 ± 1.2 (3.3–8.0) | 2.9 ± 1.1 (1.2–5.4) | 7.1 ± 0.5 (6.3–8.1) | 3.3 ± 0.5 (2.3–4.6) | 0.5 ± 0.2 (0.2–0.7) | 1.7 ± 0.6 (0.8–2.8) | |
| 2 | T0 | 8.4 ± 1.5 (6.3–9.9) | 9.3 ± 3.5 (4.7–14.2) | 5.2 ± 2.2 (2.5–8.6) | 2.3 ± 0.6 (1.5–3.1) | 8.0 ± 0.9 (6.7–9.1) | 3.9 ± 0.9 (2.9–5.5) | 0.6 ± 0.2 (0.4–1.0) | 1.9 ± 0.8 (1.2–3.0) |
| T30 | 9.1 ± 0.5 (8.5–9.8) | 12.9 ± 2.3 (8.7–15.3) | 5.2 ± 2.7 (2.7–10.7) | 5.2 ± 2.0 (3.1–8.1) | 7.5 ± 0.5 (7.1–8.1) | 3.5 ± 0.5 (3.0–4.4) | 0.5 ± 0.1 (0.4–0.6) | 1.9 ± 0.6 (0.9–2.8) | |
| T60 | 8.5 ± 1.0 (7.9–10.0) | 12.3 ± 3.7 (6.6–18.3) | 6.8 ± 2.3 (4.1–9.9) | 2.9 ± 1.2 (1.3–4.4) | 8.0 ± 0.5 (7.1–8.8) | 4.2 ± 0.7 (3.4–5.3) | 0.8 ± 0.1 (0.6–1.0) | 2.3 ± 0.7 (1.3–3.4) | |
| Mean | 8.7 ± 1.1 (6.3–10.0) | 12.4 ± 2.9 (4.7–18.3) | 5.7 ± 2.4 (2.5–10.7) | 3.5 ± 1.9 (1.3–8.1) | 7.8 ± 0.7 (6.7–9.1) | 3.9 ± 0.7 (2.9–5.5) | 0.6 ± 0.2 (0.4–1.0) | 2.0 ± 0.7 (0.9–3.4) | |
| 3 | T0 | 8.3 ± 2.7 (4.7–11.2) | 7.2 ± 4.5 (2.8–13.8) | 4.2 ± 2.8 (1.1–8.3) | 2.4 ± 1.5 (1.0–4.3) | 8.4 ± 0.6 (7.8–9.1) | 4.7 ± 1.3 (3.5–6.6) | 0.5 ± 0.3 (0.3–1.0) | 2.7 ± 1.0 (1.9–4.4) |
| T30 | 8.2 ± 0.7 (7.4–9.2) | 14.7 ± 3.7# (9.7–19.0) | 9.4 ± 3.4# (6.0–13.5) | 4.5 ± 1.9# (2.8–7.8) | 7.5 ± 0.4 (7.0–8.0) | 4.1 ± 0.9 (3.0–5.4) | 0.5 ± 0.1 (0.4–0.6) | 2.5 ± 0.7 (1.7–3.6) | |
| T60 | 7.5 ± 1.1 (6.4–9.2) | 5.7 ± 2.7 (2.7–8.4) | 3.5 ± 1.5 (1.8–5.0) | 1.7 ± 1.1 (0.8–4.4) | 7.2 ± 1.5 (6.3–9.8) | 4.3 ± 1.6 (3.0–7.1) | 0.5 ± 0.2 (0.2–0.7) | 2.7 ± 1.6 (1.7–5.5) | |
| Mean | 8.0 ± 1.7 (4.7–11.2) | 9.2 ± 5.3 (2.8–19.0) | 5.7 ± 3.7 (1.1–13.5) | 2.9 ± 1.9 (0.8–7.8) | 7.7 ± 1.0 (6.3–9.8) | 4.3 ± 1.2 (3.0–7.1) | 0.5 ± 0.2 (0.2–1.0) | 2.7 ± 1.1 (1.7–5.5) | |
| 4 | T0 | 8.3 ± 1.4 (6.0–9.9) | 17.6 ± 7.3 (5.9–23.2) | 11.3 ± 5.5 (2.5–15.8) | 5.4 ± 2.1 (3.0–8.3) | 7.7 ± 0.9 (6.8–9.0) | 4.6 ± 1.3 (3.4–6.4) | 0.7 ± 0.2 (0.5–0.9) | 2.6 ± 1.2 (1.5–4.4) |
| T30 | 7.9 ± 2.3 (4.8–9.8) | 23.0 ± 12.9 (8.0–41.9) | 15.5 ± 9.6 (3.7–28.9) | 6.2 ± 3.1 (2.7–10.5) | 7.0 ± 0.8 (5.8–7.9) | 4.3 ± 0.6 (3.6–4.8) | 0.7 ± 0.2 (0.5–0.9) | 2.5 ± 0.5 (2.0–3.1) | |
| T60 | 6.9 ± 1.7 (5.1–9.0) | 15.4 ± 5.4 (6.6–19.7) | 10.0 ± 4.5 (3.0–14.5) | 4.3 ± 2.4 (1.5–7.1) | 7.0 ± 0.4 (6.5–7.6) | 4.2 ± 0.6 (3.6–5.0) | 0.4 ± 0.1# (0.3–0.6) | 2.6 ± 0.8 (2.0–3.9) | |
| Mean | 7.7 ± 1.8 (4.8–9.9) | 18.7 ± 9.0 (5.9–41.9) | 12.3 ± 6.9 (2.5–28.9) | 5.3 ± 2.5 (1.5–10.5) | 7.2 ± 0.8 (5.8–9.0) | 4.4 ± 0.8 (3.4–6.4) | 0.6 ± 0.2 (0.3–0.9) | 2.6 ± 0.8 (1.5–4.4) | |
| 5 | T0 | 6.8 ± 1.6 (5.6–9.5) | 9.7 ± 3.3 (6.7–15.3) | 6.6 ± 1.6 (4.8–9.0) | 2.8 ± 1.6 (1.5–5.7) | 8.3 ± 0.5 (7.7–9.0) | 3.9 ± 0.5 (3.1–4.3) | 0.5 ± 0.1 (0.3–0.7) | 1.9 ± 0.4 (1.4–2.3) |
| T30 | 7.7 ± 1.2 (6.1–9.0) | 10.7 ± 1.5# (9.1–12.6) | 7.9 ± 1.3# (6.2–9.1) | 1.9 ± 0.6# (1.1–2.5) | 7.3 ± 0.5 (6.9–8.0) | 3.8 ± 0.5 (3.4–4.6) | 0.7 ± 0.2# (0.5–0.9) | 1.7 ± 0.5 (1.3–2.3) | |
| T60 | 7.5 ± 2.2 (5.9–11.3) | 7.4 ± 2.8 (3.8–10.9) | 4.8 ± 2.2 (1.4–7.0) | 2.1 ± 1.0 (1.1–3.7) | 7.2 ± 0.7 (6.2–8.0) | 3.5 ± 0.6 (2.9–4.3) | 0.7 ± 0.2# (0.5–1.0) | 1.8 ± 0.5 (1.2–2.5) | |
| Mean | 7.3 ± 1.6 (5.6–11.3) | 9.3 ± 2.8 (3.8–15.3) | 6.4 ± 2.1 (1.4–9.1) | 2.3 ± 1.1 (1.1–5.7) | 7.6 ± 0.8 (6.2–9.0) | 3.7 ± 0.5 (2.9–4.6) | 0.6 ± 0.2 (0.3–1.0) | 1.8 ± 0.4 (1.2–2.5) | |
| 6 | T0 | 8.5 ± 2.2 (5.3–9.8) | 18.6 ± 3.4 (14.0–22.0) | 12.4 ± 1.8 (10.5–14.7) | 5.0 ± 1.9 (2.2–6.2) | 7.6 ± 0.5 (7.2–8.2) | 3.5 ± 0.3 (3.2–3.7) | 0.5 ± 0.1 (0.4–0.6) | 1.7 ± 0.2 (1.5–1.9) |
| T30 | 7.7 ± 1.7 (6.0–10.1) | 13.6 ± 3.5 (10.7–18.4) | 9.1 ± 4.7 (4.6–15.6) | 3.6 ± 1.3 (2.2–4.8) | 7.2 ± 0.8 (6.0–7.9) | 3.6 ± 0.5 (3.1–4.1) | 0.9 ± 0.3# (0.4–1.2) | 1.6 ± 0.3 (1.1–1.9) | |
| T60 | 8.1 ± 1.5 (6.4–9.8) | 17.4 ± 5.1 (11.2–22.2) | 9.9 ± 4.1 (6.2–14.6) | 5.8 ± 2.7 (3.1–8.2) | 7.4 ± 0.6 (6.6–8.0) | 3.9 ± 0.5 (3.4–4.6) | 0.8 ± 0.3# (0.5–1.1) | 1.8 ± 0.6 (1.2–2.4) | |
| Mean | 8.1 ± 1.7 (5.3–10.1) | 14.7 ± 5.9 (10.7–22.2) | 10.5 ± 3.7 (4.6–15.6) | 4.8 ± 2.1 (2.2–8.2) | 7.4 ± 0.6 (6.0–8.2) | 3.7 ± 0.4 (3.1–4.6) | 0.7 ± 0.3 (0.4–1.2) | 1.7 ± 0.4 (1.1–2.4) | |
| Ref. range | 5.0–10.0a | 12.5–17.5a | 2.5–12.5a | 1.5–7.0a | 5.4–7.8b | 2.6–5.1b | 0.4–0.9b | 2.5–4.1c | |
| anova | ns | *** | *** | *** | * | *** | ns | *** | |
| Tukey HSD test | * | 6 versus 1 | 6 versus 1,3 | 4 versus 2 | 1 versus 2 | 3 versus 5, 6; 4 versus 1, 5, 6 | |||
| ** | 6 versus 3, 5 | 6 versus 2 | 4 versus 1, 3, 5 | 1 versus 3, 4 | 3 versus 1 | ||||
| *** | 4 versus 1, 2, 3, 5 | 4 versus 1, 2, 3, 5 | 6 versus 5 |
T0, first sampling; T30, 30 days after T0; T60, 60 days after T0.
* P < 0.001; **P < 0.01; ***P < 0.05; ns, not significant; #significantly different from T0 (P < 0.05).
a From Jain (1993).
b From Kaneko (1997).
c From Kristensen and Barsanti (1977).
The mean numbers of leucocytes (WBC), neutrophils (PMNs) and lymphocytes recorded in catteries 3 and 5, and the mean α 2 ‐globulin concentration recorded in catteries 4–6 showed significant fluctuations among the different time samplings: total and differential leucocyte counts from cattery 4 showed evident but not significant increases at T30. Moreover, the mean values and the internal ranges calculated on the basis of the results recorded in the three samplings were often strongly different from the reference ranges (Kristensen and Barsanti, 1977; Jain, 1993; Kaneko, 1997) and significant differences among the catteries were detectable. In particular, mean leucocyte number of cats from cattery 4 was higher than the reference range, mean total protein concentration was close to the highest reference limits in all the groups, cats from catteries 4 and 6 had the highest total and differential leucocyte counts and cats from catteries 3 and 4 had the highest total and γ‐globulin concentration.
Furthermore, in all the catteries some cat had at least one change consistent with FIP during the study period, and, except for cattery 1, cats with multiple changes were often detected (Table 3).
Table 3.
Number of cats without symptoms consistent with FIP that showed laboratory changes consistent with FIP compared to the reference ranges
| Cattery | ||||||
|---|---|---|---|---|---|---|
| 1 (n = 5) | 2 (n = 7) | 3 (n = 5) | 4 (n = 5) | 5 (n = 5) | 6 (n = 4) | |
| Anaemia (A) | 0 | 0 | 1 | 1 | 0 | 0 |
| Neutrophilic leukocytosis (N) | 0 | 0 | 1 | 4 | 0 | 2 |
| Lymphopenia (L) | 1 | 1 | 4 | 0 | 1 | 0 |
| Increased total proteins (P) | 1 | 6 | 4 | 2 | 3 | 2 |
| Increased total globulns (G) | 0 | 1 | 2 | 2 | 0 | 0 |
| Increased α 2 ‐globulins (α) | 0 | 2 | 1 | 0 | 1 | 4 |
| Increased γ‐globulins (γ) | 0 | 0 | 1 | 1 | 0 | 0 |
| A + N | 0 | 0 | 0 | 1 | 0 | 0 |
| L + P | 0 | 1 | 0 | 0 | 0 | 0 |
| L + α | 0 | 0 | 0 | 0 | 1 | 0 |
| P + α | 0 | 0 | 0 | 0 | 0 | 1 |
| N + L + P | 0 | 0 | 1 | 0 | 0 | 0 |
| N + P + G | 0 | 0 | 0 | 1 | 0 | 0 |
| N + P + α | 0 | 0 | 0 | 0 | 0 | 1 |
| P + G + α | 0 | 1 | 0 | 0 | 0 | 0 |
| A + L + P + G | 0 | 0 | 1 | 0 | 0 | 0 |
| N + P + G + α | 0 | 0 | 0 | 1 | 0 | 0 |
| L + P + G + α + γ | 0 | 0 | 1 | 0 | 0 | 0 |
Group B
As shown in Table 4, compared with reference ranges, cats with FIP had most of the changes considered highly diagnostic for this disease. Some of these changes, however, were detectable also in cats with diseases other than FIP. In most of the cases, the same laboratory changes were detectable compared with both the reference ranges and the internal ones. In some cats with FIP, however, values that were out of the reference ranges fell into the internal ones (total proteins in cat no. 6, lymphocytes in cat no. 23, WBC in cat nos. 30 and 32, PMNs in cat nos. 30–32). Rarely, values that were within the reference ranges fell out of the internal ones: this occurred in both cats with FIP (erythrocytes, PMNs and α 2‐globulins in cat no. 8, γ‐globulins in cat no. 45) and in cats not affected by FIP (cat no. 9: erythrocytes and α 2‐globulins; cat no.10: PMNs).
Table 4.
Results from the cats with symptoms consistent with FIP
| Cattery | Cat no. | Diagnosis | RBCs × 106/μl | WBCs × 103/μl | PMNs × 103/μl | Lymphs × 103/μl | Tot prot (g/dl) | Tot glob (g/dl) | α 2 ‐Glob (g/dl) | γ ‐Glob (g/dl) |
|---|---|---|---|---|---|---|---|---|---|---|
| Cats with FIP | 6 | FIP | 4.52*§ | 18.90*§ | 17.01*§ | 0.38*§ | 7.83* | 5.22*§ | 1.88*§ | 1.50 |
| 7 | FIP | 4.90*§ | 17.50*§ | 14.70*§ | 1.93 | 5.83 | 3.91 | 1.03*§ | 1.38 | |
| 8 | FIP | 5.88§ | 10.56 | 8.56§ | 1.58 | 10.51*§ | 7.99*§ | 0.70§ | 5.79*§ | |
| 23 | FIP | 5.82 | 1.85 | 0.43 | 1.30* | 9.80*§ | 7.60*§ | 0.41 | 0.63 | |
| 30 | FIP | 6.41 | 20.10* | 17.09* | 0.40*§ | 9.80*§ | 6.55*§ | 1.36*§ | 3.21 | |
| 31 | FIP | 5.52 | 30.20*§ | 25.97* | 2.11 | 12.00*§ | 10.19*§ | 0.86 | 7.66*§ | |
| 32 | FIP | 6.94 | 24.20* | 19.80* | 2.69 | 11.80*§ | 9.42*§ | 1.23*§ | 5.45*§ | |
| 45 | FIP | 4.01*§ | 11.26 | 9.91 | 0.56*§ | 9.00*§ | 6.98*§ | 0.59 | 2.99§ | |
| Cats with diseases | 9 | NSH | 5.33§ | 19.84*§ | 15.54*§ | 1.98 | 7.64 | 4.22 | 0.88§ | 2.89§ |
| other than FIP | 10 | FUO | 8.01 | 9.40 | 8.93§ | 0.37*§ | 7.57 | 3.93 | 1.14*§ | 0.58 |
| 24 | T | 9.51 | 10.05 | 2.41 | 6.97 | 7.00 | 3.47 | 0.63 | 1.73 | |
| 33 | AML | 3.17*§ | 34.45*§ | 29.80*§ | 3.96 | 6.70 | 4.50 | 0.23 | 2.96 | |
| 34 | PC | 8.25 | 6.6 | 5.08 | 0.85*§ | 8.06*§ | 4.40 | 1.24*§ | 1.29 | |
| 40 | FUO | 5.30 | 9.30 | 3.25 | 4.56 | 9.80*§ | 4.32 | 0.47 | 1.81 |
* Values different from the reference range (see Table 2); § values different from the internal range (see Table 2).
NSH, necrotizing and suppurative hepatitis; FUO, fever of unknown origin (most likely because of antibiotic resistant bacteria); T, toxoplasmosis; AML, acute myeloid leukaemia (most likely myelomonocytic); PC, pulmonary carcinoma.
Discussion
The results presented here confirm that laboratory changes consistent with the diagnosis of FIP (anaemia, neutrophilic leucocytosis, lymphopenia, increased total proteins, increased total‐, α 2‐ and γ‐globulins) can be detected also in cats without any clinical symptom or with symptoms not consistent with FIP living in multicat environments.
Moreover, the analysis of repeated samplings allowed detecting significant or evident differences over the time, most frequently associated with outbreaks of infectious diseases (rinoconjunctivitis, upper respiratory infections, gastroenteritis). In these cases, the most evident changes were obviously detectable in symptomatic cats (e.g. anaemia in cat no. 26 after an episode of haemorragic diarrhoea, neutrophilic leucocytosis in cat nos. 21, 22 and 26, which had rhinoconjunctivitis). But also the non‐symptomatic cats of the same cattery had altered parameters. As a consequence, mean values and internal ranges calculated using the lowest and the highest values observed at each sampling, as suggested by Lumdsen (2000) for small groups of animals, were strongly different not only among the catteries but also among the different samplings. In order to reduce the variability because of transient alterations, mean values and internal ranges have been calculated also based on the results recorded during the whole study period. Although this might not be considered statistically correct, it can be the best way to represent the real laboratory profile of cats living in small or medium catteries. The majority of breeding catteries, in fact, are composed by 5–30 animals and have ‘open’ or ‘mixed’ management, because of repeated participation in cat shows and frequent exchange of cats with other catteries. In this situation, it is quite impossible to use a wide statistical approach and to avoid mild to moderate outbreaks of infectious diseases that can induce transient fluctuations of laboratory parameters.
The comparison of mean values obtained in the whole study period allowed to detect that, with the exception of total protein concentration that was in all the catteries close to the highest limit of the reference range, as already reported for colony cats (Kristensen and Barsanti, 1977; Kaneko, 1997), each cattery was characterized by a particular laboratory profile and, as a consequence, by the presence of cats with some parameter out of the reference range. The presence of these changes seems to depend on the characteristic of the cattery rather than on the prevalence of FIP. In fact, the most evident haematological and eletrophoretic changes were detected in catteries 3 and 4, which had a high prevalence of FIP, open management and a poor health condition, while they were rare in cattery 1, which also had a high prevalence of FIP but close management practices and few cases of infectious diseases. The high number of lymphocytes in cattery 6 may depend on the recent appearance of FIP, as lymphoid hyperplasia in cats living with FCoV shedders has been reported (Kipar et al., 1999). These suggestions can be confirmed by the analysis of the number of cats per cattery that had, at least in one sampling, values different from the reference range: also in this case, the number of cats with laboratory changes was low in cattery 1 and high in catteries 3 and 4. The high number of cats with hyperproteinaemia in catteries 2 and 5 might depend on their high percentage of old cats, which are known to have high total protein concentration (Kaneko, 1997). Moreover, all the cats from cattery 6 had increased α 2‐globulins and this might be further support to the hypothesis of a recent contact with the FCoV, as an increase of this electrophoretic fraction has been recorded just after experimental infection with the FCoV, most likely depending on the increase of acute phase proteins (Stoddart et al., 1988). However, it must also be considered that it is very likely to find at least one change compared with a range, when seven parameters are considered for three time‐samplings. For this reason, also the presence of multiple laboratory alterations, that has a high diagnostic value for FIP (Sparkes et al., 1991; Pedersen, 1995), was evaluated. The type of change most frequently observed, however, was very variable among the catteries, most likely depending on the laboratory profile of each cattery. In fact, cats with simultaneous changes were mainly detected in catteries 3 and 4, with electrophoretic changes associated with lymphopenia in cattery 3 and neutrophilia in cattery 4.
All these changes were obviously absent when the results are compared with internal ranges. A possible consequence of using internal ranges would be the lack of ability to identify cats with FIP. The results from cats with symptoms suggestive of FIP indicate that, in the majority of the cases, the range used does not affect the possibility of detecting typical laboratory changes in cats really affected by this disease and to avoid false positive diagnoses in cats with disease other than FIP.
A more objective evaluation could be obtained by calculating sensitivity, specificity and both negative and positive predictive values for each laboratory change. These parameters were not calculated in this study because they have a statistical validity only if calculated on large populations with known prevalence of infection (Jacobson, 1991) and, as previously mentioned, such a situation rarely occurs in breeding catteries. Only in catteries 1, 3 and 4 were both cats with FIP and with other diseases sampled. However, sensitivity and specificity can be interpreted as the possibility to avoid false negative and false positive results, respectively. On this perspective, in some cats with FIP values out of the reference range fell into the internal ones, thus decreasing the sensitivity of these changes (hyperproteinaemia in cattery 1, lymphopenia in cattery 3, neutrophilic leucocytosis in cattery 4). In contrast, the number of cats without FIP with anaemia, neutrophilic leucocytosis and increased α 2‐globulins recorded in cattery 1 was higher compared with the internal ranges than compared with the reference ones. The specificity of these changes thus decreased, but, except for γ‐globulin concentration, their sensitivity increased, as the number of cats with FIP that had these changes compared to internal ranges, was higher than compared to the reference ones.
In conclusion, this study allowed to design laboratory profiles typical of each cattery and confirmed the presence of haematological and electrophoretic changes consistent with FIP in catteries characterized by poor sanitary conditions and open management. In these colonies, the appearance of clinical signs because of diseases other than FIP might lead to wrong diagnoses of FIP. This risk might be avoided by using internal ranges, calculated on the basis of the results of repeated samplings from cats without symptoms consistent with FIP. The use of these internal ranges rarely affects the possibility to correctly diagnose the disease in cats with symptoms suggestive of FIP.
Acknowledgements
This work was supported by a government grant (MURST ex 60%). The authors thank Prof. Giuseppe Sironi, Prof. Margherita Parodi Cammarata, Dr Cristina Crosta and Emiliana Monzani.
References
- Addie, D. D. , and Jarrett O., 1995: Control of feline coronavirus infection in breeding catteries by serotesting, isolation and early weaning. Fel. Pract. 23, 92 – 95. [Google Scholar]
- Addie, D. D. , Dennis J. M., Toth S., Callanan J. J., Reid S., and Jarrett O., 2000: Long‐term impact on a closed household of pet cats of natural infection with feline coronavirus, feline leukaemia virus and feline immunodeficiency virus. Vet. Rec. 146, 419 – 424. [DOI] [PubMed] [Google Scholar]
- Hsu, S. M. , Raine L., and Farger H., 1980: Use of avidin–biotin–peroxidase complex (ABC) in immunoperoxidase techniques: a comparison between ABC and unlabeled antibody (PAP) procedures. J. Histochem. Cytochem. 29, 577 – 580. [DOI] [PubMed] [Google Scholar]
- Jacobson, R. H. , 1991: How well do serodiagnostic tests predict the infection or disease status of cats? J. Am. Vet. Med. Assoc. 199, 1343 – 1347. [PubMed] [Google Scholar]
- Jain, N. C. , 1993: Essentials of Veterinary Hematology. Lea & Febiger, Philadelphia, PA. [Google Scholar]
- Kaneko, J. J. , 1997: Serum proteins and the dysproteinemias In: Kaneko J. J., Harvey J. W., and Bruss M. L. (eds), Clinical biochemistry of Domestic Animals, 5th edn, pp. 117 – 138. Academic Press, San Diego, CA. [Google Scholar]
- Kipar, A. , Bellmann S., Gunn‐Moore D. A., Leukert W., Kohler K., Menger S., and Reinacher M., 1999: Histopathological alterations of lymphatic tissues in cats without feline infectious peritonitis after long term exposure to FIP virus. Vet. Microbiol. 69, 131 – 137. [DOI] [PMC free article] [PubMed] [Google Scholar]
- Kristensen, F. , and Barsanti J., 1977: Analysis of serum proteins in clinically normal pet and colony cats, using agarose electrophoresis. Am. J. Vet. Res. 38, 399 – 402. [PubMed] [Google Scholar]
- Lumsden, J. H. , 2000: Reference values In: Feldmann B., and Jain N. C. (eds), Schalm's Veterinary Hematology, 5th edn, pp. 12 – 15. Lippincot Williams & Wilkins, Philadelphia, PA. [Google Scholar]
- Paltrinieri, S. , Cammarata M. Parodi, and Cammarata G., 1999: In vivo diagnosis of feline infectious peritonitis by comparison of protein content, cytology, and direct immunofluorescence test on peritoneal and pleural effusions. J. Vet. Diagn. Invest. 11, 358 – 361. [DOI] [PubMed] [Google Scholar]
- Pedersen, N. C. , 1995: An overview of feline enteric coronavirus and infectious peritonitis virus infections. Fel. Pract. 23, 7 – 20. [Google Scholar]
- Sparkes, A. H. , Gruffydd‐Jones T. J., and Harbour D. A., 1991: Feline infectious peritonitis: a review of clinicopathological changes in 65 cases, and a critical assessment of their diagnostic value. Vet. Rec. 129, 209 – 212. [DOI] [PubMed] [Google Scholar]
- Stoddart, M. E. , Wicher J. T., and Harbour D. A., 1988: Cats inoculated with feline infectious peritonitis virus exhibit a biphasic acute plasma protein response. Vet. Rec. 123, 621 – 624. [PubMed] [Google Scholar]
- Vennema, H. , Poland A., Floyd K. Hawkins, and Pedersen N. C., 1995: A comparison of the genomes of FECVs and FIPVs: what they tell us about relationship between feline coronaviruses and their evolution. Vet. Rec. 23, 40 – 44. [Google Scholar]