

Scientific Oral Abstract Plenary Session
P1‐A03A
IgG Subtype Determines Suppressive Vs. Enhancing Effects of Anti‐RBC Antibodies through Fc Receptors in a Murine Model of Antibody Mediated Immune Regulation
Hayley Waterman1, Ariel M Hay1, Heather Howie1, Jenna Lebedev1, Meghan Delaney2, Krystalyn E Hudson1, Amanda L Richards1, Xiaohong Wang1 and James C Zimring*1
1BloodworksNW Research Institute, 2Bloodworks NW
Background/Case Studies: 19 different monoclonal anti‐D reagents have been tested in humans, but have not shown equivalent efficacy as donor derived polyclonal anti‐D. In addition, some monoclonal anti‐D results in a paradoxical enhancement of alloimmunization, an effect also seen with donor derived anti‐D in some cases. K1 transgenic mice express the human K1 RBC alloantigen selectively on RBCs. Wild‐type mice become alloimmunized to K1 RBCs, when exposed through either transfusion or pregnancy, the latter leading to HDFN. Analogous to anti‐D in humans, polyclonal mouse serum derived anti‐K1 prevents alloimmunization. Thus, the K1 mouse serves as a model of antibody mediated immune regulation of alloimmunization.
Study Design/Methods: IgG subtype was isolated as an independent variable by engineering a panel of IgG subtype switch variants for a monoclonal anti‐K1. Monoclonal anti‐K1 was isolated for each murine IgG subtype (IgG1, IgG2a, IgG2b, IgG2c and IgG3) and each with the same antigen‐binding domain. The effects of IgG subtype on clearance and alloimmunization to transfused K1 RBCs was tested. The role of FcgRIIb (the inhibitory FcgR in mice and humans) was tested using FcgRIIb KO mice. The role of activating FcgRs (aFcgR) was tested using a novel conditional knockout mouse (Con‐FcgR) where the common gamma chain (required for expression of all murine aFcgRs) is deleted upon exposure to CRE recombinase.
Results/Findings: Significant clearance of K1+ RBCs was observed with IgG1, IgG2a, and IgG2c, but not IgG2b or IgG3. IgG1 and IgG3 significantly decrease, whereas IgG2a, IgG2b, and IgG2c increased anti‐K1 alloimmunization. IgG1 and IgG2c were further studied, as examples of suppressing and enhancing antibodies. In FcgRIIb KO mice, clearance was unaffected, suppression by IgG1 was eliminated, and enhancement by IgG2a was not altered. When aFcgRs were deleted in all tissues, no clearance was observed with either subtype, enhancement by IgG2c was eliminated, and suppression by IgG1 was unaffected. Tissue specific deletion of aFcgRs demonstrated that aFcgR expression on dendritic cells (DCs) [and not macrophages] was required for enhancement by IgG2c.
Conclusion: Similar to what is observed in humans, some monoclonal anti‐RBC antibodies prevented alloimmunization whereas others enhanced. IgG subtype determined inhibition vs. enhancement. Inhibition by IgG1 functions through an FcgRIIb dependent mechanism. Also, lack of clearance but maintenance of suppression by IgG1 in mice lacking aFcgRs indicates clearance is not required for suppression, a finding consistent with data from other murine and some human studies. Enhancement by IgG2a requires expression of aFcgRs by DCs. Follow up studies will be required to see if these findings translate into humans.
P2‐A03A
Endothelial Expression of MHC Class I Is Necessary for Transfusion‐Related Acute Lung Injury
Nicholas Kwaan1, Benat Mallavia1, Craig N Morrell2, James C Zimring3 and Mark R Looney*1
1UCSF, 2University of Rochester, 3BloodworksNW Research Institute
Background/Case Studies: Transfusion‐related acute lung injury (TRALI) remains the most common cause of death from blood transfusion therapy. A mouse model of TRALI relies on the administration of a MHC Class I (MHC I) monoclonal antibody (mAb) to mice with cognate MHC I antigen; however, the critical site(s) of cognate antigen expression have not been elucidated. We hypothesized that endothelial expression of MHC I is necessary for the development of TRALI.
Study Design/Method: Conditional MHC I knockout mice on the C57Bl/6 background were generated by crossing floxed beta2 microglobulin mice (B2mFlox) to a congenic H‐2Kd expressing C57Bl/6 mouse (C‐H2d) and to cell‐specific Cre strains to delete MHC I in myeloid cells (LysM‐Cre), endothelial cells (VECadherin‐CreERT2) and platelets (PF4‐Cre). TRALI was modeled by the injection of a MHC I mAb (H‐2Kd; 34‐1‐2S) into LPS‐primed mice (0.1 mg/kg, i.p.). Lung injury was measured using extravascular lung water and lung vascular permeability to 125I‐labelled albumin. To measure the endothelial expression of MHC I within the lung, the left lung was removed for MHC I quantification using flow cytometry. One week after pneumonectomy, these mice were challenged with the TRALI model.
Results/Finding: C‐H2d mice are susceptible to TRALI with no significance difference in excess lung water (109 vs. 87 µl, p=NS) and lung vascular permeability (135 vs. 102 µl, p=NS) compared to BALB/c wild‐type controls. C‐H2d x B2mFlox x PF4‐Cre mice that lack MHC I expression on platelets are fully susceptible to TRALI and show no significant difference in excess lung water (88 vs. 81 µl, p=NS), lung vascular permeability (114 vs. 101 µl, p=NS), lung neutrophil‐platelet aggregate formation (2.9 vs. 2.6%, p=NS) or survival at 2 hours (71 vs. 58%, p=NS by log‐rank test) compared to C‐H2d x B2mFlox controls. C‐H2d x B2mFlox x VECadherinCreERT2 mice have reduced MHC I expression on lung endothelial cells after neonatal tamoxifen administration (MFI reduction 43 +/‐ 17%, p=0.04 vs. C‐H2d x B2mFlox control). With TRALI challenge, Tamoxifen‐treated C‐H2d x B2mFlox x VECadherinCreERT2 mice with low‐to‐intermediate expression of MHC I have a significant reduction in excess lung water (49 vs. 89 µl, p=0.01) and lung vascular permeability (31 vs. 63 µl, p=0.04) compared to controls with high levels of MHC I expression. C‐H2d x B2mFlox x LysMCremice lack MHC I expression on neutrophils and experiments on susceptibility to TRALI are ongoing.
Conclusion: TRALI results from cognate antibody recognition of endothelial MHC I. The vast endothelial surface area of the lung and the first‐pass of transfused blood products through the lung may explain the pulmonary‐restricted organ injury after transfused cognate antibody.
P3‐A03A
Transfusion with Cold Stored Platelets in Patients Undergoing Complex Cardiothoracic Surgery with Cardiopulmonary Bypass Circulation: Effect on Bleeding and Thromboembolic Risk
Torunn Oveland Apelseth*1,2, Einar Klæboe Kristoffersen2,3, Venny Lise Kvalheim3,4, Christopher Kalhagen Bjerkvig5,6, Theodor Kaurin Fosse5,6, Tor Audun Hervig2,3, Andrew P Cap7, Rune Haaverstad3,4, Turid Helen Felli Lunde2, Hanne Braathen2, Joar Sivertsen2 and Geir Strandenes2,8
1Laboratory of Clinical Biochemistry, Haukeland University Hospital, 2Department of Immunology and Transfusion Medicine, Haukeland University Hospital, 3School of Medicine and Dentistry, University of Bergen, 4Section of Cardiothoracic Surgery, Department of Hearth Disease, Haukeland University Hospital, 5Department of Anaesthesia and Intensive Care, Haukeland University Hospital, 6Norwegian Naval Special Operations Commando, 7U.S. Army Institute of Surgical Research, 8Norwegian Armed Forces Medical Services
Background/Case Studies: Storage at 4oC shortens the circulation time of platelets, but previous experience indicates better hemostatic function. A randomized clinical pilot study is performed investigating the efficacy and safety of cold stored platelets in treatment of bleeding in patients undergoing complex cardiothoracic surgery with cardiopulmonary bypass circulation. The study is a joint effort by Civilian and Military Health Care Services.
Study Design/Method: A two‐armed randomized clinical pilot study is designed to evaluate leukoreduced apheresis platelets in PAS stored cold (4 degrees Celcius) for up to 7 days under constant agitation (4CPLT) against standard room temperature storage (RTPLT). Patients are enrolled prior to surgery and we aim to include a minimum of 20 transfused patients in each study arm. We report on postoperative bleeding, total blood usage, and laboratory measures of coagulation and blood cell counts within day 1 after surgery in addition to thromboembolic events during hospital stay for up to 28 days. Statistical analyzes are performed by Independent samples T‐test and Chi‐Square test (SPSS version 23.0), and results presented as mean ± SEM.
Results/Finding: By 3rd of April 2017, 17 patients have received 4CPLT vs. 22 RTPLT. There are no significant differences in age, gender, weight, BMI, Cardiac Bypass Time, EuroSCORE, or EF between the two groups. Significantly lower volume of postoperative bleeding is observed in patients receiving cold stored platelets (chest drain output after chest closure: 546 ml ± 61 (4CPLT) vs. 820 ml ± 109 (RTPLT)). Thromboembolic events are observed in 3 of 17 (18%) 4CPLT patients and 7 of 22 (31%) of RTPLT, but no significant difference is observed between the two groups. No differences are observed in measures of coagulation prior to surgery, immediately after heparin reversal, and the morning after surgery; INR (4CPLT: 1.3 ± 0.1→1.5 ± 0.1→1.3 ± 0.1 vs. RTPLT: 1.2 ± 0.1→1.4 ± 0.0→1.2 ± 0.0), APTT (sec) (4CPLT: 40 ± 2→43 ± 2→40 ± 2 vs. RTPLT: 40 ± 1→44 ± 2→39 ± 1), fibrinogen (g/L) (4CPLT: 3.8 ± 0.3→2.6 ± 0.2→3.8 ± 0.2 vs. RTPLT: 3.9 ± 0.3→2.6 ± 0.2→3.7 ± 0.1). Similarly, no significant differences are observed in platelet count (x 109/L) (4CPLT: 219 ± 20→114 ± 10→136 ± 16 vs. RTPLT 232 ± 25→110 ± 13→154 ± 17) or hemoglobin (g/dL) (4CPLT: 11.3 ± 0.3→8.8 ± 0.3→9.4 ± 0.3 vs. RTPLT: 12.0 ± 0.4→9.4 ± 0.3→9.7 ± 0.2). Blood usage is similar in the two groups: Platelets 2.1 ± 0.1 (4CPLT) vs. 2.3 ± 0.2 (RTPLT), red blood cells 4.2 ± 0.7 (4CPLT) vs. 4.7 ± 1.0 (RTPLT), and SD pooled plasma 7.7 ± 1.0 (4CPLT) vs. 9.5 ± 1.0 (RTPLT).
Conclusion: Preliminary data from 39 patients indicate that transfusion of cold stored leukoreduced apheresis platelets in PAS is effective in treatment of bleeding in patients undergoing complex cardiothoracic surgery, and that cold stored platelets present no higher risk of thromboembolic events. Larger studies are recommended to explore the use of cold stored platelet transfusion in critical bleeding.
P4‐A03A
Danish Decision to Discontinue NAT Screening: Residual Risk Estimates for Transfusion Transmitted Viral Infections with and without NAT
Leen Baudewijn*1 and Jorgen Georgsen2
1Odense University Hospital, KIA, 2Odense University Hospital
Background/Case Studies: Increasingly sensitive screening assays for transfusion transmitted infections have been developed and mandatorily implemented in most developed countries. Currently, no technology exists to guarantee zero risk blood products. In Denmark, individual donation (ID) nucleic acid testing (NAT) was by legislation added to the serological based screening assays for HIV, HBV and HCV in 2009, after a case of transfusion transmitted HIV infection. The Danish government decided to change the legislation and discontinue the funding for ID NAT screening from July 2017. Instead, anti‐HBc screening was added to the mandatory serological screening assays for repeat donors.
Study Design/Method: The incidence/window model was used to estimate the residual risk of transfusion transmitted viral infections. Incidence rates were estimated for blood and plasma donations from repeat donors in Denmark from 2006 to 2016, based on the number of reactive donations (positive tests) following a negative donation. Residual risk was estimated as the incidence rate multiplied by the average window period for HIV, HBV and HCV with and without ID NAT testing.
Results/Finding: 3.5 million donations were screened from 2006 to 2016. The average donation frequency is approx. 2 donations per year. The residual risk estimates (RR) per donation with and without ID NAT and the fold reduction of RR since the implementation of ID NAT testing are summarized in the table.
| RR without ID NAT | RR with ID NAT | Ratio | |
|---|---|---|---|
| HIV | 1 in 3,647,888 | 1 in 16,436,213 | 4.5 |
| HBV | 1 in 3,352,628 | 1 in 6,806,407 | 2 |
| HCV | 1 in 1,573,213 | 1 in 50,429,289 | 32 |
In addition, we observed 14 NAT only cases (NAT reactive/seronegative) among repeat donors including 1 acute HCV infection and 13 chronic HBV infections without detectable HBsAg, so‐called occult hepatitis B infection (OBI). In the table the effect of future anti‐HBc testing was not taken into account but this measure will result in a RR for HBV between the two values in the table.
Conclusion: In Northern Europe, the risk for transfusion transmitted viral infections is low. With the current Danish transfusion rates (RBC 35/1,000) and a population of 5.8 mio., the removal of the ID NAT testing results in an estimated increase in the risk for transfusion transmitted HIV from one in 80 years to one in 18 years, HBV from one in 34 years to one in 17 years and HCV from on in 250 years to one in 8 years. This increase in the risk for transfusion transmitted infections seems to have been acceptable for the majority in the national parliament.
P5‐A03A
Zika RNA Persistence in Blood and Body Fluids and Clinical Outcomes in Infected Blood Donors
Mars Stone*1, Sonia Bakkour1, Tzong‐Hae Lee1, Marion Lanteri1, Graham Simmons1, Don Brambilla2, Jose Orlando Alsina3, Phillip C Williamson4, Rita A Reik5, Susan A Galel6, Jeff Linnen7, Steve Kleinman8, Michael Paul Busch1 and for the NHLBI Recipient Epidemiology and Donor Evaluation Study‐III (REDS‐III)9
1Blood Systems Research Institute, 2RTI International, 3Banco de Sangre de Servicios Mutuos, 4Creative Testing Solutions, 5OneBlood, Inc., 6Roche Molecular Systems, Inc., 7Hologic, 8University of British Columbia, 9NHLBI
Background/Case Studies: Zika virus (ZIKV) is associated with severe neurological consequences in fetuses and adults and potential for transfusion transmission (TT). RNA persistence has been reported in whole blood (WB) long after clearance of viremia in plasma, raising concerns over the risk of TT with plasma based nucleic‐acid amplification testing (NAT). The dynamics of ZIKV persistence in asymptomatic infection are not well understood and are needed for understanding of the natural history of ZIKV infection. We sought to characterize the dynamics of infection through prospective enrollment of ZIKV RNA+ blood donors.
Study Design/Method: Donors identified through investigational ZIKV NAT screening were enrolled into longitudinal follow up and assessed for viral and serological persistence and clinical outcomes. Plasma and RBC were obtained from index donations and blood, urine, saliva and semen samples were collected prospectively at weeks 1, 3, 6, 12 and 24 following index donations from 50 donors and detailed symptom questionnaires were administered at each study visit. Blood compartments and body fluids were tested for Zika RNA by real time RT‐PCR. Plasma samples were tested for Zika specific IgM and IgG antibodies
Results/Finding: The percent of ZIKV RNA+ samples, followed by the number of samples tested in parenthesis, for each sample type during each sampling interval is summarized in the table. Plasma viremia declined rapidly after index donations whereas RBC‐ and WB‐associated viral RNA persisted for up to 3 months and peripheral blood mononuclear cell (PBMC) associated virus was detected intermittently at low levels and waning by 3 months. Urine and saliva detection decreased significantly after 2 weeks and was undetectable by 3 months. Of donors who were enrolled in the acute pre‐seroconversion stage of infection 65% (15/23) developed multiple ZIKV related symptoms 1 week post index donation, compared to only 30% (7/27) for donors detected post‐seroconversion.
TABLE 1. P5‐A03A
| Interval (days) | Plasma | RBC | WB | PBMC | Urine | Saliva |
|---|---|---|---|---|---|---|
| 4‐13 | 24.4 (41) | 75.6 (41) | 70.6 (34) | 30.8 (39) | 59.0 (39) | 48.7 (37) |
| 14‐28 | 6.5 (46) | 69.8 (43) | 60.5 (43) | 11.6 (43) | 9.3 (43) | 9.8 (37) |
| 29‐56 | 2.6 (38) | 59.5 (37) | 44.7 (38) | 12.8 (39) | 2.6 (39) | 8.6 (35) |
| 57‐120 | 0 (35) | 38.2 (34) | 40.0 (35) | 5.7 (35) | 0 (35) | 0 (32) |
| 121‐196 | 0 (18) | 0 (18) | 5.6 (18) | 5.9 (17) | 0 (18) | 0 (18) |
Conclusion: ZIKV RNA persists in cellular blood compartments for several months following clearance from plasma and body fluids, with higher rates of symptoms than previously reported. The persistence of Zika RNA in RBCs has unknown implications for blood screening, which currently relies on plasma testing; infectivity studies are in progress. WB testing may be of value to extend detection of acute infection and for diagnostics and monitoring of pregnant women.
P6‐A03A
Iron Status and Novel Risk Factors for Iron Depletion in a Diverse Donor Population
Bryan R. Spencer*1, Yuelong Guo2, Ritchard G. Cable3, Joseph E. Kiss4, Michael Paul Busch5, Grier Page2, Stacy Endres‐Dighe2, Steve Kleinman6, Simone Glynn7, Alan Mast8 and for the NHLBI Recipient Epidemiology and Donor Evaluation Study‐III (REDS‐III)9
1American Red Cross, 2RTI International, 3American Red Cross Blood Services, 4Blood Systems Inc., 5Blood Systems Research Institute, 6University of British Columbia, 7NIH/NHLBI, 8Blood Research Institute, 9NHLBI
Background/Case Studies: Blood centers and regulators in the United States (US) are evaluating strategies for minimizing iron depletion in blood donors. The logistics of donor management might differ across blood centers, but the optimal approach may also vary according to biological or behavioral differences across sub‐populations of donors. Studies in US donors have been conducted in predominantly Caucasian populations, which may differ from racial/ethnic minority donors in iron metabolism and capacity to undergo repeat phlebotomy.
Study Design/Method: Over 12,600 donors were enrolled from 4 US blood centers for ferritin testing. The study population was enriched for racial minorities [1600 African‐American (AA), 1600 Asian (As), 1000 Hispanic (Hisp)] and for “Super Donors” (1600, who had completed 10+ donations in two years without low hemoglobin deferral). The minority donors and the remaining 6800 non‐Hispanic White (NHW) donors were an unselected population with no specific eligibility criteria. Subjects completed questionnaires on risk factors for iron depletion. Logistic regression was used to identify demographic and behavioral predictors of Absent Iron Stores (AIS, ferritin <12 ng/ml) and Low Ferritin (LF, ferritin <26 ng/ml).
Results/Findings: Across all subjects, 19% had AIS and 42% had LF, with a high degree of variability based on demographic factors and donation behavior. In models stratified by race, expected patterns common to all 4 groups included a sharp increase in risk with increasing donation intensity, and a large decrement in risk for females > 50 years old. In models including all subjects, race was an independent predictor of both AIS and LF controlling for age, sex, body weight, donation frequency, and other factors (Table). AA and As donors showed ≈20% decreased risk for AIS compared to NHW, while Hisp donors had 25% higher risk. Daily use of exogenous iron reduced risk for LF and AIS by 30 to 40%, respectively, while the estimated benefit from less‐ than‐daily use was lower (5 to 19% protection). Regular use of antacids was associated with a 20% or greater increment to risk. Reported use of hormone supplements showed opposing effects in males and females. Use of oral contraceptives or estrogen in females reduced risk by ≈15‐20%, while males who reported current use of supplemental testosterone had twice the estimated risk for AIS.
Conclusion: This large study confirms the high prevalence of LF and AIS in US donors and the principal risk factors of age, sex, and donation frequency. The diverse population studied and the questionnaire data from donors identify additional demographic and behavioral risk factors of secondary importance. In developing iron mitigation strategies, practices based on age and gender could be further refined depending on a given blood center's operational context and donor population.

Basic Science Oral Abstract Session: Immunobiology of Response to RBC Antigens
B1‐A01A
Cross‐Presentation of Red Cell Antigen Requires Batf3‐Dependent Conventional Dendritic Cells
Amy Tang1, Steven Spitalnik1, Eldad A. Hod2 and Stuart Weisberg*3
1Columbia University, 2Columbia University Medical Center, 3New York Blood Center
Background/Case Studies: Transfused donor antigens are consumed by recipient antigen presenting cells for processing into peptides, which are then presented in recipient MHC class I to recipient CD8 T cells ‐ a process called ‘cross‐presentation.’ Red blood cell (RBC) antigens are efficiently cross‐presented after transfusion; however this process is poorly understood. RBC antigen cross‐presentation was linked to the development of cytotoxic T cell responses capable of bone marrow graft rejection as well as to the induction of immunological tolerance capable of ameliorating autoimmunity. A subset of conventional dendritic cells, cDC1s (XCR1+), consume transfused RBCs and are functionally specialized for efficient cross‐presentation. We used a mouse model of selective cDC1 deficiency to determine whether cDC1s are required for cross‐presenting RBC restricted antigens in vivo.
Study Design/Methods: Mice genetically deficient in the Basic Leucine Zipper ATF‐Like Transcription Factor 3 (BATF3) have selective deficiency of cDC1s. In an in vivo cross‐presentation assay, OVA‐expressing RBCs from transgenic HOD mice (selective RBC expression of surface hen egg lysozyme, Ovalbumin, and Duffy antigens) were the transfused antigen source and naïve OT‐1 CD8 T cells, which express a MHC class I restricted OVA‐specific TCR transgene, were the responders. Magnetically‐selected CD8+ OT‐1 cells labeled with Cell Trace Far Red (CTFR) were adoptively transferred into MHC identical (i.e., H‐2Kb) wild type (C57BL6/J) and Batf3null recipient mice. After 24 hours, these mice were transfused with HOD blood. After 3 days, splenic OT‐1 T cells were analyzed for proliferation (by CTFR dye dilution) and activation (by CD44, CD62L, and CD122 expression).
Results/Findings: HOD blood transfusion into wild type mice induced dose dependent proliferation of naïve OT‐1 T cells, as compared to transfusion of RBC‐lysed HOD blood. T cell proliferation was associated with up‐regulation of CD44 and CD122 but not down‐regulation of CD62L. OT‐1 T cell proliferation in response to HOD RBC transfusion was dramatically decreased in Batf3null mice compared to wild types (Table 1).
Conclusion: Consistent with other reports, a RBC restricted antigen is efficiently cross‐presented in vivo after transfusion. Antigen‐specific proliferated CD8 T cells partially acquired effector T cell characteristics with up‐regulation of CD44 and CD122, but they distinctly failed to down‐regulate CD62L. Cross‐presentation of RBC restricted antigen required Batf3‐dependent cDC1 cells. Thus cDC1s are a potentially important link between transfused RBC antigen and the cellular immune response. This may have important implications for understanding RBC‐induced immune modulation.
TABLE 1. B1‐A01A
| Genotype, transfusion (n=2) | % divided | CD44 (MFI divided / MFI non‐divided) | CD122 (MFI divided / MFI non‐divided) | CD62L (MFI divided / MFI non‐divided) |
|---|---|---|---|---|
| Batf3 +/+, 200uL HOD RBCs | 75.7 (±3.8) | 4.9 (±0.32) | 3.5 (±0.039) | 1.1 (±0.091) |
| Batf3 +/+, 100uL HOD RBCs | 61.1 (±1.3)* | 6.0 (±1.0) | 3.5 (±0.23) | 1.1 (±0.067) |
| Batf3 +/+, 50uL HOD RBCs | 51.1 (±5.1)* | 5.8 (±0.86) | 3.6 (±0.25) | 1.1 (±0.067) |
| Batf3 +/+, 200uL RBC lysed HOD | 21.1 (±5.8)* | 4.9 (±0.36) | 4.0 (±0.47) | 0.87 (±0.22) |
| Batf3 ‐/‐, 200uL HOD RBCs | 13.4 (±10.7)* | 6.7 (±0.012) | 2.7 (±0.043) | 1.0 (±0.14) |
Data are reported as mean (±SD)
* P < 0.05 compared to Batf3+/+, 200uL HOD RBCs
MFI, median fluorescence intensity
B2‐A01A
Erythrocyte Saturation with IgG Was a Key Factor for Inducing Antibody‐Mediated Immune Suppression to Erythrocyte Alloimmunization and Impacted Both Erythrocyte Clearance and Erythrocyte Antigen Modulation
Yoelys Cruz‐Leal*1, Danielle Marjoram1,2 and Alan Lazarus1,2,3
1Department of Laboratory Medicine and the Keenan Research Centre in the Li Ka Shing Knowledge Institute of St. Michael's Hospital, 2Department of Medicine and Laboratory Medicine and Pathobiology, University of Toronto, 3The Canadian Blood Services Centre for Innovation
Background/Case Studies: Anti‐D has been used to prevent hemolytic disease of the fetus and newborn and this mechanism has been referred to as antibody‐mediated immune suppression (AMIS). None of the monoclonal antibodies developed have been as effective as anti‐D. Recent studies have demonstrated that blends of monoclonal antibodies targeting different epitopes induce complete AMIS. In the present work, we performed a dose‐response analysis to explore the impact of erythrocyte sensitization on erythrocyte clearance and antigen modulation in the induction of AMIS effects.
Study Design/Methods: Mice were transfused with murine transgenic red blood cells (RBCs) expressing the HOD antigen (hen egg lysozyme, in sequence with ovalbumin (OVA) and the human Duffy transmembrane protein) in the presence of serial doses of OVA‐specific polyclonal IgG. HEL‐specific antibody production was evaluated by ELISA. To evaluate erythrocyte clearance and antigen modulation mice were immunized with HOD‐RBC labeled with the fluorescent dye PKH26, followed by a selected dose of anti‐OVA IgG 24 hours later. The percentage of HOD‐RBC remaining in circulation and HOD antigen levels on the surviving RBC were assessed by flow cytometry. Pearson's coefficients were calculated to determine associations between alloimmunization and erythrocyte clearance and antigen modulation.
Results/Findings: AMIS was only evident when erythrocytes appeared to be saturated with IgG. In contrast, attaining the maximal percent‐positive cell level was not sufficient to explain AMIS activity. High quantities of the OVA‐specific IgG induced both significant clearance of HOD‐RBCs (80%) as well as a significant reduction of surface detectable HOD antigen on the RBCs (antigen modulation). However, intermediate quantities of OVA‐specific IgG induced partial HOD‐RBCs clearance (50%) and significant HOD antigen modulation. In contrast, a low dose of anti‐OVA IgG did not induce either clearance or antigen modulation. Interestingly, the ability of selected doses of antibody to induce AMIS was better correlated with antigen modulation than erythrocyte clearance.
Conclusion: The AMIS IgG used in this study demonstrated a better correlation with antigen modulation than RBC clearance and the level of erythrocyte IgG saturation was a key factor to predict AMIS activity in this model. These findings may help explain the superiority of polyclonal antibodies to monoclonal therapeutics for AMIS induction.
B3‐A01A
Exploration of the Parameters Responsible for the Rapid Red Blood Cells Clearance in a Murine Model of Transfusion
Alexandre Morel1, Michaël Dussiot1, Anaïs Martinez1, Martin Colard1, Mickaël Marin2, Camille Roussel2, Alioune NDour2, Caroline Le Van Kim2, Pierre Buffet2, Olivier Hermine1 and Pascal Amireault*3
1INSERM U1163, Institut Imagine, 2INSERM UMR‐S 1134, Institut National de la Transfusion Sanguine, 3INSERM U1163, Institut Imagine and Institut National de la Transfusion Sanguine
Background/Case Studies: During storage, red blood cells (RBCs) undergo multiple morphological, biochemical and molecular modifications, collectively called the storage lesion. The proportion of cleared RBCs is correlated with storage duration, which may be responsible for the rapid clearance of up to 25% of transfused RBCs, reducing transfusion yield. It has been shown, using imaging flow cytometry that a subpopulation of morphologically altered RBCs accumulates during storage. The reduced surface area of these small RBCs (sRBCs) suggests their rapid elimination by the spleen in the hours following transfusion. This hypothesis remains to be clarified, since the physiological mechanisms of RBC clearance remain to be precisely identified.
Study Design/Method: Murine “young” and “old” RBCs (respectively on D1 and D14 of storage) were transfused into different models including splenectomized or macrophage‐depleted mice. Flow cytometry was used to determine the kinetics of clearance, the transfusion yield and to quantify RBCs retention in organs. The accumulation, during storage, and the post‐transfusion disappearance of sRBCs were analyzed by imaging flow cytometry.
Results/Finding: Using a murine model of transfusion, we confirmed that the post‐transfusion yield decreases with storage duration (62% on D14 vs 100% on D1 of storage). A clearance of the storage‐damaged RBCs mediated by spleen and macrophages is shown by significant improvements in post‐transfusion yield observed in the splenectomized (74%) and macrophage‐depleted (79%) groups. As in humans, we observed the accumulation of a subpopulation of small RBCs (mouse small RBC: msRBC) of reduced projected surface area with altered morphology. These msRBCs disappear rapidly from the circulation in control or splenectomized mice with a decrease of more than 50% at 2h post‐transfusion. In contrast, in macrophage‐depleted mice, msRBCs are kept in circulation at 2h post‐transfusion. At 24h, these msRBCs completely disappear in all models, suggesting the importance of their elimination and the presence of compensation clearance mechanisms.
In control mice, storage‐damaged RBCs are mostly retained in the spleen but also in the bone marrow (BM). No retention is observed in the liver, kidney or lung. In macrophage‐depleted mice, retention is decreased in the spleen and BM. Conversely, elevated retention is observed in the BM of splenectomized mice, associated with a transient retention in the kidney and liver.
Conclusion: During storage of murine RBCs, damaged RBCs accumulate, and are eliminated following transfusion via spleen/macrophage‐mediated mechanisms. They include, as observed in humans, a subpopulation of small RBCs which undergoes a rapid macrophage‐mediated clearance. The increase in transfusion yield in the absence of spleen or macrophages suggests that the recipient's functional state is one of its determining factors.
B4‐A01A
Age Dependent Relapsing and Remitting Autoimmune Hemolytic Anemia in a Murine Model
Andrea Sut Ling Wong*1, Amanda L Richards2 and Krystalyn E Hudson2
1Bloodworks Northwest Research Institute, 2BloodworksNW Research Institute
Background/Case Studies: Breakdown of tolerance to RBC antigens may result in development of pathogenic autoantibodies (autoAb) and lead to autoimmune hemolytic anemia (AIHA), a severe and sometimes fatal disease. AIHA in humans has a number of known features, including increased frequency with age, and tendency to relapse and remit. However, the mechanisms behind such observations are not understood. To gain insight into tolerance (or loss thereof) to an RBC autoantigen, we utilized the HOD mouse, which expresses an RBC‐specific triple fusion protein consisting of hen egg lysosyme (HEL), ovalbumin (OVA), and, Duffy (HOD). HOD mice were bred to a transgenic mouse that expresses a T cell receptor specific for an OVA peptide in HOD presented by MHCII (OTII mice). Thus, HOD+OTII+ mice are predisposed to have autoreactive CD4+ T cells.
Study Design/Method: Four cohorts of HODxOTII F1 mice (16‐48 mice/cohort) were bled monthly for 15 months to assess for autoAb production. Peripheral RBCs were stained with anti‐complement (C3) and mouse immunoglobulin Ab. Spleens were weighed and splenocytes were stained with anti‐CD71 and TER119 to assess for the presence of RBC progenitors. Statistical analysis between HOD+OTII+autoAb+ vs. HOD+OTII+autoAb‐ vs. HOD‐OTII+ was performed using Kruskal‐Wallis test and corrected for multiple testing with Dunn's test.
Results/Finding: OTII CD4+ T cells were not deleted in the thymus of HOD+OTII+ mice; rather, they matured to the periphery. Despite these peripheral autoreactive T cells, no detectable autoAb were observed in HOD+OTII+. However, as they aged, 15‐50% of HOD+OTII+ were positive for RBC autoAb by 6 months. Thereafter, ∼50% of the autoAb+ mice stopped producing autoAb within two months after onset and remained autoAb free throughout the study. In 3 of the 4 cohorts, 60‐100% of autoAb+ mice were female. HOD+OTII+autoAb+ mice also had enlarged spleens compared to HOD+OTII+autoAb‐ and HOD‐OTII+ mice (0.42g vs. 0.21g and 0.14g, resp., p<0.04). This may due to RBC consumption, extramedullary erythropoiesis, or both. Consistent with increased erythropoiesis, elevated numbers of RBC progenitors (CD71hiTer119inter) were observed in the spleens of HOD+OTII+autoAb+ mice but not in HOD+OTII+autoAb‐ and HOD‐OTII+ (2.86% vs. 0.06% and 0.05% resp., p<0.03). Moreover, autoAb and C3 deposition were found (0.1‐2% and 3‐10%, resp.) on Ter119+ RBCs in all of the HOD+OTII+autoAb+ mice analyzed.
Conclusion: Several features known to exist in human AIHA were observed, including age‐dependant autoAb production, relapsing of autoimmunity after onset, and an increased frequency in females. This model may serve as an experimental system to investigate the mechanisms of AIHA.
B5‐A01A
Reduction in Neutrophil Numbers Is a Risk Factor for RBC Alloimmunization
Amanda L Richards1, Christopher A Tormey2 and Krystalyn E Hudson*1
1BloodworksNW Research Institute, 2Yale‐New Haven Hospital
Background/Case Studies: Red blood cell (RBC) alloimmunization occurs in up to 10% of transfusion recipients (excluding ABO and RhD). The underlying factors that influence alloimmunization are poorly understood; thus, there is currently no reliable way to predict who will make an alloantibody and who will not. Patients who receive multiple RBC units or several separate transfusions are at higher risk of alloimmunization; likewise, certain disease states have higher rates of alloimmunization, such as myelodysplasctic syndrome (MDS) and sickle cell disease patients. However, despite chronic transfusions, some patients never develop RBC alloantibodies. It has been recently reported that poly (I:C)‐elicited inflammation leads to enhanced alloimmunization rates and is correlated with increased splenic neutrophil (PMN) numbers. Additionally, RBC transfusion into an inflamed recipient leads to enhanced erythrophagocytosis by PMNs. Here, we test the hypothesis that PMNs regulate RBC alloantibody generation.
Study Design/Method: Mice: C57Bl/6 (B6) mice were treated with PBS, or anti‐Ly6G to deplete PMNs, followed by poly (I:C) to elicit inflammation, and finally a transfusion of allogeneic DiO‐labeled RBCs expressing a synthetic antigen, HOD (HEL‐OVA‐Duffy). Multiple splenic cellular subsets were evaluated for DiO fluorescence, an indirect measure of RBC consumption, at 18‐24 hours post‐transfusion. Anti‐HOD alloantibody generation was assessed 14 days post‐transfusion by flow cytometry. Humans:Retrospectively, mean white blood cell (WBC) and PMN counts were collected on chronically transfused MDS patients at VA Connecticut Healthcare. For alloimmunized patients (n=5), WBC and PMN counts were assessed on the day of exposure to the alloimmunizing RBC unit, whereas counts were averaged for the entirety of RBC therapy for non‐alloimmunized patients (n=5). Patients were matched for numbers of RBC transfusions.
Results/Finding: Mice: The MFI of anti‐HOD antibodies was significantly increased in PMN‐depleted mice, compared to controls (3/3 experiments, p<0.01). While many control mice made no alloantibody (non‐responders), all PMN‐depleted mice made detectable anti‐HOD. PMN depletion also led to a significant reduction in DiO+ leukocytes, suggesting a lack of compensatory mechanism(s) for RBC consumption. Absence of PMNs also shifted RBC consumption from macrophages to immune‐stimulating dendritic cell subsets. Flow cytometric analysis revealed that PMNs with internalized RBCs upregulated expression of co‐inhibitory molecules (e.g. PD‐L1), compared to PMNs (without internalized RBCs) from the same mouse; thus, PMNs may regulate alloimmunization through antigen presentation and/or inhibitory signals. Humans:. Alloimmunized MDS patients had a significant decrease in PMNs, compared to non‐alloimmunized (p<0.05); no significant differences were detected in mean WBC counts between the two arms.
Conclusion: These data demonstrate that in both murine and human settings, PMNs may play a significant role in regulating RBC alloimmunization and may provide key insights into predicting which patients will become alloimmunized.
B6‐A01A
Kidney Transplant Outcomes in Patients with Anti‐Donor Kidd Blood Group Antibodies
Glenn Ramsey*1, Joseph R Leventhal1, John J Friedewald1, Karyn Hartman2,3, Ricardo D Sumugod2,4 and Paul F Lindholm1
1Northwestern University, 2Northwestern Medicine, 3Northwestern Memorial Hospital, 4Northwestern Medicine ‐ Northwestern Memorial Hospital
Background/Case Studies: Human urea transporter‐B, the Kidd (JK) blood group glycoprotein, functions in renal endothelial cells in the descending vasa recta. Five single case reports have linked renal transplant rejections, including 3 graft failures, with concurrent emergence of anti‐Jk antibodies (anti‐Jk) from 12 days to 9 yr (median 5 yr) after transplant (Sanford KW, 2015). HLA antibody status or graft Jk type were noted in only 1 case each. Nothing is known about the effects of preformed anti‐Jk donor‐specific antibodies (DSA) on renal grafts.
Study Design/Methods: RBC antibody screening was performed by solid phase RBC adherence (Immucor, Norcross, GA). Anti‐Jk titers were performed in serial saline dilutions with the last 1+ anti‐IgG reaction as endpoint. Since 2012, when our transfusion service identifies anti‐Jk antibodies in renal transplant candidates or recipients, current renal donors are typed for Jka/b and the transplant service is notified about Jk‐incompatible grafts or patients with past transplants, graft Jk type unknown. We retrospectively reviewed these cases for graft survival, highest HLA DSA titers and biopsy findings.
Results/Findings: In 4.5 years, 7 patients (0.7% of our renal transplants) had pre‐transplant anti‐Jk to a donor Jk antigen (4 Jka, 3 Jkb); 3 of these patients and 2 others developed anti‐Jk after earlier transplants, donor Jk types unknown (Table). Pre‐transplant anti‐Jk: At transplant, 5 cases had anti‐Jk and 2 had prior anti‐Jk not detected currently. In 3 cases with HLA DSA pre‐ or post‐transplant, 2 had reversible acute antibody‐ or cellular‐mediated rejection (AMR, CMR) at 3 mo. In 4 cases with no HLA DSA, one had equivocal AMR vs glomerulonephritis (GN) at 2 yr. All 7 grafts are surviving at 3‐53 mo (median 24). Post‐transplant anti‐Jk: Anti‐Jk was discovered 1‐8 yr after 5 transplants which underwent chronic rejection or failure. All had HLA DSA, and 4 had titers from 32 to >1024. Cases 1, 3 and 4 have subsequent surviving Jk‐incompatible grafts.
Conclusion: In 7 renal transplant patients with preformed anti‐Jk vs graft Jk antigens, all grafts are surviving; two patients had early rejection episodes but also had HLA DSA. Like prior reports, we found anti‐Jk post‐transplant in 5 patients with rejection or graft failure, but these patients had evidence of HLA‐mediated rejection. HLA and RBC alloimmunization have been associated in past studies. We have not found clear evidence of rejection from anti‐Jk alone. However, we have not seen anti‐Jk graft incompatibility with high anti‐Jk titers (32 in Hamilton MS, 2006) or rejection with no detected HLA DSA (Holt S, 2004).
|
Anti‐Jk Timing |
Case Sex |
Tpt age Tpt # |
Anti‐Jk Titers |
Donor Jk | HLA DSA titer |
Tpt PEx # |
Rejection Time post‐tpt |
Graft Survival | ||
|---|---|---|---|---|---|---|---|---|---|---|
| Pre‐Tpt | 1 | M | 36 | 2 | Jkb 1 | a+b+ | N | Y 2 | AMR v GN? 2y | 53+ mo |
| 2 | F | 65 | 1 | Jka <1 | a+b‐ | 1 | N | Ac AMR 3 mo | 45+ mo | |
| 3 | F | 25 | 2 | Jka <1 | a+b+ | N | Y 2 | N | 26+ mo | |
| 4 | M | 60 | 2 | Hx Jkb | a+b+ | N | N | N | 24+ mo | |
| 5 | M | 35 | 1 | Jka 4 | a+b+ | 4 | Y 1 | N | 22+ mo | |
| 6 | M | 35 | 1 | Hx Jkb | a+b+ | N | N | N | 17+ mo | |
| 7 | F | 23 | 2* | Jka 1 | a+b+ | 8 | N | Ac CMR 3 mo | 3+ mo | |
| Post‐Tpt | 1 | M | 29 | 1 | Jkb | NA | 64 | Chr AMR 2 yr | 6 yr X | |
| 3 | F | 21 | 1 | Jka | NA | >1024 | Chr AMR 1 yr | 3 yr X | ||
| 4 | M | 47 | 1 | Jkb | NA | Y, NA | Chr CMR 4 yr | 7 yr X | ||
| 8 | F | 39 | 1 | Jkb | NA | 1024 | Chr AMR 2 yr | >3 yr† | ||
| 9 | F | 48 | 1 | Jkb | NA | 32 | Failure 8 yr | 8 yr X | ||
Ac: acute. Chr: chronic. Hx: history. NA: not available. PEx: plasma exchange at Tpt. Tpt: transplant. X: graft failure. *Tpt 1 elsewhere. †Last followup.
Basic Science Oral Abstract Session: Basic and Preclinical Cellular Therapy and T cell Immunology
B7‐A03B
Insulin‐like Growth Factor‐II Released By Osteoblasts Promotes the Growth of Cord Blood Progenitors
Kyle Law1,2, Owen Hovey1,2 and Nicolas Pineault*2,3
1Canadian Blood Services, 2University Ottawa, 3Canadian Blood Services, Centre for Innovation
Background/Case Studies: Expansion of cord blood (CB) hematopoietic stem and progenitor cells (HSPC) is investigated as a means to accelerate engraftment following CB transplantation. Small molecules, cytokines and cocultures are some of several strategies investigated for HSPC expansion. Recently, we discovered a complementary strategy based on the use of serum free medium (SFM) conditioned with mesenchymal stromal cell (MSC)‐derived osteoblasts. Osteoblast conditioned media (OCM) increases expansion of CB CD34+ cells and colony‐forming progenitors 2‐fold vs. control SFM. The growth factors responsible for OCM’ activities remain to be identified. Herein, we investigated the implication of insulin‐like growth factors (IGF‐I, ‐II) on the growth promoting activity of OCM.
Study Design/Method: Bone marrow MSCs were differentiated into osteoblasts in osteogenic medium, and SFM conditioned for 24hours. OCM was fractionated with filter‐aided sample preparation columns with molecular weight cut‐offs of 30 and 50 kDa. Fractions of interest were analyzed by mass spectroscopy. Q‐PCR assay was used to measure expression of IGFs in osteoblast and MSC. The functional contribution of IGFs to the growth promoting activities of OCM on CB cells was investigated by inhibition of IGF‐I receptors (IGF‐IR) with AG‐1024. All CB cultures were supplemented with cytokines (SCF, FL and TPO).
Results/Finding: Fractionation of OCM revealed that proteins or complexes greater than 30 Kda were essential for the growth promoting activity of OCM (2.8 ± 0.3 vs SFM, p<0.05), since no significant effect was seen below 30 Kda (1.5 ± 0.4, n=3). Preliminary analysis comparing fractionated MSC‐conditioned medium (MCM) and OCM identified IGF‐II and IGF binding protein‐2 (IGFBP‐2) as two factors present preferably in OCM. Q‐PCR revealed a large increase in the relative expression of IGF‐II mRNA in osteoblasts by day 4 of osteogenic differentiation compared to MSC (10‐fold ± 1.5, p<0.01). Expression of IGFBP‐2 mRNA was also significantly greater in osteoblasts (16‐fold ± 3, p<0.01). In contrast, only low transcript levels for IGF‐I were detected in MSC or MSC‐derived osteoblasts. Moreover, the concentration of IGF‐II in OCM (6.5 ±1.1 ng/mL, n=5) was 75‐fold higher than that measured in MCM (p<0.001). IGF‐II’ mitogenic activities are mediated through the activation of the tyrosine kinase receptor IGF‐IR, which can be inhibited with the selective kinase inhibitor AG‐1024 (IC50 7µM). Addition of AG‐1024 reduced in a dose‐dependent manner the growth of CB cells in OCM cultures (p<0.05), while having minimal effect in SFM cultures. Moreover, the increased production of CD34+ (p<0.01), CD34+CD45RANEG‐HSPC enriched cells (p<0.001) and CFU progenitors (p<0.05) in OCM cultures were largely abrogated in the presence of 10 µM of AG‐1024 (p<0.05, n=3). The contribution of IGF‐II/IGF‐IR signaling on the engraftment properties of OCM‐expanded CB CD34+ cells in immunodeficient mice is currently under investigation.
Conclusion: Fractionation and mass spectroscopy identified IGF‐II as a potential promoter of cell growth in OCM. Q‐PCR and ELISA confirmed elevated levels of this factor in osteoblasts and OCM, and inhibition of IGF‐IR severely impaired the growth promoting activities of OCM on CD34+ cells. Altogether, these results suggest that the increased expansion of HSPC‐enriched cells induced by OCM is mediated in part by IGF‐II.
B8‐A03B
Personalized Neoantigen‐Specific Adoptive T Cell Therapy for Acute Myeloid Leukemia and Myelodysplastic Syndrome: Evidence for T Cell Anti‐Stem Cell Specificity
Valentina Ferrari*1, Alison Tarke1, Hannah Fields1, Luca Ferrari1, Trevor Conley1, Franco Ferrari1, Jiehua Zhou2, Dimitrios Tzachanis2, Tiffany Tanaka2, Asad Bashey3, Rafael Bejar2, Thomas Lane1, Edward Ball2 and Antonella Vitiello1
1PersImmune, 2UCSD, 3Northside Hospital
Background/Case Studies: The 5‐year survival rate for patients with acute myeloid leukemia (AML) is ∼25% and the 2‐year survival rate for patients with high‐risk myelodysplastic syndrome (MDS) who fail standard therapy is ∼15%. The only curative therapy for most high‐risk AML and MDS patients is allogeneic hematopoietic stem cell transplant (allo‐HSCT). The goal of this study is to address the gap in treatment options through development of a novel T cell therapy that immunizes T cells against AML/MDS‐specific mutations. This therapy, termed PACTN (Personalized Adoptive Cell Therapy targeted to patient‐specific tumor cell Neoantigens), is based on the concept that cancer is caused by somatic mutations that may generate novel immunogenic proteins (neoantigens). The evidence shown here demonstrates that AML mutation‐reactive T cells generated by the PACTN method can kill AML/MDS leukemic stem cells, as marked by CD34 and/or CD117 positivity.
Study Design/Method: Twelve subjects with AML and three with MDS were studied. The T cell immunization process comprises (i) whole‐exome and transcriptome sequencing of both AML/MDS patient CD34+ and/or CD117+ blasts and patient normal blood cells to identify non‐synonymous, expressed, tumor‐unique DNA mutations; (ii) in silico screening of peptides spanning the mutations to identify potentially immunogenic MHC‐binding peptides via IEDB (Immune Epitope Database); (iii) in vitro immunogenicity screening of candidate neopeptides against T cells from allo‐HSCT donors (AML) or the MDS patient; and (iv) selection of immunogenic peptides (neoantigens) and generation of T cell lines with the desired neoantigen specificity and cytolytic activity. To confirm the anti‐stem cell specificity of the immunized T cells, their cytotoxicity was tested against their corresponding AML CD34+selected cell targets, vs. non‐leukemic control cells, using a validated flow cytometry assay. All assays were run in triplicate.
Results/Finding: At least one driver mutation was present in the DNA/RNA of all 15 patients. Immunogenicity testing of selected neopeptides expressed in the CD34+ cells of two AML patients was performed; both allogeneic and autologous T cells immunized with neopeptides were capable of killing CD34+AML targets.
| Patient ID | T cell source | Neopeptide ID | Cytotoxicity (%) | P‐value (Two‐way ANOVA) | |
|---|---|---|---|---|---|
| AML CD34+ cells | Control cells | ||||
| 1 | Autologous | 68/69 | 46 | 7 | 0.0004 |
| 9 |
Allogeneic (HSCT‐donor) |
22 | 37 | 13 | 0.0110 |
| 30 | 25 | 12 | 0.1730 | ||
Conclusion: These experiments demonstrate the ability of AML mutation‐derived neopeptides to immunize both allogeneic and autologous T cells sufficient to generate significant and specific killing of leukemic stem cells. An IND has been approved for two Phase I clinical trials to assess safety and tolerability of PACTN in both AML and MDS patients.
B9‐A03B
CXCR5+PD1+ and CCR7+ Expressions Characterize Responders to RBC Immunization
Benoît Vingert*1,2,3, Marie Tamagne1,2,3, Sadaf Pakdaman1,2,3, Anoosha Habibi2,3,4, Philippe Bierling1,2,3,4,5, Rachid Djoudi1 and France Pirenne1,2,3,5
1EFS Ile de France, 2Laboratory of Excellence GR‐Ex, 3IMRB U955 ‐ Eq2, 4AP‐HP, 5Université Paris Est
Background/Case Studies: Post‐transfusion alloimmunization can induce life‐threatening hemolytic transfusion reaction. In human, mechanisms responsible of RBC alloimmunization are not fully defined. CD4+ T cells are major for antibodies production. We have already shown in responder patients that the majority of anti‐RBC CD4+ T cells have a Th17 profile. In contrast, in whole blood of non‐responder patients, there is an unexpected expression of circulating CD4+ T cells with a CXCR5+PD1+ phenotype. This phenotype is usually associated with the presence of Tfh cells, specialized in the production of antibodies. It has been suggested that some of the activated circulating Tfh could have a CXCR5+PD1hi profile, with a differentiated expression of CCR7. CCR7 is essential for T cells domiciliation in lymph nodes where the encounter T and B cells is major for B cell differentiation and antibody production. Others chemokines receptor like CCR6 and CXCR3 can also differentiate circulating Tfh subpopulations. In this study, we were interested in the phenotype and function of these CXCR5+PD1+ lymphocytes which were paradoxically highly represented in non‐responder patients.
Study Design/Method: The membrane and functional phenotype of the circulating CXCR5+PD1+ cells were compared in 2 groups of transfused sickle cell patients : alloimmunized (n=14) and non‐alloimmunized patients (n=10). The analysis was also performed in non‐transfused healthy controls (n=12). All assays were performed on whole blood without separation procedures that are known to alter the expression of chemokine receptors
Results/Finding: The CXCR5+PD1hi subpopulation expression was identical between transfused groups and controls. CCR6 and CXCR3 expressions show no difference between the transfused groups or the controls. However, in non‐responder patients, CCR7 expression was very strong independently of the expression of PD1. In the aim to determine the help of the circulating CXCR5+PD1+ cells in the production of antibodies, these cells were purified by flow cytometry and co‐cultured for 5 days with B cells, and in the presence of SEB protein. The levels of antibodies after SEB stimulation were identical with the CXCR5+PD1+ subpopulations from transfused groups or controls.
Conclusion: The paradoxical presence of circulating CXCR5+PD1+ cells in non‐responder transfused patients do not appear to have any particular functions that can promote the absence of a humoral response. However, in responder patients, the high expression of CCR7 on circulating CXCR5+PD1+ cells suggests remarkable migratory properties towards secondary lymphoid organs, and could facilitate allo‐immune responses. In conclusion, the study of the CXCR5+PD1+ profile and the CCR7+ expression in these cells could help to differentiate responder and non‐responder patients to RBC immunization.
B10‐A03B
Primed CD4 T Cells to One RBC Alloantigen Can Enhance Subsequent Alloimmunization
Seema R Patel*1, Ashley Bennett1, Kathryn Girard‐Pierce1, Connie Arthur1, Amanda Mener1, Patty Zerra1, Christopher A Tormey2, Jeanne Hendrickson3 and Sean Stowell4
1Emory University, 2Yale‐New Haven Hospital, 3Yale University, 4Emory University School of Medicine
Background/Case Studies: While red blood cell (RBC) alloantibodies can increase the probability of transfusion‐related complications, not all patients become alloimmunized following transfusion. However, individuals that do generate alloantibodies appear to experience an increased rate of additional alloantibody formation following subsequent transfusion. However, how immunity to one RBC alloantigen primes immunization to a completely distinct alloantigen remains unknown. Though CD4 T cell help classically occurs through direct recognition of a peptide that resides within a target B cell antigen, individuals who develop antibodies toward one RBC alloantigen experience increased rates of antibody formation against completely distinct RBC alloantigens. These observations suggest that CD4 T cells that respond to one alloantigen may directly facilitate immunity to a completely distinct RBC alloantigen.
Study Design/Method: B6 recipients were transfused with KEL RBCs in the presence or absence of poly I:C (PIC), followed by transfusion of HOD RBCs, KEL RBCs, RBCs expressing HOD and KEL (HOD x KEL), or a mixture of HOD and KEL RBCs (HOD + KEL). To examine the role of CD4 T cells, PIC/KEL primed B6 recipients were CD4 T cell depleted prior to transfusion. In addition, B6 recipients were adoptively transferred with CD4 T cells from naïve or PIC/KEL primed donors, followed by transfusion of HOD RBCs or (HOD x KEL) RBCs. Anti‐HOD and anti‐KEL alloantibody formation was evaluated using indirect immunofluorescence staining.
Results/Findings: KEL RBC transfusion in the presence of PIC (PIC/KEL) not only enhanced anti‐KEL antibody production through a CD4 T cell‐dependent process, but this same priming event directly facilitated anti‐HOD antibody formation following subsequent (HOD x KEL) RBC transfusion (p < 0.001); PIC/KEL primed recipients transfused with (HOD + KEL) RBCs or HOD RBCs alone failed to impact anti‐HOD antibody formation. The ability of immunity to KEL to boost a humoral response to the HOD antigen following (HOD x KEL) RBC transfusion required KEL priming in the presence of PIC. CD4 T cell depletion prevented PIC/KEL primed recipients from boosting an anti‐HOD antibody response (p < 0.0001) and transfer of CD4 T cells from PIC/KEL primed recipients likewise directly facilitated anti‐HOD antibody formation following a (HOD x KEL) RBC transfusion (p < 0.001).
Conclusion: These results demonstrate that CD4 T cells primed to one RBC alloantigen can directly enhance the immune response to a completely distinct RBC alloantigen, suggesting a mechanism whereby alloantibody responders may exhibit an increased rate of additional alloantibody formation. These findings also highlight a previously underappreciated mechanism by which cellular adaptive immunity can influence humoral immunity to unrelated immunogens.
B11‐A03B
Minor‐Antigen Mismatch Stimulates CD8 T Cell Mediated Platelet Clearance
Cheryl L Maier*1, Seema R Patel1, Connie Arthur1, Ashley Bennett1 and Sean Stowell2
1Emory University, 2Emory University School of Medicine
Background/Case Studies: Platelet refractoriness remains a significant clinical problem, yet the mechanisms by which it occurs are incompletely understood. Immune‐mediated platelet clearance by anti‐platelet alloantibodies plays a significant role, and patients with detectable alloantibodies can be managed with transfusion of HLA‐matched platelets. Still, many patients are refractory even after receiving HLA‐matched platelets. It was shown previously that CD8 T cells can play a direct role in platelet clearance, as allogeneic platelets are cleared within 24 hours post transfusion in B cell‐deficient µMT recipient mice (ie in the absence of anti‐platelet alloantibodies) and depletion of CD8 T cells prevents such clearance. Since minor antigenic differences still exist between donor HLA‐matched platelets and a recipient, we hypothesized that minor antigens alone may mediate clearance of otherwise HLA‐matched platelets.
Study Design/Method: To test whether minor antigens can stimulate CD8 T cell‐dependent platelet clearance we examined platelet refractoriness using mOva and OTI transgenic mice. Leukoreduced donor platelets from mOva mice, which express a membrane‐bound form of chicken ovalbumin and thus present ovalbumin peptides complexed with murine MHC class I H2Kb, were labelled in vivowith the fluorescent dye CFSE and transfused into wildtype (WT, C57BL/6) mice or OTI mice, whose CD8 T cell receptors recognize a specific ovalbumin peptide in the context of MHC class I H2Kb. In some experiments OTI mice were primed with mOva or WT splenocytes one week prior to mOva platelet transfusion, and in others WT mice were adoptively transferred with OTI splenocytes 48 hours before mOva platelet transfusion. Platelet recovery was measured immediately after transfusion as well as after 2, 4, 8, 16, and 24 hours and on days 2‐5.
Results/Finding: Transfusion of mOva platelets into OTI mice results in significant platelet clearance as compared to transfusion with WT platelets. Clearance kinetics demonstrate platelet loss starting after 8 hours and peaking at 24 hours, and are similar whether OTI mice are naïve or previously primed with mOva splenocytes. Specifically, mOva platelet recovery in OTI recipients is 28‐35% versus >60% in WT recipients at 24 hours (p<0.05), whereas transfusion of WT platelets into either OTI or WT recipients is approximately 60% at 24 hours after transfusion. Adoptive transfer of OTI CD8 T cells into WT mice recapitulates the effect, with significant mOva platelet clearance at 24 hours compared to WT platelet clearance (p<0.05).
Conclusion: This work extends the ability of CD8 T cells to mediate platelet clearance to a minor antigen, providing insight into the potential etiology of platelet refractoriness in patients receiving HLA‐matched products. This study also holds implications for the clinical management of any non‐antibody‐mediated platelet refractory patient, as therapies directed toward immunomodulation of T cell responses may prove beneficial.
B12‐A03B
Cell Death Pathways and the Alloresponse to Pathogen Reduced Platelet Rich Plasma
Rachael P. Jackman*1, Marcus O. Muench1,2, John W. Heitman1, Ashley I. Beyer1 and Philip J. Norris1,2
1Blood Systems Research Institute, 2University of California
Background/Case Studies: Alloimmunization against major histocompatibility (MHC) antigens is a common complication of transfusion, and can negatively impact subsequent transfusions and transplants. We have previously demonstrated that pathogen reduction with riboflavin and UV light (UV+R) is effective both at rapidly killing donor white blood cells (WBCs) and at blocking their ability to stimulate an allogeneic response in vitro. Furthermore, UV+R treatment of allogeneic platelet rich plasma (PRP) prevents alloimmunization in mice, and provides partial antigen‐specific tolerance to subsequent transfusions. As cells that die through different pathways can be either tolerizing or inflammatory, we sought to determine which cell death pathways are triggered by UV+R, as well as evaluate the immunogenicity of PRP containing WBCs killed by other methods.
Study Design/Method: WBC‐rich PRP was prepared from C57Bl/6 mouse blood and treated with UV+R, and WBCs prepared in parallel from the same blood were treated with known inducers of either apoptosis or necrosis. Membrane integrity, phosphatidylserine exposure, caspase activity, and chromatin condensation were evaluated by flow cytometry. BALB/c recipients were transfused with either UV+R treated WBC‐rich PRP, or UV+R treated WBC‐poor PRP either alone or with added untreated, apoptotic, or necrotic WBCs, all generated from allogeneic C57Bl/6 donor blood. A second transfusion of untreated WBC‐rich C57Bl/6 PRP was given 2 weeks later, and alloresponses were compared against mice given no transfusion or only the second untreated transfusion.
Results/Finding: UV+R treated WBCs have a pattern of phosphatidylserine exposure and loss of membrane integrity consistent with early apoptosis, but fail to demonstrate significant caspase activity or clear chromatin condensation. Alloantibody responses to transfusion were significantly higher in mice previously exposed to untreated (p<0.01) or necrotic (p<0.05) WBCs, but not those given UV+R treated or apoptotic WBCs. Ex vivo cytokine responses to stimulation with C57Bl/6 WBCs were reduced in recipients of either UV+R or apoptotic WBCs, and enhanced in recipients of untreated or necrotic WBCs.
Conclusion: The mechanism of WBC death following UV+R treatment shares some membrane characteristics of early apoptosis, but is distinct from classic apoptosis. However, both UV+R treated and apoptotic WBCs fail to trigger an alloresponse, and offer some protection against subsequent alloexposures.
Basic Science Oral Abstract Session: Blood Product Biochemistry
B13‐A03I
Unexpected Variability of Hemoglobin Oxygen Saturation in Packed Red Blood Cells upon Donation Suggests Uncontrolled and Overlooked Parameter Associated with the Development of the Storage Lesion
Tatsuro Yoshida*1, Travis Nemkov2, Abbejane Blair1, Peili Chen3, Tracey Cheves1, Carolyn Young4, Andrew Dunham1 and Angelo D'Alessandro2
1New Health Sciences Inc., 2University of Colorado Denver, 3Pendar Technologies, 4Rhode Island Blood Center
Background/Case Studies: In mitochondria‐less red blood cells (RBCs), oxygen is the main substrate for oxidative reactions and resulting oxidative damage is considered as one of the major causative factors in the development of RBC storage lesion. Oxygen saturation (SO2) of venous blood is generally assumed to be around 70‐80% as measured from a central venous line. However, a recent investigation of SO2 levels in freshly prepared leukocyte‐reduced red cell concentrates (LR‐RCCs) revealed unexpectedly wide SO2 distribution (mean 45.9%±17.5% [Yoshida et al. 2017; Blood Transfusion 15, 172]. The present study was undertaken to determine the distribution of SO2 in LR‐RCC produced at a medium‐size blood center using a novel non‐invasive SO2 probe. Additionally, quantitative metabolomics were carried out to examine the redox status of the stored RBC under various SO2 levels.
Study Design/Method: The SO2 from 977 units of LR‐RCC were examined on five consecutive days representing 78% of the collected units during the period at a regional blood center where all the units were processed at room temperature within 8 hours of blood collection. SO2 was measured non‐invasively through the PVC bag immediately prior to refrigeration by employing a Resonance Raman spectrometry (Pendar Microvascular Oximeter A3U11; Pendar Technologies, Cambridge MA). In addition to SO2, process methods, RCC volumes, blood types, gender and process times were recorded for analyses. In a separate study, LR‐RCC (n=4) from human volunteers were stored in AS‐3 under normoxic, hyperoxic, or hypoxic conditions for up to 42 days (SO2ranging from <3 to >95%) prior to UHPLC‐MS metabolomics analyses in presence of 13C, 15N or deuterated internal stable‐isotope labeled standards for absolute quantitation.
Results/Finding: Measurements of SO2 carried out non‐invasively at a blood center yielded a similar wide distribution as previous study from 497 units of LR‐RCC procured and sampled invasively within 24 hours after blood collection [Yoshida ibid]. The shape of the SO2 distribution appeared near normal with the mean of 47.0%±21.0%, median 45.2%, range < 5% to > 95% and inter‐quartile range (IQR) of 31.4%‐61.9%. Male donors showed higher SO2 compared to female donors (p<0.04). No correlations were observed between SO2 levels and processing time, donor age or blood types. Metabolomics workflow indicated that lower SO2 levels ameliorate the energy and oxidative metabolic lesion. Lower SO2 levels yielded higher rate of GSH synthesis, higher NADPH concentration, higher GSH / GSSG and NADPH/NADP+ratios, lower supernatant urate consumption and lower purine oxidation.
Conclusion: The surprisingly wide distribution of starting %SO2 levels was observed from LR‐RCC manufactured at a blood center using 8‐hour room temperature process. Considering recent reports showing profound effects of oxygen levels on RBC metabolism, coupled with the negative impacts of high oxygen saturation on the quality of stored RBC suggests that oxygen level is important and underappreciated source of unit to unit variability in RCC quality. Future studies will investigate whether day 0 SO2 levels affect red blood cell storability and the storage lesion.
B14‐A03I
Hypoxia Modulates the Purine Salvage Pathway and Decreases Cell and Supernatant Levels of Hypoxanthine, a Predictor of 24h In Vivo Survival of Stored Mouse and Human Red Blood Cells
Travis Nemkov1, Kaiqi Sun2, Tatsuro Yoshida3, Julie A Reisz1, Kirk C Hansen1, Richard Francis4, Robert C Roach1, Yang Xia2, Karen de Wolski5, Steven Spitalnik6, Eldad A. Hod7 and Angelo D'Alessandro*1
1University of Colorado Denver, 2University of Texas Houston, 3New Health Sciences Inc., 4Columbia University Medical Center ‐ New York Presbyterian Hospital, 5Bloodworks Northwest, 6Columbia University, 7Columbia University Medical Center
Background/Case Studies: Refrigerated red blood cell (RBC) storage promotes the progressive accumulation of biochemical lesions, affecting red blood cell energy and redox metabolism. Purine catabolism/oxidation generates hypoxanthine, a recently appreciated marker of RBC metabolic age during storage. Despite known deleterious effects associated with supra‐physiological levels of circulating hypoxanthine, it is unclear whether accumulation of intracellular and supernatant hypoxanthine in stored RBC units is clinically relevant for transfused recipients.
Study Design/Method: Leukofiltered RBCs (n=5) from human volunteers were stored in AS‐3 under normoxic, hyperoxic, or hypoxic conditions for up to 42 days (SO2 ranging from <3 to >95%) prior to UHPLC‐MS metabolomics analysis. RBCs from healthy volunteers were collected at sea level or after 1‐7 days at high altitude (>5000m). Freshly‐collected C57/BL6 mouse RBCs were incubated with 13C1‐aspartate or 13C5‐adenosine for up to 6h under normoxic or hypoxic conditions. Metabolomics analyses were performed on human and mouse RBCs stored for up to 42 or 14 days, respectively, and correlated with 24h post‐transfusion recovery studies.
Results/Finding: Intracellular and supernatant hypoxanthine increased in stored RBC units as a function of oxygen levels. Purine oxidation is decreased and salvage reactions are promoted by hypoxic storage, as gleaned by steady state analysis of stored human and mouse RBC concentrates. Metabolomics analyses of RBC from healthy human volunteers exposed to high altitude hypoxia and tracing experiments with stable‐isotope labeled substrates confirmed in vitro steady state results, suggesting that hypoxia induces increased flux through salvage reactions. Using both mouse and human stored RBCs, increases in hypoxanthine negatively correlate (p<0.005) with post‐transfusion recovery.
Conclusion: Hypoxanthine is an in vitro metabolic marker of the RBC storage lesion that correlates with post‐transfusion recovery in vivo. Storage‐dependent accumulation of hypoxanthine can be ameliorated by hypoxia‐dependent decreases in purine oxidation and activation of salvage reactions.
B15‐A03I
Murine RBCs from Genetically Distinct Donors Cross‐Regulate When Stored Together
Ariel M Hay1, Hayley Waterman1, Karen deWolski1, Heather Howie1 and James C Zimring*1,2
1BloodworksNW Research Institute, 2University of Washington School of Medicine
Background/Case Studies: Donor variability of RBC storage has been observed in both humans and animal models. It has been previously reported that RBCs from wild‐type C57BL/6 mice (B6) store well, whereas RBCs from FVB mice store poorly; these determinations were made based upon 24‐hour recoveries post‐transfusion. An F1 cross between these two strains (B6xFVB) had an intermediated storage phenotype. These strains of mice were utilized to test the hypothesis that RBCs affected the storage of other RBCs as opposed to the RBC storage lesion being an event intrinsic to individual RBCs.
Study Design/Methods: To allow visualization of stored RBCs, B6xFVB F1 mice were generated that also expressed green fluorescent protein in their RBCs (F1‐GFP). F1‐GFP RBCs were stored with either wild‐type B6 or wild‐type FVB RBCs. Control F1‐GFP RBCs were stored with wild‐type F1 RBCs that were not green to normalize conditions amongst groups. This design is such that only the F1‐GFP RBCs fluoresce by flow cytometry, allowing the ability to assess the effect of co‐storing RBCs upon the F1‐GFP RBCs. Transwell plates consisting of two compartments separated by a semi‐permeable membrane (0.4 micron size limit) were used to test the nature of any cross‐regulation. In all cases, RBCs were stored for 7 days and transfused into F1 mice; 24‐hr recoveries were determined by enumerating F1‐GFP RBCs in peripheral blood by flow cytometry.
Results/Findings: 24‐hr recoveries of F1‐GFP RBCs were significantly increased when co‐stored with B6 RBCs and significantly decreased when co‐stored with FVB RBCs. This effect was not observed when only molecules smaller than 0.4 microns were allowed to exchanges between the RBC populations, in the transwell system. Antibodies placed in top chamber of the transwell system freely diffused into the bottom well, confirming the membrane allowed passage of small molecules.
Conclusion: These findings indicate that the storage of RBCs of one phenotype impact the storage of RBCs of a different phenotype, both in positive and negative directions. Molecules smaller than 0.4 microns are not alone sufficient to mediate this “cross‐regulation”, indicating that large molecules and/or cell‐to‐cell contact is required. These findings challenge the notion that the biology of a given RBC is an entirely intrinsic property, suggesting rather that RBCs may function as a multicellular organ, with intercellular communication. The degree to which these findings extend into normal RBC physiology, outside the context of storage and/or translate into human RBC biology will require further study.
B16‐A03I
Metabolic Pathways That Correlate with In Vivo Hemolysis Following Storage of Human RBCs
Angelo D'Alessandro1, Francesca Rapido2, Tiffany Thomas2, Xiaoyun Fu3, Richard Francis4, Steven Spitalnik5, James C Zimring3 and Eldad A. Hod*2
1University of Colorado Denver, 2Columbia University Medical Center, 3BloodworksNW Research Institute, 4Columbia University Medical Center ‐ New York Presbyterian Hospital, 5Columbia University
Background/Case Studies: Refrigerated storage significantly affects metabolomic profiles of RBC units. Prior studies suggest increasing storage impairs energy homeostasis and antioxidant capacity leading to the generation of bioactive lipids, but these findings are limited by lack of an in vivo human correlate. We evaluated relationships between RBC metabolomic profiles in vitro and hemolysis in vivo in human transfusion recipients.
Study Design/Method: 52 healthy adults, who met the standards for allogeneic blood donation, were randomized to transfusion of one autologous RBC unit after 1, 2, 3, 4, 5, or 6 weeks of storage. Blood samples were collected before, and at defined times after, transfusion to measure markers of hemolysis and 51‐chromium RBC recoveries. At transfusion, aliquots of the transfusate were frozen in liquid nitrogen for metabolomic profiling by tandem liquid chromatography‐mass spectrometry. Predictive regression models were developed using SAS (v9.4).
Results/Finding: Hierarchical clustering analysis confirmed previous results of metabolites that correlate with storage time. To discover metabolites that predict in vivo hemolysis after a given storage duration, multivariable linear regression was performed following adjustment for storage time. When adjusted for storage time, the metabolites that most significantly (all P<0.01) predict the area under the curve (AUC) of iron (e.g., the amount of iron released into the recipient's circulation over 20 hours after transfusing one autologous RBC unit) involved energy production and glutathione homeostasis pathways (e.g., reduced glutathione, glucose‐6‐phosphate) and bioactive lipids (e.g., 5‐HETE, 8‐HETE). Increasing donor/recipient age, but not gender, also correlate with increasing AUC iron (adjusted R2 = 0.50, P=0.01). Similarly, when adjusted for storage time, the metabolites that correlate best with post‐transfusion recovery involved similar pathways (e.g., adenine, P=0.0002; 8‐HETE, P=0.02). Interestingly, a feature tentatively assigned as 3‐methyleneoxindole, a metabolite of tryptophan thought to be produced by bacteria in the colon, predicted both AUC iron and RBC recovery (P=0.002).
Conclusion: These data confirm that oxidative stress (i.e., antioxidant pathways and generation of oxidized lipids) is functionally important in the RBC storage lesion and identify specific metabolites that correlate with outcome in vivo. Interestingly, prior mouse model studies suggested that specific HETEs produced in vitro predicted RBC recovery in vivo. Thus, this report correlating metabolomic profiles in vitro with post‐transfusion hemolysis in vivo in humans also supports the conclusions of earlier mouse studies. Future studies will prospectively test the most predictive metabolites of in vivo hemolysis.
B17‐A03I
Analysis of the Effect of Additive Solution on the Bacterial Growth and Survival in Red Blood Cell Units
Marie‐Pierre Cayer*1, Lise‐Ann Cloutier1, Marie Joelle de Grandmont1, Audrey Laforce‐Lavoie1, Danny Brouard1, Mélissa Girard2, Yuntong Kou3, Sandra Ramirez‐Arcos3 and Marc Cloutier1
1Héma‐Québec, 2Hema‐Quebec, 3Canadian Blood Services
Background/Case Studies: Most studies of red blood cell concentrates (RBCC) prepared using different manufacturing processes and additive solutions (AS) are focused on changes on the RBC storage lesion and in vitro quality. So far, none of the studies have investigated whether RBCC manufacturing practices affect bacterial survival in contaminated units. Previous studies from Canadian Blood Services (CBS) and Héma‐Québec (HQ) suggest that AS might have differential effects on bacterial growth. Thus, this study aims at comparing bacterial growth in RBCC prepared in four AS: SAGM, PAGGSM, AS‐1, and AS‐3.
Study Design/Method: The study was conducted in parallel at CBS and HQ. Three ABO‐Rh gender matched CPD whole‐blood units were used to prepare three RBCC each suspended in SAGM, PAGGSM and AS‐1, respectively. In parallel, one CPD2‐RBCC was prepared and suspended in AS‐3. Each RBCC was inoculated with one of four bacteria: Klebsiella pneumoniae, Staphylococcus epidermidis, Yersinia enterocolitica or Propionibacterium acnes, at a target load of 10 colony‐forming units (CFU)/mL) (n=4). On days 7, 14, 21, 28, 35 and 42, RBCC samples were taken to determine CFUs on blood agar. If growth was not detected during storage, at day 42, samples were inoculated in BacT/ALERT 3D culture bottles. The effect of AS and/or gender on bacterial growth will be statistically analyzed once the experimental work is complete at both HQ and CBS.
Results/Finding: Results from HQ show that S. epidermidis self‐sterilized in all RBCC regardless of the AS. Although K. pneumoniae growth was not detected on blood agar, positive BacT/ALERT 3D cultures were obtained at day 42. P. acnes did not proliferate but survived RBC storage and was detected at concentrations <5 CFU/mL in PAGGSM‐RBCC. At day 42, Y. enterocolitica grew similarly in AS‐1 and PAGGSM‐RBCC (3.3 ± 3.0x10⁷ CFU/mL and 2.0 ± 0.8x10⁷ CFU/mL, respectively), while a 1‐log increase was observed for AS‐3‐RBCC (1.9 ± 0.5x10⁸ CFU/mL) and 1‐log decrease was obtained in SAGM‐RBCC (2.0 ± 2.1x10⁶ CFU/mL). Preliminary data at CBS show similar growth trends for all bacteria.
Conclusion: Our results confirm that different AS have a differential effect on bacterial growth in RBCC. The clinical significance of these observations is unknown and merits further investigation.
Basic Science Posters
Basic and Preclinical Cellular and Immunotherapeutics
BP1
CCR5 Delta 32 Allele Frequency in Argentinean Cord Blood Donors
Valeria Roca*1, Daniela Fernandez Souto2, Julieta Rosello2, Silvina Juarez3, Andrea Mangano4, Cecilia Gamba2 and Silvina Kuperman5
1Hospital de Pediatría Juan P. Garrahan ‐ CONICET, 2Hospital de Pediatría Juan P. Garrahan, 3Lab. de Biologia Celular y Retrovirus, Hospital de Pediatría Prof Dr Juan P Garrahan, 4Lab. de Biologia Celular y Retrovirus, Hospital de Pediatría Prof Dr Juan P Garrahan ‐ CONICET, 5Hospital de Pediatría Juan P. Garrahan
Background/Case Studies: The identification of a 32 base pair deletion in the cc‐chemokine receptor 5 gene (CCR5 delta 32 allele) that has direct correlation with resistance to HIV infection has prompted worldwide investigations of the allele frequency in different populations, with special interest in Cord Blood Banks. Since the Argentinean is a mixed population, with South‐American as well as European ancestry, we aim to study the CCR5‐delta 32 allele frequency in cord blood samples.
Study Design/Method: We report the frequency of this allele, detected by PCR‐RFLP, in 220 cord blood donors enrolled according to standard procedures from the Argentinean population. The ethnic origin was collected by a survey at the time of recruitment, and samples divided in 4 groups A: Latin‐American from European ancestry (60% of the samples), B: South‐American (25% of the samples), C: Mixed AB (13% of the samples); D: other origin (1% of the samples). In order to further characterized our ethnic populations, we also studied locus HLA‐A; ‐B and ‐DRB1 (by PCR‐SSO) and calculated the allele frequencies in groups A and B.
Results/Finding: Overall, 6.8% were heterozygous for the mutation, distributed on each group as follows: 9.02% Latin‐American from European ancestry, 1.82% South‐American, 6.9% Mixed AB population; 0% other origin. There were no homozygous individuals in the samples studied. Regarding HLA frequencies, results are shown in Table 1.
TABLE 1. BP1
| Top Antigen frequencies | |||
|---|---|---|---|
| Latin‐American from European Ancestry | South‐American | ||
| A* 02 | 0,267 | A* 02 | 0,364 |
| A* 03 | 0,118 | A* 03 | 0,100 |
| A* 01 | 0,111 | A* 24 | 0,082 |
| A* 24 | 0,103 | A* 01 | 0,073 |
| B* 35 | 0,141 | B* 35 | 0,255 |
| B* 44 | 0,103 | B* 44 | 0,109 |
| B* 07 | 0,088 | B* 07 | 0,091 |
| B* 08 | 0,076 | B* 51 | 0,082 |
| DRB1* 11 | 0,156 | DRB1* 04 | 0,173 |
| DRB1* 04 | 0,145 | DRB1* 08 | 0,118 |
| DRB1* 07 | 0,118 | DRB1* 14 | 0,100 |
| DRB1* 15 | 0,111 | DRB1* 13 | 0,091 |
Conclusion: The frequency observed for CCR5 delta 32 allele is lower than that reported for European populations but consistent with the lack of presence in South‐American originary populations. Also, we found allele frequencies in group A to be more resemblant to Caucasian population and group B to Hispanic population, according to OPTN/UNOS data base (https://www.transplantpro.org/news/kidney/optn-public-comment-proposal-offers-alternate-cpra-calculation-method/) supporting the idea of a mixed population. It is worth noticing that the samples selected belong to 3 different regions through the country, being the most distant collection center 935km from the bank. Further studies will be needed to increase the number of geographical regions as well as ethnic groups from our country.
BP2
Deletion of Cellular Prion Protein (PrPC) Results in Peripheral Lymphocytosis and Larger Platelets in a Knockout Mouse Model
Meng‐Lei Zhu*1,2, Yan Zheng1,2, Guangyuan Li1,2, Yu Li1, Howard J Meyerson1,2, Wenquan Zou1 and Robert W Maitta2,3
1Case Western Reserve University, 2University Hospitals Cleveland Medical Center, 3Case Western Reserve University School of Medicine
Background/Case Studies: Cellular prion protein (PrPC) is a GPI‐anchored cell surface glycoprotein that is expressed mainly in the brain but also in peripheral organs including blood, bone marrow (BM), and lymphoid tissue. PrPC can be converted post‐translationally into scrapie‐PrP (PrPSc), which is involved in the pathogenesis of neurodegenerative diseases including Creutzfeldt‐Jakob disease, kuru in humans, and scrapie and bovine spongiform encephalopathy in animals. However, biological functions of PrPC have yet to be conclusively elucidated.
Study Design/Method: In this study, PrPC knockout mice (KO) are utilized to investigate the role of PrPC in the hematopoietic system with controls of age and sex‐matched PrPC transgenic mice harboring a slightly augmented PrPCexpression. Peripheral blood was examined by hematology analyzer to establish counts. Bone marrow, thymus, spleen, lymph nodes, and peripheral blood were harvested and analyzed by flow cytometry using a comprehensive panel of fluorochrome‐conjugated antibodies specific for all hematologic cell precursors/ lineages. Histology of bone marrow, spleen, thymus and lymph nodes were evaluated by light microscopy.
Results/Finding: Complete blood count (CBC) showed a significant increase of WBC in KO mice. Closer analysis of WBC differential revealed that the elevated number of WBC in KO mice was due to lymphocytosis. Specifically, KO mice had a 3‐fold increase in the absolute lymphocyte count (KO 7.59 ± 4.63 x10⁹/L vs. WT 2.90 ± 1.32 x10⁹/L, p = 0.0303), as well as a higher lymphocyte percentage compared to controls. KO mice also had a trend toward higher hemoglobin, RBC, and hematocrit compared to WT mice. Additionally, platelet count in KO mice was higher than control mice. Of interest, the mean platelet volume indicating platelet size was significantly increased in KO mice compared to controls (KO 6.00 ± 0.29 fL vs. WT 5.24 ± 0.56 fL, p=0.0140). A comprehensive flow cytometric analysis of all cell lineages revealed no significant differences in the numbers of RBC and megakaryocyte in BM, and of lymphocytes in the thymus, spleen and lymph nodes. Histological analysis of BM, thymus, spleen and lymph node tissue from KO and WT animals failed to show morphological differences between the two groups.
Conclusion: Absence of PrPC resulted in significant leukocytosis and specifically higher absolute count and percentage of lymphocytes, as well as larger platelets in peripheral blood, but does not appear to affect hematopoiesis and lymphopoiesis. Our findings indicate that PrPC might be critical in the survival and trafficking of lymphocytes in peripheral blood. The molecular mechanisms underlying the observed changes in lymphocytes and platelets, and whether these involve functional changes in these cells will be subject of future studies.
BP3
Potential Role of CD8+FOXP3+ Regulatory T Cells Derived Exosomes in Their Immune Modulation
Yiming Yang*, Rufeng Xie and Jie Yang
Blood Engineering Laboratory, Shanghai Blood Center
Background/Case Studies: Exosomes are defined as one type of membrane vesicles secreted into extracellular space by most types of cells and are reported to involve in intercellular communications, mediate biological process. Human periphery blood CD8+FOXP3+ Tregs cells are reported as more stable regulatory cells with greater inhibition effects. However, CD8+FOXP3+Tregs derived exosomes and their functions involved in CD8+Tregs mediated immune‐modulation were seldom reported.
Study Design/Method: CD8+ T cells were freshly purified from PBMCs, cultured with anti‐CD3/CD28 antibody packaged beads and IL‐2, and then polarized with TGF‐β and rapamycin into CD8+FOXP3+ Treg cells. The harvest cells were co‐cultured with CD3/CD28 beads stimulating CD4+CD25‐ effector cells in the transwell plate. The supernatant derived from CD8+ Tregs was collected and ultrafiltrated by centrifugation and the remaining solution was precipitated with PEG. The harvest precipitation was resuspended in PBS and exosomes were analyzed by SEM and NTA. Exosome surface marker CD63, CD81, TSG101 and other proteins expression were evaluated by flow cytometry and western blot. microRNA was isolated with miRcute miRNA kit and miR‐155, let‐7b, let‐7d were measured by qPCR. The precipitated exosomes were further purified by CD63 immunoaffinity capture and co‐cultured with effector cells to investigate their function in immune modulation.
Results/Finding: As compared with direct contact co‐culture, separated CD8+Treg cells could suppress the proliferation of effector cells with a small decline (p>0.05), which means some non‐contact factors involved in the CD8+ Treg mediated immune modulation. A total number of 4.57 ± 0.52 × 10⁸/106 cells exosomes were harvest. Electron microscope analysis demonstrated a kind of round‐shaped membrane vesicle 50‐150nm in diameter (145.1± 6.7nm by NTA). CD63 and CD81 were expressed on these exosomes and western blot experiments confirmed the expression of those exosome surface markers CD63, TSG101. Besides, TGF‐beta and NOX2 were also expressed on CD8+FOXP3+Treg derived exosomes. Compared with their IL‐2 induced effecter CD8+ counterparts, CD8+Treg derived exosomes contained higher levels of miR‐155, let‐7b and let‐7d (p<0.05). And the addition of CD8+ Treg cells derived exosomes demonstrated a dose‐depend inhibition on the proliferation of CD4+ effector cells.
Conclusion: CD8+CD103+Treg cell could secrete extracellular vesicles ranged in 50‐150nm diameter and those exsomes could involve in CD8+Treg mediate immune modulation.
BP4
The Stability of Ex‐Vivo Induced Polyclonal Human CD8+ Regulatory T Cells (Tregs) in Inflammation and Transfusion
Juan Sun*, Yiming Yang and Jie Yang
Shanghai Blood Center
Background/Case Studies: Regulatory T cells (Tregs), containing CD4+ and CD8+ subtypes, play an essential role in immune regulation and autoimmune disease prevention which makes it a potential candidate for cell therapy on autoimmune disease (AIDs). Unfortunately, due to the instability of natural CD4+Foxp3+regulatory T cells (nTregs) in inflammation conditions (including instability of Foxp3, conversion to pro‐inflammatory effector cells and was unable to modify established disease), thus, it is needed to investigate CD8+ regulatory T cells stability both in vitro and in vivo.
In our previous works, we found that CD8+ Treg has an effective therapeutic function on CIA mice. In this study we aim to investigate the stability of induced polyclonal human CD8+regulatory T cells in inflammation and transfusion.
Study Design/Method: Human CD8+ Tregs were induced with TGF‐β1 and rapamycin from CD8+ T lymphocytes in vitro. Collagen‐induced arthritis (CIA) mice were induced with type‐two collagen as an autoimmune disease model. In vitro the stability of CD8+ Tregs when encountering with inflammation were test by Foxp3 expression, Th1 and Th17 cells conversion in inflammations conditions (IL2+TGF‐β1+IL21+IL23 and IL2+TGF‐β1+IL1β+IL6) on day3, day6 and day9. In vivo, CD8+ Tregs were transfused into CIA mice and then their survival in mice and Foxp3 express were evaluated to reveal the stability of CD8+ Tregs in an inflammation condition model. Additionally, we also investigate the stability maintenance of CD8+Tregs when induced factor TGF‐β1 and rapamycin were removed by testing the Foxp3 expression on day3, day6 and day9.
Results/Finding: Ex vivo induced human CD8+ Treg were Foxp3+ (90.40 ± 1.40%) and did not secret IL17A (both in supernatant and % of cells). Foxp3 express in CD8+ Tregs were maintained after induced factor TGF‐β1 and rapamycin were removed on day3, day6 and day9. In vitro, Foxp3, IL2 and IFN‐γ expression has no significant difference when compared with controlled Tregs on day3, day6 and day9 and did not secret IL17A when encounter with inflammation conditions (IL2+TGF‐β1+IL21+IL23 and IL2+TGF‐β1+IL1β+IL6). In vivo, CD8+ Treg cells were transfused into CIA mice on the peak of disease onset (35 days after the first Collagen immunization, has inflammation condition in vivo) to test CD8+ Tregs survival. CD8+ Tregs were found in CIA mice foot (27.4 ± 2.03%), blood (4.55 ± 1.03%) and spleen cells (1.90 ± 0.05%) 72 hours after transfusion and their % of foxp3+were remained.
Conclusion: The results revealed that ex‐vivo induced and expanded human CD8+Tregs are stable in inflammation and transfusion and can maintain Foxp3 expression when induced factor were removed, these make CD8+ Treg a novel and stable cell for potential cell therapy on AIDs. This research can provide some instructive reference and improve the utilization of blood components.
BP5
Tolerogenic Dendritic Cells Induced By mTOR Suppression and Control Inflammation in Chs Model through S6K Related Proteins Translation Inhibition.
Li GAO*
Shanghai Blood Center
Background/Case Studies: Tolerogenic dendritic cells (tDCs) adoptive cellular immunotherapy is a cutting edge strategy for treating hypersensitivity response disease, in which immune responses are directed against self‐antigens, such as atopic dermatitis, systemic lupus erythematosus (SLE), rheumatoid arthritis (RA),et al. However, the traditional strategy base on the tDCs was usually unstable and inconspicuous through cytokines inducing processing so that might be the limitations on tDC adaptive cell therapy in future clinical use.
Study Design/Method: Human tDCs were derived from fresh purified monocytes from PBMNCs isolated from buffy coat and induced by mTOR inhibitors (rapamycin and temsirolimus) in safe concentrations confirmed by apoptosis assay when the cells were completely differentiated. The mature markers and endocytisis were detected by flow cytometry. The production of cytokines and chemokines was measured using ELISA. Mechanism investigation was analysis by Real‐time PCR and Western blotting. Contact hypersensitivity (CHS) model, an atopic dermatitis animal model, was treated with tDCs induced via mTOR suppression and analyzed by ear thickness and tissue leukocytes number calculating.
Results/Finding: Human tDCs treated with mTOR inhibitors had a lower mature marker CD83/CD80/CD86 expression after TLR signaling activation, accompanied with a set of cytokines and chemokines remarkably down‐regulated in a concentration dependent manner but not the LPS absent group. Moreover, mTOR suppression extremely reduced the capacity of LPS treated human DCs to stimulate autogenic naïve T cell proliferation, which is one of the most important characteristics of tDC. Beyond expectation, the common signal transduction pathway, MAPK and NF‐κB pathway, were not the signal target so that it could hardly be the explanation for the tolerogenic performance of tDC when exposure to LPS stimulation. However, the P70S6K and its downstreanm proteins, especially the protein S6, which controls the protein translation, were shown in charge of the tolerogenic induction mechanism. The data were also supporting the suggestion that rare difference on mRNA transcription of the related functional proteins in tDCs induced by mTOR inhibitors when exposure to LPS stimulation from the non‐induced cells, although there was more transcription of IDO induced by mTOR inhibitors. More important, edema responses of ears were clearly weakened in the CHS model and recruited less leukocytes to the tissue when co‐sensitized with mTOR inhibitors or with tDCs induced by mTOR inhibitors suggested that the tDC induced by mTOR suppression were able to control hypersensitivity inflammation response in vivo.
Conclusion: Accordingly, tDC induced by mTOR suppression is a potent adoptive cellular immunotherapy strategy for treating hypersensitivity response disease and the induction mechanism of it might be through suppressing systematically effective function proteins by mTOR‐S6 related protein translation inhibition.
Blood Product Biochemistry
BP6
Accumulation of Bioactive Lipids during RBC Storage Varies Widely Amongst Donors
Xiaoyun Fu*1,2, Mikayla Anderson1 and James C Zimring1,2
1BloodworksNW Research Institute, 2University of Washington School of Medicine
Background/Case Studies: Red blood cells (RBCs) undergo many changes when stored under blood banking conditions, collectively known as the storage lesion. Bioactive lipids generated during RBC storage have been implicated in certain adverse outcomes. Recently, we reported that bioactive lipids, especially polyunsaturated fatty acids (PUFAs) and their oxidized products (oxylipins) accumulate during RBC storage despite leukoreduction. To evaluate the extent of membrane lipid degradation and oxidation in stored RBC units among the donor population with different blood groups, we quantified PUFAs and lysophospholipids (LPLs) in 405 leukoreduced RBC units.
Study Design/Method: RBC units from different donors were acquired and processed on day 43 (one day past their expiration). 35 bioactive lipids including 10 common Fatty acids, 10 oxylipins, and 15 LPLs were analyzed by liquid chromatography‐tandem mass spectrometry with multiple reaction monitoring (LC‐MS/MS‐MRM). Total fatty acid concentrations of selected units were also analyzed. A One‐way ANOVA test was used to determine significant difference of analytes amongst the different blood groups.
Results/Finding: We observed a wide distribution in concentration of major PUFAs in 405 stored RBC units. For example, arachidonic acid (AA) ranges from 0.5 ‐10.7 µM, linoleic acid (LA) (1.4‐28 µM), dihomo‐γ‐linolenic acid (DGLA) (0.1‐0.8 µM), eicosapentaenoic acid (EPA) (0.03‐3.1 µM), docosahexaenoic acid (DHA) (0.2‐3.0 µM), and alpha‐linolenic acid (ALA) (0.06‐2.3 µM). Ten oxylipins including HETEs, HODEs, and DiHOMEs, and 15 LPLs including LPCs, LPSs, and LPEs all showed a large variation in concentration among donors. Of 35 analytes quantified, 25 showed a significant difference in concentration among different blood types by one‐way ANOVA testing (FDR<0.05). The AB Rh+ blood group consistently exhibited the lowest concentration of major PUFAs, while the O Rh‐ blood group showed the highest, averaging a two‐fold difference in concentration (O Rh‐/AB Rh+). The fold increase of O Rh‐/O Rh+ among PUFAs ranges from 1.3 to 2.1, suggesting the Rh blood group, independent of the ABO blood group, correlates with donor to donor variation in lipid metabolism.
Conclusion: The wide distribution in the concentration of bioactive lipids among 405 stored RBC units suggests that lipid degradation is highly donor‐dependent. Red blood cell blood type, such as Rh antigen, as well as ABO blood group correlated with, and may influence the degradation and oxidation of membrane lipids during RBC storage.
BP7
Compatibility of the Intercept® Blood System for Red Blood Cells (RBC) with Leukocyte Reduced (LR) As‐1, As‐3 and As‐5 RBCs
Mary Ann Schott, Blake Warbington, Garrett Villegas, Nina Mufti and Anna Erickson*
Cerus Corporation
Background/Case Studies: The INTERCEPT Blood System for RBCs inactivates pathogens and leukocytes in RBC components for transfusion using amustaline to form nucleic acid adducts, preventing replication of a broad range of contaminating pathogens and leukocytes. INTERCEPT RBC prepared from AS‐5 RBC demonstrated 24h recovery that met FDA requirements. A US Phase 3 clinical study evaluating transfusion safety and efficacy of LR INTERCEPT RBC is enrolling patients. This study evaluated compatibility of input LR RBC in AS‐1 and AS‐3 additive solutions (AS) compared to AS‐5.
Study Design/Methods: Whole blood in CPD (AS‐1/AS‐5) or CP2D (AS‐3) was LR by filtration. RBC in AS were prepared on day (D) 1 following donation. Matched pairs, prepared for each AS (AS‐1, AS‐3, AS‐5), were composed of 1 Test RBC (T) processed with the INTERCEPT system, stored in SAG‐M, and 1 untreated Control (C) stored in the respective AS. All RBC were stored at 1‐6°C and assessed throughout 35 day storage.
Results/Findings: T RBC had 51 ± 2g Hb and Hb recovery of 97 ± 1%. D2 hemolysis was similar for T and C RBC and D14 hemolysis was not higher in T (Table). pH of AS‐1 and AS‐5 T RBC was slightly lower than C, while AS‐3 T RBC had higher pH than C. ATP in all T units was significantly higher than C. Lactate and K+ levels were lower in T than in C. Differences in Na+ were significant only for AS‐3 input RBC, where T RBC were slightly higher than C. The different glucose concentrations in the AS are reflected in the glucose levels of T in SAG‐M and Control in AS‐1, AS‐3 or AS‐5. AS‐1 and AS‐3 C glucose levels were higher than T, while AS‐5 T was lower.
Conclusion: All D2 measured in vitro parameters of treated RBC were similar to untreated Control, suggesting that the INTERCEPT Blood System for RBC is compatible with LR AS‐1 and AS‐3 RBC inputs in addition to the current Phase 3 study AS‐5 RBC input.
TABLE 1. BP7: RBC in‐vitro function post treatment (mean±SD; n=4)c
| Input RBC AS | AS‐1 | AS‐3 | AS‐5 | |||
|---|---|---|---|---|---|---|
| Treatment Arm | Test (SAG‐M)b |
Control (AS‐1) |
Test (SAG‐M)b |
Control (AS‐3) |
Test (SAG‐M)b |
Control (AS‐5) |
| Hematocrit,% | 61 ± 2 | 61 ± 2 | 61 ± 0 | 63 ± 3 | 62 ± 0a | 59 ± 1 |
| Hemolysis D2,% | 0.0 ± 0.0a | 0.0 ± 0.0 | 0.0 ± 0.0a | 0.1 ± 0.0 | 0.0 ± 0.0 | 0.0 ± 0.0 |
| Hemolysis D14,% | 0.1 ± 0.0 | 0.1 ± 0.0 | 0.1 ± 0.0a | 0.2 ± 0.0 | 0.1 ± 0.0 | 0.1 ± 0.0 |
| pH 37°C | 6.7 ± 0.0a | 6.9 ± 0.0 | 6.7 ± 0.0a | 6.6 ± 0.0 | 6.7 ± 0.0a | 6.9 ± 0.0 |
| Total ATP,μM/gHb | 7.6 ± 0.3a | 5.2 ± 0.3 | 7.3 ± 0.2a | 5.5 ± 0.3 | 7.3 ± 0.4a | 4.9 ± 0.5 |
| Extracellular Lactate,mM | 5 ± 1a | 6 ± 1 | 7 ± 0 | 8 ± 0 | 6 ± 0 | 6 ± 1 |
| Extracellular Glucose,mM | 32 ± 1a | 50 ± 3 | 29 ± 1a | 38 ± 1 | 25 ± 0a | 28 ± 1 |
| Extracellular Na+,mM | 142 ± 2 | 143 ± 2 | 138 ± 1a | 137 ± 1 | 144 ± 1 | 141 ± 1 |
| Extracellular K+,mM | 1 ± 0a | 4 ± 0 | 1 ± 0a | 5 ± 0 | 1 ± 0a | 4 ± 0 |
ap<0.05, paired t‐test
bINTERCEPT Blood System for Red Blood Cells is not approved for commercial use.
cThis project has been funded in whole or in part with Federal funds from the DHHS; ASPR; BARDA; Contract No. HHSO100201600009C.
BP8
Detection of Micrornas As Quality Markers for the Characterization of Blood Products Using Biocompatible Gold Nanosensors
Marie‐Pier Lambert1, Marie‐Pierre Cayer2, Denis Boudreau1 and Danny Brouard*2
1Université Laval, 2Héma‐Québec
Background/Case Studies: To ensure availability of biological products to hospitals, blood banks have developed and validated multiple storage conditions for each of their products to maximize shelf life and quality. In the case of labile products, their metabolism is known to remain active during storage, leading to storage lesions. microRNAs (miRNAs) levels are modulated by these storage‐related damages, which makes miRNAs ideal candidates as potential biomarkers of quality monitoring. Lately, nanoparticles have been widely studied and used for biosensing applications. The objective of this work is to develop biocompatible gold nanosensors for sensitive, selective and direct detection of biomarkers to characterize and assess the quality of blood products delivered to hospitals.
Study Design/Method: Gold nanoparticles (GNPs) surrounded by a fluorescent silica shell were prepared using a wet chemistry method. miRNA‐223 was chosen as a potential target, since it is strongly expressed in platelet concentrates and its concentration fluctuates according to storage lesions. Custom RNA and DNA molecular beacons were designed and used as a probe for the specific detection of miRNA‐223 targets in PBS and human plasma. These fluorescent transducer probes were conjugated at the surface of fluorescent silica shell‐GNPs using an EDC/NHS cross‐linking reaction. The hybridization reaction between the target and the probe initiates an energy transfer mechanism which can be recorded by fluorescence.
Results/Finding: GNPs (49 ± 6 nm) surrounded by a thick fluorescent silica shell (22 ± 2 nm) were prepared and used as nanosensors because of their optimal luminescence properties and long‐term stability. Conjugation of the probe onto the nanoparticles was confirmed by fluorescence spectroscopy and microscopy, as well as nanoparticle tracking analysis. The fluorescent response of the molecular beacons was studied and showed a reproducible and linear relationship ( = 0.96 and = 0.98) with miRNA‐223 concentration, down to a 10‐nM limit of detection. Hybridization assays in 1% human plasma appear to demonstrate denaturation of RNA probes and targets.
Conclusion: Biocompatible fluorescent GNPs were prepared and used as tools for blood product characterization. The conjugation of a molecular beacon at the surface of nanoparticles was achieved and characterized using spectroscopic and microscopic techniques. The functionalization of the probe is still being optimized. The fluorescence response of the molecular beacon was characterized for the detection of a model miRNA target in PBS and in 1% human plasma.
BP9
Energy Metabolism Profile of Erythrocytes during Storage
Suping Ren*, Qun Yu, Yanbing Wang, Changlan Li and Yu Wang
Department of Blood Products and Substitutes, Beijing Institute of Transfusion Medicine
Background/Case Studies: The moment the mature red blood cells (RBCs) leave the bone marrow, it is optimally adapted to perform the binding and transport of oxygen and its delivery to all tissues. Red blood cells modulate oxygen transport, protect hemoglobin from oxidant‐induced damage, and maintain the osmotic environment of the cell. Glycolysis is the only energetic metabolic pathway for mature RBCs to obtain ATP which is the energy for RBCs to maintain a number of vital cell functions. Generally, the current methods used to measure RBCs glycolysis are not in living state in real‐time, or are destructive to cells or require radioactivity.XF technology can be applied to different types of cells, in which the red blood cells are suspended and the cell shape and size are different from other cells, and more importantly, RBCs have no nucleus, mitochondria and other organelles, so application of the XF technology in erythrocytes and exploration of the assay conditions are necessary.
Study Design/Method: An extracellular flux (XF) methodology has been particularly advantageous, and it is capable of dynamic monitoring of cell energy metabolism and the glycolytic rate in real‐time. And the ATP concentration was determined with ATP Colorimetric/Fluorometric Assay Kit.
Results/Finding: Our research found that it was better to seed the suspended RBCs onto Cell‐Tak‐coated microplates before the assay, which can improve the glucose response of RBCs. And we found that a 37°C incubation for each blood sample produced a much better glucose response. We varied the concentrations of glucose, and found that 40 mM glucose was optimal. We then applied the method to measure the energy metabolism changes in RBCs isolated from storage blood samples. The glucose response and glycolysis capacity of the RBCs decreased to 81.5% and 78.2%, respectively, on Day 42; this result was validated by the ATP content changes.
Conclusion: These standardized parameters lay the framework for using XF analysis to profile RBCs glycolysis and the technology will complement information gathered from more extensive and high‐throughput metabolomics platforms.
BP10
Evaluation of Donor Characteristics of Lipemic Whole Blood Donations
Lara de Laleijne‐Liefting, Johan W Lagerberg*, Pieter F van der Meer and Dirk de Korte
Department of Product and Process Development, Sanquin Blood Bank
Background/Case Studies: Several studies on the impact of lipemic plasma on the quality of blood products indicate that lipemic plasma has an adverse effect on the quality of platelets and red blood cells (RBC) during storage. As a follow‐up on those studies, a possible relationship between donor characteristic and the occurrence of lipemic plasma was examined. The aim of this study was to expand the knowledge of donor characteristics in relation to the quality of blood products.
Study Design/Method: From whole blood (WB) donations with lipemic plasma, RBC concentrates in SAGM were produced and in vitro quality during cold storage was determined. In addition, donor characteristics were obtained. These data were used to investigate whether there is a relationship between certain donor characteristics, triglyceride (TG) level in plasma and hemolysis during storage. Quality control data of normal RBC were used as control group (n=74).
Results/Finding: 26 lipemic WB donations were evaluated. The data indicated no direct relationship between the plasma TG level and the degree of hemolysis during storage. In 21 out of 26 lipemic donations, hemolysis at day 42 of storage was > 0.4% while in the control group hemolysis in all units was <0.4%.
Only two lipemic donations were obtained from a female donor, while in the donor population more women are registered as active donor. The mean age of donors in this study was 50 years (21‐67 years). The mean BMI was 26; 8 donors were in the normal range (BMI 18.5‐25); 14 donors showed overweight (BMI 25‐30), and 4 donors were obese (BMI> 30).
The donations were drawn between 2:40 and 8:40 PM: four donations before 6:00 PM, seven donations between 6:00 PM and 7:30 PM and 11 donations after 7:30 PM. It should be noted that at our blood bank most blood donations take place in the evening.
The normal TG level in blood is ≤1.7 mmol/L. TG in the lipemic plasma units was on average 5.9 mmol/L, range from 3.3 mmol/L to 12.8 mmol/L, whith 3 units showing TG >10 mmol/L. These 3 units were donated after 8:00 PM.
Conclusion: In 81% of RBC concentrates made from lipemic WB, hemolysis was greatly enhanced during storage. Based on the limited set of donations in this evaluation, a tentative conclusion is that highest chance of lipemic plasma exists in donations from men over 50 years with BMI >25, donating in the evening. More donor characteristics from donors related to lipemic units, which are rejected for production of blood products, should be collected to perform a more extensive data analysis. Based on these investigations, our blood service decided not to use lipemic WB for the production of (cellular) blood products. Donors will be provided with instructions how to prevent lipemic donations as much as possible.
BP11
High Platelet Content Can Increase Storage Lesion Rates Following Intercept Pathogen Inactivation Primarily in Platelet Concentrates Prepared By Apheresis
Hendrik B Feys*1,2, Rosalie Devloo1, Bea Sabot1, Karen De Pourcq1, Jose Coene1 and Veerle Compernolle1,2
1Belgian Red Cross‐Flanders, 2Ghent University
Background/Case Studies: Pathogen inactivation methods for platelet concentrates are increasingly being used in blood banks worldwide to make transfusion safer. In vitro studies have demonstrated the effects of pathogen inactivation on storage lesion, but little routine quality control data on blood banking outcomes have been reported.
Study Design/Method: Swirling of distributed products was monitored one year before and one year after implementation of Intercept pathogen inactivation. Metabolic parameters like pH, glucose and lactic acid were determined in a random sample of expired pathogen inactivated products. Furthermore, indicators of platelet storage lesion were measured in apheresis concentrates with premature low swirling and compared to controls with normal swirling.
Results/Finding: In an experimental phase on a limited number of products (n=6) to validate the Intercept pathogen inactivation method, pH and glucose levels decreased faster in apheresis platelet concentrates with high platelet content than with low platelet content or than in pooled buffy coat derived products. Once pathogen inactivation was implemented, routine products showed glucose exhaustion more often when prepared by apheresis compared to buffy coat derived platelet concentrates despite more plasma carryover in the former. Furthermore, the number of apheresis products with premature low swirling increased by 50% (63/12,492) compared to the previous year without pathogen inactivation (42/12,931, P=0.030, Chi‐square). In contrast, the incidence of premature low swirling in platelet concentrates prepared by the buffy coat method decreased (2/15,286 vs 10/13,488). Of note, apheresis concentrates with premature low swirling had a significantly higher median platelet count (5.0x10¹¹) than unaffected controls (3.5x10¹¹) and showed signs of increased storage lesion compared to controls expiring on day five without swirling defects. These signs included lower pH, higher lactic acid concentration, increased mean platelet volume, phosphatidylserine exposure and alpha‐degranulation.
Conclusion: The risk of increased storage lesion rates following Intercept pathogen inactivation is higher for apheresis than for buffy coat derived platelet concentrates, especially when platelet content is above 5.0x10¹¹.
BP12
In Vitro Quality of Single Dose Amotosalen/UVA Treated Platelets in 35% Plasma/65% PAS‐3 after 5 Days of Storage
Crystal Stanley1, Marguerite Kelher2, Nero Evero1, Melissa VonGoetz3, Betsy Donnelly3 and Anna Erickson*3
1Belle Bonfils Memorial Blood Center, 2University of Colorado, 3Cerus Corporation
Background/Case Studies: The INTERCEPT® Blood System for platelets is FDA approved for the ex vivo preparation of pathogen‐reduced AmicusÒ apheresis platelet components (PC) in PAS‐3 to reduce the risk of TTI, including sepsis, and to potentially reduce the risk of transfusion‐associated GVHD. Registration studies (http://ClinicalTrials.gov NCT02298842) are in progress to support approval of the TrimaÒ apheresis platform for collection of platelets components (PC) suspended in PAS‐3 and plasma. The objective of this study was to evaluate in vitro function of platelets suspended in 35% plasma/65% PAS‐3, collected using the Trima platform, after treatment with the INTERCEPT Blood System for platelets.
Study Design/Method: Double dose apheresis PC, 7.5 ± 0.6 ×10¹¹ platelets in 602 ± 52 mL, were collected on the Trima apheresis platform in 35% plasma/65% PAS‐3. A sample was taken from each donation prior to dividing the donation to produce INTERCEPT treated apheresis PC (T), using the small volume (SV) set, and an untreated control PC (C). Input volumes for replicates, n=6, were 302 ± 26mL (T) and 300 ± 27mL (C) with doses of 3.8 ± 0.3 × 10¹¹ (T) and 3.7 ± 0.3 × 10¹¹ (C). All PC were stored under the same conditions and evaluated on Day 5 and Day 7 for physical/metabolic characteristics.
Results/Finding: On Days 5 and 7 all T and C PC had pH22°C ≥6.2. The dose recovery for T was 87%±3%. On Day 5, T had lower count, volume, dose, bicarbonate and glucose compared to C PC; however, parameters predictive of in vivo function (ATP, morphology score, HSR, and ESC) were equivalent between T and C (Table 1).
Conclusion: Trima PC in 35% plasma/65% PAS‐3 treated with the INTERCEPT Blood System for platelets using the SV set and stored for 5 days retained in vitro metabolic and functional properties consistent with in vivo functionality.

BP13
Induction of Pluripotent Stem Cell‐Derived Cardiomyocyte Toxicity By Supernatant of Long Term‐Stored Red Blood Cells in Vitro
Feng‐Yan Fan1,2, Yang Yu1, Li‐Ping Sun1, Shu‐Fang Wang1, Rui Wang1, Lei‐Ying Zhang1 and Deqing Wang*1
1The Department of Blood Transfusion, The PLA General Hospital, 2The Department of Blood Transfusion, Air Force General Hospital, PLA
Background/Case Studies: Recently, multi researches have reported that longer term‐stored red blood cells(RBCs) units were associated with increased risks of clinically adverse events, especially in critically ill patients. However, other studies have concluded the negative results. Whether RBCs storage duration was associated with increased risks of clinically adverse events is uncertain and had become a popular topic. To study the adverse effects of longer term‐stored RBCs directly, we aim to look at the pluripotent stem cell‐derived cardiomyocyte toxicity induced by supernatant of suspended red blood cells(SSRBCs), and study the possible mechanism.
Study Design/Methods: ① Five doses of leuko‐reduced RBCs were prepared, and supernatant was isolated by centrifugation on d0, d14 and d35. We looked at the cardiotoxicity of SSRBCs on human‐induced pluripotent stem cell‐derived cardiomyocytes (hiPS‐CMs). HiPS‐CMs were treated with SSRBCs in 17% final volume simulating the large volume blood transfusion. Using real‐time cellular analysis (RTCA) technology the beating of hiPS‐CMs was recorded in real time in detail. ② Levels of K and lactic acid (LA) were tested using automatic biochemical analyzer.③ K and LA solution with concentrations being consistent with SSRBCs were prepared and co‐cultured with hiPS‐CMs. We analyzed the cardiotoxicity of K and LA solution on hiPS‐CMs. ④ Treated hiPS‐CMs with d35 SSRBCs, d35 K and cell culture media for 48h. The nuclear shape and integrity of filament and sarcomere was examined by immunofluorescence. Total RNA of hiPS‐CMs was isolated and mRNA analysis microarray was implemented. Screened for toxic effects related signaling pathways through bioinformatics analysis.
Results/Findings: ① d0 SSRBCs had no obvious influence on beating state of HiPS‐CMs;HiPS‐CMs treated with d14 SSRBCs stop beating, but beating patterns restored at 48h. HiPS‐CMs treated with d35 SSRBCs stop beating, and beating patterns did not restored at 48h. ② Levels of K and LA in SSRBCs changed most obviously. ③Only d35 K solution made hiPS‐CMs stop beating and can restore in 48h; d0 K, d14 K and LA solution did not influence the beating pattern in hiPS‐CMs. ④At the end of the treatment for 24h, hiPS‐CMs treated with d35 SSRBCs show obvious shrinkage. At the end of the treatments for 48h, cells treated with d35 K and d35 SSRBCs both show obvious shrinkage, the shrinkage in d35 SSRBCs group was more serious. The immunofluorescence results show the integrity of filament and sarcomere was complete and no nuclear pyknosis was detected. ⑤ Gene Expression Array results show a total of 140 genes were differentially expressed in d35 SSRBCs group compared with naive group. There was no consistent separation within the d35 K and naive group. Fifteen differently expressed genes were selected with bioinformatics method which were likely to play an important role in the cytotoxic effect.
Conclusion: ① Under the condition of simulating the large volume blood transfusion, SSRBCs of long term‐stored RBCs have toxic effect on myocardial cells. ② In addition to high potassium that induced cardiotoxicity, there must be other elements are involved in the toxic effects. ③ Further study should be applied to signal pathways on SSRBCs induced cytotoxicity. ④ Large volume transfusion of long term‐stored RBCs may be a risk factor for adverse clinical outcomes, and clinical should pay attention to it.
BP14
PAG3C: The Optimal Additive Solution for Thawed, Deglycerolized Red Cells?
Johan W Lagerberg*, Juliette Nierich, Mya Go, Charles C.M. Lelkens and Dirk de Korte
Department of Blood Cell Research, Sanquin Research
Background/Case Studies: Processing thawed, deglycerolized red cell concentrates (RCC) in a functionally closed system allows for a prolonged storage after thawing. Thawed cells are better maintained in AS‐3 as compared to SAGM. The presence of citrate in AS‐3 seems to be necessary to prevent hemolysis of thawed cells. During storage in AS‐3, ATP and 2,3‐DPG levels rapidly decline. Recently developed additive solutions like PAG3M and AS‐7 have shown to better maintain 2,3‐DPG and ATP levels during storage of normal, unfrozen, RCC. However, most probably due to the absence of citrate, these solutions are not suitable for storage of thawed cells. We therefore designed PAG3C in which the mannitol of PAG3M was replaced by citrate.
The aim of this study was to investigate the in vitroquality of thawed, deglycerolized RBC during storage at 2‐6°C in PAG3C.
Study Design/Method: Leukoreduced RCC (n=6) in PAG3C (phosphate, adenine, glucose, guanosine, gluconate, citrate) were stored at 2‐6°C. On day 8, RCCs were glycerolized using ACP215 (Haemonetics®, Braintree, MA) to a final concentration of 40% (w/v), frozen and stored for at least two weeks at ‐80°C. After thawing and deglycerolization using ACP215, RCC were resuspended in PAG3C. During storage at 2‐6°C, stability (hemolysis), ATP and 2,3‐DPG levels were determined. Results were compared with thawed RCC (prefreeze storage in SAGM, n=8) resuspended in AS‐3 (n=4) or SAGM (n=4).
Results/Finding: Pre‐freeze storage in PAG3C resulted in increased 2,3‐DPG levels at day 8 as compared to storage in SAGM, resp. 9.1 ± 7.6 µmol/g Hb and 1.9 ± 0.7 µmol/g Hb. Hemolysis during post‐thaw storage in PAG3C remained below 0.8% for 35 days and was comparable with storage in AS‐3. In SAGM, hemolysis remained below 0.8% for 7 days. During the first 2 weeks of post‐thaw storage in PAG3C, both ATP and 2,3‐DPG levels increased, followed by a gradual decline during prolonged storage. During the whole post‐thaw storage period, RCCs in PAG3C showed significantly higher ATP and 2,3‐DPG levels compared to AS‐3 or SAGM. While in SAGM and AS‐3, 2,3‐DPG levels were undetectable after 7 days post‐thaw storage, in PAG3C, 2,3‐DPG levels only decreased to 6.1 μmol/g Hb after 35 days of storage.
Conclusion: Pre‐freeze storage in PAG3C resulted in increased 2,3‐DPG levels. As compared to AS‐3, post‐thaw storage in PAG3C showed comparable hemolysis while ATP and 2,3‐DPG levels were much better maintained. Based on a maximum allowed hemolysis of 0.8% and an ATP content of >2.7µmol/g Hb, thawed RCC can be stored at 2‐6°C for 35 days in PAG3C.
BP15
Positive Effect of Bicarbonate on in Vitro Red Blood Cell Quality during Storage in the Experimental Additive Solution PAG3M
Herbert G. Korsten, Johan W Lagerberg*, Pieter F van der Meer and Dirk de Korte
Department of Product and Process Development, Sanquin Blood Bank
Background/Case Studies: In Europe, red cell concentrates (RCC) are usually stored in SAGM. During storage, in vitro red cell quality declines, including lowered energy status and increased cell lysis. Recently, several additive solutions, designed to diminish the decline in in vitro quality during storage, were developed. These new solutions, including PAG3M and AS‐7, are mainly developed to better maintain RBC 2,3‐DPG levels and energy status during storage. Compared to AS‐7, PAG3M maintains higher levels of 2,3‐DPG and higher energy status, which is necessary for function and survival of RBC in vivo. However, a recent study has shown that RBC storage in PAG3M has a negative effect on the deformability of RBCs. This effect was not seen with RBC stored in AS‐7. An important difference between PAG3M and AS‐7 is the presence of gluconate in PAG3M, while AS‐7 contains bicarbonate. Aim of this study is to investigate the effect of various concentrations of bicarbonate on the in vitroquality of RBC during storage in PAG3M.
Study Design/Method: Four variants of PAG3M were tested: PAG3M; PAG3M+52 mmol/L NaHCO3; PAG3M with 26 mmol/L gluconate replaced by 26 mmol/L NaHCO3; PAG3M with all gluconate replaced by 52 mmol/L NaHCO3. Overnight stored whole blood (n = 3) was leucocyte reduced and processed to plasma and packed RBCs. The packed RBCs were divided into 4 equal volumes and diluted with the PAG3M variants. During storage at 2‐6°C for 35 days, RCC were weekly sampled and analyzed for hematological, metabolic and rheological parameters.
Results/Finding: The internal pH of RBC stored in PAG3M variants with bicarbonate remained significantly higher than that of RBCs in PAG3M during the entire storage period. ATP content at day 35 of storage showed no significant differences between the PAG3M variants, all values were around 5 µmol/g Hb. Hemolysis during storage was comparable for all PAG3M variants and was below 0.4% at the end of storage. At day 21 of storage, 2,3‐DPG levels showed no significant differences between the PAG3M variants (21‐25 µmol/g Hb). After 35 days of storage, the fraction of non‐deformable cells, as measured with ARCA, was significantly lower for the PAG3M variants with reduced gluconate concentration. While with PAG3M, about 30% of the RBCs were non‐deformable, this was reduced to 15‐24% for these PAG3M variants.
Conclusion: Full or partial replacement of gluconate in PAG3M by bicarbonate has a positive effect on the deformability during storage without negatively affecting the positive effects of PAG3M on RBC metabolism (high ATP and 2,3‐DPG levels).
BP16
Refrigerated Platelets (PLTs) Collected with a Trima System and Stored in Isoplate Platelet Additive Solution (PAS) Display Better Adhesive Function Under Physiologic Flow Than PLTs Collected on an Amicus System in Intersol PAS
Kristin Reddoch*, Crystal Lafleur, Grantham C. Peltier and Andrew P Cap
U.S. Army Institute of Surgical Research
Background/Case Studies: Platelets (PLTs) are vital for effective treatment of hemorrhage. Cold (4°C, 4C) storage of PLTs in platelet additive solution (PAS) is a promising alternative to conventional storage at room temperature (RT) due to a lower risk of bacterial concerns, preservation of PLT function, and mitigation of PLT activation. Currently only 2 apheresis (AP) and PAS systems are FDA‐approved for use in the US: Trima and Isoplate‐PAS (ISO; Terumo) and Amicus and Intersol (INT; Fenwal). The goal of this study was to assess the adhesive function of long‐term cold‐stored PLTs collected by FDA‐approved AP/PAS methods.
Study Design/Method: PLTs were collected (n=4‐5) in 65% ISO using a Trima or in 65% INT using an Amicus and stored for 15 days at RT and 4C. Samples were tested on Day 1 (baseline, BL), 5, 10, and 15 of storage to assess PLT adhesion under shear flow (Bioflux). ACD vacutainer tubes were collected from donors and centrifuged to obtain red blood cells (RBCs) for all Bioflux runs. Simulated whole blood was created by combining PLTs labeled with calcein‐AM with RBCs at 40% Hct. Labeled blood was perfused through microfluidic channels (Fluxion) coated with 100 ug/ml type‐1 collagen at 720s‐1 shear rate. Images were acquired every 30 sec for 10 min using a fluorescent microscope and % surface coverage was reported. Data were analyzed using two‐way ANOVA and posthoc Tukey test with significance at P<0.05.
Results/Finding: Both RT‐INT and RT‐ISO PLTs showed significantly decreased adhesion by Day 5 of storage compared to BL (BL: 11.6 ± 1.7%, RT: 4.9 ± 1.2%; p<0.005). 4C‐INT samples showed no difference in adhesion at any timepoint compared to BL‐INT but significantly enhanced adhesion compared to both RT‐INT and RT‐ISO. In contrast, 4C‐ISO PLTs showed significant enhancement of surface coverage compared to BL‐ISO by Day 5 (P=0.03) and compared to 4C‐INT by Day 10 (P<0.01).
Conclusion: Our work suggests that 4C storage of PLTs collected with a Trima AP system in ISO for up to 15 days offers a significant enhancement in adhesive function compared to PLTs collected with an Amicus system in INT and stored at 4C. These results are surprising since both 4C‐INT and 4C‐ISO have been shown to express similar levels of CD62P, PAC‐1, and phosphatidylserine and may suggest differences in PAS PLT intracellular signaling. As expected, storage at 4C of PLTs collected on either platform demonstrated superior function to RT storage. A PLT product with superior hemostatic function and a shelf‐life 3x longer than the current standard‐of‐care provides the potential for shipment of products to underserved areas and may bolster PLT availability for trauma care in the US.
BP17
Synergic Apoptotic Effect of Irradiation and Storage on White Blood Cells in Whole Blood Components
Jeong‐Shi Lin*1,2, Fen‐Lan Lin1, Li‐Chun Shih1, Fu‐Ru Li1, Ying‐Ju Chen1,2 and Tzeon‐Jye Chiou1,2
1Division of Transfusion Medicine, Department of Medicine, Taipei Veterans General Hospital, 2School of Medicine National Yang‐Ming University
Background/Case Studies: It has been reported that short‐term storage of blood facilitates white blood cell (WBC) apoptosis therefore releasing transforming growth factor‐beta that modulates post‐transfusion red blood cell (RBC) alloimmunization in mouse. But whether gamma‐irradiation and storage have synergic apoptotic effect on WBCs was rarely reported. Early apoptotic cells will exclude 7‐aminoactinomycin D (7‐AAD), while late stage apoptotic cells will stain positively, due to the passage of these dyes into the nucleus where they bind to DNA.
Study Design/Methods : Samples were acquired from 29 whole blood components in citrate‐phosphate‐dextrose with adenine (CPDA‐1) preservative. Each sample was split in two parts, one of which was irradiated with 3000 cGy by Gammacell® 3000 Elan cesium‐137 blood irradiator (Best Theratronics Ltd, Ottawa, ON, Canada). Samples were stored at 4o C. Complete blood counts were analyzed using Sysmex KX‐21N™ automated hematology analyzer (Sysmex Corporation, Chuo‐ku, Kobe, Japan). The BD FACSCanto™ II flow cytometer with 7‐AAD DNA dye (BD Biosciences, San Jose, CA, USA) was used to measure the late apoptotic fraction of WBCs and lymphocytes in irradiated and unirradiated aliquots after 2 weeks of storage.
Results/Findings: In unirradiated group, two‐week storage at 4°C did not induce significant change of WBC counts (5.7 ± 2.3 vs. 5.3 ±1.7 x 10⁹/L, p = 0.18). After 2‐week storage, WBC counts were similar between the unirradiated and the irradiated groups, but percentages of apoptotic WBCs and lymphocytes were significantly higher in irradiated group compared with those of unirradiated group, p < 0.001 and p < 0.001, respectively (Table 1).
Conclusion: Increased percentages of late stage apoptotic WBCs and lymphocytes were observed in 3000 cGy gamma ray irradiated whole blood stored at 4°C for 2 weeks compared to unirradiated whole blood stored at the same condition. The impact of apoptotic WBCs on post‐transfusion RBC alloimmunization in human needs further study.
TABLE 1. Comparisons of white blood cell counts and percentages of apoptotic cells in whole blood components after 2‐week storage between unirradiated and irradiated groups (n = 29)
| Unirradiated | Irradiated | p‐value* | |
|---|---|---|---|
| WBC count (x 109/L) | 5.3 ± 1.7 | 5.6 ± 2.2 | 0.059 |
| 7‐AAD positive WBC (%) | 61.8 ± 27.1% | 78.7 ± 20.2% | <0.001 |
| 7‐AAD positive lymphocyte (%) | 52.8 ± 27.7% | 64.7 ± 22.9% | <0.001 |
*Wilcoxon signed‐rank test.
WBC = white blood cell; 7‐AAD = 7‐aminoactinomycin D.
BP18
The IMPACT of the Pathogen Reduction and Storage Medium on the Platelet Activation in Platelet Concentrates
Muhayyokhon Azimova*, Gennadiy Galstyan, Tatjyana Gaponova, Irina Galtseva, Yuliya Davydova, Nikolay Kapranov and Valeriy Savchenko
Federal State‐Funded Institution National Research Center for Hematology of the Ministry of Healthcare of the Russian Federation
Background/Case Studies: Pathogen inactivation treatment and platelet additive solutions improve the safety of transfusion of platelet concentrates (PCs). There are a few data on the impact of the inactivation technology and the additive solutions on the functional activity of platelets during storage. The aim of this study was to evaluate the impact of the pathogen inactivation technology and additive solutions on the functional activity of platelets during storage.
Study Design/Method: All leukoreduced PLT units were collected using automated blood collection system. The median PC collection target was 8 x 10¹¹ platelet. PCs were suspended up to 600 ml in 100% plasma (PCpl) (n=25) or 30% plasma and 70% additive solution SSP+ (PCpas) (n=24). From the both types of suspended PCs the volumes on 100 ml were separated in plastic containers and used as a control (CPCpl and CPCpas). The next day the remaining 500 ml of PCs were treated according to the technology of INTERCEPT Blood System Platelet (amotosalen+ ultraviolet A light). From each type of the pathogen reduced PCs (PRPCpl and PRPCpas) 100 ml of samples were separated in the plastic containers. In the control samples on 1, 3, 5 and 7 day, and in the pathogen reduced PCs on 3, 5 and 7 storage days the platelet activation was investigated. We assessed the platelet activation as the proportion of spontaneously activated platelets according the detection of antigen CD62P+ on the membrane surface and the percentage of specifically activated platelets, i.e. platelet count, associated with the antibody PAC‐1 under the action of the agonist adenosine diphosphate (ADP).
Results/Finding: During the storage the spontaneous activation of platelets significantly (p<0.05) increased in all PCs. The maximal activation was achieved on the 7thday (CPCpl from 17.8 ± 3.4 % to 61.4± 2.5%; CPCpas from 28.7 ± 2,2% to 68.4 ± 1,9%; PRPCpl from 41.7 ± 6.8 % to 66.3 ±5,3%; PRPCpas 53.5 ± 3.2% to 65,0 ± 3,6%). Spontaneous activation of platelets on the 7th day was less pronounced in CPCpl than CPCpas (61.4± 2.5% vs 68.4 ± 1.9%; p<0.001), but did not differ significantly between the PRPCs. The percentage of ADP‐activated platelets during storage for 7 days significantly decreased (CPCpl from 52 ± 7.6% to 12 ± 2,5%; CPCpas from 49 ± 5.8% to 17.7 ± 1.8%, PRPCpl from 30.8 ± 5.3% to 8.0 ± 2.9 %; PRPCpas from 26.3 ± 4.3% to 18.8 ± 2.8%). The percentage of ADP‐activated platelets on the 7th day of storage was significantly higher in CPCpas than CPCpl (17.7 ± 1.8% vs. 12.0 ± 2.5%; p<0.01) and in PRPCpas than PRPCpl (18.8 ± 2.8% vs. 8 ± 2.9%; p<0.01).
Conclusion: Inactivation of pathogens had no effect on markers of platelet activation. The functional activity of the platelets had been influenced by the suspending medium and duration of storage of PCs.
Platelet, Granulocyte and RBC Immunobiology
BP19
A Case of Neonatal Alloimmune Thrombocytopenia Associated with the Low‐Frequency Platelet Antigen HPA‐21bw in Chinese
Yongmei Nie*1 and Jinping Ma2
1Guangzhou Blood Center, 2Division of Gastrointestinal & Pancreatic Surgery, The First Affiliated Hospital of Sun Yat‐sen University
Background/Case Studies:
Human platelet antigens (HPA) has proven to be contributory in some clinical situations related to platelet alloimmunization. Neonatal alloimmune thrombocytopenia (NAIT) is one of the most common alloimmunization disorders. It is characterized by maternal alloimmunization against paternal fetal platelet antigens. In the study, a case of an infant with severe NAIT given birth by a healthy Chinese mother was reported.
Study Design/Method: 20 cases of NAIT were involved in the study. Serologic and genetic studies of the blood samples from the NAIT infants were conducted. All the blood samples of 5 ml were extracted from the mothers and the infants with EDTA‐anticoagulant were detected for HPA‐21bw gene and antibody. The HPA‐21bw gene was amplified by PCR‐SSP. DNA Sequencing of HPA‐21bw PCR products was followed while HPA‐21bw antibody of mothers' blood samples were detected.
Results/Finding: Among these 20 NAIT cases, one case showed that the Sequence‐based typing studies identified a G>A mutation at Nucleotide 1960 (a glutamic acid > lysine substitution at Position 628) in the 11th exon of the GPIIIa gene in the sample of the infant. This mutation was recently identified in a report as HPA‐21bw. While the mother's sample was identified to be G/G at the same nucleotide position which was observed as homozygous.HPA‐21a/a. The other 19 samples from the infants and the mothers were identified to be HPA‐21a/a homozygote.
Conclusion: We identified the HPA‐21bw allele from one case among 20 Chinese infants with severe NAIT. The low‐‐frequency platelet antigen HPA‐21bw should be paid attention to in NAIT in Chinese.
BP20
Acute Autoimmune Hemolytic Anemia Due to Anti‐Ena autoantibody Successfully Treated with Rituximab
Elena Nedelcu*1, Megan Desai1, Jennifer Green2, Kathleen Bensing3, Austin Turner1, David Head1 and Pampee Young1
1Vanderbilt University Medical Center, Department of Pathology, Microbiology and Immunology, 2Vanderbilt University Medical Center, Department of Medicine, Division of Hematology, 3Immunohematology Reference Laboratory, Versiti/BloodCenter of Wisconsin
Background/Case Studies: Autoimmune hemolytic anemia (AIHA) due to anti‐Ena antibody has been previously reported to be associated with sudden massive intravascular hemolysis, disseminated intravascular coagulation, and fatal outcomes. This case is of AIHA due to anti‐Ena antibody successfully treated with rituximab.
Study Design/Method: This is a retrospective case review of a 69‐year‐old male with a past medical history of cirrhosis due to non‐alcoholic steatohepatitis status post orthotopic liver transplant (OLT) 18 months prior to presentation who presented with one‐month history of progressive anemia, scrotal infection, right knee swelling, and pain. He had a history of multiple blood product transfusions at the time of transplant, and he was known to have blood type A Rh D‐positive with a negative red blood cell (RBC) antibody screen. At presentation, his hemoglobin (Hb) was 5.6 g/dL, hematocrit (Hct) 16%, reticulocyte 0.3%, direct bilirubin (bili) 4 g/dL. lactate dehydrogenase (LDH) 533 Unit/L (Ref: 125‐220), haptoglobin 254 mg/dL (Ref: 40‐273). Treatment included antibiotics for septic arthritis confirmed by arthrocentesis and cultures. Blood Bank testing revealed an autoantibody present in his plasma and a weakly positive direct anti‐human globulin test (DAT) for IgG but negative for complement. Alloantibodies against major RBC antigens were ruled out. He received one unit of least incompatible blood type O phenotypically matched RBC unit. Over the course of the next five days, the Hb and Hct decreased to 4.1 g/dL and 12%, respectively, direct bili increased to 12.3 mg/d, reticulocyte slightly increased to 0.9%, and over two more days the haptoglobin decreased to less than 8 mg/dL. Bone marrow biopsies and aspirate showed a hypercellular marrow with erythroid hyperplasia consistent with stress erythropoiesis without any evidence of underlying neoplastic disorder. Additional work‐up performed at a reference laboratory identified an autoantibody with anti‐Ena specificity.
Results/Finding: The patient was treated with 1 mg/kg of prednisone, followed by 325 mg/m2 rituximab infusions weekly for one month. His clinical picture and labs including CBC, CMP, LDH were monitored weekly. He responded to chemotherapy quickly by demonstrating improvement in his anemia, and his two‐month return visit showed Hb and Hct increased to 10g/dL and 32%, respectively.
Conclusion: Unlike prior cases with reported fatal outcomes, weekly rituximab infusion and monitoring resulted in clinical recovery and significant anemia improvement in this 69‐year‐old male who developed AIHA with anti‐Ena specificity.
BP21
Baicalin ‐‐ A Main Active Ingredient of Scutellaria Baicalensis Georgi from Yin‐Chen‐Tang, Inhibit Red Blood Cell Immunization in Mouse Model
Xueyu Jiang*
Shanghai Blood Center
Background/Case Studies: YIN‐CHEN‐TANG is widely used in preventing hemolytic disease of the newborn(HDN) caused by Rh and ABO maternal‐fetal incompatibility since 1970s in China.Baicalin,originally isolated from Scutellaria baicalensis Georgi which is a major component of YIN‐CHEN‐TANG, is an anti‐inflammatory agents and has a good safety records in clinic. It could reduce the severity of experimental autoimmune encephalomyelitis (EAE), asthma, colitis, systemic lupus erythematosus(SLE) and other immune diseases.However,its potential in inducing transfusion tolerance remains to be explored.The aims of our study are to find if baicalin could inhibit red blood cell (RBC) immunization and to elucidate the possible mechanism of YIN‐CHEN‐TANG in preventing HDN. Study Design/Method: We used human red blood cells with adjuvant Lipopolysaccharide (LPS) and transfused mice to induce antibodies, as an experimental system to study the effect of baicalin on RBC immunization. Mice were divided into a normal control group, a human RBC transfused positive control group receiving human RBC and LPS intravenously weekly for five weeks, a control group receiveing dexamethasone (10mg/kg/day) intraperitonealy daily for five weeks,a treatment group receiving baicalin (250mg/kg/day) intraperitonealy daily for five weeks. Assessment of human RBC immunization was performed by measuring serum immunoglobulin G (IgG) and immunoglobulin M (IgM) against human RBC weekly. And the lymphocyte changes in spleen are also monitored by flow cytometry. Results/Finding: We found that baicalin treatment decreased serum IgG but not IgM production significantly since the second week, with a concomitant reduction in Th17 cells and increase in CD4 regulatory T cells in both spleen and mesenteric lymph nodes. And there are no significant differences in the percentage of Th1,Th2,Tfh and Tfr CD4 subpopulation among all groups.In addition, baicalin treatment didn't decrease the size of spleen and the percentage of CD4 positive cells in spleen in baicalin treatment mouse but in dexamethasone treated mouse. Conclusion: Our results indicate that baicalin could inhibit RBC immunization especially IgG production without the damage to the function of spleen,while dexamethasone as a wildly used immune‐suppressive drug in blood transfusion could damage the function of spleen.Considering its good safety records in clinic, it may be exploited for suppressing transfusion immunization events. In addition, our results elucidate the inhibitory effect in antibody production of baicalin may be a possible mechanism for YIN‐CHEN‐TANG as a widely used Chinese herbal medicines in preventing HDN.
BP22
Comparison of Immucor's Pak Plus and Pak Lx Assays for the Detection of Human Platelet Alloantibodies
Randy M Schuller*1, Sarah Kloss1, Sara Crew1 and Sandra J Nance2
1American Red Cross, 2American Red Cross and American Rare Donor Program
Background/Case Studies: Alloantibodies directed against human platelet membrane glycoproteins (GP) Ia, IIa, IIb, IIIa, Ib, IX, IV, and CD109 have been implicated in several clinically significant disorders such as fetal and neonatal alloimmune thrombocytopenia (FNAIT), post‐transfusion purpura (PTP), refractoriness to platelet transfusions, and passive transfer of antibodies in donor plasma. Polymorphic epitopes on these GPs give rise to 28 unique human platelet antigens (HPA). Identification of the specific platelet alloantibody is crucial in diagnosing and treating these bleeding disorders.
Currently the only 510k FDA approved test permits the identification of these HPA antibodies to the glycoprotein level. Immucor has recently released Pak Lx, a research use only (RUO) assay in the United States that has the ability to identify HPA antibodies to a single nucleotide polymophism (SNP). We compared the performance of Pak Lx to the FDA approved Immucor PakPlus.
Study Design/Method: We compared PakPlus and Pak Lx results from 40 plasma and serum clinical specimens. Group 1 contained a single HPA alloantibody specificity with or without HLA antibodies (n=26). Group 2 included 5 specimens with HLA antibodies alone and Group 3 consisted of 9 patient samples that were negative for both HPA and HLA antibodies.
Pak Lx utilizes a Luminex bead based assay which allows the user to report antibodies to the platelet specific antigen (HPA‐1, HPA‐2, HPA‐3, HPA‐4, HPA‐5, GPIV) and HLA Class I. PakPlus uses an ELISA method and results can only be reported to the glycoprotein location (GPIIb/IIIa, GPIa/IIa, GPIb/IX, GPIV) along with HLA Class I. However, based upon the pattern of reactivity observed in the PakPlus and Pak Lx assays it is possible to determine the most probable HPA antibody specificity to the HPA SNP.
Results/Finding:
| Concordant results | Discordant results | |||
|---|---|---|---|---|
| Antibody | No. of Samples | PakPlus | Pak Lx | No. of Samples |
| HPA‐1a | 5 | HPA‐1a | HPA‐1a+HLA | 2 |
| HPA‐1a + HLA | 2 | HPA‐1a +HLA | HPA‐1a | 1 |
| HPA‐1b | 2 | GPIa/IIa+HLA | HPA‐5a+HLA | 3 |
| HPA‐1b + HLA | 2 | HPA‐5b + HLA | HPA‐5b | 1 |
| HPA‐5a + HLA | 1 | GP Ib/IX+ GPIIb/IIIa+HLA | GPIb/IX+ GPIa/IIa+ GPIIb/IIIa | 1 |
| HPA‐5b | 4 | |||
| HPA‐5b +HLA | 2 | |||
| HLA | 5 | |||
| Negative | 9 | |||
Conclusion: When analyzing HPA antibody specificity, there is 100% concordance observed for HPA‐1a, HPA‐1b and HPA‐5b antibodies. The PakPlus assay had difficulty discriminating HPA‐5b from HPA‐5a antibody when HPA‐5a antibody was present (3 false positive samples) although the PakPlus signal OD to cutoff OD ratio was significantly higher for HPA‐5a when compared to HPA‐5b in these samples. The discordant HLA Class I antibody results between the assays was isolated to very weakly positive antibody (within 10% of the cut‐off for PakPlus and <2.0 adjusted ratio for Pak Lx). We conclude that Pak Lx is an easy to use platelet alloantibody screening method that has the ability to differentiate HPA antibodies to the allele level.
BP23
Histo‐Blood Group Antigen Lewis Y Promotes Cell Migration Via Regulation of Microtubule Acetylation
Huijun Zhu* and Ping Lu
Shanghai Blood Center
Background/Case Studies: Blood group antigens are critical for transfusion practices as antibodies raised against them can cause severe transfusion reaction. Beside this, blood group antigens themselves are composed of sugar chains, proteins, lipids, etc, which may be involved in various biological processes. Lewis Y is a histo‐blood group antigen belonging to ABH family. LeY consists of carbohydrate chains which may play important roles in cell recognition, adhesion as well as migration, which are all critical steps in tumor progression and thus attracts wide researches focusing on its relevance in tumor biology. LeY is demonstrated to affect cell mirgration via various mechanisms. However. although changes in cytoskeleton organization is the basis for cell motility, little is known about the association between cytoskeleton and LeY. As microtubule and its construction unit tubulin participate in various steps of cell migration, we aim to explore the role of LeY in microtubule and cell migration using breast cancer cells, which may provide reference to clinical study of other histo‐blood group antigens and change the way of thinking in transfusion practice.
Study Design/Methods: We first manipulate LeY expression in breast cancer cells by overexpression or siRNA knockdown of fucosyltransferases, and block LeY activity in MDA‐MB231 cells using anti‐LeY antibody, to verify the effect of LeY on cell migration. Then, we detect acetyl‐α‐tubulin level change as microtubule acetylation is a sign for stability. To establish the role of LeY in cell migration via microtubule modification, we use HDAC6 specific (Tubacin) and nonspecific (TSA) inhibitors to minimize deacetylation of acetyl‐α‐tubulin and test again the effect of FUT1 overexpression on cell motility.
Results/Findings: FUT1 overexpression increases both LeY expression and cell migration, while FUT1 knockdown leads to the opposite. LeY activity blockade by anti‐LeY antibody also significantly inhibits cell migration. Western Blot and Immunostaining results show α‐tubulin acetylation level is negatively related with LeY expression. Tubacin or TSA treatment increases the acetyl‐α‐tubulin level while inhibits cell migration; in the meantime, the significance of FUT1 overexpression in promoting cell migration is eliminated.
Conclusion: It can be concluded from the results above that LeY can promote cell migration via regulation of α‐tubulin acetylation, wherein LeY may have interaction with deacetylase HDAC6. As tumor promoter, HDAC6 becomes the target of many anti‐cancer drugs. We demonstrated the potential association of LeY and HDAC6 function in this study. Many blood group antigens are also carbohydrate chains, which are not only critical in blood group determination, compatible transfusion and immunological reaction, but may also have an effect in the initiation and development of diseases as tumor, similar to LeY; they can even be components in a network with other important molecules and contribute to the destiny of diseases. Transfusion of blood products is frequently needed by tumor patients. Most attention is focused on the search of compatible blood for reducing transfusion reaction. However, it may lower the chance for the disease to advance to take account of roles of blood group antigens per se, which needs further evidence from future theoretical and clinical researches.
BP24
Microparticles from Blood Products Are a Major Component for the Immune System Modulation
Marion Pinheiro*1,2,3, Elayeb Rahma1,2,3, Marie Tamagne1,2,3, Rachid Djoudi1, Laurence Pelle1, Thibaut Bocquet1, France Pirenne1,2,3,4 and Benoît Vingert1,2,3
1EFS Ile de France, 2IMRB U955 ‐ Eq2, 3Laboratory of Excellence GR‐Ex, 4Université Paris Est
Background/Case Studies: One of the main risks of allogenic blood transfusion is humoral alloimmunization against red blood cells (RBCs). Alloimmunization depends on the immunologic status of the patient; however, specific constituents of the blood products could be involved in the post‐transfusion immunization and explain the difference between alloimmunized and non‐alloimmunized patients. Microparticles (MPs), contained in blood products, have been shown to exhibit immunomodulation properties. Few studies have focused on MP phenotype and none on lymphocyte‐derived MPs. The aim of this study was to determine whether purified MPs obtained from blood products could modulate the immune system, according to their cellular origin and phenotype.
Study Design/Method: MP characteristics were studied in the whole blood (WB) of healthy donors before and after leukoreduction (n=44). Lymphocyte‐derived MPs were phenotyped by flow cytometry. The expression of 17 markers known to be expressed by lymphocytes was analyzed. Total and lymphocyte‐derived MPs isolated from leukoreduced RBC units were sorted by flow cytometry. The cytokine content of purified MPs was measured by Luminex assay. The purified MP effect on antibody production was studied in CD4+/B lymphocyte co‐cultures. The functionality of purified MPs was also evaluated by proliferation and cytokine secretion assays from total and differentiated CD4+ T cells.
Results/Finding: In the 44 blood donors included in this study, we measured an average of 6.8 106 MPs/ml in plasma from WB. After leukoreduction, we observed a higher number of MPs (8.8 106 MPs/ml, P<0.05). The most striking point is the high variability between blood donors: 36.107 to 9.109 before and 14.107 to 24.109 MPs after leukoreduction. All the 17 markers studied were present on CD4+ and/or CD19+ MPs. Among the 34 cytokines studied, 20 were detected in MPs, independently of their cellular origin. In CD4+/B lymphocyte co‐cultures, MPs induced Ig secretion. This Ig titer was the same regardless of MP phenotype or cellular origin. In cultured CD4+ lymphocytes, all type of MPs stimulated also the proliferation of Tfh, Th17 and Treg subtypes and the secretion of TNFα, IL2, IL17A, IL21, IL10, but not IL4 and IFNγ cytokines. The induction of Ig production, CD4+ lymphocyte proliferation and cytokine secretion were correlated with the number of MPs in culture. Interestingly, an inhibition of these immune responses was observed with a ratio beyond 1/4 (MPs/cells).
Conclusion: This study highlight that independently of their cellular origin and phenotype, MPs are able to activate or inhibit the immune system in a dependent dose manner. Thus, in allogenic blood transfusion, the number of MPs transfused can represent a parameter to take into account in immune responses against RBC antigen or in other immune reactions. Most importantly, this study also demonstrates a potential variable “donor” effect on the recipient immune system.
BP25
Mirasol Treatment of Day 10 Cold‐Stored Platelets in Platelet Additive Solution and Its Impact on Platelet Hemostatic Function, Activation, and Mitochondrial Integrity
Kristin Reddoch*, Robbie K. Montgomery, Ashley S. Taylor and Andrew P Cap
U.S. Army Institute of Surgical Research
Background/Case Studies: Reducing the risk of bacterial contamination in platelet (PLT) products is of great concern since PLT storage occurs at room temperature (RT). Pathogen reduction technologies (PRT) were developed to inactivate pathogens prior to transfusion; however, studies have shown that PRT may damage PLTs over the course of extended storage at RT resulting in a greater loss of function than what is normally concomitant with platelet storage lesion. Storage of PLTs in platelet additive solution (PAS) at 4°C helps to preserve PLT function and reduces the risk of contamination. In this study, we established the impact of PRT performed after long‐term cold‐storage of PLTs in PAS, instead of before storage, on PLT function, mitochondrial respiration, and cell death parameters.
Study Design/Method: PLT units were collected in PAS (n=3) and stored at 4°C for up to 10 days. After this time period, the bag was treated using Mirasol PRT (riboflavin and UV). Samples were obtained and tested on the day of collection (baseline, BL), pre‐Mirasol (PRE), post‐Mirasol (POST), and 30 minutes post‐Mirasol (POST‐30). Aggregometry (ADP, Collagen, TRAP), ROTEM, flow cytometry (CD62P [P‐Selectin], lactadherin [PS], PAC‐1 [activated GPIIb‐IIIa], and GPIb), high‐resolution respirometry (Oroboros), and imaging flow cytometry (Amnis) were used for analysis. Data are reported as means±SEM, and paired student's t‐tests were used to determine statistical significance (p<0.05).
Results/Finding: On Day 10, P‐Selectin levels were significantly higher in PRE than BL (p=0.03). Mirasol treatment caused a significant increase in PAC‐1 expression compared to PRE (PRE: 10.5 ± 3.1%, POST: 28.1 ± 4.7%; p=0.04), which remained after incubation. A significant drop in both Collagen and TRAP aggregation was observed in POST samples compared to PRE, but ADP aggregation response was preserved. No differences in P‐Selectin, GPIb expression, and mitochondrial respiration were observed between PRE and POST samples. POST‐30 samples displayed significantly less function, higher activation levels, and lower mitochondrial respiration compared to PRE and POST.
Conclusion: PRT treatment of PLT units in PAS after 10 day storage at 4°C presents a unique alternative to PRT treatment of PLTs prior to RT storage. In addition to providing a lower risk of bacterial contamination, 4°C‐stored PAS PLTs may provide better preservation of hemostatic function than standard‐of‐care RT PLTs, even after Mirasol PRT treatment. However, we show here that Mirasol PRT of Day 10 4C‐stored PAS PLTs followed by incubation (30 minutes or more) results in widespread cell damage and should be avoided.
BP26
Safety Evaluation of Lyophilized Canine Platelets in a Model of Coronary Artery Bypass Graft (CABG)
Todd M. Getz*1, Arthur P. Bode1, Anne S Hale2, Michael Stanton3, Mark Johnson4 and G. Michael Fitzpatrick3
1CellPhire, 2BodeVet, Inc, 3Cellphire, 4MPI Research
Background/Case Studies: Cellphire has completed a micro dose clinical safety trial using lyophilized human platelets. Cellphire also evaluated the safety of Lyophilized Canine Platelets (LCP) in comparison to Liquid Stored Canine Platelets, following intravenous administration in a model of on‐pump coronary artery bypass graft (CABG) in the canine. This safety study was in support of a future Phase II human clinical trial in cardiac patients.
Study Design/Method: Three groups of eight mixed breed hounds underwent CABG to create an anastomosis and were administered LCPs equal to 33, 10, and 3.3% of the Total Circulating Platelet Count (TCPC). One group of four animals served as the vehicle group which received lyophilization platelet‐formulation buffer, and another group of four animals received control (2‐day old liquid‐stored platelets). Safety was assessed through the collection of blood loss data, evaluation of blood flow through the bypass graft, evaluation of the development of acute thrombosis, and maintenance of patency through the graft over the 4 hr evaluation period. Full necropsies with complete tissue analysis were also performed. Efficacy signals were evaluated through the collection of blood loss data and coagulation endpoints (PT, APTT, Fibrinogen, and TEG).
Results/Finding: The results demonstrated that administration of the test article at doses up to 33% of the TCPC was not associated with any unexpected mortality, adverse changes in hematology or coagulation parameters, development of thrombosis at the anastomosis sites, or evidence of adverse thrombosis formation either clinically or microscopically regardless of group. The mortality noted on study was considered to be related to the surgical model and not a result of test article administration. The results also demonstrated that administration of doses of 10% and 33% of the TCPC produced a significant decrease in blood loss. The LCPs at 10% and 33% TCPC were as effective in mitigating blood loss as 2‐day old liquid‐stored platelets and trended towards being more effective. No appreciable differences in coagulation parameters were observed between groups.
Conclusion: The results of the study demonstrate that administration of LCP up to 33% of the TCPC was safe in a canine CABG model. The data also demonstrate that administration of LCP at doses of 10% and 33% of the TCPC reduced blood loss. These results suggest a starting dose above 3.3% TCPC may be required to achieve an effective dose in future human Phase II trials in cardiac patients. Although the study was not powered for efficacy, these data indicate a level of safety, as 10% TCPC had similar efficacy signals as 33% TCPC with no observable severe adverse events. The starting effective dose may vary depending on the clinical indication. Future studies will be required.
This study was funded under BARDA contract HHSO100201300021C.
BP27
Test Sample Stability Determination for Flow Cytometric (FC) Anti‐IgA Assay
Wendy Beres*1, Sandra Nance2, David Moolten3 and P. Dayand Borge3
1American Red Cross, Assay Development, 2American Red Cross, Immunohematology Reference Laboratory, Biomedical Services, 3American Red Cross, Medical Office
Background/Case Studies: A FC based anti‐IgA detection assay was developed using plasma. Samples were assessed for storage stability in a 13 day study. Ten donor plasma samples were stored at 2‐8°C and tested in duplicate for anti‐IgA on 2, 4, 6, 9, 11, and 13 days of storage. Previously evaluated frozen low and high level positive control samples were thawed on day 1, stored, and tested in parallel with the donors.
Study Design/Method: Pooled IgA coated red cells (RBC/IgA) were prepared from 10 group O donor samples. The washed pool was tannic acid treated (25ug/mL) at 37°C±1°C for 15 ± 1 minute (min), washed, and incubated with a 0.5mg IgA/mL solution of human IgA (MP Biomedicals, Santa Ana, CA) at 37°C±1°C for 60 ± 15 min. Diluted test/control plasma was incubated with RBC/IgA for 30 ± 15 min, washed, and incubated with fluorescein isothiocyanate (FITC)‐labeled anti‐human IgG (Jackson ImmunoResearch Lab, West Grove, PA) at lot‐specific optimal dilutions for 45 ±15 min. The samples were washed and 50k events were acquired from each sample by the Becton Dickinson FACScanTM (San Jose, CA) FC for analysis. The testing was performed and repeated in days 2, 4, 6, 9, 11 and 13.
Results/Finding: The FC detects fluorescence emitted when the FITC‐labeled anti‐IgG is bound to the anti‐IgA in the plasma, bound to the RBC/IgA and reports the presence or absence of anti‐IgA. The mean result and standard deviation (SD) for each sample tested over the 13 days was calculated. The negative, low, and high controls performed as expected in each test run. Over the 13 days of storage there was no evidence of false negative or positive results.
Conclusion: The anti‐IgA test normal donor samples showed individual variation, but overall showed stability over 13 days providing evidence to allow storage of samples prior to testing. This extended storage time allows for batching of test samples making the assay more cost effective and extending shipping time.
TABLE 1. BP27
| Donor Sample | 1 | 2 | 3 | 4 | 5 | 6 | 7 | 8 | 9 | 10 |
|---|---|---|---|---|---|---|---|---|---|---|
| Day 2 | 5.07 | 7.58 | 8.77 | 4.72 | 3.90 | 7.81 | 6.12 | 1.48 | 11.01 | 8.43 |
| Day 4 | 1.01 | 1.41 | 1.03 | 1.42 | 0.83 | 1.28 | 1.12 | 0.40 | 1.11 | 2.90 |
| Day 6 | 0.88 | 1.44 | 2.15 | 1.66 | 0.67 | 1.83 | 1.03 | 0.28 | 2.87 | 1.87 |
| Day 9 | 3.03 | 5.82 | 9.98 | 5.99 | 3.00 | 7.28 | 3.61 | 0.91 | 13.74 | 8.30 |
| Day 11 | 1.66 | 3.41 | 14.68 | 3.51 | 1.74 | 5.78 | 2.13 | 0.56 | 13.23 | 6.32 |
| Day 13 | 7.94 | 3.26 | 9.82 | 2.39 | 1.36 | 2.65 | 1.72 | 0.42 | 10.89 | 4.38 |
| Mean % positive | 3.26 | 3.82 | 7.74 | 3.28 | 1.92 | 4.44 | 2.62 | 0.67 | 8.81 | 5.36 |
| 1 SD | 3.93 | 2.41 | 5.02 | 1.82 | 1.24 | 2.78 | 1.91 | 0.48 | 5.21 | 2.75 |
BP28
The Study on PCR‐SSP Technique for the Genotyping of CD36 329‐330del.AC Mutation and the Genetic Polymorphism of CD36 329‐330del.AC in Chinese Population
Lilan LI* and Guoguang WU
Nan‐Ning Institute of Transfusion Medicine
Background/Case Studies: CD36 (Platelet glycoprotein IV, SCARB3) is an important and characteristic platelet antigen implicated in immune‐mediated thrombocytopenia in Chinese population. Except anti‐HLA, anti‐CD36 is the most common antibody of clinically relevant platelet antibodies in Chinese population, which is associated with the high frequency of CD36 deficiency in China. CD36 gene mutation is the main reason that leads to CD36 deficiency. CD36 329‐330del.AC(frameshift at AA110)mutation is one of the CD36 mutations that causes CD36 deficiency. The aim of this study was to develop a DNA‐base PCR‐SSP technique for the genotyping of CD36 329‐330del AC mutation individuals, and to investigate the structural features of the CD36 329‐330delAC gene in CD36 deficiency individuals found in Guangxi population and the gene polymorphism of CD36 329‐330delAC in Chinese population as well.
Study Design/Method: Designed both of sequence‐specific reverse primers for the CD36 nucleotide polymorphism 329‐330AC and 329‐330del.AC alleles, as well as their common forward primer. 12 of CD36 329‐330delAC mutated DNA samples and 90 of CD36 329‐330delAC wild type DNA samples that confirmed the CD36 gene by DNA sequencing were used to evaluate the effectiveness of the developed PCR‐SSP technique. Using the developed technique, the structural features of the CD36 329‐330delAC gene in 107 CD36 deficiency individuals that found in Guangxi population were studied, and the gene polymorphism of CD36 329‐330delAC gene was investigated in 300 unrelated individuals, including 168 Han and 132 Zhuang ethnic group individuals in Guangxi Zhuang Autonomous Region of China.
Results/Finding: We established a DNA‐Base PCR‐SSP technique for the genotyping of CD36 329‐330del.AC mutation individuals. 100% concordance of genotyping results of 102 DNA samples that compared by both of the DNA sequencing and the developed PCR‐SSP genotyping technique. In 107 of CD36 deficiency individuals found in Guangxi population, 17 of 329‐330del.AC/del.AC individuals (15.9%) were detected that included 1 of 329‐330del.AC/del.AC homozygous individual and 16 of 329‐330AC/del.AC heterozygous individuals. The allele frequency of CD36 329‐330del.AC was 0.0119 and 0.0492 in Han and Zhuang ethnic group individuals in Guangxi Region of China, respectively.
Conclusion: In this study, we successfully established a DNA‐base PCR‐SSP technique for the genotyping of CD36 329‐330del AC mutation individuals. Using the developed technique, the structural features of the CD36 329‐330delAC gene in CD36 deficiency individuals that found in Guangxi region of China and the gene polymorphism of CD36 329‐330delAC in Chinese population were investigated.
Clinical Oral Abstract Session: Pediatric Transfusion Medicine
C1‐A01B
Comparison of CPD Versus CP2D/AS3 Products for Large Volume Transfusions in Pediatric Patients Undergoing Cardiac Surgery
Nabiha H. Saifee*1,2,3, Dee Townsend‐McCall3, Theresa Nester1,2 and Meghan Delaney1,2,3
1Dept of Laboratory Medicine, University of Washington, 2Bloodworks NW, 3Seattle Children's Hospital
Background/Case Studies: The safety of RBCs preserved in additive solutions has been demonstrated for small volume transfusions in pediatric patients. Yet, many pediatric hospitals utilize RBCs in additive solutions for large volume transfusions. This study examines the impact of large volume transfusions (LVTs) using blood products stored in citrate phosphate dextrose (CPD) versus in citrate phosphate double dextrose (CP2D)/Nutricel (AS3) additive solutions in pediatric patients undergoing cardiac surgery.
Study Design/Method: A retrospective review of pediatric patients who underwent a LVT during either a Norwood or heart transplant surgery 28 months before or after the transfusion service lab changed from CPD to CP2D/AS3 blood products was conducted. All RBC and whole blood (WB) units were irradiated just prior to issue and were less than 7 days old for children less than 5 years. LVT was defined as ≥20mL of WB and/or RBCs per kg body weight. Patients receiving supernatant removed RBCs for ABO‐incompatible heart transplants were excluded. Laboratory values and clinical data points were compared using statistical analyses performed with R v3.3.1; continuous variables using the Wilcoxon rank sum test and categorical variables using the Fisher exact test. A 2‐sided P ≤ 0.05 was considered statistically significant.
Results/Finding: The study included 46 patients in the CPD group and 43 patients in the AS3 group. Age, weight, LVT amount, number of intraoperative RBC, platelet, and cryoprecipitate units transfused per patient in the two arms were not significantly different. The mean LVT amount in the CPD and AS3 groups was 197 and 190 mL WB and/or RBCs per kg, respectively. Intraoperative plasma usage was higher in the AS3 group and 28% of the CPD group received a WB unit. Sodium, glucose, and phosphorous levels were significantly higher in the AS3 group immediately post‐surgery but not on day 1 post surgery. Lactate levels were significantly higher in the AS3 group compared to the CPD group immediately post‐ and day 1 post‐surgery. Mortality, total length of stay (LOS) and ICU LOS were not significantly different between groups.
Conclusion: This analysis suggests that pediatric patients may have significant increases in sodium, glucose, phosphorous, and lactate levels immediately after LVT with CP2D/AS3 products in cardiac surgery. The increased sodium and phosphorous can be attributed to use of AS3 preserved RBCs, and the increased glucose to double dextrose content of CP2D plasma components. These changes had no effect on mortality or LOS.
TABLE 1. C1‐A01B
| Changes in Immediate Post‐ and Pre‐surgery Lab Values | Changes in Day 1 Post‐ and Pre‐surgery Lab Values | |||||
|---|---|---|---|---|---|---|
| CPD | CP2D/AS3 | p value | CPD | CP2D/AS3 | p value | |
| pH | 0.06 ± 0.12 (0.05) | 0.02 ± 0.09 (0.02) | 0.18 | 0.07 ± 0.09 (0.07) | 0.03 ± 0.09 (0.02) | 0.03 |
| Sodium, mEq/L | 4.8 ± 4.5 (5.0) | 7.2 ± 4.0 (7.0) | 0.01 | 3.8 ± 5.6 (4.0) | 4.5 ± 5.4 (5.0) | 0.54 |
| Potassium, mEq/L | 0.3 ± 0.8 (0.3) | ‐0.02 ± 0.5 (‐0.1) | 0.02 | 0.4 ± 0.8 (0.4) | 1.0 ± 0.9 (1.0) | <0.01 |
| Creatinine, mg/dL | 0.05 ± 0.12 (0.0) | 0.02 ± 0.13 (0.0) | 0.40 | 0.11 ± 0.20 (0.0) | 0.05 ± 0.25 (0.0) | 0.16 |
| Glucose, mg/dL | 25.9 ± 76.9 (17.5) | 84.4 ± 85.4 (91.0) | <0.01 | 9.9 ± 63.4 (10.5) | 33.0 ± 74.7 (31.0) | 0.11 |
| Ionized calcium, mmol/L | 0.07 ± 0.22 (0.02) | 0.08 ± 0.20 (0.05) | 1.00 | ‐0.10 ± 0.17 (‐0.11) | ‐0.07 ± 0.17 (‐0.06) | 0.19 |
| Lactate, mmol/L | 1.6 ± 1.7 (1.0) | 3.0 ± 2.2 (2.7) | <0.01 | 0.9 ± 1.5 (0.5) | 1.5 ± 1.5 (1.2) | 0.02 |
| Phosphorous, mg/dL | ‐0.5 ± 1.4 (‐0.7) | 0.6 ± 1.7 (0.3) | <0.01 | ‐0.4 ± 1.3 (‐0.4) | 0.1 ± 1.2 (0.0) | 0.16 |
| Values listed as mean±sd (median) | ||||||
C2‐A01B
Variation in Transfusion Support of ABO‐Incompatible Pediatric Heart Transplant Patients in the United States and Canada
Christina L Dean*1, Harold Sullivan1, Ross Fasano1, Lori J West2, Nancy Robitaille3 and Cassandra Josephson1
1Emory University School of Medicine, 2University of Alberta, 3CHU Sainte‐Justine
Background/Case Studies: ABO‐compatibility restriction on cardiac allograft transplantation limits organ availability. To increase donor heart availability for children, ABO‐incompatible heart transplants (ABOiHT) are performed with similar outcomes and rejection rates to ABO‐compatible transplants (ABOcHT). Transfusion support of children undergoing ABOiHT may contribute to the success of these transplants, however no standard guidelines for anti‐A and anti‐B titer testing, or therapeutic intervention to reduce antibody titers exist world‐wide. The study aim was to survey current blood bank and antibody reduction practices for pediatric ABOiHT in the US and Canada.
Study Design/Method: A 43‐question web‐based survey was sent to 50 U.S. and Canadian pediatric blood bank directors. Participants were queried regarding pre‐, intra‐, and post‐operative blood product support, ABO titer testing, and therapeutic intervention for antibody reduction in ABOiHT recipients.
Results/Finding: The response rate was 21/50 (42%) where 19/21 centers perform ABOiHT, with 58% considering patients up to 2 years old eligible for ABOiHT. Most centers have pre‐, intra‐, and post‐operative protocols (100%, 95%, and 89%, respectively). Fifty‐three percent use anti‐A and anti‐B titer cutoffs of 1:16 for ABOiHT eligibility; 26% have variable titer cutoffs either based on age or on use of intraoperative antibody‐reduction techniques. Titer cutoffs vary for implementing antibody‐reduction strategies [1:4 (27%), 1:8 (20%), 1:16 (20%)], with 27% of centers administering therapy regardless of titer. All centers use plasma exchange as part of the antibody reduction strategy. ABO titer testing is performed intra‐ and post‐operatively at 68% and 84% of centers, respectively, at varying frequencies. In the pre‐operative setting, 74% of centers transfuse ABO‐compatible (ABOc)/type‐specific RBCs and 58% give AB plasma and platelets. In the intra‐operative setting, 42% give O RBCs only and another 42% give either O or ABOc/type‐specific RBCs. In the post‐operative setting, 47% give either O or ABOc/type‐specific RBCs, while 32% give only ABOc/type‐specific RBCs. The majority of centers give either AB or ABOc/type‐specific plasma in the intra‐ and post‐operative setting (68% and 78%, respectively). Many centers do not wash RBCs in the pre‐ or post‐operative setting (63% and 63%, respectively). Intraoperatively, 42% of centers wash all RBCs, while another 42% do not wash RBCs and the remaining 16% have varying practices.
Conclusion: Transfusion support of children with ABOiHT varies widely among U.S. and Canadian blood banks. The frequency of ABO titer testing, the titer cutoffs used as medical intervention points, and antibody‐reduction strategies are not standardized from center to center. As pediatric ABOiHT become more common, a more sophisticated understanding of optimal transfusion support and therapeutic intervention is needed.
C3‐A01B
Reevaluating Immunization Delays Post Red Blood Cell Transfusion
Alexandra Zabeida*1, Christian Renaud1, Marc H. Lebel1 and Nancy Robitaille2
1Sainte‐Justine Hospital, 2CHU Sainte‐Justine
Background/Case Studies: Current American and Canadian guidelines recommend to delay the measles, mumps, rubella (MMR) and varicella live attenuated vaccines by 6 months following transfusion of unwashed red blood cells (RBC) due to potential interference by serum antibodies. Patients chronically transfused with RBC commonly suffer from a delay or absence of MMR and varicella vaccination. There is a paucity of data concerning the true effect of modern‐day transfusions on live attenuated vaccine immunization. Vaccination guidelines from the Advisory Committee for Immunization Practices also stipulate that the effect of RBC preparations on the response to the MMR vaccine remains unknown. Over the last decades, not only has RBC handling by blood banks changed, but also fewer current blood donors have had natural mumps, measles and rubella infections, resulting in lower antibody levels in their blood. The recommendations may thus be unfounded and outdated, and prevent valuable vaccination opportunities for children with frequent blood transfusions. This places an already highly vulnerable pediatric population at risk for acquiring preventable infections. The primary aim of this project was to determine MMR vaccination immunogenicity in patients chronically transfused with RBC.
Study Design/Method: Medical charts were reviewed for vaccination and transfusion histories. MMR‐specific antibodies were quantified in 28 pediatric patients who received both doses of the MMR vaccine at 12 and 18 months of age while they were on a chronic RBC transfusion program for sickle cell disease, B‐thalassemia major, Diamond‐Blackfan anemia or pyruvate kinase deficiency. There was no formal control group; long‐term immunity rates in the literature are ≥90% for all MMR components.
Results/Finding: Table 1 shows immunogenicity to vaccine components. Delays between vaccination and serology testing averaged 6.8 years (0.5 to 16.5 years). Thirteen patients (46%) were chronically transfused at the time of serology. Twenty‐three patients (82%) seroconverted to at least one of the vaccine components.
TABLE 1. Immunogenicity to MMR vaccine components (%). N=28
|
Serology status (antibodies, IU/mL) |
Measles | Mumps | Rubella |
|---|---|---|---|
| Immune (≥10) | 60 | 68 | 64 |
| Equivocal (5.0 ‐ 9.9) | 8 | 7 | 11 |
| Non immune (<5.0) | 32 | 25 | 25 |
Conclusion: To the best of our knowledge, this is the first study designed to measure the effect of RBC transfusions on MMR vaccine immunogenicity. Although lower than the rates reported in the literature, the results suggest a high rate of immunogenicity to each component of the MMR vaccine in chronically transfused patients immunized prior to 6 months post‐transfusion. Weighing the risks and benefits of disease prevention in a highly vulnerable population, and taking into account the aforementioned results, a reevaluation of immunization delays post RBC transfusions is called for in chronically transfused infants. Post‐vaccination serology should be considered.
C4‐A01B
Cold Stored Uncrossmatched Whole Blood Can be Safely Administered to Pediatric Trauma Patients
Christine M Leeper1,2, Franklyn Cladis2, Richard Saladino2, Darrell Triulzi3, Barbara A Gaines2 and Mark Yazer*1
1University of Pittsburgh, 2Children's Hospital of Pittsburgh of UPMC, 3Institute For Transfusion Medicine
Background/Case Studies: The use of uncrossmatched cold stored whole blood (WB) is becoming increasingly popular in the initial resuscitation of trauma patients without a current ABO group. WB has advantages over conventional component therapy including greater platelet and factor concentrations, as well as less saline and additive solution compared to an equivalent volume of reconstituted whole blood. This report details the initial use of WB in pediatric trauma patients.
Study Design/Method: Pediatric trauma patients ≥3 years old and ≥15 kg with evidence of hemorrhagic shock were eligible to receive up to 20 cc/kg of cold stored, leukoreduced group O negative WB during their initial resuscitation. All WB units had a low titer of anti‐A and –B (<50) to reduce the likelihood of hemolysis in non‐group O recipients. Biochemical markers of hemolysis were measured on the day of WB transfusion and the following two days. Admission thromboelastograms were obtained and repeated as necessary during the resuscitation. After receipt of the maximum quantity of WB, conventional components were utilized.
Results/Finding: In approximately 11 months, 15 trauma patients received WB: 7 group O and 8 group A recipients, 53% male, median (IQR) age was 11 (4.5‐14) and 73% blunt trauma mechanism. Patients were severely‐injured with a median (IQR) Injury Severity Score of 36 (22‐51) and 47% mortality rate. The median (IQR) quantity of WB transfused to group O recipients was 21.9 (14.8‐24.3) ml/kg versus 13.4 (9‐18) ml/kg to non‐group O recipients. No transfusion reactions were reported. The mean ± standard deviation haptoglobin concentrations for non‐group O recipients was 51.3 ± 14.4 mg/dl on day 0, 86.3 ± 36.8 mg/dl on day 1, and 126.9 ± 45.8 mg/dl on day 2; the corresponding haptoglobin concentrations for group O recipients were 51.4 ± 38.0 mg/dl, 84.7 ± 61.5 mg/dl, and 134.8 ± 68.3 mg/dl, respectively (p>0.42 for all comparisons). Similarly there were no significant differences in total bilirubin, LDH, creatinine, and potassium at any time point. Regarding evaluation of cold platelet function, we compared the subset of patients who received WB but no warm platelets (n=7) to a historical group of pediatric trauma patients who received conventional components including warm platelets (n=14). The mean ± standard deviation platelet volume administered was 112 ± 24 cc for whole blood recipients versus 147 ± 68 cc for warm platelet recipients. When pre‐ and post‐transfusion TEG and platelet counts were analyzed, there was no difference in median platelet count or TEG maximum amplitude (MA) between cold and warm platelet groups.
Conclusion: Use of cold‐stored uncrossmatched whole blood for the resuscitation of pediatric trauma patients is feasible, acceptable, and appears to be safe. Receipt of low titer group O WB did not lead to detectable hemolysis amongst the non‐group O recipients. Given this finding, the maximum quantity of WB per patients will be increased to 30 ml/kg.
C5‐A01B
Identification of Red Blood Cell Antibodies in Human Breast Milk By Novel Adaptation of Serological Method
Philippe P Pary*, Alexis Leonard, Lauren Hittson, Naomi LC Luban, Deepika S Darbari, Yunchuan Delores Mo, Cyril Jacquot, Valli Criss and Jennifer Webb
Children's National Medical Center
Background/Case Studies: Human breast milk contains immunoglobulins that are present in maternal serum and secretions. Data in mice has demonstrated the potential for Kell antibodies to be absorbed enterally from breast milk and impact the survival of transfused Kell positive cells; however, methods to test and titer human breast milk for red cell antibodies are lacking.
A two week old infant with a history of Rh‐D hemolytic disease of the fetus and newborn (HDFN), previously treated with Intravenous Immunoglobulin and phototherapy, was referred for anemia and reticulocytosis. Patient was O positive, positive Direct Antiglobulin Test (DAT) 4+ with anti‐human IgG only, and a 3+ positive antibody screen by gel method. Antibody identification showed anti‐D in both the plasma and eluate. Patient was transfused O negative red cells and discharged. Over several weeks, the patient returned twice for persistent anemia requiring additional transfusions. At eight weeks of age, evaluation showed a persistent DAT IgG reactivity concerning for continued antibody exposure. Maternal breast milk was evaluated as a potential source.
Study Design/Method: Based on similar properties of human breast milk and plasma, testing to identify IgG antibodies using a stantard tube saline method was performed with a 60 minute 37°C incubation, followed by 3 automated washes prior to the addition of anti‐human IgG reagent. As a control, breast milk from an O positive, antibody screen negative mother was used to assess for interference by milk proteins. Antibody screens were performed on the plasma of the patient, the patient's mother and the control concurrently using the same method. Antibody identification and titers were also performed when indicated. Only freshly collected breast milk stored at room temperature for less than 3 days was found suitable for this technique.
Results/Finding: The patient's mother showed plasma anti‐D with a titer 4096 and the breast milk showed anti‐D with a titer between 16 and 64. The patient had a consistent plasma anti‐D titer of 8. The patient's mother chose to stop breast feeding after 8 weeks, and the patient's hemoglobin was improved at 12 and 16 weeks of age. Using this method, we identified two additional cases of breast milk induced hemolysis: another anti‐D and an anti‐Jka.
Conclusion: Testing showed that it is possible to identify red cell IgG antibodies in human breast milk using a standard tube saline method. We identified implicated antibodies in the breast milk received by infants with persistent anemia due to HDFN. Breast milk titers were generally lower than maternal serum titers, but titers varied depending upon the timing and frequency of breast feeding. Cessation of breast feeding correlated with improved hemoglobin in affected infants.
C6‐A01B
Partial C Antigen within Sickle Cell Disease Children at a Large Children's Hospital
Matthew Hiskey*1, Melanie Wooten1, Rozic Malek2, Paula Jessup1, Kinjal Shah1 and Ross Fasano1
1Emory University School of Medicine, 2Childrens Healthcare of Atlanta
Background/Case Studies: Red blood cell (RBC) transfusion is lifesaving for patients with sickle cell disease (SCD), but is commonly complicated by RBC alloimmunization. Despite transfusion protocols serologically matching for C,E, and Kell antigens, alloimmunization to Rh antigens continues. SCD patients often exhibit a hybrid RHD‐CE‐D gene which is often characterized by the production of a partial C antigen. It has been previously documented that 30% of C+ SCD patients from the West Indies and West and Central Africa are partial C and at (30%) risk for alloimmunization to the C antigen through transfusion of C+ RBCs. This study sought to determine the prevalence within a cohort of children with SCD at a U.S comprehensive SCD center.
Study Design/Method: RBC genotyping results performed on all SCD patients using PreciseType HEA array (Immucor, Norcross, GA) at Children's Healthcare of Atlanta were reviewed and compared to the serologic type for Rh (C/c, E/e) antigens. The prevalence of C‐antigen positive patients (serologically) was determined overall, and compared to the prevalence partial C antigen based on the detection of the RHCE*ce(733G,1006T) allele in the absence of an RHCE gene encoding a conventional C antigen in trans, since this allele is commonly linked to the hybrid RHD*DIIIa‐CE(4‐7)‐D gene which encodes the partial C antigen. Review of the blood bank information system was performed to identify the number of C‐antigen positive transfusion exposures and frequency of alloimmunization to the C antigen.
Results/Finding: Out of a total of 255 patients with genotype/Rh phenotype data available, 78 (30.6%) were C antigen positive serologically. The allele frequency of RHCE*ce(733G,1006T) was 0.071. In total, 15 (5.9%) patients possessed RHCE*ce(733G, 1006T) in the absence of conventional C gene in trans. Of the 78 C antigen positive patients, 15 individuals (19.2%) were predicted to be partial C based on four molecular profiles [RHCE*ce(733G, 1006T)/RHCE*ce:12; RHCE*ce(733G, 1006T)/RH*cE:1; RHCE*ce(733G, 1006T)/RH*ce(733G):1; RHCE*ce(733G, 1006T)/RH*ce(733G, 1006T):1]. In these 15 partial C patients, no anti‐C alloantibodies (or other Rh antibodies) were detected after 60 transfusion exposures (57 C‐antigen negative units; mean: 4, range: 0‐36), likely from placement of a C–negative RBC restriction upon detection of the RHCE*ce(733G, 1006T) allele.
Conclusion: This report confirms previous data of a high prevalence of the partial C antigen in SCD patients historically typed as C‐positive serologically, and demonstrates the benefits of RBC genotyping to prevent alloimmunization to a highly immunogenic Rh antigen by identifying individuals who should receive C–negative blood. All patients with SCD should have RBC genotyping performed for determination of their RBC phenotype, preferably prior to receiving transfusions.
Clinical Oral Abstract Session: Transfusion Transmitted Diseases ‐‐ Zika
C7‐A01C
Investigational Detection of Zika Virus RNA in US Blood Donors
Paula P Saá*1, Megan L Nguyen1, Melanie C Proctor1, David E Krysztof1, Gregory A Foster1, Erin K Sash1, Sandy S Dickson1, Joua Yang1, Jeffrey M Linnen2, Kui Gao3, Jaye P Brodsky4 and Susan L Stramer1
1American Red Cross, 2Grifols Diagnostic Solutions Inc., 3Grifols Diagnostic Solutions, Inc, 4Quality Analytics, Inc
Background/Case Studies: Zika virus (ZIKV), an emerging flavivirus, is primarily transmitted by infected Aedes aegypti mosquitoes, but recent outbreaks have revealed non‐vector transmission routes including the unprecedented sexual transmission of an arbovirus. Acute ZIKV infection is mainly asymptomatic or presents as a self‐limited disease but also includes severe congenital defects and neurologic disorders. The large proportion of asymptomatic cases, high numbers of returning travelers from ZIKV‐active areas, severe clinical consequences to developing fetuses, the detection of RNA in asymptomatic donors during the French Polynesia epidemic, and 4 suspected cases of transfusion transmission in Brazil led FDA to release guidance documents to minimize the risk of ZIKV transmission via blood/blood components.
Study Design/Method: Investigational testing by mini‐pool (MP)‐NAT using the Procleix Zika Virus Assay (TMA) was implemented on collections from five presumed high‐risk US states on 6/20/16 (FL, GA, SC, MS, AL). Following revised guidance on 8/26/16, testing was extended to all blood donations; conversion from MP‐NAT to individual donation (ID)‐NAT was implemented in phases and completed on 12/12/16. Travel history questions were discontinued on 1/23/17. Confirmatory testing included repeat TMA; in addition, RT‐PCR, serology and red cell (RBC) TMA were performed. Estimates of viral loads were performed by end‐point TMA on plasma and RBCs.
Results/Finding: As of 4/8/17, 2,288,855 donations were tested including 393,713 (17%) in 24,611 MPs. No reactive donations were identified by MP‐NAT. Of the 1,895,142 ID‐NAT donations, 72 were initial reactive (IR) of which 8 (11%) confirmed positive (CP) by subsequent testing (CP rate of 1:286,107; positive predictive value of 11%; specificity of 99.997%). Five (62%) CP donations were ID‐NAT repeat reactive (RR); 3 (38%) donations were ID‐NAT IR only, IgM positive and RNA positive in RBCs. CP donors resided in MA, TX, CA, NY, WV and 3 in FL, 2 of which were local transmissions. Six donors had traveled to a ZIKV‐active area returning to the US from 2 to 73 days prior to donation. Two donors with a travel risk reported clinical symptoms; 6 CP donors (75%) remained asymptomatic. ZIKV RNA was detected in RBCs from all CP index donations with estimated levels varying from less than 40 copies (c)/mL to about 8E^5 c/mL. At the time of writing, the longest period of detection in RBCs was 91 days vs. 17 days in plasma from the same TMA‐RR donor. ZIKV RNA levels in plasma were obtained from 1 IR and all RR donors, ranging from 12 to 2000 c/mL.
Conclusion: ID‐NAT identified 8 ZIKV RNA‐positive donations, including 3 long‐term infections in travelers returning from ZIKV‐active areas, further reducing the risk of transfusion transmission of ZIKV in the US.
C8‐A01C
Evolving Viral and Serological Stages of NAT Yield Donations from the 2016 Puerto Rico Zika Epidemic
Phillip C Williamson*1, Lisa Lee Pate2, Graham Simmons3, Mars Stone3, Valerie Winkelman1, Gerardo Latoni4, Jose Alsina4, Sonia Bakkour3, Susan A Galel2 and Michael Paul Busch3
1Creative Testing Solutions, 2Roche Molecular Systems, Inc., 3Blood Systems Research Institute, 4Banco de Sangre de Servicios Mutuos
Background/Case Studies: Puerto Rico (PR) began screening blood donations for Zika virus (ZIKV) RNA under an investigational protocol using a nucleic acid test (NAT) on April 3, 2016 as a result of FDA guidance. Approximately 350 confirmed infected (NAT+) donations were detected through Dec 2016. The aim of this analysis is to categorize the ZIKV NAT+ index donations in order to stage them according to viral load (VL), simulated minipool (MP) results, and ZIKV IgM reactivity to evaluate the changing profile of infected donors over the course of the 2016 PR epidemic.
Study Design/Method: Plasma from blood donors were screened by individual donation (ID‐NAT) for the presence of ZIKV RNA with the cobas® Zika test. ID‐NAT+ samples were repeated in duplicate and further tested by a second NAT to confirm infection and estimate VL, and for anti‐ZIKV IgM. Simulated MPs of 6 were prepared by diluting NAT+ plasma 1:6 and tested to discriminate ID‐NAT only detectable donations. NAT yield samples for which simulated MP and conclusive IgM results were available (n=308) were sorted into 4 categories corresponding to sequential stages of acute ZIKV infection: IgM‐/low VL; IgM‐/high VL; IgM+/high VL; IgM+/low VL.
Results/Finding: Of 52,942 donations collected April 3‐December 31, 352 were reactive for ZIKV RNA. IgM‐ index donations had higher VLs (mean 1.1 x 10⁶ vs 8.3 x 10⁴ IU/mL) and higher proportions of simulated MP‐detectable results (93% vs 23%) than IgM+ donations. The distribution by stage of infection was evaluated as the epidemic evolved. Over the course of the epidemic, the rates of ID‐NAT only detectible and IgM+ donations increased (Table 1).
TABLE 1. C8‐A01C
| Month | Apr | May | Jun | Jul | Aug | Sep | Oct | Nov | Dec |
|---|---|---|---|---|---|---|---|---|---|
| # NAT+ | 15 | 27 | 64 | 55 | 72 | 36 | 18 | 14 | 7 |
| % ID‐NAT Only | 7 | 26 | 25 | 36 | 25 | 42 | 56 | 36 | 57 |
| % IgM Positive | 33 | 37 | 27 | 27 | 25 | 50 | 61 | 36 | 86 |
Conclusion: This study demonstrates how the viral and immunological profiles of ZIKV infection in the index donations shifted through the course of the 2016 PR epidemic. Categorization of index samples into stages of infection is important for blood safety considerations, since infectivity and utility of MP vs ID‐NAT screening likely correlate with VL and serological stages of infection. Staging of infections also has implications for diagnostic testing and understanding the durations of ZIKV viral and immunological markers in blood and persistence of ZIKV in body fluids and tissues.
cobas® Zika is not commercially available for blood screening. Data generated under the cobas® Zika IND is preliminary and has not been reviewed by FDA. This project has been funded in whole or in part with Federal funds from the Biomedical Advanced Research and Development Authority, Office of the Assistant Secretary for Preparedness and Response, Office of the Secretary, Department of Health and Human Services, under Contract #HHSO100201600010C.
C9‐A01C
Detection of Zika Virus RNA in United States Blood Donations Using cobas® Zika on the cobas® 6800/8800 Systems
Lisa Lee Pate*1, Phillip C Williamson2, Michael Paul Busch3, Susan Rossmann4, Scott Jones5, Ann Butcher1, John Duncan1, Jean Stanley1 and Susan A Galel1
1Roche Molecular Systems, Inc., 2Creative Testing Solutions, 3Blood Systems Research Institute, 4Gulf Coast Regional Blood Center ‐ Sugar Land, 5QualTex Laboratories
Background/Case Studies: In February 2016, the US FDA recommended that all blood donations in areas with active Zika virus (ZIKV) transmission be tested with an FDA approved nucleic acid test (NAT) for ZIKV RNA or treated with an FDA approved pathogen reduction technology. The cobas® Zika test was approved under an investigational new drug application on March 30, 2016 and testing of Puerto Rico donations began on April 3, 2016. As a precautionary measure some blood centers in the US states also began NAT testing for ZIKV. In August 2016, the FDA recommended universal screening of all blood donations.
The aim of this study is to describe the detection of ZIKV RNA in blood donations collected in US states between April 3, 2016 – February 28, 2017 using the investigational cobas® Zika for use on the cobas® 6800/8800 Systems.
Study Design/Methods: Donations were screened with cobas® Zika by individual donation testing. All initial reactive (IR) results were repeated in duplicate. Supplemental testing included an alternative NAT (AltNAT) assay which is less sensitive than cobas® Zika and serology testing for anti‐Zika IgM and IgG. Reactive donors were invited to enroll in follow‐up, which included cobas® Zika and serology testing. A donor was considered to be Zika confirmed positive if at least one replicate of the repeat testing by cobas® Zika was reactive on index donation or follow‐up, reactive by AltNAT on the index donation, or positive for anti‐Zika IgM on index or follow‐up. All IR donations were also retested at a 1:6 dilution to simulate mini‐pool testing.
Results/Findings: A total of 1,776,190 blood donations were screened using cobas® Zika. Of 56 IR donations, 12 were repeat reactive (RR), 39 non‐RR and 5 had no repeat testing.
Of the 12 RR donations, 7 were positive by AltNAT; 3 of these were IgM positive. All 4 AltNAT negative donors were IgM positive. One donor was AltNAT equivocal and IgM negative. Of the 5 RR donors that were not IgM positive on index, 3 enrolled in follow‐up and all seroconverted.
Of 39 non‐RR donations, 38 were AltNAT negative and 1 is pending supplemental testing. 8/38 donors were IgM positive on index. 30 donors were IgM negative on index; 15/30 enrolled in follow‐up; 14 remained IgM negative and 1 was 1gM inconclusive.
Of 5 donations without repeat testing results, 2 met criteria for positive (1 was AltNAT positive, IgM negative and 1 AltNAT negative, IgM positive). 1 donation is pending additional testing.
Altogether, 22/56 IR donations met the criteria for true positive on the index donation. 9/22 (41%) true positive donations were reactive when retested in a simulated minipool. 16/22 were IgM positive.
Conclusion: 0.001% of the 1,776,190 donations in US states screened for ZIKV RNA were confirmed as true positives.
cobas ® Zika is not commercially available for blood screening use.
C10‐A01C
Risk Assessment for Zika Virus Transfusion‐Transmission in Brazil Using Monte Carlo Simulation
Luiz Amorim*1, Marc Germain2, Gilles Delage3, Maria Esther Lopes1 and Yves Grégoire3
1HEMORIO, 2HemaQuebec, 3Héma‐Québec
Background/Case Studies: Zika virus was implicated in very large and recent outbreaks, in French Polynesia (2013), and in Brazil (2015/2016), which was followed by outbreaks in South America, Central America and Caribbean. Four probable transfusion transmitted cases were reported in Brazil; since 80% of Zika cases are asymptomatic, the actual transfusion rates can be much higher than reported. In this study, we used a Monte Carlo simulation for risk estimation during the Brazilian outbreak.
Study Design/Method: The data feeding the Monte Carlo simulation were collected from January 1st, 2016 through November, 26th, 2016, from Brazil (the whole country) and for Rio de Janeiro state, one of the outbreak epicenters. The data came from Brazilian epidemiologic bulletins and from Brazilian blood donation figures. The risk assessment was performed separately for whole blood (WB) donation and for apheresis platelets (AP). The model took into account the following parameters: Zika incidence in Brazil and in Rio; lognormal distribution symptomatic viremia (period: 5 days, with 99% of the values lower than 18 days); 20% of infected donors with symptoms lasting 2 days; 1.2 donation/donor/year for WB and 1.75 for AP. The formula for transfusion risk calculation was: incidence X infectious period X average donation number per donor per year (WB, x/y; aph, z/y) X (1 ‐ proportion of refused donors) X (1 – proportion of discarded donations due to post donation ‐ PD ‐ information).
Results/Finding:
The table below shows the results.
TABLE 1. C10‐A01C
| Parameter | Average (Min‐Max) | ||
|---|---|---|---|
| Whole Blood | Apheresis Platelets | ||
| # cases/105 persons | 102.9. (60 ‐ 143) | 103 (65 ‐ 145) | |
| Incidence (X 105 persons‐year) | 113.74 (66.6 ‐ 158.12) | 113.86 (71.9 ‐ 160.3) | |
| Asymptomatic viremia (days) | 5.81 (1 ‐ 33) | 5.85 (1.45) | |
| Brazil | Composite viremia (days) | 5.05 (1 ‐ 33) | 5.07 (1.45) |
| % of infected donors captured ‐ PD information | 0.1003 (0.0051 ‐ 0.1493) | 0 | |
| Infectious Risk (year) | 0.014 (0.003 ‐ 0.09) | 0 | |
| Risk (95% Range) | 1:86.666 (1.20,615 ‐ 1:177,766) | 1: 53.362 (3,452 ‐ 249,371) | |
| # cases/105 persons | 403.7 (319 ‐ 484) | 403.9 (328 ‐ 487) | |
| Incidence (X 105 persons‐year) | 446.43 (352.73 ‐ 535.18) | 446.65 (362.7 ‐ 538.5) | |
| Asymptomatic viremia (days) | 5.82 (1 ‐ 37) | 5.8 (1 ‐ 36) | |
| Rio de Janeiro | Composite viremia (days) | 5.04 (1 ‐ 37) | 5.05 (1 ‐ 34) |
| % of infected donors captured by PD information | 0.1003 (0.051 ‐ 0.1494) | 0 | |
| Infectious Risk (year) | 0.014 (0.003 ‐ 0.101) | 0.014 (0.003 ‐ 0.093) | |
| Risk (Range 95%) | 1:22,044 (1,953 ‐ 88,388) | 1: 13,598 (1,305 ‐ 52,354) |
Conclusion: The estimated risk of transfusion transmitted Zika is very important in Brazil and in Rio de Janeiro, where it can attain 1:13,598, for apheresis platelets. The severe consequences of Zika in vulnerable populations – pregnant women and newborn – indicate that interventions to reduce this unfavorable outcome, such as donor testing and pathogen inactivation, should be considered in Brazil
C11‐A01C
Zika, Chikungunya and Dengue Virus Incident Infections in Blood Donors in Brazil in 2016: Implications for Blood Safety and Public Health Surveillance
Brian Custer*1, Thelma Goncalez1, Kui Gao2, Donald J Brambilla3, Anna Carneiro Proietti4, Alfredo Mendrone5, Paula Loureiro6, Maria Esther Lopes7, Ligia Capuani5, Michael Paul Busch1, Ester Sabino8 and REDS‐III International‐Brazil9
1Blood Systems Research Institute, 2Grifols Diagnostic Solutions, Inc, 3RTI International, 4Hemominas, 5Fundacao Pro‐Sangue, 6Faculdade de Ciências Médicas, Universidade de Pernambuco, 7HEMORIO, 8University of Sao Paulo, 9NHLBI
Background/Case Studies: Except for surveillance based on clinical case diagnosis, data on the incidence of Zika (ZIKV), Chikungunya (CHIKV) and Dengue (DENV) arboviruses in the population are not available in Brazil. The objective of this study was to assess the contemporaneous incidence of these agents in donors at 4 large geographically dispersed blood centers located in the southeast and northeast of Brazil.
Study Design/Method: In the Brazil public blood bank system, NAT screening for HIV, HCV and HBV is performed on minipools (MP from 6 donations). The residual volume of MP plasma, 0.35 – 0.45 mL, is routinely discarded. Beginning in April 2016 each blood center saved ∼67 MPs/week for retrospective testing using the triplex ZIKV, CHIKV, DENV Transcription Mediated Amplification (TMA) assay developed by Grifols/Hologic. MPs were shipped to the USA and batch tested at Grifols. In the first two weeks (April 3‐15) 3 MP6 were combined into pools of 18 donations; thereafter MP6 were tested without additional pooling. To estimate the percent positive donors, the denominator was adjusted to account for the number of donations included in each pool each month and 95% confidence intervals (CI) calculated using the method developed by Biggerstaff.
Results/Finding: The triplex assay performance was shown to have very high sensitivity (95% limit of detection <20 copies/mL for ZIKV/CHIKV/DENVs) and to accurately discriminate each of the arboviruses. Testing of the first 6 months of samples is complete for 6,292 MP, comprised of 37,752 donations collected from April 3 to October 9, 2016. A total of 77 pools were positive, with 76 detected between April‐June 2016. The table summarizes the highest monthly estimated percent positive donors for each virus in each city. Months with highest percent postive donors were April or May. At the peak over 0.6% of donors in Belo Horizonte and Rio were viremic for ZIKV, whereas ZIKA was not evident in donors in Recife, but over 0.4% of donors in that city were viremic for CHIVK during the peak.
TABLE 1. Highest monthly estimated percent positive donors for each arbovirus in each city during the period April – September 2016.
| Arbovirus |
FPS, Sao Paulo % (95%CI) |
Hemominas, Belo Horizonte % (95%CI) | Hemorio, Rio de Janeiro % (95%CI) |
Hemope, Recife % (95%CI) |
|---|---|---|---|---|
| ZIKV | 0.06 (0‐0.29) | 0.64 (0.31‐1.17) | 0.64 (0.40‐0.93) | 0 [0.004]* |
| CHIKV | 0.06 (0.03‐0.3) | 0 [0.002]* | 0.35 (0.20‐0.57) | 0.43 (0.19‐0.84) |
| DENV | 0.08 (0.02‐0.21) | 0.42 (0.17‐0.86) | 0.06 (0‐0.3) | 0 [0.004]* |
Brackets represent virus‐specific upper limit of the 95% CI by month when no pools were positive for the specific arbovirus.
Conclusion: During the latter part of the arbovirus outbreak season in Brazil in 2016, ZIKV, CHIKV, and DENV were being transmitted by mosquitoes to donors with asymptomatic donors donating, indicating that blood recipients in Brazil were extensively exposed to viremic blood components. The use of donor MPs for surveillance may be one of the most efficient approaches for public health monitoring of the onset and magnitude of arbovirus infections.
C12‐A01C
Universal Zika Screening for Blood Donors in Singapore
Sally Lam*1, Sze Sze Chua1, Mars Stone2, Michael Paul Busch2 and Ai Leen Ang1
1Health Sciences Authority, Blood Services Group, 2Blood Systems Research Institute
Background/Case Studies: Singapore reported its first locally transmitted Zika case on 26 August 2016. The numbers rose rapidly to 386 cases by the end September, with eight clusters (hotspots) of cases island‐wide. Zika virus (ZIKV) shares the same mosquito vector, Aedes aegypti, as the Dengue viruses and can caused microcephaly in unborn fetuses of infected pregnant women and Guillan‐Barré syndrome, which hastened Singapore's Blood Services Group (BSG) to look into securing the safety of blood supply from the Zika threat. We aimed to assess the assay performance of USA–FDA investigational (IND) Procleix ZIKV nucleic acid technology (NAT) assay for universal blood donation screening in Singapore to prevent transfusion‐transmitted Zika infection.
Study Design/Method: All blood donations were screened for Zika with the Procleix ZIKV NAT assay since 1 October 2016. Zika NAT reactive samples were tested at Blood System Research Institute (BSRI) for Zika RNA in plasma and red cells by PCR and for Zika and Dengue IgM and IgG antibodies. A Zika confirmed case was defined by the presence of Zika RNA by PCR and/or Zika antibodies. The analytical sensitivity was evaluated using 300 blinded frozen samples consisting of 25 replicates of 11 half log dilutions of the WHO International Standard for ZIKV and 25 replicates of negative controls prepared by BSRI. Probit analysis was performed to determine the 50% and 95% limits of detection (LOD). Clinical performance of the Procleix ZIKV assay was also assessed with local patient samples obtained from Institute of Infectious Disease and Epidemiology, Singapore and a 14 member blinded ZIKV reference panel from the USA‐FDA.
Results/Finding: A total of 63,144 donations were screened from 1 October 2016 to 31 March 2017, with 1 false positive case and 1 Zika confirmed donation detected. Alternative ZIKV PCR tested positive in both the plasma and red cells with an estimated plasma viral load of 9.54x10⁵ copies/ml. Zika IgM was negative in the index donation sample but present in the 10‐day post‐donation follow up sample.. The donor reported no clinical symptoms. The analytical sensitivity for the Procleix ZIKV assay was determined to be 2.1 copies/ml at 50% LOD and 10.0 copies/ml at 95% LOD. The Procleix ZIKV assay detected RNA in 6 out of 9 patient samples and provided 85.7% agreement to the results of the USA‐FDA ZIKV reference material.
Conclusion: The investigational Procleix ZIKV assay showed good analytical sensitivity and clinical performance, suitable for blood screening of Zika infection especially in asymptomatic donor populations. BSG commenced universal Zika NAT screening by individual donation testing following the Zika outbreak with 1 confirmed Zika donation (high‐titer and seronegative) interdicted, which translates to a risk incidence of 1 in 25,888 donations in Singapore.
Clinical Oral Abstract Session: Rh D and Kidd Molecular Topics
C13‐A02A
Phasing in Patient RHD Genotyping
Ingrid Perez‐Alvarez*, Chelsea Hayes, Jina Seo, Holli Mason and Ellen B Klapper
Cedars‐Sinai Medical Center
Background/Case Studies: A CAP/AABB Work Group suggested that steps be taken to phase in RHDgenotyping for patients with a serologic weak D phenotype. Weak D types 1, 2 and 3 express all the major RhD epitopes and these patients can be managed as RhD‐positive, which may lead to a reduction in unnecessary Rh immunoglobulin (RhIG) administration and conservation of RhD‐negative RBCs.
Study Design/Method: RHD genotyping was performed on all patient samples with weaker than expected or discrepant RhD typing results, utilizing a commercially available genotyping kit manufactured by Immucor (RHD BeadChip). Initially, testing was performed at a reference lab while the RHD BeadChip was validated and implemented at this institution. A serologic weak D phenotype is defined as weak to 2+ reactivity on initial gel testing. If genotyping demonstrated weak D types 1, 2 or 3, the intent was to manage the patient as RhD‐positive. If weak D types 1, 2 or 3 were NOT detected, the patient is considered at risk for alloimmunization and treated as RhD‐negative. While RHD genotyping results were pending, RhD‐negative RBCs were used and if pregnant, the patient was eligible for RhIG. Results were generally available in 2 to 4 weeks.
Results/Finding: RHDgenotyping was performed on 22 patient samples over 15 months. Of these 22 patient samples, 13 (59%) were weak D types 1 or 2. The remaining samples demonstrated a variety of alleles including known partial D variants (see Table). One patient identified as weak D type 1 required multiple transfusions over the study period, and refused RhD‐positive RBCs. The remaining weak D types 1 and 2 patients have not received transfusions at this institution since they were genotyped. Four of 4 obstetric weak D types 1 and 2 patients received RhIG while genotyping was pending.
Conclusion: Testing and management of patients with serologic weak D phenotypes is not standardized. RHD genotyping may lead to more consistent, personalized patient care and appropriate management of resources. In this 15 month study period 13 serologic weak D patients were identified who could be managed as RhD‐positive, however this did not result in withholding any doses of RhIG nor conservation of RhD‐negative RBCs. Genotyping results pertaining to the management of an obstetric patient were discussed with each obstetrician and it is possible this information may impact management of future pregnancies. These outcomes highlight the limitations of current genotyping processes, including long turn‐around‐time for results and lack of acceptance of a new approach to management of serologic weak D phenotypes. It is anticipated that reduction in testing time and efforts to educate patients and clinicians will lead to improved resource utilization.
| Weak D Types 1, 2 or 3 | Number of Patients | Reason for Testing |
|---|---|---|
| Weak D type 1 | 9 | SWD |
| Weak D type 2 | 4 | SWD |
| Other Genotyping Results | Number of Patients | Reason for Testing |
| Weak D type 4.0 or 4.3 | 1 | SWD |
| Weak D type 5 | 1 | SWD |
| DVI | 3 | SWD |
| RHD psi or DV type 1 or DBS2 | 1 | SWD |
| DIVa type 2 or DIVa type2/DIIIaCE(4‐7)‐D | 1 | SWD and anti‐D |
| Dllla/DIIIa‐CE(4‐7)‐D | 1 | SWD |
| Possible D (sequencing not performed) | 1 | SWD |
SWD = serologic weak D
C14‐A02A
RHD Genotyping in Serologic Rh D‐Negative Blood Donors
Ingrid Perez‐Alvarez*1, Chelsea Hayes1, Jina Seo1, Tiruneh Hailemariam2, Holli Mason1 and Ellen B Klapper1
1Cedars‐Sinai Medical Center, 2Bioarray Solutions, An Immucor Company
Background/Case Studies: The RH blood group is highly immunogenic and the most clinically significant blood group secondary only to ABO. Currently, in the United States, blood donors who type RhD‐negative by serology undergo weak‐D testing to identify some weak and partial states of RhD expression. However, not all RhD expression can be detected serologically. It has been suggested that investigation of serologic RhD‐negative blood donors using genotyping methods can more accurately identify units that may lead to alloimmunization in RhD‐negative recipients.
Study Design/Method: RHD genotyping of all serologic RhD‐negative blood donors presenting to our blood donor center was implemented to identify units with altered RHD alleles that should be characterized as RhD‐positive. Repeat donations were not tested. Initial serologic testing of blood donors was performed using 3 FDA approved anti‐D reagents. When reactivity with all 3 reagents was negative, RHD genotyping was performed using a commercially available genotyping kit manufactured by Immucor (RHD BeadChip). This assay detects over 80 RHD variant alleles and additional DNA sequencing was performed in selected cases. To maximize efficiency samples were batched for testing; testing was generally performed once a month. If an RHD variant known or suspected to be associated with an increased risk of alloimmunization was detected, recipients of previous donations were investigated for evidence of alloimmunization, and all future donations were restricted to RhD‐positive recipients.
Results/Finding: Over a period of 8 months we tested 509 RhD‐negative blood donors. There were 3 (0.6%) partial‐D, 1 weak D (0.2%), and 3 (0.6%) DEL donors. In one donor sample a novel RhD allele was identified through DNA sequencing (RHD*IVS5‐46_42delTCTC). The phenotype associated with this allele variant is unknown. Investigation of previous donations from these 8 donors showed that 6 RhD‐negative recipients received RBCs from 4 of these donors. Five of these recipients underwent antibody screening after an average follow‐up period of 5 months; anti‐D was not detected in any sample (See Table).
Conclusion: Serologic testing occasionally fails to identify some RhD‐positive donor units, which could place RhD‐negative recipients at risk for alloimmunization. DNA‐based testing can be used to identify donors who have the potential to sensitize RhD‐negative individuals. In this limited study period a small number of serologic RhD‐negative donors, whose genotype indicated potential to sensitize recipients, were found. However, review of recipient transfusion records indicated that prior exposure to these donors’ RBCs did not lead to detectable immunization to date. Future potential sensitizing events will be avoided by restricting these units to RhD‐positive recipients.
| Variant Predicted Phenotype | Allele | Number of units transfused to RhD‐negative recipients | Anti‐D detected in recipient(s) to date (Yes/No) | Total |
|---|---|---|---|---|
| Weak | RHD*weak D type 38 | 2 | N | 1 (0.2%) |
| Partial | RHD*weak partial 11 | 0 | N/A | 3 (0.6%) |
| RHD*DBS1 | 1 | N | ||
| RHD*weak partial 11 | 1 | Unknown* | ||
| DEL | RHD*DEL1(1227G>A) | 0 | N/A | 3 (0.6%) |
| RHD*DEL8(IVS3 + 1G>A) | 2 | N | ||
| RHD*DEL1(1227G>A) | 0 | N/A | ||
| Unclassified | RHD*IVS546_42delTCTC | 0 | N/A | 1 (0.2%) |
Patient deceased before follow up antibody screen was obtained
C15‐A02A
D+ Women at Risk for Anti‐D Formation Can be Readily Identified By Targeted Molecular Testing
Patricia A. R. Brunker*1,2, Paul M. Ness1, Rosetta Shirey3, Karin J. Blakemore1, Geralyn Meny4, Roser Hoffman5, Lauro Guerra5 and Gorka Ochoa5
1Johns Hopkins University School of Medicine, 2American Red Cross Greater Chesapeake & Potomac Region, 3Johns Hopkins Hospital, 4Grifols Diagnostic Solutions Labs, 5Grifols Immunohematology Center
Background/Case Studies: Pregnant women with RHD variants may be candidates for RhIG prophylaxis if molecular analysis reveals a genotype associated with possible anti‐D formation. Proposed testing algorithms advocate molecular characterization of weak D types but if a patient types as RhD‐positive, no further action is proposed. Women with partial D variants who may also be at risk of anti‐D formation have not been included in algorithms proposed to date yet molecular testing may unmask this hidden subpopulation of women who type as D‐positive but who may be candidates for RhIG prophylaxis. Our hospital is in an urban setting in which 63% of deliveries are to African‐American patients. We initiated routine, full‐gene RHDsequencing for obstetric patients whose serology demonstrated not only weak D, but also those who were categorized as “D+” with 3+ reactivity to determine the prevalence of partial D patients in an ethnically‐mixed population who may be at risk of anti‐D formation.
Study Design/Methods: From October 2016 to March 2017, we performed routine D typing (NEO, Immucor) on 1875 obstetric specimens followed by RHD sequencing on samples with either a serologic weak D phenotype or anti‐D testing strength of 3+ using at least 1 antibody. Solid phase and manual testing used the series 4 and series 5 reagents. Four additional anti‐D reagents manufactured by Grifols (DG Gel Anti‐D), Quotient (Anti‐D blend), Biorad (Anti‐D (RH1) blend), and Ortho (BioClone Anti‐D) were also used for supplemental testing. RHD sequencing was performed by Sanger methodology using routine clinical protocols.
Results/Findings: RHD polymorphisms or variations were identified in all 13 samples. Two of 13 (15.4%) were D+ with an RHD gene with only common, known intronic variants that is predicted to produce the “reference” RhD protein (IVS1‐29C, rs2301153; IVS3 + 117C, rs28521909; and IVS3 + 124A, rs28562109). Two (15.4%) were D+ and heterozygous for two apparently new RHD coding variations which we are confirming by further testing. Four (30.8%) patients had RHD alleles with known potential to make anti‐D (RHD*DOL2, RHD*DAR1.2, and 2 with weak D type 4.0). One had weak D type 96, which has uncertain susceptibility to alloimmunization and one was weak D type 1, which has not yet been associated with anti‐D. Interestingly, two (15.4%) had variable D expression associated with apparently new alleles, pending ongoing confirmatory testing and cloning. One patient had the same noncoding variations as the 2 D+ patients above (IVS1‐29C, IVS3 + 117C, IVS3 + 124A) but she had much more variable serological testing using 6 anti‐D reagents, suggesting that she may harbor novel, unidentified variant(s) responsible for the anti‐D reactivity.
Conclusion: By selecting obstetric patients with 3+ reactivity to at least one anti‐D reagent, we have readily identified several RHD variants, including some possibly unreported, which we are in the process of confirming. Expanding antenatal RHD molecular testing to include women with 3+ serologic reactivity is an efficient method to identify patients with partial or weak D variants at risk for anti‐D alloimmunization who may benefit from RhIG but who would be characterized as simply “D+” according to standard clinical practices.
C16‐A02A
C.1154‐31C>T Is in Linkage Disequilibrium with the Missense Mutation C.1154G>C on RHD Weak Type 2
Bruno Costes1,2, Jennifer Martret3,4, Natacha Martin1, Kévin Gaillard3,4, Abdel Aissat1,2,5, Guillaume Gricourt5, Alexandre De Brevern6,7, Rachid Djoudi3, Pascale Fanen1,2,5, France Pirenne2,3,4,7 and Christophe Tournamille*3,4,7
1IMRB ‐ INSERM U955 Equipe 5, 2UPEC, Université Paris Est‐Créteil, 3EFS Ile de France, 4IMRB ‐ INSERM U955 Equipe 2, 5AP‐HP, Pôle de Biologie‐Pathologie, 6INSERM, UMR_S1134, Université Paris Diderot, 7Laboratory of Excellence GR‐Ex
Background/Case Studies: A weak D type 2 is a variant of the RhD protein that comprises an amino acid substitution located in the 12th transmembrane segment and expresses a reduced amount of the D antigen. This variant is known to be associated with the missense mutation c.1154 G>C which is the first nucleotide of the exon 9 of the RHD gene and thus could be implicated in exon 9 skipping when it is mutated. When performing NGS (Next Generation Sequencing) analysis to fully genotype known patients, we identified an additional variant.
Study Design/Method: DNA samples were studied by Beadchip technology (Immucor/Bioarray solutions) and NGS using the SureSelect Human All Exon V6 (Agilent) and the Nextseq500 platform. In silico analysis with different bioinformatic tools was used to predict splicing events. Furthermore, a functional splicing assay was performed to determine the impact of the nucleotide variations on exon 9 skipping of RHD gene. This study was completed by the comparative modeling between the wild type and the weak type 2 RhD proteins.
Results/Finding: By a targeted analysis of full exome sequencing, we have confirmed the blood group genotype of 10 patients previously characterized by BeadChip technology. Interestingly, 4 out of 10 carry the c.1154‐31C>T intronic variation on the RHD gene, already described and associated with a Del allele. Among these last 4 patients, one has been previously characterized as RHD weak type 2 carrying the c.1154G>C (p.Gly385Ala). Independently, Sanger sequencing on 50 unrelated RHD weak type 2 samples pinpoint to a linkage disequilibrium between c.1154G>C (ExAC, MAF = 0.001145) and the c.1154‐31C>T (ExAC, MAF = 0.2496). In silico analysis of both mutation located close to the splice acceptor site of the exon 9 does not predict a significant reduction of its strength score. With minigene vectors harboring RHD wildtype exon 9, mutant RHD c.1154G>C, mutant RHD c.1154‐31C>T and double RHD mutants c.1154G>C plus c.1154‐31C>T, we showed no influence on skipping of exon 9 due to these mutations. Comparative modeling of RhD proteins pointed out an additional hydrophobic interaction on the RhD weak type 2 between Ala385 (transmembrane helix 12) and Val183 (transmembrane helix 6) hampering membrane insertion.
Conclusion: The c.1154‐31C>T variation is always associated in cis with the missense mutation c.1154G>C on the allele RHD weak type 2. The c.1154‐31C>T can be found alone on the RHD gene as a neutral polymorphism. We assess that these two mutations isolated or combined do not lead to abnormal RHD transcripts. Our results clearly demonstrate that the weak D antigen reactivity observed with RhD type 2 red blood cells is due to the substitution of alanine at amino acid position 385 to glycine.
C17‐A02A
Topology of Jk‐Weak or Jk‐Negative Single‐Nucleotide Missense Variants in the Kidd Protein
Glenn Ramsey*
Northwestern University
Background/Case Studies: The human urea transporter‐B (HUT‐B) protein carrying the Kidd blood group has 10 transmembrane (TM) and 2 tilted urea‐pore α‐helices, a long extracellular connector segment, and 2 cytoplasmic segments at each end. Numerous single‐nucleotide missense variants (SNMVs) weaken or abolish expression of Jka/b antigens determined at p.280. We mapped all reported Jk‐weak or Jk‐negative (Jk‐neg) SNMVs onto the HUT‐B structure to explore topological correlates of Jk antigen expression.
Study Design/Methods: JK*A and JK*B SNMVs affecting Jk expression were compiled from dbRBC and ISBT registries, literature searches and 2010‐2016 AABB, ISBT and British Blood Transfusion Society meeting abstracts. SNMV locations were correlated with the human homolog of the x‐ray‐crystallographic structure of mammalian UT‐B derived for analysis of UT function (Levin EJ, 2012).
Results/Finding: Seven SNMVs located within 1 amino acid (aa) from the exofacial or internal end of a TM helix are mostly weak variants (Table). All 3 at the exofacial ends (p.A93T, p.W240R, p.V333D) are Jk‐weak; the two Jk‐neg exceptions p.G298E and p.G299E are at the internal end of the TM helix bearing Jka/b. Four SNMVs in the cytoplasmic N‐terminal segment are mostly weak variants. In contrast, 13 SNMVs within membrane helices are mostly Jk‐neg variants. Three Jk‐weak SNMVs (p.V10M, p.E44K, p.V76I) have been associated with allo‐anti‐Jka/b to the antigen on their alleles (“weak partial”). Six of the 13 Jk‐neg variants are within 19 aa (p.270‐p.299) of Jka/b at p.280. None of these SNMVs are in the long extracellular connector region or the cytoplasmic C‐terminal segment. Jk‐neg variants p.N289S and p.S291P are adjacent to p.288F and p.292L which line part of the urea transporter pore.
Conclusion: In the transporter‐structured RhD and RhCE proteins, SNMVs with weak D, C, c, E or e expression are mostly within the RBC membrane, and non‐canonical antigen‐negative SNMVs are unusual. In the structurally similar Kidd HUT‐B, most Jk‐weak SNMVs are at the ends of the TM helices or in the N‐terminal cytoplasmic segment. Among 13 Jk‐neg SNMVs, most are in membrane helices. However, whether a variant appears Jk‐weak or Jk‐neg may depend on the extent of testing. Next‐generation sequencing may provide more complete structure‐antigen correlations.
| JK SNMV Location | Jk‐weak (bold)/Jk‐neg expression | n |
|---|---|---|
| Within 1 aa from TM α‐helix end | V76I, A93T, W171R, W240R, G298E, G299E, V333D* | 5/2 |
| Cytoplasmic N‐terminal | V10M, G40S, E44K, L45P | 3/1 |
| In membrane TM and urea‐pore α‐helices | R64W, R64Q, G65D, I117T, A183V, L246R, A248T‡, A270A§, L272F, N289S, S291P, T319M | 2/10 |
Second nucleotide variant in this allele is synonymous (p.P196P). ‡Reported as Jk‐neg but considered Jk‐weak by ISBT. §Near splice point.
C18‐A02A
Discovery of the Genetic Cause of the Autosomal Dominant Kidd‐Null Phenotype
Félix García‐Sánchez1, Vincent Schulz2, Patrick Gallagher2, Betty Lawton2, Leslie Biesecker3, Roser Corominas4, Miguel Angel Rodríguez‐Granado5, Victoria Campuzano4, Laia sans‐Atxer6, Yoshihiko Tani7, Luis Alberto Pérez Jurado4 and Diane Krause*8
1Madrid Blood Transfusion Center, 2Yale School of Medicine, 3National Insitutes of Health, 4Department of Experimental and Health Sciences, Univerisitat Pompeu Fabra,, 5Histocompatibilidad e Inmunohematología Molecular, 6Hypertension Unit, Nephrology Department, 7Japanese Red Cross Osaka Blood Center, 8Yale University
Background/Case Studies: The Kidd‐null blood group is most often inherited as a recessive genetic trait due to biallelic mutations in the SLC14A1 gene, which encodes the urea transporter UT‐B1. The Kidd‐null phenotype is associated with transfusion risk and also is associated with abnormalities in the ability to concentrate urine. The cause of the identical Kidd‐null phenotype with dominant inheritance [In(Jk)] has not yet been defined, though it was first described in 1965. In contrast to recessively inherited Kidd‐null phenotype, this is not associated with mutations in the SLC14A1 gene. The aims of the studies was to Identify and characterize the causative gene for Dominant Kidd‐Null red blood cell phenotype (InJk).
Study Design/Method: We identified several families with dominant inheritance of the Kidd‐null phenotype in multiple kindreds in Spain. We performed whole‐genome linkage analysis, exome sequencing, expression (RT‐PCR and Western) analyses, and Urea lysis using patients’ cells. In addition, two probands underwent urine concentration tests.
Results/Finding: Using molecular approaches, we mapped the affected locus to a 5 Mbp region in 19q13.11‐13.2 with an LOD score of 9.6. Using deep sequencing, we identified a potential deleterious mutation in the ZNF850 gene, which deletes 84 bp resulting in loss of an entire zing finger domain. The identical del84‐ZNF850 mutation is present in all affected individuals, and is absent from all controls tested (n>2000). In addition, two adult individuals who are homozygous for the entire haplotype including the deletion within the ZNF850 locus, thus completely lacking the common allele, were identified. We also obtained DNA from an unrelated InJk individual reported from Japan. In this individual, there was a similar, though not identical, ZNF850del84. None of the other potential genetic variants identified in the Spanish kindreds was present in the DNA from the InJk individual from Japan. Consistent with the fact that the Kidd antigen, encoded by the SLC14A1gene, is a urea transporter that has been associated with renal function, we found that people with the ZNF850del84 in Spain had an inability to concentrate their urine.
Conclusion: A predicted zinc finger deletion at ZNF850, prevalent in Southern Spain due to a founder mutation, leads to UT‐B1 dysfunction and underlies the dominantly inherited Kidd‐null blood phenotype. The phenotype associates subnormal urine concentrating ability.
Clinical Oral Abstract Session: Components ‐‐ Plasma and RBCs
C19‐A02B
In Vitro Evaluation of Non‐DEHP Plasticized PVC Blood Bags for Fresh Frozen Plasma Storage at 30 Days and 1 Year
Sharon Graminske*1, Kathleen Puca1, Anna Schmidt1, Scott Brooks1, Amanda Boerner1, Sybil Heldke1 and Mark Brucks2
1BloodCenter of Wisconsin, 2Eastman Chemical Company
Background/Case Studies: Di‐(2‐ethylhexyl) phthalate (DEHP) makes PVC film flexible and useful for blood products. During storage, DEHP can leach from the bag film into solution and be metabolized. Studies in rodents have suggested that exposure to DEHP may be associated with adverse health effects, albeit at high dosages. Attempts to find DEHP alternatives for blood bags have been difficult due to the RBC membrane‐stabilizing effect of DEHP.
Bis(2‐ethylhexyl) terephthalate (DEHT) a non‐ortho‐phthalate is structurally and functionally similar to DEHP, but distinct from a metabolic and toxicological standpoint. DEHT can undergo complete hydrolysis and has an excellent safety profile; it is not classified as a carcinogen, mutagen, reproductive toxicant or endocrine disruptor.
The study objective was to evaluate the quality of fresh frozen plasma (FFP) stored in DEHT containers versus FFP stored in DEHP containers at 30 days and 1 year.
Study Design/Methods: Thirty‐six WB units were collected into CPD solution, leukoreduced, centrifuged, and separated into RBC and plasma. ABO identical plasma units were pooled together in groups of three. The 12 pools included 5 group A, 6 group O and 1 group AB. Each plasma pool was weighed, mixed, sampled, divided into DEHP and DEHT pairs, and frozen at less than ‐20°C within 8 hours of collection. In vitro plasma testing (PT, aPTT, Factor V, Factor VIII, Fibrinogen, Protein C, and Protein S) was done on Day 0 (Pool), Day 30, and 1 Year of storage. DEHP and DEHT paired plasmas were thawed and tested at the same time.
Plasticizer concentrations were determined on Day 0, Day 30, and 1 Year of FFP storage. DEHP and DEHT and their monoesters were analyzed by liquid chromatography‐mass spectrometry. Internal standards were deuterated‐DEHP, MEHP, DEHT and MEHT. The lower limits of quantification (LLOQ) were: DEHP = 2.9 ppm; MEHP = 0.3 ppm; DEHT = 0.9 ppm; and MEHT = 0.2 ppm.
Results/Findings: Mean and standard deviation (SD) for key clotting factors and plasticizer results are summarized in the table.

There was no statistical difference in any plasma parameter between DEHP and DEHT bags at the same time period. Factor VIII retained greater than 80% of its initial value. Plasma stored in DEHT bags had an average plasticizer content 90% lower than that of the DEHP bags.
Conclusion: DEHT plasticized PVC containers provide similar FFP performance to that of DEHP plasticized bags. Since DEHT is less polar than DEHP its migration into plasma is also reduced. Based upon this data, DEHT is a potential replacement for DEHP in FFP storage bags.
C20‐A02B
A Microfluidic Analysis of Thrombus Formation in Whole Blood Treated with Spray‐Dried Plasma Versus Fresh Frozen Plasma
Rachel S Bercovitz*1, Caleb S Drew1, Waseem Q Anani1, Mark A Popovsky2 and Kenneth D Friedman1
1BloodCenter of Wisconsin, 2Velico Medical
Background/Case Studies: Plasma prevents dilutional coagulopathy in trauma victims by replacing coagulation factors and substrates during resuscitation with red blood cells (RBCs) and/or crystalloid solutions. Spray‐dried plasma (SpDP) is lightweight and can be reconstituted in minutes making it ideal for use in combat and pre‐hospital settings to rapidly provide plasma in situations where it is impractical to administer fresh frozen plasma (FFP). The spray‐drying process preserves coagulation proteins, but high molecular weight multimers (HMWM) of von Willebrand factor (VWF) are decreased. The objective of this study was to compare SpDP and FFP in reconstituted whole blood (rWB) to test the hypothesis that SpDP is not inferior to FFP in facilitating platelet adhesion and thrombus formation.
Study Design/Method: Under an IRB‐approved protocol, whole blood from healthy volunteers was collected into sodium citrate and centrifuged at 100 g to separate RBCs from platelet‐rich plasma (PRP). PRP was diluted 3‐fold in PIPES‐Saline with 1.4µM PGE1 and centrifuged at 1900 g. The platelet pellet was resuspended in either SpDP or FFP and recombined with the packed RBCs to create rWB with hematocrit of 34‐40% and 150,000‐250,000 platelets/µL. In addition, two rWB pairs were reconstituted with SpDP diluted 1:1 (SpDP50%) with plasma from a patient with Type 3 VW disease (T3VWD). Samples were fluorescently labeled with a GPIIbIIIa‐specific antibody and the sample was flowed through a Type I collagen‐coated microchannel at a shear rate of 1600 s‐1 for 180 seconds. Still images of adherent platelets and thrombi were captured in order to calculate surface area coverage (SA) along the length of the channel. Ratio paired t‐test was used to compare SA in samples reconstituted with SpDP vs. FFP. The margin of noninferiority was 20% (SpDP/FFP > 0.8).
Results/Finding: Six batches of SpDP/FFP were evaluated using 17 subjects. There was no statistical difference between the SpDP/FFP pairs (P=0.7558). The mean ratio of SpDP/FFP was 1.21 with a 95% CI of 0.84 – 1.57. Comparing SpDP vs. SpDP50%, there was no difference (median ratio = 1.045, range: 0.95‐1.14) in SA. Two‐way ANOVA demonstrated that batch did not significantly affect ratio of SA in SpDP vs. FFP.
Conclusion: SpDP, despite a decrease of VWF HMWM, was not inferior to FFP in ability to support platelet adhesion and thrombus formation. On average, SA in samples reconstituted with SpDP was 20% greater than in samples reconstituted with FFP. The lower limit of the 95th% CI is a difference of 16%, which is less than the a priori determined margin of noninferiority of 20%. Even with 50% dilution with T3VWD plasma, there was no reduction in platelet adhesion and thrombus formation in the SpDP rWB samples. These data support the development of in‐human studies to evaluate the efficacy and safety of SpDP in preventing and reversing trauma‐related coagulopathy.
C21‐A02B
Spray‐Dried Plasma Deficient in High Molecular Weight Multimers of Von Willebrand Factor Retains Hemostatic Properties
Michael A. Meledeo*1, Qiyong Peter Liu2, Grantham C. Peltier1, Ryan C. Carney2, Ashley S. Taylor1, Colby S. McIntosh1, James A. Bynum1 and Andrew P Cap1
1U.S. Army Institute of Surgical Research, 2Velico Medical Inc
Background/Case Studies: Restoring coagulation factors is key in acute resuscitation after traumatic hemorrhage, but blood products are frequently unavailable in emergency response due to shelf‐life restrictions and storage needs. A single unit spray dried plasma (SpDP) process has been developed that produces a long‐lived and readily stored product that has a reduction in high molecular weight multimers of von Willebrand factor (vWF) and an increase in low molecular weight multimers. vWF is critical in platelet adhesion and thrombus formation.
Following work demonstrating enhanced function with use of glycine‐based reconstitution solutions for SpDP, this study examines two different SpDP pretreatment conditions.
Study Design/Method: The samples were: (1) FFP; (2) FFP with 70mM glycine; (3) regular SpDP without pretreatment (rSpDP), rehydrated with glycine‐HCl:glycine; (4) SpDP pretreated with glycine‐HCl (20mM); and (5) SpDP pretreated with glycine‐HCl:glycine (20mM:50mM; both pretreated were rehydrated in water). Six donor‐matched plasmas of each type were tested.
vWF activity was measured by ristocetin cofactor assay. Fibrin polymerization kinetics were analyzed by turbidimetry. Thrombin generation (TG) was observed by thrombogram. Chemistry was evaluated by i‐STAT. Residual cell material was quantified by flow cytometry. Coagulation properties were measured by thromboelastography (TEG) in plasma and reconstructed whole blood (40% Hct with 200 platelets/nl from type‐matched donors). Platelet adhesion to collagen under shear was measured by BioFlux.
Results/Finding: Pretreated SpDP showed enhanced vWF activity over rSpDP (p < .05). Fibrin polymerization density was slightly diminished in rSpDP vs. FFP (0.879 vs. 0.742 O.D., p < .01), but TG was unchanged. Bicarbonate/base excess were lower in SpDP samples vs. FFP (p < 0.001). Residual cellular material (especially platelet‐derived) was reduced threefold in rSpDP vs. FFP (p < .01) and an additional twofold in pretreated SpDPs vs. rSpDP (p < .05). TEG results were unchanged in plasma‐only samples; in reconstructed WB there was a reduction in amplitude (clot strength) in all SpDP samples vs. FFP (63.82 vs. 55.0‐59.38; p < 0.01). Platelet adhesion was equivalent in pretreated SpDPs and FFP, while rSpDP was improved vs. all other samples (71.53% surface coverage vs. 30.26‐43.87%, p < .05).
Conclusion: SpDP has a longer shelf life and easier storage requirements than FFP and was equivalent or superior to FFP in most of these in vitro assays. SpDP pretreated with glycine solutions was similar to FFP in most assays and showed superior vWF activity and fewer residual cellular materials but inferior support for platelet adhesion to collagen while under flow compared with untreated SpDP. Clinical significance of these findings is unclear, but overall in vitro outcomes suggest clinical studies are warranted.
C22‐A02B
The Interaction between Red Blood Cell Transfusion and Lung Injury: The Influence of Blood Component Manufacturing Methods
Mathijs Wirtz*1, Anita Tuip‐de Boer1, Ruqayyah Almizraq2, Jason P. Acker3, Philip J. Norris4, Jennifer A Muszynski5 and Nicole Juffermans1
1Academic Medical Center, 2University of Alberta, 3Canadian Blood Services, 4Blood Systems Research Institute, 5Nationwide Children's Hospital
Background/Case Studies: Red blood cell (RBC) transfusion is associated with acute lung injury, in particular in patients on mechanical ventilation. The causative factor is not known but may include residual cells or extracellular vesicles (EVs). In this study we investigated the functional effect of different manufacturing methods of RBC products on the response of pulmonary cells in an in vitro model of mechanical ventilation.
Study Design/Methods: Groups of RBC products (whole blood filtered [WBF], red cell filtered [RCF], apheresis derived [AD] and whole blood derived [WBD]) were manufactured from 8 donors (blood type A or B). Supernatants were prepared after 4‐5 (fresh) and 41‐42 days of storage (stored) for measurement of thrombin generation and EV analysis. A549 type II alveolar cells were seeded onto flexible membranes and incubated with RBC supernatant. Cells were subjected to 25% stretch using a cell‐stretcher. Control cells were not stretched. After 24 hours, IL‐8 and IL‐6 production were measured.
Results/Findings: Both fresh and stored supernatants from AD products significantly increased pulmonary cell IL‐6 and IL‐8 production compared to incubation with other RBC products and non‐incubated controls, which was further exacerbated by cell stretching. AD products also had significantly increased thrombin generating ability compared to other RBC products, as well as a significantly increased number of RBC‐derived EVs compared to RCF and WBD products (p<0.05). Incubation of stretched cells with stored WBF products resulted in higher IL‐8 production compared to other blood products and stretched controls. RCF products did not activate pulmonary cells, had an absence of TG and had low levels of EVs compared to other products.
Conclusion: Manufacturing methods markedly influence the interaction of RBC products with lung cells. AD products activate lung cells, which is further aggravated by cell stretching. This may in part be mediated by RBC‐derived EVs and increased thrombin generating potential, effects which were irrespective of storage duration. Stored WBF products also show an additive effect to inducing lung injury when cells are stretched. In this model of mechanical ventilation, RCF seems to be the safest product to avoid the induction of lung injury.
| Cytokine production of pulmonary cells | ||||||||
|---|---|---|---|---|---|---|---|---|
| IL‐6 (pg/mL) | IL‐8 (pg/mL) | |||||||
| Non‐stretched | Stretched | Non‐stretched | Stretched | |||||
| Non‐incubated controls | 21 ± 12 | 85 ± 34 | 1200 ± 690 | 4300 ± 3900 | ||||
| Fresh | Expired | Fresh | Expired | Fresh | Expired | Fresh | Expired | |
| WBF | 17 ± 2 | 16 ± 4 | 96 ± 69 | 52 ± 23 | 2300 ± 340*‡ | 1800 ± 390‡ | 5200 ± 2400 | 16000 ± 12000*‡ |
| RCF | 12 ± 3 | 8 ± 2 | 40 ± 29* | 36 ± 20 | 1200 ± 260 | 1300 ± 200 | 2300 ± 770 | 2900 ± 1500* |
| AD | 91 ± 18*‡ | 87 ± 33*‡ | 130 ± 55 | 150 ± 35* | 2100 ± 640*‡ | 1900 ± 470‡ | 4100 ± 2500 | 5200 ± 4200* |
| WBD | 19 ± 8 | 55 ± 85 | 81 ± 51 | 91 ± 37 | 1000 ± 230 | 1200 ± 500 | 2700 ± 1300 | 2700 ± 1300 |
Data are mean ±SD, *p<0.05 vs control, ‡p<0.05 vs other RBC product
C23‐A02B
Component Manufacturing Method Affects Immunomodulatory Activity of Red Cell Products
Jennifer A Muszynski*1,2, Somaang Menocha2, Tim Rogers2, Philip J. Norris3, Nicole Juffermans4, Ruqayyah Almizraq5, Mathijs Wirtz4, Philip Spinella6 and Jason P. Acker7
1Nationwide Children's Hospital, 2The Research Institute at Nationwide Children's Hospital, 3Blood Systems Research Institute, 4Academic Medical Center, 5University of Alberta, 6Washington University School of Medicine, 7Canadian Blood Services
Background/Case Studies: Investigators previously demonstrated immunosuppressive effects of RBC supernatant on monocytes in vitro, with greater effects seen in response to older units. Recent clinical data suggest that RBC manufacturing method may influence immunomodulatory potential, but this has not been directly measured. We used in vitro models to test the hypothesis that RBC supernatants obtained by different manufacturing methods will have differential effects on monocyte function.
Study Design/Method: RBC products were manufactured by 4 different methods from 5 individual donors, each: (whole blood filtration [WBF], red cell filtration [RCF], apheresis, and whole blood derived [WBD]). RBC products were stored in SAGM (WBF and RCF) or ADSOL‐containing preservative solution (apheresis and WBD). Supernatants were obtained after 4‐5 days (fresh) and 41‐42 days (expiry). Monocytes were co‐cultured in media plus 20% RBC supernatant or media only (control) followed by LPS stimulation. Experiments were performed in 5 replicates, each with a distinct monocyte donor. Comparisons between groups by ANOVA with Dunnett's post‐test for multiple comparisons. Data are mean ± SD of % of control values.
Results/Finding: Exposure to apheresis or WBD RBC supernatants suppressed monocyte LPS‐induced TNFα production capacity compared to controls (Table 1). This was true for fresh units and those at expiry. For monocytes exposed to RBC supernatant alone without LPS, interleukin‐8 production was higher after exposure to fresh WBF (248 ± 115 % control, p = 0.02) or WBD at expiry (292 ± 111 % control, p = 0.0005).
Conclusion: Manufacturing method and/or storage solution significantly alters immunomodulatory effects of RBC supernatant on monocytes in vitro and may confound analyses of clinical effects of RBC storage duration, particularly within international multi‐center studies.
TABLE 1. LPS‐induced TNFα production as a function of manufacturing method
| RBC group | % of control; (p vs Control) | |
|---|---|---|
| Fresh | Expired | |
| Whole blood filtration |
84 ± 17% (NS) |
81 ± 14% (NS) |
| Red cell filtration |
98 ± 15% (NS) |
102 ± 30% (NS) |
| Apheresis |
54 ± 21% (0.0007) |
48 ± 15% (0.0001) |
| Whole blood derived |
62 ± 10% (0.006) |
59 ± 11% (0.003) |
C24‐A02B
A Magnetic Levitation System to Study the Impact of Donor Gender, Age and Blood Storage Conditions on Red Blood Cell Density Profile
Gozde Durmus*1, Alessandro Tocchio1, Anita Howell2, Kaushik Sridhar1, Jason P. Acker3 and Utkan Demirci1
1Stanford University, 2Canadian Blood Services, Centre for Innovation, 3Canadian Blood Services
Background/Case Studies: The amount of hemolysis in red blood cell units increases as the product ages and has been shown to be lower in female blood donors than in males. It is hypothesized that female donors possess, on average, a younger population of red cells, which results in the lower hemolysis that is observed in the pre‐menopausal population. It is also hypothesized that the differences between donor populations are mitigated by lysis of older cells when whole blood units undergo processing steps to produce red cell concentrate (RCC) units. As red blood cells (RBCs) age in circulation, they undergo characteristic changes in density and membrane composition that allows for them to be separated from younger cells.
Study Design/Method: Our aim is to study the effect of donor factors and method of manufacturing and storing conditions on the average RBC age and density of red cell units. We have recently developed a powerful yet simple and inexpensive magnetic levitation‐based platform, which allows real‐time, high‐resolution imaging and monitoring of various cell populations. This label‐free system allows density profiling for individual red blood cells, with an unprecedented resolution of 10‐4g/mL. First, to determine the effect of RCC storage on the density profile of RBCs, levitation and single‐cell density profiles were measured at 7, 14, 21, 28, 35 and 42 days. In addition, to determine the effect of donor age and sex on the RBC density profile, blood samples from 24 volunteers with four different age and sex categories (Male, 18‐40 years; Male, >60 years; Female, 18‐40 years; Female, >60 years) were profiled.
Results/Finding: First, we observed that the levitation and density profiles as well as morphology of RBCs within RCC units change significantly during storage. In addition, RBC density was significantly different between young (1.098 g/mL) and older female donors (1.109 g/mL) (p < 0.01). Moreover, RBCs from young males (1.096 g/mL) were significantly less dense compared to RBCs profiled from older female donors (1.109 g/mL) (p < 0.05).
Conclusion: We have developed a magnetic levitation system for the point‐of‐care, real‐time evaluation of RBC and red cell concentrate (RCC) quality. We envision our results might inform decision makers about impact that donor deferral criteria may be having on the quality of red cell concentrates available in the blood banks, for the optimal clinical outcomes.
Clinical Oral Abstract Session: Transfusion of Fresh vs. Older Red Blood Cells and Current Issues in the Transfusion of Blood and Blood Products
C25‐A02C
Fresher Blood Is Associated with Higher Oxidation Reduction Potential (ORP) and Increased Risk of Infection in Critically Ill Adults
Amy E Schmidt*1, Kelly F Henrichs2, Anthony P Pietropaoli2, Charles Dorsey3, Kimberly B Bjugstad3, Majed Refaai1 and Neil Blumberg1
1University of Rochester, 2University of Rochester Medical Center, 3Aytu Bioscience
Background/Case Studies: Oxidation Reduction Potential (ORP) or Redox is the ratio of activity between oxidizers and reducers. Redox imbalance caused by a higher production of reactive oxygen species (ROS) and reactive nitrogen species or a decrease in endogenous protective antioxidants results in oxidative stress (OS). While OS can cause cellular injury and death, it is also important in the regulation of a healthy immune response to injury or disease. In the present study we investigated changes in hemoglobin, free heme, and ORP as red blood cells (RBC) age and the effects of red blood cell age on ICU patient morbidity and mortality.
Study Design/Method: 120 ICU patients were enrolled in this prospective observational trial investigating the effect of transfused RBC age on ICU patient morbidity and mortality. All RBCs were pre‐storage leukoreduced and ABO identical. Citrated blood samples were collected from each RBC unit prior to issue. The RBC supernatants were tested for free hemoglobin/heme and ORP. The patients were followed prospectively.
Results/Finding: A total of 426 RBC units were transfused. Patients and RBC characteristics are shown in the table. Significant reductions were detected in ORP values over storage duration (p<0.001). Substantial correlations were also found between ORP and free hemoglobin (p<0.05) and ORP and free heme (p<0.05). Interestingly, there was a statistically significant difference between the average ORP values of the transfused RBC in patients who developed infection with higher ORP values measured in RBC units given to patients who developed post‐transfusion infections 132 ± 10 vs 127 ± 13 (p<0.05). No significant differences were observed between ORP and patient mortality, hospital/ICU days, or thrombosis. Also, no correlations were detected between free heme/hemoglobin or RBC age and infection development.
Conclusion: These data demonstrate that older blood has lower ORP values as well as increased free heme/hemoglobin. There were no differences in ORP values between the different blood groups once RBC age was controlled for and there were no statistically significant differences in patient mortality associated with ORP, free heme/hemoglobin, or RBC age. The decreased ORP values observed in the older blood are likely attributable to the “storage lesion”. Higher transfused RBC ORP values were associated with subsequent development of infection, and younger RBCs were found to have higher ORP values. Thus, this data supports that young/fresher blood may predispose to subsequent development of infection in critically ill patients. Further studies are needed.
TABLE 1. Patients and RBC characteristics
| Characteristic | Mean + SD (Range) |
|---|---|
| Age (years) | 58.7 + 17.3 (18‐93) |
| APACHE II Score | 25 + 8 (6‐52) |
| RBC age (days) | 23.5 + 8.5 (4‐42) |
| ORP | 131 + 18 (92‐231) |
| Free hemoglobin (g/dL) | 218 + 157 (51‐1419) |
| Free heme (µM) | 103 + 55 (37‐374) |
| Death | 49 (41%) |
| Infection | 63 (53%) |
| Thrombosis | 24 (21%) |
C26‐A02C
Analysis of Red Blood Cell Storage Duration and in‐Hospital Mortality Using Time Dependent Exposure: Is the Oldest Blood Bad?
Nancy M Heddle*1,2, Richard J Cook2,3, Ker‐Ai Lee3, Donald M Arnold2,4, Mark Crowther1, Phillip Devereaux4, Martin Ellis5, Priscilla Figueroa6, Andrea Kurz6, David Roxby7, Daniel Sessler6, Yehudit Sharon5, Magdalena Sobieraj‐Teague8, Theodore Warkentin2,9, Kathryn Webert2,10, Rebecca Barty1,2, Yang Liu2,4 and John Eikelboom1
1McMaster University, 2McMaster Centre for Transfusion Research, 3University of Waterloo, 4McMaster University, 5Meir Medical Center, 6Cleveland Clinic, 7Transfusion Medicine, SA Pathology, 8Flinders Medical Center, 9Hamilton Health Sciences, 10Canadian Blood Services
Background/Case Studies: No randomized trials in humans have addressed whether only exposure to red blood cells (RBCs) that have been stored for a long time is associated with harm. We explore the effect on in‐hospital mortality of transfusing RBCs stored for more than 35 days compared to RBCs stored for 7 days or less.
Study Design/Method: Data from a multi‐national randomized controlled trial were used for this exploratory analysis. The patients were hospitalized adults who required transfusions and were randomly allocated to receive the freshest RBCs in inventory or the oldest (standard issue) RBCs providing a large cohort of patients receiving RBCs with storage durations along the entire RBC storage continuum of 1 to 42 days. Using a time dependent variable patient exposure was defined by the maximum storage duration of RBCs received. This was then used to classify individuals on each day of hospitalization into one of three mutually exclusive exposure categories: freshest (exclusively exposed to RBCs less than or equal to 7 days storage duration – reference group), medium age (at least 1 RBC of 8‐35 days storage), and oldest (at least 1 RBC greater than 35 days storage). The primary outcome was all‐cause in‐hospital mortality. Cause‐specific Cox regression models of in‐hospital death assessed the effect of exposure of RBCs in each category to exclusive exposure to RBCs stored for 7 days or less. The effects of fixed and time‐dependent confounders were dealt with through stratification and regression. Sensitivity analyses were conducted with a) weekly partition with cut‐points every 7 days, and b) a finer partition using cut‐points every 3 days.
Results/Finding: 24,726 patients receiving 90,530 RBCs were included in the analysis. Exposure to RBCs stored for more than 35 days was not associated with increased risk of in‐hospital death compared with exposure exclusively to the freshest RBC units (stored for 7 days or less) after adjusting for several fixed and time‐dependent potential confounders (HR = 0.91; 95% CI: 0.72, 1.14; p = 0.400). Exposure to blood stored for at most 8‐35 days yielded a similar hazard ratio (HR = 0.90; 95% CI: 0.73, 1.10; p = 0.295). In the sensitivity analyses using weekly partitions, exposure to RBCs stored for greater than 35 days compared to exclusive exposure to RBCs stored 7 days or less was not significant (HR 0.90; 95% CI 0.72, 1.14; p = 0.381). The confidence intervals around the hazard ratios for the other 7‐day intervals all include 1. Similar findings were obtained with partitioning exposure data into 3 day intervals where exposure to RBCs stored for 40‐42 days was not associated with increased risk of death compared with exclusive exposure to RBCs stored for 1‐3 days (HR 0.82; 95% CI 0.37, 1.83; p = 0.635). The confidence intervals around the hazard ratios for the other 3‐day intervals all include 1.
Conclusion: Individuals exposed to RBCs stored for more than 35 days were not at increased risk of in‐hospital death compared to individuals exposed exclusively to RBCs stored for 7 days or less.
C27‐A02C
Transfusion of Anaerobically Stored Red Blood Cells Improves Recovery in Experimental Rat Hemorrhagic Shock Model
Alexander Williams*1, Cynthia Walser1, Tatsuro Yoshida2, Andrew Dunham2 and Pedro Cabrales1
1University of California San Diego, 2New Health Sciences Inc.
Background/Case Studies: Hemorrhagic shock (HS) severely decreases oxygen (O2) delivery and induces cardiovascular collapse. In parallel to controlling the hemorrhage, clinicians respond by infusing large volumes of red blood cells (RBCs) to restore blood volume, O2 carrying capacity, and hemodynamic stability. The quality of the transfused RBCs determines the recovery from HS, and extent of clinical sequelae prompted by the HS. This study compares the ability to recover from HS with conventionally stored RBCs, anaerobically (O2 saturation <10%) stored RBCs, or anaerobic/hypercapnic (O2 saturation <10% and pCO2 (@37°C)∼70mmHg) stored RBCs.
Study Design/Method: Packed red blood cells (pRBCs) stored in AS‐3 after leukorfiltration were created from donor Sprague‐Dawley rats. pRBC units were randomly stored under either 1) conventional; 2) anaerobic; or 3) anaerobic/hypercapnic conditions. Rats (150‐200g) were hemorrhaged to 50% of blood volume, held in hypovolemia for 30 minutes, and resuscitated to recover blood pressure to 90% pre‐hemorrhage with pRBC stored for either 1 or 3 weeks. Systemic hemodynamics, cardiac function, and blood gas parameters were monitored during shock and resuscitation; and vital organ inflammation, oxygenation, and function were evaluated post resuscitation. Data were analyzed using two‐way ANOVA, followed by the appropriate post hoc analyses.
Results/Finding: Conventionally stored RBCs were more susceptible to both biochemical and mechanical changes during storage compared to anaerobic or anaerobic/hypercapnic storage. 24‐hour post transfusion recovery of anaerobically or anaerobic/hypercapnic stored RBCs was significantly higher compared to conventionally stored RBCs (P<0.05). Shock impaired cardiac function and oxygen delivery, and resuscitation with pRBCs restored cardiac output. Recovery of systemic vascular resistance was attained earlier and with a lower volume with either anaerobic or anaerobic/hypercapnic stored RBC. Resuscitation with either anaerobic or anaerobic/hypercapnic required significantly lower volume (1.5 and 1.7 fewer units than conventional storage) of pRBC to preserve hemodynamics during resuscitation (P < 0.05). Conventionally stored RBCs resuscitated animals showed impaired ability to deliver O2to tissues, increased lung, liver, and spleen inflammatory markers, and decreased liver and kidney function, compared to animals resuscitated with either anaerobic or anaerobic/hypercapnic pRBC.
Conclusion: Studies indicate that anaerobic or anaerobic/hypercapnic storage of RBC can improve clinical outcomes from hemorrhagic shock in a rat model, as evidenced by hemodynamic stability, enhanced O2 delivery, and reduction in vital organs inflammation and function.
C28‐A02C
Quantitation of Isoagglutinin Titers of Platelets Stored in Additive Solution: Strategy for Hemolysis Risk Mitigation
Shiva Khoobyari*1, Brennan L. Katchatag2, Ryan A. Metcalf3, Mark Van Gerwen1, Rebecca Haley4, Terry Gernsheimer1, John Hess5 and Monica B. Pagano3
1University of Washington, 2Harborview Medical Center, 3Division of Transfusion Medicine, University of Washington, 4Bloodworks Northwest, 5Division of Transfusion Medicine, Harborview Medical Center
Background/Case Studies: Transfusion of minor ABO incompatible platelets poses a risk for hemolytic reactions. Different strategies such as washing and reduction of plasma volume by centrifugation have been used to reduce the risk of hemolysis. Although it is still controversial whether there is a “safe” titer that would not result in hemolysis, many institutions provide “low titer” units when transfusing minor ABO incompatible platelets. Another strategy that has been proposed but not evaluated includes the use of platelet collected in platelet additive solution (PAS). The aims of this study are 1) to characterize isoagglutinin titers in platelets stored in PAS and evaluate how they compare to titers from unmodified donor plasma, 2) to evaluate cost of the use of PAS compared to plasma reduction.
Study Design/Method: Paired plasma donor (unmodified) and platelet (collected in PAS‐F) samples were obtained from the local blood center. Using the tube method, serial two fold dilutions of plasma was prepared for both IgM and IgG antibodies. The titer was interpreted as the reciprocal of the highest dilution that yields a 1+ macroscopic reaction.
Results/Finding: A total of 101 pairs of donor/platelet samples were tested including 40 group O, 52 group A and 9 group B. The titer median and range for donor samples and PAS platelets are presented on Table 1a. Overall, PAS platelets units’ isoagglutinin titers were 1.3 dilutions lower than unmodified plasma donor samples. Group O anti‐A titers distribution for PAS and donor samples are presented on Table 1b. No group O PAS platelets had a titer > 64. Cost analysis demonstrated that 1unit of plasma reduced platelets [$584.7 (platelet: $545, volume reduction: $39.7)], has similar cost than 1 PAS platelets unit ($580).
Conclusion: The use of PAS effectively decreases plasma isoagglutinin titers to levels that are considered low risk for hemolytic episodes, and it is cost effective when compared to plasma reduction.
| 1a. Titers | Group O | |||
|---|---|---|---|---|
| Anti‐A | Anti‐B | |||
| Anti A IgG | Anti A IgM | Anti B IgG | Anti B IgM | |
| Donor Sample | 64 (16‐256) | 16 (8‐64) | 32 (8‐256) | 16 (4‐64) |
| PAS Platelets | 32 (4‐64) | 4 (1‐16) | 16 (2‐64) | 8 (1‐16) |
| Group A | Group B | |||
| Anti B IgG | Anti B IgM | Anti A IgG | Anti A IgM | |
| Donor Sample | 8 (2‐64) | 8 (1‐64) | 16 (4‐16) | 16 (4‐16) |
| PAS Platelets | 4 (1‐16) | 2 (1‐16) | 4 (2‐8) | 4 (1‐8) |
| 1b. Distribution | Anti‐A Ig G | Anti‐A Ig M | ||||
|---|---|---|---|---|---|---|
| Group O | Titer | n | % | Titer | n | % |
| Donor Sample | 256 | 4 | 10 | 64 | 2 | 5 |
| 128 | 13 | 32.5 | 32 | 10 | 25 | |
| 64 | 18 | 45 | 16 | 19 | 47.5 | |
| 32 | 3 | 7.5 | 8 | 8 | 20 | |
| 16 | 2 | 5 | 4 | 1 | 2.5 | |
| PAS Platelets | 64 | 9 | 22.5 | 16 | 5 | 12.5 |
| 32 | 19 | 47.5 | 8 | 15 | 37.5 | |
| 16 | 8 | 20 | 4 | 17 | 42.5 | |
| 8 | 1 | 2.5 | 2 | 2 | 5 | |
| 4 | 3 | 7.5 | 1 | 1 | 2.5 | |
C29‐A02C
Correlation of Antibody Screens with Clinical Response to Daratumumab Therapy in Multiple Myeloma Patients
Jaleah Hawkins*, Raeann Thomas, Meghan Herwig, Rachel Davis‐Rauser, Colleen H Erb, Abbey C Barron, Brendan Weiss, Helen Carpenter, Carlos Villa, Suzanne Thibodeaux and Nicole Aqui
University of Pennsylvania
Background/Case Studies: Daratumumab (DARA) is an anti‐CD38 monoclonal antibody used for the treatment of multiple myeloma (MM). CD38 is expressed on plasma cells, as well as red blood cells (RBCs). Interference with serology testing including positive type and screens (T&S) has been described. Some patients do not demonstrate serologic interference; anecdotally these patients may have poorer clinical response. This retrospective study explores the relationship between DARA‐induced serologic interference and clinical response.
Study Design/Method: MM patients on DARA were identified by the clinical team. Data over a 23‐month period were used to identify patients with repeatedly negative T&S (NEG) and positive T&S controls (POS). Patient treatment response evaluations (eval), as determined by the clinical team, were reviewed and separated into 3 categories: short term(assessment <7 weeks post DARA); standard (assessment 8 weeks ± 1 week post DARA); long term(assessment >9 weeks post DARA). Data was analyzed with the Chi‐square test (Graphpad version 5.0b).
Results/Finding: 62(58%) of 107 DARA patients had repeat T&S available for review. 9(15%) patients qualified for the NEG group. See Table 1 for patient characteristics. 8(89%) NEG patients withdrew from treatment compared to 36(68%) POS patients. 5(56%) NEG patients terminated treatment <7 weeks after initiation compared to 19(36%) POS patients. Mean length of treatment in the NEG and POS groups was 41 days and 71 days; respectively.
1(11%) NEG patient showed short term response and 6(67%) patients showed progressive disease. At the NEG group standard eval 1(11%) patient showed response and 3(33%) had progressive disease. 1(11%) NEG patient had long term response compared to 11(21%) POS patients. At the POS short term eval 22(42%) patients showed response and 20(38%) patients had progressive disease. At the POS group standard eval, 20(38%) patients showed response and 6(11%) patients had progressive disease. Overall, 28(53%) POS patients responded compared to 2(22%) NEG.
TABLE 1. C29‐A02C
| NEG (n=9) | POS (n=53) | |
|---|---|---|
| Age (µ) | 57.7 | 61.9 |
| % Living | 33 | 68 |
| % Response at Short Term | 11 | 42 (p=0.08) |
| % Response at Standard | 11 | 38 (p=0.1) |
| % Response at Long Term | 11 | 21 |
| % Overall Response | 22 | 53 (p=0.09) |
Conclusion: There is a trend in lower response rate in patients with negative antibody screens compared to positive controls. These findings suggest that an anti‐CD38 neutralizing substance could play a role in treatment response. Alternatively, reduced CD38 expression may also contribute. The low response rates seen in both groups may result from biased selection. The need for repeat T&S and presumed repeat transfusions may be preselecting patients with more aggressive disease. Also, only a small number of patients were suitable for review. A larger prospective study that controls for such variables is needed.
C30‐A02C
A Review of Blood Utilized during Provider‐Activated and Critical Administration Threshold‐Triggered Massive Transfusion Events
Patrick Ramos* and John Hess
Division of Transfusion Medicine, Harborview Medical Center
Background/Case Studies: Traditional definitions of massive transfusions — e.g., the transfusion of ten or more units of red blood cells (RBCs) in a 24‐hour period — are limited in prospectively identifying patients requiring massive transfusions, excluded patients who may not survive long enough to meet criteria, or ignored the acuity of the event. To address these issues, a level I trauma center adopted the critical administration threshold (CAT) as an additional indication for activating its massive transfusion protocol (MTP). This study reviewed blood utilized during massive transfusion events based upon whether the MTP was provider‐activated versus CAT‐triggered.
Study Design/Method: All massive transfusion events between January and April 2017 were reviewed to identify the start time, termination time, number of components transfused, and the start time of each component transfused. The transfusion of three or more blood components in an hour defined CAT. A massive transfusion was any event in which the concern for hemorrhagic shock either necessitated a provider to activate the MTP or blood components were transfused at a rate that met CAT criteria. The massive transfusion start time is based on either the time the provider activated the MTP or the time the first blood component was transfused, whichever came first. Unless the patient expired first, the termination of the massive transfusion event was determined by identifying the point in time in which the patient went three or more hours without the transfusion of any additional blood components. This information was tabulated to determine the monthly number of provider‐activated MTPs, CAT‐triggered MTPs, and average blood component transfused per massive transfusion.
Results/Finding:
| Provider‐Activated | CAT‐Triggered | |
|---|---|---|
| Number of massive transfusion events | 77 | 96 |
| Quantify transfused for all events | ||
| RBC | 475 | 363 |
| Plasma | 448 | 335 |
| Platelets | 80 | 89 |
| All Blood Components (including cryo) | 1031 | 806 |
| Per event, average: | ||
| RBC | 6.2 | 3.8 |
| Plasma | 5.8 | 3.5 |
| Platelets | 1.0 | 0.9 |
| All Blood Components (including cryo) | 13.4 | 8.4 |
| For all events, mode: | ||
| RBC (Number of MTPs) | 2 units (12) | 2 units (36) |
| Plasma (Number of MTPs) | 2 units (14) | 2 units (30) |
| All Blood Components (Number of MTPs) | 4 units (11) | 4 units (25) |
A monthly breakdown for both groups also displayed a downward trend in the average use of blood components.
Conclusion: Blood utilization is lower within the CAT‐triggered MTPs even though it outnumbered provider‐activated MTPs. However, the mode for both groups suggests that most massive transfusion require less blood components than the average rate. Using the mode provides an approximate 24% replacement of blood volume. This should be enough to counter the early signs and symptoms of hemorrhagic shock. Though this study did not review the appropriateness of provider‐activated MTPs, using CAT as an indicator ensures clinicians are prepared for a potential massive transfusion. Further investigation is needed to determine the factors contributing to the downward trend of the average blood components transfused. The mode would suggest optimistically that patients are being stabilized faster and resuscitated more efficiently. If this is the case, defining massive transfusion should include the rate of components transfused in addition to the total volume transfused.
Clinical Oral Abstract Session: Special Serological and Molecular Techniques
C31‐A03D
The Long Term Storage Effect of 0.2M Dithiothreitol on Red Cell Antigen Integrity in Reagent Red Blood Cells
Heike Carrel*1, Laurie Sutor1,2, Germán Leparc3, Marjorie Doty3 and William Crews1
1Carter BloodCare, 2UT Southwestern Medical Center, 3OneBlood
Background/Case Studies: Anti‐CD38 drugs, such as daratumumab, pose a problem for the transfusion service. They may cause a number of false positives, including positive direct antiglobulin tests (DAT), indirect antiglobulin tests (IAT), and panreactivity in eluates. Such results can prolong compatibility testing and delay delivery of blood products for patients. Treating reagent red cells (rRBCs) with 0.2M dithiothreitol (DTT) removes drug interference due to daratumumab and allows for the detection of underlying alloantibodies. This study aimed to investigate the effect of DTT‐treatment on rRBC antigen integrity over a 28 day period.
Study Design/Method: Twelve aliquots of human plasma, each containing an antibody of a single, known specificity (anti‐D, ‐C, ‐E, ‐c, ‐e, ‐M, ‐S, ‐s, ‐Fya, ‐Fyb, ‐Jka, and ‐Jkb), were tested against untreated and 0.2M DTT‐treated rRBCs (Immucor Panoscreen I, II, III; DTT from Acros Organics). DTT treatment of rRBCs was performed using the methodology described in the AABB Technical Manual (18thedition). Each of the 12 plasma aliquots was further separated into 28 aliquots and stored at ‐20°C until day of use. Fresh aliquots were thawed each day to avoid unintended antibody integrity degradation. A Polyethylene Glycol (Immucor) enhancement technique was used and reactions were read at the IAT phase. Hemolysis, if present, was observed in the diluent each day prior to mixing the cell suspension and given a grade based on the Haemonetics color comparator chart. Serological antibody reaction strengths were observed and documented each day.
Results/Finding: There was noticeably more hemolysis with the DTT‐treated cells over time compared to the untreated cells. Red cell antigens remained serologically detectable on the DTT‐treated cells throughout the study, despite a greater degree of observed hemolysis. There was minimal difference in reactivity strength between untreated and DTT‐treated cells for antigens not affected by DTT. In most instances, the DTT‐treated cells reacted slightly more strongly. None of the antibodies produced reactivity strengths of less than 1+ with the untreated or DTT‐treated cells during the study.
Conclusion: Long term storage of 0.2M DTT‐treated rRBCs does not compromise antigen integrity. Advance DTT‐treatment and storage of a large aliquot of rRBCs may serve to increase efficiency in the transfusion service.
TABLE 1. Hemolysis grade of untreated and 0.2M DTT‐treated cells based on Haemonetics color comparator chart for each day tested
| Day Tested | |||||||||||||||||||||||||||||
|---|---|---|---|---|---|---|---|---|---|---|---|---|---|---|---|---|---|---|---|---|---|---|---|---|---|---|---|---|---|
| Cell | 0 | 1 | 2 | 3 | 4 | 5 | 6 | 7 | 8 | 9 | 10 | 11 | 12 | 13 | 14 | 15 | 16 | 17 | 18 | 19 | 20 | 21 | 22 | 23 | 24 | 25 | 26 | 27 | 28 |
| Untreated SC I | 4 | 4 | 4 | 4 | 4 | 4 | 4 | 4 | 4 | 4 | 4 | 4 | 4 | 4 | 4 | 5 | 5 | 5 | 5 | 5 | 5 | 5 | 5 | 5 | 5 | 5 | 5 | 5 | 6 |
| Untreated SC II | 4 | 4 | 4 | 4 | 4 | 4 | 4 | 4 | 4 | 4 | 4 | 4 | 4 | 4 | 4 | 5 | 5 | 5 | 5 | 5 | 5 | 5 | 5 | 5 | 5 | 5 | 5 | 5 | 6 |
| Untreated SC III | 4 | 4 | 4 | 4 | 4 | 4 | 4 | 4 | 4 | 4 | 4 | 4 | 4 | 4 | 4 | 5 | 5 | 5 | 5 | 5 | 5 | 5 | 5 | 6 | 6 | 6 | 6 | 6 | 6 |
| 0.2M DTT‐treated SC I | 4 | 4 | 4 | 4 | 4 | 4 | 4 | 5 | 5 | 5 | 5 | 5 | 5 | 5 | 5 | 6 | 6 | 6 | 6 | 6 | 6 | 6 | 6 | 6 | 6 | 6 | 6 | 6 | 6 |
| 0.2M DTT‐treated SC II | 4 | 4 | 4 | 4 | 4 | 4 | 5 | 5 | 5 | 5 | 5 | 5 | 5 | 5 | 5 | 6 | 6 | 6 | 6 | 6 | 6 | 6 | 6 | 6 | 6 | 6 | 6 | 6 | 6 |
| 0.2M DTT‐treated SC III | 4 | 4 | 4 | 4 | 4 | 4 | 4 | 4 | 5 | 5 | 5 | 5 | 5 | 5 | 5 | 6 | 6 | 6 | 6 | 6 | 6 | 6 | 6 | 6 | 6 | 6 | 6 | 6 | 6 |
C32‐A03D
Use of Molecular Testing and Monocyte Monolayer Assay in a Patient with Anti‐hrS and –Hr
Margaret A Keller*1, Pamela Nickle1, Paul Mansfield1, Jessica Keller1, Trina Horn1, Maria Burgess1, F Bernadette West1, Rebecca Klayman1 and Sandra Nance2
1American Red Cross, 2American Red Cross, Immunohematology Reference Laboratory, Biomedical Services
Background/Case Studies: An 18‐year old female was admitted for sickle cell crisis and symptomatic anemia; her physician ordered 2 red blood cell (RBC) units. She was Group A, weak D+ with a history of transfusion several years prior. The Immunohematology Reference Lab identified anti ‐e, ‐K, ‐Fya, ‐Jkb and unexplained reactivity with all reagent red cells tested except her own. Molecular testing was recommended to aid in antibody identification and selection of compatible units.
Study Design/Method: Genomic DNA was extracted from EDTA peripheral blood. RBC genotyping included PreciseType HEA Molecular (HEA), RHD and RHCE BeadChips (Immucor), PCR RFLP analysis for RHD c.1136C>T and RHCE c.254C>G. Sanger Sequencing of RHCE‐cDNA PCR products and plasmids containing those products was performed (GeneWiz) and sequences aligned using Sequencher (GeneCodes). Punnett Square analysis was performed as described (Keller MA etal. Transfusion 53(2S)174A, 2013). Antibody identification studies were performed by standard tube methods. Monocyte Monolayer Assay (MMA) was performed as described (Transfusion1987; 27:449‐452).
Results/Finding: The HEA panel predicted the patient to type C‐c+ E‐e+ K‐ Jk(a+b‐) Fy(a‐b+). RHD genotype results supported the patient being hemizygous or homozygous for RHD*DAR1 family allele. This D variant often presents as a serologic weak D. RHCE genotyping found the patient to carry a RHCE*ceEK allele and a novel allele with c.712G, 787G, 800A but lacking 48C. This allele is provisionally called RHCE*ceEK.01. The predicted Rh phenotype is partial D+ C‐ E‐ partial c partial e and hrS‐. Punnett square analysis for RH genotype matching assigned donors homozygous for RHCE*ceEK as Tier 2 whereas donors homozygous for other hrS‐ alleles such as RHCE*ceMO and RHCE*ceAR were assigned Tier 3. Adsorbed serum from allogeneic adsorption tested with RBCs with variant RHCE alleles predicted be hrS‐ as well as r”r” cells demonstrated that the patient had allo anti‐hrS (also anti‐K, ‐Fya ‐Jkb). MMA studies performed with rr and R2R2 cells were positive (35.0% and 44.15% respectively) while RBCs with RHCE*ceAR or RHCE*ceMOin homozygosity were negative (0.2% and 0.3% respectively).
Conclusion: Individuals carrying RHCE variant alleles that predict an E‐ hrS‐ phenotype are at risk of anti‐hrS and anti‐Hr. It is known that patients with anti‐hrS are not compatible with all RBCs carrying any of the several alleles predicted to be hrS‐. The testing in this patient suggested that a patient with RHCE*ceEK alleles and allo‐anti‐hrS and ‐Hr could be compatible with donor units carrying RHCE*ceAR and RHCE*ceMO. Since RBCs negative for E and hrS are rare in the US population, studies showing that different hrS‐ alleles may be cross compatible may aid in the effort to find compatible blood products for such patients.
C33‐A03D
Cryopreserved Buffy Coat‐Derived Monocytes for the Assessment of Alloantibody Clinical Significance
Betty Kipkeu1, Donald R. Branch1,2, Jason P. Acker*1,3 and Jelena Holovati3
1Canadian Blood Services, 2University of Toronto, 3University of Alberta
Background/Case Studies: Monocyte monolayer assay (MMA) is a cellular bioassay used to evaluate the hemolytic significance of blood group antibodies and aid in the selection of RBCs for alloimmunized patients. The requirement for fresh auto/allogenic monocytes for MMA is highly restrictive due to tedious processing of fresh peripheral blood (PB). Our previous study described processing and cryopreservation of buffy‐coat (BC) derived and fresh PB‐monocytes for MMA assay. The aim was to evaluate the functional properties of cryopreserved BC‐monocytes as substitute for fresh PB‐monocytes in MMA in evaluation of previously reported clinically significant RBC alloantibodies.
Study Design/Methods: Peripheral blood mononuclear cells (PBMCs) were isolated from buffy‐coats (Histopaque‐10771), pooled, suspended in cryopreservation media (20% DMSO; 1:1) and stored in liquid nitrogen. PBMC membrane integrity post‐thaw was determined by trypan blue exclusion. PBMCs were cultured on poly‐L‐lysine‐treated coverslips (37°C, 5% CO2, 1h) and monocyte monolayers incubated with fresh or cryopreserved antigen positive (O+) RBCs sensitized with either anti‐D (positive control), anti‐Scianna‐2 (Sc2) or anti‐AnWj or lipopolysaccharide stimulated for 2h. Aliquots of the sensitized RBCs were tested for opsonization by indirect antiglobulin test (IAT). Phagocytosis index (PI) was determined microscopically as the number of fully phagocytosed RBCs/100 monocytes. Supernatants were analyzed for cytokines using Luminex technique.
Results/Findings: Cryopreserved PBMCs showed 96.2 ± 1% viability post‐thaw. We report no significant difference in phagocytosis of anti‐D sensitized RBCs by cryopreserved monocytes vs fresh monocytes. We show a significant increase in TNF‐α, IL‐1β, IL‐6, IL‐8, MIP‐α (p < 0.01), MIP‐β and GRO (p < 0.05) secretion from cryopreserved BC monocytes vs both fresh BC and PB‐monocytes. Sc2‐ and AnWj‐sensitised RBCs resulted in a PI of 9.2 ± 2% and 60.2 ± 6.4% respectively vs anti‐D sensitized RBCs (PI: 72 ± 8.7%). A weak (1+) reactivity by IAT was observed for anti‐AnWj sensitized RBCs while anti‐D sensitized RBCs resulted in 4+ IAT reactivity. These results correlated with previously reported results for clinical significance and MMA when using freshly obtained autologous or healthy donor monocytes.
Conclusion: This study shows that cryopreservation preserved monocyte viability and phagocytosis function for MMA. As previously reported with fresh monocytes MMA assay, the two alloantibodies tested with cryopreserved BC monocytes were shown to have a phagocytic index of clinical significance (PI>5%). The use of cryopreserved BC‐monocytes has the ability to achieve consistent and predictable results from MMA by minimizing inter‐assay variations.
C34‐A03D
Unexpected Antigen Typing Discrepancies in Testing of DAT+ RBCs with Monoclonal Reagents
Helene DePalma*1, Christine Lomas‐Francis2, Kim Wilson‐Sandberg3, Randall Velliquette2, Sunitha Vege2 and Connie M. Westhoff2
1New York Blood Center, 2Immunohematology and Genomics Laboratory, New York Blood Center, 3Long Island Jewish Medical Center
Background/Case Studies: Monoclonal reagents that are direct‐agglutinating are considered suitable for typing DAT positive (DAT+) RBCs. We describe antigen typing discrepancies in 5 patients, involving 3 antigens (C, Jka, S), revealed when serologic results differed from the phenotype predicted by DNA testing. All 5 patients had 3‐4+ positive DAT with anti‐IgG and warm autoantibodies identified in the plasma. Investigation of the antigen typing discrepancies showed both false negative and false positive results using monoclonal reagents.
Study Design/Method: Standard tube hemagglutination methods were used for antigen typing. RBCs were treated with EDTA glycine‐acid (EGA) using Gamma EGA Kit. Genomic DNA was isolated from WBCs and HEA PreciseType performed.
Results/Finding: The RBCs of patients 1 and 2 typed C– on initial testing with Immucor Gamma‐clone anti‐C, but were predicted C+ by HEA PreciseType. EGA‐treated RBCs gave 3+ reactions with the same anti‐C reagent. Patient 1 RBCs gave variable reactivity (vw‐1+) with Bio‐Rad Seraclone and Ortho BioClone anti‐C. Patient 2 RBCs gave 1+ reactivity with all 3 anti‐C reagents when incubated for the maximum incubation time allowed. Patient 3 RBCs were Jk(a+) with Immucor Gammaclone anti‐Jka, which the manufacturer states is suitable for testing DAT+RBCs, but predicted Jk(a–) by HEA. EGA‐treated RBCs tested Jk(a–) with the same reagent. RBCs from patients 4 and 5 tested S+ with Bio‐Rad Seraclone anti‐S (3‐4+), but predicted S– by HEA. Further testing with Immucor Gammaclone anti‐S showed RBCs from both patients were S–. EGA‐treated RBCs from both were non‐reactive with both anti‐S reagents.
Conclusion: Commercial monoclonal reagents are valuable resources, especially when phenotyping DAT+ RBCs but not all manufacturers include reagent limitations regarding testing of DAT+ RBCs. We describe 2 cases of false negative tests with monoclonal anti‐C due to antigen blocking by IgG, and 3 cases with false positive tests with anti‐S (n=2) and anti‐Jka (n=1) typing. False positive tests would potentially be anticipated, but false negative results due to antigen blocking are unexpected. Extended incubation as indicated in the reagent insert may reveal weak reactivity when antigen blocking is involved. Results concordant with DNA testing were obtained with EGA‐treated RBCs, but it is generally accepted that this is not necessary when using a direct‐agglutinating monoclonal reagent. These cases caution the potential for both false negative and false positive results for samples with 3‐4+ positive DAT and supports testing to dissociate IgG from RBCs strongly DAT+ before antigen typing. In addition, this report highlights the benefits of DNA testing as part of the routine reference laboratory workup.
C35‐A03D
Serologic and Molecular Characterization of Weak D Type 29
Mouna Ouchari*1, Kshitij Srivastava2, Andrea Döscher3, Roland Conradi4, Saloua Jemni5, Franz Friedrich Wagner6 and Willy Albert Flegel1
1NIH, 2DTM/CC/NIH, 3Institutes Springe and Bremen, 4Johannes Gutenberg‐University, 5Regional Blood Transfusion Center Sousse, Tunisia, 62DRK Blutspendedienst NSTOB, Institutes Springe and Bremen
Background/Case Studies: The human RhesusBase lists 145 molecular weak D types, with types 1, 2 and 3 representing more than 90% of all weak D types in Caucasians. Weak D type 29 is caused by 8 SNPs in the RHD exons 2, 4, 5 and 7. In 2003, Perco and colleagues inadvertently found the original weak D type 29 sample, while exploring 3 complementary methods for D zygosity testing. A second example of weak D type 29 was observed in Tunisia among 448 samples that were D negative by the indirect antiglobulin test. Also, a nucleotide sequence FR745438 closely resembled weak D type 29 with 1 additional missense mutation and lacking 1 silent mutation. None of these reports documented a detailed serologic description or the RH haplotype involved. In the present study, we describe the serology of weak D type 29 and its RH haplotype including stretches of the introns.
Study Design/Methods: Samples from the Tunisian donor and the original donor FR745438 and his parents in Germany were collected. Standard hemagglutination and flow cytometry tests were performed. The nucleotide sequences of all 10 exons as well as adjacent intronic regions, including the 5’ and 3’ untranslated regions (UTR), were determined for the RHD and RHCE genes. A phylogenetic tree for weak D type 29 allele was established.
Results/Findings: The weak D type 29 allele was confirmed in both the Tunisian donor and the German donor. Molecular analysis in the German donor family showed that the donor and his father shared the RHD*weak D type 29 – RHCE*ce haplotype, similar to the Tunisian donor. While exploring the family of the German donor, the father reported to be born in Tunisia. The D antigen densities for both donors with the serologic weak D type 29 phenotype was found to be 174 and 80 D antigens per red blood cell, respectively. The observed agglutination patterns correlated well with the antigen densities. Both weak D type 29 samples showed weak or negative reactivity with a panel of 12 monoclonal anti‐D as compared with weak D type 4.0, weak D type 4.1, and weak D type 4.2.2. Phylogenetic analysis showed that the weak D type 29 allele evolved through genomic point mutation, gene conversion and recombination events with other RHD alleles.
Conclusion: Our study resolved 2 seemingly closely related RHD alleles with a complex phylogenic origin, which was a conundrum since 2010. A corrected sequence was deposited for the FR745438 donor.We established unambiguous data for 5 RH haplotypes spanning a DNA stretch of more than 150,000 nucleotides each on the short arm of chromosome 1. Such data can be applied to develop, evaluate and validate next generation sequencing approaches using targeted and long range techniques.
C36‐A03D
Revisiting Alloimmunization: A Direct Method for Determining Red Blood Cell Antigen Immunogenicities
Ghazala Hashmi*1, Oswaldo Castro2 and Michael Seul1
1BioMolecular Analytics, 2Howard University College of Medicine
Background/Case Studies: Sensitization to antigens expressed on transfused cells, by triggering premature antibody‐mediated clearance, diminishes the therapeutic effectiveness of transfusion and may also lead to serious delayed hemolytic transfusion reactions. Accepted US clinical practice, while providing that sensitized patients receive only cells lacking “offending” antigens, nevertheless ensures continued alloexposure, and thus possible sensitization, to additional antigens, thereby complicating patient management. To mitigate sensitization risk, especially in an era of increasingly cost‐conscious procurement, a quantitative assessment of the immunogenicity of specific antigens will be desirable. Giblett, long ago, introduced a relative scale relating the RBC antigen immunogenicities to (an assumed) immunogenicity of “K” (http://bit.ly/2opqFew). Here, we show that an absolute estimate of immunogenicities may be extracted directly from observed antibody counts provided these are properly normalized to the fraction of recipients at risk (namely those lacking a specific antigen) and the expected fraction of donors expressing that antigen.
Study Design/Method: We define immunogenicity, or sensitization risk, σ, for any antigen (“Ag”) of interest, as the conditional probability of allo‐antibody (“Ab”) formation, given allo‐exposure to Ag, i.e. σ := prob(Ab|alloExp), so that prob(Ab) = prob(Ab|alloExp)*prob(alloExp) and 0 ≤ σ ≤ 1; rewriting prob(alloExp) = prob(Recipient, “R”, lacks Ag)*prob(Donor , “D” has Ag); and estimating prob(Ab) = nAb/nR, nAb denoting the number of Ab in nR recipients, we obtain: nAb/(nR*prob(R lacks Ag)) = σ * prob(D has Ag), the left‐hand side representing the observed sensitized fraction, Φ, i.e. the number of observed Ab in relation to the number of recipients at risk.
Results/Finding: Values of σ = Φ/prob(D has Ag) were determined from the compilation in Castro2002 (http://bit.ly/2oplxHr) for 137 sensitized patients in a retrospective analysis of 941 sickle cell anemia patients of whom 351 were transfused during the study period (<n> ≈ 19 transfusions, excluding ∼25 recipients with n > 50), with units from predominantly (> 90%) white donors:
| E | K | Jsa | Jsb | V | _e | CW | U | C | Kpa | Jka | Jkb | Fya | S | M | _s | _c | N | Lua | Ytb | Fyb |
|---|---|---|---|---|---|---|---|---|---|---|---|---|---|---|---|---|---|---|---|---|
| 1.00 | 1.00 | 1.00 | 0.86 | 0.81 | 0.73 | 0.72 | 0.57 | 0.37 | 0.28 | 0.23 | 0.16 | 0.14 | 0.14 | 0.14 | 0.09 | 0.09 | 0.06 | 0.04 | 0.04 | 0.03 |
Conclusion: Several antigens, though corresponding antibodies may be rare (e.g. “Jsa”, “e”, “U”), nevertheless are highly immunogenic, requiring only a single exposure (on average) for sensitization; in contrast, others (on average) will require many exposures and thus pose a relatively low risk. In conjunction with patient genotypes, our σ –scale will facilitate the selection of patient‐specific cells so as to minimize the risk of (proliferating) alloimmunization even when perfectly matched cells are not available. Our approach may be readily extended to additional RBC antigens and other antigen systems.
Clinical Oral Abstract Session: Donor Deferrals, Reactions and Recruitment
C37‐A03E
Tattoo Policy and Impact on Donor Base
Mary Townsend*, Hany Kamel, Ralph R Vassallo and Marjorie D Bravo
Blood Systems, Inc.
Background/Case Studies: AABB and FDA require a 12 month deferral of donors with a tattoo applied using non‐sterile needles or reusable ink. We review state regulations to ascertain if tattoo establishments are licensed and required to use sterile or single‐use needles and single‐use ink. We recently added two large states in which we collect blood to the Acceptable States List (ASL). We compared the rates of donors deferred before and after the addition of these states to determine potential donor gain with changes in state tattoo licensing regulations.
Study Design/Method: We analyzed allogeneic interview responses to the screening question, “In the past 12 months have you had a tattoo?” and if ‘yes’, whether the tattoo was applied by a state regulated entity. Blood centers in 2 states were selected for the analysis before and after state tattoo regulation. In State A, a comparison period of similar 3 months before (2/2015 ‐ 4/2015) and 3 months after (2/2016 ‐ 4/2016) was selected; for State B, a similar 4 months before (12/2015 ‐ 3/2016) and 4 months after (12/2016 ‐ 3/2017) was selected. Frequency and rate of responses were compared in before and after periods. Among those who responded to having a tattoo in a regulated state, donations were reviewed for presence of infectious disease markers including HIV, HBV and HCV.
Results/Finding: A higher proportion of donors presenting to give blood admitted to having a recent (<12 months) tattoo in the post period in both states. This increase occurred immediately following the addition of States A and B to the ASL (data not shown). Among those who responded yes to having a tattoo, in States A and B respectively, there was a 13‐ and 3‐fold increase in accepted donors (Table). The absolute number of accepted donors with tattoos increased from 13 to 567 (State A) and 151 to 1,496 (State B), which annualized, represents a potential gain of 2,216 (State A) and 4,035 (State B) additional donations. All donors who had a tattoo in regulated states (ASL) tested negative for HIV, HBV and HCV.
Conclusion: To counter rising numbers of ineligible donors resulting from recently added deferrals, we considered recovery of donors deferred for tattoos as a way to enhance our donor base. The immediate rise in the number of donors reporting a tattoo following the addition of the 2 states may reflect a decline in self‐deferrals based on having had a recent tattoo. We demonstrated an increase in the potential number of donations without compromising safety.
| Collection Center State | Period | Actual | Annualized | |||||||
|---|---|---|---|---|---|---|---|---|---|---|
| Interviews | Yes to Tattoo in Prior 12 months | Tattoo In regulated state | Interviews | Yes to Tattoo in Prior 12 months | Tattoo In regulated state | # of donor gained | ||||
| n | % | n | % | |||||||
|
State A (3 months) |
PRE | 34,223 | 182 | 0.5 | 13 | 7.1 | 136,892 | 728 | 52 | 2,216 |
| POST | 36,657 | 599 | 1.6 | 567 | 94.7 | 146,628 | 2,396 | 2,268 | ||
|
State B (4 months) |
PRE | 65,288 | 521 | 0.8 | 151 | 29 | 195,864 | 1,563 | 453 | 4,035 |
| POST | 67,458 | 1567 | 2.3 | 1496 | 95.5 | 202,374 | 4,701 | 4,488 | ||
C38‐A03E
Initial Assessment of Consequences of Policy Change to a 1‐Year Deferral for Men Who Have Sex with Men
Brian Custer*1, Marjorie D Bravo2, Jackie Vannoy2, Mary Townsend2, Hany Kamel2 and Ralph R Vassallo2
1Blood Systems Research Institute, 2Blood Systems, Inc.
Background/Case Studies: In the last half of 2016 many US blood centers changed from an indefinite deferral for any man who had sex with another man since 1977 (MSM77) to a 1‐year deferral since last sexual contact (MSM1YR). This change is being monitored carefully to assess the impact on who presents to donate and whether there is early evidence of a change in risk to blood recipients.
Study Design/Method: The 1‐year deferral was implemented at our blood centers August 29, 2016, and on the donor health questionnaire males are now asked 2 questions: MSM sexual contact in the previous 12‐months, and if the answer is 'no,’ a follow‐up question on MSM contact since 1977. The rates of deferral in 2 7‐month calendar periods before and after the policy change are reported [Sep 2015 – Mar 2016 (MSM77) and Sep 2016 – Mar 2017 (MSM1YR)]. Donor requests to be reinstated are reported as well as the infectious marker test results in accepted donors.
Results/Finding: Overall, there was a 68% increase in the number of ever‐MSMs presenting from 408 in the MSM77 period compared to 685 in the MSM1YR period (table). Percent of male donors with MSM history presenting in each period who disclosed and were deferred was 0.136% during the MSM77 period and 0.097% during the MSM1YR period. Following medical staff review for each potential donor, some men who reported MSM during the MSM77 period were accepted for donation. Acceptance rate was 9.3% during the MSM77 period, and 64.2% for the MSM1YR period. Of the 41 men who requested and were reinstated, 16 returned and have given 24 successful donations to date. Among the 440 donors who reported ever‐MSM history more than 1‐year before donation, two first‐time donors tested positive for infectious markers (1 HIV; 1 HCV).
TABLE 1. C38‐AO3E
| Period | Total Interviews | Response to Screening for MSM History | |||||
|---|---|---|---|---|---|---|---|
| YES | NO | ||||||
| Total YES | Deferral? | Total NO | Follow‐up Question (Since 1977…) | ||||
| DEFER (%) | ACCEPT | NO | YES | ||||
| MSM77 | 272,306 | 408 | 370 (0.136) | 38 | 271,898 | ||
| MSM1YR | 252,395 | 245 | 245 (0.097) | 0 | 252,150 | 251,710 | 440 |
Conclusion: Deferral for MSM behavior decreased with adoption of MSM1YR, reflecting the removal of deferral for remote MSM contact. This initial assessment suggests continuous monitoring of MSM deferral rates along with infectious disease marker tracking are essential to assess the effectiveness of donor selection with the new MSM donation policy.
C39‐A03E
Assessing Transfusion‐Related Acute Lung Injury (TRALI) Risk in Transgender Donors
Kathleen M Grima*, Janis Lugo, Yvette Marie Miller and Mary O'Neill
American Red Cross
Background/Case Studies: Transgender donors represent a small fraction of blood donors. Determining their eligibility to donate has been challenging for blood centers. To assess behavioral risk, the donor is required to answer gender specific questions. The same is true when assessing TRALI risk where the donor is asked about a history of prior pregnancies. Prior to the implementation of the FDA's Final Rule, blood centers asked donors for their birth gender and determined eligibility based on that gender. If the donor changed their gender they were asked to answer both the male and female questions. The Final Rule now allows blood centers to accept the donor's stated gender and to determine eligibility based on that gender. In order to assess the risk of failing to ask a transgender male donor (birth gender female) the pregnancy question, a review was done to determine the number of transgender males who were actively donating with a large blood center.
Study Design/Method: Donors who had changed their gender were indentified by the computer system or by collections staff at the time of donation and tracked. Donors were contacted to resolve any descrepancies. Donors who had changed their gender from female to male and who had answered yes to prior pregnancies were identified. HLA antibody test results were reviewed for these donors to see if they had been tested and whether they had tested positive or negative.
Results/Finding: From 2013‐2015, there were 181 donors identified who had changed their gender from their birth gender; 121 female donors changed their gender to male and 60 male donors changed their gender to female. There were 7 (6%) transgender male donors, birth gender female, who had answered yes to the pregnancy question at one of their donations. Three of these donors were apheresis donors who had been tested for HLA antibodies. One tested positive and the other two tested negative for HLA antibodies. The four other donors were whole blood donors and had not been tested. An HLA test was added to these donors' records so that the test could be performed the next time they presented to donate.
Conclusion: Transgender male donors may have had prior pregnancies and are also choosing to become pregnant after having transitioned from female to male. Six percent of transgender males that we identified reported a prior history of pregnancy. At our center, when a donor requests a gender change from female to male, an HLA test is requested for the next donation. First time donors are qualified based on their stated gender so transgender donors with a history of pregnancy will not be identified unless they volunteer this information. Consideration should be given to using educational materials to prompt the donor to reveal a history of pregnancy at the time of donation so that HLA antibody testing can be performed.
C40‐A03E
Effect of Variable Volume Scale Introduction in a Large Multi‐Site Blood Center
Ralph R Vassallo*, Marjorie D Bravo and Hany Kamel
Blood Systems, Inc.
Background/Case Studies: Regulations allow whole blood donation [WBD] of up to 10.5mL/kg or 15% of estimated blood volume [EBV]. Traditional measuring/mixing devices are set to halt blood flow at fixed volumes which, with testing samples, are consistently below the 15% limit. Variable volume scales [VVS] can be programmed to vary unit volume (up to 550mL) by donor EBV. This maximizes transfusable RBCs and plasma and recovered plasma [RP] volume. RP from WBDs is a small but important source of derivatives and blood center cost recovery. We report the effect of introducing the Hemoflow VVS on donor reaction rates and RP volume in a large blood center. Compared to previous fixed settings, variable collection volumes were expected to decrease by 10mL at EBVs <3.5L in donors ≥23 yo, but increase by 5‐40mL for all others.
Study Design/Method: Donor vasovagal reaction [VVR] rates (prefaints, prolonged/offsite reactions, and loss of consciousness [LOC]) for successful WBDs were obtained from the center's hemovigilance database for the 18 mos. before a 6 mo. phased implementation of the VVS, and the subsequent 24 mos. Multivariable analysis [MVA] by 6‐mo. periods was performed in a model incorporating donor sex, age, first‐time [FTD] vs. repeat status, EBV and donation site. Both the volume and number of units of plasma sent for fractionation were available for the same time periods from the blood center's data warehouse.
Results/Finding: Compared to the baseline period, a significant increase in prefaint reaction rates were noted in Pre‐Implementation (Impl) periods 1 & 2, continued during Impl and Post‐Impl periods 1 & 2, returning to the baseline rate in Post‐Impl periods 3 & 4 (Table). More severe reactions showed an increasing trend that only became significant in Post‐Impl periods 3 & 4. The MVA showed the VVS as independent factor contributing to the increased prefaint and more severe reactions. However, its contribution, as measured by odds ratios, was consistently lower than those exerted by known donor determinants of reaction rates: young age, low EBV, FTD status and collection site (not shown). Plasma unit volume increased an average of 3.8mL during Post‐Impl periods 1 & 2 from the temporally matched baseline & Pre‐Impl period 1.
Conclusion: Following an initial increase in mild VVRs during and immediately after implementation of the VVS, VVR rates fell back to baseline, suggestive of transient staff distraction from usual donor care, or a minor effect of increased blood loss with a superimposed improvement trend. The subsequent increase in prolonged/offsite reactions and LOC after prefaint reactions had already returned to baseline suggests that staff training, work load, donor compliance with mitigation strategies and other determinants of donor reactions have a far greater effect than the small additional blood loss due to the VVS. Small but significant increments in RP volume improve derivative availability and offset the cost of the VVS.
| Period | Months | Donations |
Prefaint VVR (%) |
Prolonged/Offsite VVR (%) |
LOC (%) |
|---|---|---|---|---|---|
| Baseline | 3/12‐8/12 | 253,760 | 1.04 | 0.29 | 0.20 |
| Pre‐Impl 1 | 9/12‐2/13 | 247,294 | 1.28* | 0.32 | 0.23 |
| Pre‐Impl 2 | 3/13‐8/13 | 231,413 | 1.23* | 0.26 | 0.20 |
| Implementation | 9/13‐2/14 | 229,633 | 1.55* | 0.30 | 0.23 |
| Post‐Impl 1 | 3/14‐8/14 | 220,328 | 1.46* | 0.28 | 0.22 |
| Post‐Impl 2 | 9/14‐2/15 | 222,652 | 1.32* | 0.33 | 0.26 |
| Post‐Impl 3 | 3/15‐8/15 | 225,237 | 1.07 | 0.34* | 0.27* |
| Post‐Impl 4 | 9/15‐2/16 | 241,248 | 1.03 | 0.37* | 0.30* |
significantly greater (p <0.05) than Baseline
C41‐A037E
Comparison of Vasovagal and Citrate Reaction Rates in Donors According to Type of Apheresis Procedure
Pierre Robillard*1 and Yves Grégoire2
1Hema‐Quebec, 2Héma‐Québec
Background/Case Studies: Apheresis procedures expose donors to various volumes of citrate depending upon type and length of procedure and type of machine used. Citrate reaction (CR) results from various degrees of hypocalcemia in donors. Blood volumes taken from donors vary according to type of procedure and use of volume replacement. Loss of blood volume is in part responsible for the occurrence of vasovagal reactions (VVR). This analysis was conducted to estimate the incidence of CR and VVR according to various types of apheresis procedures performed at our blood center.
Study Design/Method: Since October 2015 all severities of donor complications (DCs) were to be reported by the personnel. In addition donors were asked about DC at their last donation on our electronic donor health questionnaire (DHQ). DHQ DCs that matched DCs reported on a form were excluded. The data were entered into a database using the new ISBT‐IHN‐AABB definitions and classification scheme. The collection of single redblood cell (RBC), double RBC (2RBC), single platelet (PLT), double PLT(2PLT), PLT + plasma (PLT/P), PLT + RBC (PLT/RBC), PLT + RBC + plasma (PLT/RBC/P), double PLT + RBC (2PLT/RBC) and double PLT + plasma (2PLT/P) was conducted with a Trima Accel® system by TerumoBCT. Plasma for fractionation (PF) was collected with a PCS®2 Plasma Collection System by Haemonetics. . Citrate exposure and volumes collected were averages. Rates of CRs and VVRs with and without loss of consciousness (LOC) are presented per 100 apheresis donations for the period January 1 2016 to December 31 2016. Donation of multiple products during one procedure is counted as one. Chi‐square and chi‐square for trend tests were used to compare rates.
Results/Finding: A total of 80,409 apheresis procedures were performed on 14,742 donors leading to 5447 CR (rate: 6.8%), 2006 VVR without LOC (rate: 2.5%) and 77 VVR with LOC (rate: 0.1%). Male represented 74% of apheresis donors. Rates of CR were higher in males (7.0% vs 6.0%, p<0.001). Rates of VVR were much higher in females (without LOC: 6.2% vs 1.6%, p<0.001; with LOC: 0.22% vs 0.06%, p<0.001). Rates of CR were similar in all age groups. For VVR there was a steady linear decrease in rates from 6.1% in the 18‐22 yo to 1.0% in the 71+ yo. Rates per type of procedure are shown in table. There was a statistically significant increase in the rates of CR according to citrate exposure (p<0.001). Trend was less clear for VVR rates according to volume collected from donor.
Conclusion: When taking into account all severities of DCs related to apheresis donations, rates of CR and VVR are quite significant. Measures must be taken to decrease DCs during apheresis like Ca supplements in prophylaxis and volume replacement by saline.
| PF | RBC | 2RBC | PLT/P | PLT | PLT/RBC/P | PLT/RBC | 2PLT | 2PLT/RBC | 2PLT/P | |
|---|---|---|---|---|---|---|---|---|---|---|
| #donations | 47990 | 63 | 1775 | 10832 | 968 | 476 | 67 | 1150 | 142 | 10252 |
| Citrate exposure (mls) | 41‐85 | 71 | 138 | 263 | 266 | 300 | 322 | 349 | 478 | 479 |
| CR rate | 0.8 | 0.0 | 9.7 | 16.4 | 21.0 | 24.1 | 25.0 | 26.3 | 25.3 | 19.6 |
| Volume collected (mls) | 550‐880 | 246 | 652 | 495 | 246 | 819 | 468 | 460 | 683 | 708 |
| VVR no LOC rate | 2.5 | 10.5 | 0.4 | 3.7 | 2.3 | 2.7 | 0.0 | 1.5 | 2.0 | 1.8 |
| VVR with LOC rate | 0.1 | 0.0 | 0.05 | 0.1 | 0.0 | 0.4 | 0.0 | 0.0 | 0.0 | 0.1 |
C42‐A03E
Vaccination Campaign As a Way to Recruit Donors during a Yellow Fever Virus Outbreak in Rio De Janeiro, Brazil
Luiz Amorim*, Margarida Pêcego, Patricia Moura, Beatriz Bianchi, Simone Maia and Maria Esther Lopes
HEMORIO
Background/Case Studies: During late 2015 and the first quarter of 2017, several cases of wild Yellow Fever Virus (YFV) were reported in Some Brazilian states – Rio de Janeiro, Sao Paulo, Minas Gerais and Espírito Santo, mainly. The vectors of those cases were mosquitoes from the Haemagogus and Sabethes genders, whose habitat is the tropical forests. Since many Brazilian urban areas are very close to rain forests, there is an outbreak risk in those areas, where the infection is transmitted by the Aedes mosquitoes. In order to minimize this risk, Rio de Janeiro health authorities decided to promote a mass vaccination in late March, 2017. The vaccine is produced with live and attenuated YFV, which can circulate for at least 4 weeks after vaccination. In some individuals, the vaccine can elicit viscerotropic effects and sometimes severe diseases. Due to that, Brazilian blood regulation authority established a 4 week deferral period after YFV vaccination. This action could dramatically affect the availability of blood donors. This study shows the measures taken by Rio de Janeiro blood center to circumvent this risk and attract more donors.
Study Design/Method: The strategy consisted in offering the population, at a single place – the blood center – the possibility to donate blood and, immediately after donation, to get vaccinated against YFV. There were no financial advantages to the donors, since YFV vaccine is completely free of charge for any Brazilian citizen. The vaccine was administrated by trained nurses, in an office close to the donors' session. If, for any reason, the prospective donors were not able to donate, the vaccine was also offered to them, provide there were no contraindications. The blood center annnounced just before the mass vacination campaign launching that it would vaccinate 600 people who came to the blood center to donate blood. If, for any reason, the prospective donors were not able to donate, the vaccine was also offered to them, provide there were no contraindications.
Results/Finding: During the five days of campaign, we received 3,351 blood donors candidates; from those, 2,449 were accepted as a blood donor, after medical interview. The deferral rate was 26.9%. At the same period of the year 2016, there were 1,215 prospective donors, and 883 blood donations. The deferral rate was 27.3%. The “Get vaccinated against YFV …but give blood before“ campaign was able to attract, in a five day period, 1,566 additional donors, compared to 2016 same dates. That represents a 177.34% increase in the number of blood donations, without deferral rate increment. There was a slight increase in the proportion of first‐time donors, from 42.7% in 2016 to 45.8% in 2017.
Conclusion: The strategy was more than successful, and it allowed the blood center to build a blood inventory large enough to avoid risks of shortage due to mass vaccination against YFV.
Clinical Oral Abstract Session: Components – Novel Platelet Product Characterization and Testing
C43‐A03F
Compatibility of Apheresis Platelet Collections with Pathogen Reduction While Maintaining Current Split Rates
Elan Weiner* and Vera Chrebtow
Cerus Corporation
Background/Case Studies: Platelet Components (PC) can only be Pathogen Reduced (PR, INTERCEPT, Cerus, Concord, CA) if within approved criteria for volume, concentration and platelet (plt) dose. PR results in ∼10% dose loss which must be accommodated when collecting plt donations to ensure the US plt dose of ≥3.0x10¹¹ is met. Currently, Triple Set kits for PR are only approved in Europe. Plt loss, and adjusted apheresis targeting parameters may impact split rate (SR) or products per apheresis procedure. Inventory suitable for PR without impacting US blood center SRs warrants evaluation and optimization.
Study Design/Method: 1,000 apheresis collections from 4 centers with different SRs were analyzed. A baseline SR for conventional PC was calculated assuming i) a minimum dose (allowing for production loss) of 3.1 x10¹¹ for single (S), 6.3x101111 for double (D), and 9.5x10¹¹ for triple (T) conventional PCs, ii) concentration and volume requirements from apheresis device manufacturer were used.
For each collection, dose, volume, and concentration were assessed for PR kit compatibility, based on storage medium (PAS or 100% plasma) assuming i) a minimum dose (allowing for production loss) of 3.5 x10¹¹ for S and 6.7x10¹¹ for D for PR units, ii) removing small quantities from units with excess volume or dose to meet PR specs., iii) if all or part of an out of parameter D or T collection could be divided into one or more kits for PR, eligible parts undergo PR, and the remainder treated conventionally, iv) collections unsuitable for PR specs. or would decrease SR if treated would be counted as conventional PCs.
Results/Finding:
| Site | A | B | C | D |
|---|---|---|---|---|
| Collection | 100% Plasma | 65% PAS | 65% PAS | 100% Plasma |
| SR | 2.25 | 2.01 | 1.72 | 1.48 |
| S‐Products (%) | 128 (12.8) | 201 (20.1) | 404 (40.4) | 525 (52.5) |
| D‐Products (%) | 982 (49.1) | 1178 (58.9) | 956 (47.8) | 950 (47.5) |
| T‐Products (%) | 1143 (38.1) | 630 (21.0) | 354 (11.8) | 0 (0) |
| Total Products per 1000 collections | 2253 | 2009 | 1714 | 1475 |
| S‐PR Native (%) | 113 (88.3) | 176 (87.6) | 364 (90.1) | 522 (99.4) |
| D‐PR Native (%) | 236 (24.0) | 318 (27.0) | 384 (41.2) | 940 (99.0) |
| D‐PR Divided (%) | 91 (9.3) | 77 (6.5) | 49 (5.1) | 2 (.2) |
| T‐PR Divided (%) | 627 (54.9) | 359 (57.0) | 188 (53) | 0 (0) |
| Native PR Products (%) | 349 (15.5) | 494 (24.6) | 748 (43.6) | 1462 (99.1) |
| Divided PR Products (%) | 718 (31.9) | 436 (21.7) | 237 (13.8) | 2 (.1) |
| Total PR Products (%) | 1067 (47.4) | 930 (46.3) | 985 (57.5) | 1464 (99.3) |
Conclusion: Blood centers today can adopt PR for a significant percent of their current supply (as high as 99%) without affecting their SR. Compatibly increases further by dividing T and large D donations. Percent achievable depends on their current S, D, T proportion of collections and practices. Changes to D and T collection parameters, optimized donation and counting accuracy, and volume reduction will improve PR compatibility further. Individual analysis is warranted for each blood center.
C44‐A03F
An Exploratory Phase 1, Microdose Escalation Safety Trial of Lyophilized, Autologous Platelets in Normal Subjects
Jeffrey M. Barroso*1, Barbara A. Osborne1, Gayle Teramura1, Joan C. Pehta2, Arthur P. Bode3, Anna E. Yu3, Ruth B. Biehl3, Todd M. Getz3, G. Michael Fitzpatrick3 and Sherrill J. Slichter1,4
1Bloodworks NW, 2The Alpha Bio Group, 3CellPhire, 4University of Washington
Background/Case Studies: A hemostatic agent (Thrombosomes) to treat uncontrolled hemorrhage has been developed by freeze drying platelets. In thrombocytopenic rabbits, Thrombosomes produced rapid hemostasis in an ear bleeding model and decreased blood loss in a canine CABG model.
Safety, thrombogenicity, and lack of immunogenicity were demonstrated in three species (New Zealand White rabbit, canine, nonhuman primate) prior to this study of autologous Thrombosomes in normal subjects.
Study Design/Method: A randomized (2:1), placebo‐controlled, single blind, 15 subject, single‐site study of ascending microdoses of autologous (apheresis‐derived) Thrombosomes was conducted. Subjects were divided into 5 cohorts, receiving increasing doses, ranging from 1/1,000 ‐ 1/10 of the lowest effective dose found in the above rabbit model. Cohorts 4 and 5 received the 1/10th dose, but cohort 5 received two 1/20th doses one hour apart. The primary end points were safety and tolerability. Subjects were monitored in‐hospital for 24hrs post infusion and followed for up to 60 days for adverse events, global neurological assessments, abbreviated physical exams, and laboratory tests.
Results/Findings: There were no serious adverse events (SAEs) or subject discontinuation post‐infusion due to a significant decrease in platelet count from baseline. There were a total of 68 AEs: 40 were treatment emergent (TEAE), of which 8 were treatment‐related (6 Thrombosomes and 2 Control). All TEAEs were mild or moderate in severity. In cohorts 4 and 5, 3/4 Thrombosomes subjects had treatment related adverse events.
One cohort 4 subject developed an upper respiratory infection and elevated WBCs within 8 hours post infusion, which resolved by 24 hours, and an elevated D‐dimer at 24 hours post infusion, which resolved by Day 7. This subject also had an elevation of Prothrombin Fragment 1 + 2 at baseline, which increased post transfusion and peaked at 24 hours with resolution by Day 14.
One cohort 5 subject developed non‐specific T‐wave changes at 1 and 2 hours following her 2nd infusion that resolved by Day 21 without clinical symptoms. Troponin levels and ECHO stress tests were normal. EKGs were considered possibly a normal variant or related to placement of the EKG leads.
Another cohort 5 subject developed an IgG platelet autoantibody on Days 7‐21, which was undetectable on Days 42‐60; there was no change in platelet counts. The Thrombosomes autoantibody assay was positive at baseline, Days 7‐14, and negative on Days 21‐60.
Conclusion: Autologous Thrombosomes showed acceptable safety and tolerability for doses up to 1/10 the expected hemostatically effective dose. However, at the two highest doses, 3/4 subjects experienced related TEAE without clinical consequences. Continued dose escalations should be performed in bleeding patients who may receive a benefit from this product.
This study was funded under BARDA contract HHSO100201300021C.
C45‐A03F
Evaluation of a Lyophilized Platelet‐Derived Hemostatic Product
James A. Bynum*1, Michael A. Meledeo1, Grantham C. Peltier1, Ashley S. Taylor1, Colby S. McIntosh1, Robbie K. Montgomery1, Todd M. Getz2, Mike G. Fitzpatrick2 and Andrew P Cap1
1U.S. Army Institute of Surgical Research, 2CellPhire
Evaluation of a Lyophilized Platelet‐Derived Hemostatic Product
James A. Bynum1, Michael A. Meledeo1, Grantham C. Peltier1, Ashley S. Taylor1, Colby S. McIntosh1, Robbie K. Montgomery1, Todd M. Getz2, Michael G. Fitzpatrick2, and Andrew P. Cap1
1US Army Institute of Surgical Research, Fort Sam Houston, San Antonio, TX 78234
2CellPhire Inc., Rockville, MD 20850
Background/Case Studies: Current limitations of platelet shelf life to 5 days have led to an increasingly greater demand for hemostatic agents with greater longevity. Our previous work has correlated a critical link between platelet and mitochondrial function and convincingly shown that by maintaining platelet mitochondria, shelf life and function of platelets can be extended. The objective of this study was to evaluate the function of a lyophilized platelet‐derived hemostatic product (LPHP) as a potential alternative to fresh platelets and determine if mitochondrial function plays a role in the hemostatic properties of such products.
Study Design/Methods: Platelets were collected by centrifugation of whole blood from healthy donors under an institute‐approved standard operating procedure. LPHPs were reconstituted with water; measures included rotational thromboelastometry (ROTEM), optical aggregometry and flow cytometry. Thrombin generation potentials were evaluated by calibrated automated thrombogram (CAT). Mitochondrial function was assessed with high resolution respirometry (Oroboros). Finally, adhesion to a collagen‐coated surface while under flow was assessed (Bioflux).
Results/Findings: In ROTEM, no differences were observed between maximum clot formation (MCF) values for INTEM (19.5mm), EXTEM (22.75mm), and FIBTEM (23.5mm) tests in the LPHP‐only sample. Significantly decreased aggregation was observed in the LPHP vs. platelets with all agonists (mean aggregation range of [2.0%, 12.0%] vs. [60.5%, 82%]; (p < .001 for all agonists). Flow cytometry measures demonstrated significant decreases in GPIb expression and increases in phosphatidylserine (PS) expression in the LPHP group compared to fresh platelets (p < 0.01). The CAT assay was suggestive that the LPHP might have some thrombogenic properties; while thrombin potential was the same for platelets and LPHP, lagtime was shorter (7.99 min vs. 4.68 min, p < .05) and peak thrombin was higher (138.1nM vs. 256.3nM, p < .01) in the LPHP. Measurements of mitochondrial function using high resolution respirometry on the LPHP were unchanged from respiration media (no cells) alone. In the BioFlux, the LPHP had significant adherence to the collagen surface.
Conclusion: In this study, LPHPs were shown to have non‐functional mitochondria, likely due to the nature of their manufacturing and processing. ROTEM measures revealed that the LPHPs had no impact on clot strength. Likewise, compared to platelets, the LPHP displayed minimal aggregation, had significantly more PS (measure of activation status), but had the ability to adhere to a collagen surface under flow conditions and induced greater thrombin generation (suggesting that they could contribute to clot formation). Clinical potency of LPHP may best be monitored by a thrombin generation assay such as CAT.
C46‐A03F
Cryopreserved Platelets Synthesize Proteins upon Thawing with Packaging of a Defined Protein Subset into Microvesicles
Peter Schubert*1, Lacey Johnson2, Brankica Culibrk1, Zhongming Chen1, Shereen Tan2, Denese C Marks2 and Dana Devine1
1Canadian Blood Services, 2Research and Development, Australian Red Cross Blood Service
Background/Case Studies: Cryopreservation of platelets (PLTs) could extend the shelf life from 5‐7 days to over two years. Cryopreserved PLTs (CryoPLTs) appear to have a greater in vivo hemostatic effect than liquid‐stored PLTs. PLTs have been shown to require protein synthesis capabilities for certain functions such as clot signaling and immune responses. This study was designed to assess whether reconstituted cryo‐PLTs carry out protein synthesis upon thawing and short term storage.
Study Design/Methods: Apheresis PLTs were cryopreserved with 5% DMSO and stored at −80°C. After thawing, the unit was reconstituted in thawed FFP spiked with either 500 μM puromycin (Pm) or 250nM biotin‐labeled Pm. PLTs were stored at room‐temperature with agitation. Samples were drawn immediately after reconstitution as well as after 2, 4 and 24 hours to assess Pm incorporation as a measure of protein synthesis, and for in vitro assays to determine platelet activation by CD62P binding, phosphatidylserine exposure by annexin‐V binding and microvesicle count in the supernatant. PLT microvesicles (PMV) were prepared from the supernatant by ultracentrifugation. PLTs and PMV were lysed in a Triton X‐100‐containing buffer and qualitative proteomics was performed on samples following affinity‐purification with streptavidin beads.
Results/Findings: In vitro parameters of reconstituted and subsequently stored platelets were in line with previously published results, with high surface levels of CD62P and phosphatidylserine. PMVs were generated during cryopreservation and the count increased by 11‐fold during 24 hour storage. Immunoblot analyses of the PLTs showed a 2‐ and 4‐fold increase in Pm incorporation after 4 and 24 hours of storage, respectively. Mass‐spectrometry revealed 23 unique proteins that were synthesized after 4 hours of storage, which was confirmed for GTPase and GTPase‐regulatory proteins Rac1, Rap1 and RhoGDI by immunoblot analyses. Analyses of the PMV translatome also revealed the presence of synthesized proteins; however, these did not change throughout storage. This finding suggests that a defined panel of proteins is packaged into PMVs upon freezing and thawing. Additionally, the PMV translatome profile comprised a smaller subset of synthesized proteins compared to the cryo‐PLT translatome, including the proteins Rac1, Rap1 and RhoGDI.
Conclusion: This study has demonstrated that cryo‐PLTs can synthesize proteins upon reconstitution in FFP and subsequent storage. Discovery of a subset of these proteins in the PMV suggests their encapsulation, possibly in a selective manner. This observation provides novel insights into the capacity for protein synthesis in cryo‐PLTs and the potential regulation of protein packaging into PMV.
C47‐A03F
Temperature Cycling during Platelet Cold Storage Improves In Vivo Recovery and Survival in Healthy Volunteers.
Jaroslav G Vostal*1, Monique P Gelderman1, Andrey Skripchenko1, Fei Xu1, Ying Li1, Pamela Whitley2, Michael Wellington2, Sherrie Sawyer2, Shalene Hanley2 and Stephen Wagner2
1CBER‐FDA, 2American Red Cross
Background/Case Studies: Room temperature storage of platelets is conducive to bacterial proliferation in contaminated units which can lead to transfusion transmitted septic reactions. Cold temperature storage could reduce bacterial proliferation but cold exposure produces activation‐like changes in platelets and leads to their rapid clearance from circulation. Cold‐induced changes are reversible by warming and periodic rewarming during cold storage (temperature cycling) has been proposed to alleviate platelet cold‐induced activation reduced circulation.
Study Design/Methods: We conducted a clinical trial in 16 healthy human volunteers to evaluate in vivo recovery and survival of autologous apheresis platelets collected on two different devices, Trima or Amicus. Double apheresis collections were split and stored under different conditions that included room temperature (RT), cold with automatic temperature cycling (TC) or continuous cold (Cold) conditions. Temperature cycling was repeat cycles of 11 hours at 4‐6C and 1 hour at 37C, automatically controlled in a programmable incubator. At end of storage platelets from each unit were radiolabelled (Cr51 vs In111) and infused into autologous donors. Remaining platelets were evaluated with standard in vitro tests.
Results/Findings: In vitro results indicated that cold and TC platelets had reduced metabolism during storage with higher Oxygen and glucose levels and reduced lactate compared to RT platelets. Cold platelets had lowest morphology score and CD42b expression and the highest Annexin V binding. P selectin expression was equivalent for TC and Cold but both were higher than RT platelets. In functional responses Cold platelets had the lowest hypotonic stress, shape change and aggregation responses while TC platelets had intermediate results. In vivo results were different between the two apheresis instruments so the data are presented separately (Table 1). Cold stored platelets had the lowest recovery, survival and area under the curve. Temperature cycled platelets had improved recovery, survival and 2.2 fold greater area under the curve compared cold stored platelets. However, compared to RT platelets TC platelets had lower recovery, survival and 4 fold lower area under the curve.
TABLE 1. C47‐A03F
| Platelet storage conditions | Apheresis instruments | |||||
|---|---|---|---|---|---|---|
| TRIMA | AMICUS | |||||
| Recovery (%) | Survival (hours) | AUC (% of RT) | Recovery (%) | Survival (hours) | AUC (% of RT) | |
| RT |
58.9 + 11.8 N= 7 |
164.8 + 24.3 N= 7 |
100 N= 7 |
51.2 + 16.7 N= 5 |
156.3 + 36.7 N= 5 |
100% N= 5 |
| TC |
45.8 + 18.8 N= 7 |
50.0 + 15.8* N= 7 |
27.42 + 20.5* N= 7 |
37.7 + 12.3 N= 9 |
47.0 + 14.4 # N= 9 |
25.32 + 12.7 # N= 9 |
| Cold |
23.1 + 8.8 # § N= 4 |
33.7 + 14.7 # § N= 4 |
11.38 + 5.1 # § N= 4 |
|||
= p<0.05 from Trima RT # = p<0.05 from Amicus RT § = p<0.05 from Amicus TC
Conclusion: Temperature cycled cold storage for 7 days produces platelets with better in vivo circulation kinetics than continuous cold storage.
C48‐A03F
Functional Validation of Cold Platelets for Stocking Air Ambulances
Camille M Van Buskirk*, Lisa Marie Button, Scott A Hammel, Sandra C Bryant, Muthuvel Jayachandran and James R Stubbs
Mayo Clinic
Background/Case Studies: In 2015, the authors’ hospital‐based blood bank received variances from the FDA and AABB for the use of cold stored platelets (CSPs) with a shelf life of 3 days. These group A CSPs, stored in a refrigerator in the Emergency Department, were used to support the trauma program for use in massively bleeding patients. The placement of the CSPs on the air ambulances, stored in coolers, was the next logical step in providing platelet therapy sooner to these patients.
Study Design/Methods: Eight double unit CSPs were collected using the Trima Accel®. Two double CSPs were pathogen reduced using the Intercept® pathogen reduction system. Half of the CSP pairs were subjected to flat storage in a refrigerator; the other half were loaded into a Credo®4‐496 cooler with 2 units of FFP, 2 units of RBCs, and 1 unit of whole blood. Three to 5mL of platelets were collected via syringe from each unit at 0 min (before storage in cooler or refrigerator) and after 0.5, 1, 3, 5, and 6 hours of storage for functional validation of platelets. The platelet count, agonists (thrombin receptor agonist peptide (TRAP), adenosine diphosphate (ADP) and collagen stimulated platelets aggregation), non‐activated and agonists activated platelet surface expression of phosphatidylserine (PS, annexin‐V binding), P‐selectin, fibrinogen receptor (PAC‐1 binding) were measured by Coulter counter, 2 channel aggregometer, and digital flow cytometer. Paired Wilcoxon rank sum tests were used to analyze differences in degradation rates with p<0.05 deemed significant.
Results/Findings: The difference in slopes of platelet counts (cooler – refrigerated) median:0.0066;range:(0.1315,0.1372), platelet aggregation stimulated with TRAP:‐0.00265(‐0.1556,0.03889), ADP:‐0.00091(‐0.1167,0.06111), and collagen:0.01428(‐0.1667,0.05000). Basal (no‐activation) expression (%) of platelet surface PS: ‐0.00034(‐0.12667,0.000909), TRAP activation:‐0.000694(‐0.006061,0.002333), ADP activation: 0.000171(‐0.010278,0.001704), and collagen activation:‐0.002197(‐0.012256,0.011182). Basal expression (%) of platelet membrane P‐selectin 0.00181(‐0.00133,0.07924), TRAP activation: 0.00180(‐0.00267, 0.01924), ADP activation:0.00463(‐0.01415,0.01435), and collagen activation: 0.01197(‐0.01194, 0.07482). Basal expression of fibrinogen receptor expression: ‐0.00000(‐0.00094,0.00091), TRAP activation:‐0.00011(‐0.02519,0.04000), ADP:0.00383(‐0.00963,0.00929), and collagen:0.00123(‐0.01800, 0.01644), all p>0.12.
Conclusion: Platelets, including pathogen reduced, stored in an oxygen‐deprived environment, (cooler), do not lose functional capabilities when compared to those platelets stored in a refrigerator with adequate oxygen for 6 hours. Therefore, cold stored platelets transported in a cooler are a viable option for providing timelier platelet intervention for severely injured patients prior to hospital arrival.
Clinical Oral Abstract Session: RBC Immunogenetics
C49‐A03H
Molecular Sieving: Beyond Genotyping
Ghazala Hashmi1, Reinhard Klemm2 and Michael Seul*1,2
1BioMolecular Analytics, 2ImmunoInformatica
Background/Case Studies: More than a decade after its commercial introduction (Hashmi2005 http://bit.ly/2oHLehE), blood group genotyping, though available in several formats, has remained a tool for special tasks, e.g. the profiling of difficult patient samples or the identification of rare antigen combinations, while serology has remained the tool of choice for routine antigen typing. Here, we introduce Molecular Sieving as an alternative to the current approach of managing special donor unit inventories. This novel process for DNA analysis combines the “multiplexing” of markers offered by existing genotyping methods with the pooling of multiple samples in manner permitting the step ‐wise refinement of candidate sets by molecular attribute patterns.
Study Design/Method: Molecular Sieving is a special format of LeanSequencing, a proprietary process that permits the simultaneous analysis of up to four samples for alleles encoding 40+ RBC antigens in MNS,RHCE, LU,KEL,FY,JK, DI,YT,DO and CO, including the identification of 30 RHCE alleles. Molecular Sieving extends these capabilities to the analysis of pools to attain large scale. Thus, in one format of the process, 4*4*96 samples are accommodated in a single run. Following the completion of the sieving step, candidates may be directly assigned to requests, or may be selected to enrich a subsequent profiling step for samples with rare or otherwise desirable attributes. Here, MolecularSieving was used to identify suitable donor units for 135 sensitized sickle cell anemia (“SCA”) patients (Tb1 in Castro2002, http://bit.ly/2oplxHr, excluding Le and e(variant) and assuming 1 request per patient), presenting with up to 9 allo‐antibodies (“Ab”) in multiple combinations. Proprietary “greedy” algorithms were invoked to optimally pair candidate units with requests.
Results/Finding: Sieving of only ½ plate holding 4*48 candidate units from actual black donors, followed by profiling of 44 samples selected to enrich for “e Neg” and “c Neg” and “C‐E‐K‐Fya Neg”, produced assignments for 127 of 135 requests (=94.1%), as indicated by colors, and shown in the row “assigned” below:
Thus, the number of assignments substantially exceeded the number of wells processed. Moreover, the remaining 66 pooled samples produced 44 additional assignments to a second set of 135 requests, for a total of 171 assignments from only 92 wells. In another scenario, sieving of a full plate of 4*96 samples, produced ∼250 assignments for two successive batches of 271 requests from SCA patients, a yield exceeding 2.5x. Sieving alone typically fills 65‐75% of requests of moderate complexity (≤ 5 Ab).
Conclusion: MolecularSieving, by widening the “funnel” while focusing the search for candidate donor units, attains a new level of efficiency in procuring suitable units for patients with hemoglobinopathies.
C50‐A03H
Molecular Sieving for Identifying Red Blood Cells with Special Phenotype Attributes
Kristopher Fernandez1, Monica Kalvelage2, Ghazala Hashmi*1 and Michael Seul1
1BioMolecular Analytics, 2LifeShare Blood Centers
Background/Case Studies: Providing transfusion support to patients with sickle cell anemia and other hemoglobinopathies remains a challenging logistical task that must accommodate pre‐existing allo‐antibodies in multiple combinations preferably while minimizing the risk of (continued) transfusion‐related sensitization. The allelic diversity of the predominantly black patient population, especially at the RH locus which encodes a variety of “partial” phenotypes further complicates the problem (Chou2013 http://bit.ly/2ppVfEq).
Study Design/Method: Molecular Sieving is a proprietary new process that, in order to rapidly probe candidate donor units in large numbers for multiple phenotype patterns, permits the analysis of pools and pools of pools of samples for a multiplicity of alleles (including 30 at the RHCE locus) that encode 40+ MNS, RH, LU, KEL, FY, JK, DI, YT, DO and CO antigens. Based on sieving, samples may be grouped by molecular attribute patterns ranging from single “Ag−“ (e.g. E−,C−,e−,c−) to specific combinations of “Ag−” (e.g. C−E−K−Fya− and C−E−Jsa−) or combinations of alleles such as those encoding partial RH phenotypes. Sieving, optionally, may be followed by profiling of samples selected for desirable attribute patterns. Genomic DNA from 384 (predominantly) black donors, independently genotyped by one of two commercial methods were provided by LBC. At bmx, 96 pools were prepared prior to amplification, and analyzed by a novel LeanSequencing method.
Results/Finding: All pool genotypes were consistent with available individual sample genotypes. Antigen patterns of particular interest included two groups, namely: several for which pools were homozygous and certain others t for which pools were heterozygous. Illustrative of the former pattern type are these:
| “antigen‐neg” pattern | C | E | V | VS | K | Jsa | Fya | C & E | C & E & K & Fya | partial_c | partial _c, _e |
|---|---|---|---|---|---|---|---|---|---|---|---|
| samples available after sieving | 124 | 132 | 100 | 100 | 360 | 208 | 192 | 40 | 28 | 92 | 52 |
Appropriate pool queries revealed that sieving alone identified, among the 124 C− samples, 24 that were also V− and VS− and, among the E− samples, 12 that were also negative for any partial_e phenotype. Illustrative of the latter pattern type are pools identified as heterozygous (“het”) for alleles encoding antigens of high or low prevalence. By segregating het pools into subpopulations, we were able to select 6 specific “eE” pools of which 4 were demonstrated (in subsequent profiling) to contain an e‐ sample. We also identified pools “het” for alleles indicating the possible presence of a rare donor, for example Yta|b (8 pools), Co a|b (8) and others.
Conclusion: MolecularSieving of a single 96‐well plate identified many desirable “antigen‐negative” phenotypes and permitted selection of pools for combinations of “Ag‐neg” patterns including “partial:” RH phenotypes and combinations of C−, E− and Jsa−. These samples are thus confirmed “ag Neg” and available for assignment. Sieving also facilitated the enrichment of subsequent refinement of molecular attribute profiles in accordance with pending or anticipated demand.
C51‐A03H
Use of 48 ERMAP Alleles, at 21,406 Nucleotides Each, to Predict Haplotypes for Genotype Prediction from Next Generation Sequencing Data
Kshitij Srivastava*1, Kurt Ralph Wollenberg2 and Willy A Flegel1
1DTM/CC/NIH, 2NIAID/NIH
Background/Case Studies: Sequence information generated from next generation sequencing (NGS) is often computationally phased using haplotype‐phasing algorithms. Utilizing experimentally derived haplotype information improves this prediction, as routinely used in HLA typing. Among the 36 blood group systems, however, experimentally derived haplotypes are known for short genes only, such as ICAM4 (Landsteiner‐Wiener) and ACKR1 (Duffy). For longer genes, such as ABO of >20 kb, most haplotypes are only statistically derived. We recently established a large dataset of long ERMAP haplotypes, which code for the Scianna blood group system.
Study Design/Methods: The nucleotide sequence of >21 kb each was used for all physically confirmed 48 ERMAP alleles that we previously published. Full‐length sequences were aligned and variant sites were extracted manually. The Bayesian coalescent algorithm implemented in BEAST v1.8.3 was used to estimate a coalescent phylogeny for these variants and the allelic ancestral states at the internal nodes of the phylogeny.
Results/Findings: We found at least 4 clades representing clusters of 5 to 11 alleles. For each clade, one observed allele was identified as the ancestral allele for its cluster of alleles. Using the 4 alleles, we were able to predict alleles with high posterior probability, which were ancestral to the observed alleles and, while not yet observed, may be extant.
Conclusion: We explored the phylogenetic structure and evolutionary events underlying the origin of different ERMAP alleles and predict ancestral alleles. In the present study, we show means to predict alleles and to calculate the distinct probabilities of correctness for such predicted alleles. The probabilities can be instrumental in defining a cut‐off value to determine which computationally predicted alleles are worth confirming by physical evidence. The alleles identified by studies like ours may be utilized in designing of microarray technologies, imputing of genotypes and mapping of NGS data.
C52‐A03H
Three Novel ABO Alleles and Associated Serologic Phenotypes Give Insights for Bioinformatics and NGS
Sunitha Vege*, Christine Lomas‐Francis, Judith Aeschlimann, Kim Hue‐Roye, Randall Velliquette and Connie M. Westhoff
Immunohematology and Genomics Laboratory, New York Blood Center
Background/Case Studies: The use of DNA to determine ABO is increasing. Because sample collection for organ and bone marrow transplant registry often involve only a buccal swab and not a blood sample, ASHI and CAP have recently released guidelines that allow DNA‐based genetic ABO determination as a “screening tool” for initial donor evaluation and for listing donors on the registry. Additionally, as next generation sequencing (NGS) becomes more widespread bioinformatics tools are being developed in attempts to translate NGS to ABO type. Documentation of novel alleles and, importantly, the actual associated serologic phenotype encoded by ABO variants are critical for accurate interpretation. We investigated three cases referred to determine if they represented Group O or subgroup A or B phenotypes.
Study Design/Method: Serologic testing was performed by standard tube agglutination. Genomic DNA from WBCs was used for duplex PCR‐RFLP (Vox Sang 69: 242, 1995). Sequence analysis was performed for ABO exons 1 to 7.
Results/Finding: Donor RBCs were no‐type‐determined by automated testing, but by tube testing reacted +vw mixed field with anti‐A and anti‐A,B and were non‐reactive with anti‐A1 lectin and anti‐B. Plasma was non‐reactive with A1 and A2 and 4+ with B cells. These results suggest a subgroup of A. PCR‐RFLP indicated A and O1 alleles. Sequencing confirmed ABO*O01, and identified an A allele with a nucleotide G insertion at c.181 in exon 4, causing a frameshift and premature stop codon (c.181_182insG; p.Leu61Argfs*21). Patient 1 was a pregnant female whose RBCs were non‐reactive with anti‐A and +vw with anti‐B and –A,B on incubation. Plasma was 4+ with A1 and A2 and non‐reactive with B cells, suggesting a subgroup of B. PCR‐RFLP results indicated ABO*B/B. Sequencing confirmed B‐nucleotides in exons 6 and 7 and identified a homozygous T insertion in the intron 1 splice site, c.28 + 2_3insT predicted to cause defective splicing. Patient 2 RBCs were non‐reactive with anti‐A, A1 lectin, and ‐B, and +w with anti–A,B and plasma was non‐reactive with A1 and A2 and 4+ with B cells, suggesting a subgroup of A. PCR‐RFLP indicated A and O1 alleles. Sequencing confirmed ABO*O01, and identified an A allele with a change, c.898T>C (p.Trp300Arg).
Conclusion: We report three new alleles, ABO* A (c.181_182insG; p.Leu61Argfs*21), ABO*A (c.898T>C;p.Trp300Arg), and ABO*B (c.28 + 2_3insT, splice defect). None of the changes were found in dbSNP. The new alleles with nucleotide insertions would be predicted to cause complete loss of expression of the corresponding antigen from a bioinformatics perspective and to encode Group O. Rather very weak expression of the respective antigen and lack of the corresponding antibody in the plasma was found, confirming these represent subgroups of A and B and suggesting that transcriptional slippage, which has been observed before, is responsible for low level antigen expression. ABO genotyping is powerful when both serology and molecular results are evaluated together, and these studies are needed to inform development of bioinformatics tools to accurately associate ABO genotypes with phenotypes.
C53‐A03H
ABO and Forssman (FORS) Blood Group Systems (II): Crosstalk in‐Between of Glycosyltransferases Encoded By the ABO and GBGT1 Genes
Miyako Yamamoto1, Emili Cid1 and Fumiichiro Yamamoto*1,2
1The Josep Carreras Leukaemia Research Institute (IJC), 2Program of Predictive and Personalized Medicine of Cancer (PMPPC), Institut d'Investigació Germans Trias i Pujol (IGTP)
Background/Case Studies: Evolutionarily related ABO and GBGT1 genes encode A and B glycosyltransferases (AT and BT) and Forssman glycolipid synthase (FS), which catalyze the biosynthesis of A and B, and Forssman (FORS1) oligosaccharide antigens responsible for the ABO and FORS blood group systems, respectively. Human AT and BT possess LeuGlyGly and MetGlyAla, respectively, at codons 266‐268, and these tripeptides are important in determining the sugar specificity of enzymes, N‐acetyl‐D‐galactosamine (GalNAc) for AT and galactose for BT. Functional FSs possess GlyGlyAla at the corresponding codons, and exhibit GalNAc specificity. It has been recently shown that human AT gained weak FS activity when the LeuGlyGly was substituted by GlyGlyAla, suggesting that the tripeptide is involved in the recognition/binding of acceptor substrates, in addition to donor nucleotide‐sugar substrates.
Study Design/Methods: We have searched for additional mechanisms that might enable human AT to express FORS1. A variety of amino acid substitution constructs of human AT were prepared. Additionally, exon deletion constructs of AT mRNA transcripts were also prepared. DNA from those expression constructs was transfected into COS1(B3GALNT1) cells, and cell‐surface expression of FORS1 antigen was immunologically monitored with a monoclonal anti‐FORS1 antibody.
Results/Findings: We found that Met69Thr/Ser substitutions also conferred human AT with weak FS activity. We also found that the deletion of exon 3 or 4 of human AT transcripts bestowed weak FS activity. Because altered RNA splicing is frequent in cancer, this mechanism may explain, at least partially, the appearance of FORS1 antigen on certain cancer cells and tumors in Forssman antigen‐negative human species. Furthermore, the co‐introduction of one of those changes together with the GlyGlyAla substitution synergistically conferred strong FS activity, in addition to strong AT and BT activities.
Conclusion: The substitution of the GlyGlyAla tripeptide codon in the catalytic domain may modify the acceptor specificity of the enzyme. Met69Thr/Ser or exon 3/4 deletion may alter the intra‐Glogi localization of the enzyme. And those mechanisms function in synergy. The overlapping usage of acceptors by glycosyltransferases encoded by ABO and GBGT1 genes is reminiscent of common ancestral origin of alpha 1,3‐Gal(NAc) transferase genes. The finding that AT can synthesize FORS1 implicates that the boundary between ABO and FORS systems may not be as strict as was previously delineated due to the crosstalk in‐between.
C54‐A03H
Genomics Methods Overcome the Challenges of ABO Typing in Cord Blood Banking
Maria Susana Albano*1, Sunitha Vege2, Ludy Dobrila1, Michal Tarnawski1, Rodica M Ciubotariu1, Connie M. Westhoff2, Andromachi Scaradavou1 and Pablo Rubinstein1
1National Cord Blood Program, New York Blood Center, 2Immunohematology and Genomics Laboratory, New York Blood Center
Background/Case Studies: ABO blood group antigens are of prime importance in transfusion medicine and testing with FDA licensed antibody‐based assays is required for donors. HPC, Cord Blood (CB) products, on the other hand, are not selected based on ABO compatibility with patients, but ABO/Rh typing is required by the FDA and FACT/AABB for identity testing. Since most antibodies in CB plasma are maternal in origin, the ABO/Rh phenotype relies only on the red cell typing. A and B antigens are not fully developed at birth, presenting about one third of A or B antigen expression levels compared to adult cells. This can result in indeterminate ABO results for some CB products.
We evaluated the use of DNA‐based methods for ABO typing to aid the resolution of inconclusive (“indeterminate”) or discrepant serologic typing results.
Study Design/Methods: A total of 29,308 CB units (CBU) were typed for ABO/Rh (Beckman Coulter PK System Blood Grouping and Phenotyping) during the period 7/1/2008 ‐ 4/1/2017. ABO genotyping targeting specific SNPs for Groups A, A2, B, O1, and O2 and, if needed, gene sequencing was conducted in cases with indeterminate results, and in 4 CBU that were provided for transplantation with ABO discrepancy found at the transplant center.
Results/Findings: Sixty‐two (0.21%) CB samples had no reportable ABO/Rh phenotype on initial testing, and therefore the CBU could not be used clinically. Molecular ABO/Rh typing resolved all but one. All cases were heterozygous (A/O, B/O, or A/B); in 53% the predicted ABO phenotype was A Rh neg (Table 1a). The predominant donor race was Caucasian (65%). Four CBU with ABO discrepancy were also evaluated by genotyping (Table 1b). In 3 of those, ABO typing performed at the hospital on the day of transplant differed from that reported by the CB bank; the fourth was identified by post‐transplant ABO typing of the recipient. Molecular genotyping resolved the discrepancies. CBU identity was always verified by confirmatory HLA typing.
Conclusion: There is currently no FDA approved DNA‐based ABO assay. However, ABO genotyping is a useful method for samples where antibody tests alone cannot be conclusive, and can “rescue” CBU that could not be used otherwise. Further, genotyping can help resolve ABO discrepancies.
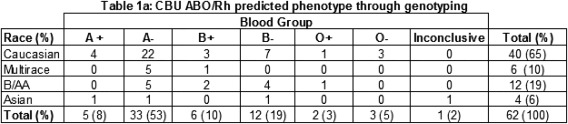

Clinical Oral Abstract Session: Transfusion Transmitted Diseases ‐‐ Classic Viruses
C55‐A03J
Evaluation of HEV Prevalence in US Donations Using the cobas® HEV Test for Use on the cobas® 8800 System
Susan L Stramer*1, Megan Nguyen1, Sakina Smith1, Boris Hogema2, John Duncan3, Nancy Huynh4, Jean Stanley3 and Susan A Galel4
1American Red Cross, 2Sanquin, 3Roche Molecular Systems, Inc., 4Roche Molecular Diagnostics
Background/Case Studies: Hepatitis E virus (HEV) is a small, non‐enveloped RNA virus with worldwide distribution. Recently reports of transfusion transmitted HEV outside of the US have increased. Immunocompromised transfusion recipients, i.e., transplant patients and some hematological patients, in particular are most vulnerable to complications of transfusion‐transmitted (TT) HEV. Four major genotypes exist for HEV, with Genotype 3 as the only genotype currently identified as the cause of autochthonous infections in the US.
cobas® HEV for use on the cobas® 6800/8800 Systems is a qualitative PCR test for the detection of HEV RNA in human plasma. The purpose of this study was to evaluate the prevalence of HEV RNA among US blood donations collected in the Midwest, a region reported to have a higher prevalence of HEV infection, and the Eastern US.
Study Design/Methods: 30,695 fresh and 20,029 frozen EDTA plasma samples from American Red Cross donors, collected from February 2015‐2016, were de‐identified and screened by individual donation testing (ID‐NAT) using cobas® HEV for use on the cobas® 8800 System under a research protocol. Samples were primarily from Midwestern and Eastern regions of the US. Samples reactive on cobas® HEV were further tested by an alternate HEV NAT, HEV RNA quantitation, HEV genotyping, and for HEV antibodies.
Results/Findings: Of 50,724 valid results, a total of 3 donations were reactive on cobas® HEV and all were confirmed positive. The confirmed donations were from a 65‐year old male in Indiana, a 21‐year old male in California, and a 55‐year old female in Kentucky. All 3 donations were positive by hemi‐nested PCR and alternative HEV NAT; however, only the Kentucky donation had a high level of HEV RNA (1440 IU/mL), and was strongly positive for both IgM and IgG HEV antibodies. The Indiana donation was genotyped as 3a, the California donation genotype 3b, and no genotype determined for the Kentucky donation (see Table). The clinical specificity for the cobas® HEV test in ID‐NAT was 100% (95% exact CI: 99.993% to 100%).
Conclusion: Based on the 3 confirmed‐positive donations of 50,724 tested, the HEV prevalence was 0.006% (95% exact CI: 0.001% to 0.017%) with a detection rate of 1:16,667 (95% CI, 1:588‐1:100,000). To date, no cases of TT‐HEV have been documented in the US. However, based on the prevalence observed, immunosuppressed transfusion recipients may be at increased risk for transfusion‐transmitted HEV.

C56‐A03J
Prevalence of Human Immunodeficiency Virus, Hepatitis B Virus and Hepatitis C Virus in More Than Fifty Percent of the United States Blood Supply: The Transfusion‐Transmissible Infections Monitoring System (TTIMS)
Whitney R Steele*1, Ed P Notari1, Diane Nelson1, Steve Anderson2, Simone Glynn3, Brian Custer4, Debra A Kessler5, Rita A Reik6, Phillip C Williamson7, Jaye P Brodsky8, Roger Y Dodd9 and Susan L Stramer1
1American Red Cross, 2US FDA, Center for Biologics Evaluation and Research, 3NIH/NHLBI, 4Blood Systems Research Institute, 5New York Blood Center, 6OneBlood, Inc., 7Creative Testing Solutions, 8Quality Analytics, Inc, 9American Red Cross (retired)
Background/Case Studies: Monitoring the epidemiology of TTIs within the donor population is critical to provide an ongoing assessment of infection risks associated with FDA policy changes such as the MSM deferral criteria. TTIMS is a multi‐center, federally‐funded program intended to derive HBV, HCV and HIV prevalence, incidence, viral genotypes, and donor risk factors for greater than 50% of blood collected in the US. TTIMS is supported by two distinct coordinating centers (laboratory and risk factor, LRCC, and donation database, DDCC). Here we report 13 months of prevalence along with demographic trends from the DDCC.
Study Design/Methods: Four blood providers and their respective testing laboratories participated. Standardized consensus‐positive (CP) monitoring definitions were established for donor test results for HBV, HCV and HIV. These results, along with demographics for each donor and donation status (first‐time vs repeat) were assembled into a single data set. Rates of nucleic acid test (NAT) yield (seronegative) and concordant positives (serologic plus NAT positives) were combined to comprise CPs, were computed overall for donors and donations and by demographic, geographic and temporal characteristics. Where appropriate, rates were compared for differences using 95% confidence intervals. This analysis contains data from 9/1/15‐9/30/16.
Results/Findings: Among 7,578,462 donations reported (16.2% from first‐time and 83.8% from repeat donors), there were respectively 483, 1489 and 194 CP results for HBV, HCV and HIV with corresponding rates of 6.37,19.63 and 2.56 per 100,000 (pht) donations. Prevalence among first‐time donors was, as expected, higher than among donations from repeat donors with ratios of 23:1, 24:1 and 5.4:1 for HBV, HCV and HIV. Rates (pht) among males were higher than among females for all markers (HBV 8.3 vs 4.2; HCV 23.5 vs 15.2; HIV 3.9 vs 1.0). In general, higher rates for all markers were seen among minority donors, those in the 25‐39‐year age group (also 18‐24 year for HIV), and those from the southeast (and south central for HIV and HCV, and southwest for HBV). No trends were noted over time when 3‐month periods were compared.
Conclusion: Data from 4 major US blood systems were successfully combined and are a baseline for monitoring purposes. Demographic trends are similar to those observed in other donor studies and generally agree with community trends. Changes in rates will require analyses in the context of potential changes in the demographic structure of the donor population.
C57‐A03J
Screening Donated Blood from Babesia Endemic Regions of the United States Using a Transcription‐Mediated Amplification Assay on a Fully Automated System
Vanessa Bres*1, Melanie C Proctor2, Deanna Self1, Monique Portugal1, Adrian Gurrola1, Laura Tonnetti2, Sonia Bakkour3, Cheryl Lobo4, Michael Paul Busch3, Susan L Stramer2 and Jeffrey M Linnen1
1Grifols Diagnostic Solutions Inc., 2American Red Cross, 3Blood Systems Research Institute, 4New York Blood Center
Background/Case Studies: The Procleix® Babesia assay on the Procleix Panther® system is a qualitative in vitro nucleic acid test currently under development. The assay, which is based on Transcription‐Mediated Amplification (TMA), detects four clinically relevant Babesia species (B. microti, B. divergens, B. duncani, and B. venatorum) in human whole blood specimens. This test is intended to screen blood donations individually and in pools of up to 16 donations. Whole blood samples are lysed and then pooled on the automated Procleix Xpress® system prior to testing on the Procleix Panther system. These studies evaluated the preliminary analytical and clinical performance of the Procleix Babesia assay on the Panther system.
Study Design/Method: Analytical sensitivity was determined by diluting in vitro synthesized RNA transcripts for the four Babesia species. Fresh B. microti‐infected hamster whole blood, cryopreserved B. duncani‐infected hamster whole blood and fresh B. divergens‐infected human erythrocytes were tested to determine the limit of detection (LOD) of parasites/mL (p/mL) by probit analysis. Clinical sensitivity and specificity were determined by screening 32,274 unlinked whole blood donations collected from August 25th 2016 to April 7th 2017 in the northeastern United States. Initial reactive donations were confirmed by repeat testing, PCR, and/or IgG immunofluorescence assay (IFA). Reactive individual donor lysates were tested in pools of 16.
Results/Finding: The Procleix Babesia assay detected all four Babesia species with a 95% LOD ranging from 7.10‐13.51 copies/mL. The preliminary 95% LOD in parasites/mL ranged from 0.64‐3.61 p/mL for B. microti (n=9), from 0.92‐1.52 p/mL for B. duncani (n=2), and from 0.62‐4.95 p/mL for B. divergens (n=2). Of the 32,274 donations screened, 17 initial reactive and 14 confirmed positive donations were identified for specificity of 99.991% (95%CI: 99.972‐99.997%). Of the confirmed positive specimens, 8 were reactive by both IFA and PCR, 5 by IFA only and 1 by PCR only. All confirmed positive samples were reactive in lysate pools of 16. Donors of reactive donations resided in CT (11), NJ (1), NH (1) and ME (1) for an overall incidence of 1:2,305, and 1:1,433 in CT.
Conclusion: The Procleix Babesia assay on the Procleix Panther system demonstrated high clinical specificity and sensitivity and detected all four Babesia species with similar sensitivity. All confirmed positive donations were also detected in pools of 16 thus demonstrating the effectiveness of pooled lysate screening.
C58‐A03J
Proportion of HIV Seropositive Donors with Recently‐Acquired Infection in the USA
Brian Custer*1, Roberta Bruhn1, Sheila Keating1, Debra Kessler2, Rita A Reik3, Valerie Winkelman4, Dylan Hampton1, Rahima Fayed5, Steve Anderson6, Alan E Willams6, Simone Glynn7, Roger Y Dodd8, Michael Paul Busch1 and Susan L Stramer5
1Blood Systems Research Institute, 2New York Blood Center, 3OneBlood, Inc., 4Creative Testing Solutions, 5American Red Cross, 6US FDA, Center for Biologics Evaluation and Research, 7NIH/NHLBI, 8American Red Cross (retired)
Background/Case Studies: While donations that test HIV RNA‐positive but seronegative (NAT yields) reflect very recently‐acquired HIV infections, likely in the 2‐week period before donation, they are rare making it difficult to assess statistical associations. The limiting antigen avidity (LAg avidity) assay can be used to estimate the proportion of HIV‐seropositive donors who seroconverted in the four months before donation. The objectives of this study are to determine the proportion of HIV‐positive donors with recent infections and to assess if demographic or other factors are associated with recently‐acquired infection in US donors.
Study Design/Method: Four large blood collection organizations provided plasma samples from index donations that were confirmed NAT and HIV‐1 antibody positive by routine testing from 2010 through 2016. These samples were tested using the Sedia Biosciences LAg avidity assay which has a mean duration of recent infection (MDRI) of 130 days [∼4 months] (95%CI 118 – 142 days) based on the product insert recommended normalized optical density (ODn) cut‐off of 1.5. Samples with ODn values of ≤2.0 were retested and the mean ODn values used. Associations between demographic and other donation characteristics, such as the interdonation interval (IDI) in repeat donors, were assessed comparing recent and long‐standing HIV infection groups.
Results/Finding: A total of 626 confirmed HIV RNA/antibody‐positive donor plasma samples were tested with 31.5% classified as having recently‐acquired infection. The proportion of donors with recent infection did not vary across the seven years. Younger donors, and independently, repeat donors were more likely to have recent infection (p<0.001 in both cases). As would be expected, in repeat donors the shorter the IDI before the HIV‐positive donation, the more likely the HIV infection was recently acquired (p for trend<0.001). Recent infection in younger, repeat donors was notable (table). Sex and race/ethnicity groups were not significantly associated with recent infection.
| First‐Time Donors | Repeat Donors | ||||
|---|---|---|---|---|---|
| Age Group | Samples Tested |
LAg Avidity Recent n (%) |
Samples Tested |
LAg Avidity Recent n (%) |
Median IDI (IQR) in days |
| 16‐19 | 77 | 29 (37.7) | 43 | 27 (62.8) | 256 (112‐485) |
| 20‐29 | 107 | 30 (28.0) | 133 | 63 (47.4) | 397 (169‐1304) |
| 30‐39 | 68 | 11 (16.1) | 34 | 7 (20.6) | 475 (77‐2368) |
| 40‐49 | 56 | 6 (10.7) | 39 | 11 (28.2) | 363 (154‐1834) |
| 50+ | 41 | 6 (14.6) | 28 | 7 (25.0) | 546 (321‐1060) |
| Total | 349 | 82 (23.5) | 277 | 115 (41.5) | 364 (168‐872) |
Conclusion: Use of the LAg avidity assay shows that in both first‐time and repeat HIV‐positive US blood donors, newly‐acquired (i.e., incident) HIV infections are more frequent in younger donors. The use of this approach provides an additional monitoring tool to assess changes in characteristics of donors whose risk exposure was proximate to the date of donation and will also complement traditional incidence methods by allowing derivation of incidence by donor type.
C59‐A03J
Epidemiology of Hepatitis B Virus, Hepatitis C Virus and Human Immunodeficiency Virus in United States Blood Donors
Lauren A Crowder*1, Whitney R Steele1, Ed P Notari1, James Haynes1, Roger Y Dodd2 and Susan L Stramer1
1American Red Cross, 2American Red Cross (retired)
Background/Case Studies: From 2004‐2012, the prevalence of HBV and HCV in US blood donors decreased, while HIV rates remained constant. However, incidence has not been recently calculated. Here we report the prevalence, incidence and residual risk (RR) of HBV, HCV, and HIV in a large US blood system from 2008‐2015.
Study Design/Methods: Prevalence was calculated in 2‐year intervals. Incidence was measured as the number of positives among repeat donors divided by the total time at risk, in person‐years (PY). RR was calculated using the window periods of 18.5, 7.4 and 9.1 days for HBV, HCV and HIV, respectively. Linear regressions were calculated with p<0.05 (*) as significant.
Results/Findings: From 1/1/08‐12/31/15, there were more than 48 million donations from 13,204,447 donors (51.4% female, 33% First‐Time (FT), 81.4% Caucasian). There were significant decreases in donation prevalence for HBV and HCV (p=0.014 and 0.044), but no significant decrease in HIV during the 8 years (see Table for F and R2 values). A significant decrease was seen in FT donor prevalence for HBV and HCV (p=0.026 and 0.042). Prevalent FT donors were significantly more likely to be male (68.3% ‐ HBV, 59.8% ‐ HCV, 79.7% ‐ HIV; p<0.001). Incidence for all agents declined (significant only for HBV; p=0.035). The decrease in HCV incidence was not significant, but there were fewer incident donors in the last 2‐year period (74in 2012‐2013 vs. 19in 2014‐2015). HCV incident donors in 2014‐2015 were more likely to be male (79.0% vs 46.0% in 2012‐2013, p<0.001) and were younger (84.2% vs. 67.6% in 2012‐2013 <40 years, p=0.011). Overall, incident donors were more likely to be Caucasian males (p<0.01). RRs for all 3 agents decreased over time with RRs in 2014‐2015 of 1in 1,565,000; 1 in 2,680,000; and 1in 2,435,000 for HBV, HCV and HIV, respectively.
Conclusion: Prevalence, incidence and RR of HBV, HCV and HIV have generally decreased within this blood system over the 8‐year time frame. As donor screening and deferral regulations evolve, it is important to monitor these risks. It is critical to note that even in a large population, small changes to the number of positives can have a significant impact on prevalence and incidence rates.
TABLE 1. Prevalence and Incidence Rates, 2008‐2015
| Donation Prevalence (per 100,000 donations) | |||||
| 2008‐2009 | 2010‐2011 | 2012‐2013 | 2014‐2015 | F, R2 | |
| HBV | 10.7 | 9.6 | 7.8 | 5.3 | 70.3, 0.97* |
| HCV | 31.6 | 27.3 | 24.4 | 13.6 | 21.4, 0.91* |
| HIV | 2.9 | 2.9 | 2.5 | 1.6 | 8.3, 0.81 |
| FT Donor Prevalence (per 100,000 donors) | |||||
| 2008‐2009 | 2010‐2011 | 2012‐2013 | 2014‐2015 | F, R2 | |
| HBV | 78.7 | 74.2 | 61.9 | 46.3 | 37.8, 0.95* |
| HCV | 230.7 | 203.7 | 178.73 | 102.9 | 22.6, 0.92* |
| HIV | 14.2 | 13.0 | 13.0 | 7.9 | 6.1, 0.75 |
| Incidence (per 100,000 PY) | |||||
| 2008‐2009 | 2010‐2011 | 2012‐2013 | 2014‐2015 | F, R2 | |
| HBV | 4.2 | 3.7 | 1.8 | 1.3 | 27.4, 0.9* |
| HCV | 6.0 | 6.0 | 6.2 | 1.8 | 2.5, 0.6 |
| HIV | 4.2 | 5.2 | 2.6 | 1.7 | 4.5, 0.7 |
C60‐A03J
Robust Inactivation of Mayaro Virus in Platelet Concentrates and Red Blood Cells Using Nucleic Acid Targeting Pathogen Reduction Technologies (PRT)
Felicia Santa Maria1, Andrew Laughhunn1, Yvette Girard1, Peter Bringmann1, Marion Lanteri*2 and Adonis Stassinopoulos2
1Microbiology Department, Cerus Corporation, 2Scientific Affairs Department, Cerus Corporation
Background/Case Studies: Mayaro virus (MAYV) is a member of the genus Alphavirus in the family Togaviridae. Similar to other alphaviruses, Chikungunya virus (CHIKV) and Ross River virus (RRV), MAYV infection results in severe arthralgia with debilitating joint pain. Since its identification in 1954, the virus has caused relatively small, sporadic outbreaks across rural areas of South America. MAYV is spread primarily via forest and urban‐dwelling mosquitos, such as Aedes aegypti and Aedes albopictus. In the 2000's, MAYV outbreaks spread to large cities of South America, indicating a shift from rural to more urban transmission. Additionally, in 2010, two travelers returning to France and the Netherlands had evidence of MAYV infection, highlighting the global concern. Furthermore, in 2015, MAYV was isolated from a patient in Haiti, suggesting the virus is already circulating in the Caribbean. The extent of MAYV transmission could be underestimated due to limited surveillance and diagnostic capabilities; therefore, it is necessary to be prepared for MAYV emergence and the potential risk for the blood supply in case it can be transmitted through blood transfusion.
Study Design/Method: Platelet components (PC) prepared in PAS were spiked with MAYV and treated with amotosalen and UVA illumination. Samples were collected pre‐UVA and post‐UVA illumination for infectious titer determination.
AS‐5 RBCs were spiked with MAYV, mixed with glutathione (GSH)/Processing solution, dosed with 200μM amustaline, and incubated for 18hrs at room temperature. Samples were collected prior to the addition of amustaline (pre‐treatment) and following the 3hr incubation (post‐treatment) to determine infectious titers.
Infectious titers for all samples were determined by plaque assay on Vero76 cells. The extent of inactivation was determined by comparing the infectious titers (plaque forming units (PFU)/mL) in pre‐ vs. post‐treatment samples.
Results/Finding: MAYV was inactivated to the limit of detection in both PC and RBCs. In platelets, >6.9 log10, or >6.2 log10 PFU/mL, inactivation of MAYV was achieved. In RBCs, inactivation of MAYV was >6.2 log10, or >5.5 log10 PFU/mL.
Conclusion: This study demonstrates robust inactivation of MAYV by both amotosalen/UVA treatment in PC and amustaline/GSH treatment in RBCs. These systems are efficient at inactivating Alphaviruses that have demonstrated or have the potential for transfusion‐transmission, including MAYV, CHIKV and RRV. PRT offers potential as a mitigation strategy for maintaining blood component availability in areas where multiple Alphaviruses are epidemic or endemic, and testing is not feasible.
(Data have not been submitted for FDA review and INTERCEPT for red blood cell is not approved for commercial use).
Clinical Oral Abstract Session: Donor and Therapeutic Apheresis
C61‐A03K
Thrombotic Thrombocytopenic Purpura with High Adamts‐13 Inhibitor May Represent a Distinct Disease Subset in Response to Therapy Based on Immature Platelet Count (A‐IPC) Dynamics
Hamza N Gokozan*1,2, Hollie M Reeves1,2 and Robert W Maitta1,2
1Case Western Reserve University School of Medicine, 2University Hospitals Cleveland Medical Center
Background/Case Studies: Thrombotic thrombocytopenic purpura is a life‐threating consumptive thrombocytopenia and microangiopathic hemolytic anemia causing diffuse ischemic damage to tissues. Early therapeutic plasma exchange (TPE) initiation has improved survival. Absolute immature platelet count (A‐IPC) has been found to aid in diagnosis and follow‐up of TTP patients. A‐IPC changes in response to therapy in patients with low ADAMTS13 activity and high inhibitor have not been analyzed in a patient cohort. We analyzed A‐IPC response to therapy in five patients with ADAMTS13 deficiency and high inhibitor at a large tertiary academic medical center.
Study Design/Method: Patients had ADAMTS13 activity of <5% and high inhibitor (1.4‐8). Mean age of cohort 22.8 years (range 17‐64). Four patients were female and one was male. Patients presented with microangiopathic hemolytic anemia, thrombocytopenia (mean 15.2 x 10⁹/L, range 9 – 27 x 109/L) and low A‐IPC (mean 1.5 x 10⁹/L, range 0.5 ‐ 3.6 x 10⁹/L). Patients were initiated on daily TPE and prednisone; additional immunosuppression during hospital stay for cohort consisted of rituximab 375mg/m2 (4 patients) and cyclophosphamide 400mg/m2 (one patient). TPE continued until platelet count reached 150 x 109/L for at least two consecutive days. Immature platelet fraction (%‐IPF) and A‐IPC (%‐IPF x platelet count) were obtained with daily pre‐TPE CBC. A‐IPC ratio was calculated from baseline.
Results/Finding: Patients responded rapidly to daily TPE (mean of 2.4 days [range 1‐4 days]) when they achieved a three‐fold increase in A‐IPC from baseline (mean 11.1 x 10⁹/L, range 2.2 ‐ 25.3 x 10⁹/L) and a rapid improvement in platelet count. However, this improvement in platelet count was not accompanied by expected decreases in A‐IPC, suggestive of recovery from disease. All patients experienced platelet (mean 217.6 x 10⁹/L, range 200 ‐ 294 x 109/L) and A‐IPC (mean 19.4 x 10⁹/L, range 13 ‐ 28.5 x 10⁹/L) decreases that occurred concurrently while receiving daily TPE so that after a mean of 11.6 days (range 8‐14 days) mean platelet count was 65.4 x 10⁹/L (range 14 176 x 109/L) and mean A‐IPC 3.2 x 10⁹/L (range 0.7 – 6.6 x 10⁹/L). Patients were initiated in either rituximab or cyclophosphamide therapy in conjunction with TPE after a mean of 20.8 days of A‐IPC and platelet count instability. A‐IPC trended to levels indicative of restoration of a negative feedback after this time.
Conclusion: Rapid decreases in platelet counts after a good response in TTP patients may raise suspicion for presence of high ADAMTS13 inhibitor. Patients with a high inhibitor have similar A‐IPC dynamics during which initial high A‐IPC production is followed by unexpected decreases in A‐IPC concurrent with platelet counts. Recovery occurs once negative feedback between platelet and A‐IPC production is re‐established. Patients with a high inhibitor may represent a distinct subset of TTP as suggested by A‐IPC responses.
C62‐A03K
Benchmarking the Centralized Urgent Plasma Exchange Service for Patients Admitted with a Diagnosis of Thrombotic Thrombocytopenic Purpura at a Multi‐Hospital Healthcare System
Jansen N Seheult*1, Michelle N Stram1, Joan Sevcik2, Alesia Kaplan2,3 and Joseph E. Kiss2,3
1Department of Pathology, University of Pittsburgh Medical Center, 2Blood Systems Inc., 3University of Pittsburgh
Background/Case Studies: Consensus guidelines recommend that therapeutic plasma exchange (TPE) must be started as early as possible and within 4‐8 hours after the diagnosis of thrombotic thrombocytopenic purpura (TTP) has been made; however, there are limited data documenting actual practice. There are several operational facets of delivering a centralized urgent TPE program in a multi‐hospital healthcare system, including: central venous (CV) access, ordering, release and delivery of thawed plasma, and transportation of personnel and equipment to perform the procedure. This study analyzes the time elapsed between major steps from diagnosis to initiation of TPE in patients admitted with TTP.
Study Design/Method: A retrospective review of the electronic medical record and laboratory information systems from January 1, 2013 to November 1, 2016 was conducted to identify all TTP patients undergoing urgent TPE. Demographics, comorbidities, and other pertinent laboratory tests (such as ADAMTS‐13 activity levels, complete blood count, biochemical markers of hemolysis and coagulation studies) were reviewed on all identified patients. Temporal data for TPE request, CV access placement, plasma product release (which usually happens after CV access), arrival of TPE team and initiation of the procedure were extracted from procedure notes and the blood bank information system. Descriptive and summary statistics were generated using Stata version 14 (Statacorp, TX). Group comparisons were made based on hospital location, level of care and history of TTP using a Wilcoxon rank‐sum test.
Results/Finding: Of the 96 TTP patients identified, 22 were excluded due to missing temporal data for important variables. The majority (85%) of patients were treated at central academic centers, with the remainder being treated at peripheral sites. Fifteen patients (20%) had a prior history of TTP and 26% had severe ADAMTS13 deficiency on admission. The median time from TPE request to initiation was 5.6 hours (interquartile range: 4.7‐7.2 hours). There were non‐significant trends to shorter time intervals from request to CV access and request to TPE initiation in patients admitted to the intensive care unit (ICU) versus non‐ICU patients (table 1). Treatment was not started within an 8‐hour window in 13 patients; the median time to CV access was significantly longer in these patients (5.8 vs 2.47 hours, p<0.001). Two of these patients had a prior history of TTP and only four patients had severe ADAMTS‐13 deficiency. The majority (more than 70%) of the time interval between TPE request and TPE initiation was spent obtaining CV access and plasma products. There were no significant differences in time intervals comparing patients with a new diagnosis of TTP versus patients with recurrent/ relapsed disease (table 1) or between patients treated at a central academic center versus a peripheral hospital.
Conclusion: The consensus 4‐8 hour target window from TPE request to initiation appears feasible for a centralized TPE program servicing a multi‐hospital healthcare system. Addressing limitations in availability of CV access would likely yield the greatest improvement in timeliness of urgent TPE.
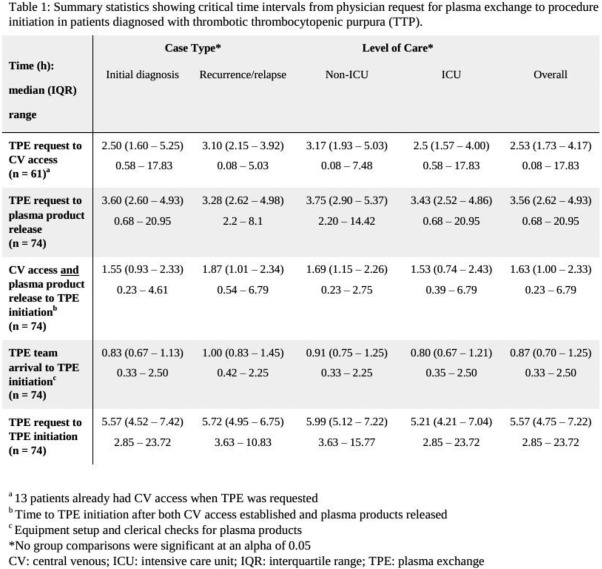
C63‐A03K
Cytoreductive Therapy for Cellular Hyperviscosity: Utility of Cytapheresis Treatment for Chronic Myelogenous Leukemia and Essential Thrombocythemia.
Jan C Hofmann* and Dobri D Kiprov
California Pacific Medical Center
Background/Case Studies: Several retrospective, case series have suggested that cytoreductive therapy to treat cellular hyperviscosity and prevent thrombotic events in patients (pts) with chronic myelogenous leukemia with accelerated transformation (CML‐AT) or essential thrombocythemia (ET) may improve short‐term outcomes. However, no randomized controlled trial (RCT) assessing the efficacy of cytapheresis treatment in this group of pts has been performed.
Study Design/Method: From January, 2006 through January, 2017, we performed cytapheresis (Cy) treatments (txs) for 123 pts with either CML‐AT or ET, and clinical and/or laboratory evidence of cellular hyperviscosity. 84 pts (68%) had CML‐AT and received 319 leukapheresis (Lp) txs; 39 pts (32%) had ET and received 124 thrombocytapheresis (Tc) txs. CML‐AT pts presented with median WBC 398 x 109/L (range 193‐689 x 109/L), of which 63% had blast percent >75% or blast count >100 x 109/L. Median age was 42 years (8‐79 years); 62% were male. CNS symptoms (sxs) of leukostasis (lks) were defined as: headache, cognitive decline, confusion, somnolence, visual abnormalities, or seizure; pulmonary (pulm) sxs of lks were defined as: dyspnea, hypoxia, or bilateral chest infiltrates. 22% of CML‐AT pts had no sxs of lks; 40% pts had sxs of either CNS or pulm lks (1 sxs), and 38% pts had sxs of both CNS and pulm lks (2 sxs). ET pts presented with median platelet (plt) count of: 1738 x 109/L (642‐3510 x 109/L)and 71% pts had sxs of thrombosis (evidence of CVA or TIA, MI, or DVT). Median age was 66 years (31‐89 years); 58% pts were male.
Results/Finding: All pts received a course of Cy tx with following objectives: 1) decreasing the risk of thrombotic/ hemorrhagic complications related to hyperviscosity, and 2) stabilizing CML‐AT pts for induction chemotherapy (ind chemo). WBC (or plt ct) tx goals were: WBC count (ct) <100 x 109/L for CML‐AT pts, and plt ct <450 x 109/L for symptomatic ET pts and <750 x 109/L for asymptomatic ET pts. CML‐AT pts received median of 3 Lp txs (mean 3.9 txs/pt; range 2‐8 txs). ET pts underwent median of 2 Tc txs (mean 3.4 txs/pt; 1‐7 txs). Outcomes were evaluated by percentage of pts who: 1) reached WBC (or plt ct) tx goal, and 2) received ind chemo. “Improved” outcome was defined as pts who reached their WBC (or plt ct) tx goal during CY tx; “stabilized” were pts who achieved >50% reduction in WBC (or plt ct) without reaching goal; and “unchanged” were pts who achieved neither. In CML‐AT cohort, 76% pts improved, 21% pts stabilized; and 3% pts worsened. In ET cohort, 85% improved, 14% stabilized, and 1% were unchanged. For CML‐AT pts, median final WBC ct = 96 x 109/L (range 66‐307 x 109/L); 94% pts received ind chemo. For ET pts, median final plt ct = 705 x 109/L (263‐1087 x 109/L); 95% pts had resolution of thrombotic symptoms. 4% of CML‐AT pts and 0% of ET pts expired within 1‐4 days after course of CY tx. Of 3 expired pts, 2 pts had both blast crisis and sxs of CNS/pulm lks; 1 pt had intracranial hemorrhage or CVA; and 2 pts were hypotensive, intubated, or unable to tolerate ind chemo.
Conclusion: Pts with CML‐AT or ET and evidence of impending thrombosis may benefit from cytoreductive therapy. A limited number of cytapheresis treatments (median 2‐3 txs) can enable a high percentage of pts to receive definitive treatment and may improve short‐term clinical outcomes. A RCT to assess efficacy of cytapheresis treatment versus induction chemotherapy (or platelet inhibitor tx) alone in this subset of pts would be very useful.
C64‐A03K
Hypotension and Citrate Toxicity Are More Common in Patients Receiving Plasma Exchange Where Saline Is Used As Partial Replacement Fluid with Albumin
Mehraboon S Irani*1, Pippa Simpson2, Liyun Zhang2, Mazen Toushan3 and Matthew Karafin1
1Blood Center of Wisconsin, 2Medical College of Wisconsin, 3William Beaumont Hospital
Background/Case Studies: Partial normal saline replacement during plasma exchange procedures is common practice. Benefits of using normal saline as a replacement fluid include reduced procedure costs and possible reduction of the hypothetical hyper‐oncotic effects of standard albumin formulations. However, the use of normal saline may increase the risk of undesired, and potentially costly, adverse events, such as hypotension and citrate reactions. The goal of this study was to compare the frequency of reported adverse outcomes for patients that received all albumin versus albumin/saline as replacement fluid for plasma exchange at our institution.
Study Design/Method: A four year retrospective chart review was done of all therapeutic apheresis procedures performed by our apheresis service that used 100% albumin or 80% albumin‐20% normal saline (80/20) as replacement. Patients who received plasma entirely or partially as replacement were excluded. The procedure type ordered (100% albumin vs 80/20), the percent of normal saline actually used during the procedure, age, gender, and any noted adverse events during the procedure were recorded in all cases. Repeated procedures were modeled using a generalized linear mixed model to examine the risk of having hypotension and/or citrate toxicity where 100% albumin was used versus those that used 80/20. Covariates included were fluid types, age and gender. Odds ratios (OR) and 95% confidence intervals (CI) were used as a measure of risk. We used the term significant for a two‐sided p‐value < 0.05.
Results/Finding: During the study period, 3650 procedures were documented for 414 subjects (46% female), age range 0‐93 years, of which 2,470 (67.7%) received 80/20. The type of fluid used as replacement had a significant effect on the risk of having either hypotension or citrate toxicity. Replacement with 100% albumin had a significantly lower risk of having either event than by using 80/20, [p=0.002, OR (CI): 0.40(0.22, 0.72)], and also had a significantly lower risk of causing hypotension [p=0.023, OR (CI):0.45 (0.22, 0.89)] in addition to a lower risk of causing citrate toxicity [p=0.042, OR (CI): 0. 24 (0.06, 0.95)]. Age had a significant effect on having a hypotensive event [p=0.04, OR (CI):1.1 (1.0, 1.1)] but no effect on citrate toxicity or the combined outcome. Gender had no effect on frequency of any event.
Conclusion: Partial saline use as a replacement fluid with albumin during plasma exchange significantly increases the risk of hypotension and citrate toxicity during the procedure. Age also increases the risk of hypotension. Use of saline as replacement fluid during plasma exchanges should be minimized to maximize patient safety especially in older patients.
C65‐A03K
Adverse Events During Apheresis: A Ten Year Experience at a Tertiary Academic Medical Center
Sirisha Kundrapu*1,2, Sireesha Datla3, Vanessa Griffin2 and Robert W Maitta1,2
1Case Western Reserve University School of Medicine, 2University Hospitals Cleveland Medical Center, 31University Hospitals Cleveland Medical Center
Background/Case Studies: Therapeutic apheresis (TA) is a complex procedure that is mostly well‐tolerated and rarely associated with adverse events (AEs). There are few studies published on AEs associated with TA but they lack uniformity of data. Moreover, there is no common database in the United States (US) to report TA‐associated AEs. We evaluated the annual incidence rates of AEs associated with TA at a large tertiary academic medical center over a 10 year period and compared it to published literature.
Study Design/Method: We conducted a 10‐year retrospective study (2007‐16) of TA procedures performed and AEs were classified according to criteria described in Table 1. During the study period, TA were performed using COBE Spectra (Software versions 4.7 and 6.1) and since 2013 the Spectra Optia apheresis system (version 8.0). Literature search was conducted for data published on AEs associated with TA. Four studies from US and 13 non‐US studies (Canada, Europe and Japan) were analyzed. Trend for AE rates from 2007‐16 was also analyzed. Statistical analysis was performed using Chi square and Spearman rho tests.
Results/Finding: The overall AE incidence was 6.9% (396 of 5,684 procedures) during 10 year period. Frequency of AEs associated with therapeutic plasma exchange (TPE) was significantly higher (8.5%, p<0.00001) compared to other TA procedures. We found significant correlation between number of TPE and AEs (Spearman rho 0.7, p=0.002) over the 10 years and significant down trend of moderate and severe AEs with a Spearman rho of ‐0.64 (p=0.04) and ‐0.83 (p=0.003) respectively. There were no fatalities during the study period. Majority of AEs were Grade I (60%) and Grade II (28%): 32/5684 (0.6%) procedures were not completed due to AEs. Comparison of AEs [6.9% (396/5,684)] to both European [11.2% (N=13, 12,256/109,842)] and other US studies [13.6% (N=4, 860/6,324)] showed a statistically significant difference (p<0.0001).
Conclusion: Overall incidence of AEs was significantly lower than current published literature. Incidence of AEs published in other countries is significantly lower than rates published in US. Differences in incidence of AEs in literature emphasizes need for uniform reporting and stratification of AEs and development of a common database to report TA‐associated AEs. We propose a grading rationale in order to standardize reporting of AE (Table 1).
TABLE 1. C65‐A03K
| Original System | Proposed System | |||
|---|---|---|---|---|
| Grade | Quality | Intervention | Quality | Intervention |
| I | Mild | No intervention required | Mild | Minimal intervention and no interruption |
| II | Moderate | Intervention required; Treatment completed | Mild/ Moderate | Intervention required; Treatment completed after pause to treat symptoms |
| III | Severe | Procedure Interrupted or abandoned | Moderate/ Severe | More extensive intervention due to change in clinical status; Procedure interrupted but eventually completed |
| IV | Fatal | Patient Expired | Severe | Significant change in clinical status; Procedure abandoned |
| V | ‐ | ‐ | Fatal | Patient expired |
C66‐A03K
Variations in Biochemical Markers of Bone Metabolism during Plateletpheresis: Impact of Socio‐Demographic and Lifestyle Factors?
Markus Dettke*
AKH Vienna University Hospital
Background/Case Studies: Plateletpheresis is associated with short‐term variations in biochemical markers of bone turnover. Socio‐demographic factors and lifestyle behaviors are recognized factors which influence mineral metabolism and bone health. In the present study we analyzed the influence of demographic and lifestyle factors on the observed changes in bone markers in a large cohort of routine platelet donors.
Study Design/Method: Altogether 200 platelet donors with a donation activity of up to 150 platelet donations participated in the study. After a detailed anamnesis all participants underwent a standardized questioner asking for several lifestyle factors known to affect bone metabolism. Blood was sampled before and after plateletpheresis and was analyzed for the bone formation marker osteocalcin (OC) and the bone resorption marker cross‐linked telopeptides of type I collagen (CTX), among other parameters. The effect of calcium supplementation on bone metabolism was tested in a placebo‐controlled crossover study involving ten donors.
Results/Finding: Plateletpheresis resulted in an increase in the serum levels of the bone resorption marker CTX and the bone formation marker OC. Both parameters returned to base levels within 2 hours after the end of the collection. Multiple regression analysis including the parameters sex, age , positive family history of bone disease, but also individual factors like hormonal contraception, smoking, regular alcohol consumption or sportive activity revealed no influence of socio‐demographic or lifestyle factors on the observed variation in CTX or OC. There was no association between individual donor career or the number of previous donation and the observed increase in bone turnover. The only predictive parameter we could identify was the amount of citrate exposure during plateletpheresis. Increase in serum CTX, showed an inverse correlation to changes of serum ionized calcium. Continuous IV supplementation of calcium‐gluconate throughout plateletpheresis reduced the variations in bone markers, although this effect was more pronounced for CTX compared to OC.
Conclusion: The amount of citrate infused during routine plateletpheresis is a predictive parameter for the transient increase in serum markers of bone metabolism. Known risk factors for bone diseases, including sex, age, smoking or alcohol consumption, seems to have a low impact on the observed citrate‐related variations in serological biomarkers of bone turnover.
Clinical Oral Abstract Session: Perioperative and Critical Care Blood Management
C67‐A03L
Transfusion with Optimized Blood Products Versus Transfusion with Standard Products in a Trauma‐Transfusion Rat Model
Mathijs Wirtz*1, Jordy Jurgens1, Jacoline Buchner‐Doeven1, Joris Roelofs1, Philip Spinella2, Jennifer A Muszynski3, Carel Goslings1 and Nicole Juffermans1
1Academic Medical Center, 2Washington University School of Medicine, 3Nationwide Children's Hospital
Background/Case Studies: Transfusion is associated with nosocomial infection and organ dysfunction in trauma patients, which may be mediated by soluble bioactive substances in blood products. We hypothesized that removing these bioactive substances improves host immune response and reduces organ dysfunction.
Study Design/Methods: Blood products were prepared from syngeneic rat blood according to blood bank standards. Soluble mediators were removed from red blood cells (14 days old) and platelets (5 days old) by washing. Plasma was filtered through a 0.22um filter. Rats (∼350 grams) were poly‐traumatized by crush injury to the small intestines, the liver lobes, and by fracture of the right femur and hemorrhaged ∼30% of their estimated blood volume, which was calculated to be 57mL/kg. Hemorrhage continued until a mean arterial pressure of 40mmHg was reached. Rats were randomized to resuscitation with standard blood products, washed/filtered blood products or sham. Blood samples were taken up to 4h after trauma to assess biochemistry and coagulation status. Ex vivo whole blood stimulation tests with LPS were performed after sacrifice, and organ damage was assessed by histopathology. Blood products were sampled to assess for biochemical changes. Comparisons between groups was done by ANOVA and Dunnett's post‐test for multiple comparisons.
Results/Findings: Filtering or washing of blood products significantly stabilized pH, sodium and potassium concentrations and decreased lactate levels in the products compared to standard products. Both resuscitation groups received an average of 17mL/kg of blood products in a 1:1:1 ratio. However, use of washed/filtered products did not improve organ failure, as assessed by histopathologic score and levels of creatinine, ASAT and ALAT. The coagulation status as assessed by thromboelastometry was deranged in all groups and normalized during transfusion, showing no significant differences between washed/filtered products and standard care. Immune response to LPS was decreased following trauma compared to healthy controls but did not differ between groups.
Conclusion: Filtering or washing of blood products reduces some aspects of storage lesion of blood products, without affecting the hemostatic capacity of the products, but does not improve organ injury in a rat trauma and transfusion model, nor does it improve the immunosuppressive host response. These results suggest that washing or filtering of blood products may have no relevant clinical effects in a rat polytrauma model.
| Biochemical characteristics of RBC products | ||
|---|---|---|
| Standard product | Washed/filtered product | |
| pH | 6.6 ± 0.01 | 7.1 ± 0.0* |
| Lactate (mmol/L) | 21.2 ± 1.7 | 1.6 ± 0.1* |
| Na+ (mmol/L) | 132.5 ± 0.1 | 143.5 ± 0.6* |
| K+ (mmol/L) | 31.2 ± 2.1 | 1.4 ± 0.1* |
| Ca2+ (mmol/L) | 0.21 ± 0 | 0.23 ± 0 |
| Glucose (mmol/L) | 19.4 ± 0.1 | 39.4 ± 0.6* |
n=5 batches, *p<0.05
C68‐A03L
Safety and Efficacy of Tranexamic Acid during Cardiovascular Surgery: A Single Center before‐and‐after Study
Takuma Maeda* and Shigeki Miyata
National Cerebral and Cardiovascular Center
Background/Case Studies: Tranexamic acid (TXA), an antifibrinolytic agent, has been widely used in cardiovascular surgery, since several studies have shown that prophylactic use of TXA is effective in reducing blood loss after cardiovascular surgery. However, there is concern about the risk of thromboembolic events and adverse neurological effects such as seizures, which might worsen patient outcomes. Consequently, we stopped using TXA in April 2013, which enabled us to conduct a before‐and‐after study. The present study aimed to examine the association between TXA and adverse effects (seizures, thromboembolism, and renal dysfunction) in patients undergoing cardiovascular surgery using a propensity score matching model. We also assessed the association between TXA and other clinical outcomes (reoperation for bleeding, transfusion volume, blood loss, ventilation time, intensive care unit stay, and 30‐day mortality).
Study Design/Method: This single center retrospective cohort study involved patients who underwent cardiovascular surgery with cardiopulmonary bypass or off‐pump coronary artery bypass grafting between January 2008 and July 2015 (n=3535). Because of missing data on patient characteristics, 257 patients were excluded. The incidence of adverse effects associated with TXA and other clinical outcomes were evaluated before (January 2008 to March 2013, n=1987) and after (April 2013 to July 2015, n=1291) using a propensity score model. We estimated propensity scores using a logistic regression model for TXA use as a function of 18 baseline variable, generating 969 pairs of patients who received or did not receive TXA. We also evaluated the adverse effects of TXA using segmental regression analysis.
Results/Finding: Propensity‐matched analysis showed that seizures were more common (8.7% vs 3.7%, p<0.001) and ventilation time was longer (15h vs 13h, p=0.04) significantly in the TXA group than in the non‐TXA group. In contrast, transfusion volume and blood loss were significantly lower in the TXA group than in the non‐TXA group (2000ml vs 2200ml, p=0.009; and 1265ml vs 1460ml, p<0.001, respectively). However, 30‐day mortality was not statistically different between the groups (1.6% vs 1.4%, p=0.82). None of the other outcomes were significantly different. Segmental regression analysis yielded similar results.
Conclusion: Even though TXA may be associated with an increased rate of seizures and longer ventilator time, it does not increase mortality. The use of TXA is significantly associated with decreased blood loss and transfusion volume, providing social benefit by reducing the need for blood transfusion because the supply of blood components will be limited with the aging of Japanese society. It seems to be advantageous to use TXA because decreased blood loss and transfusion volume and the associated social benefit outweigh the disadvantages of an increased rate of seizures and longer ventilator time.
C69‐A03L
Sustained Impact of Blood Management Strategies in Orthopedics: Continuous Quality Improvement
Linda Levinus* and Michele Deeney
New England Baptist Hospital
Background/Case Studies: Transfusions are one of the most over‐utilized treatments performed in any hospital setting (Choosing Wisely Campaign, April 2014, http://www.choosingwisely.org/societies/american-association-of-bloodbanks). Costs and risks associated with transfusions are high and may have a significant impact on patient safety. In our institution we perform over 12,000 joint replacements and spine surgeries per year, making transfusion‐associated costs very high. Since our last formal evaluation of the metrics used post implementation of Patient Blood Management (PBM) Strategies, questions regarding the feasibility of continued transfusion reduction and sustainability of the program were raised by administration and key stakeholder physicians. The objective of this study is to determine what, if any, sustainable improvement to our blood utilization dashboard has occurred through the enhancement of our PBM Program, and determine if this can serve as a Continuous Quality Improvement initiative for our organization. There are three metrics to be evaluated: 1) Transfusion Rate per Discharge; 2) Length of Stay (LOS); 3) Purchased Blood Product Cost Center budget.
Study Design/Method: We monitored the following PBM strategies as part of a continuous quality improvement charter, and where necessary made the following changes: 1) Revised the Maximum Surgical Blood Ordering Schedule (MSBOS) focusing on reducing primary Total Hip Arthroplasty and specific spine procedure orders from Type and Crossmatch to Type and Screen Only; 2) Revised Transfusion Guidelines based on transfusion data collected and through consensus of both medical and surgical physicians' practice; 3) Presented to both physician and administrative stakeholders our updated blood utilization dashboard. This established quarterly review of the effects of the changes in policy and practice on transfusion rates at both Transfusion Safety Committee and Medical Executive Committee.
Results/Finding: The sustainable impact of PBM strategies was monitored and measured with three organization wide metrics updated using data from FY13 as baseline through the first 6 months of FY17 (see Table 1).
Conclusion: The data collected show that there has continued to be a reduction in transfusion rate, and blood expenditures through FY16. Length of stay has also shown a continued reduction, which is an indicator that the PBM strategies implemented have not compromised quality outcomes. Further, continued review and monitoring of the chosen metrics, evaluating changes to policy and practice related to transfusion medicine, and communication of findings to providers/administration upon immediate restrospective analysis, are integral to the continued success and sustainability of our PBM program. Going forward, these practices, along with investigating use of additional PBM strategies, will provide the basis for an effective continuous quality improvement program in transfusion medicine for orthopedics.
TABLE 1. C69‐A03L
| FY13 | FY14 | FY15 | FY16 | FY17 (6mos to date) | |
|---|---|---|---|---|---|
| Transfusion Rate per Discharge | 0.68 | 0.50 | 0.32 | 0.25 | 0.22 |
| Length of Stay | 3.3 | 3.2 | 3.0 | 2.8 | 2.7 |
|
Blood Spend (Annual) |
1,083,208 | 776,880 | 620,028 | 303,027 | 184,715 |
C70‐A03L
Safety and Efficacy of 4‐Factor Prothrombin Complex Concentrate: A Retrospective Review of Outcomes at an Academic Hospital
Stephanie Jalaba*, Hollie Benson, Nan Zhang, Jill Adamski and Theresa Kinard
Mayo Clinic Arizona
Background/Case Studies: 4‐factor prothrombin complex concentrate (PCC) contains factors II, VII, IX, X, Proteins C and S and is used for reversal of vitamin K antagonists in acute major bleeding or urgent, invasive procedures. Occasionally, it is used off‐label when plasma is not optimal for achieving hemostasis. This study compares the efficacy of on‐label and off‐label use of PCC in correcting coagulation parameters and reducing allogeneic blood transfusion.
Study Design/Methods: A retrospective chart review was performed for PCC use at our institution in 2015. Marginal modeling (GEE method) was used to account for within patient correlation and assess changes in lab values and products transfused. Logistic regression (GEE method) was used to evaluate potential risk factors for unsuccessful hemostasis (UH= rate of transfusion after PCC ≥ rate before PCC) or thrombotic complications.
| Coagulation: Mean Values (SD) | Allogeneic Transfusion: Mean Units (SD) | ||||||
|---|---|---|---|---|---|---|---|
| 1 hr before PCC | 1 hr after PCC | p‐value | 6 hrs before PCC | 6 hrs after PCC | p‐value | ||
| All cases (n=87) | |||||||
| INR | 3.1 (2.6) | 1.8 (0.6) | <.0001 | RBC | 1.49 (3.39) | 0.69 (1.85) | .0018 |
| PT | 29.2 (17.4) | 19.5 (5.7) | <.0001 | FFP | 1.48 (2.84) | 0.34 (0.90) | .0003 |
| PTT | 54.5 (34) | 26.7 (17.1) | .0053 | Plt | 0.46 (1.04) | 0.26 (0.60) | .0827 |
| On‐Label (n=46) | |||||||
| INR | 3.6 (2.8) | 1.5 (0.3) | <.0001 | RBC | 0.46 (1.09) | 0.28 (0.69) | .3274 |
| PT | 33 (19.2) | 18 (3.1) | <.0001 | FFP | 0.76 (1.78) | 0.24 (0.74) | .0721 |
| PTT | 50.3 (11.6) | 42.1 (11.3) | .0037 | Plt | 0.20 (0.58) | 0.09 (0.28) | .2450 |
| Off‐Label (n=41) | |||||||
| INR | 2.5 (2.2) | 2.1 (0.8) | .0029 | RBC | 2.66 (4.55) | 1.15 (2.54) | .0255 |
| PT | 25.2 (14.9) | 21.3 (7.5) | .0005 | FFP | 2.29 (3.54) | 0.46 (1.05) | .0010 |
| PTT | 57.8 (44.6) | 74.2 (62.9) | .3660 | Plt | 0.76 (1.34) | 0.46 (0.78) | .1704 |
Reference: PT 11.8‐14.2 sec, PTT 25‐35 sec
Results/Findings: The reduction in PT (p=.005) and PTT (p=.05) was significantly greater in on‐label than off‐label use. Interestingly, transfusion reduction in RBC (p=.03) and plasma (p=.04) after off‐label use was significantly greater than on‐label use. 20 cases, both on‐label and off‐label, with UH were associated with cell saver, acute normovolemic hemodilution (ANH), or cardiopulmonary bypass (CPB). The odds of having UH were 5.5 times (p=.0072) more with cell saver or ANH, and 5.3 (p=.0130) times more with CPB. Post‐PCC thromboses were identified in 6 cases, but no association was found with potential risk factors: use of antifibrinolytics, vitamin K, Factor VIIa, or extracorporeal support.
Conclusion: PCC is clinically safe and effective at achieving hemostasis without significantly increasing thrombotic risks. PCC rapidly corrects coagulopathies and reduces allogeneic blood transfusions. PCC may be less effective for patients with recent use of CPB, cell saver, or ANH. Causes of this potential correlation need further investigation. Larger studies are necessary to explore additional indications for PCC.
C71‐A03L
Extending the Crossmatch Validity Date for High Risk Antenatal Patients on Bedrest
Kirsten Watson Alcorn*1, Katherine Eastwood2 and Theresa Nester3
1Bloodworks, Swedish Medical Center, 2Swedish Medical Center, 3Bloodworks NW
Background/Case Studies: When a pregnant woman with high risk pregnancy (diagnoses such as abnormal placentation, multiple gestation) is admitted to inpatient bedrest the obstetrical team would like to assure ability to crossmatch red blood cells (RBC) at all times by always having an in‐date type and screen specimen. Per current AABB Standards, this necessitates a new sample every 3 days. This can lead to excessive iatrogenic blood loss and increasing difficulty with obtaining intravenous access in the patient, to the point that an invasive catheter such as a PICC line may be placed. In order to mitigate these issues, we chose to extend the type and screen specimen to expire after 7 days in patients without RBC alloantibodies other than passively acquired anti‐D due to Rh immune globulin administration.
Study Design/Method: Patients expected to have an antenatal hospitalization of at least 4 days with high risk for transfusion need are identified by the obstetrical service, which submits a request to the transfusion service for extension of pre‐transfusion specimens to 7 days. The transfusion service medical director reviews the case and gives final approval. We observed patient red cell alloantibody status at baseline, new antibody formation between admission and delivery, number of patients requiring prenatal transfusion, and adverse events related to incompatibility if units were transfused.
Results/Finding: Between January 28, 2016 and April 11, 2017 there were 44 requests for extended out‐dating for 43 patients, all of which were approved. Only 1 patient did not have an in‐date specimen when the extended out‐dating was requested. Thirty‐eight (38) patients were in‐patients continuously until delivery. Five patients were discharged prior to delivery‐ 1 moved to another state, 1 was admitted later at another local hospital, and three were re‐admitted for later deliveries. The mean interval from approval to delivery was 17 days (range 0‐63). Six (6) patients delivered within 3 days of approval.
After approval, the mean number of additional specimens per patient was 2.1 (range, 0‐9).
No patient required transfusion prior to delivery. Five patients received transfusion of at least 1 RBC at the time of delivery, and none had evidence of transfusion reaction.
TABLE 1. Specimens Collected After Approval for Extended Out‐date Type and Screen Specimens
| Number of specimens | Number of Patients | Number of Specimen Collections Potentially Avoided Per Patient |
|---|---|---|
| 0 | 11 | 0‐2 |
| 1 | 8 | 1‐3 |
| 2 | 8 | 2‐4 |
| 3 | 8 | 4‐6 |
| ≥4 | 8 | 5‐7 |
Conclusion: Since no new antibodies were identified prior to discharge or delivery and no transfusion reactions were observed, the process appears safe.
With only 6 patients delivering within 3 days of approval for extended specimens, 37 patients avoided collection of at least 1 specimen each, and 16 patients avoided at least 4 collections each.
Since new antibodies are not detectable for at least 10 days after immunization, even longer extension of pre‐transfusion specimen out‐date may be considered.
Although this requires further study, we believe our practice of extending the pre‐transfusion testing sample expiration date to 7 days is safe and is justified, when weighed against the risk of excess iatrogenic blood loss and placing an invasive line for blood sampling in a pregnant patient.
C72‐A03L
Iron Metabolism in Critically Ill Patients Developing Anemia of Inflammation
Margit Boshuizen*1,2, Jan M. Binnekade1, Benjamin Nota2, Pieter R Tuinman3, Kirsten van de Groep4, Olaf L Cremer4, Janneke Horn1, Marcus J Schultz1, Robin van Bruggen2 and Nicole P Juffermans1
1Academic Medical Center, 2Sanquin Research and Landsteiner Laboratory, 3VU University Medical Center, 4University Medical Center Utrecht
Background/Case Studies: Anemia due to inflammatory processes (anemia of inflammation, AI) frequently occurs in critically ill patients. In AI, inflammation‐induced hepcidin decreases iron availability, a process that is thought to be regulated by erythroferrone, which impact erythropoiesis. Knowledge on changes in iron metabolism during the course of AI is limited, hampering the development of strategies to counteract AI. This study aimed to investigate the dynamics of parameters of iron metabolism during the development of AI in critically ill patients.
Study Design/Methods: A case control study was performed in 2 tertiary ICUs in The Netherlands comparing 30 patients who developed AI during ICU stay with 3 control groups: 30 non‐anemic patients with sepsis, 30 non‐anemic patients without sepsis, and 10 patients with anemia due to acute blood loss. Patients were matched on age and sex. A linear mixed model was used to assess differences in parameters of iron metabolism between groups and over time.
Results/Findings: In patients with AI, levels of iron, transferrin and transferrin saturation decreased already prior to the development of anemia, with lower levels compared to controls (table). Ferritin and hepcidin were increased in AI compared to controls. In the course of AI development, erythroferrone decreased. Differences in iron metabolism between groups were not influenced by disease severity. Patients with AI differed from patients with anemia due to acute blood loss, the latter was characterized by high iron (15.4 vs. 2.9 µmol/L, p<0.001) and transferrin saturation (53 vs. 9 %, p<0.001), and low ferritin (104 vs. 645 µg/L, p<0.001).
Conclusion: In critically ill patients with AI, iron metabolism is already altered prior to the development of anemia, suggesting a potential window of opportunity for therapy. Iron metabolism in AI is more disturbed than in non‐anemic septic controls, irrespective of disease severity, indicating that AI is not solely determined by severity of inflammation. Iron metabolism in AI patients differs from patients with acute blood loss, suggesting that efforts to modulate iron metabolism in anemic ICU patients should take the cause of anemia into account.
TABLE. Mean estimates of iron parameters for all patients per group at all time points, with 95% CI.
| AI |
Septic controls, no anemia |
Non‐septic controls, no anemia | |
|---|---|---|---|
| Iron (µmol/L) | 3.8 (3.2 – 4.5)*# | 5.6 (4.8 – 6.6) | 6.3 (5.4 – 7.3) |
| Transferrin (g/L) | 1.3 (1.2 – 1.5)*# | 1.6 (1.5 – 1.8) | 1.9 (1.7 – 2) |
| Transferrin saturation (%) | 10 (8 – 12)* | 14 (11 – 16) | 13 (11 – 15) |
| Ferritin (µg/L) | 1134 (548 – 2346)# | 473 (229 – 976) | 314 (152 – 648) |
| Hepcidin (pg/ml) | 20.7 (15.1 – 28.5)# | 12.9 (9.4 – 17.9) | 7.3 (5.4 – 9.8) |
| Erythroferrone (pg/ml) | 15.5 (9.3 – 26) | 9.6 (5.8 – 16) | 18.7 (11.2 – 31) |
* p<0.05 AI compared to septic controls, # p<0.05 AI compared to non‐septic controls.
Clinical Oral Abstract Session: Novel Approaches to Processing and Assessing Cell Therapy Products
C73‐A03M
A Paradigm Shift in Stem Cell Isolation and Storage
Jeffrey Drew*
Cells4life Group LLP
Background/Case Studies: Widespread use of umbilical cord blood is limited by processing yield and post‐thaw recovery of viable nucleated cells. The recommended therapeutic cell dose is approximately 2.5 x 10⁷ cells per kg body weight indicating that a single cord unit may be insufficent to treat larger individuals.
Cell isolation methods were developed to remove erythrocytes whilst recovering the white cell fraction (WCF). However, all current methods result in significant loss of the WCF, some up to 65%, whilst leaving 25% of the starting volume of erythrocytes. Additionally, there is an almost total loss of potentially important, low abundance cellular subsets.
The use of cord blood for hematopoietic reconsititution and in regenerative medicine would be widened if processing methods improved post‐processing and post‐thaw viable cell recovery.
Study Design/Methods: We have developed a solution consisting of a defined concentration of reagents routinely used in blood therapy. On combination with blood, this solution results in the selective sedimentation of erythrocytes by gravity within 30 minutes. The WCF remains in solution and can be easily separated from the erythrocyte sediment. The WCF can then be concentrated by gentle centrifugation into a small volume containing less than 1% of the original erythrocyte content. The addition of DMSO for cryogenic storage and controlled freezing using standard procedures then completes this simple process.
Results/Findings: We have clearly demonstrated that this method allows almost the entire WCF to be isolated and/or concentrated with only modest loss of any of the cellular sub‐sets thus far examined. In addition to improving pre‐freeze yields, post‐thaw recoveries of viable cells are markedly increased, with a yield of approximately 65% of the CD34+ fraction post separation and freeze thaw (Table 1). Possibly more important, the CFU assay results reproducibly yield higher counts of CFU‐GM, CFU‐GEMM and BFU colonies (Table 1) which is a strong indicator that this method will improve patient outcomes.
In addition, our separation method isolates and preserves the megakaryocyte‐like cells (CD45+CD61+) and early projenitor cells expressing Oct4 and Nanog (markers for VSELs) which are two examples of cellular subsets usually lost using current separation techniques.
Conclusion: These results demonstrate that our method achieves:
Routine recovery of the WCF at levels higher than current methods, independent of volume.
Higher percentage recoveries of all cell types tested than can be achieved with existing methods.
Markedly higher post‐thaw recovery of viable nucleated cells than any current methodology.
Almost complete removal of hematocrit.
As a result units of cord blood separated using this new method will contain cell yields that could only otherwise be achieved through pooling multiple separate units. Therefore, this new method has the potential to increase the demand for cord blood in therapy, expanding to larger individuals and adults, where up until now, it has been suppressed due to limited cell yields delivered by existing methods.
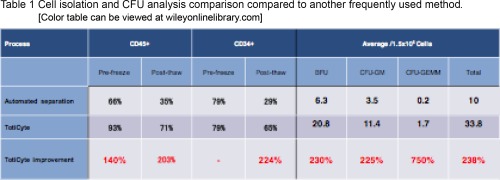
C74‐A03M
Effects of Implementation of an Absolute Lymphocyte Count Target, in Addition to CD34+ Target, for Hematopoietic Progenitor Cell Collection
Edwin A Burgstaler*, Luis F Porrata, Dennis A Gastineau, Eapen K Jacob and Jeffrey L Winters
Mayo Clinic
Background/Case Studies: Lymphoma patients receiving >0.5x10⁹ lymphocytes(lymph)/Kg during peripheral blood stem cell transplant have superior survival. In addition to a CD34+ cell target of 4.0x10⁶/Kg, a lymph target was also implemented. Fifty patients before (No ALC) and after (ALC) implementation were retrospectively evaluated.
Study Design/Method: Lymph and CD34+ yields, number of collections, lymph target reached, and days to engraftment were examined. Mobilization was G‐CSF (G) or G‐CSF + plerixafor (G+Pl). Consecutive No ALC and ALC procedures were examined. The Mann‐Whitney and Chi Square tests were used for statistical comparison, p< 0.05 considered significant.
Results/Finding: 110 No ALC and 159 ALC collections occurred among the 50 patients. Fenwal Amicus was used for 91% of the No ALC and 99% of the ALC collections (TerumoBCT Spectra Optia CMNC used for remaining). Diagnosis was 5 Hodgkin's and 45 non‐Hodgkin's lymphoma (No ALC); 7 Hodgkin's and 43 non‐Hodgkin's lymphoma (ALC). Pre procedure WBC and lymph counts were significantly higher for No ALC (WBC 49.3, Lymph 2.0x10⁹/L) than ALC (WBC 39.1, Lymph 1.2x10⁹/L). Equivalent whole blood (corrected for AC) was processed for No ALC (16.4L) and ALC (17.1L). For ALC group, extra collections beyond CD34+ target were: 0 days: 24%, 1 day: 36%, 2 days: 22%, 3 days: 16%, and 5 days: 2%. Significantly more patients were mobilized with G+Pl in No ALC group (N=81) than ALC group (N=60) and 42 collections in ALC group had mobilization discontinued after CD34+ cell target reached. There was no significant difference in G (13.2x10⁹ lymph) compared to G+Pl mobilized collections (13.0x10⁹ lymph); both were significantly higher than the collections where mobilization had been discontinued (5.9 x10⁹lymph). Days to WBC engraftment (13.5 No ALC vs 13.0 ALC) and platelet engraftment (13.0 NO ALC vs 12.0 ALC) were not significantly different. Median number of collections for No ALC (2) and ALC (3) were not significantly different. Data (medians) in the table.
Conclusion: Not all patients achieved the 0.5x10⁹ lymph/Kg or even the 0.3x10⁹ lymph/Kg targets. Implementation of a lymph target increased patients obtaining 0.5x10⁹ lymph/Kg from 40% to 54%. Only 12% had <0.3x10⁹ lymph/Kg. Discontinuation of mobilization once CD34+ cell target was reached significantly reduced lymph yield. The median increase of one collection per patient following implementation was less than had been expected.
| Lym Yield x109 | Lym Yield x109/Kg | (T)Lym Yield x109/Kg |
Lym CE2 % |
Frequency ≥ 0.5 Lymx109/Kg (%) |
Frequency 0.3‐0.49 Lymx109/Kg (%) |
Frequency < 0.3 Lymx109/Kg (%) |
(T)CD34 Yield x106 |
|
|---|---|---|---|---|---|---|---|---|
| No ALC | 13.9 | 0.18 | 0.44 | 46.9 | 40 | 36 | 24 | 5.1 |
| ALC | 10.2 S | 0.12 S | 0.48 | 50.7 | 54 | 34 | 12 | 7.5 S |
Lym= lymphocyte, T=total, CE2= Collection Efficiency 2, S=Significant
C75‐A03M
Extended Preprocessing Storage Impairs Cord Blood Hematopoietic Stem Cell Activity
Suria Jahan*1,2 and Nicolas Pineault2,3
1Canadian Blood Services, 2University Ottawa, 3Canadian Blood Services, Centre for Innovation
Background/Case Studies: Large distances between collection and processing sites combined with staff availability can result in long processing delays of umbilical cord blood (UCB) unit. Current NET‐Cord‐FACT standards specify that units can be stored for almost 48 hours at room temperature (RT) as long as units are cryopreserved by 48‐hours post‐collection. The impact of such delay on hematopoietic stem cell (HSC) function is unclear since most studies have not used transplantation assays that measure HSC key properties and activities. We hypothesized that such processing delay reduces the engraftment activities of UCB units. We set out to measure the loss in engraftment activities associated with preprocessing storage.
Study Design/Method: UCB units (n=3) were split with one half processed immediately (baseline 8‐12 hours) and the second after 43 hours storage at RT. UCB were then processed with hetastarch and buffy coat maintained cryopreserved in liquid nitrogen until use. Viability was assessed post‐thaw, and thawed UCB buffy coat cells were transplanted into NSG mice. Serial transplantation was used to test the self‐renewal and differentiation activities of HSC, while limiting dilution (LD) assay and Poisson statistic were used to estimate the frequency of Scid repopulating cells (SRC) in thawed units.
Results/Finding: Storage before processing had no significant impact on the recovery of viable post‐thaw CD45+ cells and CD34+ cell (n=3). Primary NSG mice were transplanted with a UCB cell dose that contained a total of 7,500 annexinVNEG viable CD34+ cells. The latter was done to avoid any bias towards one group or another. Short term platelets (190 vs. 140 hPlt/µL, p=0.06) and leucocytes (1.2% vs. 0.2% hCD45+, p<0.02) engraftment at 4‐weeks were significantly reduced in stored mice vs. baseline (n=3), and similar results were observed long‐term at 16‐weeks. Long‐term human bone marrow (BM) engraftment was also reduced in primary transplants from stored samples (33 ±19% (SEM) vs. 45 ±17 %hCD45+ BM cells, p<0.03, n=3). Similarly, the net number of human CFU progenitors were reduced by 60% in stored recipients (p=0.035). Multi lineage lympho‐myeloid engraftment was however confirmed in both groups. BM cells from primary mice were transplanted into secondary recipients and human engraftment investigated 3 months post‐transplant. Strikingly, the frequency of human CD45+ BM cells was 10‐fold greater in baseline vs. stored mice (p<0.01, n=2). Hence, storage at RT of UCB units is associated with a deficit in engraftment activity likely due to a loss in HSC activity and/or numbers. To distinct between both possibilities, the net number of SRC in baseline and stored samples for two units were calculated by LD transplantation assay. The net number of SRC measured 22‐weeks post‐transplants were reduced by 30% in unit 1, and by 80% in unit 2.
Conclusion: Prolonged preprocessing RT storage significantly impairs the engraftment activities of UCB units. The reduced engraftment in secondary transplants coupled with the results from the LD assays suggest that this engraftment deficit origins from loss of HSC numbers. Our results stress the importance of rapid UCB processing to avoid loss of engraftment activity.
C76‐A03M
Acoustic Microfluidic Separation of Blood Components
Charles Lissandrello, Ryan Dubay, Kenneth Kotz and Jason Fiering*
Draper
Background/Case Studies: New cell therapies require efficient and automated methods for purification of target cells prior to subsequent processing. While apheresis, density gradient centrifugation, and magnetic separation achieve some of the requirements, no method is currently available that fully meets clinical needs for a closed, automated, and scalable process. Continuous acoustic separation in microchannels is emerging as a versatile method for sorting, separating, and concentrating cells from blood. It has advantages over centrifugation because it is scalable to small or large quantities and can discriminate cells by size as well as density. Meanwhile, unlike magnetic methods, acoustophoresis is “label free” and adds no reagents to the therapeutic cells.
It has been shown previously that acoustic separation can separate blood components including purification of lymphocytes. However, these studies used devices that were constructed from silicon or glass and have limited potential for scale‐up or production as disposable cartridges. In contrast, we report the first ever demonstration of acoustic lymphocyte enrichment along with RBC and platelet depletion in a disposable plastic chip, and we present a cartridge concept that enables clinical scale throughput by linking microchannels in parallel.
Study Design/Method: Acoustophoresis uses ultrasonic waves to oscillate a rectangular microchannel having a cross section on the scale of the ultrasonic wavelength (∼1mm). This results in an acoustic force across the channel that drives cells toward the axial center stream. Because the force increases with a cell's size and density, lymphocytes experience a weaker force than RBCs and other classes of WBCs. Thus, as blood product flows through the device, the lymphocyte population is enriched at the sides of the channel and can be captured in a branching outlet. Likewise, platelets can by separated from lymphocytes. Initial and output cell counts are measured by a standard hematology analyzer.
Results/Finding: In our acoustic system, lymphocyte purity (% of total WBCs) was enriched up to 97%, using leukapheresis product as the starting material. This enrichment was achieved in a single pass through the device (residence time of 1sec). Total lymphocyte recovery was 43% and monocyte concentration was reduced 76%. Furthermore, in a two‐pass process platelets were reduced by 75%. In a 12‐fold parallel system we tested RBC separation from plasma and achieved 90% separation at 72ml/hr.
Conclusion: Acoustic lymphocyte enrichment along with platelet depletion from standard blood product was demonstrated for the first time in plastic microchannels. Such disposable devices are suitable for scale up to clinical bioprocessing systems. Lymphocyte purity is comparable to existing methods with the advantage of monocyte and platelet depletion and potential for an automated instrument.
C77‐A03M
Natural Killer Cell Infusion Reactions ‐ a Retrospective Review
Stephanie Kinney*1, Jeffrey Miller2, Sarah Cooley2, Katelyn Tessier2, Todd De For2 and David H McKenna2
1Department of Laboratory Medicine and Pathology, University of Minnesota, Minneapolis MN, Minneapolis, MN, 2University of Minnesota
Background/Case Studies: The use of natural killer (NK) cells as a cellular immunotherapy has increased over the past several years, specifically their use in patients with hematologic malignancies. NK cells have been used at our institution for the past 15 years. Most patients have a reaction with NK cell infusion with some reactions being quite severe. We retrospectively analyzed the reactions associated with NK cell infusions to help address why some patients have more severe reactions than others.
Study Design/Method: Retrospective chart review of NK cell infusions performed at our institution from 9 clinical protocols from 2008‐2016. An infusion reaction was defined as any symptom from the time of NK cell infusion up to 4 hours afterwards. A severe reaction was defined as any symptom with Grade 3 or higher severity (graded on Common Terminology Criteria for Adverse Events‐ CTCAE). Preliminary data was analyzed using R 3.3.1. Two major endpoints of interest were: 1) infusion reaction with any symptom and 2) severe infusion reaction. To numerically summarize the association of continuous variables with our endpoints, the median, (range) and interquartile range (IQR) were used. A Wilcoxon test was performed to test the association between the continuous variables and our end points. A Chi‐Square test was used to test the association between categorical variables and our endpoints of interest.
Results/Finding: There were a total of 127 NK cell infusions. There were 119 (94%) patients with an infusion reaction of any symptom and there were 37 (29%) patients with a severe reaction. Infusion rate (mL/min) was similar among those with any reaction (median=2.55, p=0.42) and those with severe reaction (median=2.52, p= 0.42). Infusion rate (mL/min/kg) was also similar among those with any reaction (median=0.03, p=0.43) and those with severe reaction (median=0.03, p=0.15 respectively). Incubation of NK cell product overnight in IL‐2 vs IL‐15 had similar reaction rates for those with any symptom (88% had reaction with IL‐2, 86% had reaction with IL‐15, p=0.94) and those with severe reaction (28% had severe reaction with IL‐2, 24% had severe reaction with IL‐15, p=0.80). Patients with severe reaction had a higher calculated monocyte dose (monocytes/kg) in the NK cell product (median=2.44 x 10^7) versus those without (median=1.92 x 10^7, p=0.02).
Conclusion: Our preliminary data analysis reveals that a higher number of monocytes in the NK cell product may contribute to severe infusion reactions, causing patients to have a grade 3 or higher symptom. Limitations to this study include this was a retrospective review at a single institution.
C78‐A03M
A Streamlined Mixed Lymphocyte Reaction (MLR) Assay for Evaluation of Human Mesenchymal Stem Cell Immunomodulation Activity
Christopher P Delavan1, Maryanne C Herzig*1, Barbara A Christy1, James A. Bynum2 and Andrew P Cap2
1US Army Institute of Surgical Research, 2U.S. Army Institute of Surgical Research
Background/Case Studies: Mesenchymal Stem Cells (MSC) have been investigated for treatment of acute respiratory distress syndrome (ARDS), graft versus host disease (GVHD), wound healing and trauma. A consensus is building that the immunomodulation by MSCs is key to their therapeutic potential. MSCs suppress peripheral blood mononuclear cells (PBMC) proliferation in vitro, suggesting a correlation for suppressing PBMC inflammatory responses in vivo. Current mixed lymphocyte reaction (MLR) assays generally rely on either direct co‐culture or indirect culture using transwell systems for monitoring the proliferation of isolated PBMCs in the presence of mitotically inactive MSCs. In the study detailed here, MSCs are analyzed in a direct co‐culture with PBMCs using a luminescent ATP assay.
Study Design/Method: Blood was obtained from an in house blood bank and PBMCs were separated by centrifugation over Ficoll‐Paque in LeucoSep tubes as specified by the manufacturer. The pooled donor PBMCs were stored at ‐80. MSCs derived from bone marrow, adipose tissue or umbilical cord (BM‐MSC, Ad‐MSC, UC‐MSC, respectively) or human umbilical cord endothelial cells (HUVEC) were serially diluted starting at 50‐60,000 cells/well and cultured in 96 well plates for 4‐48h in their respective medias. On Day 0, MSCs were washed, resuspended in PBMC media and incubated with or without 150,000 freshly thawed PBMCs/well, in the presence or absence of phytohemagglutinin A (PHA, 0‐5 μg/ml). Proliferation of both MSCs and PBMCs was assessed in triplicate wells by quantitation of ATP levels using the bioluminescent reagent Cell Titer‐Glo (Promega).
Results/Finding: PBMC proliferation in response to PHA gave a robust ATP signal by 72h, with >6 fold increase over control PBMCs. No increase in ATP response or proliferation was seen in the absence of PHA. Co‐culture with MSCs inhibited PBMC proliferation dependent upon MSC passage, source, MSC media additive. Intra‐assay variance of triplicate samples was 10.0%. Inter‐assay variation of MSC preps run under identical conditions was 7.5%. Inhibition of PBMC proliferation was graded from 0‐100% over the range MSC concentrations therefore an EC50 of MSC cell number resulting in 50% suppression of PBMC could be determined for each MSC prep. This EC50 however was dependent upon PBMC donor pool.
Conclusion: Direct co‐culture of live MSCs with freshly thawed PBMCs give a robust determination of immunosuppression by MSCs. Graded responses can be determined, allowing comparison of potency between MSC preparations. This streamlined assay can be performed within 72h, without irradiating cells and with minimal equipment outlay.
Clinical Oral Abstract Session: Donor Iron and Cardiac Evaluation
C79‐A04A
Elevated Risk for Iron Depletion in High School Blood Donors
Bryan R. Spencer*1, Walter Bialkowski2, Ritchard G. Cable3, Joseph E. Kiss4, Darryl Creel5, Mars Stone6, Christopher McClure5, Steve Kleinman7, Simone Glynn8, Alan Mast9 and for the NHLBI Recipient Epidemiology and Donor Evaluation Study‐III (REDS‐III)10
1American Red Cross, 2Bloodcenter of Wisconsin ‐ West Bend Donor Center, 3American Red Cross Blood Services, 4Blood Systems Inc., 5RTI International, 6Blood Systems Research Institute, 7University of British Columbia, 8NIH/NHLBI, 9Blood Research Institute, 10NHLBI
Background/Case Studies: A high prevalence of iron depletion (ID) in blood donors has been documented by recent studies, but none targeted high school aged donors, who consistently contribute 10% or more of the US blood supply. Differences between donors 16‐18 years old (yo) and adults in baseline and donation‐altered iron status are important to understand because teenagers need increased iron for physiological growth and development and may be more susceptible to harm from iron depletion.
Study Design/Method: Donors aged 16‐49 were eligible for ferritin testing if they donated at a high school (HS) blood drive at the start of the 2015/16 academic year at two blood centers. Samples from return donations over the remainder of the school year were also tested. The prevalence of Absent Iron Stores (AIS, ferritin <12 ng/ml) and Low Ferritin (LF, ferritin <26 ng/ml) were estimated for 16, 17, 18 and 19‐49yo groups separately for both genders. Linkage to operational databases established first‐time (FT) vs repeat (RPT) donor status. Linear regression analysis tested for differences in natural log of enrollment ferritin values by age. Multiple logistic regression assessed whether young age independently predicts iron depletion controlling for donation frequency and other factors.
Results/Finding: A total of 4265 donors contributed 6219 donations. Donors were evenly split by gender, 66% were FT donors, and 87% were 16‐18yo. FT and RPT 16‐18yo donors had on average lower ferritin values at enrollment (p<.0001), and a greater percentage were iron‐depleted than donors 19‐49yo (Table). In repeated measures logistic regression analysis using data from all visits, female sex, greater number of previous donations, shorter interval since last donation, and lower body weight were risk factors for both AIS and LF. Controlling for these covariates, donors aged 16‐18 have sharply higher risk for iron depletion than donors 19‐49yo. Odds for LF were 4 to 6 times greater in the younger donors, and for AIS were 3‐ to 4‐fold higher. Preliminary statistical models indicate 16yo donors may have greater risk for LF than 17 or 18yo by 4 to 5 percentage points, controlling for other factors (p=.06).
Conclusion: The prevalence of iron depletion varies markedly by age, sex, and donation frequency, but was considerably higher in 16‐18yo donors than in adult controls. Logistic regression analysis confirms lower age as an independent risk factor for iron depletion. Blood centers should implement measures to mitigate higher risk for iron depletion and the potential adverse consequences for this population of vulnerable donors.
TABLE. C79‐A04A: Iron status at first visit by sex, age, and prior donation history (ferritin in ng/mL)
| Female | Male | ||||||
|---|---|---|---|---|---|---|---|
| Median | % Ferr < 12 | % Ferr < 26 | Median | % Ferr < 12 | % Ferr < 26 | ||
|
First‐ time Donors |
16 | 24 | 17% | 53% | 53 | 3% | 12% |
| 17 | 24 | 19% | 52% | 58 | 1% | 9% | |
| 18 | 26 | 15% | 49% | 63 | 1% | 8% | |
| 19‐49 | 40 | 7% | 28% | 138 | 0% | 1% | |
| Repeat Donors | 16 | 15 | 29% | 74% | 45 | 7% | 23% |
| 17 | 17 | 33% | 71% | 38 | 9% | 32% | |
| 18 | 20 | 32% | 61% | 37 | 8% | 30% | |
| 19‐49 | 26 | 24% | 49% | 67 | 6% | 14% | |
C80‐A04A
Mitigation of Iron Deficiency in Young Donors – a Preliminary Report
Ralph R Vassallo*, Marjorie D Bravo, Mary Townsend and Hany Kamel
Blood Systems, Inc.
Background/Case Studies: Iron deficiency is observed in blood donors who meet regulatory hemoglobin (Hb) requirements for blood donation. Frequent donations result in negative iron balance and eventually lead to anemia. Young donors may be at risk for adverse health consequences (cognitive dysfunction, pregnancy‐related complications, fatigue, decreased exercise endurance and pica) even before anemia occurs.
Study Design/Method: Serum ferritin testing was implemented on 12/19/2016 by a large blood collector. Testing was performed on successful 16‐18 y/o whole blood and apheresis donations. Low ferritin (LF) was defined as a value < 20 ng/mL in females (F) and < 30 ng/mL in males (M). Donors with low ferritin were notified of deferral from red blood cell (RBC) donations (12 months for F and 6 months for M) and counseled to take 18‐28mg of elemental iron daily for 60 days. For M and F, a ferritin < 12 ng/mL indicated absent iron stores (AIS) and < 26 ng/mL indicated iron deficient erythropoiesis (IDE). Ferritin levels ≥ 20 ng/mL in F and ≥ 30 ng/mL in M were considered as indicating an iron‐replete state.
Results/Finding: Through 3/31/2017, 26,746 donations were tested (Table), 12% of successful donations by all ages. The overall rates of AIS and IDE were 10.5% (2.6% of M and 17.9% of F) and 34.7% (14.6% of M and 53.6% of F) respectively. Deferral rates of 18.9% in M and 39.6% in F were observed. The proportion of iron‐replete donors increased with increasing pre‐donation Hb measurements. At the lowest acceptable Hb level for M, 65% of donors have a ferritin ≥ 30 (70% ≥ 26). At the lowest acceptable Hb level for F, 46% of donors have a ferritin ≥ 20 (33% ≥ 26). For ∼80% of tested individuals to have ferritin above the IDE level, M needed a Hb ≥ 14g/dL; this was not observed at any F Hb value. For M and F donors, 53% had no RBC donations in the prior 24 months: LF was identified in 7% and 28% of M and F respectively (data not shown). The proportion of donors with LF increased with increasing number of RBC units donated in the prior 24 months, doubling with an average of 1 RBC per year in F and quadrupling in M.
Conclusion: Ferritin testing of young donors identified individuals with LF who would benefit from risk mitigation, e.g., delaying subsequent RBC donations and/or taking iron supplements. LF is more common in F than in M donors. LF is more prevalent in M and F donors with any RBC donations in the prior 24 months. An appreciable number of donors with no RBC donations in the prior 24 months presented with LF. These data may be useful in conducting a risk‐based decision making exercise to establish recommendations for risk mitigation which could be different for M than for F, e.g., universal iron replacement in teen male donors may not be warranted above a certain Hb value.
C81‐A04A
Ferritin Blood Screening in Minor or Young Adult Donors
Jennifer L Ritter*1, Joan Williams1, Michelle Humphries1, Nancy Haubert1, Ben Reynolds1, Michael Phillips1, Randall Spizman1, Ralph R Vassallo2, Hany Kamel2, Sally Caglioti1, German Leparc1,3 and Phillip C Williamson1
1Creative Testing Solutions, 2Blood Systems, Inc., 3OneBlood
Ferritin Blood Screening in Minor or Young Adult Donors
Background/Case Studies: One unit of whole blood removes approximately 200‐250mg of iron. Iron stores in men average 1000mg but in women the average iron store is 300mg. Studies of iron depletion in adults suggest similar effects in minor or young adult donors, although this has not yet been completely investigated. The adolescent growth spurt, poor nutrition and onset of menses increase the risks of iron depletion in young donors.1 New studies show that teenage donors who give blood frequently may be more susceptible to becoming iron deficient than older repeat donors.2
Study Design/Methods: Over 28,000 serum samples from donors aged 16, 17 and 18 years were analyzed for ferritin levels using the Beckman Coulter AU680 instrument and reagent kit. The anti‐ferritin reagent is a suspension of polystyrene latex particles, of uniform size, coated with polyclonal rabbit anti‐ferritin antibody. Immune complexes formed in solution scatter light in proportion to their size, shape and concentration. The decrease in light intensity is measured spectrophotometrically.3
Results/Findings: Table 1 shows 2982 of 28528 (10.4%) of samples tested had ferritin results <12 ng/mL; 4089 of 28528 (14.3%) of samples tested had ferritin results 12‐19 ng/mL; 4645 of 28528 (16.3%) of samples tested had ferritin results 20‐29 ng/mL; 16812 of 28528 (59%) of samples tested had ferritin results 30‐450 ng/mL. A level less than 20 ng/mL (female) or 30 ng/mL (male) indicates the donor's iron stores are low. A level less than 12 ng/mL indicates the donor's iron stores are absent.
| <12 ng/mL | 12‐19 ng/mL | 20‐29 ng/mL | 30‐450 ng/mL | Total | |
|---|---|---|---|---|---|
| 1/2017 | 919 | 914 | 1040 | 3880 | 6753 |
| 2/2017 | 1030 | 1558 | 1685 | 6108 | 10381 |
| 3/2017 | 1033 | 1617 | 1920 | 6824 | 11394 |
| Total | 2982 | 4089 | 4645 | 16812 | 28528 |
Conclusion: Approximately one‐quarter (7071 of 28528 or 25%) of donors aged 16, 17, or 18 years had ferritin levels indicating low or absent iron stores on the day of donation. Although the donation deferral period for these donors will be increased to 6 months or 1 year, based on gender, ongoing‐ferritin monitoring and/or restorative iron supplements may better mitigate iron deficiency caused by frequent donation.
References:
1 FDA Briefing Document : BPAC‐ Topic II: Blood Collection and Adverse Events in Teenage (16‐18 years) Blood Donors, 11/17‐18/2016
2 Troy Brown, RN , Blood Donors: FDA Meets on Iron Management, Teen Issues, Medscape, 4/27/2017
3 Beckman Coulter , Instructions for Use, Ferritin, 12/2016
C82‐A04A
Identifying Cardiometabolic Risk Among Adolescent Blood Donors
Odette Gore1, Stephen Eason2, Brittany P Boyer3, Colby Ayers4, James De lemos4 and Merlyn H Sayers*2,4
1University of Colorado Denver School of Medicine, 2Carter BloodCare, 3University of Dallas, 4UT Southwestern Medical Center at Dallas
Background/Case Studies: The risk of cardiovascular (CV) disease in adults can often be identified during adolescent years. The presence of even borderline levels of multiple risk factors increases the likelihood of a CV event. Our blood program routinely provides a total non‐fasting cholesterol (TC) and blood pressure (BP) measurement for all blood donors. We added glycated hemoglobin (HbA1c) determination and performed analyses of the prevalence of abnormal (borderline or elevated) levels of multiple risk factors among 21,007 adolescents (ages 16‐19; 61.5% female) who donated blood from 2015 to 2016.
Study Design/Method: Abnormal risk factor levels were defined as HbA1c ≥ 5.7%, SBP/DBP ≥ 120/80mm Hg and TC ≥170mg/dL, as suggested by the American Heart Association for adolescents. The presence of isolated risk factors was defined as one single abnormal risk factor per individual. Clustering of risk factors was defined as the presence of 2 or more abnormal risk factors in the same individual. Donor sex was recorded at the time of donation.
Results/Finding: Table 1 shows the prevalence of isolated abnormal risk factors and the prevalence of abnormal risk factor clustering in the study cohort. Overall, 11,283 (53.7%) adolescents had at least one abnormal risk factor (61.8% of males, 48.6% of females). Of these, 8,709 adolescents had isolated abnormal risk factors, and 2,574 adolescents had clustering risk factors. Higher proportions of males were in the abnormal BP alone, BP+TC, BP+HbA1c, and BP+TC+HbA1c groups. Higher proportions of females were in the abnormal TC alone and HbA1c alone groups.
Conclusion: A high proportion of adolescent blood donors have abnormal CV risk profiles. Clustering of risk factors was commonly observed, with higher risk profiles in male vs. female blood donors. Analyzing data from a community blood program permits identification of a significant proportion of adolescents with clustering risk factors. Screening in this manner has the potential to inform community prevention efforts.

C83‐A04A
Variations in Hemoglobin Screening and Deferral Practices across Blood Services Explain Differing Hemoglobin Deferral Rates: A Best Collaborative Study
Katja van den Hurk*1, Saurabh Zalpuri2, Bas Romeijn2, Elias Allara3, Mindy Goldman4, Hany Kamel5, Jed Gorlin6, Ralph R Vassallo5 and Emanuele Di Angelantonio3
1Department of Donor studies, Sanquin Research, 2Sanquin, 3University of Cambridge, 4Canadian Blood Services, 5Blood Systems, Inc., 6Innovative Blood Resources
Background/Case Studies: Pre‐donation determination of hemoglobin (Hb) level in candidate blood donors is a pre‐requisite in the majority of blood services and is used to ensure donor safety and blood product quality. However, a variety of Hb testing strategies are used across blood services to satisfy this selection criterion. This study aimed to identify how Hb screening practices vary across blood donation services and to what extent they influence deferral rates for low Hb.
Study Design/Method: An online survey was performed among members of the Biomedical Excellence for Safer Transfusion (BEST) Collaborative. Additionally, data from literature were used to extend the dataset. The survey involved a detailed assessment of Hb screening practices, numbers of donations and low Hb deferrals for male and female donors separately. Multivariable negative‐binomial regression models were built to estimate the adjusted effects of minimum donation intervals, Hb cutoffs (high/low with high defined as ≥13.5g/dL for men and ≥12.5g/dL for women), iron monitoring (Y/N), iron supplements (Y/N providing or prescribing), and geographical location on deferral rates due to low Hb.
Results/Finding: Data were included from 52 blood services worldwide and complete data were available for 25 blood services. Deferral percentages for low Hb varied from 0.01% to 8.81% among male donors and 0.03% to 46.73% among female donors. Hb deferral rates were notably higher in Asian blood services. Overall, iron monitoring was associated with 53% lower Hb deferral rates in men (95% Confidence Interval [CI] 11% to 75%) and 61% lower rates in women (95%CI 15% to 82%). Iron supplementation was associated to 57% lower Hb deferral rates among women (95%CI 22% to 76%) but there was no evidence of such an effect among men (p=0.680). Each one‐week increase in minimum donation intervals resulted in 8% lower Hb deferral rates among women (95%CI 1% to 14%) but not among men (p=0.454). At the 5% level of significance, higher Hb cutoffs do not appear to have an effect among men or women.
Conclusion: The variation in Hb deferral rates across blood donation services can be, particularly in female donors, explained by differences in Hb screening and deferral practices. Mitigation strategies should consider the variable response among men and women. These insights can help improve both blood service efficiency and donor care.
C84‐A04A
Factors Associated with the Recovery of Haemoglobin Levels after Whole‐Blood Donation – Haemoglobin and Return to Blood Donation of Prospective Donors in Continental France in 2015
Anne‐Marie Fillet*1, Lucile Malard1, Gilles Follea2, Rachid Djoudi3, Chantal Jacquot4, François Charpentier4, Brigitte Bonneaudeau5, Pierre Tiberghien6 and Sylvie Gross1
1Etablissement Français du Sang, Medical Department, 2Etablissement Français du Sang, Medicine Research and Innovation General Direction, 3EFS Ile de France, 4Etablissement Français du Sang, Collection and Production Department, 5Etablissement Français du Sang, Research and Technology Transfer Department, 6Etablissement Francais du Sang (French transfusion public service)
Background/Case Studies: Prevention of blood donor iron deficiency anemia is based on deferring prospective donors if haemoglobin (Hb) levels are too low. In France, Hb levels must exceed 12g/dL in women and 13g/dL in men. We conducted a study to determine characteristics of blood donors and current deferral rates, and to identify factors associated with Hb recovery between 2 consecutive whole‐blood (WB) donations.
Study Design/Method: Within all individual donors who presented to donate WB in continental France in 2015, 200,000 donors having donated at least once were selected at random. If a donor candidated several times, only the first application was kept. Donors with withdrawn volume ≤ 300ml at previous donation and with lacking data were excluded. Hb recovery, assessed on index donation, was defined as Hb reaching the level measured prior the previous donation. Median interval between previous and index donation was 30 and 21 weeks for women and men respectively. Variables were: characteristics of donors (age, sex, size, weight, region); Hb levels, date and volume of donation for index application and previous donation; and number of previous donations (in the 5 previous years and the lifetime). Data were analyzed using logistic regression stratified by sex.
Results/Finding: 9.15% of all candidates for WB donation were deferred in continental France in 2015. Deferral was significantly more frequent in women (11.16%) than in men (7.29%), due to anemia in 24.41% of deferred women and 9.79% of deferred men. Plotting mean Hb recovery against time showed mean recovery times ranging from 20 to 30 weeks.
Analysis (Table) identified 3 main factors associated with a higher likelihood of Hb recovery: higher logarithm of time since previous donation, lower levels of Hb at previous donation, higher number of blood donations in the 5 previous years.
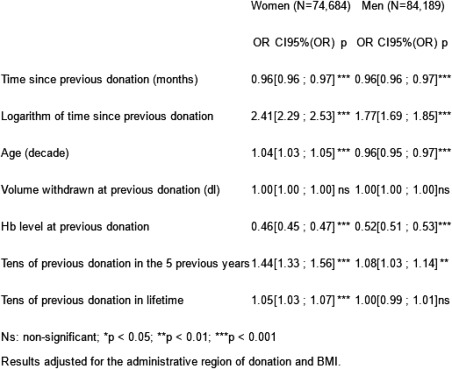
Conclusion: The 3 main factors associated with higher likelihood of Hb recovery after WB donation are probably linked with hematopoiesis stimulation and selection bias among high‐frequency donors. Mean times required for Hb recovery were long enough to require further studies to assess inter‐donation intervals in France.
Clinical Oral Abstract Session: Risk Factors for Transfusion Non‐infectious Adverse Events
C85‐A04B
Transfusion of Autologous Microvesicles from Stored Red Blood Cells Does Not Affect Coagulation in Human Recipient.
Nicole Juffermans*1, AnnaLinda Peters1, Alexander Vlaar1, Dirk de Korte2, Rienk Nieuwland1 and Robin van Bruggen3
1Academic Medical Center, 2Department of Blood Cell Research, Sanquin Research, 3Sanquin Research and Landsteiner Laboratory
Background/Case Studies: Red blood cell (RBC) transfusion has been related to thrombo‐embolic events. Microvesicles in the RBC product may support coagulation, which in part may depend on storage time because microvesicles have procoagulant effects in vitro and the amount of microvesicles increase with storage duration.
Study Design/Method: We investigated whether transfusion of RBCs containing microvesicles promotes coagulation in human recipients. As transfusion is mostly administered to ill patients, we used a model of mild endotoxemia. Eighteen healthy volunteers were randomized to receive either saline, 2 days stored or 35 days stored autologous RBC transfusion two hours after infusion of lipopolysaccharide (LPS, from E.coli, 2 ng/kg). Blood was sampled every 2 hours up to 8 hours after LPS infusion.
Results/Finding: LPS resulted in a mild increase in thrombin generation. During storage, the total number of microvesicles increased from 1.4e+08 (IQR 8.3e+07‐1.9e+08) /ml in the fresh product to 1.7e+10 (IQR 7.9e+09‐2.3e+10/ml; p<0.01) in the stored product (p <0.001), which were mostly RBC derived vesicles. After transfusion, microvesicles from stored RBC products, but not from fresh products, could be detected in the circulation of healthy volunteers and were cleared within 6 hours. However, infusion of stored RBC microvesicles did not augment thrombin generation. Levels of D‐dimer and thrombin‐antithrombin complex were also unaffected.
Conclusion: Transfusion of autologous RBCs containing high levels of microvesicles does not enhance coagulation in human volunteers with mild endotoxemia.
C86‐A04B
Risk Factors and Outcomes of Transfusion‐Associated Circulatory Overload during a Period of Decreased Blood Utilization
Nareg Roubinian*1, Jeanne Hendrickson2, Darrell Triulzi3, Jerome Gottschall4, Michael Michalkiewicz5, Dhuly Chowdhury6, Daryl Jon Kor7, Mark R Looney8, Michael Matthay8, Steve Kleinman9, Donald Brambilla6 and Edward Murphy10
1Blood Systems Research Institute, 2Yale University, 3Institute For Transfusion Medicine, 4Blood Center of Wisconsin, Inc, 5Aurora Research Institute, 6RTI International, 7MAYO, 8UCSF, 9University of British Columbia, 10Blood Centers of the Pacific‐Irwin Center
Background/Case Studies: Transfusion‐associated circulatory overload (TACO) is characterized by hydrostatic pulmonary edema related to blood transfusion. We sought to examine contemporary risk factors and outcomes for TACO during a period where patient blood manaement has led to declines in blood utilization.
Study Design/Methods: At four academic hospitals, cases of TACO were detected by active surveillance of all adult hospitalized patients who received a blood transfusion, and transfused controls were matched to cases by transfusion intensity. TACO incidence was calculated, and clinical characteristics were compared with control patients. Odds ratios (OR) were calculated using multivariable logistic regression. Hospital mortality and length of stay were modeled using cumulative incidence functions in proportional hazards regression.
Results/Findings: 200 cases of TACO and 405 matched controls were enrolled from 20,845 transfused patients who received 128,263 blood components from May 2015 until July 2016. TACO incidence was 1 case per 100 patients transfused. In addition to well described cardiac and renal comorbidities, multivariable analysis identified the following independent predictors of TACO: number of plasma units, emergency surgery, pre‐transfusion diuretic use, and higher post‐transfusion hemoglobin levels (See Table). Compared to controls, TACO cases were more likely to require mechanical ventilation (71% vs. 49%; p < 0.001), experienced longer intensive care (4 vs. 3 days; p=0.04) and hospital length of stay following transfusion (10 vs. 7 days; p< 0.001), and had higher mortality (21% vs. 11%; p=0.02).
Conclusion: The incidence of TACO was lower than what has been reported by prior active surveillance studies. Despite declines in its incidence and the number of blood components transfused per case, TACO remains a complication of transfusion with significant associated morbidity and mortality. In addition to risk factors for cardiovascular and kidney disease, plasma transfusion and higher post‐transfusion hemoglobin levels were associated with TACO after controlling for other covariates in the model. Additional research is needed to examine the utility of these risk factors in the development of real‐time predictive algorithms and the benefit of reduced erythrocyte or plasma exposure in patients at high risk for TACO.
| Multivariable analysis evaluating risk factors for TACO versus control status | |||
|---|---|---|---|
| Characteristic | Odds Ratio | 95% CI | P‐value |
| History of congestive heart failure | 2.0 | 1.1‐3.6 | 0.02 |
| History of coronary artery disease | 1.8 | 1.1‐3.0 | 0.02 |
| Acute renal failure | 1.9 | 1.1‐3.3 | 0.02 |
| Liver failure | 2.4 | 1.3‐4.2 | <0.01 |
| Emergency surgery | 1.9 | 1.1‐3.2 | 0.02 |
| Fluid balance in the 6 hours prior to TX (per liter) | 1.4 | 1.2‐1.7 | <0.001 |
| Hemoglobin level > 9g/dL following TX | 3.0 | 1.7‐5.3 | <0.001 |
| # of plasma units in 6 hours (per unit) | 1.2 | 1.1‐1.3 | 0.02 |
| Abnormal electrocardiogram prior to TX | 2.0 | 1.2‐3.3 | <0.01 |
| Use of diuretics pre‐TX | 2.5 | 1.4‐4.4 | <0.01 |
| Hypertension prior to or at the time of TX | 1.7 | 1.1‐2.7 | 0.02 |
| Cardiomegaly on chest x‐ray prior to TX | 2.0 | 1.1‐3.6 | 0.03 |
C87‐A04B
A Multi‐Center Study Investigating Vital Sign Changes Occurring in Complicated and Uncomplicated Transfusions
Eric Gehrie*1, Nareg Roubinian2, Dhuly Chowdhury3, Donald Brambilla3, Edward Murphy4, Jerome Gottschall5, Yanyun Wu6, Paul M. Ness1, Ronald G Strauss7 and Jeanne Hendrickson8
1Johns Hopkins University School of Medicine, 2Blood Systems Research Institute, 3RTI International, 4Blood Centers of the Pacific‐Irwin Center, 5Blood Center of Wisconsin, Inc, 6Bloodworks Northwest, 7ITXM, 8Yale University
Background/Case Studies: Trainees are taught that vital signs are just that: vital. As such, hospitals frequently maintain policies requiring transfusions to be discontinued when vital signs fall outside of predetermined ranges. However, the ability of vital signs to determine whether or not an adverse reaction to transfusion is occurring is not well established. Vital sign changes associated with uncomplicated transfusions are not well described in the medical literature, and almost no data describing vital sign changes during adverse events are published.
Study Design/Method: A retrospective record review was completed on a random sample of ∼200 inpatient transfusion episodes each month for 6 months at each of 4 academic tertiary care hospitals (total ∼4800 episodes). Vital signs pre‐ and post‐transfusion were recorded by trained clinical research nurses, and serious reactions were adjudicated by a panel of transfusion medicine experts. The distribution of pre‐transfusion vital signs was compared using the Wilcoxon rank‐sum test, and changes in vital signs over the transfusion period were compared for each vital sign and group.
Results/Findings: In both uncomplicated transfusions (>98%) and those including an adverse reaction (<2%), vital sign fluctuations were generally modest with most transfusions resulting in changes of <0.5ºC in temperature, <5 beats per minute of pulse, essentially no change in respiration rate, <10 mmHg of systolic blood pressure, and <5 mmHg of diastolic blood pressure. Pre‐transfusion temperature (37.1ºC) and pulse rate (98.5 bpm) were higher in the 0.62% of patients that developed febrile reactions compared to those with uncomplicated transfusions (T36.8 ºC and 86 bpm), p=0.0003 and 0.0002 respectively. Pre‐transfusion respiratory rate (20/min) was also higher for the 0.8% of patients with TACO compared to those with uneventful transfusions (18/min), p=0.028. By multi‐variate analysis, the only statistically significant vital sign changes noted over the course of the transfusion were an expected increase in temperature and pulse rate in febrile reactions.
Conclusion: This study provides the largest amount of vital sign data to date for uncomplicated transfusions by component type, in a diverse patient population at 4 academic medicals across the US. The small number of reactions that occurred over the study period prevents broad conclusions, and it is plausible that medications and mechanical ventilator support may have obscured vital sign changes. Additional investigation is needed into whether pre‐transfusion vital signs may be an important – yet potentially underutilized ‐ predictor of vital sign changes during transfusion.

C88‐A04B
The Supernatants from Stored Red Blood Cell Units Activate Liver Sinusoidal Endothelium
Susan Kuldanek*1,2, Marguerite Kelher3,4, Timothy Burke3,4 and Christopher C. C Silliman1,2,3,4
1Center for Cancer and Blood Disorders, 2Department of Pediatrics, 3Bonfils Blood Center, 4Department of Surgery
Background/Case Studies: Transfusion is a life‐saving intervention, and may be associated with significant morbidity in critically ill patients. Although the mechanisms underlying transfusion related acute lung injury (TRALI) have been well investigated, little is known about liver injury in the setting of massive transfusion. The current study was designed to test the hypothesis that the supernatant from stored red blood cells (RBCs) induce pro‐inflammatory activation of post‐venule liver sinusoidal endothelial cells (LSECs), resulting in neutrophil (PMN) adhesion and predisposition to liver injury.
Study Design/Method: RBC units were collected followed by pre‐storage leukoreduction, processed per industry standards and stored in AS‐3. Cell‐free supernatants from days (D) 1, 21, 28, or 42 of storage were applied to LSECs at concentrations approximating the transfusion of >4, >8 and >16 RBC units. LSEC intracellular adhesion molecule‐1 (ICAM‐1) surface expression was measured with fluorescently labeled monoclonal antibodies to ICAM‐1 via flow cytometry. PMN adherence to LSECs was assessed on cellular lysates by the measurement of myeloperoxidase (MPO) via spectrophotometry at 405nm.
Results/Finding: ICAM‐1 expression was increased in LSECs exposed to D42 supernatants at all concentrations (10‐40%) compared with media and the day 1 supernatants. Increased ICAM‐1 expression was also observed with D21 and D28 supernatants, both at 10% and 40%, compared to media controls or day 1 supernatants. Supernatants (10%‐40%) from D42 RBCs significantly increased PMN adherence to LSECs, compared to media alone. Lipoxin A4 [100nM], a naturally occurring eicosanoid antagonist, inhibited the 40% D42 PRBC increased ICAM‐1 surface expression by 67 ± 10% (p<.05).
Conclusion: Transfusion‐induced liver injury is likely a two‐step process and may only occur in the setting of massive transfusion. The first event is a pro‐inflammatory insult inducing endothelial activation, which primes PMNs eliciting firm adherence. A second insult then may activate these primed, adherent, hyperactive PMNs leading to PMN‐mediated endothelial damage. At concentrations approximating massive transfusions, stored RBCs elicit pro‐inflammatory activation of LSECs and could serve as the first event in a two‐step process of transfusion‐induced liver injury.
C89‐A04B
A Hospital‐Based Retrospective Cohort Hemovigilance Study of 828 INTERCEPTTM Platelet Transfusions
Inga Gurevich*1, Nicole Draper1, Joel Kniep1, Samantha Mack2, Dianna Pruden3 and Mary Berg1
1University of Colorado, 2Bonfils Blood Center, 3University Hospital
Background/Case Studies: A photochemical treatment process with amotosalen and UVA light (INTERCEPTTM Blood System) has been developed and successfully used for inactivation of pathogens and white blood cells that might contaminate blood components used for transfusion. A retrospective cohort study was designed in order to further characterize the safety profile of platelet (INTERCEPTTM Platelet System) component transfusions in a hospital setting.
Study Design/Method: An open retrospective cohort hemovigilance study was carried out in a university‐based hospital setting. INTERCEPTTM Platelet components (IPC) for transfusion were received from the regional blood center. Medical records of patients transfused with IPC from July 2016 to April 2017 were analyzed in order to determine safety data for each IPC administered.
Results/Finding: Data for 202 patients with 828 IPC administered was analyzed. The majority of the patient population was male (64.4%) with the overall cohort mean age of 56.3 years (range <1 – 88) and median of 56.6. Of these, 112 (55.5%) patients received multiple IPC transfusions (2‐44). The major clinical indications for IPC transfusions were hematological disorders (32.2%) followed by cardiovascular surgeries (23%), liver transplantation (18.5%), and neurosurgery (9%).A total of 810 (97.8%) transfusions and 186 (92%) patients had no reported reactions. Eighteen (2.2%) transfusions were associated with acute adverse reactions (ATAR), and 11 (1.3%) were related to the IPC transfusion. The other 7 were thought not to be transfusion‐related. Adverse events occurred in 16 (7.9%) patients, but in only 10 (5.0%) patients was an IPC transfusion established as a cause. Out of 11 IPC ATAR, 6 (0.7%) were allergic reactions, 4 (0.5%) ‐ febrile nonhemolytic and one (0.1%) – acute hemolytic event (due to anti‐A antibodies in a group O IPC given to a group A patient). The most common clinical symptoms or signs of IPC‐associated transfusion reaction were urticarial lesions, chills, fever, dyspnea, nausea and hypotension. No episodes of IPC transfusion‐related acute lung injury were detected. The surgical patients who received IPCs had no indications in their records that any unexpected coagulopathy or excessive bleeding was associated with the transfusion.
Conclusion: In our study, 97.8 percent of transfusions did not reveal reactions attributed to INTERCEPT platelet transfusion. Thus INTERCEPT platelets demonstrate a low rate of acute adverse transfusions reactions and reveal a safety profile similar to conventional platelet components.
Clinical Oral Abstract Session: Transfusion Transmitted Diseases ‐‐ Bacteria and Parasites
C90‐A04C
Bacterial Screening of Apheresis Platelets with a Rapid Test‐ an 8 Year Single Center Experience
Nancy M. Dunbar* and Zbigniew M. Szczepiorkowski
Dartmouth‐Hitchcock Medical Center
Background/Case Studies: The residual risk of bacterial contamination of single‐donor apheresis platelets (AP) was recently addressed by the March 2016 FDA draft guidance to enhance the safety of platelet transfusion. This document also describes an existing pathway for AP outdate extension from 5 to 7 days using an FDA cleared rapid test (RT). Our hospital based transfusion service has used this RT to enhance the safety of AP transfusion since July 2008 and to routinely extend AP outdate to day 7 since February 2016. This study reports a 103 month experience of secondary screening of AP using a RT.
Study Design/Methods: All AP were obtained from our hospital‐based donor center or one of four external suppliers. AP were screened by culture based methods post‐collection and prior to entry into our inventory. From July 2008‐January 2016, AP underwent RT on day 4. Day 6 and 7 units were transfused with physician approval when deemed medically necessary. Any units remaining in inventory on Day 8 had a second RT performed. From February 2016‐January 2017, AP underwent RT on day 5 with routine outdate extension to 7 days by performing a second RT on day 6 and a third RT on day 7, as per manufacturer instructions. Any positive RTs were repeated in triplicate. Repeat RT positive units were quarantined and cultured to identify true positives. False positives (FP) were defined as repeat RT negative (type 1) or repeat RT positive with negative confirmatory culture (type 2). All RT results were reviewed during both study periods. AP transfusion and outdate rates were also summarized.
Results/Findings: Since July 2008, 20,010 AP were entered into inventory. Of these, 11,840 (59%) were transfused prior to RT testing. The remaining 8170 (41%) underwent RT on day 4 or day 5. Of these 43 (0.5%) were RT positive (29 type 1 FP, returned to inventory; 14 type 2 FP, discarded), leaving a total available inventory of 8156 units tested by RT. Of these, 5631 (28% of original inventory) were transfused before the end of day 5 and the remaining 2525 (13% of original inventory) reached a day 5 outdate. A total of 1561 (8% of original inventory) were transfused on day 6 or day 7. Of these, 768 underwent a second RT on day 6 (2 RT positives; 1 FP type one and 1 FP type 2) and 233 underwent a third RT on day 7 (no positive results). A total of 964 (5% of original inventory) outdated on day 7. Of these, 754 underwent a second RT on day 8 (no positive results).
Conclusion: To date we have performed 9925 RTs on AP at our hospital. No true positives have been identified. Use of RT over the study period decreased our outdate rate from a predicted 13% to only 5%. A total of 1522 AP have been tested twice by RT (768 on day 5 and 6; 754 on day 4 and 8) with 2 (0.1%) positive results, both of which were deemed FP by repeat testing or culture. A total of 233 units have been tested 3 times (day 5, day 6 and day 7) with no additional positives identified. We have not yet identified any units with an initial negative RT result that subsequently converted to a true positive. There is a low FP rate which should also be expected when performing repeat testing on the same unit. These data suggest that the yield for repeating the RT every 24 hours, as currently specified by the manufacturer instructions, is quite low. Additional studies are needed to clarify how RT can optimally be used to enhance detection of AP bacterial contamination.
C91‐A04C
Survival of Trypanosoma Cruzi in Human Blood Components
Laura Tonnetti*, Aaron Thorp and Susan L Stramer
American Red Cross
Background/Case Studies: Trypanosoma cruzi, the agent of Chagas disease, is associated with 8 to 10 million infections worldwide, mostly in Latin America. Despite the extensive immigration from endemic areas, only 5 cases of transfusion‐transmission (TT) T. cruzi have been reported in the US, before blood donor screening was implemented in 2007. Contributing factors to the low number of TT cases are a possible association between parasite lineage and TT, and high numbers of unreported cases. Platelets are almost exclusively involved in T. cruzi TT cases; however, during preparation of components a large fraction of the parasites can be found in red blood cells (RBCs). We investigated if blood component preparation and storage time affect the survival of the parasite and thus play a role in TT of T. cruzi.
Study Design/Method: Whole blood (WB) units were spiked with T. cruzi trypomastigotes to a final concentration between 10‐10,000 parasites/mL. Each parasite concentration in WB was tested x2. An aliquot of contaminated WB was used to prepare hemocultures to detect live parasites before preparation of components. RBCs were separated and half of the components leukoreduced (LR) by filtration. Platelets and plasma were separated, along with one aliquot of plasma collected before LR. RBCs were stored at 4°C for up to 42 days; platelets were stored at 22°C (RT) under agitation for 5 days and plasma was frozen at ‐20°C. Aliquots for culture were removed weekly from RBCs, daily from platelets and after 30 days from frozen plasma. All samples were cultured in Liver Infusion Tryptose (LIT) media at 27°C for detection of live parasites for up to 16 weeks.
Results/Finding: Hemocultures from spiked‐WB were positive at all concentration of parasites. LR'd and non‐LR'd RBCs cultured before storage were positive at all concentrations. After storage at 4°C, RBCs from all units spiked with 10,000 parasites/mL were positive for up to 21 days; all further times yielded negative results. At lower concentrations, only non‐LR'd RBCs spiked with 1000 parasites/mL were positive for up to 7 days. Plasma samples cultured before freezing were positive at the highest concentration in one non‐LR'd sample, while all others were negative. Platelets obtained from WB spiked with 10,000 and 1000 parasites/mL were positive up to 5 days at RT. No parasites were observed in plasma or platelets prior to storage at lower concentrations. Molecular analysis to determine the presence of parasite DNA in each component is on‐going.
Conclusion: Platelet storage conditions offer a suitable environment for T. cruzi survival; however, high concentrations of parasites also survived in RBCs at 4°C for up to 3 weeks. Leukoreduction offers partial protection, while freezing conditions appears unsuitable for T. cruzi survival.
C92‐A04C
Hemovigilance Monitoring of Platelet Septic Transfusion Reactions (STR) after Treatment with INTERCEPTTM Pathogen Reduction or Large Volume, Delayed Bact/ALERTTM Bacterial Culture Screening
Richard Benjamin*1, Marion Lanteri2 and Larry Corash1
1Cerus Corporation, 2Scientific Affairs Department, Cerus Corporation
Background/Case Studies: Amotosalen/ultraviolet A (UVA) light (INTERCEPT™ Blood System, Cerus Corporation) pathogen reduction (PR) and delayed, large volume, bacterial culture with the BacT/ALERT™ System (DLVBC) (BioMerieux, Inc) represent respective best‐in‐class systems to reduce the risk of STR associated with platelet concentrates (PC). Where implemented, hemoviligance (HV) programs continue to receive reports of suspected STR, most of which have low imputability as other causes are more likely or insufficient information is available to impute system failure.
Study Design/Methods: United Kingdom (2006‐2015), French (2006 ‐2015), Swiss (2011 ‐ 2015), and Belgium(2009 ‐2015) HV reports, and Cerus Corporation's adverse event records were reviewed to assess the residual risk and imputability of STR with amotosalen/UVA‐treated or DLVBC‐screened PC.
Results/Findings: Approximately 1.35 million DLVBC‐screened were issued with a 7 day outdate after release into inventory 3 days after collection, and ∼2.3 million amotosalen/UVA‐treated PC were released into inventory on day 1 or 2, with a 5 to 7 day shelf‐life. No septic fatalities were reported with either technology. The French, Belgium and Swiss HV programs monitored >2.83 million conventional, non‐DLVBC‐screened PC and recorded 58 STR and 9 fatalities. Concurrently, zero definite and 2 possible STR were reported with 607,871 amotosalen/UVA‐treated PC, significantly fewer than with conventional PC (Table 1) (20.5 STR per million vs. 0.0 per million, P<0.001). One definite, 1 possible, 7 undetermined/indeterminate non‐fatal STR and 5 contaminated “near miss” PC were reported with 1.35 million DLVBC‐screened PC between 2010 and 2015, for a reduced false‐negative rate compared with the prior five years (3.7 STR per million vs. 16.3 per million, P <0.05). HV programs highlight a major weakness when reporting STR. Stringent criteria are used to determine definite imputability, including evidence of patient infection, PC contamination and irrefutable evidence of a donor source, with confirmation of strain identity. Reports with incomplete investigations are considered undetermined or indeterminate, or possible sepsis. Some of these cases are almost certainly due to bacterial contamination of PC, suggesting that the actual rates of sepsis are considerably higher than that reported by HV programs.
Conclusion: Best‐in‐class pathogen reduction and bacterial culture systems reduce STR risk, although underreporting and inadequate clinical data may result in underestimation of the true rates. Pathogen reduction of platelets with the INTERCEPT Blood System is at least as, if not more effective, than DLVBC and allows for the earlier release of fresh platelets into inventory.
TABLE 1. Hemoviglance reports of high imputability septic transfusion reactions.
| Conventional Platelets | Amotosalen/UVA Platelets | |||
|---|---|---|---|---|
| Country ‐ Year | Units Transfused (n) | Transfusion Transmitted Sepsis (Fatalities) | Units Transfused (n) |
Transfusion Transmitted Sepsis (Fatalities) |
| France (2006‐2015) | 2,575,224 | 49 (9) | 214,293 | 0 (0) |
| Switzerland (2011‐2015) | 6,613 | 0 (0) | 167,200 | 0 (0) |
| Belgium (2009‐2015) | 252,610 | 9 (0) | 226,378 | 0 (0) |
| Total | 2,826,393 | 58 (9) | 607,781 | 0 (0) |
C93‐A04C
Implementation of Secondary Bacterial Culture Testing of Platelets to Mitigate Residual Risk of Septic Transfusion Reactions
Evan M. Bloch*1, Christi E Marshall2, Joan S Boyd2, Aaron Tobian1 and Paul M. Ness1
1Johns Hopkins University School of Medicine, 2The Johns Hopkins Hospital
Background/Case Studies: Despite extant mitigation measures (e.g. diversion pouches and primary platelet culture at the collection facility), bacterial contamination of platelets and associated septic transfusion reactions remains a leading cause of transfusion‐associated fatalities in the United States (US). Consequently, the US Food and Drug Administration has recommended adoption of additional measures such as point of release testing (PORt) and/or pathogen reduction to safeguard against transfusion‐associated sepsis. However, PORt poses logistical challenges, particularly in institutions with high‐volume platelet utilization, while pathogen reduction is a high cost intervention. We evaluated a second bacterial culture to contend with residual risk.
Study Design/Method: Phased implementation of secondary bacterial culture testing (BacT/ALERT ™,BioMerieux, Inc., Durham, NC) was initiated in October 2016 for all platelets received at our institution. At time of receipt at the blood bank (day 3 post collection), products were sampled using a sterile connection device (TSCD™, Terumo, Elkton, MD) and a sampling kit (SampLok™ Sampling Kit, 10mL, ITL BioMedical, Malaysia). Five mLs of product was transferred aseptically to BacT/ALERT BPA (aerobic) culture bottles using the same sampling device. Inoculated culture bottles were loaded into the BacT/ALERT incubator modules and incubated at 35C for three days.
Results/Finding: A total of 9473/11,066 (85.6%) platelet products were successfully cultured (934/1373 [68.03%] and 1842/1912 [96.3%] in October 2016 and March 2017 respectively). Over the 6‐month period, two true positive cultures were obtained (incidence of 1in 4736 platelet products). The cultures grew Acinetobacter species (Case A) and coagulase negative Staphylococcus species (Case B); both positive results were obtained four days following collection. Repeat testing of Cases A and B grew the same organisms identified in the initial cultures. There was a co‐component in our inventory (Case A) with negative initial and repeat cultures. None of the products were released for transfusion. The initial post‐collection product cultures remained negative at the collection facility. Over the same time period, no false positives were detected.
Implementation required hiring one additional dedicated FTE; the total cost (technologist time, equipment and related supplies) was calculated to be $US16.83 per product tested. The cost per averted case was $US79,707.
Conclusion: We demonstrate the feasibility of implementation of a secondary bacterial culture test of apheresis platelets to interdict bacterially contaminated units and prevent septic transfusion reactions. This presents a low‐cost strategy (as compared to pathogen reduction) to mitigate risk of septic transfusion reactions. Importantly, it offers a viable alternative to PORt in high volume institutions where logistic (e.g. time and personnel) constraints impede practical adoption of PORt.
C94‐A04C
Clinical Signs and Symptoms of Blood Culture Positive Transfusion Reactions
Sean Erony*1, Christi E Marshall1, Joan S Boyd1, Eric Gehrie2, Paul M. Ness2, Aaron Tobian2 and Evan M. Bloch2
1The Johns Hopkins Hospital, 2Johns Hopkins University School of Medicine
Background/Case Studies: According to the United States Food and Drug Administration (FDA) bacterial contamination and associated septic transfusion reactions accounted for 10% of transfusion associated fatalities between 2011 and 2015. An increase in cases of blood culture positive transfusion reactions (BCPTR) was noted at our hospital; BCPTR was defined as bacterial culture positivity in the transfusion recipient and/or associated transfused blood product during investigation of a transfusion reaction. We sought to characterize the risk and clinical presentation of BCPTR at our institution.
Study Design/Method: An analysis was conducted of all reported transfusion reactions at Johns Hopkins Hospital (JHH) between January 2009 and December 2016. The data, extracted from hemovigilance records, were evaluated to determine the incidence of BCPTR; the severity and symptoms were evaluated in concordance with recipient data, including patient diagnosis, medications and clinical manifestations of the reaction. Bacterial culture results were evaluated for both patients and associated blood products (i.e. partially transfused or residual product in blood bag).
Results/Finding: In the 7‐year study period, a total of 3280 transfusions reactions were reported, 18 of which were BCPTR (0.55% of transfusion reactions). Of the 18 BCPTR, 15 (83%) were associated with apheresis platelets, 2 (11%) with red blood cells, and 1 (6%) with plasma. Recipient diagnoses spanned hematologic/oncology (n=12), renal (n=3), cardiac (n=1), autoimmune (n=1), and obstetrics (n=1). An organism was identified in both the blood product and recipient in 10 (56%) cases; in 6 (33%) cases an organism was grown in the blood product but not the recipient; and in 2 (11%) cases an organism was isolated from the recipient only, due to inability to culture the product. The transfusion recipients in 5 of the 6 cases that did not isolate organisms in the recipients were on broad‐spectrum antibiotics at the time of transfusion. Symptoms of BCPTRs included fever (83%), chills (67%), nausea and vomiting (50%), pain (27%) and dyspnea (22%). Blood pressure (BP) decreased in 22%, increased in 17%; 61% of reported BCPTRs had no change in BP.
Conclusion: The signs and symptoms of BCPTRs are not specific and overlap both with underlying disease as well as other types of adverse transfusion associated events, thus contributing to delayed diagnosis and under‐reporting. Furthermore, high rates of antibiotic use in transfusion recipients can mask symptoms of true septic transfusion reactions. Hospitals should consider expanding the clinical indications for culturing blood components that are implicated in transfusion reactions. Furthermore, excessively stringent criteria (CDC/NHSN Blood Safety Surveillance) for transfusion‐transmitted infection, may contribute to misclassification of septic events in some recipients, particularly if on antibiotics.
Clinical Oral Abstract Session: Immonohematology and Genetics ‐‐ Sickle Cell Disease and Beyond
C95‐A04D
Blindspots and Cross‐Reactivities of Anti‐Human Globulin Specific for IgG Subtypes
Heather Howie1, Jenna Lebedev1, Linda Kapp1, Xiaohong Wang1, Meghan Delaney2, Lay See Er1 and James C Zimring*3
1BloodworksNW Research Institute, 2Bloodworks NW, 3University of Washington School of Medicine
Background/Case Studies: There are four different subclasses of human IgG (IgG1‐IgG4), each with different effector function. Essentially all existing data on the effect of IgG subclass on hemolytic transfusion reactions and HDFN, were generated using AHG specific for IgG subclasses. In recent decades, it has become appreciated that there are at least 29 natural human variants of IgG. In this study, the reactivity of IgG specific AHG was tested against all 29 known variants.
Study Design/Methods: The heavy and light chain variable regions of an anti‐K1 monoclonal antibody were sequenced and cloned into expression plasmids that fused variable regions (in frame) with each of the known 29 IgG variants. Plasmids were expressed by co‐transfection into CHO cells. The resulting panel of antibodies were pre‐incubated with K1+ RBCs and were then subjected to testing with currently available IgG subtype specific AHG (monoclonal AHGs from Southern Biotech and Sanquin, polyclonal AHGs from Sanquin and The BindingSite). All testing was carried out by flow cytometry.
Results/Findings: Polyclonal reagents against IgG2, IgG3, and IgG4 had cross‐reactivity with variants found in other IgG subclasses, and specific amino acids responsible were identified by site directed mutagenesis (table 1). Titrations of the AHGs did not identify a dilution at which cross‐reactivities were lost, but authentic targets were still detected. However, cross‐reactivity could be neutralized by pre‐incubating AHG with the cross‐recognized IgG forms (against a third party antigen); the remaining reactivity recognized the intended IgG subtype without detectable cross‐reactivity. No cross‐reactivity was detected for polyclonal anti‐IgG1 or for any of the monoclonal AHGs tested. Monoclonal anti‐IgG3 had a blindspot for IgG3‐04, due to the shorter hinge region on IgG3‐04. No blindspots were detected in other monoclonal or polyclonal AHG.
Conclusion: The relative quantitation of different IgG subtypes has been studied in multiple immune settings, and plays important roles in diagnosis and research of human disease, including immunohematology. Herein, we demonstrate that the reagents used to generate this body of knowledge suffer problems of cross‐reactivities and blindspots. As such, the existing data regarding IgG subtype biology may have some inaccuracies as a result of these defects in IgG specific AHG.
| AHG Specificity | Polyclonal AHG Cross‐reactivity | Sequence Responsible for Cross‐reactivity | Monoclonal AHG Blindspots | Sequence Responsible for Cross‐reactivity |
|---|---|---|---|---|
| anti‐IgG1 | None | N/A | None | N/A |
| anti‐IgG2 | IgG3‐09, IgG4‐02 | V309L | None | N/A |
| anti‐IgG3 | IgG1‐05, IgG1‐06 | R435H | IgG3‐04 | Hinge Domain |
| anti‐IgG4 | IgG3‐03, IgG3‐13 | E419Q | None | N/A |
C96‐A04D
Genotype Matching for Pediatric Sickle Cell Disease Patients
Nancy Robitaille*1, Yves Dominique Pastore1 and Maryse St‐Louis2
1CHU Sainte‐Justine, 2Hema‐Quebec
Background/Case Studies: Among the different treatment modalities available for sickle cell disease (SCD), blood transfusion is frequently used. However, alloimmunisation remains a significant problem, even if prophylactic antigen matching is performed for C, E and Kell antigens. This is partly explained by different antigen frequency among Caucasian blood donors and African‐American recipients, and by variants in the Rh blood group of people of African‐descent. Blood group genotyping has been proposed as a potential way to alleviate this problem. The SCD cohort of a pediatric academic hospital was genotyped for RHD, RHCE and FY genes. The primary objective of our study was to evaluate whether compatible genotyped blood donors presenting similar Rh variants could be identified.
Study Design/Methods: Since 2008, our local blood provider intensified recruitment of African‐descent blood donors. These donors were phenotyped and genotyped for clinically relevant antigens by different means: GenomeLab SNP Stream, laboratory‐developped assays and IDCoreXT. As of 2014, 205 SCD children were genotyped by sequencing RHD, RHCE and FY cDNAs after obtaining informed consent. Extended red blood cell phenotypes were done at diagnosis at the hospital. Patients’ genotypes were compared to Héma‐Québec's donor database to attribute blood donors to specific patients.
Results/Findings: From diagnosis until September 2016, 117 (57%) patients had been transfused and 14 had antibodies with known blood group antigen specificity: anti‐C, anti‐E (2), anti‐hrb, anti‐Fya, anti‐Jka, anti‐Jkb (2), anti‐S, anti‐M, anti‐Sc2, anti‐Leb (2). Seventeen patients (8.3%) were either D− or partial D. RHCE results showed that 163 patients expressed a normal c antigen and 32 expressed partial c. As for e antigen, 163 had a normal antigen, 38 bore a partial antigen and 3 were weakly expressed. Fy(a−b−) phenotype was found in 182 (89%) patients. A total of 2606 genotyped blood donors of African‐descent were available. The table below indicates the compatibility with these donors.
| Predicted phenotype | Patients (n=205) |
Donors (n=2606) |
Comments on donors |
|---|---|---|---|
| hrB+w/− | 15 | >100 | All D+ |
| Partial c, partial e | 17 | >100 | All D+ |
| hrB− | 3 (2 are D−) | 15 | 1 D− |
| CEAG− (RHCE*01.06/RHCE*01.06) | 1 | 2 | Both O D− |
| Sec− (RHCE*02.10.01/RHCE*02.10.01) | 1 | 0 |
Conclusion: This study shows that several patients have RHCE variants difficult to match, even with available genotyped blood donors from their community. Although this measure is probably beneficial to decrease alloimmunisation, a larger donor pool is still needed to fulfill the patients’ needs. The continued effort put towards recruitment and pheno/genotyping should improve the situation.
C97‐A04D
Using Genetic Markers to Select Responders and Non‐Responders Sickle Cell Disease (SCD) Patients for Transfusion with RH Haplotype Matching Red Blood Cell (RBC) Units
Tamires Delfino dos Santos1, Emilia Sippert1, Mayra Dorigan de Macedo1, Sheila Fatima Perecin Menegati1 and Lilian Castilho*1,2
1Hemocentro Unicamp, 2University of Campinas
Background/Case Studies: RBC alloimmunization has been associated with several factors and with individual characteristics of each patient. We recently found that TNFA–308A, IL1B–511T cytokine polymorphisms, RHAG 808G>A and HLA‐DRB1*15 alleles may predict a good responder phenotype (Sippert etal, Transfusion 2017) and that RHAG 808A and HLA‐DRB*15 alleles are closely linked to RH alloimmunization. Based on this and considering the challenge to fulfill the transfusion needs of the patients with RH variants, we used these genetic markers to select responders and non‐responders SCD patients for transfusion with RH haplotype matching RBC units and evaluated the risk of alloimmunization.
Study Design/Method: Our study included 96 non‐alloimmunized patients with SCD, homozygous for HbS, receiving a range of 5‐289 RBC units. RBC antigen phenotypes of each patient and history of RBC antibodies were obtained from the medical records and transfusion service computerized database. RBC genotyping was performed using wHEA, wRHD and wRHCE BeadChip arrays (BioArray Solutions, Immucor) in accordance with the manufacturer's instructions. Cytokine gene polymorphisms (TNFA–308G>A, IL1B–511C>T) and the RHAG 808G>A gene polymorphism were analysed by PCR‐RFLP and TaqMan assays. HLA class II genotyping was performed using PCR‐SSO.
Results/Finding: Among 96 non‐alloimmunized patients, 21 were homozygous or compound heterozygous for RH variant alleles. From those, 6 had RHAG 808A and/or HLA‐DRB*15 alleles and at least one cytokine polymorphism (TNFA‐308A or ILB1‐511T) associated with risk of alloimmunization and were transfused with extended and RH haplotype matching RBC units. The other 15 patients with no risk factors associated with RBC alloimmunization were considered non‐responders and were not transfused with extended and RH matching units. All patients were followed for one year and did not develop RBC antibodies.
Conclusion: These findings contributed to the development of a transfusion strategy for non‐alloimmunized SCD patients as typing for these polymorphisms could potentially help in the classification of responder and non‐responder SCD patients, allowing blood with high level of compatibility to be transfused to responders in order to avoid production of RBC antibodies and the negative consequences of alloimmunization.
C98‐A04D
A Comparison of Molecular Genotype Platforms in Patients with Sickle Cell Disease
Chelsea Sheppard*1, Nicole Bolen2, Geralyn Meny3, Monica Kalvelage4 and Gorka Ochoa‐Garay3
1Virginia Blood Services, 2Virginia Blood Services/ITxM, 3Grifols Diagnostic Solutions Labs, 4LifeShare Blood Centers
Background/Case Studies: Transfusion remains a cornerstone of therapy in managing sickle cell disease (SCD), where the high degree of RBC antigenic variation poses an inherent risk of post‐transfusion alloimmunization. To mitigate RBC alloimmunization, genotyping assays have been increasingly employed. Their success depends on the ability to detect specific allelic variants. Side‐by‐side comparisons show a high concordance rate between genotyping and serology, leading some experts to suggest that genotyping without serologic confirmation, should be considered.
Study Design/Method: The performance of 2 commonly used genotyping platforms was compared for accuracy in interrogating blood group allelic variants in a cohort of SCD patients. From December 2012 to June 2016, DNA extracted from 138 HbSS patients was tested by Human Erythrocyte Antigen (HEA) BeadChip DNA array (BioArray/Immucor) at the time of extraction; then subsequently by ID CORE XT (Progenika Biopharma/Grifols). Results were compared and a concordance rate was calculated. Discrepancies were resolved by Sanger sequencing. All testing was done under an IRB‐approved protocol.
Results/Finding: A total of 3,450 SNP calls, representing 25 separate RBC antigens, were compared. A concordance rate of 99.8% was demonstrated. Five discrepant samples required sequencing. ID CORE XT identified three RHCE*ceAR samples encoding a partial c, and a partial e (predicted phenotype: Vweak, VS‐) and 2 were confirmed by sequencing. The third sample was found to be RHCE*ceVS.01,RHCE*ceBI on sequencing (predicted phenotype V+,VS+). The 3 samples were typed as V+ (or ceS) and VS+ (or eS) by HEA. In addition, ID CORE XT accurately identified RHCE*ce[712G]in 2 samples. This SNP has been linked to various allelic variants affecting c and e antigenic expression. Both samples were predicted to be c+ by HEA.
TABLE 1. C98‐A04D: Discrepancy and Resolution Summary
| Discrepancy | |||||
|---|---|---|---|---|---|
| ID CORE XT | HEA Beadchip DNA array | Sequencing, Predicted phenotype | |||
| Genotype | Predicted Phenotype | Genotype | Predicted Phenotype | No. samples | |
| RHCE*ceAR | *Vweak, VS‐ | RhCE‐P103S (Ax), L245V (AB) | V+, VS+ | V+weak, VS‐ | 2 |
| RHCE*ceAR | *Vweak, VS‐ | RhCE‐P103S (Ax), L245V (AB) | V+, VS+ | V+, VS+ | 1 |
| RHCE*ce[712G] | partial c, partial e | RhCE‐P103S (Ax), 109Ins (AB) | c+, e+ | partial c, partial e | 1 |
| RHCE*ce[712G] | partial c, partial e | RhCE‐P130S (Ax), 109Ins (AA) | c+, e+ | partial c, partial e | 1 |
Conclusion: Blood group genotyping platforms vary depending on the specific SNPs that are included in each assay. Such variations may be clinically significant when genotyping is used as a tool for providing matched blood. Discrepancies leading to differences in the predicted phenotype could affect unit selection. Despite the discrepancies between the 2 methods, the high concordance rate and the limitations of serology warrant further reconsideration for the need for serologic confirmation of extended phenotypes.
C99‐A04D
Two Distinct Types of Warm Autoimmune Hemolytic Anemia Showing Differential Tyrosine Phosphorylation of Band‐3
Evgenia M. Bloch1,2, Regina M. Leger3 and Donald R. Branch*2
1Canadian Blood Services, 2University of Toronto, 3American Red Cross Blood Services
Background/Case Studies: Over three decades ago, two independent groups published work suggesting a novel categorization of warm autoimmune hemolytic anemia (wAIHA) on the basis of DAT scores of age‐fractionated RBCs: Type I wAIHA, comprising 80% of patients, showed increased binding of autoantibodies to aged RBC, whereas Type II wAIHA autoantibodies (20% of patients) bound young and old RBCs with no apparent prejudice. Band‐3 is a ubiquitously expressed RBC transmembrane protein which plays a vital role in maintenance of RBC structural integrity, cellular hemostasis, and regulation of senescence; and, has been suggested to be targeted by autoantibodies from patients with wAIHA. Band‐3 is regulated through phosphorylation of key residues; its hyperphosphorylation is a hallmark of normal RBC senescence, which causes band‐3 to disengage from the cytoskeleton, increasing its lateral diffusion, thereby permitting the formation of band‐3 aggregates forming new epitopes which are recognized by natural IgG autoantibodies causing phagocytosis and destruction of senescent RBCs. Type I wAIHA has been postulated to be caused by an exacerbation of normal RBC senescence.
Study Design/Methods: In an effort to confirm and characterize the two wAIHA subtypes we age‐fractionated whole blood samples from 22 patients with wAIHA on discontinuous Percoll® gradients and looked for differences in DAT results between less (young RBCs) and more dense (aged RBCs) fractions, fractionation patterns and band‐3 tyrosine phosphorylation.
Results/Findings: We confirm that two distinct types of wAIHA can be identified based on autoantibody reactivity with the youngest and oldest autologous RBCs. Further, comparing 5 Type I and 5 Type II patients, we found that Type I is characterized by 5 Percoll® fractions (similar to healthy storage‐matched controls) but increased band‐3 tyrosine phosphorylation compared to healthy storage‐matched controls, with phosphorylation occurring during younger stages of RBC development. Type II patients were characterized by 3‐4 Percoll® fractions, lacking the fraction containing the oldest RBCs, and showed a complete lack of, or dramatic decrease in, band‐3 tyrosine phosphorylation compared to healthy storage‐matched controls.
Conclusion: These results confirm the two distinct types of wAIHA. In Type I wAIHA, the increased binding of autoantibodies to older RBCs coupled with increased tyrosine phosphorylation of band‐3 suggests that RBCs from Type I patients are aging faster than RBCs from normal healthy controls; this may represent an accelerated and pathogenic form of normal RBC senescence. In contrast, Type II wAIHA where autoantibodies bind strongly to either young or old RBCs coupled with a lack of fractionated bands that represent the oldest RBCs and a dramatic diminution in tyrosine phosphorylation of band 3 suggests faster destruction of RBCs, consistent with the early published data, and metabolic changes that could affect RBC function.
C100‐A04D
Microbial Pathogen Primary Sequence Correlates with Blood Group Antigen Immunogenicity
Ian Baine*1, Burak Bahar1, Jeanne Hendrickson2, Krystalyn E Hudson3 and Christopher A Tormey1
1Yale‐New Haven Hospital, 2Yale University, 3BloodworksNW Research Institute
Background/Case Studies: It is known that specific groups of patients immunologically respond more readily than others to RBC antigens. While RBC antigenic differences between donors and recipients are required for humoral immune responsiveness, other variables are also involved. Studies have shown that there is significant primary sequence identity between common RBC antigens and microbes, and that cross‐reactivity is possible between antigens in experimental models. We hypothesize that responder populations may be immunologically primed to form RBC alloantibodies via environmental exposure to cross‐reactive microbial antigens, and that such a correlation may be linked to observed blood group antigen immunogenicity.
Study Design/Method: We performed peptide homology searches of the most immunogenic RBC antigens, based on previously published antigenicity findings. Thirteen amino acid peptides containing the polymorphic residues of K, Jka, Lua, E, c, M, C, Fya, and S antigens were queried for identity with microbial peptides using the BLAST database (blastp, PAM30 algorithm, E value=1x10‐6, Word Size= 6, Gap Costs: Existence=9 Extension=1). Search results were restricted to bacteria and fungi, with a selective threshold of >80% identity set for inclusion criteria. To corroborate with observed patient data, we also examined preceding cultures from 162 alloimmunized patients to explore agreement between specific pathogens and RBC alloantibodies.
Results/Finding: Significant peptide identity was found between RBC antigens and pathogenic organisms including B. fragilis, P. aeruginosa, Candida spp. among others. Linear regression analysis of the number of genuses in microbial kingdoms meeting inclusion criteria showed a statistically significant inverse trend in predicting the degree of immunogenicity when Fya (an outlier) was removed (b=‐0.0017, r 2=0.624 & p=0.0197); that is, lower immunogenicity antigens were associated with larger number of kingdoms. k‐medoids cluster analysis comparing immunogenicity and kingdoms showed that antigens clustered to low (C), moderate (E, c, S, M) and high (K, Jka, Lua, Fya) immunogenicity groups, suggesting that an antibody response is inversely associated with environmental antigenic prevalence. Of 162 alloimmunized patients reviewed, 105 were culture‐positive. Of these, 76% of the anti‐C/c group (13 of 17 patients) and 16% of the anti‐K group (7 of 43 patients) had microbe‐antibody agreement. Remaining microbe‐RBC antibody agreements ranged from 0 ‐ 11.1%. Overall, 21.9% (23 of 105 patients) demonstrated agreement. Interestingly, we observed a particularly strong agreement between infection with Klebsiella species and anti‐K, despite the lack of >80% sequence identity. While 27.6% (29 of 105) patients reviewed had positive cultures for Klebsiella species, 62.1% of these (18 of 29 patients) demonstrated an anti‐K.
Conclusion: Our study highlights the potential connection between microbial infection and RBC alloimmunization, based on shared epitopes. We speculate that low‐level antigenic exposure to highly prevalent microbial antigens such as commensals may promote immunotolerance, providing a model for the inverse relationship between RBC antigen immunogenicity and prevalence of microorganisms. Longitudinal studies of microbial carriage (or acute microbial infection) and RBC alloimmune responses in larger patient cohorts may be informative.
Clinical Posters
Anesthesia, Peri‐operative, and Trauma
CP1
A Study of the Impact of Pre‐Thromboelastogram Transfusions during Cardiovascular Surgery
Andrea Ho*1, Bethany Ho2, Cynthia Essmyer3, Suparna Nanua3 and Gagan Mathur3
1University of Missouri, Kansas City Department of Pathology, 2University of Colorado School of Medicine, 3Saint Luke's Health System Department of Pathology
Background/Case Studies: Thromboelastogram (TEG) has been incorporated into many hospital armories to manage transfusions during cardiovascular (CV) surgeries. Some institutions use well‐defined protocols for TEG utilization at different stages of surgery (baseline, rewarming, post‐protamine, and post‐operative). On the other hand, at some institutions TEG utilization is driven mainly by clinical judgment. When TEG is ordered based on clinical judgment (clinical bleeding in most cases), some patients receive blood transfusions before TEG is performed. There is no published literature on how pre‐TEG transfusions impact TEG results and guide further transfusion requirements during CV surgeries. In this study, we have tried to address this issue.
Study Design/Method: We retrospectively reviewed 109 TEGs performed on 76 patients undergoing CV surgeries at our institution from Jan 1 to Dec 31, 2016. No specific TEG protocol was used to direct transfusions (plasma, platelets, and cryoprecipitate) during that period. Only the first TEG performed during surgery was included in the analysis. We excluded the patients that received only red blood cell (RBC) transfusions during the surgery because RBC transfusions are usually not based on TEG results. For the 56 TEGs analyzed, TEG results were divided into three categories: “normal” (reaction time (R), kinetics (K), angle (α), maximum amplitude (MA), and lysis at 30 minutes (min) all within reference range), “hypocoagulable” (R>10 min, K>3 min, α<53 degrees, MA<50mm) and “hypercoagulable” (R<5 min, K<1 min, α>72 degrees, MA>70mm). Fisher's exact tests and Z‐scores for two population proportions were used to identify statistically significant differences in TEG results and blood product utilization.
Results/Finding: Out of 56 TEGs analyzed, 37 patients (66%) received pre‐TEG transfusions. We found significantly fewer hypocoagulable TEG results in pre‐TEG transfused patients than nontransfused patients (8% vs. 32%, p=0.02). The data also reflected a trend suggesting that there may be more normal TEG results in pre‐TEG transfused patients compared with nontransfused (32% vs. 11%, p=0.07). There was no statistically significant difference in transfusions after obtaining TEG results in both groups. However, there was a trend suggesting that hypocoagulable state was more likely to be corrected by transfusion in patients who were already transfused pre‐TEG compared to nontransfused (100% versus 33%, p=0.06).
Conclusion: Pre‐TEG transfusions impact TEG results (transfusions correct/normalize coagulopathy) but do not significantly impact further blood product utilization during CV surgeries. The decreased threshold (more transfusions) for correcting hypocoagulable state in patients who already received pre‐TEG transfusions may be due to more clinical significant bleeding in these patients to begin with.
CP2
Autologous Cell Salvage Efficacy in Reducing Intraoperative Allogeneic Transfusion Requirement in Liver Transplantation
Isabel Nagle dos Reis*, Araci Sakashita, Leila Patricia de Souza Fontenele, Andrea Kondo, Carolina Bonet Bub, Jose Mauro Kutner, Sanny Marcele da Costa Lira, Marcio Dias Almeira, Sergio Paiva Meireles Filho and Ana Paula Hitomi Yokoyama
Hospital Israelita Albert Einstein
Background/Case Studies: Orthotopic liver transplantation (OLT) is associated with significant blood loss, due to the complexity of the procedure and extensive liver vascularity, demanding blood transfusion. In this setting, cell salvage autotransfusion (CS) is been used as an alternative to decrease allogeneic red blood cell transfusion. However, as long as some studies have shown that CS in OLT decreases allogeneic blood transfusion, others reported that CS presented little benefit or might have been associated with increased blood loss through fibrinolysis. In this study, we evaluate CS efficacy in reducing allogeneic blood transfusion in the intraoperative period.
Study Design/Method: We retrospectively evaluated data from 670 liver transplants, performed from 2011 to 2015 in a single‐center. Patients were divided in two groups: one with cell salvage (CS) and another without CS (NCS). Study endpoint included the requirement of allogeneic blood components transfusion during intraoperative period in both groups. CS was used in all liver transplant recipients but patients with malignancy and sepsis. Blood transfusions were indicated based on clinical and hemodynamic criteria. Clinical data included age, gender, diagnosis, body weight, height, warm and cold ischemic time and Model for End‐Stage Liver Disease (MELD) score. Statistical analyses were performed using t‐test, Chi‐square test, Mann Whitney test.
Results/Finding: In this study period, 670 OLTs were performed. A total of 345 patients was submitted to CS. The median age was 51 years (range 10‐78 yo). Cirrhosis caused by chronic hepatitis C virus infection was the main etiology of liver disease. Hepatocellular carcinoma (HCC) was found in 31,6% of the patients. The average MELD score was 29,6 ± 9,4 and it was slightly higher in the CS group (31,3 vs 27,9, p<0,001). There was no statistically significant difference in other variables such as body weight, height and cold ischemic time. The mean salvaged blood volume was 8856 ± 4503ml and mean reinfused blood volume was 914 ±909ml. Allogeneic blood transfusion was required in 71,8% patients in the CS group, compared to 46,7% patients in the NCS group. However, average red blood cells (RBC) and fresh frozen plasma (FFP) units transfused were lower in the CS group. The threshold for RBC transfusion was significantly lower in the CS group (2,4 units vs 3,39 units, p<0,001). This finding was similar for FFP transfusion (4,38 units vs 6,5, p <0,023). There was no significant difference in transfused Cryoprecipitate and Platelet units between groups.
Conclusion: Autologous CS decreases allogeneic blood transfusion requirements during liver transplantation, with less RBC and FFP units transfused intraoperatively.
CP3
Blood Product Wastage in Massive Transfusion Protocols
Rachel Jug*1, Gustaaf de Ridder1, Kimberly Ingersoll1, Susan Violet2, Nicholas Bandarenko2,3 and Jessica Poisson3
1Duke Health Pathology, 2Duke Health, 3Duke University Hospital
Background/Case Studies: Hemorrhage is a leading cause of mortality in trauma patients and morbidity in non‐trauma patientsADDIN EN.CITE.DATA. Massive transfusion protocols (MTP) reduce mortality in trauma and non‐trauma settings; however, this may be at the cost of blood product wastageADDIN EN.CITE.DATA. Blood product wastage benchmarks are loosely established, and data on wastage associated with MTPs especially sparse. With a redesign of MTP and Obstetric Massive Transfusion Protocols (OBP) which have different blood product preparation schedules, we assessed wastage, delivery method, and product utilization to identify differences in wastage during these protocols.
Study Design/Method: Following Institutional Review Board approval, a retrospective study on blood product wastage associated with the MTP and OBP between July 2015‐December 2016 was performed. Data on numbers of products dispensed and wasted were manually collected from Transfusion Service paper and electronic records and an automated data report from the electronic medical record.
Results/Finding: The MTP resulted in higher total number of wasted products than the OBP (27 and 15 products, respectively) however, OBP wastage occurred more frequently in the 18 month period. This reflects automatic thawing of cryoprecipitate in the first round of deployed products in the OPB. MTP‐trauma activations contributed higher wastage than non‐trauma activations (23 versus 4 products). This is skewed by one month when 20 products were wasted due to expiration of product on the floor. Cooler‐related issues (6) and products dwelling too long out of a controlled environment (5) were common reasons reported for wastage. The overall product wastage rates for MTP: trauma, MTP: non‐trauma, and OBP were 1.7%, 0.3%, and 2.3%, respectively, with a total exsanguination protocol waste rate of 1.33%. The difference between the overall proportion of waste between the MTP and OBP protocols was insignificant (p=0.176).
| MTP: Trauma | MTP: Non‐trauma | OBP | ||||
|---|---|---|---|---|---|---|
| Month | Issue | Waste | Issue | Waste | Issue | Waste |
| 15‐Jul | 175 | 11.4% | 10 | 0% | 8 | 0% |
| 15‐Aug | 30 | 3.3% | 138 | 0% | 42 | 2.4% |
| 15‐Sep | 106 | 0% | 54 | 0% | 55 | 0% |
| 15‐Oct | 0 | ‐ | 0 | ‐ | 39 | 5.1% |
| 15‐Nov | 47 | 0% | 103 | 1.9% | 55 | 0% |
| 15‐Dec | 138 | 0% | 34 | 0% | 31 | 3.2% |
| 16‐Jan | 59 | 0% | 65 | 0% | 16 | 0% |
| 16‐Feb | 28 | 0% | 0 | ‐ | 73 | 2.7% |
| 16‐Mar | 101 | 0% | 169 | 1.2% | 50 | 2.0% |
| 16‐Apr | 73 | 2.7% | 31 | 0% | 23 | 0% |
| 16‐May | 33 | 0% | 49 | 0% | 48 | 2.1% |
| 16‐Jun | 30 | 0% | 244 | 0% | 100 | 3.0% |
| 16‐Jul | 0 | ‐ | 0 | ‐ | 40 | 2.5% |
| 16‐Aug | 56 | 0% | 57 | 0% | 9 | 11.1% |
| 16‐Sep | 78 | 0% | 141 | 0% | 9 | 11.1% |
| 16‐Oct | 141 | 0% | 75 | 0% | 57 | 1.8% |
| 16‐Nov | 100 | 0% | 0 | ‐ | 0 | ‐ |
| 16‐Dec | 129 | 0% | 0 | ‐ | 0 | ‐ |
| Totals | 1324 | 1.7% | 1170 | 0.3% | 655 | 2.3% |
Conclusion: Wastage associated with both protocols was low and there is no statistical difference between MTP versus OBP wastage. Cooler‐related issues accounted for most product wastage, allowing for targeted waste reduction strategies including educational outreach and improved product delivery methods. Better documentation of waste events identifies wastage trends for further product utilization optimization during these protocols.
CP4
Blood Typing Error during Trauma Resuscitation Due to Donor Unit Contamination: A Second Documented Case
Erin Tuott*1, Stephanie Franson1 and Patrick Ramos2
1Harborview Medical Center, 2Division of Transfusion Medicine, Harborview Medical Center
Background/Case Studies: A 17 year old female with multiple gun shots was admitted to a level one trauma center and received uncrossmatched group O, Rh negative (D‐) red blood cells (RBCs) through a rapid infuser during resuscitation. Transfusion of uncrossmatched products before sample collection can lead to errors and confusion in blood typing, as can the venipuncture site used for collecting the patient's blood sample. The current FDA guidance and AABB standard of two samples for determination of blood type to prevent cases Wrong Blood in Tube (WBIT) or electronic identification systems do not always catch or clarify these errors.
Study Design/Methods: Patient was tested by manual tube method. Two different technologists using two different reagent racks performed initial testing with matching results.
Results/Findings: Two samples were collected during resuscitation from the patient and typed as O D‐. Patient was transfused with 5 units of O D‐ RBCs before stabilizing. Two days later another sample was collected and typed as O Rh positive (D+) with mixed field being seen on the anti‐D. A weak D testing was performed to see if the negative result with anti‐D could be strengthened through incubation. Both original samples still resulted as D‐ (table A). After consulting the patient care team it was discovered the samples were collected above the IV site after one unit had been completed and while the second unit was being transfused. It was also discovered all other clinical laboratory samples were rejected due to possible line contamination when results for the sodium, potassium, and glucose appeared inaccurate. The transfusion service laboratory is in a different area of the hospital and was unaware those samples had been rejected.
Conclusion: The initial samples were collected above the IV site and were contaminated with the D‐ blood product being rapidly transfused during resuscitation. The samples collected during the initial trauma response should have been rejected and a request made for samples drawn below the IV site. Because both samples were collected while the unit was being transfused, contamination was in both. Use of a handheld barcode system would not have caught this error because the patient had been correctly identified. Future prevention of the above anomaly would be the education of transfusion testing staff to recognize an abnormal high hematocrit: secondly reminding the staff collecting samples to be aware of the proper collection procedures for laboratory testing, which would include type and screen. Facilities also should strive to perform collection of the confirmatory sample from a completely different venipuncture site.
TABLE A. CP4
| Anti‐A | Anti‐B | Anti‐D | A1 Cell | B Cell |
Weak D IgG |
Weak D CC | Interpretation | Sample collection |
|---|---|---|---|---|---|---|---|---|
| 0 | 0 | 0 | 2 | 2 | 0 | 3 | O, D‐ | Day 1 at 0 minutes |
| 0 | 0 | 0 | 2 | 2 | 0 | 3 | O, D‐ | Day 1, at 2 minutes |
| 0 | 0 | 2 MF | 4 | 4 | 4 MF | NT | O, D+ | Day 3 |
MF = mixed field, NT = not tested
CP5
Impact of Cell Saver Usage during Solid Organ Transplants at a Major Institution
Holly Ross*1, Edward Smith2, Thomas Brown2, Foeks Jeremy2, Metcalf Suzanne2, James Johnson2, Peter Davis2, Karafa SW Badjie1 and Abba Zubair1
1Department of Laboratory Medicine and Pathology, Transfusion Medicine, Mayo Clinic, 2Department of Anesthesia, Mayo Clinic
Background/Case Studies: Our institution performs an average of 398 solid organ transplants (SOTs) yearly. Transfusion support for transplants can be tremendous, accounting for a large percentage of red blood cell (RBC) transfusions annually. Even the best practices for allogeneic transfusion are not without risk. Transmission of pathogens is possible with even the strictest screening methods, and each transfusion increases the risk of alloimmunization. The advent of intraoperative blood recovery has reduced the need for allogeneic donor RBCs during surgeries expected to bleed heavily. With the Cell Saver® (Haemonetics®, Braintree, MA), patients’ own blood shed during surgery is collected, washed, concentrated, and re‐infused, lessening the need for transfusion support. This study sought to examine the amount of allogeneic donor RBC units saved during SOTs through the use of the Cell Saver for intraoperative blood recovery.
Study Design/Methods: Data was collected for SOTs which utilized the Cell Saver. These included liver, liver/kidney combination, lung, and heart transplants. Data points included type of transplant, volume of shed blood collected, and volume of concentrated RBCs washed and re‐infused. An average donor RBC unit volume of 290mL was used to determine the equivalent number of donor units. Data was collected for a period of fourteen months.
Results/Findings: A total of 244 SOTs were documented which utilized the Cell Saver. A total of 932,903mL of shed blood was collected, from which 185,275mL of concentrated RBCs was washed and re‐infused (Table 1). Using an average donor RBC unit volume of 290mL, the volume of concentrated shed blood re‐infused to patients was equivalent to 640 allogeneic donor RBC units, or 2.6 units per transplant. According to published literature, the average cost per RBC unit is $761 (±$294). Reducing the need for allogeneic RBCs by 640 units for solid organ transplants equates to an average savings of $487,040, or $1,996 per transplant.
Conclusion: Given the high volume of SOTs performed at our institution, intraoperative blood recovery with the Cell Saver has proven to greatly reduce the need for allogeneic donor RBCs during transplants, resulting in reduced risk from allogeneic blood exposure and significant cost savings.
TABLE 1. Cell Saver Usage During Solid Organ Transplants
| Type of Transplant | Volume of Shed Blood Collected (mL) | Concentrated Volume of Shed RBCs Washed and Re‐infused (mL) | Donor Unit Equivalent |
|---|---|---|---|
| Liver | 724,217 | 125,875 | 434 |
| Liver/Kidney | 23,314 | 3,375 | 12 |
| Lung | 72,993 | 24,975 | 87 |
| Heart | 112,379 | 31,050 | 107 |
| Totals | 932,903 | 185,275 | 640 |
CP6
Implementation and Evaluation of an Emergency Blood Refrigerator for Immediate Access to Universal Blood Components
Jenna Khan*, Max Joseph Louzon, Patrick Ramos, Lauren Reyes Fernandez, Virginia Cruz‐Cody, Nina Sen, John Hess and Ryan A. Metcalf
Division of Transfusion Medicine, Harborview Medical Center
Background/Case Studies: Turnaround time (TAT) for emergency blood components from order to delivery at this level 1 trauma center was 3 minutes in the PROPPR trial. This rapid TAT led to positive feedback from satisfied clinicians and ways to further improve speed and efficiency of the transfusion service (TS) are continuously evaluated. The trauma response protocol includes Full Trauma Team Activations (FTTAs) for severe trauma or Modified TTAs based on mechanism of injury, age, and hemodynamic stability. Previously, all FTTAs required TS staff to respond and remain present with 6 RBCs, 6 plasma, and 1 platelet until universal products were no longer needed. The impact of an ED blood refrigerator on operational efficiency and blood utilization was evaluated.
Study Design/Methods: In February 2015, a monitored blood storage refrigerator was activated for use in the ED with 2 O‐ RBCs, 2 O+ RBCs, and 2 AB or A (low titer anti‐B) plasma. ED staff were trained and given code access that activates an alarm in TS when used. After a process change, FTTAs only required the physical presence of a TS staff member if requested. Pertinent metrics were collected for the year prior to and 1 year post implementation.
Results/Findings: Prior to use of the ED refrigerator, about half of TS staff time at FTTAs was essentially unnecessary as no uncrossmatched blood was given. After the ED refrigerator, idle TSL staff time at TTAs was reduced from 30 to 16 hours. The ED refrigerator was consistently used after 2‐3 months due to ED stakeholder buy‐in. When FFP was used it generally resulted in an MTP and a 1:1 ratio with RBCs overall. Post‐implementation there was a slight increase in the number of TTAs and uncrossmatched RBCs used while the number of FTTAs and injury severity scores (ISS) remained stable.
Conclusion: At a Level 1 trauma center with a highly efficient TS, implementation of an ED refrigerator enhanced operational efficiency and likely improved the already rapid TAT for blood components.
| Monthly Averages | ||
|---|---|---|
| Pre‐Implementation (3/2014‐1/2015) | Post‐Implementation (3/2015‐2/2016) | |
| TTAs (FTTAs) | 176 (66) | 189 (64) |
| TTAs with MTP activations (%) | 12 (7) | 14 (7) |
| TS responses (% of TTAs) | 70 (41) | 57 (31) |
| % of FTTAs with TS response | 100 | 93 |
| % of TSL responses with MTP activations | 17 | 24 |
| TS staff hours spent at TTAs | 65 | 55 |
| % of TS responses with no uncrossmatched blood use | 64 | 45 |
| TS staff time with no uncrossmatched blood used hours (%) | 30 (47) | 16 (28) |
| Total blood usage over 24 hours | 408 | 391 |
| Uncrossmatched units # (% of total) | 166 (43) | 201 (53) |
| Uncrossmatched RBCs # (% of total) | 94 (24) | 109 (29) |
| Injury Severity Score (ISS) | 17 | 18 |
| ED refrigerator usage (RBCs, FFP) | 15, 2 | |
| # of patients using ED refrigerator units | 10 | |
| % of ED refrigerator patients not requiring TSL response | 25 | |
| % of ED refrigerator patients with MTP activation | 33 | |
| % of total uncrossmatched blood from ED refrigerator | 9 | |
CP7
Process Improvement to Prevent Formation of Anti‐D in Female Trauma Patients
Erika M Reese*1, Ellen Plummer2, Theresa Dinardo2, Jay Menaker3, Deborah Stein3 and Magali J. Fontaine4
1Laboratories of Pathology, University of Maryland Medical Center, 2Trauma Resuscitation Unit, R Adams Cowley Shock Trauma Center, University of Maryland Medical Center, 3Department of Surgery, University of Maryland School of Medicine Program in Trauma, R Adams Cowley Shock Trauma Center, 4Department of Pathology, University of Maryland School of Medicine
Background/Case Studies: Emergent red blood cell (RBC) transfusions can be life‐saving in trauma patients and are often initiated before a blood type is determined. The availability of universal blood type O negative (‐) units cannot support all trauma patients in need of emergent transfusions. Thus, O(‐) units are reserved to trauma females of child‐bearing age. At our institution, females <50 years old (y.o.) are transfused O(‐) RBC, whereas females >50 y.o. and males of all age receive O positive (+) during trauma resuscitation.
Uncrossmatched type O RBCs are maintained in refrigerated kiosk in the trauma department. For emergent transfusion the appropriate RBC, either O(+) or O(‐), is selected from the kiosk.
A 29 y.o. female was admitted to the trauma department after a motor vehicle collision (MVC) and transfused 2 O(+) RBC units from the kiosk. Her blood type was determined as O(‐) with a negative RBC antibody screen (AS). She was transfused 10 more units of O(‐) RBC. Two months later, a repeat AS identified two new RBC alloantibodies, anti‐D and anti‐E. The anti‐D formation resulted from the 2 O(+) RBC transfused from the kiosk, but the source of the anti‐E was undetermined since E antigen is expressed in 1% of Rh(‐) individuals. The trauma department staff was notified of delayed serologic transfusion reaction and asked to investigate further since a 29 y.o. female patient should not have received O(+) RBCs.
Study Design/Method: An investigative plan was developed by the trauma staff involving a patient census, review of the chart and kiosk inventory, obtaining feedback from clinical providers, and review of information provided by emergency services (EMS).
Results/Finding: The trauma unit was busy with 10 admissions during the 5 hours preceding the patient's arrival. The chart review found the following physical attributes; patient was overweight (107kg) with obvious facial deformities from the MVC, that compromised age assessment. It was determined that the kiosk was fully stocked with both O(‐) and O(+) RBC units. One clinical provider recalls that the patient identification (ID) might have been unknown. Review of the EMS communication states “patient is a 50 y.o. female.”
Conclusion: Use of visual examination to determine age was significant in the selection of O(+) RBC for this patient. The trauma staff proposed and implemented a change in policy to prevent future incidents. Any female patient that arrives without ID or written confirmation of age will be transfused O(‐) uncrossmatched RBC until a blood type can be determined.
After being notified of the incident, the trauma staff took the lead in investigating and providing a process improvement resolution. This is credited to the excellent collaborative relationship between the transfusion service and trauma department on ensuring patient safety during emergent, uncrossmatched RBC transfusions.
CP8
Rate of ABO/Rh Confirmation in Outpatient Pelvic Organ Prolapse Surgery
Alexis R Peedin*, Taylor Brueseke, Yara Park and Jay S Raval
University of North Carolina
Background/Case Studies: Approximately 375,000 surgeries for urinary incontinence or pelvic organ prolapse (POP) are performed annually. For abdominal pelvic floor disorder (PFD) surgeries, transfusion rates historically range from 6‐16%, whereas transfusion rates for vaginal and robotic PFD surgeries range from 0.2‐1.6% and 0.3‐1.4%, respectively. Since the implementation of College of American Pathologists (CAP) requirements for ABO/Rh confirmation, approximately 15% of patients who receive a transfusion in our hospital required a second ABO/Rh specimen to be drawn; however, limited data are available regarding the impact of this new requirement on patients preparing to undergo outpatient surgery that currently require preoperative Type & Screen (T&S). The primary objective of our study was to assess the rate of ABO/Rh confirmation in women who underwent outpatient POP surgery.
Study Design/Method: This was a planned secondary analysis of a retrospective cohort study of consecutive patients undergoing POP surgical repair from May 2015 – May 2016 in our academic tertiary care institution. Among this sample, patients were excluded if their first T&S was drawn before our institution implemented the ABO/Rh confirmation requirement. Fisher's Exact Test was used, and statistical significance was defined as p<0.05.
Results/Finding: We identified 66 patients for analysis, of whom 65 (98.5%) had a preoperative T&S ordered. Two (3.1%) of these 65 patients had positive antibody screens; one patient had an anti‐K and one had a warm‐reacting autoantibody. Fifty‐nine (90.8%) of the 65 patients required a second ABO/Rh specimen per hospital protocol; 51 (86.4%) of these actually had a second specimen drawn. In patients for whom ABO/Rh confirmation was indicated, there were no differences between those who did and did not have ABO/Rh confirmed when comparing age, body mass index (BMI), pre‐operative hemoglobin (Hgb), or surgical approach (Table 1). No ABO/Rh discrepancies were identified. One patient received 1 unit of red cells after abdominal POP surgery.
Conclusion: The rate of requiring ABO/Rh confirmation before POP surgery was markedly higher than that seen in all patients receiving transfusions at our institution (90.8% vs. 15%, respectively). Because the vast majority of women undergoing vaginal or robotic POP surgery are not transfused perioperatively, hospital transfusion services should consider eliminating routine pre‐operative T&S for this low‐risk population in the maximum surgical blood ordering schedule, avoiding this unneeded test and subsequent ABO/Rh confirmation.
| ABO/Rh confirmed when indicated (n=51) | ABO/Rh not confirmed when indicated (n=8) | p value | |
|---|---|---|---|
| Mean age (yrs) | 57.3 | 53.4 | 0.40 |
| BMI | 28.2 | 29.0 | 0.56 |
| Mean pre‐op Hgb (g/dL) | 13.6 | 14.0 | 0.17 |
| Surgical approach | |||
| ‐Vaginal or robotic | 45 | 8 | 0.58 |
| ‐Abdominal | 6 | 0 | |
CP9
Volume Reduction of Red Cells to Reduce Transfusion‐Associated Adverse Events Related to Hyperkalemia
Maressa T Pollen*, Laura Knicks, Linda Van Tol and C. Michael Knudson
University of Iowa
Background/Case Studies: One attribute of older blood is an increase in supernatant potassium level which can contribute to transient hyperkalemia. This problem is exacerbated in conditions of massive transfusion and in patients with renal failure. Washing RBCs can effectively remove free potassium but is time consuming and can often only be performed on one unit at a time. Here, we estimate the amount of potassium that is removed by volume reduction of red cell units. We also examined whether this technique would be feasible in the setting of massive transfusion in a patient with hyperkalemia.
Study Design/Method: Expired or over temperature units (n=27) that had been removed from inventory were utilized for these studies. Each unit was weighed and a volume reduction procedure was performed. The supernatant was weighed and the potassium of the supernatant was measured using routine laboratory assays. For all formulas, weight was converted to volume using a specific gravity of 1.05g/ml. The Hematocrit (Hct) of the volume reduced RBC was measured using a Sysmex xs‐1000i instrument. The percentage of supernatant removed was calculated by dividing the residual supernatant in the volume reduced unit (RBC Hct X RBC volume) by the total supernatant prior to the procedure (residual supernatant + removed supernatant). The remaining free potassium (mEq) was calculated as the (concentration of potassium in the supernatant (mmol/L) x the estimated red blood cell residual supernatant volume. To simulate the process that would occur in the setting of a massive transfusion protocol (MTP), 5 units were subjected to the volume reduction while recording the time needed to process all 5 units. This was performed twice for a total of 10 Units processed in this manner.
Results/Finding: The volume reduction procedure reduced the supernatant volume by an average of 72% (range 49%‐87%). In units between 21 and 42 days (n=10), the estimated mean residual K+ was 1.89 mEq (Range 0.61 to 2.21). In the two mock MTP trials, the time to complete the procedure was approximately 50 minutes and we estimate an additional 5‐10 minutes would be required to modify and issue the units in our LIS/EMR.
Conclusion: A manual volume reduction protocol in red cell units significantly reduces the amount of potassium administered in a unit of red cells. This procedure may be useful when only older red cell units are available for a patient at risk for hyperkalemia. The procedure can be performed in less than one hour and may be useful under the conditions of massive transfusion.
Cellular Therapies excluding Immunotherapies: Collection, Processing, Storage and Clinical Applications
CP10
A Comprehensive Validation of Umbilical Cord Tissue Banking for Mesenchymal Stem Cells Expansion
Hung Pham1,2, Richard Tonai1, Jocelyn Nagy1, Jennifer Willert1,3 and Monica Chen*1
1StemCyte, 2Department of Medicine, UCLA, 3Pediatric Bone Marrow Transplant, UCSF
Background/Case Studies: Mesenchymal stem cells (MSCs) are self‐renewing, non‐specialized cells capable of differentiating to multiple lineages. MSCs possess tremendous therapeutic potential but are limited in source and quantity. Although MSCs have been identified and expanded from umbilical cord tissue (UCT), the current practice of UCT banking has not been standardized. Our goal is to develop a validated method to cryopreserve UCT that can generate viable and consistent MSCs in a GMP facility to meet cell‐based product Biologics License requirements for future therapeutic applications (21 CFR 600 ‐ BIOLOGICS, FDA).
Study Design/Method: Donated human UCTs were washed, sectioned, and stored in the freezing media containing DMSO (CryoStor CS10) in the vapor phase of liquid nitrogen tank. Freshly processed and post‐thawed UCT samples (2‐ 30 weeks) were expanded for MSC growth in xeno‐free media for consecutive passages (P0, P1 to P10). RNA analysis was performed with aliquots of tissues and expanded cells for MSC markers CD73, CD90 and CD105 by qPCR. MSC identity/phenotype was confirmed by flow cytometry using Stemflow (FACSCalibur, BD) to detect the presence of CD44, CD73, CD90 and CD105 and the absence of CD34 and CD45 surface expression. Replicate tissue samples were subjected to a 14‐Day Sterility Test by an accredited service laboratory that encompasses aerobic, anaerobic, yeast, and fungal IDs with supplemental speciation/sensitivity tests performed on each positive sample.
Results/Finding: Our findings demonstrate that mRNA expression of CD73, CD90, and CD105 were detected in both fresh and post‐thawed UCT with variations in relative levels among donors. After 30 weeks of cryostorage, recovery of marker signals averaged 52% for CD73, 92% for CD90 and 100% for CD105 (n=4), which was not significantly changed to indicate minimal deterioration of frozen UCT. Similar mRNA expression were also detected in expanded MSCs cultured from both fresh and post‐thawed tissues. The adherent MSC cultures of both fresh and post‐thawed UCT samples (passage 1‐5) showed 95 to 100% positive for markers CD44, CD73, CD90, and CD105 but negative for CD34 and CD45, characteristic of mesenchymal origin. All expanded MSC cultures, including post‐thawed groups, showed >90% viable 7AAD. In particular, post‐thawed MSC cultures after long‐term cryostorage showed similar cell viability and stability as seen in fresh groups. Sterility tests showed a < 7% overall contamination rate (n=1100 private bank UCT samples).
Conclusion: We have developed a comprehensive procedure for our private UCT banking and MSC expansion. Complementary tests are employed to validate the isolation, cryopreservation and expansion of UCT‐derived MSCs that may lead to its approvable use for regenerative medicine.
CP11
A Practical Method for Remote Collection and Preservation of Umbilical Cord Tissue
N Rebecca Haley*1, Joyce Lehner2, Denise Farrer1, Katie Benson1 and Aby J Mathew3
1Bloodworks, 2Bloodworks Northwest, 3BioLife Solutions
Background/Case Studies: Umbilical cord (UC) tissue is of growing importance. Mesenchymal stem cells (MSC), which are isolated from Wharton's Jelly in the UC, are under study for a growing number of research indications. Future regenerative medicine approaches may require autologous MSCs, but remote collection and preservation of UC tissue from referral sites remain challenging. It requires practical methods for transport, processing, cryopreservation, and non‐specialized hospital collection. Preliminary studies of three shipping conditions after collection were tested using sterile containers with sterile normal saline (NS) alone, NS plus antibiotic/antimycotic (AB/AM) and a dry container. Prolonged exposure to AB/AM solution retarded outgrowth of MSCs, but control of microbial growth in cultured tissue samples was needed. These findings were used to construct a validation study.
Study Design/Methods: A validation study designed to test procedures to collect, transport, process, and store umbilical cord tissue was measured by post‐thaw outgrowth. Collected UC tissue from consenting mothers was transported to the distant lab in validated shipping containers in a dry, sterile cup from vaginal (3) and caesarian (2) births. UC collections were divided into 3 segments to test 3 conditions. Segment explants were placed on 0.1% gelatin‐coated gridded tissue culture plates (32 explants per plate) in enriched medium specified for MSC outgrowth containing antibiotic only with an endpoint of 21 days. Growth was scored as the number of squares with explants exhibiting outgrowth compared to the total planted explants. One segment (fresh control) was dissected and planted without further processing. The 2 remaining tissue segments were soaked in (AB/AM) saline solution for 1 hr and 24 hrs at 4°C, respectively. Tissue segments were frozen in cryo bags with a proprietary 10% DMSO/large molecular weight sugar solution. The tissue was stored below ‐150°C, vapor phase, for a minimum of 72 hrs.
Results/Findings: Samples were received in the lab 16 to 31 hours after collection. All conditions showed growth and are reported as the percent of squares with dissected tissue fragments showing outgrowth. Outgrowth plates exhibited expected MSC CD markers. Fresh and short exposure AB/AM samples fared similarly. Longer AB/AM exposure outgrowth yields were lower. Fifteen culture plates were evaluated for % growth. No plates exhibited contamination.
| Processing Condition | Storage/Outgrowth Condition |
Avg % growth Day 21 (n=5) |
FLOW results CD34CD73 CD90CD105 |
|
|---|---|---|---|---|
| Control | Fresh /Fresh | 63 | ||
| 1 hr AB/AM soak | Frozen /Post‐thaw | 63 | Neg | Pos |
| 24 hr AB/AM soak | Frozen /Post‐thaw | 37 | ||
Conclusion: Fresh and post‐thaw tissue samples exhibited similar levels of growth. Shipping UC tissue in a dry, sterile cup efficiently preserved outgrowth potential. Prolonged exposure to AB/AM retarded tissue outgrowth. Average numbers of colonies post‐thaw were equal between fresh and short AB/AM incubation. Extended incubation in the AB/AM solution gave poorer outgrowth results. Storage in this cryopreservation medium preserved tissue outgrowth potential. This method was successful in providing collected cord blood tissue from a community setting capable of MSC outgrowth after thawing.
CP12
An Institution‐Specific Prediction Algorithm for the Collection of Peripheral Blood CD34+ Stem Cells
Robert Bradley*1, Joseph Roig2 and Yasser Khaled3
1Memphis Pathology Group, Methodist University Hospital/University of Tennessee, 2Terumo Medical Corporation, 3Blood and Marrow Transplant Program‐West Cancer Center, University of Tennessee/Methodist University Hospital
Background/Case Studies: It has been the practice in our institution to process 3 or 4 times the total blood volume (BV) of the patient, up to a maximum of 25 liters (L) per procedure, to obtain peripheral blood CD34+ stem cells. As a consequence, a patient often would need to spend 6 hours or more on the machine. It would be desirable to be able to specify the exact volume of blood to process to achieve the desired CD34+ cell yield, thus minimizing the patient's time on the machine, the nurse's time performing the procedure, and the number of bags that have to be submitted for cryopreservation and storage.
Study Design/Methods: Our institution recently implemented the new Spectra Optia CMNC collection protocol, a continuous flow and continuous collection procedure that uses the Automated Interface Management (AIM) system to precisely manage the separation interface. An analysis of our 2016 collection data suggested a highly reliable collection process, so a prediction algorithm (PA) based on the linear regression between the patient's CD34+ pre‐count and CD34+ yield, normalized per liter of blood processed, was derived utilizing the patient's CD34+ pre‐count, the patient's weight in kilograms (Kg), and the target CD34+ dose/Kg. This PA calculated the exact volume of whole blood to be processed to achieve the requested dose of peripheral CD34+ stem cells. The initial equation was modified to add an additional 15% to the predicted volume, to account for the natural variability of the process. This PA was then tested prospectively in the clinical setting.
Results/Findings: In 8 patients, representing both allogeneic and autologous donors, the average blood volume processed was 14.8L. The range was 4.9L ‐ 21.6 L. The target dose was achieved in all patients. Our previous practice for these 8 patients would have required, assuming a standard 4 BV procedure, processing an average of up to 28L per patient, with a range of 20‐62L. To quantify how well the new PA works, it was decided to evaluate the ratio between actual and predicted volume vs. the ratio between the actual and expected CD34+ yield. The result was a high correlation between these two ratios (R² = 0.92), indicating that the algorithm produces very consistent results.
Conclusion: The predictability of our collection process during the time period analyzed was a robust R² = 0.92, confirming the findings in the first data analysis. The blood volumes processed and patient time on the machine decreased substantially, with some patients only needing 2 hours or less to achieve their target dose. Nurses and lab medical technologists have seen a dramatic change in their workflow. The number of bags to process has dropped for the lab, with the consequent freezer space savings and the shorter collection times allowing the lab medical technologists to finish with their work earlier in the day. All in all, implementation of this PA has produced huge increases in patient and provider satisfaction. Important factors that likely contributed to the success of the protocol included the precision and consistency of the AIM system of the apheresis device, as well as the small number of nurses (1‐2) who performed the procedures, resulting in less variability. The economic impact of this PA has not been quantified, but might be an interesting area for future studies.
CP13
Biosimilar Based Mobilization Of Peripheral Blood Hematopoietic Stem Cells For Autologous Stem Cell Transplantation. A Single Centre Experience.
Eva Alonso*1, Mireia Morgades2, David Lopez2 and Joan‐Ramon Grífols1
1Banc de Sang i Teixits, 2Institut Català d'Oncologia
Background/Case Studies: Zarzio®, a biosimilar granulocyte colony‐stimulating factor (G‐CSF) has recently been introduced into clinical practice. Its use has stimulated a certain debate regarding their possible less efficacy and security on CD34+ mobilization. The aim of this study is to evaluate if there are differences between good and bad mobilizers and assess the need for plerixafor when a biosimilar as G‐CSF is used.
Study Design/Method: We retrospectively evaluated autologous mobilization processes performed between June 2015 and March 2016. Patients (n=25) evaluated were diagnosed with malignant lymphoma (n=15), multiple myeloma (n=9) and Primary Amyloidosis (n=1) and were mobilized according to standard protocols. Collection CD34+ cellularity target was established ≥ 2x10E6/kg. Two groups, good and bad mobilizers, have been determined. Predictors of unsuccessful mobilization were defined by >65 years old, previous fludarabine, lenalidomide, or bendamustine treatments or ≥2 previous regimens, present peripheral cytopenias, active disease and previous mobilization failure. Mann‐Whitney U test was used to compare means and comparisons of medians were performed by the median test. CD34+ count was performed according ISHAGE protocol. Adverse events (AE) were analysed according to CTCAE v4.0.
Results/Finding: The media (range) general collection parameters were: CD34+ (day 5) 27.50/µL (4.5‐157.5/µL), blood volume processed 23204mL (9718‐39618mL) and 4.96 (2‐7.30) exchanged volemias. Seventeen patients were considered bad mobilizers, 7 needed plerixafor and 5 had to undergone a collection procedure twice. There were statistically significant differences between both groups on mobilization characteristics and product cellularity [mean (SD)]: CD34+ (day 5) [69.88 (43.02) versus 32.56 (37.68), p=0.023], CN/Kg [9.54 (4.30) versus 14.36 (4.81); p=0.020] and CD34+/Kg [5.97 (2.60) versus 3.24 (1.55); p=0.017]. And there was a trend towards statistical significance in terms of CMN/Kg [8 (3.53) versus 10.41 (3.24); p=0.062] and GM/Kg [7.06 (3.94) versus 3.80 (2.14); p=0.071]. There were no significant differences on mobilization characteristics and product cellularity between both groups. Five mobilization AE were observed [muscle pain (n=2), fever (n=2) and flu syndrome; all grade 1]. Two patients could not undergo hematopoietic stem cell transplantation due low CD34+ cellularity.
Conclusion: There are differences between products collected from the good mobilizer (rich in GM and CD34) versus poor mobilizer (with plerixafor) rich in CN and CMN. The mobilization with Zarzio® could be smaller than expected since there are no significant differences if we compare the good mobilizers versus the bad mobilizers although the number of cases studied can be limiting.
CP14
Characterize the Effect of Rat Mesenchymal Stem Cells on Hemostasis and Platelet Function in Vitro
Xiaowu Wu*, Daniel N. Darlington, Bin Liu, Jeffrey D. Keesee, Robbie K. Montgomery, Andres S. Penagosnino and Andrew P Cap
U.S. Army Institute of Surgical Research
Background/Case Studies: Mesenchymal stem cells (MSCs) have been widely studied and have shown beneficial effects on tissue regeneration, immunomodulation, and improvement of multiple organ failure caused by infection, sepsis, and trauma. However, MSCs express tissue factor, which may be a risk factor for thrombosis especially if administrated systemically following trauma when coagulopathies are common. Before applying MSCs in a preclinical animal model, we sought to determine the procoagulant properties of rat MSCs in vitro.
Study Design/Methods: Bone marrow and adipose derived MSCs (BMSC and AMSC) were isolated from bones (femur and tibia) and visceral fat tissue in normal young Sprague Dawley rats respectively. Both BMSCs and AMSCs were cultured and passaged using DMEM medium with 20% fetal bovine serum. BMSC and AMSC at passage 2‐5 were used in this study. The tissue factor expression of MSCs was determined by immunohistochemistry. Citrated whole blood collected from normal rats was treated with rat BMSCs and AMSCs at low, medium and high doses (1.5 × 10⁴/ml, 7 × 10⁴/ml and 1.5 × 10⁵/ml respectively). The prothrombin time (PT), coagulation properties and platelet aggregation (response to ADP, collagen and PAR4) were measured by hemostasis analyzer, rotational thromboelastometry (ROTEM) and impedance aggregometry (Multiplate) respectively within 30min and 2hr after incubation.
Results/Finding: Tissue factor was significantly expressed among both BMSC and AMSC at all passages in vitro. BMSC and AMSC at any dose and time of treatment neither shortened nor elongated PT in whole blood. However, both BMSC and AMSC significantly shortened the clotting time (CT) (None: 334 ± 35 seconds, versus low, medium and high doses of AMSC (145 ± 2, 111 ± 6, and 75 ± 12 seconds), and BMSC (155 ± 2, 90 ± 10, 80 ± 7.0 seconds), p<0.05), clot formation time (CFT, p<0.05) and increased alpha angle (p<0.05) by NATEM measurement, but did not significantly affect the CT, CFT and alpha angle by EXTEM. Maximum clot firmness (MCF) and fibrinolytic index were not affected by MSCs. There was no significant impact of both BMSC and AMSC on platelet aggregation simulated by ADP, collagen and PAR4. No significant differences of hemostatic and platelet function were found between the treatments of BMSC and AMSC.
Conclusion: Consistent with reports from human derived MSC, both rat BMSC and AMSC significantly expressed tissue factor in both early and late passages, which led to a significant decrease in clotting time at various dose and time of treatment. However, MSCs had no direct impact on platelet aggregation in vitro. As considering the procoagulant capability of MSCs, future study will be necessary to determine the optimal dose and safety of using MSCs for systemic application in vivo.
CP15
Comparison of the Terumo BCT MNC and Cmnc Protocols for Peripheral Blood Stem Cell Collections
Lindsey Westbrook*1, Neil Bagamasbad2, Reynold Dilag2, Melissa Nasser2, Nicole Bauer2, Jennifer Wheeler3 and Mary Berg1
1Department of Pathology, University of Colorado ‐ Anschutz Medical Campus, 2Department of Medicine, Division of Hematology, University of Colorado Hospital, 3Scientific Support, Terumo BCT
Background/Case Studies: Terumo BCT recently offered a new method of peripheral blood stem cell (PBSC) collection using the Spectra Optia, an apheresis instrument. The new protocol, Continuous mononuclear cell collection (CMNC) collects cells continuously as opposed to the older protocol, the Mononuclear cell collection (MNC) protocol, which is batch collection or dual stage collection, involving an additional step where platelets are separated from MNC within a cell separation chamber. Our institution has used both protocols and the purpose of this study was to compare PBSC product characteristics and run times between the CMNC and the MNC protocols.
Study Design/Method: A retrospective review and comparison of parameters from 120 collection procedures using the MNC protocol and 173 collection procedures using the CMNC protocol was done using the t‐test. Data from patients/donors (including 36 allogeneic donors) as well as procedure details including run time, flow cytometry marker for stem cells (CD34)‐positive (CD34+) throughput, CD34+ collection efficiency (CE%), platelet loss per total blood volume processed (plt loss/TBV), and collection product characteristics were included in the analysis.
Results/Finding: Numerical results are summarized in the Table. The MNC and CMNC donor groups included 14 and 22 allogeneic donors, respectively. Donor weight was not significantly different between the two groups. Pre‐procedure WBC values were also similar between the two groups.
Run time was found to be significantly shorter using the CMNC protocol compared to the MNC protocol. Product volume was also significantly lower in the CMNC group compared to the MNC group. Although the volume was lower, the CMNC product had significantly higher percentages of mononuclear cells (mono%) and lymphocytes (lymph%) collected when compared to the MNC product. The CD34+ throughput was significantly higher in the CMNC group than the MNC group. The CD34+ CE% was found to be slightly increased in the CMNC group, though not significantly. The platelet loss was not significantly different between the protocols when normalized for total blood volume. Product hematocrit (HCT%) was significantly higher using the CMNC protocol; however, the red blood cell volume never exceeded 20mL due to the lower product volume with the CMNC protocol.
| Donor Wt (kg) | Pre WBC (x10e3/µL) | Run time (min) | Product volume (mL) | Mono% | Lymph % | CD34+ throughput (cells/min) | CD34+ CE% | Plt loss/TBV | HCT% | |
|---|---|---|---|---|---|---|---|---|---|---|
| MNC | 85.2 ± 19 | 53.3 ± 29 | 379 ± 66 | 499 ± 152 | 61.8 ± 16 | 21.3 ± 10 | 0.022 ± 0.008 | 45.9 ± 13 | 12.1 ± 3.8 | 1.8 ± 0.7 |
| CMNC | 82.0 ± 20 | 49.4 ± 19 | 302 ± 44 | 302 ± 70 | 68.9 ± 14 | 27.6 ± 11 | 0.029 ± 0.009 | 47.6 ± 11 | 11.6 ± 2.6 | 3.7 ± 0.9 |
| P‐Value | NS | NS | <<0.05 | <<0.05 | <<0.05 | <<0.05 | <<0.05 | NS | NS | <<0.05 |
Conclusion: The CMNC protocol collects a smaller volume of a purer product when compared to the MNC protocol with comparable platelet and red blood cell loss. Staff members who perform apheresis procedures are pleased by the shorter run time.
CP16
Conundrums Surrounding Organ Transplant in a Hematopoietic Stem Cell Transplant Recipient
Helen LaCarrubba*, Maria Aguilucho, Misty Marchioni, Donna King, Rafiya Khan and Prakash Rao
NJ Sharing Network
Background/Case Studies: Hematopoietic stem cell (HSC) donors and their recipients need not have a matching blood type. Eventually, the HSC recipient will become the blood type of the HSC donor. This scenario can become quite a conundrum if the HSC recipient becomes a patient in need of an organ transplant. In order for a patient to receive a donor organ, the patient and donor's blood type and HLA typing must be compatible.
Study Design/Methods: Blood type was determined using gel test cards. HLA typing was determined by using sequence‐specific oligonucleotide (SSO), sequence‐specific primer (SSP), and sequence based typing (SBT) technologies. HSC sources were bone marrow and umbilical cord blood.
Results/Findings: Patient #1, originally typed as an A2, had 1 bone marrow donor and 2 cord blood transplants. One of the cord blood transplants successfully engrafted. The engrafted unit was from a type O donor. Patient #1 is now typing as type O.
Patient #2 was originally typed as A2 and received a bone marrow transplant from a type B donor. Patient #2 is now front‐typing as a B and back‐typing as an AB. Since the patient's ABO front and back‐type do not match, a note must be made, that when confirming ABO during crossmatch, the ABO will not match. The patient now has an HLA and ABO identical kidney match (his father who is a type B). Previously, the patient and his father were ABO incompatible.
|
Patient #1 (2Y AA Male) (Aplastic Anemia) |
HSC Donor #1 – bone marrow (Father) | HSC Donor #2a – cord blood | HSC Donor #2b – cord blood | Patient #1 Now (matches HSC Donor #2a) | |
|---|---|---|---|---|---|
| HLA‐A | 11:01, ‐ | 11:01, 23:01 | 03:01, 11:01 | 11:01, 26:01 | 3,11 |
| HLA‐B | 18:01, 57:03 | 18:01, 44:03 | 18:01, 57:03 | 18:01, 51:02 | 18,57 |
| HLA‐Bw | 4,6 | 4,6 | 4,6 | ||
| HLA‐C | 07:01, ‐ | 07:01, 03:03 | 07:01, ‐ | 07:01, 15:02 | 7,‐ |
| HLA‐DRβ1 | 04:03, 09:01 | 04:03, 16:02 | 04:03, 13:02 | 04:03, 09:01 | 04:03, 13:02 |
| HLA‐DRB3 | 03:01 | ||||
| HLA‐DRβ4 | 01:01, 01:03 | 01:03, ‐ | 01: | ||
| HLA‐DQβ1 | 02:02, 03:02 | 03:02, 05:02 | 03:02, 06:04 | 03:03, 03:03 | 03:02, 06:04 |
| ABO | A2 positive | A2B positive | O positive | O positive | O positive |
|
Patient #2 (30Y W Male) (Multiple Myeloma) |
HSC Donor #1 – bone marrow (Father) | Patient #2 Now (matches HSC Donor #1) | |
|---|---|---|---|
| HLA‐A | 3, 25 | 1, 25 | 1, 25 |
| HLA‐B | 7, 18 | 8, 18 | 8, 18 |
| HLA‐Bw | 6, ‐ | 6, ‐ | 6, ‐ |
| HLA‐C | 7, 12 | 7, 12 | 7, 12 |
| HLA‐DRβ1 | 15, ‐ | 15, 17 | 15, 17 |
| HLA‐DQβ1 | 6, ‐ | 2, 6 | 2, 6 |
| ABO | A2 | B |
Front‐typing: B, Back‐typing AB |
Conclusion: The ABO and HLA results on both patient #1 and patient #2 indicate that the HSC transplants have engrafted. Results also indicate that the ABO and HLA now match that of the donor and differ from the recipient's original ABO and HLA type. Due to various reasons, for example, a side effect of the immunosuppression, both patients now need a kidney transplant.
Both patients will be entered into the UNet system according to their “new” ABO and HLA types, as UNOS regulations require patients to be listed as per the results of two separate ABO typing tests. The patients’ antibodies will be monitored as per lab policy and communication with the transplant centers and blood banks is crucial.
CP17
Determine the Effect of Hypoxia on Procoagulant Properties of Rat Mesenchymal Stem Cells
Xiaowu Wu*, Daniel N. Darlington, Jeffrey D. Keesee, Bin Liu, Robbie K. Montgomery, Josue Garciamarcano and Andrew P Cap
U.S. Army Institute of Surgical Research
Background/Case Studies: Mesenchymal stem cells (MSC) are beneficial for tissue regeneration, immunomodulation and improvement of multiple organ failure caused by infection, sepsis, and trauma. MSCs express tissue factor (TF) that activate the clotting cascade and interfere hemostasis. Hypoxia is a condition that occurs after trauma globally during shock or at the site of injury, and is known to change or influence the phenotypes of cells, including MSCs. In this study, we want to determine if hypoxia changes the expression of tissue factor and the pro‐coagulant properties of rat MSC in vitro.
Study Design/Method: Bone marrow and adipose derived MSCs (BMSC and AMSC) were isolated from bones (femur and tibia) and visceral fat tissue in normal young Sprague Dawley rats respectively. Both BMSCs and AMSCs were cultured using DMEM medium with 20% fetal bovine serum under either normoxia (20% O2) or hypoxia (3.5% O2). MSC growth curves were measured by cell counter. The TF expression was determined by immunohistochemistry. CD90/CD29 and CD45 were measured as positive and negative markers of MSC respectively by flow cytometry. The citrated rat whole blood was treated with MSC (1.5 × 10⁵/ml) either from normoxia or hypoxia. The coagulation properties were measured by hemostasis analyzer and rotational thromboelastometry (ROTEM).
Results/Finding: Hypoxia potentiated the growth of BMSC by 15%, but depressed the growth of AMSC by 30% at day 5 in comparison to normoxia. Both BMSC and AMSC equally expressed CD90 and CD29 but not CD45 under any culture condition. Tissue factor was significantly expressed among BMSCs and AMSCs from both normoxia and hypoxia. Whole blood treated with BMSCs and AMSCs from normoxia significantly shortened the clotting time (CT: 468 ± 64 (control), versus 170 ± 13 (BMSC), and 195 ± 60 (AMSC) seconds) by NATEM. Hypoxia also significantly shortened CT (165 ± 20 (BMSC), 169 ± 50 (AMSC) seconds, p<0.05 as compared to control), but the changes in CT were not significantly different between BMSCs and AMSCs. Maximum clot firmness (MCF) and fibrinolytic index did not change after treatment with BMSC and AMSC regardless of the normoxia or hypoxia conditions.
Conclusion: Tissue factor is constitutively expressed in rat BMSCs and AMSCs. Adjustment of the MSC culture condition to hypoxia did not affect tissue factor expression or the procoagulant properties of MSC (BMSC and AMSC). This study also suggests that the procoagulant properties will not be affected if MSCs are recruited into injured tissues with hypoxic environments. Future study will be necessary to determine the optimal dose MSC and whether it is safe to use MSCs for systemic application in trauma.
CP18
Effect of Double‐End Cryopreservation on Gene‐Transduced Human Hematopoietic Stem and Progenitor Cells
Sandeep K Srivastava*, Jiaqiang Ren, Steven Highfill, Narda Theobald, Suksee DeRavin, Andre Larochelle, David F Stroncek and Sandhya R Panch
National Institutes of Health
Background/Case Studies: Current early‐phase clinical gene therapy trials use freshly collected or cryopreserved CD34+ cells as the starting fraction prior to gene manipulation. Following gene‐transduction and culture, the end product is infused fresh into recipients. For wider applicability and scale‐up, gene therapy manufacturing protocols would benefit from double‐end cryopreservation (DEC) of CD34+ cells during manufacture (i.e. immediately post‐collection and again, post‐gene modification). DEC helps delink patients’ preparative conditioning phase from cell manufacture, eases logistics of inter‐facility cell transportation, and ensures fulfillment of regulatory product release criteria before infusion. Our objective was to study the effects of DEC on gene transduced mobilized peripheral blood (MPB) CD34+ cells.
Study Design/Method: Cryopreserved CD34+ cells from 2 healthy adult donors were thawed and transduced (TR) in RetroNectin coated tissue culture bags with an EF1‐alpha‐YFP lentivirus (2.5% concentration) and media (X‐VIVO‐10, human serum albumin(HSA), 100 ng/mL each of cytokines (SCF, TPO and FLT3‐L) over 2 days. Untransduced (UTR) cells were cultured as controls. TR and UTR fractions were re‐cryopreserved. A standard freeze‐mix of 5% DMSO, 6% Pentastarch, HSA, plasma‐Lyte A was used for cryopreservation. Viability, Hematopoietic stem cell (HSC) (CD34+CD38‐CD45RA‐CD90+CD49f+ cells) phenotyping and CFU assays were done following first thaw (PT1), post‐transduction (PTxn) and second cryopreservation‐thaw (PT2).
Results/Finding: TNC recovery decreased gradually in the donor samples at each step. Transduction efficiency, CD34%, CFUs were similar before and after PT2. HSCs ranged from 824 to 1655 cells/106 CD34+ cells in the PT2‐TR arm compared to a range of 286 to 1416 /106 CD34+ cells after PT1. Viability, % CD34+ and CFUs were lower in the TR compared to the UTR arm. This difference was not altered after PT2 (Table).
Conclusion: DEC of MPB human CD34+ cells decreases TNC recovery, but has minimal effects on CD34+ cell phenotype, transduction efficiency and cell function. HSC numbers were within acceptable range after re‐cryopreservation. Lower viability and CD34% in the TR arm compared to the UTR arm is likely due to vector toxicity. This was unaffected by re‐cryopreservation. Additional studies to assess DEC mediated changes on CD34+ cell early apoptotic markers, telomere lengths, gene expression and engraftment potential in NOD/SCID mice will inform clinical trials.
| Donor 1 | Donor 2 | ||||||||||
|---|---|---|---|---|---|---|---|---|---|---|---|
| PT1 | Post Txn | PT2 | PT1 | Post Txn | PT2 | ||||||
| UTR | TR | UTR | TR | UTR | TR | UTR | TR | ||||
| Viable TNC recovery (%)* | 99 | 98 | 68 | 87 | 69 | 73 | 52 | 36 | 52 | 25 | |
| CD34 (%) | 99 | 94 | 88 | 96 | 89 | 84 | 95 | 85 | 94 | 84 | |
| Transduction efficiency (%) | ___ | 0 | 9.4 | 0 | 11.9 | ___ | 0 | 25 | 0 | 22 | |
| CFUs/1000 plated cells | 205 | 272 | 201 | 283 | 186 | 237 | 268 | 235 | 285 | 267 | |
Calculated as a fraction of TNC in the starting fraction, i.e. before first cryopreservation
CP19
Engraftment and Post‐Thaw Viability of Cryopreserved Peripheral Blood Stem Cells for 04 – 09 Years
José Roberto Luzzi*, Daniel Bassetto Jesuino, Roberta Araújo Navarro‐Xavier, José Antonio Rosa and Paulo Roberto Oliveira Messias
Hospital Samaritano Blood Bank and Transfusion Service
Background/Case Studies: Autologous peripheral blood stem cell (PBSC) transplantation has been used as a powerful resource during the treatment of some hematological malignancies. Cryopreservation of these cells is routinely performed to allow for patient adequate conditioning and chemotherapy. In some cases, PBSC are harvested as a backup option and remain stored for several years, although effect of storage lesion in this product is still controversial. Our work presents retrospective data on PBSC infusion after long‐term storage.
Study Design/Method: All products were harvested after patient mobilization with G‐CSF by apheresis with COBE Spectra®. Flow cytometry analysis of CD34+ cells was performed prior to cryopreservation. The cryoprotective solution was freshly prepared by addition of 20% hydroxyethyl starch, 18% human serum albumin and 10% DMSO at final concentration. PBSC were cryopreserved by direct immersion on ‐80°C mechanical freezer (dump freeze) and stored until transplantation. Post‐thaw viability was determined from stored cryotube samples by Trypan Blue exclusion minutes prior to infusion. Cells were thawed and infused on bedside. Engraftment was defined as the first day of 03 consecutive days of neutrophil count >0.5 x10⁹/L and platelet count >20 x109/L after 07 days.
Results/Finding: There were 06 multiple myeloma and 01 Non‐Hodking lymphoma, all from relapses after first PBSC transplant. Median patient age was 65 (range 49 – 73). Median storage time was 06 years (04 – 09). CD34 content at harvest was 2.33% (0.78 – 7.42) and median infused CD34 content was 4.5 x 10⁶ cells / Kg (3.41 – 35.24). Cell viability prior to cryopreservation was 98% (97 – 100) and post‐thaw 86% (75 – 90), with median loss of 14% (8 – 23). Engraftment median until neutrophil recovery was 11 days (9 ‐ 13) while platelet recovered in 12 days (8 ‐ 19), which was comparable to our data from PBSC infused < 02 years storage. Neutrophil and platelet recovery were 03 and 06 days lower than values published by AABB (2009). Pearson's correlation index showed moderate negative correlation (r = ‐0.4799) between storage time and viability loss. Infusion reactions were mild and self‐resolved, such as nausea and coughing, and no microbiological positive samples were reported prior to cryopreservation.
Conclusion: Cell integrity in cryopreserved products depends on differences regard to many factors that can affect the quality of PBSC, as cooling rate (freezing curves) and cryoprotective solution. Our data demonstrated that even not widely recommended, dump freezing combined with constant temperature storage could generate good results for cell viability and engraftment time. Also, it is reasonable to consider longer storage times for autologous PBSC as second chance therapeutics for some hematological malignancies relapse.
CP20
Evaluation of Efficacy of Peripheral Blood Stem Cell Collection Endpoint with Prediction Algorithm
Rafaela Guerra Maciel*, Sandra Satoe Kayano, Ingrid Priscila Ribeiro Paes Ferraz, Marcos Paulo Colella and Rafael Colella
A C Camargo Cancer Center
Background/Case Studies: The increased number of patients ongoing bone marrow transplantation requires a better understanding of hematopoietic progenitor cells (HPC) harvest apheresis to obtain enough cells for the transplant without submitting the patient or donor to excessive procedures.
Objective:Evaluate whether we can accurately predict yield of HPC harvest apheresis for both patients and healthy donors with target value tailored (TVT) apheresis.
Study Design/Method: We performed a retrospective analysis of 208 HPC collections using COBE Spectra device in 117 patients and 42 healthy donors from December 2015 to present date. Healthy donors were mobilized with G‐CSF for four days and patients with G‐CSF for five days with use of Mozobil when CD34+ was below 10 x 106 cells/L on the fourth day. HPC collection was performed on the fourth day of mobilization for healthy donors and on the fifth day for patients. All procedures were realized based on a prediction algorithm using pre‐CD34+ on the day of the collection and estimating WBC liters to be processed to obtain sufficient stem cells for the transplant. This algorithm was designed using linear regression of peripheral blood CD34+ on the day of the collection versus collected CD34+ per liter of blood processed. There was no distinction between patients and donors, once the efficiency coefficient was used for both. Collected material was sent to analysis and total CD34+ was calculated. Final laboratory count of CD34+ per kilogram was compared with the number predicted by the algorithm with Spearman's correlation to evaluate whether the formula is effective. Calculations were made using IBM SPSS 23 Software.
Results/Findings: Among patients collecting HPC for autologous transplantation, 69,23% needed only one day of HPC harvesting, while 25,64% needed two days and 5,13% needed three or more days. Our collection efficiency (CE) and standard error of the mean (SEM) was 49 +‐ 2,91%. After comparing predicted values with CD34+ collected in the final product, we found a very strong correlation of 0.873 (p<0.01) for patients and a strong correlation 0.653 for healthy donors (p<0.01).
Conclusion: The use of a mathematical model with a prediction algorithm is safe, has low cost and provides a good tool to estimate WB liters to process and avoid unnecessary procedures in both patients and healthy donors.
CP21
Fresh or Frozen, a Comparison of Umbilical Cord Mesenchymal Stem Cells.
Matthew Wilgo*, Brad Blaney, Grace Centola, Angela Dexter, Kayla Jewett, Cassandra Kirwan, Jawad Husein, Diego Hernandez, Glenda Hernandez and Micah Blondeau
New England Cord Blood Bank
Background/Case Studies: Mesenchymal stem cells (MSC) are poised to be an invaluable part of regenerative medicine in the coming years. It is increasingly common for cryopreservation of umbilical cord derived MSC (UC‐MSC) in both public and family banks. Reports vary on both the techniques to cryopreserve UC‐MSC, and the ability to successfully obtain viable cultures upon thawing.
This study evaluated the phenotypic characteristics of UC‐MSCs derived from fresh and cryopreserved cord tissues (CT), as described in ISCT's position paper on minimal characteristics of mesenchymal stem cells (plastic adherent; ≥95% CD90, CD105, CD73 and ≤2% CD14, CD19, CD34, CD45, HLA‐DR)
Study Design/Method: Umbilical cord tissue (N=10) was washed, blood vessels removed, cut into 0.5‐3mm pieces, and washed twice in saline. Fresh tissue was immersed in 0.9% saline for same day culture, while frozen tissue was cryopreserved for at least 24 hours prior to culture.
For colony forming unit (CFU) testing tissue was plated directly in a 25cm2 tissue culture flask following a wash in PBS with antibiotic/antimycotic. The tissue was allowed to adhere for 10 minutes prior to the addition of cell culture media. Media was changed several times a week. Cells were passed when robust colony growth was observed and in subsequent cultures >80% confluence. All cells were tested on an MSC flow panel at passage 2 just prior to confluence.
Results/Finding: Both fresh and cryopreserved tissue showed excellent colony forming capabilities. Average time for cellular emergence of 8 days (Fresh = 7.8, Frozen = 8.1), and 13 days (total) for the MSC's to reach passage 1 (Fresh = 12.6, Frozen 13.4). All cells were ready for flow analysis in approximately 3 weeks time. There was no statistical difference between fresh and frozen tissue in their colony emergence (p = 0.81), or their growth rates (p > 0.05 for all). Flow cytometry showed average ≥95% for positive markers and ≤2% negative markers. There was no statistical difference between fresh and frozen flow result (p > 0.05).
| CD90 | CD105 | CD73 | CD‐Neg | |
|---|---|---|---|---|
| Fresh | 100.0 | 99.6 | 98.4 | 0.2 |
| Frozen | 99.8 | 100.0 | 99.3 | 0.3 |
Conclusion: UC‐MSC's show excellent adherence to plastic in both fresh and frozen explant cultures, with a consistent fibroblast‐like morphology. Flow cytometry analysis showed strong MSC phenotype in both fresh and frozen samples. The data show that the cryogenic process does not appear to have any detrimental effects on the ability to obtain MSC colonies.
CP22
Impact of UCB Storage Time on Cell Recovery and Viability
Luciana Luppi*, Aline Souza, Isa Theodoro, Telma Campos, Dayse Meirelles, Gabrielle Mendes, Rafaela Santos and Roberto Waddington
Cordvida
Background/Case Studies: Hematopoietic stem cell transplantation (HSCT) is a therapeutic strategy used to treat patients with onco‐hematological diseases. Umbilical Cord Blood (UCB) is a proven graft source for HSCT.
Studies have shown that HSCT improves survival and disease‐free survival rates when compared to conventional chemotherapy treatments.
The increase in the number of HSCTs over the last years has demanded quality and safety improvements of cell processing and cryopreservation services.
Cell recovery and viability are crucial parameters to assess UCB quality as a viable HSCT graft source.
Study Design/Method: Twenty‐five UCB units cryopreserved for periods of 2 up to 11 years (2004 to 2017) were analyzed. Units underwent red cell and plasma depletion and then subjected to controlled rate freezing and subsequent cryopreservation using DMSO (dimethylsulfoxide) cryoprotectant with 10% concentration. Informed consent and the unit discard terms for all units were obtained.
Units were thawed in a 37° C water bath and 0.5ml aliquots were diluted at a 1:1 proportion with 5% human albumin solution and plasmin were prepared, enabling DMSO stabilization and concentration reduction.
The following analysis were performed: nucleated cell count (TNC) in an automated hematologic counter and cell viability using flow citometry.
Post‐processing (pre‐cryopreservation) cell viability was tested using trypan blue as exclusion dye, while post‐thaw cell viability was assessed using 7‐AAD marker through flow cytometric analysis.
Results/Finding:
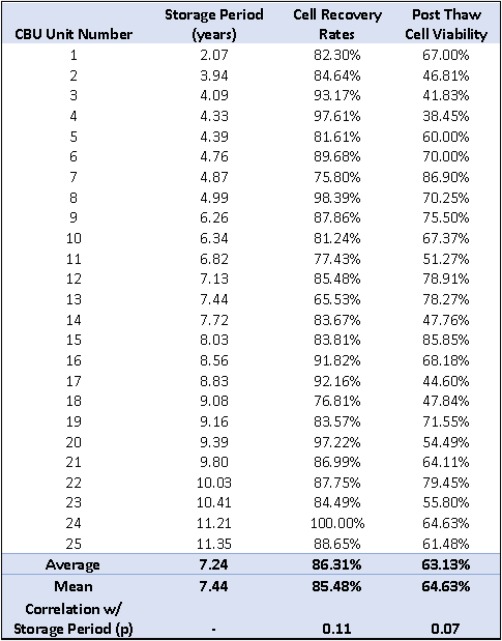
UCB storage period was 7.24 years (mean) and cell recovery was 86.31% (mean). There was no statistically significant correlation between storage period and post‐processing cell recovery (p = 0.11).
Post‐thaw cell viability of 63.13% (mean) showed no statistically significant correlation with unit storage period (p = 0.07).
Post thaw cell viability results are within parameters defined in other studies.
Conclusion: These results indicate there is no correlation between UCB storage time period and cell recovery, as well as post‐thaw cell viability.
CP23
Isolation of Mesenchymal Cells from Composite Umbilical Cord Tissue Cryopreserved for 5 Years
Matthew L. Skiles*1, Katherine S. Brown1 and Heather L. Brown2
1Cbr Systems, Inc., 2CBR Systems, Inc.
Background/Case Studies: Umbilical cord (UC) tissue is a rich source of mesenchymal stem cells (MSCs) that can be collected noninvasively at birth and stored for potential future use. As such, a growing number of stem cell banks have established UC storage programs based on mounting preclinical evidence of its therapeutic potential. However, little has been reported on the ability to isolate MSC‐like cells from UC tissue after extended periods of cryopreservation. This work describes and characterizes the isolation of MSCs from UC tissue cryopreserved as a composite material at a family stem cell bank for 5 years.
Study Design/Method: Donated UC units from consenting mothers were evaluated. Units had been cryopreserved as composite tissue pieces in LN2 vapor in a DMSO‐based cryoprotectant for 5yrs. (5.49 ± 0.431; n=4). Units were rapidly thawed and rinsed in DPBS, then 25 pieces were excised from each using a biopsy punch. Pieces from each unit were explanted in a 5x5 grid pattern in MSC‐supportive medium and incubated for 7 days, after which the tissue was discarded and media exchanged. Cells were isolated on the 14th day, counted, and subcultured for two passages. At the end of each passage, cells were collected, counted and population doubling time was calculated. Isolated cells from each unit were also evaluated for MSC immunomarkers.
Results/Finding: Small, proliferative cells with fibroblastic morphology were obtained from all explants, yielding a 100% success rate. Cells were positive for the MSC markers CD73, CD90, and CD105 (98.8 ± 0.7%, 98.7 ± 0.6%, and 97.8 ± 0.6%, respectively) and negative for the hematopoietic markers CD34/45 (1.1 ± 0.7%). Passage 1 and passage 2 doubling times were 1.92 ± 0.47 days and 2.07 ± 0.43 days, respectively, which are in line with values reported for MSCs isolated from fresh UC tissue.
Conclusion: Due to their immature status, ease of collection, and potential therapeutic value, UC MSCs are an appealing candidate for future clinical research and treatment. The present work demonstrates that the long‐term cryopreservation of UC tissue does not disrupt the ability to isolate functional MSCs from the tissue at a later date. Importantly, growth characteristics of isolated MSCs appear to be comparable to those reported for MSCs from fresh UC tissue. Based on the consistent isolation and lack of apparent impact on proliferation kinetics, it is reasonable to expect cell yields in the range anticipated for therapeutic requirements and more than sufficient for moving to clinical grade bioreactors for expansion. These results support the feasibility of storage of UC as a composite material for future potential cell isolation and expansion to clinically relevant doses.
CP24
Large Volume Leukapheresis with Spectra Optia Cmnc Protocol in Adult and Pediatric Patients: Performance and Determination of CD34 Yield Prediction Algorithm
Ines Bojanic*1, Nelly Besson2, Ivana Vidovic1 and Branka Golubic Cepulic1
1Department of Transfusion Medicine and Transplantation Biology, University Hospital Centre Zagreb, 2Terumo BCT
Background/Case Studies: Large volume leukapheresis (LVL) have shown to enhance CD34+cell yield collected. This study evaluated performance and safety of the Spectra Optia CMNC protocol (version 11) in adult and pediatric LVL. A prediction algorithm for CD34+cell yield was also tested.
Study Design/Method: We evaluated retrospectively 67 LVL performed in 46 adult patients, and 14 LVL in 11 pediatric patients treated in UHC Zagreb from March 2016 till September 2016. Mobilization regimen combined chemotherapy and filgrastim; 2 poor mobilizes received plerixafor additionally. A combination of ACD‐A and heparin was used as anticoagulant (ACD‐A:whole blood ratio 1:24). In patients weighting≤25kg (n=9), a RBC prime was performed.
CD34, lymphocyte(Ly) and monocyte(Mo) collection efficiencies (CEs) were calculated. A customized prediction algorithm was determined on linear regression between pre‐CD34+cell count and CD34+cells collected / blood volume processed. Prediction accuracy was evaluated by comparing predicted CD34 values to real CD34 yield. Results are presented as median (IQR).
Results/Finding: In both groups, CD34, Ly and Mo CEs were high. Target CD34 dose was successfully reached in 1 procedure in 30 (65,2%)adults and in 9 (81.8%) children. All procedures were well tolerated: adverse reactions were restricted to mild citrate toxicity symptoms in 5 (7.5%) adults, while all pediatric apheresis went uneventful. No bleeding episodes occurred, and no transfusion was needed.
Product and procedure characteristics*
| Adults (N=46) | Children (N=14) | |
|---|---|---|
| CD34 dose (x106/kg) | 4.8(2.3‐10.6) | 11.1(3.2‐16.3) |
| TBV processed (L) | 21.3(19.3‐25.5) | 5.5(5.0‐5.5) |
| Time (min) | 300(270‐301) | 300(270‐300) |
| CD34 CE1(%) | 49(37‐57) | 46(39‐60) |
| Ly CE1(%) | 54(46‐62) | 63(51‐75) |
| Mo CE1(%) | 43(25‐66) | 49(23‐84) |
median, IQR; CE = collection efficiency
A high correlation between preCD34+cells and CD34+cells collected/blood volume was observed in both groups (r²=0.97 and 0.83 in adults and children respectively, p<0.0001) suggesting CD34 yield could be predicted based on preCD34+cells and blood volume to process. Linear regression equations served as prediction algorithm. The high correlation between predicted CD34 yield and observed CD34 yield (r²=0.95 and 0.82 in adults and children respectively, p<0.001) showed accuracy of the algorithm. Implementation of the algorithm could have allowed sparing a median of 10.1(8.9‐12.9)L of blood in 20 adult procedures, and 5.9(3.5‐7.8)L in 7 pediatric procedures.
Conclusion: LVL performed using Spectra Optia CMNC protocol is safe and efficient in adults and in low body weight children. High CD34, Ly and Mo CE1 were observed in both groups. Implementation of a predictive algorithm can reliably minimize blood volume processed, shorten procedure duration, reduce anticoagulant volumes infused, and improve patient comfort.
CP25
Mesenchymal Stem Cell Therapy in Steroid Refractory Graft‐Versus‐Host Disease (GVHD)
Emese Molnar*1, Aniko Barta2, Arpad Batai2, Zoltan Csukly2, Zita Farkas2, Laszlo Gopcsa2, Gabor Tatai2, Lilla Lengyel2, Tamas Masszi3, Gabor Mikala2, Melinda Paksi2, Marienn Reti2, Eva Torbagyi2 and Peter Remenyi2
1Hungarian National Blood Transfusion Service, 2Department of Hematology and HSCT – St. Istvan & St. Laszlo Hospital, 33rd Department Of Internal Medicine – Semmelweis University, Budapest
Background/Case Studies: Steroid refractory acute graft‐versus‐host disease (GvHD) is a serious complication of allogeneic hematopoietic stem cell transplantation (HSCT). More experience accumulates in the immunomodulatory effect of mesenchymal stem cell (MSC) infusion in numerous immunopathological disorders – such as GvHD – and signals. MSCs have a HLA‐restrictive and non‐immunogenic nature.
Study Design/Method: We have evaluated the efficacy of MSC transfusions in cases of acute GvHD refractory to conventional immunosuppressive treatment. The patients with steroid‐resistant GvHD had received third‐party MSCs (derived from Wharton's jelly and bone marrow) 4 times per case weekly at a dose of 1 million cells/kg. Clinical response was assessed 28 days after administering the first dose. Complete remission was defined as the complete disappearance of symptoms. Partial remission was assessed by the significant relief of symptomsand by the general improvement of the patient's condition.
Results/Finding: In all 12 patients had received 13 cycles of MSC‐treatment (4 dose per cycle). The median age was 47 years old (19‐56) with a male/female ratio of 1:2. Distribution of the original malignancies (n): acute myeloid leukemia: 6; acute lymphoblastic leukemia: 2; myelofibrosis: 1; myelodysplastic syndrome: 1; multiple myeloma: 1; T‐cell lymphoma: 1. Nine patients had undergone allogeneic HSCT with matched unrelated donors, the other three had stem cells derived from HLA‐identic relatives. The first episode of GvHD after HSCT was started on the median 63rd day (7‐455). The involved organs were skin (2), gut (4), skin and gut combined (7) and even lung in 3 cases. The median time of MSC's first infusion was 274 (114‐1981) days after the stem cell transplantation (HSCT) and 165 (19‐1974) days after the first episode of GvHD. 4 of the 13 cycles of MSC‐treatment led to complete remission (30.8%) and 7 resulted inpartial remission (53.8%).
Conclusion: We have evaluated MSC‐therapy as an effective treatment of GvHD in the majority of the observed cases with 83% overall cumulative response rate. The application of third‐party MSCs offers a promising alternative in the therapy of GvHD and other GvHD‐associated complications after HSCT. Further research is needed to determine the optimal start of the treatment, along with the issue of long‐term safety.
CP26
Predictive Value of CD34+ Cells/Microliter in the Peripheral Blood on the Collection of Stem Cells for Transplantation
Ian M. Harrold*, Melissa R. George and Ronald Domen
PennState Health Milton S. Hershey Medical Center
Background/Case Studies: Stem cell collection by leukapheresis for transplantation is a significant endeavor for the patient and the clinical team. Whether the collection is allogenic or autologous, the patient undergoing the collection and the physicians caring for the patient are always concerned whether they will be able to harvest enough cells for transplantation and engraftment. A typical goal for most adult procedures is 2 million CD34+ cells/kg. If a patient does not reach this goal on the day of the procedure, they will likely have to return the following day to undergo a second procedure to reach the desired goal. Given the logistical challenges in planning transplantation, it is reasonable to attempt to optimize the number of cells collected while minimizing the number of collections. Measuring a patient's CD34+ cells/µL in their peripheral blood before the leukapheresis procedure has been used to predict if the collection will successfully reach the 2 million cells/kg goal. The ideal minimum CD34+ cells/µL that will lead to successful harvest has not been conclusively identified.
Study Design/Methods: We analyzed the collection data from 55 patients to evaluate the predictive value of the CD34+ cells/µL level. Data was collected over 6 months from every patient who underwent a stem cell collection. Four patients were allogenic donors and 51 were autologous donors. The patients’ weight, diagnosis, and pre‐procedure CD34+ cells/µL level were all collected. The run time, amount of volume processed, and the absolute viable CD34+ cells collected were recorded. The collection efficiency and the CD34+ cells/kg were calculated for each patient.
Results/Findings: Our data showed a strong linear correlation between pre‐procedure CD34+ cells/µL and post‐procedure CD34+ cells/kg (r=0.95). Any patient who had a pre‐procedure CD34+ cells/µL count of 29 or greater had a collection of at least 2 million cells/kg. Any patient who had a pre‐procedure CD34+ cells/µL count of 16 or less collected less than 2 million cells/kg. The patients with counts between 16 and 29 had variable results. Controlling for age and clinical diagnosis demonstrated no difference between younger versus older patients or the various disease states in the likelihood of collecting the target yield of cells.
Conclusion: The pre‐procedure CD34+ cells/µL level in the peripheral blood has a very strong predictive value for the post‐procedure CD34+ cells/kg level. To confidently know that a patient will be able to produce the desired 2 million cells/kg, a pre‐procedure CD34+ cells/µL count of at least 29 should be obtained. For any patient with a count below 16, they should be counseled that their collection is likely to take at least a second day and a second procedure. Further studies, including potentially lengthening the run time and the volume processed, to evaluate how to handle the patients who fall between 16 and 29CD34+ cells/µL should be conducted.
CP27
Replacement of Pentastarch with Hetastarch for Cryopreservation of Hematopoietic Progenitor Cells, Apheresis
Heidi Elmoazzen1, Antonio Giulivi1, Michael Halpenny*1, Lisa Martin1, Donna Perron1, Chris Bredeson2, Lin Yang1, Locksley McGann1, Paul Birch1 and Jason P. Acker1
1Canadian Blood Services, 2Ottawa Hospital
Background/Case Studies: A critical aspect of Hematopoietic Progenitor Cell processing is the cryopreservation method. Our program uses a “dump” freeze method consisting of product placement directly into liquid nitrogen vapour after addition of a cryopreservation solution containing DMSO (5% final concentration) and HES (Hydroxyethyl Starch). Pentastarch (HES source) a critical component of the cryoprotectant formulation was discontinued by the commercial vendor. This required that an alternative cryoprotectant formulation be validated to minimize the risk to patient safety without compromising engraftment quality.
Study Design/Method: The validation study consisted of 3 phases; first ‐ evaluation of the efficacy of four different cryoprotectant formulations, second ‐ evaluation of full scale production and crypreservation and third ‐ a concurrent validation for clinical transplant.
Phase I ‐ Samples from four different cryoprotectant formulations were tested for TNC, CD34, viability and CFU at three points during manufacturing (fresh, post processing and post thaw).
Phase II ‐ Mock HPC, Apheresis units were used for a side‐by‐side comparison of freezing curves for the control and replacement formulations.
Phase III ‐ Five clinical transplants were performed with HPC, Apheresis products cryopreserved using the recommended replacement (Hetastarch).
Results/Finding: Phase I –Results indicate that aliquots cryopreserved in 5% DMSO and 1.7% HES (Hetastarch) did not behave significantly different than cells cryopreserved in the control in terms of cell recovery, viability or cell proliferation assay (CFU).
Phase II ‐ The majority of freezing profiles displayed typical or expected bulk freezing profiles for both formulations.
Phase III – Transplants performed resulted in a mean engraftment time of 12.6 days for ANC500 with no adverse patient reactions observed. Engraftment times using the new Hetastarch formula were compared to the previous engraftment times with no significant difference.
Conclusion: A change in the formulation of a cryoprotectant solution represents a major change that could have a significant impact on quality. In addition, maintaining the current 5% DMSO final concentration was critical as post thaw washing is not performed at the clinical site, history demonstrating a very low toxicity rate with the existing formulation. This study demonstrated the acceptability of the Hetastarch formulation using 5% DMSO and 1.7% Hetastarch to replace Pentastarch in the cryoprotectant formulation used for cryopreservation of HPC, Apheresis products.
CP28
Similar Outcomes in Larger Patients (>100kg) Mobilized with Capped or Full Doses of Plerixafor
Gabriel Park*, Sepideh Shayani, Sean Wang, Tracey Stiller and Shan Yuan
City of Hope National Medical Center
Background/Case Studies: Autologous stem cell transplantation is usually performed with mobilized peripheral blood stem cells (PBSCs). Traditional mobilization regimens include granulocyte colony stimulating factor (G‐CSF) with or without chemotherapy, but have failure rates ranging from 5% to 40%. Plerixafor is an adjunct agent used to improve mobilization in many clinical settings. However, its high cost is a significant concern. The manufacturer‐recommended dose is 0.24mg/kg, therefore patients weighing >100kg would require a second vial, thus doubling the drug cost.
In 2013 we implemented a policy of capping plerixafor at 24mg for patients weighing >100kg. This retrospective study compares the mobilization of patients >100kg who received capped doses (2013‐2016), with historical control patients (2010‐2013) who received full or uncapped doses.
Study Design/Method: Patients weighing >100kg with CrCL >50ml/min who received capped and full doses of plerixafor were identified in the pharmacy database. Electronic medical records were used to collect baseline characteristics and cell collection data.
Results/Findings: A total of 47 and 40 consecutive patients were included in the capped and full dosing groups, respectively. They showed comparable baseline distributions of age, weight, gender and diagnoses. Plerixafor was given upfront, or as a rescue agent due to suboptimal mobilization in both groups. In the capped dosing group, fewer patients received chemo‐mobilization or plerixafor upfront. When compared to historical controls, they used half of the number of vials of plerixafor, but collected similar numbers of CD34+/cells kg and achieved a comparable collection success rate.
TABLE 1. Comparision between patients >100kg who received capped vs full dosing of plerixafor. Median and range or percentages are reported.
| Parameter | Capped Dose (n=47) | Full Dose (n=40) | P |
|---|---|---|---|
| Age | 55 (18‐74) | 57.5 (28‐70) | 0.60 |
| Male (%) | 34 (72) | 35 (87) | 0.08 |
| Diagnosis (%) | |||
| MM | 18 (38) | 11 (27.5) | 0.53 |
| NHL | 22 (47) | 24 (60) | |
| HL | 4 (9) | 4 (10) | |
| Germ cell | 3 (6) | 1 (2.5) | |
| Body weight(kg ) | 111.4 (100.1‐137.7) | 110.5 (101‐158) | 0.21 |
| BMI | 35.9 (26.5‐49.5) | 36 (27.1‐52.8) | 0.89 |
|
Mobilization Regimen (%) Chemo+G‐CSF G‐CSF only Upfront plerixafor |
28 (60) 16 (34) 3 (6) |
29 (72.5) 5 (12.5) 6 (15) |
0.04 |
|
Plerixafor Use # of Doses # of Vials Dose mg/kg |
3 (1‐6) 3 (1‐6) 0.22 (0.17‐0.24) |
3 (1‐6) 6 (2‐12) 0.24 (0.24‐0.24) |
0.11 <0.0001 <0.0001 |
| Success rate of collecting >2x10⁶ cells/kg | 98% | 90% | 0.21 |
| Total CD34+ cells collected (x106/kg ) | 4.08 (0.34‐11.26) | 3.36 (0.11‐30.73) | 0.86 |
| Rate collecting >2x10⁶ /kg | 98% | 90% | 0.21 |
| Total # of collection days | 4 (1‐7) | 5 (1‐8) | 0.01 |
Conclusion: The strategy dose capping plerixafor at 24mg for patients >100kg is cost‐effective and achieves comparable mobilization outcomes while decreasing the drug cost by half.
CP29
The Effect of Unrelated Allogeneic Peripheral Blood Stem Cell Donor Ethnicity on Mobilization and Apheresis Collection of CD34+ Cells
Rachel Beddard*1, Samantha Ngamsuntikul1, Eulogio Rodriguez2 and Dorothy Ward2
1BioBridge Global, 2GenCure
Background/Case Studies: Peripheral blood stem cells (PBSC) collected through apheresis of a related or unrelated donor continues to be an important allogeneic transplantation source with BeTheMatch® reporting several thousand PBSC transplants every year. The PBSC product cell dose is of utmost importance for engraftment, with 4x10⁶ CD34+ cells/kg of recipient weight considered the minimum required. Higher doses are required in reduced‐intensity conditioning and haploidentical transplants. Only a few studies have evaluated the effect of ethnicity on the success of PBSC mobilization. Vasu etal1 reported that White donors had the lowest CD34+ cell counts after mobilization compared to Black, Asian/Pacific and Hispanic donors in a population of 639 donors. Richa etal2 reported that race did not influence mobilization, but their cohort of 195 donors was much smaller. In a very large cohort of over 10000 donors, Hsu etal3 reported that African Americans had a much higher CD34+ level after mobilization compared to Whites. More data is needed to elucidate this area to ensure optimal donor selection by transplant centers.
Study Design/Method: All PBSC donors collected from January, 2014 through December, 2016 were retrospectively evaluated, representing 122 unique donors. One donor requiring emergent central line was excluded from analysis. Data collected on the remaining 121 donors included age (in years) at time of donation, gender, self‐declared ethnicity (Hispanic vs Not Hispanic), and donor pre‐apheresis peripheral %CD34. The races of the Non‐Hispanic group included: 1.6% South Asian, 1.6% Korean, 3.1% African American, 4.7% Northern European, 4.7% Other White, 6.2% North American Indian, 6.2% Western European, 28.1% Mixed, and 43.8% North American.
Results/Finding: The table shows the data on all 121 donors stratified by age group. Mean and range of %CD34 in peripheral blood were calculated. The data show that in the Non‐Hispanic group, the youngest donors (<30yrs) have a higher pre‐apheresis %CD34 level than any of the other groups, reaching statistical significance when comparing the %CD34 pre‐apheresis between the youngest group (<30 yrs) and the oldest group (>=40 yrs). Hispanic donors show statistically similar %CD34 pre‐apheresis levels over all age groups. Moreover, the Hispanic older age group (>=40yrs) had a statistically higher %CD34 pre‐apheresis level than the Non‐Hispanic older age group.
| Number of Donors | %CD34 Pre‐Apheresis | ||
|---|---|---|---|
| Mean | Range | ||
| All Hispanic Donors | 57 | .21 | .05‐.48 |
| <30 Yrs | 30 | .20 | .08‐.48 |
| 30‐39 Yrs | 11 | .22 | .09‐.38 |
| >=40 (range 40‐58) Yrs | 16 | .22* | .05‐.40 |
| All Non‐Hispanic Donors | 64 | .19 | .05‐.47 |
| <30 Yrs | 43 | .21+ | .05‐.47 |
| 30‐39 Yrs | 9 | .17 | .13‐.25 |
| >=40 (range 40‐52) Yrs | 12 | .14*+ | .06‐.22 |
Conclusion: In this analysis of 121 sequential unrelated PBSC donors, Hispanic donors maintain a similar pre‐apheresis %CD34 level even as the donor ages, while Non‐Hispanic donors show a decreasing pre‐apheresis %CD34 level as they age. If proven, this data would suggest there are genetic factors that modulate a person's ability to mobilize stem cells as they age and that these genetic factors differ between ethnic groups. This small data set would suggest that people of Hispanic ethnicity maintain a more robust and quickly responsive stem cell pool, even as they age. Further studies of larger cohorts are needed to validate this observation. If proven, this has far reaching implications within the stem cell research and therapy arena.
CP30
Use of Buffy Coat Derived Leukocyte Enriched Products for Evaluation of a Plasma Reduction Stem Cell Manufacturing Protocol
Anita Howell1, Angela Hill1, Kelly Murphy2, Brenda Letcher3, Sheila Langevin3, Jelena Holovati2, Jason P. Acker4 and Nicolas Pineault*1,5
1Canadian Blood Services, Centre for Innovation, 2Canadian Blood Services' Cord Blood Bank, 3Canadian Blood Services' Cord Blood Bank, 4Canadian Blood Services, 5University Ottawa
Background/Case Studies: An update in HPC apheresis collection software led to higher collection volume in the organization's human progenitor cell (HPC) products without a corresponding increase in total cellular counts. Incorporation of a volume reduction step was therefore warranted as larger product volumes require additional time to transfuse and lead to a larger DMSO load to the recipient, often resulting in the need to transfuse over several days. The objectives of this study were to develop suitable mock HPC (mHPC) products and evaluate the effectiveness of the BioSafe PeriCell volume reduction technology on white blood cell (WBC) recovery and viability.
Study Design/Method: HPC products are not readily available for development. mHPC were created from whole blood buffy coats (BCs). Fresh ABO compatible BCs were pooled and concentrated using centrifugation and manual extraction of supernatant and red cells. The mHPC products were then diluted in plasma to produce an appropriate concentration and volume. HPC collection data from last 3 years was analyzed to determine the 95th percentile, median and 5th percentile values for both HPC volume and WBC concentration. Six mHPC products were tested; three high WBC (234 x 106 cell / mL) and three low WBC (114 x 106 cells / mL) concentrations, each at high (505mL), low (265mL) and median (355mL) volumes. Each unit was processed sequentially from high, median and low volumes. Hence, the highest mHPC volume was processed for volume reduction first with a Sepax 2 (PeriCell Protocol, CS.430.1 kits), analyzed and then reconstituted and volume adjusted to the next volume target before being volume reduced again, and so forth. One additional mock product was prepared for a reproducibility study and was volume reduced three times. WBC concentration and 7‐AAD viability was determined before and after each volume reduction. A control sample was removed from the product prior to processing and sat on the bench top until the end of the protocol to assess the change in cell concentration and viability over time.
Results/Finding: Mock HPC products had a mean starting 7‐AAD viability of 76 ± 8% [range 64‐85]% and a hematocrit of 14 ± 5% [9‐19] which is well below the maximum allowable limit of the PeriCell. No significant differences in WBC recovery or change in viability were seen between the 6 mHPC products. Aggregate data showed that the mean WBC recovery of the volume reduction process was 97 ± 8% [64‐105] with a 3 ± 3% [‐2‐11] change in viability. The recovery protocol used to salvage product after each volume reduction gave a recovery of 99 ± 4 [92, 104] % and a change in 7‐AAD viability of 2 ± 2 [0, 11] % from the input product. The method was found to have a CV of 2.0%. The change in WBC concentration and WBC viability of the test products was not significantly different from the unprocessed control samples.
Conclusion: Mock BC products are a suitable alternative where HPC products are not available for development and are a good use of product otherwise directed for rejection and disposal. The volume reduction protocol evaluated had minimal impact on the WBC concentration and WBC viability in the mock products and was found to be highly reproducible, giving confidence that it will be a valuable processing step with HPCs and will facilitate transfusion of HPC products into the recipient. The protocol is now in use with patient HPC products and engraftment kinetics will be tracked in a post‐implementation study.
CP31
Validating the Use of an Infusion Pump for Infusion of Cryopreserved Hematopoietic Progenitor Cells – Single Institution Experience
Ronit Slotky*1, Michael Ancharski1, Johanna M Rojas1, Lara M Scrimenti1, Shawna Robilio1, Yen‐Michael Hsu2, Ljiljana Vladimir Vasovic2, Melissa Cushing2, Tsiporah B Shore2 and Koen van Besien2
1New York Presbyterian Hospital/Weill Cornell Medical Center, 2Weill Cornell Medicine
Background/Case Studies: Many centers use bedside thaw infusion. Maintaining functional and viable stem cells is fundamental for transplant success. To reduce potential damage to cells due to DMSO exposure, products must be administered promptly. Like most transplant centers, we previously infused products by gravity through high flow rate central venous lines. An existing peripheral line central catheter (PICC) is sometimes used. PICC line infusion can result in prolonged infusion time that can cause aggregation and accelerated cell death. Infusion time can be decreased by transferring the product to a syringe and using a manual push, but this may increase the contamination risk. Infusion pumps are routinely used for blood products, but are not commonly used for administration of Peripheral Blood Stem Cell products (PBSCs). The use of a pump can provide a consistent and controlled infusion practice. In this study we analyze the safety of infusion pump use for thawed autologous PBSCs.
Study Design/Method: Safety analysis of the Sigma Spectrum infusion pump (Baxter) was performed in 2 phases: in vitro simulation and in vivo clinical assessment. In the first phase, 2 cryopreserved PBSC products were tested. Two aliquots were thawed simultaneously for each product: One was passed through a pre‐set infusion pump and a second control aliquot was drained by gravity. Each aliquot was tested for baseline total nucleated cell (TNC) count and viability, and for final TNC recovery, Trypan Blue (TB) viability, CD34 7‐AAD viability, and potency (CFU). The effect of long‐term exposure to DMSO was assessed by visually inspecting the product for aggregates and measuring viability up to 3 hours post thaw. The second in vivo phase included use of an infusion pump for 10 consecutive autologous patients, with comparison of infusion and transplant outcomes to 18 previous infusions by gravity drip. Comparison variables included infusion rate, adverse events (AE), and engraftment time.
Results/Finding: No significant differences were observed between infusion pump and drip for the 2 products tested in vitro, including TNC recovery, cell viabilities, and potency. For both methods TNC TB viability decreased by more than 20% within 1 hour, while CD34+ cell viability remained stable up to 3 hours post thaw. Small aggregates appeared after 1 hour for both methods and increased by a similar rate over time. Comparison of infusion and transplant outcomes between drip and infusion pump patients showed no significant differences for all measured variables. Engraftment time was similar for both groups. ANC days to engraftment for pump and drip were 10.8 ± 1.3 and 11.6 ± 1.0, respectively (p‐value=0.075). Platelet days to engraftment for pump and drip were 17.9 ± 2.2 and 20.2 ± 5.0, respectively (p‐value=0.207). Infusion rates were slightly higher for the pump group. For control patients, 2 required transfer of products to syringes due to slow infusion rate and 2 others experienced allergic and hypotension infusion adverse events.
Conclusion: No significant in vitro or clinical differences were observed between thawed PBSCs infused by gravity or an infusion pump. These results demonstrate that the use of a pump for PBSC infusion is safe, provides consistent infusion rates, eliminates the need to transfer products to syringes, and results in comparable engraftment times.
CP32
ZIKV Impact on Eligibility Determination of HCT/P Donors ‐ Cord Blood (CB)
Rodica M Ciubotariu*1, Michal Tarnawski1, Nela‐Ludy Dobrila2, Maria Susana Albano2, Andromachi Scaradavou1 and Pablo Rubinstein1
1National Cord Blood Program, New York Blood Center, 2New York Blood Center
Background/Case Studies: Zika virus (ZIKV) has been linked to central nervous system malformations in fetuses. Due to a theoretical risk of ZIKV transmission through HCT/P and documented transplacental transmission in the first trimester of pregnancy or during delivery, FDA identified ZIKV as relevant communicable disease and amended its Donor Eligibility Guidelines (FDA “Donor Screening Recommendation to reduce the risk of Transmission of Zika Virus by Human Cells, Tissues, and Cellular and Tissue‐Based Products” March 2016). All donors with potential exposure to ZIKV shall be declared ineligible. As of now there is one blood test available, under investigation, for blood donors. Purpose of this study is to determine the impact of maternal potential exposure to ZIKV on donor eligibility for our CB bank donors.
Study Design/Method: Cord Blood Units (CBUs) collected in all five collection sites, which qualified as clinical grade, were assessed for eligibility determination when maternal medical history, risk factor information and test results were complete. Donors were declared ineligible for ZIKV reasons as indicated in the table below.
Results/Finding: Eligibility was assigned for 1335 clinical CBUs collected between 3/2016 ‐ 12/2016; of those, 356 CBU (27%) were declared ineligible. 278 CBUs (22% of clinical CBUs and 78% of ineligible CBUs) had at least oneZIKV risk factor. Since the aim of the study was the analysis of ZIKV impact on donor eligibility, we ranked ZIKV as primary reason; some CBUs had additional risk factors.
| Risk factors | N | % Ineligible of total CBU | % of Ineligible |
|---|---|---|---|
| A) Mother had *: | |||
| a) traveled to ZIKV area | 227 | 17 | 64 |
| b) residence in ZIKV area | 26 | 2 | 7 |
| c) residence + traveled to ZIKV area | 25 | 2 | 7 |
| B) Mother had sex with a man who had: | |||
| a) traveled to ZIKV area | 214 | 16 | 60 |
| b) residence in ZIKV area | 21 | 2 | 6 |
| c) residence + traveled to ZIKV area | 3 | 0.2 | 0.8 |
| C) Mother had A+B | 191 | 14 | 54 |
In the 12 months before delivery
Donor racial distribution among the 278 ZIKV ineligible CBUs was: Caucasian 52%, Asian 9%, Black/AA 20%, and Multi‐race 21%. Racial distribution of all clinical CBU donors was Caucasian 49%, Asian 15%, Black/AA 20%, and Multi‐race 17%, suggesting there is no race correlation for this risk factor driven by cultural habits such as family travel. There were no cases in which onlythe sexual partner's potential exposure determined donor's ineligibility.
Conclusion: Our study indicates that currently the leading risk factor for ineligible CB donors is potential exposure to ZIKV: 78% of all ineligible CBUs and 21% of all banked CBUs in the study period. We anticipate the number of cases to decrease following maternal education and travel warnings. Recognizing the importance of ZIKV in public health, and its potential transmission via HCT/P products, an FDA approved screening test for HCT/P donors becomes a timely necessity.
Components and Component Processing
CP33
A Study of the Effect of Rejuvenation on the Compatibility and Phenotype of Stored Red Blood Cells
Thomas Lynes*, Sue Proffitt, Peter Smethurst, Phil Mellor, Rebecca Cardigan, Tom Bullock and Matthew Hazell
NHS Blood and Transplant
Acknowledgments: Funded by Zimmer Biomet, a Zimmer Biomet company, IBGRL Red Cell Reference and NHSBT Reagents
Background/Case Studies: During storage, red blood cells (RBCs) become less deformable, deplete 2,3‐diphosphoglycerate (2,3‐DPG) and adenosine triphosphate (ATP), release pro‐coagulation phospholipids, accumulate pro‐inflammatory molecules, free iron and haemoglobin and increase their potential for adhesion to a recipient's vascular endothelium. Longer RBC storage may impair transfusion outcome due to impaired oxygen delivery, promotion of oxidative stress, increased pro‐inflammatory state and coagulation.
A sterile, non‐pyrogenic rejuvenation solution, containing pyruvate, inosine, phosphate, and adenine (Citra Labs, LLC, Braintree, MA), is approved by the U.S. Food and Drug Administration for the rejuvenation of stored RBCs. The solution acts by restoring 2,3‐DPG and ATP in stored RBCs to levels equivalent to those in the circulation.
The aim of the study was to investigate the effect treatment with this rejuvenation solution had on the crossmatch reaction profile and phenotypic state of stored RBCs.
Study Design/Method: A 10mL aliquot was removed from ABO/Rh grouped, leucocyte depleted RBC units (n = 20), which were stored in SAGM for ≤22 days, to act as untreated controls. The remainder of each unit (∼270mL) underwent treatment with the rejuvenation solution (50mL, 60minutes at 37oC), followed by cell washing twice in SAGM (‘manual’ centrifuge‐based process). To represent current transfusion laboratory practice, units were crossmatched against plasma from 39 random donors, using both Diamed gel column and glass tube technique. Phenotype investigation with commercial antisera was performed to identify the effect the rejuvenation solution treatment exerted on RBC surface antigens (A, B, D, C, c, E, e, K, M, N, S, s, P1, Lua, k, Kpa, Kpb, Lea, Leb, Fya, Fyb, Jka, and Jkb), including whether it exposed crypt antigens (T, Tn, Tk*, Th, Tx*, and CAD). Crossmatch and phenotype agglutination scores observed for the untreated and treated RBCs were then compared.
Results/Finding: Crossmatch findings were defined as compatible, suitable, and incompatible. The study identified no difference between the crossmatch reaction profiles of untreated and treated RBCs. Furthermore, no difference was observed in the phenotypic state between untreated and treated RBCs.
Conclusion: Treatment of ≤22 day old stored RBCs with the rejuvenation solution had no effect on crossmatch reaction profiles or phenotypic state when compared to matched untreated samples.
CP34
ABO Phenotype and Platelet Function in a Population of Regular Apheresis Platelet Donors at 2600m.a.s.l.
Leonardo Bautista*1, Michel Garcia2, Fernando Palomino3, Solangie Forero4, Milena Baquero4, Vilma Villa4 and Guillermo Orjuela‐Falla4
1Universidad Nacional de Colombia, 2Universidad Del Rosario, 3FUATS, 4National Blood Bank Colombian Red Cross
Background/Case Studies: The aim of this study was to evaluate the platelet function and their relationship with the ABO phenotype in regular apheresis platelet donors in a blood bank located at intermediate altitude.
Study Design/Method: Blood samples were collected from 90 apheresis platelet donors after acceptance. Platelet function was determined by high‐voltage dynamic flow (Siemens/Dade Behring PFA‐100®) with Collagen/ADP (closure times reference range, RR: 60‐114 seconds) and Collagen/Epinephrine (RR: 83‐156 seconds). Data were analyzed by unpaired t test and Chi square.
Results/Finding: Sixty percent of participants were O blood group (13 women and 41 men); 28%: A (8 women and 17 men), 10%: B (1 woman and 8 men) and 2.2%: AB (2 men). There was no association between donor age and Collagen/ADP or Collagen/Epinephrine closure times in men or women. No differences were found in averages or medians between genders in the platelet count and in the closure time of Collagen/ADP and Collagen/Epinephrine. However, 20.6% of men and 4.5% of women showed a prolonged Collagen/Epinephrine closure time with respect to the reference range (p = 0.08). Likewise, 7.4% of men and 4.5% of women had a Collagen/ADP closure time above the reference value (p = 0.65). 22% of non‐O donors presented increased Collagen/Epinephrine time, vs. 13% O donors, (p = 0.25). Similarly, 2.8% of non‐O donors had prolongation of Collagen/ADP vs. 11.1% of O donors (p = 0.15). Overall, 25% of non‐O donors and 24.1% of O participants had prolonged platelet function times (p = 0.87). It was found that 11.1% of non‐O donors had Collagen/Epinephrine times below the baseline vs. 3.7% of O donors (p = 0.17). In addition, it was observed a decrease in Collagen/ADP time in 5.6% of non‐O donors vs 0% in O donors. The time reduction in any of the two tests evaluated was 16.7% in non‐O donors vs. 3.7% in O donors (p = 0.034), suggesting a relationship between alteration in PFA‐100® and ABO phenotypes.
Conclusion: In contrast with previous reports on general population, apheresis platelet donors with a non‐O phenotype are more likely to have alterations in platelet function tests dependent on collagen, epinephrine and ADP in conditions associated with a higher Hb/Hct than at sea level. This could eventually be reflected in variable clinical effectivity of the transfused product.
CP35
Automated Platelet Cryopreservation Technique
Igor Vysochin*, Mogeli Khubutiya and Elena Kobzeva
Moscow's Sklifosovsky Research Institute for Emergency Medicine
Background/Case Studies: Cryopreserved platelet production is burgeoning worldwide. Currently, there are no automated platelet cryopreservation methods. By contrast, red blood cell cryopreservation using the ACP 215 (Haemonetics Corp., Baintree, MA) has automated the processing within a closed system, increased labour productivity and provided high quality blood components.
Purpose: To automate platelet cryopreservation procedure.
Study Design/Method: Apheresis platelet concentrates (PC) were collected on the Trima Accel system. Platelet counts were performed using an ABX Micros 60. PC were centrifuged at 1250g in a Sorvall RC3C+ Centrifuge (Sorvall, USA) for 10 min. The combination cryoprotectant DMSO+Dextran (CryoSure Dex40, Germany) was used for PC cryopreservation. Cryopreserved PC (CPC) were frozen and stored in a Kelvinator chest freezer. CPC were thawed at 37 degrees C (Barkey plasmatherm) for 10 min. CPC osmolality was measured with an Osmomat 030 osmometer.
Results/Finding: Staged platelet cryopreservation technology has been developed. Platelets were cryopreserved in a closed system (Patent No.: RU 169287 U1). During the first stage, CPC were spun to separate a platelet‐rich plasma (PRP) fraction from platelet‐poor plasma (PPP). The second step was to resuspend the PRP by adding a combination of DMSO+Dextran (CryoSure Dex40) , as a cryoprotectant, to obtain a final concentration of 5% DMSO in the platelet suspension. The Injectomat MC Agilia and NPBI Compomixer M3 were instrumental in automating that phase. PC to be frozen had an osmolality of no less than 1500 mOsm/L. PRP and PPP were frozen at a cooling rate of 1‐3°C/min and stored at ‐ 850С in the chest freezer for up to 24 months. Pre‐transfusion defrosted platelets were also processed in a closed system (Patent No.: RU 167874 U1). Our transfer set made it possible to automate platelet resuspension in plasma through the agency of the Exadrop®. Post‐thaw PRP was resuspended in plasma, which lowered the osmolality to 380 mOsm/L. Freeze‐thaw recovery of platelets was 80% or more of the original population. Defrosted PC were stored at 20‐240С with continuous gentle stirring from a Helmer platelet agitator for no longer than 4 hours before transfusion. It took no more than 30 min to cryopreserve PC and process pre‐transfusion thawed platelets. The automated processing accounted for the bulk of the time (over 20 min).
Conclusion: The automated technique developed reduced the workload while offering reproducibility of the procedure and high CPC quality. The use of closed systems ruled out bacterial contamination. Employing the infusion pump, platelet stirrer and precision flow regulator enabled adequate osmolality monitoring.
CP36
Bacterial Detection in Leukoreduced Apheresis Platelets on Day 4 and Day 5
Evelyn C. Oyler*
SunCoast Blood Bank
Background/Case Studies: The recently published FDA draft guidance describing bacterial testing to enhance the safety and availability of platelets outlined the steps for blood collection establishments and transfusion services to extend apheresis platelets dating for up to 7 days. This evaluation will compare culture based and rapid based test methods for detecting bacterial contamination in apheresis platelets.
Study Design/Method: A large community blood center and transfusion service collects leukoreduced apheresis platelets (LRAP) using Amicus Separator System (Fenwal, Lake Zurich, IL) and Trima Accel System (Terumo BCT, Lakewood, CO). Previously‐cultured LRAP units were sampled on day 4 for secondary culture using BacT/ALERT (BioMerieux, Durham, NC) and rapid bacterial tests using BacTx (Immunetics, Boston, MA) and PGD (Verax, Marlborough, MA). If LRAP unit is still available, it is also sampled and tested for rapid testing on day 5. A total of 60 LRAP units were tested over a 3‐month period: 50 were cultured and rapid tested on day 4; 10 were rapid tested on day 5. The rapid test methods were also evaluated based on cost, ease of use, incubation time and indication for use.
Results/Finding: Of the LRAP units evaluated for this study, there were 59 True Negatives (TN) and 1 False Positive (FP) on day 1 when tested by BacT/ALERT, with 60 TNs on day 4. BacTx testing results showed 50 TNs on day 4 and 10 TNs on day 5. Testing using the PGD kit showed 50 TNs on day 4; and 8 TNs and 2 FPs on day 5. FP results were confirmed by performing a secondary culture, which were found to be negative. BacTx requires a specific analyzer and 30 minutes are required for result interpretation. There is no instrument requirement for PGD and reactions can be read within 20 minutes.
Conclusion: The results of this evaluation makes PGD the best fit for this blood center based transfusion service. PGD offers a shorter time for reading of results, does not need an initial investment for an analyzer and is indicated for LRAP in 100% plasma and LRAP in PAS/plasma. Its ease of use allows for testing of LRAP on day 4 and day 5 during the night shift to be accomplished without additional staffing and allows to extend outdate to 7‐day storage of LRAP.
CP37
Change in Growth Factor Content of Human Serum for Use As Eye Drops during Frozen Storage for 1 Year
Jos Lorinser1, Pieter F van der Meer1, Hans van der Heiden2 and Dirk de Korte*1
1Department of Product and Process Development, Sanquin Blood Bank, 2mu‐Drop
Background/Case Studies: Growth factors are thought to be among the active components in serum used for treatment of dry‐eye syndrome. Stability of growth factors during frozen storage in mini containers (140 µL) is unknown. If these products can be stored at ‐18°C it will be feasible to store this product in 3‐star household freezers, making the product available for patients in need of serum eye drops.
The purpose of this study is to demonstrate stability of growth factor content in human serum during longtime storage at ‐18°C or <‐25 to ‐35°C packed in a new micro dose device for single use as eye drops.
Study Design/Method: Serum produced from 500mL whole blood donations from non‐remunerated healthy donors was quickly frozen. After frozen storage at <‐25°C for 3‐12 months and controlled thawing, six different sera were used to fill a large number of mini (140 μL) containers, which were refrozen and stored at either ‐18°C or <‐25°C. During storage at 3 months intervals, samples were tested for several growth factors, using Magpix® Luminex Multiplex assays and compared to control samples stored at <‐80°C. Growth factors tested were PDGF‐AA&AB/BB, TGF‐ß1/2/3, VEGF, EGF, FGF2. The study was a fact‐finding study, without preset acceptance criteria.
Results/Finding: PDGF‐AB/BB and TGF‐ß1 were the most abundant growth factors, on average 35, resp. 40 ng/mL. Also PDGF‐AA was detected at relatively high concentration in human serum, on average 11 ng/mL. TGF‐ß2, EGF and VEGF were detected at relatively low values, resp. 3 ng/mL, 0.5 ng/mL and 0.3 ng/mL. Average levels of FGF2 and TGF‐ß3 were close to detection limit (< 0.2 ng/mL). The controls stored at <‐80°C showed for all growth factors close to 100% of the initial values in samples at T=0 (moment of filling mini containers). For serum stored at <‐25°C for up to 12 months, most factors showed less than 2 % decrease, except for PDGF‐AA and TGF‐ß2, showing 6% resp. 3% lower values. For serum stored at ‐18°C the values for TGF‐ß1, EGF and VEGF were stable, whereas PDGF‐AB/BB, PDGF‐AA and TGF‐ß2 showed a decrease of resp. 9, 17 and 3%.
Conclusion: Human serum eye drops can be stored in the new micro dose device at ‐18°C (3‐star household freezers) or <‐25°C (professional freezers) for at least one year after preparation without large decreases in growth factor content. The maximum decrease was found for PDGF‐AA in serum stored at ‐18°C. It is yet unknown if the tested components add to the in vivo effectiveness of serum eye drops and what the minimal concentration is to ensure in vivo effectiveness. Further stability testing in combination with in vitro and in vivo application is required to extend the shelf‐life beyond 1 year.
CP38
Characteristics of Extracellular Vesicles in Stored Red Blood Cell Products Influenced By Component Manufacturing Method
Ruqayyah Almizraq*1, Heather Inglis2, Phillip Norris2,3, Jennifer A Muszynski4, Nicole Juffermans5, Jelena Holovati1 and Jason P. Acker1,6
1University of Alberta, 2Blood Systems Research Institute, 3University of California, San Francisco, 4Nationwide Children's Hospital, 5Academic Medical Center, 6Canadian Blood Services
Background/Case Studies: Different blood manufacturing methods can influence residual cell numbers and membrane vesiculation, which may affect quality and safety of blood components. The aim was to identify, quantify and characterize residual cells and extracellular vesicles (EVs) in stored RBC products produced by different blood manufacturing methods.
Study Design/Methods: Thirty‐two RBC units produced using whole blood filtration (WBF), red cell filtration (RCF), apheresis, and whole blood derived (WBD) methods were examined (n=8 per method). Residual platelets and white blood cells (WBCs) were measured on day 5 using flow cytometer (FC). On storage day 5 and 42, number and cell of origin/surface markers of EVs were assessed with FC, and concentration and size‐profile of EVs were examined using tunable resistive plus sensing (TRPS).
Results/Findings: On day 5, apheresis and WBD units had significantly greater residual platelets in comparisons to RCF (vs: apheresis p<0.01, WBD p<0.05) and WBF (vs: apheresis p<0.0001, WBD p<0.01) methods. While RCF units yielded the lowest count of Platelet‐EVs (CD41a+) on day 5 and 42, the highest number of Platelet‐EVs were in apheresis (day 5) and in WBD (day 42). Similarly, there was significant difference among methods in the number of WBC‐EVs (CD3+, CD14+, CD16+, CD19+, CD66b+) and RCF contained the smallest concentration. Moreover, both TRPS and FC showed an increase in the total number of EVs on day 42 vs day 5 in all of the processing methods. Noteworthy, TRPS showed that the number of small EVs/exosomes (< 200nm) was greater than large EVs (≥ 200nm) in all of the products on day 5 and 42, and the highest level of EVs < 200nm were in apheresis units. TRPS results also showed a significant difference in the EVs size‐profile amongst all RBC products (p<0.05).
Conclusion: This study shows that the method of manufacturing significantly affects RBC and non‐RBCs EVs characteristics throughout storage, which has the potential to impact quality and safety of RBC products. The differences in the EVs cell‐of‐origin, concentration, and size‐profile observed between manufacturing methods, warrants further examination of their potential immunomodulatory effects and clinical consequences.
| Total # of EVs/mL | EVs‐CD41a+/µL | EVs‐CD235a+/µL | EVs‐CD62p+/µL | EVs‐CD16+/µL | ||||||
|---|---|---|---|---|---|---|---|---|---|---|
| Methods | Fresh | Expiry | Fresh | Expiry | Fresh | Expiry | Fresh | Expiry | Fresh | Expiry |
| WBF | 1.1x10¹⁰ ± 5.6x10⁹ | 9.8x10¹⁰ ± 5.6x10¹⁰ | 310 ± 330 | 430 ± 440 | 900 ± 260 | 28000 ± 33000 | 3 ± 3 | 18 ± 31 | 30 ± 22 | 110 ± 97 |
| RCF | 1.9x10¹⁰ ± 7.4x10⁹ | 4.2x10¹⁰ ± 1.1x10¹⁰ | 13 ± 4 | 31 ± 14 | 530 ± 160 | 5100 ± 2000 | 3 ± 3 | 9 ± 7 | 17 ± 7 | 34 ± 11 |
| Apheresis | 2.4x10¹⁰ ± 2.0x10¹⁰ | 1.0x10¹¹ ± 6.1x10¹⁰ | 520 ± 320 | 700 ± 310 | 2200 ± 1900 | 9800 ± 4100 | 14 ± 17 | 7 ± 5 | 46 ± 15 | 120 ± 24 |
| WBD | 6.4x10⁹ ± 3.1x10⁹ | 4.6x10¹⁰ ± 1.5x10¹⁰ | 350 ± 140 | 760 ± 360 | 1000 ± 180 | 4400 ± 2400 | 3 ± 2 | 42 ± 23 | 57 ± 24 | 120 ± 56 |
Table displays mean ± SD.
CP39
Coagulation and Complement Assays in Whole Blood Stored at 4° Centigrade
Maryanne C Herzig*1, Crystal Lafleur2, Chriselda G Fedyk1, Sherrill J. Slichter3 and Andrew P Cap2
1US Army Institute of Surgical Research, 2U.S. Army Institute of Surgical Research, 3University of Washington
Background/Case Studies: Whole blood has been demonstrated to retain hemostatic activity, including platelet aggregation function, over at least 2 weeks of storage at 4°C without agitation. It may be possible to extend the preservation of platelet function by agitating WB. In order to more fully characterize the quality of WB stored at 4°C with or without agitation, we evaluated complement activation as a marker of inflammatory potential.
Study Design/Method: Subjects donated one unit of WB collected in CPD‐A2 (citrate phosphate dextrose anticoagulant with adenine). The WB was not leukoreduced nor was it separated into components. Units were stored under refrigerated conditions for 10, 12, 15, or 22 days after collection. Units were stored for 12 days without agitation. Units stored for 10, 15 or 22 days were agitated during storage with a Model 400 Hybridization Incubator at 4°C set for end over end rotation at 2‐3 rpms. At the appropriate time point, platelet free plasma was obtained from the WB sample and stored at ‐80°C. The frozen plasma was analyzed by ELISA assays to determine: thrombin‐antithrombin complex (TAT) as a marker of coagulation; soluble CD40L as a measure of platelet activation and granule release; plasmin anti‐plasmin complex (PAP) as a marker of fibrinolysis; plasminogen activator inhibitor (PAI‐1) as another fibrinolytic measure; and complement activation markers C3a, C4d, C5a and C5b‐9. Data was analyzed by one way repeated measure ANOVA.
Results/Finding: Only 49 ± 12% of the platelets were recovered in units stored for 12 days without agitation. These levels did not meet FDA requirements of 5.5 x 10¹⁰ platelets per WB unit. Subsequently, WB was agitated and platelet recovery was 71‐76%. No difference was seen in ELISA analysis for agitated or non‐agitated samples. No change was seen in TAT or PAP levels between T0 (day of collection) and T10, 12, 15, or 22 measurements. Significant elevations of PAI‐1 and sCD40L indicate activation of platelets and inhibition of fibrinolysis (p<0.001). Activated complement peptides C3a, C5a, and C4d were all elevated over time (p<0.001) while sC5d‐9 was not. However, only C3a and C4d levels at T22 were above normal reference ranges at 1.30 and 1.41 times maximum reference, respectively.
Conclusion: Whole blood agitation appeared necessary to recover platelets at or above FDA requirements. Whole blood stored at 4°C for 10‐22 days did show some activation of complement proteins. In contrast to studies in stored red blood cells with elevations of sC5d‐9 reported, WB showed elevation of C3a, 5a and C4d and not sC5d‐9. Complement was gradually and modestly activated with most levels remaining within reference ranges over whole blood shelf life.
CP40
Compatibility of Platelet Collections for Treatment with the Intercept Blood System for Platelets
Meredith Lummer*1 and Christian Todd2
1Cerus Corporation, 2Community Blood Serivces
Background/Case Studies: The INTERCEPT® Blood System for Platelets (Cerus, Concord CA) is used for the pathogen reduction (PR) of platelet collections, and replaces irradiation, CMV testing, bacterial culture and point of issue bacterial testing. To better understand PR compatibility and impact to split rate, data were analyzed from a mid‐size blood center with roughly 7,000 platelet collections per year with a split rate of 1.8 prior to INTERCEPT adoption, 1.53 when excluding triples. Post adoption of INTERCEPT, high hospital demand catalyzed the center's objective to treat as many collections as possible, with the goal of pathogen reducing all single and double dose platelet collections.
Platelet collections must meet specific volume, concentration, and dose ranges to qualify for INTERCEPT PR. Changes made to apheresis devices included adding the following 4 collection targets: 4.4x10¹¹ in 350mL, 6.6x10¹¹ in 400mL, 6.8x10¹¹ in 400mL, and 7.0x10¹¹ in 400mL.
Study Design/Methods: Four months of collections were retrospectively analyzed. Platelet collections were evaluated to determine eligibility for PR treatment, and all products meeting PR processing specifications (unless intended for an HLA matched recipient at a hospital not able to accept PR products) underwent PR treatment regardless of potential impact to split rate. A minimum post‐treatment dose of 3.0x10¹¹ or 6.0x10¹¹ was required to classify collections as singles or doubles respectively. Volume/dose mitigation (removal of volume to increase the number of products eligible for PR) was not utilized during this study. Thus units were treated conventionally if volume, dose, and/or concentration did not meet PR specifications without further manipulation.
Results/Findings: 64% of all single and double collections were eligible for and underwent PR treatment. Split rate for single and double collections was 1.34.
TABLE 1. Percent of Collections Eligible for PR Treatment
| Month | Total Single and Double Collections | PR Treated Collections | % Eligible |
|---|---|---|---|
| Overall | 943 | 601 | 64 |
| 11/2016 | 218 | 142 | 65 |
| 12/2016 | 237 | 152 | 64 |
| 1/2017 | 254 | 158 | 62 |
| 2/2017 | 234 | 149 | 64 |
Conclusion: It is possible to treat 64% of single and double platelet donations with INTERCEPT PR at the blood center's current state with only a slight impact to split rate if centers are willing to make alterations to their targeting practices. Platelet collections that fall outside of the specifications for PR are processed and distributed as conventional products. Strategies to increase eligibility toward 100% while minimizing impact to split rate are being investigated, including incorporating new collection settings, splitting triples, and volume/dose mitigation. Further evaluation is needed to determine the additional quantity of PR eligible products resulting from such changes.
CP41
Concurrent Comparison of Circulation Kinetics of Cold Stored and Temperature Cycled 7‐Day Human Platelets in Human Volunteers and SCID Mice for Transfusion Model Development
Monique P Gelderman*1, Andrey Skripchenko1, Fei Xu1, Ying Li1, Stephen J Wagner2, Pamela H Whitley3 and Jaroslav G Vostal1
1FDA/CBER/OBRR/DBCD/LCH, 2American Red Cross Holland Laboratory, 3American Red Cross Mid‐Atlantic Research Facility
Background/Case Studies: Platelets (PLTs) stored at room temperature (RT) can support bacterial proliferation in contaminated units and therefore septic transfusion reactions may occur. Storing PLTs at cold temperature (4‐6oC [CT]) limits bacterial growth but results in rapid clearance upon transfusion. The development of alternate storage conditions usually involves costly radiolabeling human studies but success in these studies is difficult to predict based on in vitro studies. Thus, an animal model of PLT circulation that could predict performance of human PLTs in human volunteers would positively impact the development of alternate storage conditions.
Study Design/Method: We designed an immunodeficient (SCID) mouse model to evaluate recovery of human PLTs and compared this side by side to a radiolabeling study in human volunteers that was conducted for evaluating a new PLT storage condition: thermocycling PLTs (11 hrs CT: 1 hr 37oC [TC]). Autologous apheresis PLTs stored for 7‐days at RT, TC and CT were radiolabeled and infused into healthy human volunteers (n=9) and the same non‐labeled PLTs were also infused into mice (n=90). Blood samples from humans and mice were collected over time to generate survival and clearance curves of the PLTs in circulation. Flow cytometry was used to detect and analyze the human PLTs in the mouse samples to generate such curves; counts <5% were considered background.
Results/Finding: The mean recoveries of infused PLTs were 51.2 ± 16.7% for RT, 37.7 ± 12.3% for TC and 23.1 ± 8.8% for CT in humans. In mice, mean recoveries of the same PLTs were 24.9 ± 10.3% for RT, 19.1 ± 9.8% for CT and 16.2 ± 6.9 for CT (mean±SD). To compare performance of the PLTs in humans and mice we expressed all recoveries as a percentage of the RT recoveries. In humans TC was ∼74% and CT was ∼45% of RT. In mice TC was ∼76% and CT was ∼64% of RT. The area under the survival curve (AUC) was calculated for the individual mouse study and human trial data sets. The results of both AUC were normalized to 100% for RT PLTs. Human TC PLTs had 26% AUC while CT PLTs had 11% AUC compared to RT PLTs in humans. In comparison, the same TC PLTs had 39% AUC and CT PLTs had 26% AUC of the RT AUC in the mice. The calculated ratios of the AUC between the TC PLTs and CT PLTs of the human data set and mouse model data set are 2.4 and 1.5, respectively.
Conclusion: The SCID mouse model differentiates between RT PLTs and CT PLTs similar to humans based on AUC and PLT recovery data. However, the mouse model cannot differentiate between CT PLTs and TC PLTs as occurs in humans. Even though the mouse model cannot differentiate between CT PLTs and TC PLTs, it may still be a useful tool to screen other novel storage conditions for human PLTs.
CP42
Converting the Component Manufacturing from a Manual Process to Automation
Nicole Peters*1 and Geeta Paranjape1,2
1Coastal Bend Blood Center, 2Carter Blood Care
Background/Case Studies: Initiatives focused on improvements to donor collection processes drove us to investigate opportunities in our component manufacturing processes. Our goal was to maintain blood quality while streamlining manufacturing and automating the in‐process documentation. The CompoMat G5 was evaluated using a multi‐team approach including component manufacturing staff, equipment management, QA, Regulatory Affairs and IT.
Study Design/Method: After a comprehensive evaluation, the team decided to purchase the CompoMat G5 with the CompoMaster Net Software for data management. Implementation was planned for a November 2014 go‐live. . To centralize processing, new work counters were installed. Fresenius Kabi installed the CompoMat G5s and CompoMaster in June 2014. Training and validations were successfully completed and a full launch occurred mid‐March 2015. Device and SOP training was performed. Training Qualification Checklists were completed for each technician with a required number of successful units processed and completed December 2014. Validation was completed and signed off in March of 2015. Manufacturing data was collected using the CompoMaster Net data management system and our Quality Control Software for Platelet (PLT) parameters, including PLT count, PLT weight, and PLT yield from before implementation (BI) and after implementing (AI) of the CompoMat G5 system. Data points were collected from 210 units BI and 302 units AI.
Results/Finding: Upon initial implementation, staff training and use, the CompoMat G5 was found to be easy. PLT weight spread was reduced from an average of 22gm to an average of 15 gm. Actual PLT weights were reduced from an average of 63gm to 59gm, resulting in an average increase in recovered plasma of 3.78ml per unit. PLT count on average increased from a count of 1435 to 1506 (103/mm3) with a negligible change in PLT Yield.
| August 2013 ‐ March 12 2015 | PLT Count (103/mm3) | Weight (gm) | PLT Yield |
|---|---|---|---|
| Average | 1435 | 63 | 8.74 x 10¹⁰ |
| Minimum | 880 | 55 | 5.47 x 10¹⁰ |
| Maximum | 2518 | 77 | 1.36 x 10¹¹ |
| Standard Deviation | 344 | 3 | 2.03 x 10¹⁰ |
| March 13 2015 ‐ April 2017 | PLT Count (103/mm3) | Weight (gm) | PLT Yield |
| Average | 1506 | 59 | 8.62 x 10¹⁰ |
| Minimum | 939 | 52 | 5.51 x 10¹⁰ |
| Maximum | 2787 | 67 | 1.54 x 10¹¹ |
| Standard Deviation | 396 | 3 | 2.25 x 10¹⁰ |
Conclusion: PLT weight spread was reduced by 31.8% after implementation of the CompoMat G5 and our PLT concentrations increased on average by 5%. We were able to consistently produce a smaller volume PLT (average 59 gm), which gave us 3.78ml more plasma per unit for recovered plasma. The team intends to review a dryer Cryo as a next step for potential additional plasma yields for recovered plasma.
CP43
Deglycerolization of Manually Glycerolized, Frozen Rccs Using a Closed System Cell Processor
Anita Howell1, Angela Hill1, Brandie Dennis2 and Jason P. Acker*2,3
1Canadian Blood Services, Centre for Innovation, 2Canadian Blood Services, 3University of Alberta
Background/Case Studies: Upon implementation of a closed system cell processor for glycerolization and deglycerolization of red cell concentrates (RCCs), many rare RCCs frozen using the current manual, open system glycerolization method will remain in the organization's frozen inventory. A study was undertaken to assess the feasibility of deglycerolizing this existing inventory on the closed cell processor and to evaluate how the change may impact post‐thaw red blood cell (RBC) in vitro quality. As the closed cell processor uses a fixed centrifuge bowl for deglycerolization and RBC re‐suspension, both large and small units were assessed to determine the impact of cellular loss and variability in hematocrit on the post‐thaw product.
Study Design/Methods: 13 ABO/Rh matched LR SAGM RCCs were pooled and split to produce 6 large (354mL) and 6 small (244mL) RCCs. The RCCs were stored to 14 d and glycerolized manually by mixing 400mL of glycerol with the RCC in a 2000mL freezing bag. Units were frozen at ≤ ‐65°C for ≥ 72h before being removed from frozen storage and thawed in a 37°C water bath. 3 large RCCs and 3 small RCCs were deglycerolized using the organization's current procedure on the COBE 2991 cell processor prior to re‐suspension in 0.9% saline, 0.2% dextrose. The remaining RCCs were transferred into a 1L bag, spun to allow removal of excess glycerol by manual extraction to achieve a hematocrit of 75 ± 5%, and deglycerolized in a 275mL centrifuge bowl on the ACP‐215 with re‐suspension in AS‐3. RBC quality was tested at 24 ± 2h post‐deglycerolization.
Results/Findings: Large RCCs had significantly higher hemoglobin per unit (COBE: p=0.006, ACP215: p=0.007) and lower cell recovery (COBE: p=0.002, ACP215: p<0.001) post‐deglycerolization than smaller RCCs on both cell processors. Large RCCs deglycerolized on the COBE 2991 had higher hemolysis (p<0.001) and supernatant potassium (p=0.001) than did small volume RCCs. Large COBE 2991 RCCs had higher hematocrits (p=0.033), hemoglobin (p=0.006), and recovery (p=0.001) than did large ACP‐215 RCCs. However, all COBE 2991 RCCs had higher (p<0.001) hemolysis (0.99 ± 0.24 %) levels than did ACP‐215 RCCs (0.31 ± 0.02 %). COBE 2991 RCCs failed to meet regulatory hemolysis standards of ≤ 0.8%.
Conclusion: Addition of a 400mL bolus dose of glycerol to RCCs of different volumes results in different concentrations of glycerol in the frozen RCC product and may lead to differences in frozen RCC quality. Additionally, the size of the RCC impacts quality for RCCs processed on the closed cell processor due to centrifuge bowl volume limitations which result in lower recovery, hemoglobin, and hematocrits. Use of the closed cell processor with re‐suspension in AS‐3 and storage for 24 ± 2h, met in vitro quality standards for recovery, hemoglobin, and hematocrit, and drastically reduced hemolysis levels in RCCs glycerolized manually. The ACP‐215 cell processor can therefore be used to deglycerolize RCCs glycerolized using a manual, open system glycerolization method.
CP44
Evaluation of a Semi‐Automated Method for Washing Platelets
Fatima Madrid and Lok Tse*
Brigham and Women's Hospital
Background/Case Studies: Washed platelets may be indicated for thrombocytopenic patients who experience severe allergic/anaphylactic or febrile reactions to conventional platelet transfusions. Platelet washing process is time‐consuming which may delay transfusion. This study was conducted to evaluate the manual platelet washing method (MM) using 0.9% saline and centrifugation and the semi‐automated washing method (SAM) using the COBE 2991Blood Cell Processor.
Study Design/Method: In this study, 20 units of single donor platelets were evaluated (10 washed using the MM and 10 washed using the SAM. The collected data included product weights (pre‐ and post‐wash), platelet counts (pre‐ and post‐wash), total plasma protein (pre‐ and post‐wash), presence/absence of platelet clumps, calculated % protein removal, and calculated % platelet recovery rate. The platelet counts were measured on the Sysmex EXN and the total plasma protein samples were measured on the Roche Cobas 6000.
Results/Finding: Table 1 shows that the average platelet recovery for the SAM (92%) was significantly higher compared to the MM (82%). The MM had a slightly higher average protein removal compared to the SAM. No platelet clumps were observed in either the MM or the SAM. It was observed that the hands‐on time for the MM took 10‐15 minutes longer than the SAM.
TABLE 1. Comparison of Manual Washing Method (MM) vs Semi‐Automated Method (SAM) to Prepare Washed Platelets (PLT)
| Average Pre PLT Weight (g) | Average Post PLT Weight (g) |
Average Pre PLT count (x 1011) |
Average Post PLT count (x 1011) |
Average Pre PLT Protein (g/dL) | Average Post PLT Protein (g/dL) | Average % Protein Removal | Average % Platelet Recovery | |
|---|---|---|---|---|---|---|---|---|
| MM | 281 | 278 | 3.9 | 3.2 | 6.0 | 0.5 | 91 | 82 |
| SAM | 262 | 217 | 2.8 | 2.8 | 5.7 | 0.5 | 89 | 92 |
Conclusion: The SAM utilizing the COBE 2991 Blood Cell Processor yielded washed platelets with significantly higher platelet recovery in less time compared to the MM. Both methods yielded comparable protein removal. The SAM is a feasible alternative to the manual, labor‐intensive technique for preparing washed platelets.
CP45
Evaluation of an Intercept Platelet Processing Set to Yield Three Pathogen Reduced Apheresis Platelet Components
Anna Erickson1, Crystal Stanley2, Marguerite Kelher3, Nero Evero2, Hermelinda Evans1, Michelle Gatmaitan1, Melissa VonGoetz1 and Nina Mufti*1
1Cerus Corporation, 2Belle Bonfils Memorial Blood Center, 3University of Colorado
Background/Case Studies: The INTERCEPT® Blood System for platelets is currently licensed for pathogen reduction (PR) of Amicus platelets in InterSol (PAS‐3) for input platelet doses of 2.9 to 8.0 × 10¹¹ platelets in 255 to 420mL of 47 to 68% plasma and 32‐53% PAS. A new platelet processing set was designed with three storage containers (TS) to process apheresis platelet components in PAS‐3 containing doses of 6.0 to 12.0 × 10¹¹ platelets in a volume of 420 to 650mL.
Study Design/Methods: Apheresis PCs (Amicus®) were collected in 35% plasma and 65% PAS‐3. One study was performed at the nominal dose (9.2 ‐ 10.0 x10¹¹ platelets), volume (558 – 629mL) in 65% PAS/35% plasma using single donor apheresis collections. Two studies were performed to evaluate the high dose and high volume condition (9.7 – 11.8 x 10¹¹ platelets in 593 – 659mL) using either single or pooled donations. Input PCs (n=20) were treated with the INTERCEPT TS set by the end of Day 1 post collection; the incubation time in the Compound Adsorption Device (CAD) container ranged from 4 to 16 hours and the INTERCEPT treated PCs were stored in 3 containers (n=60). Day 5 and 7 post‐donation PCs were evaluated using a panel of in vitro platelet function assays
Results/Findings: In vitro function data for apheresis PCs in PAS‐3 treated in the INTERCEPT TS set demonstrated acceptable in vitro function (Table 1). All INTERCEPT treated PCs had pH(22°C) ≥6.2. Platelet dose and volume recovery post‐treatment ranged from 82% to 99% and 88% to 92%, respectively.
Conclusion: Pathogen reduced platelet components processed using the INTERCEPT TS set from either single or pooled apheresis donations maintained acceptable in vitro quality through 7 days of storage.
INTERCEPT Blood System for Platelets TS set is currently not approved for use in the US.

CP46
Evaluation of Pathogen Reduction Technologies, Phase 1: In Vitro Quality Markers of Mirasol‐Treated Platelets.
Marie Joelle de Grandmont, Nathalie Dussault, Eric Ducas, Patricia Landry, Audrey Laforce‐Lavoie, MArie‐Ève Nolin, Marie‐Pierre Cayer, Marc Cloutier, Francois Drouin and Danny Brouard*
Héma‐Québec
Background/Case Studies: The possibility of transmitting infectious organisms via blood products, plasma and their derivatives is a major public health concern. While current screening measures have considerably improved transfusion safety by reducing the risks associated with known pathogens, they cannot protect from emerging infectious threats. The Pathogen Reduction Technology (PRT) represents a proactive strategy to further reduce transfusion‐transmitted infectious risk. However, the scientific community broadly agrees over the fact that PRT has negative impacts on the product's quality markers. This study aims at evaluating the impacts of the Mirasol PRT on platelet (PLT) quality and PLT processing.
Study Design/Method: Two ABO‐compatible platelet concentrates (PCs) containing 100% plasma obtained from either apheresis or SAGM whole blood (WB)‐derived processing were paired, pooled and then split into two equal units. One unit was used as a non‐treated control (CTRL) (n=6). Riboflavin was added to the other PC unit and then exposed to UV light according to the manufacturer's instructions for the Mirasol PRT (TerumoBCT) (Test) (n=6). Numerous in‐vitro quality markers (PLT concentration, ATP, pO2, pCO2, pH, glucose, lactate, sodium, and potassium) were measured for both Mirasol‐treated and non‐treated PCs on days 1, 3, 5 and 7 for apheresis PCs, and on days 2, 3, 5 and 7 for WB‐derived PCs. Two flow cytometry assays were used to evaluate CD62p expression with and without thrombin activation, and to measure the percent annexin V‐positive PLT.
Results/Finding: Platelet recovery was 92 ± 5% and 81 ± 10% for apheresis and WB‐derived PCs, respectively. Mirasol‐treated PCs showed higher levels of annexin V‐positive cells (3% ± 1 (Test), vs. 1.7% ± 0.5 (CTL) on day 5) and a higher rate of CD62p expression than control PC units (58% ± 7 (Test), vs. 23% ± 6 (CTL)) on day 5). The Mirasol treatment generates changes in pH, glucose and lactate for PCs during storage.
Conclusion: The Mirasol treatment induces a loss in the net number of PLTs/unit and elevated platelet activation. Changes in pH, glucose and lactate suggest that PRT affects PLT metabolism. Finally, PRT has numerous impacts on logistic, storage and processing time constraints of blood bank operations. Nevertheless, the Mirasol PRT is routinely used in Europe with acceptable clinical outcomes.
CP47
Evaluation of a Test Method to Detect Bacterial Contamination in Platelets; Bactx™ Assay
Ji Hye Park Sexton*1, Lorraine Blagg2, Christi E Marshall1, Herman Woodson1, Sean Erony1, Krishna Patel1 and Eric Gehrie3
1The Johns Hopkins Hospital, 2Johns Hopkins Hospital Transfusion Medicine Dept, 3Johns Hopkins University School of Medicine
Background/Case Studies: Bacterial contamination of platelets (PLTs) is the leading infectious risk of platelet transfusion therapy and it is the most significant infectious cause of transmission‐associated morbidity and mortality. Therefore, detecting various potential bacterial contaminants in platelets in a timely manner is critical. The BacTx assay is a rapid colorimetric assay that detects peptidoglycan, a cell wall component of both gram‐positive and gram‐ negative bacteria. Here, we report an analysis of the BacTx assay at our hospital.
Study Design/Method: We aimed to determine the sensitivity and specificity of the BacTx assay. 340 intact leukoreduced apheresis PLT (LRAP) units were tested by BacTx at storage day 4. As a control, each intact LRAP was also cultured by an automated bacterial detection system (BacT culture) on storage day 3. The results of the BacTx test were compared to the results of the BacT culture system.
Results/Finding: A total of 340 LRAP were tested. 335 LRAPs initially tested negative by BacTx, while 5 LRAPs initially tested positive by BacTx. All 5 initial positive BacTx tests were negative when subjected to repeat testing. In contrast, all LRAPs tested negative with the BacT culture system. The specificity of the BacTx test was 98.5%. We did not have any true positive test results; therefore, the sensitivity of the BacTx could not be determined.
Conclusion: This is a small study of only 340 platelet units. The expected rate of bacterial contamination of platelets is less than 1 per 2000 units. The 1.5% initial positive rate was therefore higher than expected, but given the small sample size, it is clear that further study is needed to more rigorously assess the true sensitivity and specificity of the BacTx assay.
CP48
In Vitro Quality of Rejuvenated and Washed CPD/As‐1 and CP2D/As‐3 RBC
Alan D. Gray*1, Matt Landrigan2, Pamela Whitley3, Michael Wellington3, Sherrie Sawyer3, Shalene Hanley3, Emily Rondeau4, Louise Herschel4, Neeta Rugg5, Patricia A.R. Brunker3, Shawnagay Nestheide5, Jose Cancelas‐Perez5, Larry Dumont6 and Zbigniew M. Szczepiorkowski7
1Citra Labs, LLC a Zimmer Biomet Company, 2Zimmer Biomet, 3American Red Cross, 4Geisel School of Medicine, 5Hoxworth Blood Center, 6Blood Systems Research Institute, 7Dartmouth‐Hitchcock Medical Center
Background/Case Studies: The addition of a rejuvenation solution to stored Red Blood Cells (RBC) has been shown to increase intracellular ATP and 2,3‐DPG to fresh levels. The objective was to demonstrate that in vitro quality measures are maintained for RBC when stored for >24 hours after treatment with an FDA approved rejuvenation solution.
Study Design/Method: Whole blood (530‐550mL) was collected and processed at 3 sites into leukocyte‐reduced RBC (a total of n=63 CPD/AS‐1 and n=64 CP2D/AS‐3). 50mL of rejuvenation solution (Citra Labs) was added to each RBC on Day 35 (D‐35), incubated for 60 minutes with agitation at 37°C water bath (Helmer DH4), washed (Haemonetics ACP215), and stored in AS‐3 at 1‐6 oC for 7 days (D‐36 through D‐42). In vitro recovery (%) was calculated and hemolysis, ATP, and 2,3‐DPG were determined on Day 0, D‐35, D‐35 after rejuvenation and washing (postRJV), D‐36, D‐38, D‐40, and D‐42. All units were cultured on D‐35 postRJV and on D‐42, and then concentrated by centrifugation on D‐42.
Results/Finding: In vitro RBC recoveries were 95.7% and 95.5% (AS‐1 and AS‐3, respectively) and no bacterial growth was observed. Hemolysis on D‐42 was maintained <1% in 58/63 (92%) AS‐1 units and 63/64 (98.4%) AS‐3 units. All AS‐1 and AS‐3 units (100%) had hemolysis <1% following concentration by centrifugation. Morphology score was reduced to 77% (AS‐1) and 74% (AS‐3) by D‐35, restored after rejuvenation (91%, 92%, respectively) and maintained through D‐42 (>90%). ATP was restored and maintained above fresh levels after rejuvenation. 2,3‐DPG was restored above fresh levels and was maintained ≥80% of fresh levels through D‐38. All values were significantly different compared to D‐35 except as noted (p<0.001, paired t‐test) (Table 1).
Conclusion: Rejuvenation of stored RBC restores ATP and 2,3‐DPG above fresh values and morphology to near fresh levels while maintaining improved in vitro RBC quality measures through D‐42 when compared to non‐rejuvenated RBC on D‐35.

This study is funded by Zimmer Biomet. Storage >24 hours is not FDA approved for use at the time of this publication.
CP49
Liposomes and Rejuvenation: New Approach for Improving Quality of Stored Red Blood Cells
Luciana da Silveira Cavalcante1, Jason P. Acker*1,2 and Jelena Holovati1
1University of Alberta, 2Canadian Blood Services
Background/Case Studies: Liposomes have been shown to minimize RBC membrane damage occurring during 42‐day hypothermic storage (HS), while rejuvenation solutions have been shown to restore RBC metabolism by maintaining ATP and 2,3‐DPG levels. This study aimed to evaluate the effect of combining liposomes and rejuvenation on the quality of stored RBCs.
Study Design/Methods: Five leukoreduced packed RBC units obtained were pooled and split. The units produced were segregated into four experimental groups: sham control (S), liposome‐treated (L), rejuvesol‐treated (R) and liposome + rejuvesol‐treated (L+R). The pRBCs were incubated for 1h at 37°C with HEPES‐NaCl (sham), liposomes (DOPC:CHOL, 7:3 mol%, 2mM lipid), Rejuvesol or liposomes plus Rejuvesol. The in vitro quality was accessed by hemolysis, deformability, aggregation, ATP and 2,3‐DPG at day 42 HS.
Results/Findings: Hemolysis was significantly decreased in all treatments compared to sham control (0.60 ± 0.06%): L (0.53 ± 0.01%, p=0.042), R (0.43 ± 0.02%, p=0.004), L+R (0.48 ± 0.06%, p=0.020). Ektacytometry analysis showed an increase in maximum elongation (EImax) in R (0.55 ± 0.01, p=0.010) and L+R (0.55 ± 0.01, p=0.010) treatments compared to S (0.53 ± 0.01) but not L (0.53 ± 0.01, p=0.936). RBC rigidity (KEI) increased in all treatments compared to sham (1.19 ± 0.07): L (1.28 ± 0.06, p=0.025), R (1.44 ± 0.17, p=0.010) and R+L (1.44 ± 0.06, p=0.004). Aggregation amplitude was significantly increased by R treatment only (24.07 ± 1.67 au vs. 19.12 ± 1.38 au, p=0.004). ATP levels were significantly higher in all treatments compared to sham (1.64 ± 0.14 µmol/g Hb): L (2.00 ± 0.21 µmol/g Hb, p=0.010), R (4.70 ± 1.20 µmol/g Hb, p=0.004), L+R (5.00 ± 1.56 µmol/g Hb, p=0.004). The levels of 2,3‐DPG were no longer detectable in S and L treatments at day 42. The combined treatment was comparable to R (2.38 ± 3.26 µmol/g Hb vs. 2.62 ± 2.20 µmol/g Hb, p=0.868).
Conclusion: Both rejuvenation and liposome treatments improved the quality of stored RBCs compared to sham control. The combined treatment (L+R) did not have a greater impact in improving in vitro quality of stored RBCs compared to rejuvenation alone.
CP50
Optimized Transport Packaging for Blood Products: A First Step Toward a Unique and Adaptable Thermoregulation System
Lucie Boyer1, Eric Ducas1, Patricia Landry1, Nathalie Dussault1, Jacques Bernier1, Danny Brouard*1 and Anne Maltais2
1Héma‐Québec, 2Institut de technologie des emballages et du génie alimentaire
Background/Case Studies: Héma‐Quebec (HQ) is facing major logistic challenges in the transportation and distribution of blood components over a large geographic area. In collaboration with the Institut de technologie des emballages et du genie alimentaire, our applied research group is working on the development and optimization of a transport packaging for the 500‐mL whole blood Leukotrap RC System (Haemonetics Corp.). The objective is to design a packaging system for the rapid cooling (T < 10°C) of one to six 500‐mL whole blood units (WBU) within 8h from collection. Moreover, the insulating and thermoregulation system must maintain the internal temperature of WBU between 1°C and 10°C for 24h under extreme external conditions (‐30°C to 40°C), including the initial blood cooling period.
Study Design/Method: The proposed packaging design is based on an external Coroplast box containing six Vacuum Insulated Panels (VIP) for increased insulating efficiency. Preservation of the initial cooling period and extended thermoregulation properties were ensured by an assembly of preconditioned 5°C Phase Change Material (PCM). The number of PCM, their position and conditioning were optimized and tested in order to meet the expected performance criteria. Preconditioned PCM were stored into VIP boxes for 24h at 20‐24°C before each test to mimic a worst‐case scenario for remote blood drives. For the experimental testing, 500‐mL WB bags were filled with 555mL saline 0.9% at T = 30°C to mimic freshly collected WB. Probes were positioned inside the saline‐filled bags to monitor temperature profiles of WBU under extreme winter (‐30°C) and summer (40°C) conditions. Shipping boxes were filled with either one or six bags (n= 2).
Results/Finding: The results showed that the thermoregulation box prototype is able to cool WBU bags under 10°C in 4.55 ± 0.62h and maintain their internal temperature between 1°C and 10°C for 24h with final values ranging between 6.3°C and 9.3°C for the extreme summer scenario. Similar results were obtained for the extreme winter scenario; units reached the 10°C threshold value in 2.4 ± 0.2h and the bags' internal temperatures were within the acceptable range for 24h.
Conclusion: The insulating and thermoregulation system met HQ performance criteria. Preliminary results showed that PCM could be conditioned at temperatures higher than ‐13°C without any significant impact on the system performances. HQ is currently validating the shipping box prototype performances. Additionally, we are working on reducing the PCM conditioning time to optimize logistic operations. As this packaging has many advantages in terms of durability, price and convenience, HQ intends to evaluate this system for the packaging and transport of other lines of blood products.
CP51
PAS‐C Platelets Contain Lower Supernatant Isohemagglutinin Titers and HLA Antibody Specificities and Increased Soluble CD40 Ligand Versus Plasma Platelets
Stuart Weisberg*1, Christopher C. C Silliman2, Beth Shaz1, Marguerite Kelher2 and Claudia S. Cohn3
1New York Blood Center, 2Bonfils Blood Center, 3Department of Laboratory Medicine and Pathology, University of Minnesota
Background/Case Studies: Platelets collected and stored in platelet additive solution (PAS) reduce recipient exposure to donor plasma components. To better define the effects of PAS on platelet supernatant composition, we compared total protein, isohemagglutinin titers, HLA antibodies and in vitro neutrophil (PMN) priming activity in supernatants of PAS‐C platelets to plasma platelets.
Study Design/Methods: Apheresis platelets from group O blood donors were collected into either 100% donor plasma (n=50) or 65% PAS‐3 / 35% donor plasma (n=50). Within 12 hours of collection, samples of the product supernatant were frozen, assayed for total protein concentration, anti‐A and anti‐B titer, and PMN priming activity within the total and lipid extractable fractions. All samples were screened for HLA antibodies. Screen‐positive samples were tested using Luminex single bead assays for antibody strength and specificity. Soluble CD40 ligand (sCD40L) was measured using solid‐phase ELISA.
Results/Findings: Supernatants of PAS‐C platelets had significantly lower total protein concentration, anti‐A and anti‐B titers compared to plasma platelets. There was no significant difference in the number of HLA‐antibody screen positive PAS‐C (3/50 products) compared to plasma platelets (2/50 products); however, the HLA‐antibody screen‐positive supernatants of PAS‐C platelets had fewer HLA specificities (2 specificities) compared to those of the plasma platelets (18 specificities). PMN priming activity was significantly increased in the supernatant of PAS‐C platelets. The lipid extractable fraction was not affected; however sCD40L levels were increased in the supernatant of PAS‐C compared to plasma platelets (Table 1).
Conclusion: Decreased plasma proteins likely underlie lower rates of allergic and febrile non‐hemolytic transfusion reactions seen with use of PAS‐C platelets. Decreased anti‐A and anti‐B titers may prevent hemolysis from minor ABO mismatch. Lower HLA‐antibody specificities may mitigate transfusion related acute lung injury (TRALI). Increased PMN priming by PAS‐C platelets is likely due to platelet membrane release of sCD40L and not bioactive lipids. Although sCD40L has been associated with TRALI, only PMN priming with lipid ‐ not cytokine ‐ agents has been causally linked with TRALI. The mechanism and clinical impact of increased sCD40L in PAS‐C platelets remain to be elucidated.
|
Plasma (n=50) |
PAS‐C (n=50) |
|
|---|---|---|
| Anti‐A (titer) † | 16 (8‐32) | 8 (4‐16)** |
| Anti‐B (titer) † | 16 (8‐32) | 4 (4‐8)** |
| Total protein (g/dL) ‡ | 5.5 (±0.33) | 2.0 (±0.13)** |
| Supernatant PMN priming (nMol O− 2/min) ‡ | 3.1 (±0.87) | 4.2 (±0.77)** |
| Supernatant sCD40L (ng/mL) ‡ | 5.8 (±3.5) | 8.1 (±4.0)** |
Data are reported as median (interquartile range)
Data are reported as mean (±SD)
P < 0.01
CP52
Performance and Workflow Efficiency of BD Facsvia and Nanoentek ADAM‐Rwbc for Assessing Residual WBCs in Leukoreduced Blood Products
Maryam Nouroozian*
San Diego Blood Bank
Performance and Workflow Efficiency of BD FACSVia and Nanoentek ADAM‐rWBC for Assessing Residual WBCs in Leukoreduced Blood Products
Maryam Nouroozian; Brian Read; William Davey; Rob Tressler ‐ San Diego Blood Bank, San Diego, CA, USA.
Background/Case Studies: Current guidelines require a reduction of residual white blood cells (rWBC) below 5x10⁶ WBC in US and 1x10⁶ WBC in Europe, per unit. The established reference method for testing rWBC in platelet (PLT) and red blood cell (RBC) products is flow cytometry. Alternative technologies have been developed including hemocytometry and microfluorometry.
Study Design/Methods: This study compared performance and workflow efficiency of the FACSVia, a flow cytometer with a simplified workflow and automated loader to the ADAM automatic microscopic cell counter based on imaging technology. Nonfiltered whole blood (WB) samples, apheresis platelet units (n=2) and leukoreduced (LR) RBC units (n=2) were used to generate spiked samples. Apheresis platelets and LR RBC were filtered to deplete WBCs and were used as a diluent. Nonfiltered WB samples were the source of WBCs to prepare a sample of 1000 WBC/uL. The spiked samples of 5, 12.5, 5, 25, 50 and 100 WBC/uL were prepared from the source sample of 1000 WBC/uL and filtered platelet and RBC units. To evaluate linearity, WBC concentrations (0, 12.5, 5, 25, 50, 100 WBC/uL) were measured using ADAM and FACSVia. Samples were stained and run in triplicate on each analyzer. Data was analyzed using linear regression. The results were proportional to the WBC concentration in the spiked samples. Reproducibility of the two systems was measured by running spiked samples (0, 5, 25, 50 WBC/uL). 10 tubes of each sample were stained and run per system. The %CV and %Diff were calculated. A batch of 20 samples (PLT and RBC) were run on both analyzers, repeated for 5 days. Workflow efficiency was assessed observationally by measuring the time of tasks performed. Tasks recorded were Instrument QC, assay controls and sample testing and analysis.
Results/Findings: The WBC concentration results for PLT and RBC samples on FACSVia correlated well with ADAM (r‐PLT=0.996, slope=0.972), (r‐RBC=0.999, slope=0.992). The %Diff‐PLT at 5, 25, 50 WBC/uL were 7.8, 4.7 and 10, respectively. The %Diff‐RBC at 5, 25, 50 WBC/uL were 10.8, 3.2 and 14.7, respectively. The average total testing time was similar on both instruments; 89 min for the FACSVia and 92 min for the ADAM. Of the total testing time, ADAM required continuous hands‐on time, while FACSVia demonstrated 62% (56 of 89 min) hands‐off time.
Conclusion: Both instruments showed comparable precision, linearity and accuracy. While the average total testing time was similar on both instruments, FACSVia offered a significant workflow efficiency advantage. Users saved an average hands‐on time of 56 minutes that could be used on other tasks.
CP53
Platelet Rich Plasma and Quality Control: Is There a Role for the Blood Bank?
Claudia S. Cohn*1 and Mickey Koh2
1Department of Laboratory Medicine and Pathology, University of Minnesota, 2St George's Hospital and Medical School
Background/Case Studies: Autologous Platelet‐rich plasma (aPRP) is a poorly regulated blood component often produced at the patient's bedside and used for indications such as chronic and acute orthopedic injuries, wound and incision‐healing and rheumatologic diseases. PRP isolation can be done by apheresis, which yields a consistent, platelet‐rich fraction; however, most aPRP is made using small bench‐top centrifuges with cartridges that deliver uneven platelet enrichment. Thus, the consistency and quality of aPRP is questionable and the lower yielding PRP may have decreased efficacy.
Study Design/Methods: A survey was designed to assess aPRP manufacture, usage and quality control (QC) measures taken prior to its use. A survey was developed with input from content experts. The survey was sent to members of BEST and ISBT. Survey respondents were encouraged to forward the survey to colleagues, thus a true denominator is unknown. A total of 62 completed and partially completed surveys were received.
Results/Findings: Responses came from 13 countries, but the majority of responses came from the United States (US). Of the respondents, 35% reported aPRP use in their hospital. aPRP was used predominantly for outpatients, though >40% of hospitals also used aPRP in the in‐patient setting. In most hospitals, aPRP was used by 1‐5 MDs; however, 3 hospitals had >10 MDs using aPRP. The aPRP was used for orthopedics, wound/incision repair, rheumatology and other indications. In the US the aPRP was manufactured outside of the blood bank, while outside the US aPRP was isolated by blood bank personnel. Nearly all the aPRP manufacturing was done with no quality control (QC) measures (97%); however, 3 respondents assessed the final product prior to release. These QC measures included a platelet count to measure the enrichment of the platelet fraction, culturing the product and infectious serology testing. In some cases, if the aPRP failed QC it could still be used, pending an MD's approval. In the 3 hospitals conducting QC on the final aPRP, the testing was done by the blood bank. A subset of respondents from African nations also used allogeneic PRP (allPRP). In contrast to the patterns of use with aPRP, allPRP was used primarily for in‐patients for indications including orthopedics, wound/incision repair and ‘other’. The allPRP was manufactured in the blood bank or the donor center with no QC other than a regular check of the centrifuge used to isolate the PRP fraction.
Conclusion: PRP is used in hospitals throughout the world for a wide variety of indications. The blood bank is involved in its manufacture in some countries, but in the US aPRP is made outside of the blood bank. Quality control of aPRP production and the final product is not done in most hospitals. To improve the consistency and efficacy of PRP, more stringent QC measures need to be in place.
CP54
Positive Metabolic and Morphological Impact of a Rejuvenation Solution on Red Blood Cells Stored 42 Days in Sagm
Mickaël Marin1, Camille Roussel1, Michaël Dussiot2, Alioune NDour1, Olivier Hermine2, Yves Colin1, Alan D. Gray3, Matt Landrigan4, Caroline Le Van Kim1, Pierre Buffet1 and Pascal Amireault*1
1INSERM UMR‐S 1134, Institut National de la Transfusion Sanguine, 2INSERM U1163, Institut Imagine, 3Citra Labs, a Zimmer Biomet Company, 4Zimmer Biomet
Background/Case Studies: The morphology of donated red blood cells (RBC) change with storage, along with a loss of deformability, increased surface exposure of phosphatidylserine (PS), and decreased intracellular ATP. These changes have been associated with increased RBC clearance within hours of transfusion. Analysis of morphological alterations of stored RBC with imaging flow cytometry (IFC) has identified a subpopulation of small RBC that accumulates upon storage. This RBC subpopulation has a reduced projected surface area and undergoes a spherocytic shift which is expected to induce their retention in the spleen (Roussel, Dussiot etal, 2017). Some of the storage alterations are reversible when the RBC metabolism is reestablished. As such, treatment with a rejuvenation solution (Citra Labs) before transfusion is expected to restore some of the RBC properties and thus potentially increase their capacity to stay in circulation and operate effective tissue oxygenation following transfusion.
Study Design/Methods: A multi‐parametric analysis of RBC alterations was performed to evaluate the effect of rejuvenation on RBCs stored in SAGM (n=6) under blood bank conditions at Day 3 (D3), at Day 42 (D42), after rejuvenation (R), and after rejuvenation and washing (RW). Morphological alterations of stored RBCs were evaluated with IFC (Imagestream X Mark II, AMNIS®).
Results/Finding: Rejuvenation increased the level of intracellular ATP, confirming the metabolic effect of this process. Population distribution as per RBC projected surface area measured by IFC depicted a well‐demarcated subpopulation of small RBC that increased with storage from 2.1‐8.8% at D3 to 8.3‐68.1% at D42. Rejuvenation markedly reduced this storage‐induced spherocytic shift (1.7‐29.3%) and partially restored RBC morphology, an effect confirmed by differential interference contrast microscopy. The restoration effect of the rejuvenation process did not correct the storage‐related loss of RBC elongation but was associated with a decrease in PS exposure (Table).
Conclusion: Our multi‐parametric analysis shows that some but not all storage‐related alterations are therefore corrected by metabolic rejuvenation. The impact of these effects while generally positive at the cellular scale requires further analysis by specific clinical studies assessing transfusion yield and tissue oxygenation.
TABLE 1. Multi‐parametric RBC analysis
| Day 3 | Day 42 | R | RW | |
|---|---|---|---|---|
| Proportion of small cells (%) | 5.3 ± 2.4 | 28.2 ± 9.0 | 12.2 ± 5.1 | 9.5 ± 4.1 |
| Projected surface area (µM2) | 69.6 ± 2.0 | 66.6 ± 5.7 | 69.5 ± 4.3 | 70.4 ± 1.9 |
| PS Exposure (%) | 0.45 ± .13 | 2.78 ± 4.72 | 0.60 ± .28 | 0.41 ± .11 |
| ATP (mmol/g Hb) | 7.8 ± 1.2 | 2.3 ± 1.0 | N/A | 5.7 ± 1.7 |
| Hemolysis (%) | 0.03 ± .02 | 0.33 ± .28 | 0.83 ± .3 | 0.32 ± .14 |
| Elongation index (30Pa) | 0.602 ± .008 | 0.585 ± .017 | 0.580 ± .017 | 0.578 ± .017 |
This study is funded by Zimmer Biomet.
CP55
Red Cell Concentrate Volume and Manufacturing Method Impact Post‐Thaw Quality in Cryopreserved Products Processed Using a Closed Cell Processor
Anita Howell1, Angela Hill1, Tracey Turner2, April Xu2, Brandie Dennis2 and Jason P. Acker*2,3
1Canadian Blood Services, Centre for Innovation, 2Canadian Blood Services, 3University of Alberta
Background/Case Studies: The blood service uses both top/top with whole blood filtration (WBF) and top/bottom with red cell filtration (RCF) methods to prepare CPD/SAGM LR red cell concentrates (RCCs). Mean volume (mL) is higher in WBF units (314 ± 15) than in RCF units (275 ± 16), with similar hematocrits. A closed system cell processor is currently being implemented for cryopreservation of RCCs. Post‐deglycerolization re‐suspension in AS‐3 additive solution is performed on‐instrument to a defined total end volume, as dictated by the centrifuge bowl size. The impact of the resulting variation in hematocrit on post‐thaw in vitroRBC quality was evaluated to ensure that regulatory standards can still be met for RCCs at the extreme edge of the input volume range.
Study Design/Methods: 12 small RCF (252‐263mL) and 12 large WBF (322‐353mL) RCCs were stored for 21 d before being glycerolized and frozen at ≤‐65°C for ≥72h. Large RCCs whose red cell mass exceeded the capacity of the 275mL deglycerolization centrifuge bowl were volume reduced prior to glycerolization. RCCs were thawed in a 37°C water bath, deglycerolized and re‐suspended in AS‐3. RCCs were stored 14 d and then tested for in vitroRBC quality.
Results/Finding: Small RCF RCCs had lower (p<0.05) hematocrit, specific gravity, hemoglobin per unit, supernatant K+ and Na+ concentration, deformability (EIMAX), and higher (p<0.001) recovery than did large WBF units. No significant differences in hemolysis, ATP, 2,3‐DPG, p50, RBC indices, RBC morphology, or residual glycerol were seen between groups. The majority of units met acceptance criteria (Table 1), however 8 of 12 large WBF units had RBC recoveries < 80% due to pre‐glycerolization volume reduction, and 2 of the small RCF units had hemoglobin values < 35g per unit. When the recovery and hemoglobin failure rates are analyzed against the organization's RCC production volume distribution, the mean recovery is projected to be well above 80% and the hemoglobin failure rate would be below 10% of units tested; compliant with regulatory standards.
Conclusion: The differences between groups in the cryopreserved RCC physical characteristics were expected due to the re‐suspension method and differences in the input product red cell mass. The lack of significant metabolic differences between groups indicates that the differences in post‐deglycerolization hematocrits are not adversely affecting product quality.
TABLE 1. RBC Quality of RCCs Cryopreserved using a Closed System Cell Processor at Expiry
| Parameter | Small RCF | Large WBF |
|---|---|---|
| Hemolysis (%) | 0.32 ± 0.06 (0.23, 0.42) | 0.27 ± 0.05 (0.22, 0.41) |
| Hematocrit (%) | 44 ± 1 (41, 45) | 54 ± 1 (52, 56) |
| Recovery (%) | 94 ± 2 (91, 97) | 77 ± 3 (72, 82) |
| Hemoglobin (g/unit) | 37 ± 2 (34, 40) | 44 ± 2 (41, 47) |
CP56
Rejuvenation Enhances Oxygen Release Capacity of 42 Day Stored Red Blood Cells Above Fresh Levels
Kyle Kausch*1, Alan D. Gray2, Matt Landrigan1, Pamela Whitley3, Michael Wellington3, Sherrie Sawyer3, Shalene Hanley3, Neeta Rugg4, Patricia A. R. Brunker3, Shawnagay Nestheide4, Fatima Mohmoud4 and Jose Cancelas‐Perez4
1Zimmer Biomet, 2Citra Labs, a Zimmer Biomet Company, 3American Red Cross, 4Hoxworth Blood Center
Background/Case Studies: Red Blood Cell (RBC) metabolic changes during liquid storage have been shown to increase the affinity of hemoglobin (Hb) for oxygen (O2). Thus, transfusions of stored RBCs suggest inefficient and impaired O2 delivery to tissues compared to fresh circulating RBCs (Hasan 1994). The objective was to determine the effect of RBC rejuvenation on RBC oxygen release capacity (ORC) and estimated oxygen consumption (VO2) after simulating a single unit transfusion of either standard or rejuvenated RBC stored for 42 days.
Study Design/Method: Oxygen dissociation curves (ODC) (Hemox Analyzer, TCS Scientific) were generated from fifty‐two (52) RBC units (leukocyte‐reduced), CPD/AS‐1 or CP2D/AS‐3, on Day 0, Day 42, and after rejuvenation and washing (PW). The ODC for each sample was used to determine ORC (mL O2/g Hb) and Total Releasable Oxygen (TRO) of the unit (mL O2). ORC was determined by assessing the change in % O2 saturation from 100mm Hg PO2 (e.g., lung) to 40mm Hg PO2 (e.g., venous blood) multiplied by 1.34mL O2/g Hb (Li 2016). A simulated baseline pre‐transfusion VO2 of 115mL O2/min was estimated using the Day 0 ORC and assuming a 7g/dL transfusion trigger with a cardiac output of 5L/min and 5L blood volume. Paired Student's t tests were used for comparative statistical analyses.
Results/Finding: RBC rejuvenation on day 42 restored ORC and TRO to levels greater than Day 0 (Table 1). ORC of the rejuvenated unit was 1.5 ± 0.2 times and 3.4 ± 0.5 times greater than RBC on Day 0 and Day 42, respectively (p<0.001). VO2 increased after a simulated single unit transfusion of RBC (Day 0, Day 42, and PW) by 19.3%, 8.9%, and 28.8% over the pre transfusion VO2, respectively (p<0.001).
Conclusion: These results suggest a transfusion with rejuvenated RBCs has the potential to release 3.3 times the volume of O2 compared to standard, untreated RBCs stored for 42 days. Inferior oxygen delivery to tissues (VO2max) has been observed during exercise in healthy human volunteers after transfusion of two autologous RBC units stored for 42 days vs 7 days which seem dependent on genetic variability and storage time (Bennett‐Guerrero 2017). Therefore, transfusion practices to correct anemia may be less effective than intended due to the variable ORC of standard stored RBC units. Transfusion strategies should consider whether the use of RBC with increased ORC may be physiologically advantageous.
Disclosure: This study was funded by Zimmer Biomet.
TABLE 1. Change in Hb Saturation, ORC, Total Hb, TRO, and VO2 of Day 0, Day 42, and Rejuvenated RBCs (n=52; Avg ± SD).
| Sample | Change in Hb Saturation(%) |
ORC [mL O2/g Hb] |
Total Hb/Unit (g) |
TRO [mL O2] |
Post Transfusion VO2 [mL O2/min] |
|---|---|---|---|---|---|
| Day 0 | 24.5 ± 3.2 | 0.33 ± 0.04 | 67.7 ± 7.2 | 22.1 ± 3.4 | 137 ± 3 |
| Day 42 | 11.3 ± 2.3 | 0.15 ± 0.03 | 67.7 ± 7.2 | 10.3 ± 2.5 | 125 ± 3 |
| PW | 37.0 ± 4.1* | 0.50 ± 0.06* | 66.6 ± 6.9 | 33.0 ± 5.1* | 148 ± 5* |
p<0.001 compared with Day 0 and Day 42 value
CP57
Rejuvenation Solution as an Adjunct Storage Solution Maintains Physiological Hemoglobin Oxygen Affinity during RBC Unit Storage
Andrea Ansari*1, Jay Srinivasan1, Gustaaf de Ridder2, Alan D. Gray3, Matt Landrigan4, Keaton Charles Stoner5, Angela Crabtree6, Jessica Poisson7 and Ian Welsby8
1Duke University School of Medicine, 2Duke Health Pathology, 3Citra Labs, a Zimmer Biomet Company, 4Zimmer Biomet, 5Duke University, 6Department of Pathology, Durham Veterans Affairs Medical Center, 7Duke University Hospital, 8Duke University Medical Center
Background/Case Studies: Deleterious changes develop during the storage of packed red blood cells (RBCs) collectively called the “storage lesion”. These include altered membrane composition and decreased deformability, increased in‐bag and post‐transfusion hemolysis, loss of ATP, S‐nitrosohemoglobin, vasodilatory capacity, and cell surface PS expression, and depleted 2,3‐diphosphoglycerate (2,3‐DPG). The loss of 2,3‐DPG increases the oxygen affinity of hemoglobin, resulting in lower p50 (partial pressure of oxygen at 50% hemoglobin saturation). Decreased p50 may negatively impact the ability for transfused RBCs to release oxygen to peripheral tissues. An FDA‐approved rejuvenation solution (Citra Labs) can restore normal levels of ATP and 2,3‐DPG, normalizing membrane function and oxygen affinity, respectively. This process requires incubation at 37°C for an hour, an impractical step in time‐sensitive situations, followed by washing of the RBCs. We tested the hypothesis that rejuvenation without the incubation step (“cold rejuvenation”) could prevent or reverse changes in oxygen affinity, deformability, and susceptibility to hemolysis of RBCs.
Study Design/Method: Eight units of group A+, leukoreduced PRBC stored in AS‐1 were obtained from our local blood center. After 3 days of storage, units were divided into 4 separate aliquots: control (CTL), wash (W), standard rejuvenation (SR), and cold rejuvenation (CR). The rejuvenation solution (50ml) was added to the CR group, and all groups were then stored for another 12 days at 1‐6°C. On day 15 of storage, the SR group was incubated for 1 hour at 37°C with rejuvenation solution, after which the W, SR, and CR groups were separately washed on a C.A.T.S®(Fresenius Kabi) using the High Quality Wash setting. Hemoglobin p50 was measured by tonometry using a Hemox Analyzer (TCS Scientific). Deformability (Elongation Index or EI) was measured by ektacytometry (LoRRca Mechatronics). Supernatant plasma free hemoglobin (PFHb) was measured using visible‐light spectrophotometry. Cell surface PS expression (PS+) was measured by Annexin V flow cytometry. All group results were compared using nonparametric Wilcoxon signed‐rank tests with α = 0.05.
Results/Finding: Significant differences in p50 were noticed between all groups (Table 1). EI, PS+, and PFHb did not differ between groups.
Conclusion: Cold rejuvenation prevents the increased oxygen affinity (lower p50) seen over 15 days of RBC storage without adverse effects on deformability or hemolysis. This offers an alternative to incubated rejuvenation to provide clinicians with ready access to RBCs with a high/normal p50 that may better release oxygen to the tissues.
TABLE 1. Compiled Results (normal p50 is 24‐28mmHg)
| Group |
p50 (mmHg) (mean±SD) |
% PS Positive (mean±SD) |
Elongation Index (mean±SD) |
PFHb (mg/dL) (mean±SD) |
|---|---|---|---|---|
| CTL | 18.1 ± 1.3* | 0.484 ± 0.29 | 0.618 ± 0.04 | 30.2 ± 14.2 |
| W | 16.7 ± 1.1* | 0.536 ± 0.37 | 0.637 ± 0.02 | 26.0 ± 2.8 |
| SR | 35.2 ± 1.5* | 0.414 ± 0.23 | 0.637 ± 0.02 | 26.8 ± 8.5 |
| CR | 31.4 ± 2.6* | 0.300 ± 0.13 | 0.627 ± 0.02 | 26.0 ± 8.6 |
p < 0.05 compared to all other groups
This protocol is for research only and is not an FDA approved method. This study is funded by Zimmer Biomet.
CP58
Removal of Extracellular Contaminants from Prbcs Using a Multifunctional Porous Polymer Filter
Karl‐Gustav Ruggeberg*, Thomas Golobish, Tamaz Guliashvili, Andrew Scheirer, Pamela O'Sullivan, Joshua Vichare, Vincent Capponi, Phillip Chan and Maryann Gruda
Cytosorbents Medical Inc.
Background/Case Studies: The extracellular potassium concentration [K+] of red blood cell (RBC) units increases dramatically during cold storage reaching >50 mEq/L in units near the end of their storage life. This can cause transient and potentially fatal cardiac arrhythmias upon transfusion, particularly in infants, and massively‐transfused patients, and those with compromised renal function. Reactive antibodies and other inflammatory agents in RBCs can also elicit life‐threatening reactions, potentially causing high fever, transfusion‐related acute lung injury (TRALI), anaphylaxis, and even death. In this study, a multifunctional bead‐based filter was evaluated for removal of K+, along with free hemoglobin (Hb) and other pRBC contaminants that can contribute to transfusion related adverse events.
Study Design/Method: Ten leukocyte‐reduced pRBC (300mL) units stored in AS‐1, obtained from a regional blood donor center at expiration (42 ± 2 days), were passed by gravity through sorbent‐devices containing 50mL of multifunctional polymer bead, at a flow rate of 20mL/min. Supernatants were analyzed for K+ removal as well as free Hb, antibodies and cytokines (27‐plex, BioRad). RBCs were analyzed for viability and integrity via flow cytometry and osmotic fragility assay, respectively.
Results/Finding: Filtration of the aged pRBC units through the sorbent device reduced [K+] from 54.2 ± 5.0 to 1.98 ± 1.3 mEq/L; equivalent to an 84.6% reduction. Free Hb was reduced by 96.3% from 2.5 ± 1.0 to 0.39 ± 0.2mg/mL. Antibodies, specifically IgG, IgA, and IgM decreased from 9.91 ± 3.1 to 2.40 ± 1.1mg/mL (77.7%), 0.48 ± 0.1 to 0.25 ± 0.01mg/mL (48.9%), and 0.73 ± 0.2 to 0.49 ± 0.1mg/mL (31.5%), respectively. Inflammatory cytokines were significantly reduced, specifically: IP‐10 from 144.27 ± 16.2 to 18.43 ± 2.7 pg/mL (87.2%), MIP‐1β from 37.37 ± 5.7 to 7.23 ± 2.5 pg/mL (80.7%), and PDGF from 1348.3 ± 291.9 to 77.91 ± 22 pg/mL (94.2%). Filtration had no significant impact on cell surface markers of RBC viability (<0.1% decrease) or sensitivity to osmotic changes. Values listed represent mean ± SEM (P < 0.01 for all analytes tested). A paired t‐test was used to assess significance.
Conclusion: The sorbent filter was highly effective in reducing the levels of extracellular K+ as well as free Hb, antibodies, and cytokines from pRBCs without impact on RBC viability or integrity. This study demonstrates the viability of a multifunctional sorbent filter for removal of K+ along with other detrimental components from stored pRBCs that can readily be incorporated into transfusion practices to minimize adverse effects.
CP59
Residual Red Cell Count Comparison in Apheresis Platelets and Whole Derived Platelets Units Using Manual Versus Automated Hematology Analyzer
Miriam Andrea Duque*1, Agnes Aysola1, Neil S Harris2, Juan Merayo‐Rodriguez3, J Peter Pelletier2 and Faisal Mukhtar2
1University of Florida, College of Medicine, 2University of Florida College of Medicine, 3Life South Community Blood Centers
Background/Case Studies: Platelets carry no Rh antigens, but residual red blood cell (RBC) in platelet products can immunize D negative recipients if the donor is D positive. Current recommendation is to give Rh immunoglobulin (RhIG) to Rh negative patient if they receive Rh positive platelet unit to avoid potential alloimmunization to D antigen. A recent study has shown a very low frequency (1.5%) of D alloimmunization when a Rh mismatch platelet is transfused. Restricting D negative patients to receive only D negative platelets could create shortage and cause inventory challenges. Higher yields of platelets with minimum to none residual RBCs are obtained with new generations of apheresis machines. As a consequence, the need for prophylactic Rh immunoglobulin (RhIG) may be unnecessary with the use of apheresis derived platelets. The accurate determination of residual RBC in a platelet unit is important for patient safety to prevent Rh alloimmunization. Hemocytometer is considered the gold standard for cell counting. However, the rapidity and convenience offered by automated methods resulted in widespread use of automated hematology analyzers. Currently there are no standardization and/or guidelines to advise what system to use for RBC quantification in platelet products.
Study Design/Method: We designed this study to quantify the residual RBC in apheresis platelets and whole blood derived platelets comparing hemocytometer and automated methods. We measured the amount of red blood cells per microliter in 50 apheresis and 50 whole blood derived platelet units using hemocytometer and two different automated hematology analyzers, namely, Sysmex (Sysmex America, Lincolnshire, IL) and Advia 2120 (Siemens Healthcare Diagnostics, Tarrytown NY). The whole blood derived platelet units were produced using AcrodoseTM system technology. We conducted non‐parametric permutation test based on 10000 permutations to compare Sysmex and Advia between apheresis and whole blood derived groups.
Results/Finding: There was no residual RBC detected in apheresis units by hemocytometer, but was found with both of the automated instruments. Acrodose units had statistically significant higher amount of residual RBCs by hemocytometer with the p value of <0.001. See table 1.
Conclusion: Manual residual RBC measurement gives a statistically significant different result from the RBC quantification by automated methods. The automated methods overestimate the residual RBCs in apheresis and Acrodose when minimal numbers of RBC are quantified. We conclude that the automated counters are not as accurate compared to the hemocytometer. Larger studies are needed to establish a clinically significant difference to accurately measure residual RBC in platelet products.
TABLE 1. Residual RBC concentration in platelet products
| Apheresis | Acrodose | P value | |
|---|---|---|---|
| Manual | 0 | 0.00118 x 10⁶ /ul | < 0.001 |
| Sysmex | 0.087 x 10⁶ /ul | 0.064 x 10⁶ /ul | 0.002 |
| Advia | 0.086 x 10⁶ /ul | 0.069 x 10⁶ /ul | 0.009 |
CP60
Restoration of p50 and Morphology in Stored Red Blood Cells after Rejuvenation
Alan D. Gray*1, Matt Landrigan2, Pamela Whitley3, Michael Wellington3, Sherrie Sawyer3, Shalene Hanley3, Neeta Rugg4, Patricia A.R. Brunker5, Shawnagay Nestheide4, Fatima Mohmoud4 and Jose Cancelas‐Perez4
1Citra Labs, a Zimmer Biomet Company, 2Zimmer Biomet, 3American Red Cross, 4Hoxworth Blood Center, 5American Red Cross Biomedical Services
Background/Case Studies: The addition of a rejuvenation solution to stored Red Blood Cells (RBCs) has been shown to increase ATP and 2,3‐DPG profiles to fresh levels. The objective was to compare 50% hemoglobin‐oxygen saturation (p50) and morphology profiles of fresh(day of collection) RBCs to RBCs stored for 42 days and after treatment with an FDA approved rejuvenation solution.
Study Design/Method: The addition of a rejuvenation solution to stored Red Blood Cells (RBCs) has been shown to increase ATP and 2,3‐DPG profiles to fresh levels. The objective was to compare 50% hemoglobin‐oxygen saturation (p50) and morphology profiles of fresh(day of collection) RBCs to RBCs stored for 42 days and after treatment with an FDA approved rejuvenation solution.
Results/Finding: In vitro RBC recovery (overall) was 97.2 ± 2.2%. Hemolysis (%) was similar on Day 42 before and after dry‐air incubation with the rejuvenation solution (0.34 ± 0.14% vs 0.35 ± 0.14%). Percent hemolysis (%) decreased after washing (0.24 ± 0.07%) and was maintained below <1% for all units during storage for 24Hr (0.51 ± 0.19%). Average ATP and 2,3‐DPG were restored above the average fresh values. The morphology score decreased ∼25% by Day 42, which was restored to near fresh values following rejuvenation and washing and storage 24Hr (93.7% and 95.1%, respectively). RBC oxygen affinity, as assessed by p50, was restored above fresh values. All values were significantly different compared to Day 42 (p<0.001, paired t‐test) (Table 1).
Conclusion: RBC morphology was restored to near fresh and average ATP, 2,3‐DPG, and p50 were restored above fresh values when incubated with a rejuvenation solution using the dry‐air incubation process. RBC Morphology, ATP and 2,3‐DPG were maintained during storage 24Hr. Rejuvenation of refrigerated RBCs may offer avenues to improve RBC quality prior to transfusion.
TABLE 1. ATP, 2,3‐DPG, Morphology Score, and p50 Values in Fresh (Day 0) RBC, After Storage (Day 42), After Rejuvenation and Washing (PW) and After Storage for 24 hours (24Hr) (Avg±SD)
| Test | n | Fresh (Day 0) | Day 42 | PW | 24Hr |
|---|---|---|---|---|---|
| ATP (µmol/g Hgb) | 65 | 4.46 ± 0.57 | 3.39 ± 0.56 | 10.14 ± 2.32 | 9.69 ± 2.26 |
| ATP (% of fresh) | 65 | 100% | 76 ± 10% | 229 ± 50% | 219 ± 50% |
| 2,3‐DPG (µmol/g Hgb) | 65 | 12.15 ± 3.39 | 0.40 ± 0.53 | 12.13 ± 3.10 | 12.37 ± 3.38 |
| 2,3‐DPG (% of fresh) | 65 | 100% | 3 ± 4% | 104 ± 29% | 105 ± 26% |
| Morphology Score (%) | 33 | 99.5 ± 1.0 (Site A) | 73.5 ± 8.2 | 93.7 ± 3.4 | 95.1 ± 3.5 |
| 32 | NT* (Site B) | ||||
| p50 (mm Hg) | 60 | 27.5 ± 2.3 | 18.4 ± 1.4 | 34.9 ± 2.7 | NT* |
| p50 (% of fresh) | 60 | 100% | 67.1 ± 6.2% | 127.6 ± 11.9% | NT* |
NT=Not Tested
This protocol is for research only and is not an FDA approved method. This study is funded by Zimmer Biomet.
CP61
Screening Blood Donor Plasma Samples for Presence of Cannabis Metabolites THC and 11‐OH‐THC at an Urban Hospital‐Based Blood Donor Center
Vandi Ly*, Dimath Alyemni, Warren R Korn, Matthew J Brune and Julie Katz Karp
Thomas Jefferson University Hospital
Background/Case Studies: Blood donors are screened with a donor history questionnaire that includes questions regarding behavioral risk factors, but none that specifically screen for the use of marijuana. Therefore, there is the theoretical possibility of transfer of active cannabis metabolites through transfusion. Donor plasma collected at an urban, hospital‐based blood donor center was examined for the presence of active cannabis metabolites, Δ9‐tetrahydrocannabinol (THC) and 11‐OH‐Δ9‐tetrahydrocannabinol (11‐OH‐THC).
Study Design/Method: De‐identified donor plasma segments were sequestered and stored frozen until time of testing. Testing for THC and 11‐OH‐THC was performed by liquid chromatography‐tandem mass spectrometry (LC‐MS/MS) based on a method modified from Lacroix and Saussereau. In summary, this method used dabsyl chloride derivatization of THC and 11‐OH‐THC to produce samples for LC‐MS/MS analysis. LC used a C18 column. Post‐column detection by MS/MS used positive ion electrospray with Q1:Q3 ion pairs of m/z = 605.3:225.3 (internal standard (IS), d3‐THC), m/z = 602.2:225.2 (THC), and m/z = 618.3:256.1 (11‐OH‐THC). Quantitative results for THC and 11‐OH‐THC were obtained from a standard curve (ratio of analyte integrals to integrals of internal standard) ranging from 0‐50 ng/mL for both THC and 11‐OH‐THC. Limits of quantitation, defined as 5 standard deviations above background, were 0.7 ng/mL for THC and 7 ng/mL for 11‐OH‐THC.
Results/Finding: A total of 424 donor plasma samples were tested for THC and 11‐OH‐THC. No samples tested positive for either THC or 11‐OH‐THC. Theoretical calculations according to statistics of a Poisson distribution indicated that there would be a 50% probability of one or more positives at a prevalence of 0.16% positive samples, and a 95% probability of one or more positives at a prevalence of 0.71% positive samples. Results thus indicated a boundary of prevalence of the presence of active THC‐metabolites in plasma samples to be less than 1% among this donor population. Standard pharmacokinetics of cannabis metabolism in previous studies indicate a likely time window of less than 12 hours for post‐exposure detection of THC and/or 11‐OH‐THC in plasma.
Conclusion: Testing of 424 donor plasma samples for active metabolites of cannabis at one urban, hospital‐based blood donor center produced no test‐positives. Statistically, results indicated that prevalence of positivity, if greater than zero, is at most less than 1%. Probability of occurrence of cannabis metabolites in blood donor samples is likely to be highly variable across donor centers and is largely dependent on blood donor demographics.
CP62
Screening of Red Blood Cell Concentrates for Microparticle Content As Quality Indicator
Elisabeth Maurer‐Spurej*1, Ruqayyah Almizraq2, Daniel Millar3 and Jason P. Acker4
1University of British Columbia, 2University of Alberta, 3LightIntegra Technology Inc., 4Canadian Blood Services
Background/Case Studies: The controversy around the quality and clinical impact of aged red blood cell concentrates (RCC) is ongoing. Current studies are limited by the lack of quality measures suitable for routine screening of RCC. Based on evidence that fragments called microparticles (MP) or extracellular vesicles are markers of cellular activation or degradation, this study investigated the utility of MP screening to characterize the effect of RCC production methods and storage.
Study Design/Method: Red blood cell concentrates were prepared by whole blood filtration (WBF; Top/Top) or red cell filtration (RCF; Top/Bottom) methods, centrifuged to prepare a supernatant and tested for MP content (as measured with dynamic light scattering or a tunable resistive pulse sensing technique), hemolysis, ATP and red cell deformability on days 7, 21, and 42 of storage. One RCF RCC was tested on days 1, 5, 14, 21, and 43 and six 10mL aliquots were stored in parallel and tested on days 14, 21, and 43. All samples were tested for MP Content and compared to the other quality indicators.
Results/Finding: MP Content showed a linear increase with storage time with statistically significant differences between days 14, 21 and 43 (p<0.001) and correlated with supernatant hemoglobin, and inversely with ATP or RBC elasticity. Both MP testing methods agreed with respect to total MP Content. Starting levels of the quality indicators varied between donations, preparation methods (WBF RCC contained much higher levels of MP), and storage time. MP Content in the 6 aliquots were consistent at each time point but statistically higher than in the original RCC on and after day 21 of storage.
Conclusion: MP Content correlates with measures of hemolysis and other RBC quality indicators and could be implemented as a routine screening tool. Differences in MP content between donors, processes and age could be monitored and used to inform component production decisions. Measuring MP Content would allow 100% screening of RCC products in studies and pragmatic QC initiatives which are needed to settle the controversy about the clinical effect of RCC age.
CP63
Single Donor Spray‐Dried Plasma: The Future of Plasma Therapy?
Qiyong Peter Liu*, Jihae Sohn, Ryan C. Carney, Sruthi Sundaram and Mark A Popovsky
Velico Medical Inc
Background/Case Studies: Frozen plasma is integral to hemostasis management in many situations but logistically cumbersome because of frozen storage and long thawing time. Spray‐dried plasma (ODP, On Demand Plasma) is potentially superior because it may be stored under refrigeration near the patient and reconstituted in minutes at the point‐of‐care. The objective of this study is to determine if ODP can be consistently manufactured at a blood center with key proteins and coagulation function comparable to FFP.
Study Design/Methods: Units of never frozen plasma collected at a blood center were processed on‐site at a fixed volume into ODP using Velico's spray dryer. ODP (n = 60) and paired FFP aliquots were stored for 31‐33 days at 2‐6°C and ≤ ‐18°C, respectively, reconstituted with a fixed volume of rehydration fluid (sterile water for injection), and extensively characterized with respect to the levels of hemostatic proteins, coagulation and complement activation markers, and clotting performance. The volumes of processed plasma and rehydration fluid were pre‐determined ensuring similar total protein concentration in reconstituted ODP and FFP for direct comparison.
Results/Findings: Compared to FFP, ODP had ≥ 80% levels of functional clotting factors (fibrinogen, factors II, V, VII, VIII, IX, X, XI and XII), plasminogen, and protease inhibitors (antithrombin III, protein C, protein S; plasmin, C1 esterase and alpha 1‐proteniase inhibitors). The level of factor XIII in ODP was slightly lower, about 70% of FFP by both activity and antigen assays. ODP was identical to FFP in the levels of albumin, immunoglobulins (IgA, IgG and IgM), lipoproteins, calcium, citrate, and coagulation proteins evaluated by antigen assays except for factor XIII. The levels of the markers for coagulation (thrombin‐antithrombin, prothrombin fragments I+II and D‐dimer) and complement (C3a and C5a) activation in ODP remained similar to FFP. ODP was equivalent to FFP when assessed by aPTT, PT and thrombelastography.
Spray‐drying fragmented a substantial number of high molecular weight von Willebrand factor (vWF) multimers into smaller ones, leading to a net increase of vWF multimers in ODP. The size re‐distribution reduced the vWF ristocetin cofactor activity (vWF:RCo) to 62% in ODP relative to FFP, but had no impact on vWF antigen and factor VIII function (stabilized by vWF). vWF‐specific studies have shown that ODP retains hemostatic function in supporting platelet adhesion and aggregation (see abstracts by Meledeo etal/US Army Institute of Surgical Research and Bercovitz etal/Blood Center of Wisconsin).
Conclusion: ODP can be manufactured at a blood center with a quality comparable to that of FFP. Future studies will determine if the product is bioequivalent to FFP and comparable in safety and efficacy.
CP64
Single‐Donor Platelet Concentrates from Whole Blood Donations with Collection Drawing Times between 12 and 15 Minutes
Ido J Bontekoe, Stéphanie Groot, Davina Sijbrands, Pieter F van der Meer, Johan W Lagerberg and Dirk de Korte*
Department of Product and Process Development, Sanquin Blood Bank
Background/Case Studies: The collection time of whole blood is, according to European Guidelines, limited to 15 minutes. In addition, donations with collection times between 12 and 15 minutes should not be used for preparation of platelet (PLT) concentrates (PC) because of the chance of too much activation of PLT. It seems justified to re‐evaluate the quality of PLT from these donations because new generations collection systems and mixers were introduced, including a more efficient needle. The aim of this study was to investigate the in vitro quality of PC prepared from 12‐15 minutes buffy coats (BC) with the aim to prevent unnecessary discarding of BC and to simplify the total blood bank process.
Study Design/Method: Single‐donor PC (sPC, n=6) were prepared from one 12‐15 minutes BC and 60mL of autologous plasma in a 600mL PVC‐DEHP container. As a reference, sPC from donations with collection times of <12 minutes were prepared (n=5). In addition, PC were prepared from 5 BC, of which at least 4 BC were from 12‐15 minutes donations (n=5). After pooling of the BC, 300mL of PAS‐E was added and a standard pooling set with a PVC‐BTHC storage container was used for storage of PC. All PC were stored for 8 days at 22 ± 2°C and sampled at regular intervals for determination of the in vitro quality. Aggregation tests were performed with Chronolog (ADP or collagen) and Multiplate (arachidonic acid) aggregometers. Thromboelastography (TEG), using kaolin as an activator, was applied for assessment of the overall clotting capacity. Values are expressed as mean±SD. A non‐paired t‐test or a Mann‐Whitney U test was applied for statistical analyses of normal or non‐normal distributed data respectively.
Results/Finding: Volume (67 ± 5 vs. 66 ± 16mL) and platelet content (74 ± 11 vs. 71 ± 15 x109) were similar in both groups. At the end of storage, both groups showed comparable in vitro quality (Day 8, pH(37°C): 6.84 ± 0.16 vs 6.83 ± 0.17, other data not shown). No differences in aggregation response after stimulation with arachidonic acid, ADP or collagen were measured. TEG parameters in both groups were also comparable. The five‐donor PC fulfilled all requirements of European Guidelines, aside from occurrence of small aggregates at Day 6 and/or 8in 2/5 PC (possibly because sometimes AB0 incompatibility was accepted). On Day 8, PLT showed low CD62P expression (17.1 ± 1.8%) and phosphatidylserine exposure (Annexin V binding, 8.9 ± 1.9%). Hypotonic shock response of platelets was comparable with historical data.
Conclusion: Single‐PC in plasma as well as five‐donor PC in PAS‐E, prepared from 12‐15 minutes whole blood donations had a normal composition and showed good in vitro quality during 8 day storage. To substantiate that the exclusion of 12‐15 minutes donations for PC preparation could be stopped, further studies will be performed.
CP65
The Effects of a Pneumatic Tube System on Red Blood Cell Units
Amy Mata*1, Jessie Miller1, Ranee Marie Wannarka‐Farlinger1, Sandra Bryant1, Scott A Hammel1, Sherry Stern1 and Camille van Buskirk2
1Mayo Clinic, 2Mayo Clinic Rochester
Background/Case Studies: The use of Pneumatic Tube Systems (PTS) has become commonplace in many healthcare facilities throughout the world. The purpose of these systems is to transport products and specimens, resulting in reduced turnaround time for laboratory testing and to aid in the timely delivery of patient care. A downfall of PTSs is that they have the potential to play a role in increased hemolysis. While several studies have been published on the effects of PTSs on blood specimens, there are very few that address the effects on blood products, specifically red blood cells (RBC). The objective of this study was twofold: to determine if the PTS that is in use at our facility contributes to an increase in hemolysis of RBC units and to evaluate how the PTS system affects red cell microparticle (RMP) levels.
Study Design/Method: Forty‐one units of AS‐3 RBCs, 20 irradiated and 21 non‐irradiated, were selected for the study. The units varied in age, ranging from 2 to 42 days old. Specimens were obtained from each unit both prior to and after being transported through the PTS, which runs underground and spans the length of a mile and a half. Specimens were spun down and the plasma supernatant was removed. All specimens were evaluated for plasma hemoglobin (hgb), potassium (K), hemolysis index (HI), and RMPs. The Wilcoxon signed‐rank test and p value were used to compare the pre and post values. Additional statistical analysis was performed to compare the values after adjusting for age and irradiation.
Results/Finding: After sending the RBC units through the PTS, hgb, HI, and RMPs were statistically (p< 0.05) higher than before. When adjusted for irradiation, the same analytes remained statistically higher, however when adjusted for age, the p‐value was only significant for hgb and HI. The K values did not significantly change. RMPs significantly increased, but only if the units were irradiated (p=0.02). (Table)
Conclusion: The use of a PTS provides an effective means to transport blood products; however, it can contribute to biological changes within RBC units. It is uncertain at this time how those changes can affect the outcome of patients who receive these products. Each PTS system is different in its specifications and should be validated prior to being used to transport blood products.

CP66
Validation of Factor VIII Levels of Thawed Fresh Frozen Plasma after 5 Days of Storage
Pei Lun Karen Lim*1, Erma Sofia Sumardi1, Isamar Eduardo Ancheta1, Susan Lim2, Christina Yip1, Lip Kun Tan2 and Shir Ying Lee3
1National University Hospital Singapore, 2National University Hospital, 3National University Hospital, Singapore
Background/Case Studies: Plasma transfusion is indicated in patients with coagulation factor deficiencies and active bleeding, or who are about to undergo an invasive procedure. Fresh Frozen Plasma (FFP) has to be placed in the freezer within 8 hours of processing and stored at ‐18°C or colder in order to preserve its coagulation factors. Thawed FFP has an expiration period of 24 hours hence to reduce wastage, this study aims to investigate Factor VIII (FVIII) activity in thawed plasma stored for 5 days and kept at 1 to 6°C. FVIII was chosen as it is an important coagulation factor in correcting coagulopathies. Arbitrary FVIII level acceptance limit was set as not less than 50 IU/dL.
Study Design/Method: Randomly selected units of FFP (n=10) were measured for FVIII concentration based on clotting assay (STA®‐DEFICIENT VIII Diagnostica Stago). FVIII levels were measured at five time points: pre‐freezing, 0, 24, 72 and 120 hours post‐thawing. FFP were thawed using Helmer Plasma Thawer (Helmer Scientific) at 30 to 37°C for 35 minutes. An aliquot of thawed FFP from each unit was removed and measured for FVIII before refrigeration (0 hours post‐thaw). Thawed plasma (TP) units were kept in a refrigerator at 1 to 6°C for 5 days for subsequent testing.
Results/Finding: Results obtained were listed in Table 1. Units 7 to 9 were not tested for FVIII at post thaw‐24 hour due to operational issues. The overall FVIII concentration decreased at an average of 13% from pre‐freezing to post thaw 0 hour. After further storage of TP post thaw‐24 hour and ‐72 hour, residual FVIII level remain to be above 50 IU/dL except unit 10 which had a lower initial FVIII concentration. At post thaw‐120 hour, 7 out of 10 units tested had residual FVIII activity within the pre‐set standard of 50 IU/dL. The average decline from 0‐hour post‐thaw to 24‐hour, 72‐hour and 120‐hour post‐thaw was 36.5%, 42.7% and 47.9% respectively. There was no observed trend of any blood group having higher or lower pre‐freezing FVIII and this is likely due to small sample size.
Conclusion: Decrease of coagulation factor such as FVIII in FFP is expected due to its diminishing stability. Nevertheless, our data showed that majority of the TP retained at least 50 IU/dL of FVIII. Typically patients with factor levels below 30 IU/dL may start to show abnormal coagulation profile. While TP is not used for specific factor replacement therapy, it may be indicated for patients with general coagulopathies and active bleeding. Further study extending to measurement of other labile factor such as FV may add value to the validation study.
TABLE 1. FVIII analysis on thawed FFP stored at 1‐6°C
| FFP | FVIII level (IU/dL) | |||||
|---|---|---|---|---|---|---|
| FFP No. | Blood Group | Post‐Thaw (hours) | ||||
| Pre‐freezing | 0 | 24 | 72 | 120 | ||
| 1 | AB Pos | 119 | 99 | 57 | 56 | 48 |
| 2 | A Pos | 110 | 91 | 56 | 55 | 46 |
| 3 | A Pos | 131 | 123 | 68 | 67 | 59 |
| 4 | B Pos | 140 | 118 | 75 | 70 | 60 |
| 5 | B Pos | 141 | 120 | 87 | 80 | 70 |
| 6 | B Pos | 143 | 138 | 76 | 68 | 66 |
| 7 | B Pos | 103 | 87 | ‐ | 50 | 50 |
| 8 | O Pos | 120 | 102 | ‐ | 58 | 57 |
| 9 | O Pos | 105 | 94 | ‐ | 53 | 50 |
| 10 | O Pos | 86 | 73 | 46 | 42 | 38 |
| SD | 19.0 | 19.8 | 14.2 | 11.2 | 9.8 | |
| Ave. | 119.8 | 104.5 | 66.4 | 59.9 | 54.4 | |
Symbol:
‐ FVIII not assayed
CP67
Validation of the Pathogen Reduction Method Using Amotosalen/UVA: Comparing Pathogen‐Reduced Pooled PRP‐Platelets and Conventional Single PRP Platelets for Quality and Bacterial Inactivation Efficacy
Lubna Ahmed Almenawi1, Ayman Mohamad Sabri1, Ali Abdullah Alajeafi1, Ashwaq Hasan Alhekri1, Saleem Bin Mahfouz1, Ali Hasan Alkhodari1, Rawya Saeed Shealy1, Marcus Picard‐Maureau*2 and Hussain Bana Almalki1
1King Abdulaziz Hospital and Oncology Center, 2Cerus Europe BV
Background/Case Studies: The growing number of transfusion‐transmitted infectious (TTI) risks, including emerging and endemic pathogens, is a constant challenge for blood centers in Saudi Arabia. While for a limited number of these pathogens TTI risk can be reduced using blood screening assays, alternative solutions are anticipated. Pathogen reduction (PR) technology was identified as a potential solution. Validation of amotosalen/UVA photochemical treatment in our blood center was performed by comparing the platelet component (PC) quality of the standard “control” single‐donor PRP‐concentrate in 100% plasma over a 5 day storage period and the new “test” pathogen‐reduced, pooled (pools of 5) PRP PC in 100% plasma over a 7 day storage period. The efficacy of the bacterial inactivation was also assessed in our setting.
Study Design/Method: The quality parameters of 4 leucoreduced test PCs were assessed at day 7 of storage and compared to leucoreduced control PC at day 5 of storage. The test PCs were pathogen‐reduced with the INTERCEPT Blood System (Cerus Corporation, Concord, U.S.A.) at day 0; the process was completed by day 1 post‐collection. Samples were taken daily for quality analysis from test and control PC until day 5 and day 7, respectively. For bacterial spiking, additional PC were spiked with each receiving 4mL of 1 McFarland (∼ 1.2x10⁹ CFU) S. aureus, S. epidermidis, E. coli, P. aeruginosa or S. viridans, respectively, to challenge PR efficacy.
Results/Finding: The average platelet loss in the test PC post PR treatment was 4.7% ± 2.0, the total average platelet loss at day 7 was 11.2% ±2.8. The average platelet loss in the control units at day 5 was 9.5% ±1.4. The average pH of the test units at day 7 was 6.64 ±0.04 and in the same range as the control PC, pH = 6.89 ±0.09. Glucose concentration in test PC at day 7 (13.8 ±3.0 mmol/L) was lower than in the day 5 control units (18.32 ±1.06 mmol/L). Lactate levels increased during the course of storage; lactate levels at days 5 and 7 were outside the range of the assay (>15 mmol/L). Cultures inoculated with pathogen reduced, bacterially spiked units were negative after 7 days of incubation, in contrast to those inoculated with non‐pathogen reduced samples from the control units, which were positive for bacterial growth.
Conclusion: The quality parameters of the pathogen reduced test PC were within specifications and comparable to the conventional control PC. The high efficacy of bacterial inactivation together with comparable quality parameter values suggests the use of amotosalen/UVA pathogen reduction is safe and efficient to enhance PC transfusion safety.
CP68
Variability in Content and Function Depends on the Source of Cryoprecipitate Units
Keaton Charles Stoner*1, Jay Srinivasan2, Jessica Poisson3 and Ian Welsby4
1Duke University, 2Duke University School of Medicine, 3Duke University Hospital, 4Duke University Medical Center
Background/Case Studies: The coagulation cascade relies on a complex interaction between proteins known as clotting factors. Cryoprecipitate (cryo) is a plasma‐derived blood product that contains several of the proteins central to the clotting cascade and is typically used as a fibrinogen replacement in bleeding patients. However, cryo contents tend to be variable, and little quantitative evidence exists regarding the exact therapeutic effect of cryo on coagulation. My study aimed to better characterize cryo for consistency across and within sources in terms of its functional effect on in vitroclot formation.
Study Design/Method: The Duke Proteomics Core conducted a semi‐quantitative liquid chromatography‐mass spectrometry/mass spectrometry (1D‐LC‐MS/MS) analysis of both depleted and undepleted samples of cryo and plasma to characterize protein content. To evaluate the functional procoagulant effect of cryo in vitro, I analyzed 18 units of cryo across three different sources of Group A cryoprecipitate (American Red Cross/ARC single and pooled units, Australian Red Cross/AuRC single units), using a novel modification of rotational thromboelastometry (ROTEM) technique. I developed an in vitromodel for a coagulopathic patient using serial dilutions of pooled normal plasma with saline and then added the equivalent of one, two, and three cryoprecipitate doses. A tissue factor‐activated test on the ROTEM® delta hemostasis analyzer (EXTEM) was performed on each condition. For each source, dose‐response curves for clotting time (CT), alpha angle, and maximum clot formation (MCF) were generated using linear regression models. Inter‐source unit variability was determined by ANOVA and Tukey's HSD post‐hoc analysis (RStudio Inc.).
Results/Finding: LC‐MS/MS identified 256 proteins in cryo; of the 10 most abundant, only fibrinogen was relevant to coagulation. Notably, the American Red Cross (ARC) single donor source had the steepest slope for MCF (4.44mm/dose), indicating a greater per dose potency than the other sources. The ARC single donor source had the highest mean MCF across all dosing levels, but also the highest standard deviations and response variability. The ARC single donor source was significantly more potent than the Australian source.
Conclusion: Paired with our estimates regarding the variability of clot formation responses to cryo, the quantitative dose‐response curves provided in this study for CT, MCF, and alpha angle can provide physicians with more information regarding cryo dosing. Future studies that evaluate the therapeutic effect of cryoprecipitate versus fresh frozen plasma or fibrinogen concentrate would be of clinical importance and give us further insight into the relative utility of and dose requirements for cryo to correct dilutional coagulopathy.
CP69
Viral Inactivation and Enrichment of Factor VIII, Factor XIII, Fibrinogen and Von Willebrand Factor (VWF) Multimers from Fresh Frozen Plasma (FFP)Using, “VIPS Plasma, Virus Inactivation Treatment System”.
Bipin Nepal*
Grande International Hospital
Background/Case Studies: The solvent/detergent (SD) process used for plasma can safely inactivate all lipid‐enveloped viruses. The method proved effective in the processing of coagulation factor concentrates by disrupting the membranes of lipid‐enveloped viruses, cells and most protozoa, while leaving the labile coagulation factors intact. This study is done to assess viral inactivation and, Factor VIII, Factor XIII, Fibrinogen and von Willebrand factor (VWF) multimers enrichment capacity of, “VIPS Plasma, Virus Inactivation Treatment System”.
Study Design/Method: “VIPS Plasma, Virus Inactivation Treatment System” comprise of interconnected bag system where the S/D reagents are removed by filtration and the final products subjected to bacterial (0·2 μm) filtration. Cryoprecipitate mini‐pools (400 ± 20mL) were subjected to double‐stage S/D viral inactivation, followed by one oil extraction and a filtration on a S/D and phthalate [di(2‐ethylhexyl) phthalate (DEHP)] adsorption device and a 0·2 μm filter. The initial and the final products were compared for visual appearance, blood cell count, factor VIII, Factor XIII, Fibrinogen and Von Willebrand factor (VWF) multimers. Initial and final products were also checked for HIV, HBV, HCV, dengue, malaria and bacterial contaminations.
Results/Finding: Our analysis showed that the treated cryoprecipitate were very clear, with negative blood count and the protein content of factor VIII, Factor XIII, Fibrinogen and von Willebrand factor (VWF) multimers were well conserved (Table 1). Kit ensured bacterial sterility (Table 3) and most importantly, final product was free of HBV, HCV and HIV (Table 2).
Conclusion: It's the first time, “VIPS Plasma, Virus Inactivation Treatment System”, is used in South Asia for product enrichment and viral inactivation. Results showed effective product enrichment and viral inactivation in our conditions. But further investigation is needed to characterize functional activity of the enrich component. Irrespective of that the process may offer one additional option to blood establishments for the production of virally inactivated plasma components especially in low income countries.
CP70
Whole Blood Derived Single‐Donor Platelet Concentrates from Donors Using Non‐Steroidal Anti‐Inflammatory Drugs
Ido J Bontekoe, Stéphanie Groot, Davina Sijbrands, Pieter F van der Meer, Johan W Lagerberg and Dirk de Korte*
Department of Product and Process Development, Sanquin Blood Bank
Background/Case Studies: Buffy coats (BC) from donors who used pain medication like aspirin and ibuprofen up to 4 days prior to the donation are discarded, because a known side effect of these non‐steroidal anti‐inflammatory drugs (NSAIDs) is inhibition of platelet (PLT) aggregation. These NSAIDs inhibit the enzyme cyclooxygenase‐1, thereby blocking synthesis of thromboxane A2 from arachidonic acid. However, the quality of platelet concentrates (PC), prepared from this BC is not known. The aim of the study was to investigate the in vitro quality of PC prepared from NSAID‐BC and autologous plasma during storage.
Study Design/Method: Single‐donor PC (sPC, n=18) were prepared from a NSAID‐BC and 60mL of autologous plasma. Information about the type of pain medication was extracted from the anamneses form. The sPC were stored for 8 days at 22 ± 2°C and sampled at regular intervals. Aggregation tests were performed with Chronolog (ADP or collagen) and Multiplate (arachidonic acid) aggregometers. Thromboelastography (TEG, kaolin) was applied for assessment of the overall clotting capacity. sPC in plasma from normal controls (n=5) were investigated as a reference. Values are expressed as mean±SD or as median & IQR. A non‐paired t‐test or a Mann‐Whitney U test was applied for statistical analyses of normal or non‐normal distributed data respectively.
Results/Finding: Volume (69 ± 4 vs. 66 ± 16mL) and PLT content (67 ± 14 vs. 71 ± 15x109) were similar in both groups. On Day 8, both groups showed comparable pH and changes in PLT content (data not shown). Phosphatidylserine exposure on Day 8 was significant higher in a subset of donors who had used ibuprofen (n=5). Aggregation tests with arachidonic acid revealed in general a low or absent response for sPC with aspirin (0,0‐30, p<0.05), diclofenac (31,1‐76) and naproxen (0,0‐24, p<0.05), compared to normal controls (76,64‐85). No differences were detected in aggregation with ADP or collagen. With TEG, slightly longer R‐times (initiation phase) were measured on Day 1 in sPC with aspirin, diclofenac and naproxen, compared to the normal controls (only significant for naproxen). These differences disappeared during storage.
Conclusion: Storage properties of sPC prepared from NSAID‐BC were comparable with sPC from normal controls.
Main differences were observed in aggregation and coagulation properties for donors who used aspirin, diclofenac or naproxen. PLT from donors who used ibuprofen showed little or no deviations. This is most likely caused by the fast (<24 hour) disappearance of ibuprofen from the blood circulation and the reversible binding to PLT. The use of BC from donors who used ibuprofen will be further investigated in a ‘worst case’ (PC in plasma) and ‘best case’ (PC in additive solution) scenario. The effects of ibuprofen on aggregation and coagulation properties will be further investigated in a dose‐response study design adding different levels of ibuprofen to PLT.
CP71
Whole Blood Derived Single‐Donor Platelet Concentrates from Donors with Type 2 Diabetes
Ido J Bontekoe1, Stéphanie Groot1, Davina Sijbrands1, Pieter F van der Meer1, Katja van den Hurk2, Johan W Lagerberg1, Arthur J Verhoeven3 and Dirk de Korte*1
1Department of Product and Process Development, Sanquin Blood Bank, 2Department of Donor studies, Sanquin Research, 3Tytgat Institute, Academic Medical Center
Background/Case Studies: Previously it was shown that donors could be classified as having platelets (PLT) with good, average or poor storage properties [Bontekoe, Transfusion, 2014]. A main difference between ‘good’ and ‘poor’ storage properties involved metabolic activity, resulting in a faster decline of pH during storage of ‘poor’ PLT concentrates (PC). This might be caused by a different functionality of the PLT mitochondria and there are indications that donors with a history of ‘poor’ PCs are more likely to have health issues, pointing towards Metabolic Syndrome and Type 2 diabetes (T2D).
Because of the strong rise of people with T2D in the Dutch population, the aim of this study was to characterize PLT from whole blood donors diagnosed for T2D, but accepted as donor.
Study Design/Method: Twelve whole blood donors with T2D, not using insulin, were selected and buffy coat (BC) and plasma were, after overnight hold, used for preparation of a single‐donor PC (sPC). An equivalent number of sPC was prepared from age and sex matched control donors, derived from the same collection sessions. sPC were stored for 8 days at 22 ± 2°C and sampled on Day 1, 4 or 5 and 8. The diabetic marker HbA1c was determined in red cells and cholesterol and triglyceride levels in plasma. From both groups 3 ‘good’ (pHday8>6.6) and 3 ‘poor’ (pHday8<6.3) storing sPC were selected and analysed in more detail.
Results/Finding: Donors were of age 57 ± 10 year and primarily men (75%). Donors with T2D had a higher mean BMI (30.3 ± 4.6 vs.25.4 ± 3.4kg/m2) and higher HbA1c than controls. The sPC of both groups had the same volume (70 ± 5 vs 72 ± 2mL) and PLT content (71 ± 9 vs 73 ± 11x109) but on Day 1 glucose concentration was higher in the diabetic group (20.5 ± 1.7 vs 18.9 ± 1.4mM, p<0.05). On Day 8, the average in vitro quality was comparable in both groups (data not shown). When combining the selected ‘good’ and ‘poor’ storing PLT from both groups, a large difference in lactate production was observed (0.14 ± 0.04 vs 0.36 ± 0.03 mmol/day/1011PLT). The ‘poor’ PLT showed a faster decline of the mitochondrial membrane potential (as measured with JC‐1) during storage than ‘good’ PLT. Remarkably, a difference in triglyceride levels was detected on Day 1 (‘poor’:2.2 ± 0.7 vs ‘good’:1.1 ± 0.2, p<0.01).
Conclusion: BC from donors with T2D who did not use insulin and fulfilled all donor criteria, were comparable with BC from age and sex matched controls, and seem suitable for preparation of PC. When selecting the ‘good’ and ‘poor’ storing PLT from the combined groups, the results of our previous study were confirmed, with significant differences in glycolysis rate and functionality of mitochondria. Metabolic Syndrome and T2D are still suspected as health issues involved in ‘poor’ storage of PLT because donors were of high mean age and because of the observed differences in triglyceride levels between ‘good’ and ‘poor’ stored PCs.
CP72
Whole Blood Leukoreduction Failures ‐‐ Following Manufacturer's Instructions May Not be Enough
Karen Klinker*, Nancy M. Dunbar and Zbigniew M. Szczepiorkowski
Dartmouth‐Hitchcock Medical Center
Background/Case Studies: Our hospital based blood donor program uses a blood collection system which leukoreduces the unit at room temperature prior to centrifugation. The manufacturer recommends minimum wait time of 30 minutes prior to filtration. Anecdotally, the vendor states waiting an hour improves the leukoreduction. We experienced leukoreduction failures in January and February of 2017 detected by our routine QC. We initiated an investigation as to the cause of these unexpected failures.
Study Design/Method: For each of the leukoreduction failures, the following factors were analyzed: collection time, length of filtration, length of wait time prior to filtration, platelet count, staff performing the process, the lot number of the collection system bag, and whether or not units collected from the same donor failed leukoreduction in the past. Hemoglobin S determinations were not sought out as no repeat donor failures were noted and our donor population would suggest a minimal number of donors would be found to be hemoglobin S positive.
Results/Finding: A relationship was established between the length of time the product rested or waited prior to filtration and leukoreduction failure. We found that shorter wait times increased the percentage of leukoreduction failures (see table 1). All units that failed had wait times less than one hour. A similar trend was noticed for the previous year. The investigation showed no relationship between length of collection time, or the length of filtration time and leukoreduction failure. Staff performing the filtration was ruled out as possible cause as the failures were spread out among numerous personnel and observation of their technique displayed no sample collection issues. Platelet counts on the donors involved were available and none were outside of the normal range. Various lot numbers of the collection sets were involved, and no donors were repeat failures.

Conclusion: In our small study, we found that following manufacturer's recommendations for the resting or wait time prior to filtration was insufficient to avoid excessive leukoreduction failures. We extended our minimum wait time to 60 minutes based on our data. We have not experienced any leukoreduction failures after this change.
Donor and Therapeutic Apheresis
CP73
Absolute Immature Platelet Count in Diagnostic Algorithm and Management of Pediatric Thrombotic Microangiopathy
Hamza N Gokozan*1,2, Katharine A Downes1,2, Hollie M Reeves1,2 and Robert W Maitta1,2
1Case Western Reserve University School of Medicine, 2University Hospitals Cleveland Medical Center
Background/Case Studies: Prior studies highlighted the utility of absolute immature platelet count (A‐IPC) and A‐IPC ratio once therapeutic plasma exchange (TPE) is initiated to differentiate thrombotic thrombocytopenic purpura (TTP) from other thrombotic microangiopathies. This can be helpful to determine those who may benefit from prompt initiation of TPE when tests such as ADAMTS13 are not readily available. We report a young pediatric patient presenting with diarrhea in the setting of laboratory results suggestive of a microangiopathic thrombocytopenia suspicious for TTP in which A‐IPC measurement was clinically useful.
Study Design/Methods: Previously healthy 12 month old unvaccinated girl presented with history of diarrhea for 5 days which was bloody at onset, accompanied by fever and dehydration. Laboratory results showed: white blood cell count: 32 x 109/L, platelets: 62 x 109/L, BUN: 77mg/dL, creatinine: 2.4mg/dL, lactate dehydrogenase 1940 U/L. Hospital course was complicated by tonic‐clonic seizure episodes that stopped with anti‐convulsants and acute kidney injury requiring hemodialysis. Peripheral blood smear revealed schistocytes. On third day of hospitalization, platelet count decreased to 44 x 109/L, ADAMTS13 sample was sent out and TPE was initiated for clinical suspicion of TTP versus hemolytic uremic syndrome, atypical versus Shiga‐toxin mediated. Immature platelet fraction (%‐IPF) and calculated A‐IPC (%‐IPF x platelet count) were obtained with daily pre‐TPE CBC. A‐IPC ratio was calculated from baseline.
Results/Findings: Platelet count began to increase prior to TPE initiation (74 x 109/L and A‐IPC of 4.7 x 10⁹/L). Two consecutive TPE were completed which resulted in a platelet count decrease to 54 x 109/L and A‐IPC of 5.1 x 10⁹/L. A‐IPC ratio was 1.1 below the ratio of 3 which has been reported for TTP patients. Similarly A‐IPC count was not below 5 x 10⁹/L threshold reported in setting of TTP with severe ADAMTS13 deficiency. At this time stool culture obtained prior to start of TPE came back positive for E. coli O157:H7 toxin. Testing of C3, C4, Factor H, Factor H autoantibody, Factor I and Factor B were normal. ADAMTS13 activity was 93%. Patient was treated for the infection and platelet count improved within 10 days to 315 x 109/L, with resolution of her renal failure: BUN: 42mg/dL, creatinine: 0.65mg/dL. No additional seizures were observed during follow‐up.
Conclusion: Measurement of A‐IPC can be used to aid clinical decisions in pediatric patients suspected of TTP especially when ADAMTS13 testing and those for other etiologies are still pending. TPE did not seem to have a significant effect in A‐IPC but decreased platelet counts in this patient. A‐IPC is rapid to obtain and can provide helpful information in the setting of potentially overlapping etiologies in the setting of other testing with longer turnaround time.
CP74
Absolute Immature Platelet Counts Differ in Thrombotic Thrombocytopenic Purpura Patients at Initial Presentation Compared to Relapse Episodes
Meng‐Lei Zhu*1,2, Hollie M Reeves1,2 and Robert W Maitta1,2
1Case Western Reserve University School of Medicine, 2University Hospitals Cleveland Medical Center
Background/Case Studies: Thrombotic thrombocytopenic purpura (TTP) is a thrombotic microangiopathy characterized by low ADAMTS13 activity. Many patients with severe autoantibody‐mediated ADAMTS13 deficiency at initial disease presentation may suffer from one or more recurrent episodes over the following months or years. It is unclear if disease course and characteristics of recurrent/relapsed TTP may be different from that seen at initial presentation. Since absolute immature platelet counts (A‐IPC) have been shown to be useful in the diagnosis and to follow response to therapy of TTP patients, we proceeded to evaluate if A‐IPC pattern was different in relapsed verse initial presentation.
Study Design/Methods: Our study cohort consisted of three patients (two female and one male) with acquired TTP (ADAMTS13 activity <5%) who underwent daily therapeutic plasma exchange (TPE). Clinical course and laboratory values were reviewed. Platelet count (PLT), immature platelet fraction (%‐IPF) and A‐IPC (%‐IPF x platelet count) were analyzed during treatment course. A‐IPC values at presentation and peak, A‐IPC peak time (days), and PLT count recovery time (days) were compared between initial onset and relapse episode for each patient. A‐IPC percent change in relapse episodes compared to initial presentation was calculated.
Results/Findings: All patients had an increased %‐IPF, and decreased A‐IPC and PLT count at presentation in both initial and recurrent episodes. Once TPE treatment was initiated, A‐IPC rapidly increased and reached a peak value 2‐3 days prior to PLT count recovery, consistent with that previously described in TTP patients. However, compared to first onset, recurrent episodes featured lower A‐IPC at presentation (results shown as percent decrease, column 1), increased peak A‐IPC value (results shown as percent increase, column 2), delayed A‐IPC peak, and delayed PLT recovery (Table 1). Moreover, recurrent episodes required more procedures compared to initial presentation (Table 1).
Conclusion: Recurrent/relapsed TTP demonstrate lower A‐IPC at presentation and a delayed and increased A‐IPC peak value in response to TPE compared to initial presentation. A longer treatment course was observed in recurrent patients. Future studies of more relapsed TTP patients are needed.
TABLE 1. A‐IPC pattern in initial verse relapse TTP
| Percent A‐IPC value changes | Percent Peak A‐IPC value changes | Peak A‐IPC time (Day) | PLT recovery time (Day) | # of procedures | ||||
|---|---|---|---|---|---|---|---|---|
| (relapse/initial) | (relapse/initial) | initial | relapse | initial | relapse | initial | relapse | |
| Patient #1 | ‐36.6% | 156.5% | 2 | 4 | 2 | 5 | 10 | 35 |
| Patient #2 | ‐41.4% | 181.9% | 2 | 5 | 2 | 3 | 3 | 14 |
| Patient #3 | ‐86.3% | 211.0% | 2 | 5 | 5 | 5 | 7 | 14 |
Mean +/‐ SE ‐54.7+/‐12.9% * 183.1%+/‐12.8%*
p<0.05
CP75
Donors Undergoing Frequent Plateletpheresis and Its Effect on the Hematological Parameters
Sweta Nayak*, Poonam Coshic and R.M Pandey
All India Institute of Medical Sciences
Background/Case Studies: Frequent plateletpheresis donors are assets for the blood banks. The well‐being of these donors has been a matter of concern. In our study we intend to analyze the effect of plateletpheresis on the hematological parameters of these donors assessed prior to each subsequent procedure. We also try to compare the effect 3 cell separators used for plateletpheresis on the post donation hematological parameters.
Study Design/Method: The study was conducted during February 2016 to March 2017 on all the repeat plateletpheresis donors coming to the Department of Transfusion Medicine for the 2nd time within a month of the first plateletpheresis. The values of the hematological parameters including red cell and platelet indices tested prior to each plateletpheresis were entered into the excel sheet and gap between each donations were calculated. The plateletpheresis were done either on Hemonetics MCS+ separator (Hemonetics Corporation, Braintree, Massachusetts, USA), Fresinius separator (COM.TEC), DN (Fresinius HemoCare GmbH, Bad Homburg v.d.H, Germany) and Gambro Trima Accel, software version 5.0 after taking consent from the donors. The target collection of each procedure was a dose of 3 x 10¹¹ platelets in 200‐250ml of plasma. To compare the effect of the cell separators on the hematological parameters due to the plateletpheresis, parameters at 2 consecutive donations within 7 days were considered. Data was analyzed by Stata 14. Within change in the continuous variables were assessed by paired t‐ test and between two groups comparison was done by independent t‐test or Wilcoxon Rank Sum test. The comparison among the cell separators was done by Kruskal‐Wallis test or one way ANOVA.
Results/Finding: Of the 98 donors, 35 repeated the plateletpheresis within a week (group I) and 63 underwent 2nd plateletpheresis within 8‐30 days (group II). No significant alteration was found in the red cell or the platelet indices within either group but a significant difference in the variation of platelet counts of the 2 groups (p=0.025). Though above the eligibility cut‐off of 1.5 lakhs/µl, platelet counts were lower than baseline in group I donors whereas it was higher at 2nd plateletpheresis in group II donors. There were 49 donors who presented to us for the 3rd time for plateletpheresis with a mean gap between 1st and 3rd plateletpheresis being 46 days. No significant difference in the parameters assessed prior to any of the plateletpheresis was found except the platelet distribution width (p=0.000). Plateletpheresis through all the 3 cell separators had similar effects on the hematological parameters.
Conclusion: There was no significant change in the hematological parameters in the plateletpheresis donors who underwent frequent plateletpheresis. Post donation follow‐up hematological parameters were not affected by the cell separators used for plateletpheresis.
CP76
Efficacy of Therapeutic Plasma Exchange on Angiotensin II Type 1 Receptor Antibodies in Two Kidney Transplant Recipients
Chisa Yamada*, Silas P. Norman, Milagros Samaniego and Laura Cooling
University of Michigan
Background/Case Studies: Some kidney transplant recipients develop antibody mediated rejection (AMR) without detected HLA donor specific antibodies (DSAs) in sera. In recent years, angiotensin II type‐1 receptor antibody (AT1RAb) has been reported to cause AMR, especially refractory AMR, possibly by contraction of renal arteries. At our institution, therapeutic plasma exchange (TPE) followed by IVIG every other day has been applied to reduce AT1RAbs in kidney transplant recipients, and we here report efficacy of TPE treatments in two cases.
Study Design/Methods: Two kidney transplant recipients who received TPE treatment followed by IVIG to decreased AT1R Ab are reviewed.
Results/Findings: Case 1: The patient is a currently 43‐year‐old female with focal segmental glomerulosclerosis who received her first kidney transplant from a living related donor at age 22, and a second deceased donor transplant due to a rejection of the transplanted kidney at age 38. Three years post‐transplant, her creatinine (Cr) started to rise from 0.7 to 1.35mg/dl and a biopsy showed Banff criteria grade 2 AMR, grade 2A T‐cell mediated rejection (TCMR) and grade 3 interstitial fibrosis and tubular atrophy. HLA DSA had been negative in serum, but high level AT1RAb was identified at >40 U/ml (high: >17 U/ml, intermediate: 12‐17 U/ml, negative: <12 U/ml). She received 6 TPE treatments every other day and started losartan. After a course of TPE, AT1RAb decreased to 32 U/ml and histology showed improvement of AMR and TCMR, however, Cr kept increasing slowly to 1.9ml/dl. In one month, her AT1RAb increased again to >40 U/ml, therefore, she received 3 more TPE treatments with a decrease in her AT1RAb to 16 U/ml. Although AT1RAb level increased slightly to 20 U/ml after 3 months, her Cr has been stable at 1.3‐1.6ml/dl. Case 2: The patient is a 25‐year‐old female with malignant hypertension who received a deceased donor kidney transplant at age 24. Her Cr started to rise 2 weeks post‐transplant from 1.4 to 2.68mg/dl without detectable HLA DSA. Although biopsy showed no AMR or TCMR, there was focally severe arteriopathy. She was found to have high AT1RAb level at 18 U/ml. She received 6 TPE procedures every other day and AT1RAb decreased to 8 U/ml with a decrease of Cr to 1.98mg/dl and improved arteriopathy in histology. Because her AT1RAb level slightly increased to 12 U/ml over the next 2 weeks, she started weekly TPE treatment. After 5 weekly TPE, TPE treatment was stopped because her AT1RAb level remained relatively unchanged. Her Cr has been stable at around 1.5ml/dl to date.
Conclusion: We present 2 kidney transplant recipients who received TPE treatments for high AT1RAb levels. A course of TPE procedures followed by IVIG every other day was effective to decrease AT1RAb levels; however, weekly TPE had no effect on reducing AT1RAbs. TPE treatment may be also beneficial to improve histological AMR and clinical kidney function.
CP77
Experience in Management of Thyroid Storm By Plasmapheresis
Tatiana Belousova*, Vanya Jaitly, Brian Castillo, Hlaing Tint, Kimberly Klein and Yu Bai
University of Texas Health sciences center at Houston
Background/Case Studies: Thyroid storm (TS) is an extreme manifestation of thyrotoxicosis that is a serious complication occurring primarily in patients with Graves’ disease. Clinically they may present with a wide range of hypermetabolic symptoms which may be fatal if not managed appropriately. We report two cases where TS with severe cardiac complications was managed by plasmapheresis (PLEX) with excellent effect.
Study Design/Method: A 36 year old man (Patient A) with a medical history of hyperthyroidism present with TS complicated with cardiogenic shock [Ejection Fraction (EF) < 10%], renal and hepatic dysfunction as well as coagulopathy. Patient was persistent tachycardic while being intubated, sedated and requiring Tandem heart support.
A 33 year old man (Patient B) with a medical history of hypothyroidism (on Synthroid for 2 years), end stage renal disease and non‐ischemic cardiomyopathy (EF of 20‐25%) presented for evaluation of dual kidney‐heart transplant. He subsequently developed TS with multiorgan failure. Standard steroid medication treatment showed little response.
| Lab Values (normal range) | Patient A | Patient B | ||||
|---|---|---|---|---|---|---|
| Before PLEX | After PLEX, next day | After PLEX, 3‐7 days | Before PLEX | After PLEX, next day | After PLEX, 3‐7 days | |
| ALT | 1418 | 458 | 1375 | 598 | 138 | |
| AST | 1414 | 268 | 6144 | 946 | 53 | |
| Bilirubin total | 7.7 | 6.9 | 2.2 | 2.8 | 1.7 | |
| Lactic Acid | 2.5 | 1.0 | 16.4 | 2.6 | ||
| TSH (0.36‐3.74) | 0.057 | 0.010 | < 0.005 | 0.051 | 1.150 | |
| T4 free (0.76‐1.46) | 0.72 | 4.68 | 2.14 | 0.8 | ||
| T4 (4.7‐13.3) | 14.4 | 8.3 | 14.1 | 7.2 | ||
| T3 total (0.60‐1.81) | 2.13 | 0.66 | 1.07 | 0.63 | ||
| T3 uptake (31‐39) | 40 | 44 | 44 | 40 | ||
| TSI (<140) | 403 | 352 | 262 | 283 | ||
| TPO Ab (<60) | >1300 | >1300 | >1300 | 951 | ||
Results/Finding: Both patients underwent urgent PLEX along with standard medication administration as soon as the clinical suspicion of thyroid storm was raised. A 1‐1.5 plasma volume, iso‐volumic procedure using fresh frozen plasma as replacement was performed in the intensive care unit where the procedure associated hemodynamic impact could be easily managed. Both patients showed significant clinical improvement within 12 hours of the procedure completion. Their total T4, T3 and free T4 levels trended to normal or near normal range within 24 hours (Table). In addition, the PLEX effect on hormone and the associated antibody removal seemed remained and no “rebound” phenomenon was observed in both cases, making repeated PLEX unnecessary. Both patients had total thyroidectomy 3‐4 weeks after the event with great clinical outcome.
Conclusion: Our cases demonstrate that PLEX is a safe, effective treatment option in managing TS patient with severe cardiac dysfunction. The procedure can not only lead rapid decrease in thyroid hormone and its associated antibody levels, but also lessen the severity of tissue injury by moderating the inflammatory process and correcting complications.
CP78
Extracorporeal Photopheresis in Sézary Syndrome Treatment: Hospital‐Based Blood Bank Experience
Sandra Ortega Sánchez*1, Laura Martínez Molina2, Cristina Muniesa Montserrat2, Octavio Servitje Bedate2, Silvia Cosano Navarro1 and Maria Isabel González Medina1
1Banc de Sang i Teixits, 2Dermatology service. Hospital Universitario de Bellvitge
Background/Case Studies: Extracorporeal photopheresis (ECP) is an immunomodulatory therapy widely used since 30 years in cutaneous T cell lymphoma, several autoimmune diseases and organ transplant rejection, and in the last 20 years, also used in graft versus host disease treatment.
The use of ECP in cutaneous T cell lymphoma (CTCL), mycosis fungoides (MF) and Sézary Syndrome (SS) in their erytrodermic form are recently categorized by the American Society for A pheresis (ASFA) 2016, as first line treatment alone or in combination with other therapies, with a strong recommendation: grade IB, category 1.
Since MF and SS are incurable diseases current therapies are focus in controlling skin symptoms and minimizing immunosuppression.
The objective of this observational study is to assess outcomes of 10 patients diagnosed with SS and compare them in their first evaluation once the 20th procedure is been performed.
Study Design/Method: ECP is a leukapheresis‐based therapy, ex vivo exposition to a photosensitizer drug ( 8‐methoxypsoralen, 8‐MOP) and UVA light, and subsequent reinfusion of the treated cells which are now induced to apoptosis.
Volume treated varies from 1.5 to 2 total body volume (TBV) and the schedule for SS disease is one cycle (two daily ECP procedures) twice per month. The venous access was peripheral in all cases except in 2 where central catheter was needed.
The procedures were performed with OPTIA or Amicus devices for the aphaeresis and external UVA irradiation for off‐line system (in 7/10 patients) and with online system (Therakos) just in 3.
Main parameters for evaluation were cutaneous response rate, number of sézary cells, previous treatments, duration of the response and possible complications during ECP treatment.
Results/Finding: Global response rate is 77’7% (partial remission 66.6% and complete remission 11.1% with maintained response). No severe side effects related with the procedure were found. The patient outcomes analyzed are similar to results in published literature.
Conclusion: Cases treated in our hospital confirm the efficacy of ECP in SS treatment, with a good safety profile. Another great advantage of ECP is the relative lack of immune suppression.
Many questions remain still unanswered about ECP: which schedule is the most suitable one, how we must continue or stop when partial or complete remission is achieved; and the number of leukocytes to be treated, as techniques as mini‐photopheresis are also getting good results. All these questions and more make prospective studies necessary to be performed.
CP79
Failure to Increase Absolute Immature Platelet Counts Excludes Thrombotic Thrombocytopenic Purpura Diagnosis during Treatment of Unexplained Thrombocytopenia
Hamza N Gokozan*1,2, Katharine A Downes1,2 and Robert W Maitta1,2
1Case Western Reserve University School of Medicine, 2University Hospitals Cleveland Medical Center
Background/Case Studies: Thrombotic Thrombocytopenic Purpura (TTP) at times is difficult to differentiate from other thrombotic microangiopathies. TTP requires immediate initiation of therapeutic plasma exchange (TPE) until platelet count normalization is achieved. Other microangiopathies may not be as responsive to TPE so testing modalities that promptly increases level of suspicion for TTP is desirable since ADAMTS13 testing is often performed at reference laboratories. Absolute immature platelet count (A‐IPC) has been shown to aid diagnostically in TTP presentations. We present a pediatric case with clinical suspicion of TTP in which A‐IPC was used to guide therapy.
Study Design/Method: Previously healthy unimmunized 7 year old male presented with diarrhea and vomiting for eleven days. Family history was significant for Immune Thrombocytopenic Purpura (ITP) in a sibling. Initial laboratory results showed severe hemolytic anemia (hemoglobin [Hgb]: 4.3g/dL; lactate dehydrogenase [LDH]: 3835 U/L) requiring transfusions, mild thrombocytopenia (144 x 109/L), acute kidney injury (BUN 175mg/dL, creatinine 2.51mg/dL). By the third hospitalization day Hgb improved to 10g/dL, however with worsening thrombocytopenia (16 x 109/L) that led to clinical concern for TTP. Peripheral smear showed many red cell fragments. Patient was transfused with platelets day prior to first TPE. Immature platelet fraction (%‐IPF) and A‐IPC (%‐IPF x platelet count) were obtained with daily pre‐TPE CBC. A‐IPC ratio was calculated from baseline.
Results/Finding: Four TPE in five days were performed (hospital days 6‐10). Platelet count and A‐IPC improved to 52 x 109/L and 6.6 x 10⁹/L respectively just prior to first TPE. Response to four TPE led to a decrease in both platelet count (30 x 109/L) and A‐IPC 1.98 x 10⁹/L. These dynamics did not resemble those which had been described for TTP patients with ADAMTS13 deficiency. ADAMTS13 obtained prior to TPE initiation was resulted at this time and was 67%. No causative organism or toxin was identified after urine, blood, and stool examination and culture. Based on these results, TPE was discontinued which led to an immediate increase in A‐IPC (2.64 x 10⁹/L) that preceded platelet count increase to 80 x 109/L three days later when patient was discharged. Other laboratory values at this time were LDH of 635 U/L, Hgb: 11.2g/dL in the setting of recovery of renal function.
Conclusion: Timely diagnosis of TTP is essential to start of TPE. A‐IPC dynamics differ in TTP compared to other thrombotic microangiopathies. In our patient A‐IPC failed to improve despite TPE and improved once procedures were discontinued and were followed by increases in platelet counts three days later. When TTP is not the causative etiology, A‐IPC can help adjust therapy and lead to clinical improvement. Further research is needed to characterize immature platelet dynamics in non‐TTP microangiopathies.
CP80
Infection and Its Role in the Clinical Course of Idiopathic Thrombotic Thrombocytopenic Purpura Associated with Severe ADAMTS13 Deficiency
Eiman Hussein*1 and Jun Teruya2
1Department of Clinical Pathology, Cairo University, 2Texas Children's Hospital
Background/Case Studies: TTP is a life threatening disease, defined by microangiopathic hemolytic anemia, thrombocytopenia and severely deficient ADAMTS13. Since the introduction of therapeutic plasma exchange (TPE) as a treatment modality for TTP, its prognosis has improved dramatically. Nonetheless, some patients may develop relapse or refractoriness, with potentially fatal outcomes. Despite the notable progress that has been made with studies that emphasized the pivotal role of ADAMTS13, the epidemiology of TTP remains uncertain. Previous studies have suggested that many factors appear to influence its pathogenesis. Some studies point toward infection as a possible trigger which may contribute to the development and can ultimately influence its clinical course. One of the theories to explain this association is the possible cross reactivity between antibodies targeting infectious pathogens and those directed against ADAMTS13. The aim of this study was to prospectively examine the potential association between infection and the clinical outcome in a cohort of patients with idiopathic TTP.
Study Design/Method: Patients with idiopathic TTP who underwent TPE from January 2008 through March 2017 were studied. Sessions were performed daily until platelets and reticulocytes had been normal, then sessions were gradually tapered. We only included patients with ADAMTS13 activity of less than 10%. Data on infections that occurred at or within a week prior to the development of TTP were analyzed.
Results/Finding: Thirty‐two patients were categorized as idiopathic TTP with severe ADAMTS13 deficiency. Eight patients (25%) were associated with suspected bacterial infection. Four of the 8 patients (50%) showed acute relapse coincident with bacterial infections. Central line associated Staphylococcus aureus infections occurred in three patients and Acinetobacter urinary tract infection was reported in one patient. One patient had symptoms of respiratory infection before the development of TTP, on his initial as well as his relapsing episode. Refractoriness to treatment was demonstrated in 3 patients. It was associated with dental abscess in one patient. The other two were associated with Mycoplasma Pneumonia. TPE sessions were continued in all refractory patients until their death.
Conclusion: In patients with idiopathic TTP refractory to conventional treatment, a serious consideration should be given to non‐idiopathic causes, particularly the presence of a remote source of infection, which can be an additional triggering factor for their initial and / or recurrent episodes.
| Episode triggered by infection |
Etiology Each applies to one patient, unless otherwise noted |
Clinical course |
|---|---|---|
| Initial episode |
1‐Respiratory infection 2‐Mycoplasma Pneumonia |
Complete remission Refractoriness/ Died |
| Acute relapse after initial response to TPE |
1‐Central line associated Staphylococcus aureus (3 patients) 2‐ Acinetobacter urinary infection |
Sustained remission after central line was removed and proper antibiotic was instituted. No further TPE sessions were needed in one patient. Complete remission when started on the proper antibiotic and no further TPE sessions were needed |
| Late relapse after 1 year |
1‐Tooth abscess 2‐Mycoplasma Pneumonia 3‐Respiratory infection |
Rituximab/Refractoriness/ Died Refractoriness/Died Complete remission |
CP81
Leukapheresis in Pediatric Patients
Sandra Satoe Kayano*, Marcos Paulo Colella, Rafaela Guerra Maciel, Ingrid Priscila Ribeiro Paes Ferraz and Rafael Colella
A C Camargo Cancer Center
Background/Case Studies: Therapeutic Leukapheresis (TL) has become an ordinary procedure in low body weight children with cancer, and its use over the time has been replacing exchange transfusion. Leukodepletion preceding chemotherapy helps preventing leukostasis and hiperviscosity, and aims to reduce metabolic and renal complications associated with cell lysis. The objective of this study is to evaluate the efficacy and safety of leukapheresis procedure in pediatric patients with less than 10 kilograms using a single apheresis procedure.
Study Design/Method: In October 2015 and June 2016, two children with possible leukemia were submitted to TL procedure. They were 6 and 9 months old, and weighted 7,0 and 9,1 kilograms. Double‐lumen 8 French central venous catheters were placed, and apheresis were performed using a continuous flow apheresis system. The device was primed with 285ml of ABO, Rh and Kell compatible, leukocyte‐reduced, irradiated, 64% hematocrit packed RBCs, and the anticoagulant used was ACD‐A plus heparin (750mL of ACD‐A and 7,500 units of heparin), at a blood to anticoagulant ratio of 25:1. A complete blood count was determined before and after apheresis. The room was heated to avoid hypothermia, and ionized calcium was measured every 30 minutes to prevent hypocalcemia. During the collection, changes in blood pressure, oxygen saturation and heart rate were observed. Net fluid balance was calculated as the sum of the volume of anticoagulant, cation and nondiverted apheresis prime solutions minus the product volume. When the procedure was completed, the blood that filled the apheresis tubing was discarded. The patients were in the intensive care unit (ICU) under the supervision of a pediatric physician and ICU nurse who were aware of potential adverse events, and the procedure were performed by two hematology physicians and the nurse practitioner.
Results/Finding: The white blood cell (WBC) in blood was counted immediately before apheresis in both subjects, and were 120.000 and 150.000/mm3. The formula “Collection Pump Flow = 0,0003 x Inlet Flow x Pre‐apheresis WBC count” was used with the goal of removing up to 3 x 10⁹leukocytes/mL. A single leukapheresis procedure was performed with 2 total blood volume processed per patient. Immediately after the 2‐hour procedures, WBC count were 74.000 and 92.000 WBC/mm3, and 12‐hour post TL, WBC count were respectively 45.000 and 70.000/mm3. Net fluid balance was zero in both procedures, and the patients required no transfusion.
Conclusion: TL was safe and efficient. Experience with leukodepletion in infants is limited, and a procedure in children weighing 10kg or less needs forethought and a multidisciplinary effort, hence operators need to customize procedures for safe collection. However, despite the potential complications that may occur (placement of adequate vascular access, management of low extracorporeal blood volume, anticoagulant‐related toxicity with metabolic and hematologic issues), remains an excellent source for leukoreduction in hematologic malignant diseases.
CP82
National Apheresis Registry Results for 2016 By the Korean Society for Apheresis
Hyungsuk Kim* and Kyou‐Sup Han
Department of Laboratory Medicine, Seoul National University Hospital
Background/Case Studies: Nationwide apheresis registry can give us information on the current status and trend regarding apheresis procedures. Data can be compared with other regions to find and understand differences in perspectives, indications, technology, and clinical practice. The Korean Society for Apheresis (KSFA) has launched an online web based registry system for apheresis procedures since 2006. We report the data from the year 2016.
Study Design/Method: The registry is consisted of two sub‐registries. One addresses the overall aspects of apheresis procedures performed at each institute, and the other is focused on therapeutic plasmapheresis procedures. Data is registered by voluntarily participating hospitals in Korea.
Results/Finding: A total of 13,302 apheresis procedures were performed at 37 hospitals. Therapeutic plasmapheresis was the most frequent procedure (50.4%) followed by autologous peripheral blood stem cell (PBSC) collection (23.9%), allogeneic PBSC collection (11.0%), donor leukapheresis (4.0%), and therapeutic leukapheresis (3.9%). COBE Spectra (37.4%) and Amicus (16.8%) were the most widely distributed instruments. Centrifugation was the dominant technique (92.2%) for therapeutic plasmapheresis. Detailed information was given for 4,199 therapeutic plasmapheresis procedures performed on 786 patients (some items were not completely filled out). Spectra Optia (42.7%) and COBE Spectra (26.6%) were the most frequently used instruments for therapeutic plasmapheresis. Fresh frozen plasma (FFP) was used most frequently (47.2%) as the replacement fluid followed by 5% albumin (26.3%), 4% albumin (13.3%), and 5% albumin + FFP (11.1%). Most of the procedures were performed for 1 plasma volume (72.4%). ACD (88.4%) and heparin (11.5%) were used for anticoagulation. Central venous catheter (91.9%) was the dominant type of vascular access. Major clinical indications were desensitization for ABO incompatible renal transplantation (24.1%), antibody mediated rejection in renal transplantation (19.9%), thrombotic microangiopathy (11.5%), desensitization for ABO compatible renal transplantation (4.7%), neuromyelitis optica spectrum disorders (4.6%), and hyperviscosity in monoclonal gammopathies (4.6%). Adverse reactions were observed in 8.5% of the procedures. Allergic reaction (55.2%), hypocalcemic symptom (20.4%), and hypotension (6.9%) were frequently reported. Therapeutic effect was achieved in 86.5% of the patients.
Conclusion: Our apheresis registry has been well run for 10 years. Recent data reflects the increase of ABO incompatible transplantation in Korea. Revision and update of the registry planned this year will help us achieve better understanding on the apheresis status of our region.
CP83
Plasma Exchange May Not Always be Necessary in Patients with Severe Hypertriglyceridemia and Acute Pancreatitis.
Jan C Hofmann* and Dobri D Kiprov
California Pacific Medical Center
Background/Case Studies: Hypertriglyceridemic pancreatitis (HP) is characterized by severe hypertriglyceridemia (sHTG: triglyceride >1000‐2000mg/dl), acute pancreatitis (AP), and absence of other causes. HP is a potentially fatal complication of acute pancreatitis with an incidence of ∼18 deaths/100,000 cases/year. Complications of sHTG include: abdominal pain (nausea/vomiting), acute pancreatitis, hepatosplenomegaly, eruptive xanthomas, lipemia retinalis, memory loss, dementia, and peripheral neuropathy. We report on the effective use of plasma exchange (PE) to treat patients (pts) with HP refractory to conventional medical therapy (lipid‐free diet plus pharmaceutical interventions).
Study Design/Method: We reviewed the medical records of 41 pts who were diagnosed with HP from January, 2009 through January, 2017, and referred for immunotherapy evaluation. 27/41 (66%) pts received conventional therapy (CT) and PE (PE group), and 14/41 (34%) pts received CT alone (CT group). Mean age was 36 years (range 16‐79), and 56% were female. Baseline mean triglyceride level (normal <150mg/dl) for PE group was 6,728mg/dl (4,652‐12,486) versus 3,142mg/dl (1,697‐5,120) for CT group. Baseline mean lipase level (normal <393 U/L) for PE group was 1,798 U/L (797‐2,745) versus 923 U/L (472‐1,796) for CT group.
Results/Finding: All pts were treated with dietary restriction (lipid‐free diet, or nothing by mouth) and aggressive lipid lowering protocols involving 2‐3 medications. 24/27 (89%) of PE group and 11/14 (79%) of CT group received insulin therapy to manage symptoms (sxs) of hyperglycemia and/or diabetic ketoacidosis. 20/27 (75%) of PE group and 6/14 (43%) of CT group received heparin therapy to stimulate lipoprotein lipase release. The PE group underwent an average of 2.85 PE treatments (txs) (median of 2, range 1‐4 daily txs) using 5% albumin; 7/27 (26%) required FFP to treat dilutional coagulopathy. In most cases, we did not perform PE txs when baseline triglyceride levels were <3000‐4000mg/dl and lipase <950‐1375 U/L (2.5‐3.5 X upper limit of normal). Mean triglyceride levels after 2 PE txs were 1,976mg/dl (627‐3,968) for PE group (mean decrease 72%); mean triglyceride levels after 48 additional hours of ongoing CT were 1,576mg/dl (487‐2,873) for CT group (mean decrease 50%). While the PE group achieved a greater mean decrease in triglyceride levels after 2 PE txs (compared to the CT group after 48 hours of CT), both groups experienced marked improvement in clinical sxs of pancreatitis and hyperglycemia (p>0.05). Limitations of the retrospective cohort study include lack of long‐term follow‐up.
Conclusion: This small study adds to the literature which demonstrates that plasma exchange is very effective in rapidly lowering triglyceride levels in pts with acute pancreatitis and hypertriglyceridemia. It suggests that there may be a threshold (or range) of triglyceride and lipase levels below which conventional therapy may be nearly as effective in achieving clinical resolution of symptoms. Randomized controlled trials would further elucidate the appropriate use of adjunctive plasma exchange in the setting of hypertriglyceridemic pancreatitis.
CP84
Role of Plasma Replacement in Therapeutic Plasma Exchange for Hypertriglyceridemia: A Single Patient Study
Geoffrey Wool* and Angela Treml
University of Chicago
Background/Case Studies: Our apheresis service performs chronic therapeutic plasma exchanges (TPE) for a 47‐year‐old man with a chronic history of hypertriglyceridemia >1000mg/dL, diabetes mellitus type II, and chronic abdominal pain. His abdominal pain is severe and persistent, but there is not overt evidence of chronic pancreatitis on imaging or fecal elastase testing. Targeted sequencing has not revealed a pathogenic mutation to explain the patient's hypertriglyceridemia.
Hypertriglyceridemic pancreatitis is a category III indication for TPE by ASFA 2016 guidelines, in a patient unresponsive to optimal medical management. ASFA 2016 guidelines for this disorder state that “Some have used plasma as it contains lipoprotein lipase and could enhance triglyceride (TG) removal. No direct comparisons of replacement fluids have been reported”.
There are three apheresis physicians on our service and use of partial plasma replacement has been variable. We undertook a retrospective study of the efficacy of partial plasma replacement in this patient.
Study Design/Method: We have performed 39 TPE on this patient. We performed a chart review to capture replacement fluid use and pre‐ and post‐TG levels, if drawn. TPE was performed using Spectra Optia (Terumo, Lakewood, CO) exchanging approximately one plasma volume, using entirely 5% albumin for exchange fluid (100% albumin procedures) or partial plasma replacement (2‐3 units of thawed plasma).
Twenty‐six TPE had pre‐ and post‐procedure TG values available. We determined the percent TG reduction achieved by the TPE. We also determined the daily rate of TG increase until the next TPE appointment (to assess any long‐term effects of plasma preventing TG rebound). Significance was assessed by Student's t‐test (one‐tailed, heteroscedastic).
Results/Finding: Twelve TPE were performed with partial plasma replacement, while 27 were performed with 100% albumin replacement.
Table shows that partial plasma replacement was associated with significantly greater % TG reduction. The rate of subsequent daily TG increase was also lower with partial plasma replacement, but this did not meet significance.
| 100% albumin replacement | Partial plasma replacement | ||||||||
|---|---|---|---|---|---|---|---|---|---|
| Average | St Dev. | Min | Max | Average | St Dev. | Min | Max | Student's t‐test | |
| % TG reduction | 65.3 | 6.9 | 54.9 | 75.0 | 69.9 | 6.0 | 56.9 | 78.2 | 0.04 |
| Rate of subsequent daily TG increase (mg/dL/day) | 469.2 | 304.1 | 62.9 | 986.6 | 349.3 | 232.2 | 28.8 | 837.7 | 0.15 |
One mild allergic reaction has occurred during partial plasma replacement which responded quickly to additional IV diphenhydramine.
Conclusion: We have performed an ad hoc cross‐over study on the efficacy of partial plasma replacement in TPE for hypertriglyceridemia. In this patient without lipoprotein lipase mutations, plasma was significantly associated with improved % TG reduction, but not with prevention of post‐TPE TG rebound.
CP85
Safety and Efficacy of Local Albumin Replacement for Therapeutic Plasma Exchange
Phandee Watanaboonyongcharoen*1,2, Metha Apiwattanakul3, Sompis Santipong2, Jutaluk Jaipian2, Jettawan Siriaksorn2 and Ponlapat Rojnuckarin1
1Chulalongkorn University, 2King Chulalongkorn Memorial Hospital, 3Prasat Neurological Institute
Background/Case Studies: Therapeutic plasma exchange (TPE) with albumin replacement has been used to treat a variety of diseases. However, there had been rising cost and supply shortage of imported albumin in our country. To solve the problem, our National Blood Centre had established a plasma fractionation plant to manufacture plasma derivatives including albumin. The objective of the study was to evaluate the safety and efficacy of local albumin as a replacement for TPE.
Study Design/Method: All TPEs using local albumin as a replacement from two tertiary care hospitals performed from June 2016 through February 2017 were included. Complete blood count and serum calcium were tested before TPE. Serum albumin was tested before and after TPE. Local albumin is available as a 20% solution. Before using, it was diluted to a 4% albumin concentration with normal saline. All the patients were hospitalized and received oral calcium before TPE to prevent hypocalcemia. The adverse effects were recorded.
Results/Finding: The total of 156 TPEs in 38 patients were included as shown in the Table. Neurologic disorders were the most common indication for TPE, followed by autoimmune diseases. The median total plasma volume was 3,000 (range 1,750‐4,200) mL. Although the corrected calcium level was low (<8mg/dL) in 3.2% (5/156) before the procedure, no clinical manifestation of hypocalcemia was detected. Adverse effects were observed during the TPE procedure in 2 patients. The first patient had 2 events of mild symptomatic hypotension. He previously took angiotensin converting enzyme inhibitor. The second patient complained nausea after finishing TPE. All reactions were mild. The incidence of adverse effects was 1.9% (3/156). In 2014, the incidence of TPE adverse effects was 1.6% (2/125) when commercial albumin was used. The difference was not statistically different (P = 1.000). Median serum albumin levels pre‐TPE and post‐TPE were 3.6 (1.9‐4.4) and 3.9 (2.4‐5.0) g/dL. The increase in serum albumin after TPE was statistically significant (p<0.001). Eighty‐two percent of pre‐TPE serum albumin levels were lower than 4.0g/dL explaining the rises of albumin after the procedures.
Conclusion: We demonstrated that local albumin was safe and effective in maintaining albumin levels in patients undergoing TPEs.
TABLE 1. Patient Characteristics
| Male:female (%) | 11 (29%):24 (71%) |
| Age (years) | 36 (13‐87)* |
| Weight (kg) | 59 (13‐89)* |
| Height (cm) | 160 (132‐175)* |
Median (range)
CP86
Safety, Efficancy and Cost‐Effectiveness of Mononuclear Cell Collections for Autologous Immunotherapies: Experience from a Private Outpatient Collection Facility within the EU
Markus Dettke*
AKH Vienna University Hospital, Cyto‐Care.eu
Background/Case Studies: Within the EU the collection of mononuclear cells (MNC) as starting source for the manufacturing of autologous cell therapies are mainly performed in hospitals or hospital‐associated apheresis centers. We report about the challenges to perform the leukapheresis procedure (LA) at a private held medical practice, with specific emphases on safety, cell collection efficiency, and cost‐effectiveness.
Study Design/Method: We reviewed the records of altogether 60 outpatients who underwent a total of 100 LA procedure at Cyto‐Care, a private held medical practice/ certified cell collection facility located in Vienna, Austria. All patients participated in various industry‐sponsored clinical P I‐III trials; the study sponsors were responsible for the manufacturing of the active cell product. Disease entities were mainly prostatic cancer (75%) and ovarian cancer (20%). Based on differences in the study protocols LA was performed either one‐time (41%), two‐times (27%) or three‐times (32%), with an interval of at least 2 weeks between repeated collections.
Results/Finding: All patients successfully completed the apheresis course. Because of poor venous access, 3 out of 60 patients (5%) required a short‐term femoral catheter insertion. There were no serious side effects in patients who required a femoral catheter, or in patients with repeated LA procedures. Side effects of the LA procedure mainly consisted on mild hypocalcaemia‐related symptoms in 16% of patients. A follow‐up survey one week after completion of the LA revealed no infectious complications, and no patient required hospitalization. Median cell yield collected per single apheresis was 1.4x10^10 WBC consisting of 1.1x10^10 MNC. MNC cell yields remained stable even in repeated LA collections. All cell products were successful transformed into an active cellular product. Analysis of the cost structure showed that the total cost of care was 32% lower in the setting of a private collection center compared to hospital‐based apheresis centers.
Conclusion: Leukapheresis performed in a private medical practice/ certified cell collection facility is safe and effective, with low rates of complications and high levels of patient satisfaction. This service model is cost‐effective and can help to reduce the cost of manufactured goods in the production of innovative cellular products.
CP87
Therapeutic Plasma Exchange in Hyperviscosity Syndrome Secondary to Polyclonal Gammopathy
Parvez M. Lokhandwala*, Maryam Shabihkhani, Paul M. Ness and Evan M. Bloch
Johns Hopkins University School of Medicine
Background/Case Studies: Hyperviscosity syndrome (HVS) refers to clinical manifestations of increased blood viscosity and is generally characterized by mucosal bleeding, visual changes and neurologic symptoms. Although typically associated with monoclonal gammopathies (e.g. Waldenstrom's macroglobulinemia and multiple myeloma), HVS has rarely been reported in patients with disorders of immune system such as rheumatoid disease, Sjogren's syndrome, HIV and IgG4‐related diseases. Therapeutic plasma exchange (TPE) is indicated in HVS due to monoclonal gammopathy (ASFA category 1 indication). However, there are limited data for the utility of TPE in HVS due to polyclonal gammopathy.
Study Design/Methods: A 70 year old female patient with a medical history significant for seropositive erosive rheumatoid arthritis, hypertension, diabetes mellitus, cutaneous lupus and diffuse parenchymal lung disease, presented to our institution with complaints of progressive fatigue, muscle weakness, poor appetite, headache and epistaxis for a few months. Fundoscopic examination showed dilated and tortuous vasculature as well as bilateral retinal hemorrhages (mixed flame‐shaped and dot‐blot patterns).
Pertinent laboratory findings included a positive anti‐nuclear antibody screen with anti‐histone antibodies and anti‐Ro antibodies. Serum rheumatoid factor was markedly elevated to 57,000 IU/mls (ref. range < 35) and anti‐cyclic citrulline peptide antibody was elevated to 34,339 units (ref. range < 20). Serum protein electrophoresis and immunofixation demonstrated a polyclonal hypergammaglobulinemia; protein precipitates were noted at the point of application, suggestive of circulating immune complexes. Serum IgG, IgM and IgA were 4610, 2890 and 1320mg/dL respectively. A cryoglobulin screen was negative. Serum free kappa to lambda ratio was 1.74. Peripheral blood flow cytometry did not identify any monoclonal B‐cell population. Plasma viscosity was noted to be 8.5 centipoise (cp) at admission (ref. range 1.6 – 1.9). PET‐CT imaging was negative. The patient was treated with high dose steroids; a single TPE procedure was performed using the following parameters: volume treated – 1 total plasma volume; replacement fluid – 5% albumin and normal saline in a 50:50 ratio; replacement fluid volume: 110% of the total volume processed. The procedure was tolerated without complication.
Results/Findings: Immediately post‐TPE her plasma viscosity level dropped to 2.4 cp. Serum IgG, IgM and IgA levels decreased to 2040, 1510 and 672mg/dL respectively. Her RF had decreased to 19,900 IU/ml. The patient reported subjective improvement in strength. She subsequently received two infusions of rituximab separated by two weeks. Her plasma viscosity has remained less than 3 cp since TPE.
Conclusion: Polycolonal gammomathy (e.g. secondary to RA) is a rare cause of HVS. TPE can provide transient relief of symptoms in unusual cases of HVS and may facilitate therapy to prevent recurrent HVS episodes.
CP88
Therapeutic Plasma Exchange in Neuromyelitis Optica Spectrum Disorders – Experience from Tertiary Care Centre in North India
Ratti Ram Sharma*, Rekha Hans, Satya Prakash, Naveen Sankhyan and Neelam Marwaha
Postgraduate Institute of Medical education and research
Background/Case Studies: Neuromyelitis optica spectrum disorder (NMOSD) is an idiopathic inflammatory demyelinating disorder of central nervous system preferentially involving optic nerve and upper segments of the spinal cord leading to optic neuritis and myelitis. TPE is indicated in acute phase or as a maintenance therapy to treat or prevent relapses in chronic phase.
Study Design/Method: To assess the efficacy of plasma exchange in patients of NMOSD not responding to high dose intravenous steroids. we did a retrospective review of TPE records for patients with NMOSD over a period of three years (Jan 2013 – Dec 2016). TPE was done using, Cobe spectra (Terumo BCT, Lakewood Co. USA), replacing one to one and half patient plasma volume with 5% human serum albumin or Fresh frozen plasma on alternate days. The improvement in clinical signs and symptoms was recorded after each TPE procedure and at the end of the therapy. Adverse reactions if any were also recorded
Results/Finding: Eleven patients of NMOSD between 4 to 35 years age (M: F; 1:2) underwent 62 TPE procedures with an average of 5.6 per patient. All the patients were on high dose immunosuppressant therapy without much clinical improvement. Three (27%) patients had only visual symptoms, 5 (46%) had both visual as well as muscular symptoms whereas 3 (27%) patients had muscular symptoms only. Three (27%) out of the seven tested, were positive for AQP4‐IgG. All the patients showed significant improvement in their visual symptoms post exchange, from no vision/light perception to finger counting in two patients, recovery of colour vision and diplopia in six patients. Post exchange recovery in the muscle power was observed in 8 patients with grade‐1, in 1 patient, and by grade‐2, in seven. Adverse events were observed in 8% (5/62) of the procedures with allergic reactions to replacement fluid as most common event (n‐3) followed by hypotension (n‐2). Follow up was available in 55% (6/11) of patients and are doing well on immunosuppressive therapy. One patient died due to respiratory failure after 3 months and another had relapse for which he underwent second TPE cycle and continue to do well.
Conclusion: TPE is a safe and effective adjunct therapy to high dose immunosuppression in NMOSD.
CP89
Trima Accel Software Upgrade from 6.0 to 6.4 for Platelet Collections
Rachel M Beck*, Kimberly J Duffy, Sandra Bryant, Audrey E Traun, Mary M Benike, James R Stubbs and Justin D Kreuter
Mayo Clinic
Background/Case Studies: TerumoBCT released Trima Accel software version 6.4 as an enhancement to allow for the collection of platelets (plt) with Platelet Additive Solution (PAS) and provide additional improvements to increase overall reliability. Additionally, the manufacturer identified a slower centrifuge speed at low draw flow rates. This software was expected to function similarly to version 6.0. The objective of this retrospective study is to identify any variances with the software upgrade influenced the plt products collection process or products collected.
Study Design/Methods: Prior to 1/16/2016, plt collections were performed on nine Trima Accel machines operating with version 6.0. Upgrading and validating all nine machines to version 6.4 occurred from 1/16/2016 to 4/30/2016. The Trimas were programmed with the same plt configurations both before and after software update. Platelet collection data from version 6.0 (5/1/2015 to 9/30/2015) was compared to version 6.4 (5/1/2016 to 9/30/2016). Incomplete collections, runs identified as having possible leukocyte contamination, duration of collection, and plt split rate were evaluated for each time period. Generalized estimating equations (GEE) were used to assess differences between plt collections with version 6.0 and 6.4, adjusting for multiple visits per donor, with significance defined as p‐value < 0.05.
Results/Findings: Following the upgrade to version 6.4, staff observed a number of changes including an increased centrifuge recovery time on a donor with a low flow and a notable increase in possible leukocyte contamination products. Version 6.4 of the Trima Accel showed a statistically significant increase in possible leukocyte contamination from 3% to 5% of collections as compared with version 6.0. Both the duration of collections and the plt split rate remained constant even with centrifuge speed adjustments in version 6.4.
| 6.0 | 6.4 | p‐value | |
|---|---|---|---|
| Collections Performed | 1856 | 1726 | 0.02981 |
| Gender | 0.04642 | ||
| Male Visits | 1094 (58.9%) | 1091 (63.2%) | |
| Female Visits | 762 (41.1%) | 635 (36.8%) | |
| Incomplete Collection | 58 (3.1%) | 57 (3.3%) | 0.77072 |
| Identified as possible leukocyte contamination | 55 (3.0%) | 82 (4.9%) | 0.01052 |
|
Time of complete collection (min), median (IQR) |
88 (75, 103) |
87 (73, 101.5) |
0.08363 |
| Platelet Split rate (95% CI) | 1.68 (1.62, 1.74) | 1.67 (1.61, 1.74) | 0.89771 |
1Poisson distribution, 2Binomial distribution, 3Normal distribution
Conclusion: Due to FDA limitations not allowing for the implementation of Trima Accel PAS plts with the currently available pathogen reduction system, the institution decided to implement only the pathogen reduction system at this time. Subsequently, the version 6.4 software is no longer required. With the noted slight increase in possible leukocyte contamination as well as the lack of enhancements for plt collection, the upgrade to version 6.4 currently does not provide added value over version 6.0 for plt collection.
CP90
Use of Hydroxyethyl Starch Is More Effective in Reducing Leukocyte Counts in CML Patients Undergoing Therapeutic Leukocytapheresis
Ramakrishna Reddy*
American Red Cross Blood Service
Background/Case Studies: Patients with hematologic malignancies can present with very high leukocyte counts. Hyperleucocytosis may lead to pulmonary and neurologic symptoms due to leukostasis. Therapeutic Leukocytaphersis (TL) is used as an adjuvant therapeutic modality in these patients with symptoms suggestive of leukostasis. TL procedures are performed using cell separators where anticoagulated blood is subjected to centrifugal force resulting in separate layers of cells and plasma depending on their density. There are two programs in the cell separator, a mononuclear (MNC)program which has greater centrifuge speed and efficiency for the collection of MNCs and a polymorphonuclear (PMN)cell program with lower centrifuge speed for the collection of PMNs. Hydroxyethyl Starch(HES) is preferred for the collections of granulocytes for transfusion from healthy donors. Use of HES facilitates the sedimentation of the granulocyte layer and increases the efficiency of collection. Though use of HES in TL was not associated with adverse events with its use as a volume expander (Pagano) its use in TL varies and no reports are available on the efficiency of leukodepletion using HES for TL.
Study Design/Method: We received a request for leukoreduction in 32 year‐old lady with chronic myelogenous leukemia (CML) who had a good response to Imatinib. She is 30 weeks pregnant with an increased WBC count due to the discontinuation of Imatinib. We performed TL with the COBE Spectra using a replacement fluid of 500ml 5% albumin. WBC counts were monitored pre and post TL in the patient and in the collected product. We modified the collection based on these results using the MNC program with ACD‐A or the PMN program with ACD‐A . As leukodepetion was not adequate with these programs we elected to use HES after discussion with the patient and her physician. TL was performed using 500ml of HES with citrate and the PMN program. WBC pre procedure, immediate post procedure and the product was obtained and the efficiency of leukodepletion with the different programs was calculated.
Results/Finding: The efficiency of % WBC depletion was calculated by product WBC to patient WBC based on blood volume and also Pre to Post WBC
|
Proc# Date |
Program/ ACD‐A ratio |
Est BV ml |
Volume Proc/ ml |
Pre TWBC 10x3ul |
Pre Abs N |
Post TWBC 10x3ul |
Post Abs N |
Prod Vol /ml |
Product Total WBC 10E9/L |
Efficiency % WBC product / WBC patient BV/L 10E9x100 |
Eff % product count | Eff % pre/post count |
|---|---|---|---|---|---|---|---|---|---|---|---|---|
|
1‐ 2/17 |
PMN/ ACD‐A 1:13‐14 |
4627 | 12001 | 139.5 | 78.1 | 104.6 | 55.4 | 806 | 268.0 |
268.0x0.806/139.5x 4.627 |
33.0 | 25.0 |
|
2‐ 2/23 |
MNC/ ACD‐A 1:15 |
4687 | 12001 | 146.4 | 83.4 | 104.5 | 74.2 | 1053 | 294.2 |
294.2x1.053/146.4x 4.687 |
45.1 | 28.6 |
|
3‐ 3/01 |
HES/MNC /PMN 1:15‐20 |
4717 | 12001 | 153.3 | 87.4 | 138.6 | 87.3 | 1100 | 266.8 |
266.8x1.100/153.3x 4.717 |
40.5 | 9.5 |
| 4‐3/08 |
HES/ PMN 1:18 |
4717 | 10692 | 146.8 | 102.8 | 80.0 | 60.8 | 1210 | 398.01 | 398.01x1.210/146.8 x 4.717 | 69.5 | 45.5 |
| 5‐3/17 |
HES/ PMN 1:20 |
4762 | 10505 | 119.1 | 83.4 | 68.0 | 50.3 | 1018 | 368.83 | 368.83x1.018/119,11x4.762 | 66.2 | 42.9 |
The patient tolerated the procedures well and there were no adverse reactions in the patient and in fetal monitoring during the procedures
Conclusion: Therapeutic leukocytapheresis in CML patients is safe and more effective in reducing the WBC count with the use of 500ml of hydroxyethyl starch with anticoagulant. Post procedure patient WBC counts sometimes may not provide the data on the efficiency of leucodepletion. Pagano etal Transfusion 2016; 56:2848‐2856
Thanks are due to our Clinical Apheresis Staff
CP91
Use of Therapeutic Plasma Exchange as an Early Adjunct Therapy for Hypertriglyceridemic Associated Acute Pancreatitis: A Case Report.
Miriam Andrea Duque*1, Karafa SW Badjie2, Abba Zubair2 and Deanna Fang3
1University of Florida, College of Medicine, 2Department of Laboratory Medicine and Pathology, Transfusion Medicine, Mayo Clinic, 3Mayo Clinic
Background/Case Studies: Early recognition of hypertriglyceridemia (HTG) in the setting of acute pancreatitis (AP) is critical to initiate effective therapy. The role of plasmapheresis as an early/adjuvant approach in acute HTG‐induced pancreatitis is controversial. Currently, there are no consensus guidelines in optimal therapy and is ASFA category III. Reported here is a case where the TG level as well as clinical symptoms improved after one therapeutic plasma exchange (TPE).
Study Design/Method: A 45 years old male with history of hypertension, HTG, and Diabetes Mellitus (DM) presented to our emergency department with excruciating abdominal pain. The patient was diagnosed with HTG at 20 years old. He was treated initially with diet and lifestyle modification. However, his clinical course has been compromised after developing pancreatitis with 3 acute episodes requiring prolong hospital admission of approximately 2 months each which were successfully treated medically. However, the recurrent episodes resulted in chronic pancreatitis which was complicated with pancreatic pseudocyst and pancreatic insufficiency. Since the first episode of pancreatitis, he was then medically managed with fenofibrate, Lovaza, Lisinopril, Levemir and NovoLog. During evaluation on current admission, he was found to have a TG level of 4980mg/dl, lipase 92 U/L, glucose 250mg/dl, Bicarbonate 24 mmol/L, anion gap 12. CT findings were consistent with AP without evidence of necrosis and stable pancreatic pseudocyst. Medical therapy was started with Omega 3 fatty acid, fibrate, statin, hydration as well as pain control. Statin therapy was suspended on day 3 of hospitalization, because he was noted to have elevated liver function tests (LFT) and TPE was requested and started on day 3 after admission.
Results/Finding: The patient TG decreased by 52% (2365mg/dl) with medical therapy, followed by additional 67% (767mg/dl) after one volume of TPE. His symptoms significantly improved and was discharged with medical treatment on day 6 after admission. Compared to previous episodes, his hospital stay was significantly decreased. TG levels remained below 1000mg/dl at 20 days follow up after discharge.
Conclusion: Early TPE may be of value in treating patients with elevated TG associated with recurrent pancreatitis. Plasmapheresis might be an effective early adjuvant therapy to mitigate length of hospital stay, improve cost‐effectiveness and patient safety.
TABLE 1. Chronologic triglyceride levels
| Triglyceride (mg/dL) | Events | |
|---|---|---|
| 3727 | TG 6 months earlier | |
| 3222 | TG 3 months earlier | |
| Day of admission | 4980 | |
| Day 2 |
Fenofibrate IV given Statin given |
|
| Day 3 | 2365 | High LFT/ Statin was stop |
| Day 3 | TPE performed | |
| Day 3 | 767 | Post‐TPE TG level |
| Day 4 | Fenofibrate IV continued | |
| Day 6 | Discharged | |
| 20 days follow up | 960 | Outpatient |
Donor Recruitment, Retention, and Adverse Events: Quantitative Aspects; Donor Recruitment/Retention/Marketing and Donor (Suitability) Eligibility
CP92
A Longitudinal Study on Ferritin Change in Platelet Donors
Wei Ping Chen*, Yun Yuan Chen, Jen Wei Chen and Sheng Tang Wei
Taiwan Blood Services Foundation
Background/Case Studies: From 2009 to 2013, a national blood donor center in Southeast Asia conducted a program to monitor the ferritin levels of platelet blood donors. The aim of this study was to explore the trend of changes in ferritin.
Study Design/Method: In this study, we collected 5,129 cases whose ferritin levels have been monitored more than twice with an interval of detection in 150‐160 days. The collected plasma samples were tested for ferritin by chemiluminescence using a commercial assay. Inclusion criteria included apheresis platelet blood donors with over two results of ferritin, and first time ferritin test result was over 50 μg/L. And the upper limit was set to be 244 μg/L in male and 158 μg/L in female as described in manufactures insert. The impact on ferritin from gender, age, and the blood donation frequency were examined with ANOVA test. The blood donations frequency was categorized into five groups: 0 times, 1 to 3 times, 4 to 6 times, 7 to 9 times and more than 10 times. The high frequency (more than 10 times group) blood donors were analyzed ferritin changes in longitudinal data.
Results/Finding: There were 5,129 donors included in the study, of which 4,944 were male (96.4%) and 185 were female (3.6%). The mean ferritin was 82.0 μg/L in male (95% CI: 80.7‐83.2 μg/L) and 66.5 μg/L in female (95% CI: 60.9‐72.0 μg/L). The result of ANOVA indicates that the group with the highest frequency (more than 10 times) has the significant lowest ferritin level (p<0.05). The average change of ferritin if donation over 10 times would up to 13.4 and 14.1 μg/L in younger and elder 50 y/o male and 18 and 23 μg/L in female. And then for high frequency (half a year more than 10 times the group of blood donors) for longitudinal analysis and found that the long‐term sustained high frequency of blood donation caused a significant decline in ferritin. The average change about ferritin in high frequencies donors (over 10 times in 150∼160 days) was reduced from 21.5 μg/L in the first period to 4.1 μg/L in the third period (1 period=150∼160 days). Along with the more and more period, the decline of ferritin decreased.
Conclusion: This analysis revealed that frequent apheresis platelet donation would decrease ferritin of donors. But the high frequency of platelet blood donors who continue to donate after a year, the decline of ferritin slowed down.
CP93
A Rare Case of Blood Donation Precipitating Acute Delirium
Joseph Griggs*1, Mary Townsend2 and Lizabeth Rosenbaum3
1University Of New Mexico Hospital, 2Blood Systems, Inc., 3Blood Systems Inc.
Background/Case Studies: We report a case of whole blood (WB) donation that precipitated a transient agitated delirium. A 22 year‐old first time male donor presented to the local blood center, completed the donor health questionnaire, mini‐physical exam, and hemoglobin check, and was deemed eligible for blood donation. Approximately 10 minutes after an uncomplicated WB donation, the donor had an observed, brief loss of consciousness in the post‐donation area. No fall or injury was seen. Shortly after regaining consciousness, the donor became agitated, confused, and was not oriented to month or year; was unable to remember the names of friends and family members; was unable to read an analog clock; and had difficulty with word finding. The donor was transported to the local university hospital where he was noted to be combatively delirious and had altered mental status; he had to be forcibly restrained. He ultimately was sedated and intubated, and transferred to the intensive care unit.
Study Design/Method: An extensive laboratory investigation was performed including standard hematologic and chemistry panels; serologic and PCR‐based studies for multiple organisms including West Nile, herpes, HIV, varicella zoster, and syphilis; aerobic and anaerobic blood cultures; and a urine drug screen for multiple drugs of abuse. Radiographic imaging was performed including a chest x‐ray, and a CT and MRI of head and spine. In addition, an EEG was performed. The inpatient neurology and psychiatry services were consulted for this patient.
Results/Finding: After the sedation was discontinued, the patient was successfully extubated and rapidly improved. He completely returned to baseline within 24 hours of onset of the event. Laboratory investigation revealed no signs of infectious organisms or evidence of drugs of abuse. Radiographic imaging and EEG studies showed no abnormalities. In addition, infectious disease marker testing performed by the blood center laboratory was negative. Investigation revealed that the donor was experiencing high levels of stress at school, had an aversion to the sight of blood, and was coerced into donating by his girlfriend and peers. A week following hospital discharge, the blood center medical director contacted the donor by phone; the donor had resumed his normal routine and was attending his graduate level classes.
Conclusion: To our knowledge, this is the first report of blood donation precipitating a transient acute delirium. At the time of donation, the health status of all potential blood donors is assessed to help ensure the safety of the donor and the recipient. The health questionnaire, physical exam, vital signs, hemoglobin level, and infectious disease testing help to identify overt signs of medical illness that may disqualify a donor. However, routine donor screening does not explicitly evaluate mental health issues, both diagnosed and undiagnosed. Although exceedingly rare, this case highlights the limitations of donor screening to identify donors who may be at risk for mental health adverse reactions when donating blood.
CP94
A Targeted Approach to Increasing the African American Blood Donor Pool
Arnethea Sutton*1, William Korzun1, Teresa Nadder1, Susan Roseff2 and Elizabeth Ripley1
1Virginia Commonwealth University, 2Virginia Commonwealth University Medical Center
Background/Case Studies: A continuous need for blood products for those who require frequent transfusions, such as individuals with sickle cell disease who could benefit from products collected from African American donors, warrants the need for targeted interventions to increase blood donations from underrepresented populations. One population in particular, African Americans, only account for 1% of blood donors in the United States. Literature indicates numerous reasons why this population is underrepresented amongst donors, including fear, lack of knowledge about the blood donation, and specific to this population, lack of trust in the medical community.
Study Design/Method: African Americans in Richmond and Norfolk, Virginia were recruited through churches and local universities. The study's aims were to develop, implement, and assess a targeted educational approach incorporating the Theory of Planned Behavior and various teaching methods, to develop and implement a survey to evaluate participants’ feelings, attitudes, and intent to donate, and to motivate African Americans non‐donors to attempt to donate blood. Participants attended a 1‐hour educational session where they were educated on the importance of red blood cell donations from African Americans. Participants completed three surveys –one before the session, one directly after the session and one, two months after the session. A two‐proportion z‐test was used to compare the known proportion of African Americans who present to donate in the study areas to those who presented to donate in this study, while regression analysis was used to estimate the relationships among survey variables.
Results/Finding: A total of 142 subjects were included in the data analysis. Sixteen percent of the study participants presented to donate as a result of attending the educational session. This resulted in a statistically significantly higher proportion of African Americans presenting to donate than the current proportion in the areas of the state where this study was conducted. Results from the first two surveys indicated that subjective norm and attitude were significant predictors of one's intent to donate blood, while perceived behavioral control was not a factor. The educational session increased survey scores related to intent to donate in comparison to scores obtained prior to the session.
Conclusion: This study shows that a targeted educational program can change attitudes toward blood donations in African Americans resulting in an increase in new blood donors. Additional studies are needed to see if this behavior will continue and whether African Americans can influence their community to increase awareness and motivation for life‐long blood donation.
CP95
Behind the Iron Curtian: Hemoglobin Deferrals at Two Military Basic Training Sites
Melanie Sloan*1, Jennifer McMahon2, Audra Taylor1 and Jason Corley3
1U.S. Army, 2DDEAMC / KMBC, 3US Army
Background/Case Studies: After implementation of the adjusted male hemoglobin standard, an Army Blood Donor Center noted a significant increase in hemoglobin deferrals, from 6.7% in 2015 to 12.3% in 2016. After scrutiny of the increase in hemoglobin deferrals, it was determined that the majority of these deferrals were observed at two different Service Component Basic Training Sites in the Southeast. The population at Basic Training Site A is the largest and most active initial entry station in the Army, training 50% of all new recruits and 60% of all enlisted women of the Army. The demographics at Basic Training Site B are much different where roughly 7% of all Marine recruits are women.
Study Design/Method: Basic Training Site A is an Army Basic Training site, while Basic Training Site B is a Marine Basic Training Site. The recruits at basic Training Site A present for the ASBP blood drive on day 60 in a 70‐day training cycle, while the blood drives as Basic Training Site B are scheduled day 60 in a 90 day training cycle, therefore each of these groups of trainees present at roughly the same times in their separate training schedules, with the same amount of time from initial entry to when ASBP blood drives are scheduled. Monthly hemoglobin deferral percentages for Basic Training Site A and B were obtained and calculated in 2015 and 2016 and compared using a T test.
Results/Finding: When hemoglobin deferrals obtained in 2015 are compared to those obtained in 2016, both Basic Training Sites A and B demonstrated a significant increase in hemoglobin deferrals. Basic Training Site A increased from 9% to 16% (p =<0.01), and Basic Training Site B increased from 10% to 24% (p = <0.01). The hemoglobin deferral demographics at Basic Training Site A were further stratified to demonstrate that 141 of 177 (80%) in 2015; and 258 of 359 (72%) in 2016 were from female basic trainees. The hemoglobin deferral demographic stratification of Basic Training Site B revealed that 23 of 136 (14%) in 2015 and 5 of 275 (1.8%) in 2016 were from female basic trainees
Conclusion: The significant increase in hemoglobin deferrals at Basic Training Site A from 2015 to 2016 could be a result of a change in the blood drive timing of the training schedule of that location. In 2015, Basic trainees at site A were scheduled at day 57 of 70. In January 2016, the blood drive date changed to day 60 of 70. The extra three days in the Basic Training atmosphere, and its associated diet changes and increased physical activity may have had an effect on the hemoglobin levels in that population. At Basic Training Site B, the significant increase from 2015 to 2016 of hemoglobin deferrals can be attributed to a larger male population presenting at this site for Basic Training. Additionally, the percentage of female recruits donating at the blood drives decreased in 2016. These observations support the hypothesis that the increase in hemoglobin deferrals in 2016 resulted from the implementation of the male hemoglobin standard change from 12.5 to 13.0g/dl at Basic Training Site B. When planning for blood drives at basic training site B, screening of an additional 24% of recruits must be considered when performing these blood drives, in order to meet the same collection goals set prior the implementation of the change in the male hemoglobin standard.
CP96
Blood Donation in the Donor with Spinal Cord Injury
Joan‐Ramon Grífols*1, Eva Alonso1, Oscar Bascuñana1, Monica Romero1, Teresa Vich1, Elena Castaño1, Laura Carbonell1, Eva Palomas1, Saray Almerge1, Francesc Carpio1 and Xavier Curia2
1Banc de Sang i Teixits, 2Institut Guttmann
Background/Case Studies: Donation of blood components (BC) in donors with spinal cord injuries (SCI) is poorly studied. Paralysis is a state, not a disease, after a reasonable time since its acquisition these people should not be differentiated from the rest of the non‐paralytic population in terms of BC donation. The literature reviews of blood donation suitability criteria among these people are scarce and the vegetative lability that they may present depending on the type of their SCI it's obvious. In daily practice these potential donors are often rejected for donation with no specific criteria related to their SCI. The objectives of this study are to establish the selection criteria for BC donation in people with SCI based on medical criteria. To evaluate the rate of adverse donation blood reactions of these donors against a donor control group without SCI. Study Design/Method: Our organization regularly organizes a donation campaign at a rehabilitation center for patients with SCI. In this campaign some donors with SCI as donors without (professionals of the center, relatives, etc.) donate blood. From January 2015 to December 2016 we analyzed the number of donors who came to give blood, the number and reasons for exclusion of those who could not make the donation, whether or not they had SCI and number and typology of adverse reactions to the donation detected in both groups. Donors with SCI higher than T5 due to the high risk of autonomic dysreflexia were excluded for donation. Donors with SCI below T5 and less than one year of evolution were set as temporary exclusion criteria. The presence of neurogenic bladder was not considered a reason for exclusion. Results/Finding: In the analyzed period, 219 donors came to give blood, of these, 15 (7%) were excluded for donation for various reasons. Two of the donors excluded suffered SCI higher than T5 excluding them due their high risk of dysreflexia. Another one donor excluded suffered SCI lower than T5 but his hemoglobin levels were lower than our selection criteria. Of the 204 donors selected for donation 16 (7.8%) had SCI lower than T5 and T6. Adverse reactions to donation (1.4%) were recorded in our haemovigilance program, none of them in donors with SCI. Conclusion: According to our experience donors with SCI lower than T5 have not had any type of adverse reaction to the blood donation. There should be selection / exclusion criteria based on the donor's paralytic conditions. The vagal syndrome that could appear as a complication to the donation in these SCI donors should be approached differently to the usual protocols that we use.
CP97
Blood Donor Center's Experience with Changing from Manual to Automated Blood Pressures
Kimberly J Duffy*, Sandra Bryant, Audrey E Traun, Kristine I Borth, Mary M Benike, James R Stubbs and Justin D Kreuter
Mayo Clinic
Background/Case Studies: Blood pressure (BP) is important for determining the health and suitability of blood donors. The manual method of reading BP can result in variability due to minor variances in the way staff perform the manual procedure. Automated BP devices are able to reduce the variability in BP determination. In December of 2013, automated BP devices were validated and replaced the manual BP method in our blood donor center. The objective of this retrospective study is to determine if the change from a manual to an automated BP process has impacted the average systolic and diastolic pressures and, additionally, if a differences in the deferral and reaction rate can be observed.
Study Design/Methods: Data for the manual BP process was accumulated for an 11 month period from January 2013 to November 2013. The same information was assembled for the automated BP process for the 11 month period of January 2014 to November 2014. The automated BP process implemented in mid‐December 2013; so the December data for both 2013 and 2014 has been excluded from the study. BP, BP deferrals, reactions, donor weights and demographics were evaluated for each time period. A donor may be included multiple times in each year and could be in both sets of data. Generalized estimating equations were used to assess differences between automated and manual BP with significance defined as p < 0.05.
Results/Findings: Significantly more people were deferred using automated BP compared to manual BP readings (p=0.006). Both systolic and diastolic BP measured significantly higher by automated BP method than by manual method. Although donors in the automated BP group experienced fewer reactions than those in the manual BP group, the reduction was not large enough to reach statistical significance. Even after adjusting for gender, weight and age at donation, BP deferrals, systolic and diastolic BPs all remained significantly higher (all p < 0.03) with the automated BP while and reactions remained non‐significantly lower (p = 0.086).
| Manual BP | Automated BP | p‐value | |
|---|---|---|---|
| Total Donor Visits | 32606 | 30800 | < 0.00011 |
| Gender | |||
| Male Visits | 15879 (48.7%) | 14385 (46.7%) | 0.602 |
| Female Visits | 16727 (51.3%) | 16414 (53.3%) | |
| Age at Donation, median(IQR) | 51 (36, 59) | 51 (37, 60) | < 0.00013 |
|
Weight at Donation median (IQR) |
180 (155, 210) |
180 (153, 210) |
< 0.00013 |
|
Systolic BP median (IQR) |
114 (104, 124) |
118 (109, 130) |
< 0.00013 |
|
Diastolic BP median(IQR) |
70 (62, 78) | 74 (67, 82) | < 0.00013 |
| BP deferrals | 136 (0.42%) | 260 (0.84%) | < 0.00012 |
| Donor Reactions | 305 (0.97%) | 250 (0.81%) | 0.0872 |
1Poisson distribution, 2Logistic GEE, 3Normal GEE
Conclusion: Automated BP devices have improved convenience for both staff and donors. With a statistically significant increase in deferrals and marginal decrease in reactions, the use of automated BP devices may play a minor role in the safety of blood donors.
CP98
Blood Donor Center's Experience with Changing the Finger Stick Lancet
Judy A Harmon*, Kimberly J Duffy, Sandra C Bryant, Mary M Benike, James R Stubbs and Justin D Kreuter
Mayo Clinic
Background/Case Studies: Blood donor centers are plagued with hemoglobin (hgb) deferrals. An accurate hgb value is important to mitigate unnecessary deferrals. On June 1, 2016 an institutional value analysis team made the decision to implement a different finger stick lancet to reduce cost. The newly acquired lancet B retained the same depth of 1.8mm as the original lancet A. The focal difference of lancet B was a smaller 23 gauge needle versus the previous 21 gauge needle of lancet A. The objective of this study is to determine if the lancet conversion has impacted the number of finger sticks required to obtain a free flowing sample of blood and, additionally if a difference in the donor hgb value and subsequent deferral can be observed.
Study Design/Methods: Lancet B usage and hgb value information was accumulated for a 6 month period starting on June 1, 2016. The same information was assembled for lancet A for a 6 month period starting on June 1, 2015. A donor may be included multiple times in each year and could be in both years of data. Hemoglobin assessment, donor gender, proportion of first time donors and the number of visits per donor across the two years were evaluated. On May 23, 2016 the minimum hemoglobin deferral for men was increased from 12.5g/dl to 13.0g/dl. For the purpose of this study, only the hemoglobin values that were below 12.5g/dl will be compared as a surrogate for deferral. To adjust for multiple visits per donor, generalized estimating equations were used to assess significance between lancet A and lancet B, using the appropriate distribution for the data type, defining statistical significance as p‐value < 0.05.
Results/Findings: The average hgb was slightly lower with lancet B but there was a larger change with the number of donors under 12.5. Statistically more visits with hgb less than 12.5g/dl used lancet B than lancet A. Additionally, fewer first time donors were seen during the lancet B time than during the lancet A time. After adjusting for the effects of both gender and first‐time donation by using logistic regression, the risk of hgb under 12.5 was 16.5% higher with lancet B than with lancet A.
| 2015 (Lancet A) | 2016 (Lancet B) | p values | |
|---|---|---|---|
| Total visits | 15471 | 14940 | 0.0023 1 |
| Hgb, mean ± SD | 14.19 ± 1.43 | 14.18 ± 1.44 | 0.02432 |
| Gender (once per donor/yr.) | 0.87223 | ||
| Females | 5525 (55.3%) | 5325 (55.3%) | |
| Males | 4461 (44.7%) | 4299 (44.7%) | |
| Less than 12.5 | 1571 (10.2%) | 1653 (11.1%) | < 0.00013 |
| Total Lancet used | 15800( 1.0213/visit) | 15600 (1.0442/visit) | 0.0493 1 |
| First time donors | 1381 (8.9%) | 1222 (8.2%) | 0.00013 |
| Number of visits/donor/yr., median (IQR), mean | 2 (1, 4), 3.19 | 2 (1, 4), 3.28 | 0.49404 |
1poisson distribution, 2normal distribution, 3logistic distribution, 4lognormal distribution
Conclusion: Donor's hgb was slightly lower with lancet B than lancet A, but not clinically different. Slightly more lancet Bs were used per visit than lancet As. In addition, more hgb deferrals were obtained using lancet B than lancet A. Even after adjusting for the effects of gender and repeat donors, we saw more potential deferrals with lancet B than lancet A. The slight difference in the gauge of the lancet may have some association to free‐flowing amount of blood and may affect hgb levels. Prior to implementing materials at a lower cost, an evaluation of downstream consequences would be recommended.
CP99
Blood Donors' Acceptance and Response Towards Implementation of Automatic Appointment Booking
Yi Lin Ang*, Ching Lian Toh and William Choon Hong Sim
Health Science Authority
Background/Case Studies: With surges in demand for blood due to an aging population and more hospitals being built, it is becoming increasingly important to be able to ensure that donors return on a regular basis to improve blood supply and blood stock management. Disliking the obligation imposed by appointments, Singaporean donors generally prefer “walk‐ins” as opposed to appointment bookings. Blood Services Group (BSG) Singapore, has made a move to change donors’ mindset by introducing automatic appointment scheduling. This paper aims to study donors’ level of acceptance towards this initiative.
Study Design/Method: To determine the donors’ acceptance rate, data was collected from 1 January to 31 March 2017. After completing their donation, donors were automatically given the next earliest eligible date for their next donation. Those who do not wish to accept the recommended appointment can either decline this arrangement or log into the blood bank's donor appointment booking system (Donor‐Care) to make changes to the appointment offered. A reminder will be sent to their phone via SMS and/or email to their account three days before the appointment date. Data was collected from Donor‐Care and was used to measure the number of appointments made and declined over the three months period. Donors who declined appointment scheduling were verbally interviewed for their reasons.
Results/Finding: A total of 6680 donors who has donated blood in the blood bank's main branch were used as the baseline for this study. 85% of donors (N=5678) accepted automatic appointment booking, whereas some donors (N=1002) were not comfortable with it. 77% of those who declined still preferred walk‐ins (N=771) based on their own time schedule, the rest decided that variable situations (N=112), donation frequency (N=69) and choice of preferred donation locations (N=50) were reasons for declining automatic appointment booking. Prior implementation of appointment booking at other blood bank branches showed that donors who booked appointment through Donor‐Care was 19%. A comparison was made and found that this study shown a significant increase of acceptance rate by 66%.
Conclusion: Generally, the results were positive and the automatic appointment booking system enabled BSG to predict donor attendance, ensure better manpower management to reduce donor turnaround time and thus hopefully improve donor retention. BSG is still monitoring this automatic appointment system and future study are still required to determine the effectiveness of automatic appointment booking, donor return and retention rate. Currently BSG has 4 collection centers, each managing its own appointment system. The eventual aim is to be able to have a centralized appointment booking system whereby donors can book appointments and still be able to donate at any collection site.
CP100
Demographic and Physiologic Characteristics of a Normal Source Plasma Donor Study Group
Marilyn Rosa‐Bray*1, Charlene Wisdom2, Jiang Yuan3 and Shinji Wada1
1Grifols ‐ Biomat USA, Inc, 2CW Clinical Regulatory Consulting, Inc, 3Axio Research, LLC
Background/Case Studies: Normal source plasma is an important source of therapeutic proteins including clotting factors, such as factors VIII and IX, immune globulins, albumin and others. However, little information is available regarding the demographic characteristics of the donors. This is an analysis of demographic and physiologic characteristics of a group of Normal Source plasma donors in the United States.
Study Design/Method: We evaluated the screening demographic and physiologic data from a group of 666 healthy first‐time or return Normal Source plasma donors from 9 donor centers in the United States. Donors were participants on a study to assess the possible effects of plasma donation on cholesterol levels. Results were compared to those of reference USA populations (Health United States 2013; CDC Anthropometric Reference Data 2007‐2010).
Results/Finding: Donors were 61.1% male, 46.0% white, 18.0% Hispanic, 13.2% African‐American, and averaged 30.0 years old. Donors were similar (p>0.05) to the reference population in terms of gender, race, and ethnicity by age group. However, donors were younger (p<0.001), with 57% and 25% of the donor and reference populations, respectively, being 20‐29 years old. Donors’ mean weight was 86.0kg. Overall, 11% of donors (12.5% males; 8.5% females) weighed ≥113.4kg. Mean male donor weights were similar (p > 0.05) to the reference group with the exception of the 20‐29 year group where donors were heavier (p = 0.008). Mean female donor weights were significantly (p<0.007) higher with the exception of the 50‐59 year group where weights were similar. The mean donor cholesterol level was 178.2 ± 33.9mg/dL and was similar in males and females overall. Mean cholesterol levels were lower (p<0.003) in younger (20‐44 yr) donors (male 175.9mg/dL donor, 193mg/dL reference; female 179.2mg/dL donor, 187mg/dL reference). The incidence of elevated cholesterol (≥240mg/dL) was similar (p>0.05) in donor and reference populations except in younger (20‐44 yrs) male donors (p<0.0021; donor 4.9%, reference 10.0%). Mean donor SBP, DBP, and pulse were 125 ± 14.7 mmHg, 75.1 ± 9.6 mmHg, and 75.9 ± 11.2 bpm, respectively. Screening blood pressure levels consistent with hypertension (29.4% male; 16.6% female) in the 20‐44 year donor group, significantly (p<0.0001) higher than the reference population (11.2% male; 8.7% female). No differences were observed in the 45‐64 year groups.
Conclusion: Normal Source donor demographic and physiologic characteristics often paralleled those of the reference USA populations. However there were differences including lower cholesterol levels and a higher rate of high blood pressure in younger donors and higher weights in 20‐49 year old females.
CP101
Developing Blood Donor Educational Materials
Gay Wehrli*1, Susan Rossmann2, Louis M. Katz3 and Dan A Waxman4
1University of Virginia Health System, 2Gulf Coast Regional Blood Center ‐ Sugar Land, 3Americas Blood Centers, 4Indiana Blood Center
Background/Case Studies: Donors must have sufficient information to make a decision, time to consider options before making a decision and an opportunity to make a choice of whether to proceed with or decline donating. Donor education (DE) materials must address mandates set forth by regulatory agencies. These materials must be accessible and understandable by the general population. The goal of this non‐experimental, qualitative design study was to evaluate knowledge acquired through standardized DE materials. This study was IRB approved as an exempt protocol.
Study Design/Method: We developed a DE document written at an 8thgrade comprehension level. A convenience sample of volunteers was identified for this two‐part study. A focus group (FG) incorporated a pre‐ and post‐quiz for knowledge acquisition from reading the four‐page DE document. The quiz was followed by a group discussion for feedback. The pre‐ and post‐quiz contained the same 10 multiple choice questions with single best answers including the option to answer, “I don't know.” The DE document was revised based upon the FG feedback and quiz results. The revised, 3.5 page, DE document was then tested using the same pre‐and post‐quiz during individual interviews (II).
Results/Finding: Demographics and quiz results are summarized in table 1. Results from the FG and II revealed a lack of knowledge in four areas: a donor might be asked not to donate at any time during the donation process, the need for photo identification to donate, iron helps increase a low red blood cell level, and not to donate for the sole purpose to obtain HIV testing. Post‐quizzes from the II group revealed an improvement in knowledge acquisition for all four areas. Feedback from both groups reiterated that the document was too long.
TABLE 1. Demographics and quiz results
| Demographics | Focus Group | Individual Interviews |
|---|---|---|
| Total Participants (N): Male & Female | 10: 4 & 6 | 7: 2 & 5 |
| Mean years of age (Range) | 50 (24‐64) | 48 (26‐61) |
|
Caucasian/White African American/Black Asian, including South Asian |
8 (80%) 1 (10%) 1 (10%) |
1 (14%) 6 (86%) 0 |
|
High school (hs) grad 2‐year college degree/A.A./A.S. 4‐year college degree/B.A./B.S. Some graduate work Completed masters or professional degree |
4 (40%) 1 (10%) 3 (30%) 1 (10%) 1 (10%) |
2 & 1 <hs (43%) 1 (14%) 2 (29%) 1 (14%) 0 |
| Ever tried to donate blood? Yes/No |
Yes: 3 (30%) No: 7 (70%) |
Yes: 4 (57%) No: 3 (43%) |
| Tried to donate in the past 2 years? Yes/No |
Yes: 0 No: 10 (100%) |
Yes: 0 No: 7 (100%) |
| Pre‐Quiz Data for 10 Questions | Pre‐Quiz | Pre‐Quiz |
| Correct responses | 43 (43.0%) | 31 (44.3%) |
| I Don't Know responses | 31 (31.0%) | 25 (35.7%) |
| Incorrect responses | 26 (26.0)% | 14 (20.0%) |
| Total Responses (N x 10 questions) | 100 | 70 |
| Post‐Quiz Data for 10 Questions | Post‐Quiz | Post‐Quiz |
| Correct responses | 91 (91.0%) | 70 (100%) |
| I Don't Know responses | 0 | 0 |
| Incorrect responses | 9 (9.0%) | 0 |
| Total Responses (N x 10 questions) | 100 | 70 |
Conclusion: Developing DE materials requires a complicated balance of providing critical information, concisely and at an appropriate comprehension level (8th grade). Testing DE materials is an essential step in the development process to ensure the intended knowledge is acquired by the end user population. The next steps for this group will be to pilot the further revised, two‐page DE document at donation sites.
CP102
Effect Analysis of the ‘Rh(‐) Blood Supply Program’ Establishment
HyeSung Han*, DeokJa Oh, BuJa Hur and ChulYong Kim
Korean Red Cross Blood Services
Background/Case Studies: The Rh(‐) blood supply program was developed in 2011 for the purpose of prompt and stable blood supply. Based on the computerized system, the program operates the emergency contact/communication.
This program has 4 major functions such as the request of the emergency blood, the recruitment and management of the Rh(‐) blood donors for the emergency blood donation, real‐time blood supply status monitoring program and statistics program.
The aim of the research is to validate the effect of Rh(‐) blood supply program operations and the responsiveness of the emergency blood supply under the Rh(‐) blood supply program.
Study Design/Method: Researchers investigated the database from 2011 to 2016 after the Rh(‐) blood supply program was developed.
Investigators analyzed and compared the recruitment and blood donation of the Rh(‐) blood donors for the emergency blood donation and securing the blood supply upon request.
Results/Finding: The data shows that the number of voluntary blood donors who pledge to give blood for the emergency blood donation has increased from 5.6% to 21.4% in 2011 and 2016, respectively.
Also, the actual participation rate of Rh(‐) blood donations among the group who pledge to give blood for the emergency blood donation has increased from 26.8% in 2011 to 57% in 2016.
Moreover, the data has indicated that the blood supply has fully met the demand for the emergency blood request.
Conclusion: The result showed that the Rh(‐) blood supply program was effective for the recruitment/management of the Rh(‐) blood donors for the emergency blood donation. This system contributes to recruiting and managing Rh(‐) blood donors who pledge to donate blood and securing Rh(‐) blood in emergency situation .
The institution that needs to meet the demand of rare blood type could possibly use the Rh(‐) blood supply program which leads to securing special type blood.
TABLE 1. The number of Rh(‐) blood donors who pledge to donate blood for the emergency blood donation and real‐time blood supply status
| year | The number ofRh(‐) blood donorswho pledge to donate bloodfor the emergency blood donation | The number ofRh(‐) blood donationsamong the groupwho pledge to donate bloodfor the emergency blood donation | Emergency Rh(‐) blood supply status | ||||
|---|---|---|---|---|---|---|---|
| Rh(‐)blood donors | Rh(‐) blood donorswho pledge to donate blood in emergency situation | Rh(‐) donations | Rh(‐) blood donationsamong the groupwho pledge to donate blood | The number of emergency blood request | The number ofRh(‐) blood donorswho made appointment for the emergency blood donation | The number ofRh(‐) donors who made appointment and participate in blood donation for the emergency blood donation | |
| 2011 | 41,774 | 2,348 ( 5.6%) | 10,087 | 2,700 (26.8%) | ‐ | ‐ | ‐ |
| 2012 | 43,275 | 4,268 ( 9.9%) | 10,835 | 5,787 (53.4%) | 839 | 850 (101.3%) | 805 (95.9%) |
| 2013 | 44,830 | 7,684 (17.1%) | 11,928 | 7,661 (64.2%) | 2,087 | 2,124 (101.8%) | 2,114 (101.3%) |
| 2014 | 46,345 | 8,743 (18.9%) | 12,884 | 7,776 (60.4%) | 2,428 | 2,492 (102.6%) | 2,491 (102.6%) |
| 2015 | 47,667 | 9,463 (19.9%) | 12,458 | 7,227 (58.0%) | 1,698 | 1,727 (101.7%) | 1,725 (101.6%) |
| 2016 | 48,907 | 10,450 (21.4%) | 11,146 | 6,352 (57.0%) | 1,638 | 1,651 (100.8%) | 1,638 (100.0%) |
CP103
Effect of Stratified Recruitment Strategy for Platelet Apheresis Donors
Hanwei Chen*
Wuhan blood center
Background/Case Studies: In China, volunteer blood donors can donate platelets by apheresis (AP) up to 24 times per year. However, the awareness and knowledge of AP donation is much lower than whole blood donation among the Chinese population. There are approximately 1.3 million doses of AP transfused within 1.375 billion people each year In China; It is one challenge to recruit new AP donors and retention them as frequency AP donors in China.
Study Design/Method: One stratified recruitment and retention strategy established and applicate at Wuhan blood center since 2006. Firstly, “one‐to‐one” telephoning model for whole blood donors instead to donate platelet; Secondly, group message for permanent AP donors and had not donated with an interval of more than 180 days in low inventory. Thirdly, specific recruiter telephone for those AP donors who had donated APs for more than 4 times and had not donated for more than 90 days or less than 4 times with an interval of more than 60 days from the last donation; The last one is preparing one letter of thanks for those AP donors who gave more than 8 times annually which advise them to voluntarily come to the blood center for AP donation when they were available.
Results/Finding: Over the past decade, the overall donation time of AP donors increased by 7.46 times from 5550 to 41420 and the doses of AP increased by 7.41 times from 7363 to 54553 within 10 years. The APs collected fulfilled the clinical needs. According to the donation frequency, AP donors were divided into 5 groups: those who donated AP once, those who donated 2‐4 times, 5‐9 times, 10‐29 times, and those who donated more than 30 times, respectively. It was found that the number of permanent AP donors who donated AP more than 30 times was only 965 (2.1%), but they denoted a total of 76432 doses of AP (29.2%) from 2006 to 2016.
Conclusion: APs increased at a rapid and steady pace in Wuhan blood center from 2006 to 2016, which not only met the clinical needs but also were supplied to other region outside Wuhan. And in addition, the permanent AP donors who gained more attention donated the greatest percentage of platelets. In conclusion, stratified recruitment is one effective approaches to meet clinical needs for platelets and worth to popularize to other region.
CP104
Evaluation of Iron Stores By Zinc Protoporphyrin Analysis in Blood Donors
Tania Toffalo1, Richard Gammon*1, Chris Kendrick2 and Patrick Morel2
1Oneblood, Inc., 2Massey University
Background/Case Studies: Zinc Protoporphyrin (ZPP) point of care testing could show iron stores and be a surrogate for ferritin (Fer) testing with blood donors.
Study Design/Method: 12/01/15 – 05/31/16, 328 (192M, 136 F) whole blood and double red blood cell donors, first‐time & repeat, ages 18‐45 and >45 years were evaluated at 4 sites on 2 consecutive donations for finger stick (fs) hemoglobin (HB) per site policy. Venous (ven) and capillary (cap) ZPP and ven ferritin (Fer) were performed per manufacturers’ direction. Donors were assessed for subclinical iron deficiency using ranges (Fer <26 ng/mL and ZPP levels >100 umol/mol heme) at 3 HB levels. Participants completed an online survey between donations to collect data on symptoms of anemia. Univariate linear regression analysis was used to determine relationship between tests.
Results/Finding: Subclinical iron deficiency was present among first‐time and repeat blood donors at all 3 HB levels with both genders and all age groups. (Table) There was a highly significant correlation between fs ZPP and ven ZPP 87.8% (R=0.937) at first and 86.5% (R=0.93) at second donations. At first donation when compared to fs HB, only 10.4% (R=0.323) of variation could be explained by variation in fs ZPP, 12.3 % (R=0.35) by ven ZPP and 9.4% (R=0.307) by ven Fer. At second donation, when compared to fs HB, only 9% (R=0.30) of variation could be explained by variation in fs ZPP, 14.4% (R=0.38) by ven ZPP and 20.1% (R=0.448) by ven Fer. For each donation, variation among tests (fs HB, ven Fer, ven ZPP and fs ZPP) was significant (p<0.001) suggesting strong evidence against correlation. 55% (181) responded to the survey of which 4% (13) reported not feeling well after donation. It should be noted that noted that 1% (3) female study participants reported feeling unwell after the first donation and had ferritin levels below 26ng/mL but the ZPP levels were less than 100 umol/mol heme. Of the 3% (10) male participants that reported not feeling well none had ferritin levels below 26 ng/mL nor ven or fs ZPP levels above 100 umol/mol heme.
| N | 41 | 85 | 202 |
|---|---|---|---|
| Fs HB (g/dL) | 12.5‐12.9 | 13.0‐13.9 | >13.9 |
| Ven Fer (ng/mL)* | 34.12, ±40.40, 7‐243 | 43.46 ± 64.51,7‐451 | 55.64 + 58.96, 10‐451 |
| Ven ZPP (umol/mol)* | 58.8,±24.04, 28‐128 | 54.55 ± 18.55,29‐135 | 45.47 ± 17.19, 20‐168 |
| fs ZPP (umol/mol)* | 62.77,±25.13,44‐135 | 60.73 ± 21.14,32‐172 | 50.75+ 18.8,25‐182 |
Data Shown‐ Mean, Standard Deviation, Range
Conclusion: Subclinical iron deficiency was present at all hemoglobin levels. There was insufficient correlation with fs HB and ven Fer to support use of fs or ven ZPP analysis as measurement of iron stores for blood donors. Symptoms reported by study participants were not consistent with laboratory results.
CP105
Factors Associated with Illicit Drug Use and Non Complinace to Drug Selection Criteria Among Blood Donors
Pierre Robillard*1, Yves Grégoire2, Emelie Laverdiere3 and Elise Roy3
1Hema‐Quebec, 2Héma‐Québec, 3Sherbrooke University
Background/Case Studies: Patterns of drug use have evolved greatly in recent years. Data on drug use among blood donors are necessary to guide the development of relevant donor selection criteria. This study was performed to estimate the prevalence of illicit drug use and associated factors among blood donors and to estimate non‐compliance to our donor selection criteria regarding drugs and its associated factors.
Study Design/Methods: An anonymous online survey was carried out among individuals who gave blood between 09/2015 and 06/2016 for which an email address was available. Participants completed a questionnaire assessing: a) socio‐demographic characteristics; b) use of illicit drugs in the previous 12 months; c) cocaine snorting in the previous 6 months; d) drug injection in the previous 12 months and lifetime. Prevalence rates were calculated according to age, sex, region of residence and first‐time donor status. Overall prevalence rates were weighted according to the source population distribution of gender, age and first‐time donor status during the study period. Logistic regression analyses were carried out to study correlates of drug use and of non‐compliance.
Results/Finding: Of the 35,850 donors contacted, 11,760 completed the survey (participation rate: 32.8%). Of them, 173 were excluded because of incomplete answers. Of the 11,587 participants, 47.4% were female vs 48.2 % in source population (p = 0.12), 4.3% first‐time donors vs 19.3% (p < 0.0001), and 11.8% < 25 years old vs 22.2% (p < 0.0001). Overall rate of any drug use was 9.4% (weighted rate 13.5%). Cannabis was most frequently used (12.7%) followed by ecstasy (1.2%), hallucinogens (1.1%), cocaine (1.1%), and amphetamines (1.0%), other drugs (< 1%). Lifetime and past year drug injection (DI) were reported respectively by 0.1% and 0.01% of donors. Non‐compliance to lifetime DI or past 6‐month cocaine snorting criteria was 0.38%. Multivariate analyses are presented in table. Factors significantly associated with drug use were: male gender, young age and living in a large urban area whereas male gender and young age were associated to non‐compliance.
Conclusion: The prevalence of drug use among blood donors was not negligible. The impact of non‐injection drug use on blood safety is unknown. Despite being deferral criteria, lifetime drug injection or past 6‐month cocaine snorting were reported by 0.38% of donors. However, it is likely that our donor selection process is effective in excluding high risk drug users given our very low rates of transmissible disease markers.
| Proportion using drugs | Factors associated with drug use | Factors associated with non‐compliance | ||||
|---|---|---|---|---|---|---|
| % | p‐value | OR | 95% CI | OR | 95% CI | |
| Gender | ||||||
| Male | 8.7 | 0.014 | 1.3 | 1.2‐1.5 | 2.9 | 1.5‐5.6 |
| Female | 10.1 | ‐ | ‐ | |||
| Age | ||||||
| 18‐24 | 31.2 | <0.001 | 15.2 | 12.5‐18.4 | 11.9 | 4.9‐28.8 |
| 25‐49 | 12.2 | 4.6 | 3.9‐5.5 | 4.4 | 1.9‐10.2 | |
| 50+ | 3.0 | ‐ | ‐ | |||
| Donor type | ||||||
| Ist time | 20.5 | <0.001 | 1.2 | 0.9‐1.5 | 1.5 | 0.6‐4.0 |
| repeat | 8.9 | ‐ | ‐ | |||
| Area | ||||||
| Large urban | 14.6 | <0.001 | 1.6 | 1.3‐1.8 | 1.5 | 0.8‐3.0 |
| Other | 8.4 | ‐ | ||||
CP106
Fear is Related to Risk of Fainting Among Blood Donors: A Retrospective Analysis Confirms the Association Even If We Don't Ask Them to Talk about It.
Christopher R France* and Janis L France
Ohio University
Background/Case Studies: Asking prospective blood donors about donation‐related fears is the first step in helping them to cope. Unfortunately, blood collections staff are typically reticent to make such inquiries due a belief that this causes donor distress and increases the risk of fainting. The present study tested the hypothesis that fear is related to risk of fainting independent of pre‐donation assessment.
Study Design/Method: An anonymous online survey was conducted among individuals who reported donating blood within the previous 30 days (N=1244; 47.4% Female; Mean Prior Donations = 5.6, SD = 3.3; 18.0% First‐time donors). Respondents answered a series of questions about their most recent donation, including pre‐donation fear of having blood drawn and donation‐related faint and pre‐faint reactions. Using logistic and linear regression analyses, fear was related to fainting and pre‐faint reactions while controlling for donation experience.
Results/Finding: Relative to those who rated their pre‐donation fear as 0 (“not at all afraid”), fearful donors had higher odds of reporting that they fainted (1 “somewhat afraid” OR = 2.25, CI 1.17‐4.35; 2 “moderately afraid” OR = 2.67, CI 1.27‐5.61; 3 “very afraid” OR = 3.79, CI 1.68‐8.57; 4 “Extremely afraid” OR = 11.18, CI 5.13‐24.38). Similarly, fear ratings were positively related to reported intensity of pre‐faint reactions (Beta = 0.54, p<0.001).
Conclusion: Although caution is needed in interpreting retrospective data due to possible reporting bias, the present findings suggest that routine pre‐donation fear assessment may help to identify donors who are at increased risk for syncopal reactions.
CP107
Impact of the Food and Drug Administration's (FDA) May 2016 21 CFR Part 600 “Final Rule” on Donations
Louis M. Katz*1 and Christopher J Gresens2
1Americas Blood Centers, 2BloodSource
Background/Case Studies: On May 23 2016, a final rule from FDA amending 21 CFR part 600 became effective that changed minimum hemoglobin (Hb) levels for males and vital sign (VS) extremes required to qualify donors. The minimum male Hb was raised from 12.5 to 13.0 gm/dL. FDA imposed specific VS ranges for acceptable pulse (P) and blood pressure (BP), removing center‐by‐center discretion. A survey of members of America's Blood Centers (ABC) was performed to assess the impact on donor deferrals resulting from these changes.
Study Design/Method: Online survey software (SurveyGizmo, Boulder, CO) was used to solicit collections and deferral information from 59 blood centers over two intervals, July‐Dec. 2015 and July‐Dec. 2016 (i.e., before and after the implementation deadline for the final rule respectively). Information on deferral at presentations for whole blood (WB) donations and apheresis platelet (AP) donations was requested for Hb thresholds and VS. The information was stratified by gender (male=M, female=F), and ABO type. Statistical analysis included t‐tests for numerical and chi‐square for categorical data (Minitab 17.0, Chicago IL). P <.05 was considered significant.
Results/Findings: Data were provided by 40 of 59 centers invited, representing 2,420,886 and 2,945,802 WB donations and 272,094 and 319,161 AP donations in aggregate during the two intervals respectively. Gender and ABO distributions appeared representative of the US donor base. Among M WB donors the rate of deferral rose from 1.5% to 2.9% in the two intervals among aggregated donation attempts (p<.001), and for M AP from 1.8 to 3.5% (p<.001). The mean “by center” deferral rates (table) were similar to that and significant (p<.001). Mean by center Hb deferral rates among F donations during the two intervals were 11.6 and 11.9% (p=0.241) for WB, 11.8 and 13.0% (p=.041) for AP, respectively, absent any change in their acceptable Hb thresholds.
Data on VS deferrals were much sparser. For P deferrals, only 12 centers could provide specific high vs. low vs. irregular pulse deferrals; 27 provided only a summary (i.e total pulse deferrals), and 1 could provide none. For BP, 8 provided detail (high vs. low), 28 summary and 4 none. P deferrals increased in the successive intervals among F WB donors from a center mean of 0.57 to 1.49% (p=.018) and for M WB donors from 0.78 to 1.16% (p=.006). Where details were available, high and irregular pulses were responsible for most of the changes for both genders. BP deferrals were not significantly increased among WB donors, regardless of gender. The data sets and deferral rates re: VS in AP donors were quite small, possibly reflecting culling during their prior donation experience.
Conclusion: Substantial additional donor deferrals attended the increased Hb thresholds for M in the final rule, for both WB and AP. Changes were more modest among female donors, consistent with the absence of changes in allowable Hb levels. Modest but significant changes attended more stringent requirements for VS, though data limitations restrict this aspect of the analysis.
TABLE 1. Mean by center percent of presenting donors deferred
| Hb | July‐Dec 2015 | July‐Dec 2016 | P value |
|---|---|---|---|
| F WB | 11.6 | 11.9 | NS |
| F AP | 11.8 | 13.0 | 0.041 |
| M WB | 1.7 | 2.9 | <0.001 |
| M AP | 2.4 | 3.8 | <0.001 |
| VS | |||
| Pulse | |||
| F WB | 0.57 | 1.49 | 0.018 |
| M WB | 0.78 | 1.16 | .006 |
| BP | |||
| F WB | 0.86 | 0.91 | NS |
| M WB | 1.12 | 1.17 | NS |
CP108
Incidence of Diabetes Among Indian Healthy Blood Donors
Raj Nath Makroo*1, Soma Agrawal2, Manthan Patel3, Mohit Chowdhry4 and Sharmila Verma5
1Department of Transfusion Medicine, Indraprastha Apollo Hospital, 2Department of Transfusion Medicine, indraprastha Apollo Hospital, 3Department of Transfusion medicine, Indraprastha Apollo Hospital, 4Department of Transfusion Medicine, Indraprastha apollo Hospital, 5Department of Biochemistry, Indraprastha Apollo Hospital
Background/Case Studies: Diabetes mellitus is reaching potentially epidemic proportions in India. Given the disease is now highly visible across all sections of society within India, there is now the demand for screening of diabetes and urgent research and intervention ‐ at regional and national levels ‐ to try to mitigate the potentially catastrophic increase in diabetes that is predicted for the upcoming years. Due to its ease of use, several studies have found that HbA1c testing can identify patients in the community who might otherwise go undiagnosed. We took an initiative to find out the incidence of diabetes by random blood sugar (RBS) measurement among Indian blood donors and measure the HbA1c levels among those with RBS >180mg/dL
Study Design/Methods: A prospective study was done at department of Transfusion Medicine and department of Biochemistry from 1st March 2017 to 31st March 2017. Total of 1,861 blood donors were tested for RBS. Those with RBS > 180mg/dl were further tested for HbA1c by gold standard HPLC method using variant II Biorad. Blood donors with >180mg/dl RBS and HbA1c > 6.5% were advised to consult a physician for further evaluation.
Results/Findings: Of the 1,861 donors tested, 44 (2.36%) donors showed a RBS of > 180mg/dl. Forty two (95.45%) were males and 2 (4.54%) females with a mean age of 40.55 years (26‐56 years). Of these, 14 (31.81%) were known case of Type‐II diabetes mellitus (DM) on oral medications and were excluded. Of the remaining 30, 8 (26.66%) of them had a family history of DM. Of these 30 donors, 8 donors did not give a consent for testing for HbA1c. Among the 22 donors tested for HbA1c levels, 16 (72.72%) had HbA1c > 6.5%. All the 16 donors were counselled and referred to a physician for further management. The overall incidence of donors having DM in the population is 0.87% (16 of 1839 donors).
Conclusion: Screening for blood glucose level by targeting the blood donors can go a long way in curbing the diabetes burden on the society.
CP109
Incidence of Low Ferritin Levels in Regular Male Blood Donors with Acceptable Hemoglobin Levels in Singapore
Ramir Alcantara*1, Hwee huang Tan1 and Ai Leen Ang2
1Health Sciences Authority Blood Services Group, 2Health Sciences Authority, Blood Services Group
Background/Case Studies: Iron deficiency is a known complication of regular blood donation. In order to protect the donor's health and prevent iron deficiency, AABB increased the minimum acceptable hemoglobin level for male whole blood and apheresis donors from 12.5 to 13.0g/dl last May 2016. The current minimum acceptable hemoglobin for male donors in Singapore is 12.5g/dl. The aim of the study is to determine the incidence of low ferritin levels in regular whole blood and apheresis male blood donors with acceptable borderline hemoglobin levels (12.5‐12.9) and in donors with hemoglobin 13g/dl and above.
Study Design/Method: During a 4 month period, serum ferritin testing was performed on 350 regular male whole blood and 250 regular male apheresis donors who made at least 3 donations in the last two years with an acceptable hemoglobin level. The donors were divided into groups according to donation type and hemoglobin range; Group A (whole blood with hemoglobin 12.5‐12.9) Group B (whole blood with hemoglobin ≥13, Group C (apheresis with hemoglobin 12.5‐12.9) and Group D (apheresis with hemoglobin ≥13). The serum ferritin levels of the four donor groups were compared and analyzed. A ferritin level below 30 ug/L is considered low and levels below <12 ug/L are considered having absent iron stores.
Results/Findings: 55.1% of donors in the study have ferritin levels below 30 ug/L. There were more donors with low ferritin in group A compared to group B, 80% and 53% respectively (p<0.05). In apheresis donors, low ferritin rates were higher in group C donors compared with group D, 49% and 30% respectively (p=0.001876). Ferritin results for the 4 groups can be seen in table 1.
TABLE 1. Ferritin Level Results
| Ferritin level | Low Ferritin (<30 ug/L) | |||
|---|---|---|---|---|
| Normal | Low (<30 ug/L) | 12‐29.9 ug/L | <12 ug/L | |
| Group A | 35 (20%) | 140 (80%) | 34 (24%) | 106 (76%) |
| Group B | 82 (47%) | 93 (53%) | 57 (61%) | 36 (39%) |
| Group C | 64 (51%) | 61 (49%) | 29 (48%) | 32 (52%) |
| Group D | 88 (70%) | 37 (30%) | 31 (84%) | 6 (16%) |
Conclusion: More than half of the donors in the study have low ferritin and of the donors with low ferritin, more than half or 54.3% have absent iron stores. Donors with low ferritin were immediately informed of their result, given iron supplements and advised to come back for donation after 4 months or more. Since donor health and safety is of paramount importance, measures to limit and prevent iron deficiency in blood donors must be implemented. Due to the high incidence of low ferritin levels in whole blood and apheresis donors with hemoglobin 12.5‐12.9g/dl, it is recommended that the minimum hemoglobin level cut off for male blood donors in Singapore be increased to 13.0g/dl. Other measures to be implemented includes better donor education on the risk of iron deficiency and the need for iron supplementation using our website and social media.
CP110
Knowledge, Attitude and Practice Regarding the Voluntary Blood Donation Among the Young Student Population of Karachi.
Bipin Nepal*
Grande International Hospital
Background/Case Studies: Safe blood is a crucial and irreplaceable component in the medical management of many diseases. The Voluntary non‐remunerated blood donation is the ideal sources of quality blood, which forms less than 15 % of the demand of the blood in Pakistan. Motivation among the youth, particularly students, is essential to make voluntary blood movement more successful.
To assess the knowledge, attitude and practice regarding the voluntary blood donation among the young student population of Karachi so that an effective approach can be made regarding motivation enrolment of voluntary non remunerated blood donors in future in Pakistan
Study Design/Method: A cross sectional prospective study was conducted among 600 students from different universities and colleges of Karachi. A well‐structured and pre‐tested questionnaire, in English, was used to access the knowledge, attitudes and practices about voluntary blood donation. A scoring mechanism was used to understand overall knowledge level. Obtained data was analyzed.
Results/Finding: The sample population consisted of 54% male and 46% female students in the age group of 18‐28 years. Only 65 % of the students have heard about voluntary blood donation and 28 % of the students have given blood once in their lifetime and among them 19 % are blood donors at the moment. 42 % of the participants believed that there is a specific reason why they don't donate blood and 59 % believed that there is a risk involved for the donors, when donating blood. 80 % students wanted to promote voluntary blood donation. Fear and lack of awareness on blood donation are the reasons for not donating blood. Students gather information about voluntary blood donation from several sources mostly schools, colleges, family and friends.
Conclusion: This study shows how increasing awareness and marketing through different ways can boost the culture of voluntary blood donation in society. Despite having the good knowledge about voluntary blood donation, very few students have donated blood. Blood donation education should begin at school level and courses should include blood donation drive. Student population can be motivated to participate in different ways. There is a dire need to mobilize the electronic media for educating our youth about voluntary blood donation due to its access to masses.
CP111
Reduced Deferral Rate Using an Ultrasound Technology‐Based Hematocrit Measuring Device
Karen Mower*
San Diego Blood Bank
Background/Case Studies: Previously, donor eligibility was assessed in our facility by testing capillary blood from donor candidates in the HemoCue Hb 301B System (HC). Donor candidates with hemoglobin values greater than or equal to 12.5g/dL were eligible for donation. We validated a new hematocrit measuring device, the UltraCrit (UC, from Separation Technology, Inc., STI) and implemented it as our test method of record in July, 2016. Nine months of deferral rate data with the UC, based on a cut‐off of hematocrit values greater than or equal to 38%, were used for comparison with our prior method of record.
Study Design/Method: The UC ultrasound based system was subjected to an Instrument Validation protocol approved by our Quality Assurance Department. The nine months of deferral data for both methods are based on single determinations on capillary blood samples and application of the above stated cut‐off values.
Results/Finding: The UC hematocrit measuring system met the manufacturer's specifications during the validation process (installation, operational and performance qualifications). Precision and accuracy testing yielded results that supported the decision to implement the UC as the method of record in our blood bank in July, 2016. The HC 301B was the method of record for all testing in October, 2015 through June, 2016. During this time, 7,218 donor candidates out of 83,647 tested had results below 12.5g/dL, for a deferral rate of 8.6%. 46,246 out of 83,647 total (55%) were tested in mobile units; the deferral rate for this population was 8.6%. The data from the UC testing for nine months post implementation on July 1, 2016 yielded a deferral rate of 6.5%, with 5,370 deferred out of 82,144 tested. The deferral rate at mobile units using the UC was 6.3%, for 44,906 out of the total 82,144 tested (55%). On an annual basis, this decrease in deferral rates translates to a collection of an additional 2,300 units per year.
Conclusion: The comparison of deferral rates during a nine month period since the UltraCrit was implemented to the nine months prior to the implementation demonstrates a significant decrease in deferral rates based on hemoglobin and hematocrit test results. The decrease in deferral rates was observed in both mobile unit collections and fixed facility collections. The decrease in deferral rates over nine months has contributed to a significant increase in units collected.
CP112
Results of a Pilot Program of Iron Supplementation for Double‐Red Blood Cell Donors
Gilles Delage*, Yves Grégoire and Isabelle Rabusseau
Héma‐Québec
Background/Case Studies: Double red blood cell donations (DRBCD) can lead to depleted iron stores, especially in frequent donors. Iron supplementation has been shown to prevent iron depletion secondary to blood donation. A pilot study of iron supplementation was carried out in one of the donor sites in order to evaluate feasibility of such a program. The following parameters were measured: acceptance of, tolerance of and compliance with supplementation, effect on ferritin levels and rates of DRBCD.
Study Design/Method: The study design was an open trial. Only donors who had made at least one successful DRBCD were solicited. Once informed consent had been obtained, donors were given 100 tablets of ferrous sulfate 300mg (60mg elemental iron) at each visit for a DRBCD, and instructed to take one tablet per day. Information on side effects and on precautions to take with the supplements were given. At each visit, ferritin levels were measured since routine ferritin monitoring is in place at that donor site, and questionnaires on compliance with supplementation and side effects were filled out.
Results/Finding: 294 donors who chose to participate and for whom we had at least 2 ferritin measurements constituted the participants; 177 donors who refused participation served as the control group. All but one donor were male. Age distribution and the number of previous RBC donations of participants and controls were similar. However, participants gave more RBC donations per year then controls during the study: 49.8% of donors vs only 39.5% of controls gave ≥5 RBC/year (p=0.032). Compliance (defined by taking ≥75% of tablets) varied from 59 % in the first course to close to 100% in those who took 3 or 4 courses. Questionnaires were filled out for 494 courses of supplementation: in 356 courses no adverse effects were noted. The most frequent side effects reported were constipation (73), dyspepsia (22), diarrhea (18), nausea (8), black stools (21); miscellaneous effects were reported in 23 courses. Side effects led to interruption of supplementation in 55 instances. Ferritin levels (MGT±SD) at entry into the program and at the last visit were 48.9 ± 2 and 65.4 ± 1.7 µg/L in participants, vs 64.1 ± 2.2 and 56.3 ± 2.2 µg/L in controls. The positive impact of iron supplementation on ferritin levels was observed only in those who took ≥75% of the tablets. Ferritin levels<26µg/L were found in 4,8% of participants and 14.7% of controls. Deferral for low hemoglobin was below 1% in both groups.
Conclusion: An iron supplementation program in a DRBCD program is feasible.However, when taking into account acceptance to participate and compliance with supplementation, only 50% of donors obtain full benefit from such a program. Using an iron preparation which is better tolerated may increase compliance.
CP113
Source Plasma Donors: A Snapshot
George Brooks Schreiber* and Mary Clare Kimber
Plasma Protein Therapeutics Association
Background/Case Studies: Knowledge of Source Plasma (SP) donor demographics sheds light on the plasma collection industry. Many misperceptions abound pertaining to plasma donation. Knowing basics such as donor age, weight, and donation frequency helps understand who donates. Thus, plasma industry donation data were analyzed to provide a donor profile. Information about SP donation volume and frequency have previously not been available.
Study Design/Methods: An industry‐wide collection of donor demographic data for 2012 on approximately 1.5 million donors and 25.2 million donations from 7 participating companies were analyzed. The data included age, weight, and gender of donors, and how often they donated. Donation volume limits, set by FDA memorandum, are weight dependent. The collection volume (plasma and anticoagulant) for a donor 110‐149 lbs is 690ml [GI]; 150‐174 lbs, 825ml [GII]; and 175+ lbs, 880ml [GIII]. Donation distributional statistics are presented.
Results/Findings: Overall, 61% of SP donors are male. Thirty percent of total donations are given by donors age 25‐34, and about 55% by donors <35 years old. The overall donation rate is highest for 55‐64 year olds, 31/year. For those weighing 110‐129 lbs, 71% are female; in those 130‐149 lbs, female and male percentages are approximately equal (49%); and ≥150 lbs, a greater percentage is male (e.g. 71% male at 350+ lbs).
Overall, the highest percentage of female and all donors weigh 150‐174 lbs. For males, the highest percentage of donors weigh 175‐199 lbs. Donation frequency increases with increasing weight: 10 donations for the lightest donors vs. 17.3 for those 300‐349 lbs. The highest donation rate for both females and males is for those weighing 300‐349‐lbs: though they comprise a small percent of donors.
Sixty‐two percent of donors fell in GIII; 22% in GII; and 16% in GI. Sixty‐six percent of donations were made by GIII donors; 21% by GII; and 13% by GI. Of the total volume collected, 69% was donated by GIII donors; 20% by GII; and 10% by GI. Of male donors, 42.3% are 200+ lbs (35.9% of US male population); 13.5% are 250+ lbs (9.2%); and 3.3% are 300+ lbs (2.5%). Of female donors, 35.0% are 200+ lbs (20.6% of US female population); 11.6% are 250+ lbs (6.1%); and 2.7% are 300+ lbs (1.7%).
The average number of donations per donor was 17.5in 2012. For the 12 months from their last donation the number increased to 21.4; 49% of donors made ≤10 donations; 14% made >50; and 0.3% made >100.
Conclusion: In contrast to blood donors, the majority of plasma donors are male. Young donors, <35 years old, who provide fewer donations than older donors, make the majority of donations. Heavier donors donate the most frequently. Frequent donors are essential to achieving critical plasma supplies for manufacturing essential lifesaving protein therapies.
CP114
Status of a Successful Hospital‐Based Blood Center Hemochromatosis Donor Program: 16 Years Later
Cathy Conry‐Cantilena*, Kamille West, Yu Ying Yau and Susan Leitman
National Institutes of Health
Background/Case Studies: Hereditary Hemochromatosis (HH) patients are permitted to donate blood for the allogeneic blood supply as long as they are eligible for donation under 21CFR630.10 and the collection is a physician‐ordered therapeutic phlebotomy. Blood collections Establishments do not need an exception or alternative under § 640.120 to make a collection under this provision if the requirements set forth in § 630.15(a)(2) are met. The objective is to describe current HH donors and long‐term contributions of to our hospital‐based donor center and hospital blood supply.
Study Design/Method: In 2001, an IRB protocol was approved for the enrollment and therapeutic phlebotomy of HH patients/subjects. This required filing an FDA variance to permit HH donor blood for use in our allogeneic supply without disease labeling. The frequency of therapeutic bleeds are guided by routine clinical assessment, MCV/hemoglobin, serum ferritin, and transferrin % saturation monitoring. Serum ferritin levels of 50 – 75 ng/mL are targeted for maintenance phlebotomy. Operationally, a custom, computerized database application is employed to ease phlebotomy management.
Results/Finding: Since inception, the cumulative number of HH subjects enrolled in the hemochromatosis protocol reached 547, of whom 365 (67%) are C282Y homozygotes. Without active recruitment, accrual rate is about 7 per quarter, with 69% of subjects qualifying as allogeneic donors. The mean current age is 59.7 years, 65% male, 96% Caucasian. The majority of HH donors (276 of an active cohort of 318) are in the maintenance phase of therapy with an average of 2.6 donations/year and a 4% deferral rate. Over the last 5 years, HH donors contributed approximately 8‐11% of the hospital's allogeneic blood supply, averaging 475 whole blood units for transfusion per year. Moreover, HH donor's whole blood (WB) donations provided 30‐40% of blood for in vitro research at our institution with an average of 180 WB research donations/year. There have been no HH donor‐derived transfusion‐transmitted infections over 16 years. Since 5/23/16, with an increase in male Hgb deferral threshold to 13g/dl, there has been only 1 HH male deferral from blood donation.
Conclusion: A simple, safe system for donor evaluation, phlebotomy management, and transfusion of blood drawn from HH subjects was established. Blood donated by HH donors remains an important resource at our hospital. HH donors benefit from careful medical follow‐up of their iron status. This mutually beneficial relationship is feasible and sustainable.
CP115
Testing for Accuracy of Non‐Invasive Blood Hemoglobin Methodology in a Blood Donor Setting
Michele Walker*, Sharon Garcia and Mythili Ram
Gulf Coast Regional Blood Center
Background/Case Studies: The objective of the study was to assess the accuracy of hemoglobin (Hb) levels measured on the OrSense NBM‐200 non‐invasive occlusion spectroscopy device by comparing them to Hb levels measured on venous samples with a laboratory hematology analyzer. In addition, the study examined operator ease of use and donor satisfaction with a finger stick‐free method.
Study Design/Method: Study procedures and protocol, including acceptance criteria, were defined in conjunction with the device manufacturer to determine the standard deviation (SD) of the difference between the NBM‐200 non‐invasive sample results and the Sysmex hematology analyzer venous sample results. Staff were provided training on the use of the NBM‐200 non‐invasive occlusion spectroscopy device. Over a span of 7 days, 200 eligible blood donors, both male and female, were first screened by the NBM‐200 non‐invasive occlusion spectroscopy device followed by performance testing utilizing a capillary blood screening method. A venous sample was collected from each of the 200 blood donors for the performance of Hb measurement on the Sysmex hematology analyzer within 1‐3 hours of collecting the venous samples.
Results/Finding: The SD of the difference between the NBM‐200 non‐invasive sample results and the Sysmex hematology analyzer venous sample results was not to exceed 1.1g/dl. The Hb measurements obtained from the NBM‐200 and the Sysmex hematology analyzer were analyzed using the statistical software Minitab and the SD of the difference was reported to be 0.978g/dl. The precision of the NBM‐200 yielded a co‐efficient of variation of .02g/dl and a standard deviation of .33g/dl.
Conclusion: The operators found the NBM‐200 easy to install, maintain, and operate with minimal training. The NBM‐200 non‐invasive occlusion spectroscopy technology showed accurate performance compared with the venous sample results. It was comparable to the capillary finger stick method and deemed suitable for screening donors. Donors were satisfied with the process and appreciated the safe, painless methodology.
CP116
Using a Motivator and Deterrent Questionnaire to Predict Actual Donation Return Behavior Among First‐Time Black Blood Donors in South Africa
Ronel Swanevelder1, Ravi Reddy1, Dhuly Chowdhury2, Don Brambilla2 and Edward L. Murphy*3
1SANBS, 2RTI International, 3UCSF/BSRI
Background/Case Studies: To maintain an adequate blood supply, South African blood centers need to collect more blood from their majority Black African population. Success in recruiting first‐time Black blood donors has been tempered by lower suboptimal return rates.
Study Design/Method: We performed a prospective cohort study of first‐time, Black blood donors donating during a four‐month period in 2014 and followed them for one year. Within 56 days post donation, a questionnaire including questions on blood donation motivators and deterrents was administered by telephone. Questions used 4‐point Likert scales to assess agreement with statements relating to domains of altruism, collectivism, self‐esteem and marketing derived from local focus groups (Muthivhi etal. 2015). Linking questionnaires to a blood donation database allowed logistic regression analysis to predict return for a second donation within one year.
Results/Finding: We included 2,902 first‐time Black donors with median age 23 and female predominance (59%). Within one year, 1,786 donors (62%) attempted at least one additional donation. When Likert scales were analyzed as an ordinal variable (4= strongly agree to 1= strongly disagree), donor return was associated with the following motivators “Blood donation is an easy way to make a difference” (odds ratio for each Likert increment (OR) = 1.16, 95% CI 1.06‐1.28), “I donated in response to adverts/campaigns on the radio, TV or newspapers” (OR=1.11, 95% CI 1.00‐1.23). Responses to altruism‐associated statements were not associated with return. Among deterrents, donors were less likely to donate if they agreed with the statement “I am afraid of the sight of blood” (OR=0.83, 95% CI 0.72‐0.96) and “I wasn't treated well by the <blood center> staff” (OR=0.85, 95% CI 0.74‐0.97). Surprisingly, donors were more likely to return if they agreed with the statement “I was afraid of finding out about my HIV status” (OR=1.19, 95% CI 1.03‐1.37). A secondary analysis treating the Likert scales as 4‐level categorical variables revealed generally similar results, with the additional finding that donors who disagreed with the statements “If I give blood then blood will be available when I need it” and “I don't know where the nearest blood collection point is” were more likely to return.
Conclusion: This novel design allowed us to study the link between donation motivators and deterrents and actual rather than intended return for donation. It is interesting that self‐esteem and marketing predicted return better than altruism. Fear and poor customer experience are recognized deterrents which could be addressed. We plan to use these data to construct Black donor recruitment interventions which may be tested using randomized trial designs.
CP117
Willingness to Donate Blood during the Summer
Christopher D Bernard1, Ramya Ghantasala1, Obhijit D Hazarika1, Nicole Leonard1, Cori A Polonski1, Zachary B Wunrow1, Michelle Heleba2, Jan K Carney1 and Mark K Fung*1
1University of Vermont Larner College of Medicine, 2American Red Cross Blood Services
Background/Case Studies: Each year donation rates fall in the summer months straining blood banks’ capacities to meet local demands. In hopes of identifying factors to increase summer donations, our study investigated donor reported barriers which influence summer donations habits.
Study Design/Method: An anonymous 16 question survey investigating various donation factors was administered across multiple blood donor centers in a state‐wide region. Questions addressed donor demographics, frequency of blood donation, preference in appointment making modalities including smartphone app use, summer travel habits, willingness to donate during vacation, and factors that deter donors from donating on vacation.
Results/Finding: A total of 292 surveys were received. Survey respondents across multiple demographic groups cited similar barriers to summer donation, namely “Too busy” (27.5 %) and “Traveling is a time for me to relax.” (30.6 %). Of the respondents who travel in the summer, very few reported donating while traveling (3.4 %). Summer donation rates between summertime travelers (36.5 %) and non‐travelers (36.4 %) were essentially equivalent. The most preferred methods of scheduling appointments were via the regional blood donor center website (45.6 %) and phone (28.4%). Willingness to use a regional blood donation smartphone app was highest among respondents ages of 18 to 34 (45‐55%) and lowest among ages 55 and older (13‐15%). Of respondents with no prior knowledge of summer seasonal shortages (22 %), 2/3rds indicated newfound motivation to donate.
Conclusion: Regardless of travel, increasing awareness of summer shortages may increase summer donations. Use of donor websites and smartphone apps may be instrumented as part of recruitment efforts.
Immunotherapies: Collection, Processing, Storage and Clinical Applications
CP118
Peripheral Blood Mononuclear Cells from Buffy Coats Processed from Healthy Whole Blood Donors for the Production of Third Party Viral Specific Cytotoxic T Lymphocytes
Fleur M Aung*, Benjamin Lichtiger, Indreshpal Kaur, Muharrem Muftuoglu, Elizabeth Shpall and Katy Rezvani
The University of Texas MD Anderson Cancer Center
Background/Case Studies: Viral infections (Adenovirus, EBV, CMV, BK, HHV6, and RSV etc.) have been implicated as major contributors to post‐transplant morbidity and mortality in Hematopoietic stem cell transplantation (HSCT) from unrelated donors. Investigators have shown that in‐vitro expanded virus specific cytotoxic T lymphocytes (CTLs) generated from donors with specificity for one or more viruses are safe and effectively treat viral infections in the HSCT setting in recent clinical trials. Present clinical trials have shown that CTLs can be rapidly produced by a single stimulation of donor peripheral blood mononuclear cells (PBMCs) with a peptide‐mixture spanning the target antigens in the presence of potent prosurvival cytokines interleukin‐4(IL‐4) and IL7. Others have used banked third party Epstein Barr Virus (EBV)‐specific CTLs generated from third party EBV‐seropositive blood donors with encouraging results.
Study Design/Methods: Eligible and consented Blood donors were tested for CMV antibodies by serology. CMV‐seropositive Whole Blood (WB) units underwent buffy coats processing from non‐leucocyte reduced WB units collected in Fenwal triple Blood‐Packs™ that underwent 2 hard spins at 3800rpm for 7 minutes with separation after each spin on a CompoMate®G5. Plasma and buffy coat was separated from red cells after the first spin. The second spin lead to the separation of the buffy coat from plasma. The buffy coats were submitted to the GMP Stem Cell Lab for processing of Cytomegalovirus‐specific CTLs. HLA typing at high resolution for HLA‐A/‐B/‐DRB1 loci was obtained for all donors.
Results/Findings: Forty five eligible healthy blood volunteers (13M [29%]: 32 [71%] F); median age 42 years (range 21‐70) donated a unit (500mL) blood from which buffy coats (average volume 56ml) were processed. The buffy coat process was previously validated on 20 WB units. The mononuclear cells (lymphocytes and monocytes) recovered from the buffy coats are listed in figures 1 and 2. All of the buffy coats received by the GMP Stem Cell Lab were adequate in cell numbers to be processed.
Conclusion: The processing of buffy coats from whole blood is a viable option for the concentration of PBMCs specifically for production of viral specific CTLs as third party off the shelf products as well as use in other research projects that require PBMCs from healthy adults.
Figure 1. Average number of cells/uL in Whole Blood
| Avg # of Cells/uL (WB) | Healthy Donors (n=45) |
|---|---|
| White Blood Cells | 7.1 |
| Lymphocytes | 2.4 |
| Monocytes | 0.5 |
| Granulocytes | 4.3 |
| Platelets | 238 |
Figure 2. Percent Recovery of WBCs and Platelets
| % Recovery | Healthy Donors (n=45)% |
|---|---|
| White Blood Cells | 46 |
| Lymphocytes | 65 |
| Monocytes | 97 |
| Granulocytes | 32 |
| Platelets | 41 |
References
1 Gerdemann U, Keirnan JM, Katari UL etal. Rapidly Generated Multivirus‐specific Cytotoxic T lymphocytes for the Prophylaxis and Treatment of Viral Infections Mol Ther 2012 ; 20: 1622‐32
2 Haque T, Wilkie GM, Jones MM etal. Allogeneic cytotoxic T‐cell therapy for EBV –virus positive posttransplantation lymphoproliferative disease: results of a phase 2 multicenter clinical trial Blood 2007; 110:1123‐31
3 Wilkie G, Taylor C, Jones M etal. Establishment and characterization of a bank of CTL for immunotherapy of EBV‐associated disease J Immunother. 2004; 27: 309‐316
4 Dey M, Williams‐Lara, etal. Transfusion, 2017 (56) Supplement S4, Abstract #SP48
Patient Blood Management
CP119
A Journey of Educational Transformation and Organizational Blood Management
Robert Raggi*, Karen Klein and Mark Domantay
Providence Holy Cross Medical Center
Background/Case Studies: The goal of this presentation is to describe the journey and challenges towards TJC, Patient Blood Management (PBM) Certification. Transfusion‐related health risks and increasing economic pressures have driven hospitals to recognize evidence‐based blood management as an important cost‐saving strategy. Providence Holy Cross Medical Center (PHCMC), as the Providence California Region alpha site, has embarked on this journey. Our goals are PBM certification and reduction of the number of unnecessary transfusions by 20% within 12 months of the program launch while improving patient outcomes. This paper will discuss our journey toward certification and the various hurdles being overcome.
Study Design/Method: TJC, AABB, and the Society for the Advancement of Blood Management have served as our primary resources for identifying current evidence‐based transfusion practices and management methods. We needed to identify our organizational gaps in data gathering and analysis. Then we could determine baseline performance and set improvement targets. From our internal assessment, we learned we had to start from scratch as we had no easily accessible data metrics and gaps in education to our staff. We took the following steps to develop our PBM program:
Formed an interdisciplinary PBM team consisting of physicians, nurses, blood bank staff, and data analysts
Constructed a report on RBC transfusions to help identify outliers and opportunities
Added a system‐wide best practice alert for RBC transfusions
-
Updated the peer review triggers for Transfusion Committee
Transfusion decisions should consider patient condition in addition with labs
Transfusion of a single RBC unit is often sufficient
Hgb<9.0g/dl in pre‐operative patients undergoing procedures associated with major predictable blood loss
Hgb<8.0g/dl in patients with cardiovascular disease, post‐operative patients following cardiovascular or orthopedic surgery, and critically ill patients
Hgb<7.0g/dl in hemodynamically stable patients, including critically ill patients
-
Developed an education plan:
CME lectures on blood mgmt/bloodless medicine
Presentation to Providence CA Region/System leadership and Providence System Blood Administration & Tracking team
Revision of educational letters
SNF Collaborative
Creation of two modules on transfusion safety and the new Blood Product Administration Module
Physician education acknowledgement letter
PBM Index Card ‐ Appropriate Guidelines
Results/Findings:
Data from Apr16 to Mar17:
RBC Transfusion Criteria Compliance rate increased from 62% to 75%
RBC Transfusion Volume decreased from 355 units/month to 266 units/month, a 25% reduction
RBC Transfusions per 1000 patient days decreased from 58.9 to 51.4
Conclusion: Regional leadership and local ministry leadership support provided the foundation for the success of the PHCMC PBM team. The program continues to collaborate with business leaders throughout the organization to identify, prioritize, and optimize evidence‐based transfusion care. By providing and reinforcing education, we have increased our RBC transfusion compliance rate by 13%. We decreased RBC transfusion volume by an average of 89 units per month. And we have reduced the number of RBC transfusions per 1000 patient days by 7.5 units/1000 pt. days. We have demonstrated that our investment in education was in the best interest for our organization and our patients.
CP120
An International Survey on the Use of the Maximum Surgical Blood Ordering Schedule
Mark Yazer*1, Meghan Delaney2, Nancy M. Dunbar3, Jose Kutner4, Mike Murphy5, Ryszard Pogłód6, Vered Yahalom7, Claudia S. Cohn8 and on Behalf Of The BEST collaborative9
1University of Pittsburgh, 2Bloodworks NW, 3Dartmouth‐Hitchcock Medical Center, 4Einstein medical center, 5Oxford University Hospitals NHS Foundation Trust, 6Instytut Hematologii i Transfuzjologii, 7Blood Bank, Rabin Medical Center, 8Department of Laboratory Medicine and Pathology, University of Minnesota, 9Dartmouth University
Background/Case Studies: The maximum surgical blood ordering schedule (MSBOS) is a list of surgical procedures performed at a hospital along with a recommendation for pre‐transfusion testing and RBC allocation before each surgery. The extent to which hospitals have an MSBOS and its design was explored in this survey.
Study Design/Methods: The survey was designed, piloted and refined by members of the BEST collaborative and invited colleagues. It was then encoded in online survey software and the link distributed to BEST members and colleagues who were encouraged to respond and to further distribute it. The survey was open for 34 days.
Results/Findings: There were 158 completed responses, of which 73 (46%) indicated that their hospital had an MSBOS and 85 (54%) did not. The majority of hospitals without an MSBOS were academic centers (36/85, 42%) from Oceania (26/85, 31%) or Europe (23/85, 27%), had between 500‐999 beds (30/85, 35%); the majority of these hospitals transfused between 1,001‐4,999 RBCs (21/85, 25%) per year. 15/85 (18%) are going to implement an MSBOS in 2017. Of those with an MSBOS, the majority 23/73 (32%) were from North America. The majority were academic hospitals (39/73, 53%) with 500‐999 beds (43/73, 59%) that transfused ≥20,000 RBC units per year (21/73, 29%) offering a wide range of surgical services. On average there were 207 ± 577 procedures listed in the MSBOS’. The MSBOS recommended no pre‐transfusion testing for a mean of 30% of the procedures listed, a pre‐operative type and screen for 38%, crossmatching RBC units for 28%, and for 4% of procedures a different recommendation was made. Most (32/73, 44%) of the MSBOS’ were created by a combination of obtaining consensus between the surgical services and blood bank and use of procedure‐specific transfusion data; only 5/73 (7%) of MSBOS’ were created solely by using procedure‐specific data, and most (35/73, 48%) do not use patient‐specific data in making a testing recommendation. Most MSBOS’ are updated less frequently than annually (30/73, 41%), and the hospital transfusion committee is often (39/73, 53%) involved in updating it. The MSBOS’ are generally available electronically in both the operating rooms and in the blood banks. It was the opinion of the majority of respondents (30%) that the MSBOS was used regularly by only a limited number of surgeons and anesthesiologists, 23% of respondents felt that it was regularly used by all surgeons and anesthesiologists; 10% felt that it was not used at all at their hospital, 36% did not respond.
Conclusion: An MSBOS was available in only about half of the respondent's hospitals and in only the minority of cases was it felt to be regularly used. However, 18% of the hospitals currently without one indicated that it would be implemented in 2017 suggesting that these hospitals perceive the value of having one in place. Implementing and following an MSBOS can be an important step in peri‐operative patient blood management and in streamlining the operations of the blood bank vis‐a‐vis pre‐operative testing.
CP121
Blood Management – One Hospital System Experience
Leana Serrano Rahman*, Mallika Gupta, Susan Solometo, Ronald Walsh and Joan Uehlinger
Montefiore Medical Center
Background/Case Studies: Our system, a Pioneer ACO, is a 1490‐bed tertiary‐care referral center dedicated to serving patients from across the New York City area and beyond. The comprising four hospitals see 93,000 hospital admissions and nearly 300,000 emergency department visits annually. We have active programs in high risk OB, stem cell transplant, solid organ transplant (heart, liver, and kidney), CT surgery, ECMO, oncology and critical care. Transfusion Medicine plays a key role in the support of these services.
Blood product spending in 2015 was approximately $15.8M. In Nov. 2015, an interdisciplinary committee was created in an effort to improve patient care (by reducing blood product exposure) and reduce blood product expenditures. The Vice President‐sponsored multidisciplinary committee was composed of representatives of: Surgery, Anesthesia, Blood Bank, Pediatrics, Perfusion, Cardiothoracic Surgery, Critical Care, Medicine, and Emergency Department.
Study Design/Method:
First Important Step: “Know your numbers”‐
Although the committee had multiple sources of data, there was no “one report” that could display all of the pertinent information. Baseline numbers were imperative to the committee's ability to effect change. A home grown one time only report revealed which services and clinicians were the highest volume users. The initial plan was to target their use with education. An initial goal was set to reduce expenditure by $1.2M.
The journey continued with regular bimonthly meetingsto brainstorm strategies and monitor utilization. Utilization was analyzed using a home grown crystal report “Transfused Patients by Location”. This report was further compared to utilization patterns (2014 and 2015), by “dollars spent” and “total units per patient” by the project manager using excel.
Key Initiatives developed by the committee
Development of evidence based transfusion triggers.
Education on evidence based transfusion triggers across multiple campuses, specialties and resident programs
Clinical Information System (CIS) “soft stops” when ordering blood products outside guidelines. RBC order set defaulting to “1” unit instead of “2” units.
Updated guidelines posted to easy to find internal intranet spots
Results/Finding: Despite higher patient volumes and a more complicated patient mix in 2016, we were still able to reduced blood product expenditures by $933,874 when compared to 2015.
Conclusion: In spite of limited resources, the committee was able to effect change by capitalizing on current stakeholders fully supported by leadership and project management.
CP122
Cord Blood Pathway to Reduce Iatrogenic Blood Loss in Neonatal Intensive Care Patients
Tracy Shachner*1, Anna W Rains2 and Christopher T Clark3
1University of Tennessee Graduate School of Medicine, 2Univeristy of Tennessee Medical Center, 3Univeristy of Tennessee Graduate School of Medicine
Background/Case Studies: Anemia due to iatrogenic blood loss in preterm and low birth weight infants is a major contributory factor leading to red blood cell transfusion in this patient population. Methods to reduce phlebotomy for laboratory testing can reduce iatrogenic anemia. At a university‐based teaching hospital, a pathway to collect cord blood samples on all newborn deliveries was established. The cord blood sample is used for initial blood bank laboratory testing on newborn patients transferred to the neonatal intensive care unit (NICU), preventing need for additional blood draw. The blood tubes are saved for 1 week post‐delivery, with cost of $1.10 per delivery tray for sterile tubes. With an initial negative antibody screen on cord blood sample, no additional phlebotomy is required for blood product selection or compatibility testing in this population until four months of age.
Study Design/Method: Labor and delivery data from our facility in 2016 was analyzed, and the gestational age and birth weight of all infants transferred to the NICU was collected. From this data, we were able to calculate the total blood volume of these infants using MedCalc 3000 system. By using the blood volume values, and assigning a value of 1.5mL as the minimum amount of blood that would be drawn to perform an antibody screen, we calculated the percent of an infant's blood that would have to be drawn if the cord blood pathway was not established.
Results/Finding: In 2016, there was a total of 3,331 infants delivered at our facility. Out of all the deliveries, 487 (14%) infants were transferred to the NICU. Of those infants, 27% received at least one red blood cell transfusion and 7% received at least one platelet transfusion. Of the 487 infants transferred to the NICU, 98 (20%) had a percentage of blood volume that would have had to be drawn for blood bank testing greater than or equal to 1% (which we considered to be significant), had the cord blood pathway not been in effect. The percentage of blood volume preserved in these infants ranged from 1.0% all the way up to 3.9%. In those 98 infants, the birth weight ranged from 400‐1650 grams, and the gestational age ranged from 22 weeks to 36 weeks and 4 days.
Conclusion: The established cord blood pathway has proven to be a relatively cost‐effective method to prevent iatrogenic blood loss secondary to blood bank testing in a population of NICU infants who are most susceptible to iatrogenic anemia. The infants that were most likely to benefit from this policy are premature infants who are low birth weight (less than 2500 grams).
CP123
Development of a Standardized Response Team for Massive Hemorrhage Events Outside of an Operating Room Setting
James Burner*1, Shannon Davis2, Suzan New2, Vaishali Patel2 and Oren Guttman2
1University of Texas Southwestern Medical Center, 2UT Southwestern Medical Center
Background/Case Studies: Managing a massive transfusion protocol (MTP) in an operating room (OR) is a relatively frequent occurrence with team members well trained in their specific roles. However, in the event of MTP activation outside of an OR, sufficient and/or appropriately trained individuals may not be present. This can lead to a scene of confusion and chaos with potential for patient harm.
Study Design/Method: A Failure Mode Effects Analysis was performed to develop a standardized process for managing MTP outside of an OR setting. With participation from anesthesia, surgery, transfusion medicine, patient safety and quality and nursing, every step of the hospital's MTP was analyzed for potential errors. The results were used to create a “code hemorrhage” team trained to respond to any massively hemorrhaging non‐OR patient.
Results/Finding: Code Hemorrhage represents a multi‐system team critical event requiring coordination of different sub‐teams (primary resuscitation, surgical/interventional, transfusion services, blood preparation, equipment management, medication management, and lab requisition/monitoring). Our Code Hemorrhage protocol utilizes critical care trained nurses from the hospital's rapid response team who play two key new coordination roles: hemorrhage coordinator and electronic medical record (EMR) coordinator. Their combined roles serve to reduce the cognitive load of the various teams, prevent duplication of resources/efforts during MTP and enable enhanced closed loop task performance. The hemorrhage coordinator establishes reliable 1:1 communication between the primary resuscitation team and transfusion services, and aids in multi‐team on‐site coordination. The EMR coordinator enters all orders into the EMR, sends/communicates laboratory results and ensures blood products are available to the resuscitation team. The primary resuscitation team includes a team leader (medical decision making and cardiac life‐support management); a proceduralist (establishing venous and/or arterial access), event documenter (real‐time documentation of actions, medications, events, etc.), medication manager (registered nurse who prepares and administers medications) and equipment technologist (managing rapid blood product infusion devices). Additional secondary roles will also be assigned, such as blood product checker(s) (verifies blood product prior to transfusion) and blood bank runner (courier sent to retrieves blood product shipments).
Conclusion: The code hemorrhage protocol is designed to ensure timely, efficient delivery of blood products to massively bleeding patients outside of an OR setting. Future work will assess its overall effectiveness by comparing blood product utilization/wastage and patient outcomes before and after implementation.
CP124
Efficacy and Safety of Erythropoietin and Iron Therapy to Reduce Red Blood Cell Transfusion in Surgical Patients: A Systematic Review and Meta‐Analysis
Tiffanie Kei*1, Gerard Curley1,2, Katerina Pavenski1, Sarah Ward1, Nadine Shehata3, Rosemary Tanzini1, Marie‐France Gauthier1, Nikhil Mistry1, C. David Mazer1 and Greg Hare1
1St. Michael's Hospital, 2Royal College of Surgeons in Ireland, 3Mount Sinai Hospital
Background/Case Studies: Preoperative anemia affects up to 50% of surgical patients and increases the risk of red blood cell (RBC) transfusion. Both preoperative anemia and perioperative RBC transfusion are associated with increased risk of adverse outcomes following surgery. Preoperative treatment of anemia includes oral and intravenous (i.v.) iron and erythroid stimulating agents (ESA) such as erythropoietin (EPO); however, the optimal treatment strategy for preoperative anemia remains to be established. Our objectives were to evaluate the efficacy and safety of ESA and iron therapy based on their effects on the prevalence of RBC transfusions and adverse thrombotic events.
Study Design/Method: We searched the Cochrane Central Register of Controlled Trials, MEDLINE and EMBASE from inception to July 2016; reference lists of published guidelines, reviews and associated papers, as well as conference proceedings. No language restrictions were applied. We included randomized controlled trials in which adult patients undergoing surgery received either an ESA and/or iron before surgery, versus iron or no intervention. Three authors independently reviewed the studies and extracted data from included trials. Risk of bias was assessed for all included studies. Where applicable, we pooled risk ratios of dichotomous outcomes and mean differences of continuous outcomes across trials using random‐effects models. Our primary outcome was the number of patients transfused with red blood cells. Secondary outcomes included risk of mortality and other thrombovascular events (stroke, myocardial infarction, deep vein thrombosis, and pulmonary embolism).
Results/Finding: A total of 79 randomized controlled trials (8,181 participants) were included. Patients that received ESAs in addition to oral or i.v. iron had a reduction in their risk for transfusion (risk ratio [RR], 0.50; 95% CI, 0.46‐0.53), relative to those that only received oral or i.v. iron or no intervention. Treatment with i.v iron alone, relative to oral iron or no treatment, also reduced the risk of RBC transfusion (RR, 0.80 [95% CI, 0.63‐1.01]. No clear increased risk of adverse events was observed with EPO use: mortality (RR, 1.03 [95% CI, 0.68‐1.57]), myocardial infarction (RR, 1.14 [95% CI, 0.60‐2.14]), deep vein thrombosis (RR, 1.43 [95% CI, 0.92‐2.21]), stroke (RR, 1.49 [95% CI, 0.62‐3.59]) or pulmonary embolism (RR, 0.50 [95% CI, 0.12‐2.06]).
Conclusion: Amongst patients undergoing surgery, the administration of an ESA in addition to oral or i.v. iron was associated with a reduction in patients requiring RBC transfusion. Intravenous iron was less effective at reducing RBC transfusion. Neither treatment was associated with any clear increase in risk of adverse thrombotic events. Additional large prospective randomized controlled trials are required to determine the optimal management strategy for patients undergoing surgery with iron restricted anemia.
CP125
Evidence Based Blood Therapeutics
Scott Neeley*1 and Stephanie Rogers2
1Dignity Health St Joseph's Medical Center, 2Dignity Health
Background/Case Studies: Over 12 million units of packed red blood cells (PRBC) are transfused annually in the United States and there is no clinical basis for as many as half of these transfusions. No randomized prospective trial has ever demonstrated a clinical benefit for transfusion in mild to moderately anemic patients and yet there is a large body of evidence which has shown that due to a variety of reasons including an immunomodulatory effect and the storage lesion, blood transfusions can cause considerable harm, including higher risk of hospital acquired bacterial infections, transfusion related acute lung injury/acute pulmonary edema, acute myocardial infarction, higher recurrence of rebleeding and higher cancer recurrence.
Study Design/Methods: A system wide goal was launched across 39 hospitals to decrease the number of PRBC transfusions given to clinically stable patients with hemoglobin (Hgb) levels >= 7.0g/dL. The numerator consisted of all PRBC units transfused to patients with a Hgb of 7.0g/dL or greater prior to transfusion and the denominator consisted of all PRBC units transfused. Exclusions included cardiac surgery, Nursery, NICU, pregnancy, post‐partum hemorrhage, massive transfusion protocol and transfusions in which 4 or more PRBC units were transfused in one episode. Data was extracted directly from the Electronic Medical Record and hospitals received patient level detail every month for all PRBC units transfused to patients with a Hgb of 7.0g/dL or higher prior to transfusion. An extensive educational campaign re: evidence‐based transfusion practice was launched for Physicians and Nurses, including the development of a Blood Therapeutics toolkit, development of standardized Dignity Health Blood Therapeutics Guidelines, a one day Blood Therapeutics Advanced Training Symposium, on‐site visits to 21 hospitals including 16 CME presentations, online Physician and Nursing educational videos, communication tools including infographics and “7 is the new 10” buttons, development of a patient education resource and bi‐monthly webinars with various educational topics and speakers. Additionally, the EHR powerplans were revised to ensure available selections for “Transfusion Indication” (required field) were aligned with evidence based guidelines. Facilties were encouraged to develop multi‐disciplinary Blood Therapeutics Committees to review all transfusions given to patients with pre‐transfusion Hgb >= 7.0g/dL on a routine basis, providing feedback to Providers whose transfusions were deemed not in accordance with current evidence‐based guidelines.
Results/Findings: From FY2015 to FYTD2017, there was a 26% reduction in PRBC units transfused to patients with Hgb >= 7.0g/dL, starting at a baseline of 67% down to 41%. This represents an FY17 annualized savings of $9.732M, from a baseline of 82 units per 1,000 patients days down to an average 71 units and approximately 2,000 fewer units transfused per month.
Conclusion: Blood transfusions, while life saving, should be regarded as an organ transplant and as such they carry considerable risk. Transfusions to stable, non‐bleeding patients with Hgb levels >= 7.0g/dL are not in accordance with evidence‐based guidelines and should be avoided due to the associated potential harm. Furthermore, this potential harm is dose dependent, so if the decision to transfuse is made, one unit of PRBC should be transfused rather than two.
CP126
Evidence‐Based Practices to Reduce RBC Transfusion: A CDC‐Laboratory Medicine Best Practice Systematic Review
Bereneice M Madison*1, Nicole Clarke2, Aaron Alford3, Aryeh Shander4, Irwin Gross5, Robert Thurer6, John Krolak1, Elizabeth Leibach1 and James Derzon7
1Centers for Disease Control and Prevention, 2Pharmerit International, 3National Network of Public Health Institutes, 4Englewood Hospital and Medical Center, 5Accumen, Inc, 6Gauss Surgical, Inc., 7RTI International
Background/Case Studies: BACKGROUND: Red blood cells (RBCs) are the most common blood component transfused. Approximately 11‐12M units are transfused annually in the US. RBC transfusion is associated with increased morbidity and mortality. RBC transfusions have decreased but remain one of the five most overused procedures in hospitals. Real‐time data on who orders transfusions, patient identifiers, units requested and hemoglobin (Hb) triggers are captured in laboratory (lab) systems. Electronic records include data on the impact of interventions e.g. anemia management (AM), restrictive transfusion (RT) and antifibrinolytics on RBC transfusion frequency. Evidence‐based practice recommendations can help labs work effectively with ordering physicians to reduce RBC transfusion.
Study Design/Method: METHODS: The CDC‐LMBP Systematic Review A‐6 Method was used to search for studies of effectiveness on RBC transfusion reduction in PubMed, EMBASE and CINAHL from 1990‐2016. Unpublished data were requested from clinical sites in 2013. Population: Adult patients for RBC transfusion. Interventions: AM; RT; computerized physician order entry/clinical decision support systems (CPOE/CDS); Audit/Feedback (AF) and antifibrinolytics. Control: Standard Practice Outcomes: Percentage of patients and number of RBC units transfused. Exclusions: Pediatrics, obstetrics, trauma and genetic diseases.
Results/Finding: RESULTS: One hundred sixteen of 2073 studies met criteria for quantitative synthesis and meta‐analysis. Nine published and one unpublished study showed that AM reduced the number of patients (OR = 0.525); and RBC units transfused {Standardized difference in Means (SDM) =0.746}. Nine studies and three labs reduced RBC units (SDM= ‐0.409) and percentage of patients transfused (OR=‐0.586) with Hb alerts in CPOE/CDS. Twenty‐three studies favored RT (OR=‐0.363) in percentage of patients and RBC units transfused (SDM =‐0.447). Three AF studies (SDM=‐0.258) reduced RBC units and two studies decreased the percentage of patients transfused (OR= 0.700). Forty‐three studies showed that intravenous tranexamic acid reduced the percentage of patients (OR =0.264) and RBC units transfused (SDM=‐0.553). Qualitative/meta‐analyses were translated into recommendations by an Expert Panel and approved by the LMBP Workgroup for reducing RBC transfusion. Recommendations are: Early assessment and effective AM; RT, Hb alerts in CPOE/CDS; reduction of blood loss and AF assessing the percentage of patients and RBC units transfused across cases, physicians and service areas over discrete periods of time with feedback to physicians for continuous quality improvement.
Conclusion: Conclusion: The LMBP A‐6 method led to evidence‐based recommendations for reducing transfusion. Critical laboratory support is needed to achieve continuous quality and patient safety.
CP127
Implementation of a Target Based Red Blood Cell Dose Calculator within the Electronic Medical Record Blood Orders Reduces the Use of Non‐Surgical Transfusion in an Academic Medical Center
Joseph Connor*1, Thomas Raife2, Joshua Medow1, Brad Ehlenfeldt3 and Kristen Sipsma4
1University of Wisconsin, 2University of Wisconsin, Madison, 3University of Wisconsin, UWHealth, 4UW Health‐Population Health
Background/Case Studies: Reducing the inappropriate use of blood products via the implementation of evidence based guidelines is a main tenet of patient blood management. The use of electronic decision support tools such as best practice alerts (BPAs) to enforce red blood cell (RBC) transfusion thresholds have been shown to reduce use by informing ordering providers when or when not to transfuse. The tools in use to date have not provided a dose of RBCs to transfuse, so in fact providers can continue to over‐transfusion based on the number of units of RBC given. A therapeutic hemoglobin/hematocrit (Hgb/HCT) targeted approach to RBC indications/orders allows for the calculation of a dose of RBCs to achieve the desired target and could further reduce the use of RBC units. Our group has developed a computer algorithm to calculate RBC dose based on patient specific data drawn from the electronic medical record (EMR) that has been used in select patient populations but has not been prospectively applied to hospital wide clinical practice. This study describes our initial experience with the use of this algorithm in non‐surgical RBC transfusion.
Study Design/Method: The Blood Utilization Calculator (BUC) is a mathematical formula that draws patient specific information including index Hgb/HCT and calculates a dose in number of units of RBCs to transfuse in order to achieve a selected target Hgb/HCT. Hgb/HCT target based indications for RBC transfusion were designed and used as the basis for RBC order set with in the EThe BUC was embedded within the EMRs RBC order set to provide a recommended transfusion dose in number of units when any non‐surgical RBC indication was selected. The target Hgb/HCT for these indications was 7g/dL/21% or 8g/dL/24%. The number of RBC units ordered and transfused were tracked prospectively for each of the orderable indications. Comparison of units transfused per month before and after the BUC implementation was performed using Student's t‐test.
Results/Finding: Historically, the three non‐surgical RBC indications represented approximately 42% of the total RBC transfused. Prior to the BUC the mean number of non‐surgical RBC units transfused was 590 + 24 units/month. After the first 5 months of BUC activation the mean number of units was 439 + 50 units/month a reduction of 151 units/month or 26% of non‐surgical blood use (P=0.003 by t‐test). Non‐surgical RBC use now represents approximately 29% of the total RBC use hospital wide a 13% reduction. This change represents a significant cost savings in RBCs over time.
Conclusion: The use of target based transfusion indications and an electronic decision support algorithm to calculate a recommended transfusion dose can significantly reduce the non‐surgical RBC transfusion rate providing enhanced patient blood management and potential cost savings.
CP128
Implementation of Patient Blood Management at a Community Hospital – 30 Month Report Card
Richard Gammon*
Oneblood, Inc.
Background/Case Studies: A collaboration between blood center between (BC) as consultant and three hospital (400+ beds) healthcare system (HCS) to implement a patient blood management (PBM) program was undertaken. This is a review of the first 30 months.
Study Design/Method: During year one PBM working group was established. Achievements included physician engagement programs, creation of transfusion committee and providing nursing education. Auditing processes were implemented with nonconformance letters sent to physicians and nurses when compliance with informed consent, transfusion tags and thresholds and discharge instructions was not achieved. In year two, IT created best practice alerts (BPA) when an order did not meet transfusion threshold criteria. BPA showed first line of associated procedure, link to the full procedure, three most recent lab results (e.g., hemoglobin & hematocrit for red blood cells (RBC)) and allowed ordering physician to cancel order after review. A blood administration video was created. It was mandatory that all physicians granted privileges complete within six months. Low vital sign compliance required action that included reducing requirement from five to three during transfusion and formation of working group (WG) to address knowledge and practice gaps. In year three, as historically at this HCS very few Jehovah's Witness patients (JWP) presented, PBM WG was involved with implementation of a bloodless medicine program. All steps of care were addressed including identifying JWP at registration, creating special arm bands, forming a bloodless medicine physician group, implementing nursing BPA in the electronic medical record, creating advanced directives and marketing to the public.
Results/Finding: The following were monitored for compliance (2Q14 vs. 1Q17): present and completed consents (66 vs. 94%), present and completed nursing flow sheets (19 vs. 96%), transfusion thresholds supported (73 vs. 100%), discharge instructions provided (17 vs. 86%); (3Q15 vs.1Q17) vital sign compliance (39% vs.71%). JWP increased from 27 to 225 (04/16‐03/17). Cost savings were realized by decreased utilization and implementation of BPA. (Table 2016‐1Q17)
Conclusion: PBM implementation at a HCS is a continuous and multiyear process. Even with a robust program challenges such as vital sign compliance remain.
| Metric | Units Not Transfused | Cost Savings (US Dollars) |
|---|---|---|
| BPA –orders cancelled | 321 total (279 RBCs, 28 platelets and 14 plasmas) | 80,749.84 total (65,407.64 RBCs, 14,613.20 platelets, 729 plasmas) |
| Decrease in Blood Product Usage | 1019 total (467 RBCs, 23 platelets, 529 plasmas) | 129,035.36 (87,329 RBCs, 12,082.36 platelets and 29,624 plasmas) |
CP129
Improving Patient Outcomes in the Golden‐Hour
Beatrice LeBeuf*
Medical City Plano
Background/Case Studies: In emergency medicine, “the golden hour” refers to the critical one‐hour time period following traumatic injury in which the patient has a higher likelihood of survival. Nearly half of all trauma related deaths occur in the first hour after injury ‐ half of those deaths are the result of major hemorrhaging. Rapid administration of blood products is vital to the survival of these patients.
We implemented BloodTrack Emerge (Haemonetics, Braintree, MA) in our Trauma emergency department (ED) as part of a quality improvement initiative to more efficiently provide group O RBCs and thawed/liquid plasma for incoming trauma patients to support ratio‐based transfusions and ensure the proper handling and traceability of this regulated resource.
Study Design/Methods: We treat approximately 30‐40 trauma patients monthly. An assessment of our current blood supply chain revealed a multi‐step, manual process that took about 8 minutes to prepare and physically transport a cooler from the blood bank to the ED. Coolers of blood were provided for incoming trauma patients, whether they ended up needing transfusions or not. This practice worked to ensure available blood supplies during critical moments, but resulted in inefficiencies and unnecessary inventory tie‐ups, with only 10 percent of coolers fully used. It also consumed valuable staff time as technologists typically made 20‐45 trips per month from the blood bank to the ED. Plus, there was no effective way to maintain traceability, control access to coolers or monitor usage.
Results/Findings: Since our November 2016 implementation, BloodTrack Emerge has freed up technologists to perform important tasks, tightened traceability and inventory control procedures and contributed to the Medical City Plano's verification as a Level 1 trauma center. Rather than preparing coolers of blood in case they may be needed in emergency situations, BloodTrack Emerge provides ED staff ready access to emergency units whenever they're actually needed —and frees up an estimated 6‐10 hours of tech time per month during which they can perform other tasks. Audio and visual alerts notify the blood bank when emergency units are removed, allowing a quick response. Plus, by stocking emergency blood supplies in the ED, the blood bank isn't unnecessarily tying up group O RBC units. Today, the blood bank stocks and maintains 2‐4 units of group O RhD negative, 4 units of O RhD positive, and 4 units of group A thawed plasma/liquid plasma in BloodTrack Emerge.
Conclusion: Implementing BloodTrack Emerge has enabled us to more effectively provide blood products for incoming trauma patients to support ratio‐based transfusions, improve staff efficiencies and proactively respond to emergency situations.
CP130
Improving Platelet Utilization: Evaluation of Computer Provider Order Entry Overrides
Anh Dinh*1, Edward J Yoon2, Lynne Uhl1 and Kerry O'Brien1
1Beth Israel Deaconess Medical Center, 2New York Blood Center
Background/Case Studies: Platelets are a limited resource for which the benefits of transfusion must be weighed against the risks. In 2015, the AABB published platelet transfusion guidelines to assist providers. At our academic medical center, a computer provider order entry (CPOE) system combines institutional transfusion guidelines with a patient's most recent lab results to guide transfusion decisions. Discordant information activates an “override” system, in which providers are prompted to select a prefixed indication for transfusion (e.g. Count < 10K/µl [prophylaxis]) with the option to add a free‐text comment. The order is placed and data is stored for later review.
Study Design/Method: Override platelet orders placed from June 2015‐October 2016 were reviewed using the following data: prefixed indication, most recent platelet count, free‐text comment, and ordering service/department. One of five “codes” was assigned to each order: I‐Indicated or NI‐Not indicated (based on institutional/AABB guidelines); NMI‐Need more information; P‐Protocol (e.g. liver transplant), and NIC‐Non‐indication comments (e.g. reserve for OR). Free‐text comments were categorized and assigned one or more keywords in order to determine the common reasons for overrides.
Results/Finding: Over a 17‐month period, 1,270 CPOE override platelet orders occurred. The percentages of code assignments by month are provided in Table 01 below. Overall, 532 (42%) were assigned as not indicated (NI).
TABLE 1. Code assignments (%), by month.
| Order Date | Year | 2016 | 2017 | Total | |||||||||||||||
|---|---|---|---|---|---|---|---|---|---|---|---|---|---|---|---|---|---|---|---|
| Month | 6 | 7 | 8 | 9 | 10 | 11 | 12 | 1 | 2 | 3 | 4 | 5 | 6 | 7 | 8 | 9 | 10 | ||
| Code Assignment (%) | I | 36 | 27 | 26 | 38 | 44 | 37 | 38 | 25 | 37 | 50 | 38 | 37 | 43 | 45 | 35 | 32 | 22 | 35 |
| NI | 43 | 54 | 43 | 38 | 46 | 31 | 40 | 37 | 39 | 30 | 22 | 46 | 31 | 43 | 50 | 51 | 63 | 42 | |
| NMI | 12 | 9 | 9 | 16 | 6 | 7 | 8 | 15 | 11 | 10 | 10 | 8 | 15 | 4 | 9 | 8 | 7 | 9 | |
| P | 7 | 8 | 17 | 8 | 4 | 25 | 10 | 13 | 6 | 2 | 19 | 6 | 8 | 1 | 0 | 9 | 1 | 8 | |
| NIC | 1 | 3 | 4 | 1 | 0 | 0 | 4 | 10 | 7 | 8 | 11 | 3 | 3 | 6 | 6 | 1 | 7 | 4 | |
The top keywords assigned to free‐text comments were “platelet count less than…” (325), “active bleeding” (303), “platelet count of …” (173), and “downtrend” (92), many with specified platelet count goals. Certain platelet count goals and reasons for transfusion (e.g. “downtrend,” “anticipate drop,” or “per service,”) are not included in institutional or AABB guidelines. Of note, 618 (49%) of overrides were placed by Hematology‐Oncology providers.
Conclusion: A majority of override platelet orders were determined to not be indicated based on institutional and AABB guidelines. Of concern were keywords such as “downtrend” and “anticipate drop,” as these are not indications for transfusion and expose patients to unnecessary transfusions. It is unclear whether trainee progression throughout the year had any effects on ordering practices and associated override patterns. This review suggests the potential benefits of provider education initiatives at all levels of experience (with particular emphasis on Hematology‐Oncology) in order to improve blood product utilization practices.
CP131
Integrated Clinical Laboratory, Transfusion Service and Blood Establishment: The Case for Patient Blood Management.
Miguel Angel de las Nieves*, Francisco Sarria, Ana Felicidad Egea, Oscar del Toro, Angela Ortega, Providencia Trujillo, Dolores Lechuga, Salvador Serna and Ampuero Javier
INGESA
Background/Case Studies: early diagnosis of iron deficiency anemia (IDA) by clinical laboratories (CL), with effective prevention and treatment in primary care may have an impact on packed red blood cell (PRBC) transfusion, as well as intravenous iron therapy and, most importantly, applying lower transfusion triggers. They all help to avoid not essential transfusions, but also promote health and wellbeing by improving iron status in the population. Results are described after implementing a process to prevent IDA, its early detection and treatment for years 2014‐2016.
Study Design/Methods: performance measure after educational and organizational intervention. Setting: public integrated healthcare system located in north Africa bordering Morocco, isolated by 207km sea distance to nearest continental Spain airport, with a general hospital blood transfusion service and a establishment for blood donation and component production. CL involved in anemia detection and diagnosis receives four primary care centers and hospital based samples, and shares common leadership with both blood establishments. Process: guidelines for first step CL diagnosis of IDA and call for attention, primary oral iron prevention and treatment in first level care, and early intravenous iron complex for inpatients (sucrose) and outpatients (carboxymaltose). Transfusion was avoided for stable IDA patients without active bleeding or coronary heart disease, with a safety hemoglobin (Hb) threshold of 5,5g/dl. Severely anemic patients were closely followed to asses Hb increase and referred for etiology studies when Hb> 9g/dl. Outcome measures: PRBC transfusion and iron formulation prescription for years 2014‐2016.Data: hospital discharges and PRBC use were analyzed in quarters for years 2010‐2016, while iron formulation prescription variance was analyzed yearly. Package SPSS v.22 was used for univariate analysis and linear regression.
Results/Findings: mean (±SD) quarter PRBC unit transfusion for years 2010‐2013 was 405,4 ±38 and 357,6 ±30 for 2014‐2016 (p=0,001), whereas quarter discharges were 1.688 ± 82 and 1.905 ± 61 respectively (p<0,001). Mean net reduction in PRBC use was 11,8% during study period, it was 19,2% when compared to year 2013 and average 20,5% if no change in tendency had been in place, as estimated by monthly regression line of years 2010‐2013 (R=0,41, p=0,003). Mean prescription of oral iron increased for study years (12.453 vs 15.297; p= 0,006), as did iron sucrose (342 vs 902; p=0,08) and carboxymaltose (569 vs 615; p= 0,6) without major adverse events.
Conclusion: IDA management is a target to avoid PRBC transfusion, and intervention at all levels of care is a successful strategy to improve awareness of this health problem and sustain blood resources.
CP132
Nursing Influence on Patient Blood Management at the Bedside
Ann McCord*, Stephanie Welsh and Adam Horn
Mary Lanning Healthcare
Background/Case Studies: Bedside nurses are critical in safeguarding the delivery of appropriate patient care. More recently, nurses have also begun to play an important role in patient blood management (PBM) programs at the administrative level, although to our knowledge little has been published on the influence nurses may have on transfusion practice at the bedside. The goal of this study was to evaluate the impact nurses have on patient expectations and physician ordering practice.
Study Design/Method: A short electronic survey (12 questions) was prepared to assess how often bedside nurses discussed transfusion necessity and the persons (patient or physician) with whom they discussed it with, as well as what was discussed, and what they felt were appropriate lab thresholds for transfusion. The survey was distributed to all registered nurses via email from floor leaders. Responses were also solicited by hospital volunteers and lab staff with electronic tablets and included coverage of the night shift.
Results/Finding: There were a total of 32 complete responses (16%). The nurses had a range of experience from less than one year to forty years. Ninety percent stated they discussed transfusion necessity with patients, 81% with physicians, and of these, 59% reported doing so proactively before an order was placed. Ninety‐six percent said they would discuss transfusion to suggest their patient required a blood product; only 3% responded that they would suggest product was not needed. Nursing perception of acceptable transfusion thresholds had a wider distribution, with the most commonly reported values being hemoglobin of 7‐8g/dL (56%), platelet count of 20‐50,000 (38%), and INR of greater than 2.0 (69%).
Conclusion: This study demonstrates that nurses are willing to discuss transfusions with both patients and providers, although they appear to be most comfortable doing so in the setting of perceived transfusion necessity. The limited number of survey responses suggests a discomfort with their level of education in transfusion practice. This, along with the distribution of perceived thresholds and the reluctance to recommend against transfusions, presents an opportunity for education to further empower nurses in providing appropriate patient care within the guidelines of PBM programs.
CP133
Patient Blood Management as a Public Health Issue: A Multidisciplinary Decision Process Requiring Call for Action
Dialina Brilhante*1,2, António Robalo Nunes1,3, Cândida Fonseca1,4, João Mairos1,5, Jorge Felix6, Mafalda Gonçalves6, Melina Mota6, César Ferreira6, Valeska Andreozzi6 and Björn Vandewalle6
1Anemia Working Group Portugal, 2Serviço de Imunohemoterapia, IPOFG, 3Serviço de Imunohemoterapia, Hospital das Forças Armadas, 4Serviço de Medicina III/Hospital de Dia de Especialidades Médicas, CHLO, 5Serviço de Ginecologia/Obstetrícia, Hospital das Forças Armadas, 6Exigo Consultores
Background/Case Studies: The use of red blood cell per 1,000 inhabitants may vary 3 folds between European countries, revealing that there may be substantial room for blood optimization strategies. Patient Blood Management (PBM) is an evidence‐based, multidisciplinary approach aiming to preserve and optimise patients’ own blood in order to improve clinical outcomes. The objective of our study was to assess the effect of a nationwide PBM program on public health in Portugal.
Study Design/Method: The first phase of this research project involved a group of 18 key opinion leaders (KOL) in a stated preference inquiry to assess the relative value of specific PBM strategies, grouped in PBM pillars, to highlight the need for strategy prioritization in the implementation of a nationwide PBM policy. Adaptive conjoint analysis techniques were used to elicit KOL preferences. In the second phase a decision analysis model was used to estimate the impact of PBM implementation in the following therapeutic areas: surgery (orthopaedic, cardiac and urologic), cardiology, oncology, gastrointestinal bleeding, abnormal uterine bleeding, haemodialysis, inflammatory bowel disease and pregnancy. Model inputs included effectiveness data regarding transfusion utilization, health resource consumption and mortality obtained from Portuguese national health databases and literature review. The public health value of PBM implementation in Portugal derives from the comparison of two scenarios: “current clinical practice” and “with PBM implementation”.
Results/Finding: KOL elicited iron administration followed by restrictive transfusion of red blood cell as the most preferred PBM strategies (14.4% and 14.0%), for the remaining strategies weights varied between 7.0% and 10.6%. We estimate that 384,704 patients would be eligible for PBM strategies in one year time horizon, resulting in 594 premature death avoided (3.8% reduction) corresponding to a gain of approximately 1,500 life years and a reduction of 3,660 (6.0%) disability adjusted life years (DALY) relative to the current clinical practice. A decrease of 233,141 in‐hospital days is expected mainly due to a 8.4% reduction in hospital length of stay and a 37.3% reduction in 30‐day readmission rate. In this population the overall transfusion rate could decrease to 4.3% from the current 8.7% (51.2% reduction) implying 17,202 blood transfusion avoided and 65,214 red blood cells units spared.
Conclusion: We anticipate that the implementation of a nationwide patient blood management program will represent a paramount improvement in clinical outcomes in terms of morbidity and mortality and may have a substantial public health impact while contributing a more efficient use health resources.
CP134
Patient Blood Management: Reducing Crossmatch and Transfusion Rates through Implementation of a Maximum Surgical Blood Ordering Schedule
Katherine Dettenwanger*, Jessica Kneib, Sara Johnston and Emily Coberly
University of Missouri Health Care
Background/Case Studies: A Maximum Surgical Blood Ordering Schedule (MSBOS) guides clinicians to order an appropriate number of crossmatched PRBC units for elective surgical patients based on local transfusion rates for each procedure type. Implementation of a MSBOS is an important component of a Patient Blood Management program, and contributes to the accurate and efficient utilization of PRBCs.
Study Design/Method: Based on measured transfusion rates for each procedure type, a MSBOS was created and implemented for elective orthopaedic surgical procedures. Total transfusions and total preoperative crossmatches were measured for 6 months prior to and 6 months after MSBOS implementation.
Results/Finding: A total of 4,559 elective orthopaedic surgical procedures were performed during the 12 month study period. After implementation of the MSBOS, preoperative crossmatch orders decreased by 74% (from 4.8% [110 of 2269 cases] to 1.3% [29 of 2290 cases], p < 0.001). Transfusion rates also significantly decreased by 50% (from 1.4% [31 of 2269 cases] to 0.7% [17 of 2290 cases], p = 0.0424). The crossmatch to transfuse ratio (C:T) decreased from 4.0 to 1.2, exceeding the best practice standard of C:T less than 2.0.
Conclusion: Implementation of a Maximum Surgical Blood Ordering Schedule reduces unnecessary crossmatching as well as transfusion rates for elective orthopaedic surgical patients, and is an important component of an effective Patient Blood Management program.
CP135
Predicting Blood Transfusion Requirements with Machine Learning and Artificial Intelligence
Mark Ereth*1,2, Adam Mustafa3, Ayin Vala3, Avishaan Sethi3, Tim Tran3, Jack Doenges4 and Jamison Feramisco3
1Mayo Clinic College Medicine, 2Apri Health, Inc., 3Apri Health Inc, 4University of Minnesota
Background/Case Studies: Laboratory‐guided transfusion algorithms are commonly employed to augment restrictive transfusion practices. They generally rely on tests of coagulation, platelets, and indicators of fibrinolysis but do not take into account other clinical factors beyond blood loss. Clinicians rely on laboratory results and a broad range of physiologic parameters to drive the decision to transfuse. The development of clinical‐guided algorithms alone or in concert with laboratory‐guided algorithms may allow for optimal transfusion therapy. Machine learning and artificial intelligence methodology may provide for the development of multi‐dimensional algorithms to facilitate transfusion of blood and blood products addressing this critical clinical gap.
Study Design/Methods: We sought to transform current empirical methods of decision making in transfusion to an evidence‐based one, using advanced analytics and machine learning techniques. After IRB approval we deployed data extraction methods with an Application Programming Interface (API) collecting pertinent clinical information from 1,100 consecutive patients undergoing cardiac surgery with cardiopulmonary bypass. The data was parsed and translated into various formats. We employed MongoDB, MSSQL, Oracle SQL, NoSQL Redis, CouchDB, and MySQL tools. A series of machine learning and artificial intelligence experiments were then conducted using training subsets of these data. The results of the training experiments were then run on a validation set and finally the test set.
Results/Findings: Machine learning and artificial intelligence methods revealed predictive relationships between numerous clinical parameters and blood transfusion. In addition to traditional laboratory results body weight, EuroSCORE, fibrinogen, 24hr chest tube output, low molecular weight heparin, age, hemoglobin, body surface area, gender, hematocrit nadir, artificial ventilation, hemoglobin A1c, multiplate platelet function, and vital sign trajectory were identified as significant predictors of transfusion.
Conclusion: Developing multi‐dimensional predictors and thus algorithms with clinical and laboratory cut‐points for transfusion furthers objective and standardized transfusion practices. By empowering providers with relevant patient information (and the cut‐points) we can refine the current clinical guidelines thus reducing its inappropriate utilization while advancing value‐based care.
CP136
Predicting Intraoperative Red Blood Cell Usage in Liver Transplantation
Ryan A Metcalf*1, Monica B. Pagano2, James D. Perkins3 and Martin I Montenovo4
1Division of Transfusion Medicine, University of Washington,, 2Division of Transfusion Medicine, University of Washington, 3Department of Surgery, University of Washington, 4Division of Transplant Surgery, University of Washington
Background/Case Studies: Blood utilization during liver transplant varies. End stage liver disease alters hemostasis due to pro‐ and anti‐coagulation factor deficiencies. Portal hypertension, hyperfibrinolysis, and platelet sequestration in the newly transplanted liver can contribute to significant hemorrhage. We sought to develop a predictive model of intraoperative RBC usage during liver transplant.
Study Design/Method: This is a retrospective study of primary liver transplants at a single institution from January 2013 to December 2015. Multivariable analysis of preoperative factors was used to develop a model predictive of intraoperative RBC use.
Results/Finding: 237 adult liver transplants were performed during the evaluation period. Preoperative hemoglobin, creatinine, MELD score, spontaneous bacterial peritonitis (SBP), preoperative hemodialysis, gender, and portal vein thrombosis (PVT) gave the strongest model predicting RBC usage. If the model predicted <1250ml of RBCs, all cases with 0ml transfused were captured and only 7.8% of the time >1250ml were used. If 1250‐2000ml RBCs were predicted to be transfused, >2000ml were used 25% of the time. If predicted usage was >2000ml, 53% of the time it exceeded 2000ml.
Conclusion: A model using specific preoperative factors can be used to predict intraoperative RBC usage. Patients at risk for >1250ml of RBC transfusion can be identified with reasonable accuracy using this model at our institution. Use of this model might help improve preparation and utilization of the blood bank.
| Usage Groups* | ||||
|---|---|---|---|---|
| 0‐1250ml | 1251‐2500ml | 2500+ml | P‐Value | |
| N (%) | 117(50) | 80(34) | 39(16) | |
| Donation after brain death Donor (%) | 83(84) | 69(86) | 32(82) | 0.8 |
| CDC High‐Risk Donor (%) | 26(22) | 18(23) | 13(33) | 0.4 |
| Cold ischemia time, hr | 7.1 ± 2.5 | 6.8 ± 2.2 | 7.5 ± 2.2 | 0.5 |
| Age, years | 55.4 ± 11 | 54.9 ± 9.2 | 51.3 ± 8.9 | 0.03** |
| Gender, male (%) | 93(80) | 50(63) | 21(54) | 0.003 |
| Height, cm | 173.9 ± 8 | 171.7 ± 9 | 173.2 ± 39 | 0.4 |
| BMI | 28.8 ± 5 | 29.6 ± 5 | 29 ± 6 | 0.6 |
| Hepatocellular carcinoma (%) | 70(60) | 21(26) | 4(10) | <0.0001 |
| Ascites | <0.0001 | |||
| No (%) | 40(34) | 12(15) | 2(5) | |
| Slight (%) | 28(24) | 10(13) | 6(15) | |
| Moderate (%) | 41(42) | 58(73) | 31(80) | |
| Prior abdominal surgery | 0.2 | |||
| Yes (%) | 35(30) | 24(30) | 17(44) | |
| Unknown (%) | 1(1) | 3(4) | 0 | |
| SBP (%) | 15(13) | 26(33) | 24(62) | <0.0001 |
| Pre‐hemodialysis (%) | 12(10) | 28(35) | 24(62) | <0.0001 |
| PVT (%) | 13(11) | 9(11) | 9(23) | 0.2 |
| TIPS (%) | 3(3) | 7(9) | 2(5) | 0.2 |
| MELD Score | 16.4 ± 11 | 28.5 ± 10 | 31.2 ± 12 | <0.0001*** |
| Pre‐Cr | 1.4 ± 1.5 | 2.1 ± 1.6 | 2.5 ± 1.6 | <0.01*** |
| Pre‐Bilirubin | 6.8 ± 10.6 | 13.8 ± 12.4 | 16.1 ± 14.6 | <0.0001*** |
| Pre‐Hemoglobin | 11.6 ± 2.2 | 9.3 ± 1.7 | 8.9 ± 1.97 | <0.0001*** |
| Pre‐INR | 1.7 ± 0.6 | 2.4 ± 1 | 2.7 ± 1.5 | <0.0001*** |
*29 with missing values with values imputed with linear regression from estimated blood loss and crystalloids given
**0‐1250 Group vs 2500+ Group
***0‐1250 Group vs both other groups
CP137
Review of Blood Ordering Practice for Elective Surgeries in a Maternity Hospital
Qi Raymond Fu*
KK Women's and Children's Hospital
Background/Case Studies: Pre‐operative over‐ordering of blood is common, resulting in waste of blood bank resources. Blood units are withdrawn from the pool, leading to constraints in allocating the limited blood resources to meet the needs of other patients. The Cross‐match to Transfusion (CT) ratio is often used in benchmarking efficient blood utilization within the hospital blood transfusion service. According to the American Association of Blood Banks (AABB), a CT ratio of less than 2.0 is favorable, and anything above indicates over‐ordering and cross‐matching of blood. To achieve this, it is necessary to review pre‐surgical blood ordering practice in a maternity hospital.
Study Design/Methods: Data on elective surgeries requiring blood for standby was collected retrospectively over a 3 month period (Jan to Mar 2017). Details of total blood cross‐matched, issued, transfused and returned were analyzed along with the CT ratio.
Results/Findings: During the 3 month period, there were 274 patients undergoing obstetrics and gynecology procedures requiring blood on standby. A total of 494 units of blood were requested. 154 units were cross‐matched, of which 138 units were sent to the Operating Theatre (OT). Only 33.3% of blood issued to OT were transfused (n=46) while the rest were unutilized. The observed CT ratio was 3.35.
Conclusion: Although only 31% of total blood requested was cross‐matched, the CT ratio remains above the recommended guideline of ≥2.0, with almost 70% of cross‐matched blood unutilized. There is a need to improve and standardize the blood ordering practice to achieve cost‐effectiveness and reduce unnecessary workload. Establishing and adhering to a maximum surgical blood order schedule (MSBOS) could help in conserving blood and prevent over‐ordering of blood.
CP138
Single Dose Intravenous Tranexamic Acid Is Not Adequate in Minimising Blood Loss and Blood Transfusion Requirement in Patients Undergoing Single Stage Bilateral Total Knee Arthroplasty
Somnath Mukherjee*1, Sujit Tripathy2, Rituparna Maiti2 and Bhaskar Rao2
1All India Institute of Medical Sciences, 2All India Institute of Medical Sciences, Bhubaneswar
Background/Case Studies: Total knee arthroplasty (TKA) is a major orthopaedic procedure with increased perioperative blood loss. This perioperative blood loss could be more significant in patients undergoing bilateral TKA in a single stage. The increased blood loss in bilateral TKA often requires blood transfusion which results in high post‐operative morbidities.
Study Design/Methods: In this retrospective study 35 patients who received tranexamic acid (TXA) (study group) and 31 patients who did not receive TXA during surgery (control) were evaluated for blood loss and transfusion requirement. The study group received a single bolus dose of TXA 1gm IV before tourniquet deflation on first side knee. Statistical analyses were performed using statistical software Instat+ Version 3.036. The level of significance was set at p value less than <0.05.
Results/Findings: Both the groups were comparable in terms of age, sex and body mass index. The mean preoperative Hb and Hct values were found to be similar in both groups. The mean post‐operative Hb and Hct levels in the study and control groups were (9.24 ± 1.12 gm/dl; 27.92 ± 3.72%) and (9.06 ± 1.42 gm/dl; 27.41 ± 4.92%) respectively [Table 1]. No significant difference in the change in Hb levels (2.42 ± 1.28 gm/dl vs 2.44 ± 1.31 gm/dl; P> 0.05) and Hct (1.37 ± 0.96 vs 1.62 ± 0.98, P>0.05) observed from pre‐ and post‐surgery between the TXA group and the control group. [Table 2] Although the mean total measured blood loss (intraoperative and blood loss through drain) was lower in the study group (785.0 ± 329.75ml vs. 860.97 ± 395.47ml; P>0.05), there was no statistical significant difference observed. [Table 2] No difference in blood transfusion requirement observed between the study group and the control group (1 unit in both groups with interquartile (IQR) ranges from 1‐3 unit, P>0.05).
Conclusion: Single intraoperative dose of TXA is not adequate in reduction of blood loss and transfusion requirement in patients undergoing one‐stage bilateral TKA. Further comparative multicentric, prospective studies on single dose vs multiple doses, fixed dose vs weighted dose of TXA need to be performed in concurrent bilateral TKA to establish its benefit.
TABLE 1. Baseline demographic and clinical data
| Characteristics | Groups | p value | |
|---|---|---|---|
|
With Tranexamic acid (n=35) |
Without Tranexamic acid (n=31) |
||
| Age (years) | 60.9 ± 7.03 | 61.8 ± 7.7 | 0.61 * |
| Sex Ratio (male:female) | 1:2.5 | 1:4.2 | 0.41 # |
| BMI | 26.07 ± 3.69 | 25.09 ± 4.17 | 0.32 * |
| Pre‐operative Hb % | 11.67 ± 1.23 | 11.50 ± 1.41 | 0.47 $ |
| Pre‐operative HCT | 29.29 ± 3.49 | 29.03 ± 4.66 | 0.81 * |
| Post‐operative Hb% | 9.24 ± 1.12 | 9.06 ± 1.42 | 0.55 * |
| Post‐operative HCT | 27.92 ± 3.72 | 27.41 ± 4.92 | 0.64 * |
Unpaired t test
# Fischer's exact test
$ Mann Whitney test
TABLE 2. Comparison of outcome parameters
| Parameters | Groups | p value | 95% CI | |
|---|---|---|---|---|
|
With Tranexamic acid (n=35) |
Without Tranexamic acid (n=31) |
|||
|
Intra‐operative blood loss (ml) |
163.71 ± 92.4 | 165.32 ± 61.32 | 0.92 * | ‐36.206 to 40.28 |
|
Blood loss through drain (ml) |
621.71 ± 277.86 | 695.65 ± 382.51 | 0.65 $ | ‐237.05 to 89.186 |
| Total blood loss (ml) | 785.0 ± 329.75 | 860.97 ± 395.47 | 0.40 * | ‐104.76 to 256.69 |
| Change in Hb% | 2.42 ± 1.28 | 2.44 ± 1.31 | 0.95 * | ‐0.6188 to 0.6569 |
| Change in Hematocrit | 1.37 ± 0.96 | 1.62 ± 0.98 | 0.22 $ | ‐0.7329 to 0.2204 |
Unpaired t test
# Fischer's exact test
$ Mann Whitney test
CP139
Thromboelastography Reduces the Avoidable Transfusion in Liver Transplantation during Perioperative Period
Shuchao Zhang*, Haiyan Wang, Shuzhen Liu, Wei Rao and Bo Sun
The Affiliated Hospital of Qingdao University
Background/Case Studies: Coagulopathy is a common issue in patients with end stage liver disease who usually require liver transplantation (LT). Profound changes and imbalance between procoagulant and anticoagulant systems during LT can lead to diffuse bleeding and result in massive usage of blood transfusion. Therefore, monitoring of hemostasis in patients is critical for coagulation management during LT perioperative period. Thromboelastography (TEG) differs from conventional coagulation tests (including PT, aPTT, fibrinogen level and D‐dimer), because it is performed at the point of care, and it tests multiple arms of the coagulation cascade. Currently TEG is generally used during liver transplantation to monitor the levels of fibrinogen, platelet count and hyperfibrinolysis to assess patients' haemostatic status and guide coagulation management with blood products, factor concentrates, and antifibrinolytics.
Study Design/Method: This retrospective analysis was conducted in The Affiliated Hospital of Qingdao University. Existing records of LT patients were reviewed from January, 2015 to December, 2016. Transfusion blood data from eighty‐six patients undergoing orthotropic liver transplantation was further analyzed. These patients were divided into two groups: TEG group in which patients were monitored during LT perioperative period using point of care TEG analysis; control group in which patients were monitored using conventional coagulation tests.
Results/Finding: Our data showed that the need for blood transfusion in TEG group patients was significantly decreased compared to control group patients, with a usage of red blood cells (16.4 ± 8.5 VS 19.5 ± 10.3, unit, p<0.05), platelet (2.7 ± 1.2 VS 3.6 ± 1.5, therapeutic dose, p<0.05), fresh frozen plasma (1763.2 ± 846.7 VS 2487.4 ± 1365.5, ml, p<0.05), and cryoprecipitate (14.8 ± 8.5 VS 20.4 ± 12.3, unit, p<0.05) in the TEG group and control group, respectively. There is also significant difference in intraoperative blood loss between the two groups (5464.2 ± 3264.5 VS 6273.4 ± 4174.5, ml, p<0.05).
Conclusion: TEG can provide overall and efficient evaluation of coagulation during LT, with a constructive impact to reduce avoidable transfusion of allogeneic blood products. TEG is a valuable tool to guide goal‐directed transfusion. Algorithms based on TEG hemostasis monitoring in LT can reduce the usage of blood products.
CP140
Transfusion Indication Affects Provider Response to Electronic Clinical Decision Support for Blood Product Ordering
Jeffrey Papiernik* and Ronald Jackups
Department of Pathology and Immunology, Washington University in St. Louis
Background/Case Studies: Blood product utilization is an increasing concern for hospital systems attempting to reduce transfusion‐associated risks. One strategy to optimize utilization is to employ clinical decision support in the form of alerts to clinicians ordering blood products. We investigated whether an alert targeted to a patient's transfusion indication could alter provider ordering behavior.
Study Design/Method: This retrospective, observational study over the course of seven months included the inpatient adult medicine floors and intensive care units at a large academic hospital. Each time a crossmatch for packed red blood cells (pRBCs) was ordered via the hospital's electronic ordering system, an indication (e.g. “hemodynamically stable with hemoglobin < 7.0g/dL”) must be selected. If the indication selected contains a threshold hemoglobin concentration, and the patient's most recent hemoglobin on record was greater than this threshold, an interruptive alert displaying the patient's hemoglobin was activated. Ordering providers were then given three options: cancel the order, select a more appropriate indication from a list, or provide an explanation via free text as to why transfusion was being requested outside of approved indications. An alert encounter was defined as all activations on a patient within a six hour period without an intervening transfusion
Results/Finding: Over seven months, there were 1732 unique alert encounters. Of these, 1531 (88.4%) led to a crossmatch being ordered while 201 (11.6%) led to the order being canceled. Providers were more likely to cancel transfusions in response to alerts for hemodynamically stable patients with lower hemoglobin thresholds (7.0g/dL) than for more complicated patients (bleeding, cardiovascular disease, or preoperative) with higher hemoglobin thresholds (8.0 or 9.0g/dL). The cancellation rate was 14.7% for hemodynamically stable patients, compared to 10.1% for more complicated patients (p < 0.006 by Fisher exact test). Furthermore, pre‐transfusion hemoglobin was higher in cancelled orders than in non‐cancelled orders for hemodynamically stable patients (median 7.4 vs. 7.1g/dL, p < 0.01 by Mann‐Whitney U test), providing further evidence of the effectiveness of transfusion alerts in this population.
Conclusion: There is evidence suggesting that the targeted alert prevented unnecessary transfusions. When patients are hemodynamically stable, providers are more receptive to transfusion alerts, resulting in higher crossmatch cancellation rates despite lower hemoglobin thresholds.
CP141
Transfusion Practices in the Era of Maximum Surgical Blood Ordering Schedules Compiled By Procedure‐Specific Data
Mark Yazer*1, Zhan Ye1, Claudia S. Cohn2 and on behalf of the Biomedical Excellence for Safer Transfusion (BEST) Collaborative3
1University of Pittsburgh, 2Department of Laboratory Medicine and Pathology, University of Minnesota, 3Dartmouth‐Hitchcock Medical Center
Background/Case Studies: The maximum surgical blood ordering schedule (MSBOS) is a list of surgical procedures performed along with a recommendation for the extent of pre‐transfusion testing to be completed before the surgery begins. With improved patient data management systems it is now possible to create an MSBOS based on actual red blood cell (RBC) utilization data on a per‐patient basis. This study investigated the transfusion patterns at 4 academic hospitals with data‐derived MSBOS.
Study Design/Method: The 4 hospitals were in 2 groups, with one shared MSBOS for each group. Three of these hospitals were large academic centers while one was a children's hospital. At each center the MSBOS recommended no pre‐transfusion testing if ≤5% of patients had been transfused for a specific procedure in the previous year, a pre‐operative type and screen (T&S) if 5‐24% of the patients had been transfused, and a crossmatch of the median number of RBCs transfused if ≥25% of the patients had been transfused. Data were collected at each center over a 1 month period between January to March 2017 and included a maximum of 400 cases per hospital during that one month to ensure equal representation between centers
Results/Finding: Between these 4 centers there were a total of 1599 cases analyzed. Some of the more frequently performed surgeries included orthopedics (23% of cases), general surgery (16%) and cardiac surgery (11%). There were 1362 T&S ordered for these cases, of which 5 were positive for antibodies on the day of surgery. Of all the T&S ordered, 52% were ordered in accord with the MSBOS recommendation, 26% were ordered when the MSBOS did not recommend one, and in 0.2% a T&S was not ordered when the MSBOS recommended one. The remainder were ordered for procedures not listed in the MSBOS. An RBC crossmatch was performed on 454 of the cases and 1390 units were crossmatched. There were 385 patients on whom RBCs were issued involving 1189 RBCs; 633 units were transfused for a crossmatch:transfusion (C:T) ratio of 2.2 and a crossmatch:issue (C:I) ratio of 1.2. The majority of the crossmatches (266/454, 59%) were ordered when the MSBOS did not recommend performing one. Of all the crossmatched RBCs, 96% were issued to a patient when the MSBOS recommended crossmatching RBCs and only 82% were issued when the MSBOS did not recommend a crossmatch. Of all the RBC issued when the MSBOS recommended crossmatching units, 66% were transfused, 31% were returned to the blood bank and 3% were wasted; the C:T ratio was 1.58. Conversely, when the MSBOS did not recommend crossmatching units, 47% of the issued RBCs were transfused, 51% were returned to the blood bank and 1% were wasted; the C:T ratio was 2.59.
Conclusion: Adherence to the MSBOS at these centers, especially for ordering RBC crossmatches, was relatively low. Nonetheless, when the MSBOS was followed there was a lower C:T ratio and less wastage compared to RBCs ordered outside of the MSBOS. Efforts to raise awareness of the MSBOS, as well as the rapid availability of crossmatched RBCs using the electronic crossmatch, should be made at these institutions to improve compliance with good transfusion practice.
CP142
Understanding Iron Deficiency Anemia Among HIV Positive and Negative Pregnant Women in South Africa: A First Step Toward Prevention of Peripartum Blood Transfusion
Jennifer C. Hull1, Evan M. Bloch2, Charlotte Ingram3, Robert Crookes4, Nicole Mack5, Lauren Courtney5 and Edward L. Murphy*6
1Chris Hani Baragwanath Hospital, 2Johns Hopkins University School of Medicine, 3The South African Bone Marrow Registry, 4Cryo‐Save, 5RTI International, 6UCSF/BSRI
Background/Case Studies: Peripartum blood transfusion is more common in South Africa than in the USA and recent studies have demonstrated that antenatal anemia is a strong risk factor for such transfusion (odds ratio = 6.12 for prenatal hemoglobin (Hgb) 8‐8.9). We therefore analyzed the etiology and characteristics of antenatal anemia according to HIV status at a large hospital with a HIV prevalence of 29% among obstetric patients.
Study Design/Method: We studied a sample of anemic (Hgb<10.0g/dL) pregnant women who were referred to an antenatal anemia clinic at a large hospital in South Africa. Clinical information was abstracted and blood was sent for laboratory studies. T‐tests were used to compare continuous variables between groups.
Results/Findings: A total of 301 women were enrolled, with median age 27 (interquartile range 23‐32) years, median gravida 2 / para 1 and median gestational age 28 weeks. Mean Hgb before referral was 7.5g/dL and most were already taking oral iron therapy. A total of 169 women were HIV positive with mean CD4+ lymphocytes counts of 394 cells/uL; 29 (12%) of HIV positive subjects were on anti‐retroviral therapy (ART) prior to the pregnancy and 156 (92%) were on ART during the current pregnancy. Iron deficiency anemia was the overwhelmingly prevalent diagnosis, present in 292 (97%) of women. There was concurrent chronic disease (n=2), infection (n=2), vitamin B12 deficiency (n=2) and antenatal hemorrhage (n=6); 10 had other/unknown/missing causes of anemia. There were few pregnancy related complications. HIV positive women had higher levels of C‐reactive protein but slightly lower levels of transferrin, soluble transferrin receptor and RBC folate than HIV negative women (Table).
TABLE 1. Laboratory values at first clinic visit
| Analyte (unit) | HIV Pos (N=169) | HIV Neg (N=132) | p value |
|---|---|---|---|
| Hgb (g/dL) | 8.8 | 8.9 | 0.18 |
| Iron (umol/L) | 9.0 | 9.7 | 0.63 |
| Iron saturation (%) | 9.5 | 8.7 | 0.58 |
| Ferritin (ug/L) | 26 | 25 | 0.91 |
| Transferrin (g/L) | 4.2 | 4.5 | 0.0001 |
| sTFR* (mg/L) | 11.0* | 14.9* | 0.01 |
| Haptoglobin (mg/L) | 1.12 | 1.04 | 0.29 |
| C‐reactive protein (mg/L) | 11.6 | 5.9 | <0.0001 |
| RBC folate (nmol/L) | 3199 | 3700 | 0.0006 |
soluble transferrin receptor; data on 53 HIV+ and 23 HIV‐ cases only
Conclusion: Iron deficiency is the overwhelming cause of antenatal anemia among South African pregnant women. Compared to HIV‐negative women, HIV‐positive women had evidence of increased inflammation, relatively little differences in iron studies after early treatment with iron and lower red cell folate. A high proportion of HIV positive women were receiving ART, consistent with national guidelines. Future studies will examine longer‐term responses to iron therapy to assess its potential in decreasing the incidence of peripartum blood transfusion.
CP143
Variation in Red Blood Cell Transfusion Practice in Hematology/Oncology
Debra L. Smith*1, Louis M. Katz2 and John B. Armitage1
1Oklahoma Blood Institute, 2Americas Blood Centers
Background/Case Studies: Red blood cell (RBC) transfusion guidelines are derived mainly from studies of inpatient populations not representative of hematology/oncology (hem/onc) patients. This study aims to identify variation in RBC transfusion practices for hem/onc patients and determine the prevalence of ‘out of guideline’ transfusions.
Study Design/Method: A 19‐question survey addressing both institutional RBC transfusion guidelines and individual practice was distributed to hem/onc clinicians. The survey was distributed through five state oncology associations and by blood center physicians to their hem/onc colleagues. The online survey was administered through the SurveyMonkey platform. Responses were received from 10/2016 – 4/2017.
Results/Finding: Thirty completed surveys were received, representing 12 states and 22 institutions.
Institutional Guidelines
Twenty‐four of 30 (80%) clinicians reported an institutional guideline for RBC transfusion for stable and non‐bleeding, non‐cardiac adult patients in the hospital setting. The most common transfusion threshold was 7.0 gm/dL hemoglobin (13/24; 54%). Others reported 6.5 (4.2%), 7.5 (17%), 8.0 (21%), and 8.5 (4.2%) gm/dL. Eight of the 24 (33%) clinicians reported inclusion of specific exceptions in the guideline for outpatients receiving myelosuppressive therapy.
Institutional RBC Guideline Audits
Eleven of 24 clinicians (46%) are notified when transfusion orders fall outside institutional guidelines, six prospectively. Hem/onc clinicians with an institutional guideline were asked if they are routinely given exemption from RBC transfusion guideline audits or enforcement. For the inpatient setting, responses were 38% (9/24) ‘yes’, 38% (9/24) ‘no’. Similarly, for the outpatient setting, responses were 33% (8/24) ‘yes’, 38% (9/24) ‘no’.
Clinical Practice
Sixteen of 24 (67%) clinicians self‐reported ‘out of guideline’ RBC transfusions in the past three months. Approximate number of instances ranged from one to 20 and represented 0.33% ‐ 50.0% of the total transfusions ordered (mean 20.4%, median 16.0%). Following were the most frequently selected reasons for exceptions:
Specific request of a patient seeking improved daily quality of life (less fatigue, etc.) (46%; 11/24);
Medical judgment in a specific clinical setting (38%; 9/24);
To extend interval for follow‐up visits due to travel distance or difficulty (33%; 8/24).
Conclusion: Institutions vary in RBC transfusion threshold and exceptions/exemptions made for hem/onc patients. Two thirds of clinicians reported ‘out of guideline’ transfusions based on medical judgment or considerations of patient quality of life. Evidence‐based guidelines specific to this patient population are needed, specifically prospective randomized trials that include objective clinical outcomes as well as quality of life measures.
Pediatric Transfusion Medicine
CP144
ABO‐Mediated Hemolytic Disease of the Newborn Requiring Exchange Transfusion
Jenna Khan*1, Monica B. Pagano2 and Ryan A. Metcalf2
1University of Washington Medical Center, 2Division of Transfusion Medicine, University of Washington
Background/Case Studies: ABO incompatibility between mother and baby is the most common cause of hemolytic disease of the newborn (HDN). Direct antiglobulin testing (DAT) of the neonate's blood may be positive and phototherapy may be required for hyperbilirubinemia. Only very rarely does HDN due to ABO incompatibility require a neonatal exchange transfusion.
Study Design/Method: This is a case report of ABO HDN meeting criteria for exchange transfusion and brief review of the literature.
Results/Finding: A 30‐year‐old G5P0222 African‐American female, blood type O, RhD positive with prior history of intrauterine fetal demise at 27 weeks underwent spontaneous vaginal delivery at 37 weeks of a 2.8kg female infant. The mother's antibody screen was negative and cord blood testing showed the neonate's blood type was B, RhD positive with a positive DAT. An elution was positive against both A and B reagent cells. Total serum bilirubin levels rose rapidly the day after delivery to 17.3mg/dL at 18.5 hours despite intensive phototherapy and a partial dose of IVIG. Testing for G6PD deficiency and hereditary spherocytosis was negative. The patient underwent double volume exchange transfusion (450ml) of reconstituted whole blood (hematocrit 40%) that evening with adequate response. Maternal anti‐B IgG titers were elevated at 1024, which is consistent with cases reported in the literature requiring invasive therapy at 1024 or greater.1 While ABO HDN is typically mild, there are scattered severe cases reported in the literature requiring exchange transfusion. Some reports have suggested BO incompatibility in individuals of African descent may be risk factors for severe ABO HDN, but well‐documented cases meeting criteria for exchange transfusion are few and both BO and AO incompatibility have been reported.1‐4
Conclusion: We report a case of ABO HDN meeting the American Academy of Pediatrics criteria for neonatal exchange transfusion due to BO incompatibility in a mother of African descent. Exchange transfusion improved the hyperbilirubinemia, avoided severe hyperbilirubinemia (>25mg/dL), and resulted in a favorable outcome. ABO HDN is not always mild and close coordination between the transfusion service and neonatologists is key for prompt management. Whether BO incompatibility and being of African descent are risk factors for needing an exchange transfusion requires further characterization.
References:
1 Bakkeheim, E. etal Maternal IgG anti‐A and anti‐B titres predict outcome in ABO‐incompatibility in the neonate Acta Paediatr. 98, 1896‐1901 (2009).
2 Christensen, R. D. etal Causes of hemolysis in neonates with extreme hyperbilirubinemia J Perinatol 34, 616‐619 (2014).
3 Goraya, J. etal Unusually severe ABO hemolytic disease of newborn Indian J Pediatr 68, 285‐286 (2001).
4 McDonnell, M. etal Hydrops fetalis due to ABO incompatibility Arch. Dis. Child. Fetal Neonatal Ed. 78, F220‐221 (1998).
CP145
Auto Anti‐E in a 2 Month Old Male: A Case of IPEX
Andrew Daniel Jones*1 and Sarah Barnhard2
1UC Davis Health, 2UC‐Davis Medical Center
Background/Case Studies: A 2 month old boy presented to our institution after a 1 month hospitalization in Japan. He was admitted there, several weeks after his unremarkable term birth to an AB Rh positive woman, with lethargy, failure to thrive, bloody mucoid stools with eosinophilia, and an elevated serum white count. He was found to be anemic and thrombocytopenic and required multiple transfusions. Also, he had a diffuse, scaling, erythematous rash over his inner thighs.
Study Design/Method: Initial workup was suspicous for an allergic/necrotizing enterocolitis. The patient had an elevated LDH and potassium, and concern was raised for leukemia with possible tumor lysis syndrome. A sample sent to our blood bank showed an anti‐E, with a positive DAT (IgG and complement), and was positive for E, e, and C antigens. Concern for a maternally‐induced antibody was raised, as was the possibility of a red cell antigen passively transfused from blood products administered at the Japanese hospital; both possibilities were excluded. Further workup revealed no infection or hematologic proliferation. Biopsy of his rash showed spongiotic dermatitis. His clinical course deteriorated, and he developed hepatomegaly and jaundice. A concern for Wiskott‐Aldrich syndrome was raised, and workup showed normal immunoglobulin levels, but with elevated IgE (15270 kU/L; RR: 0‐2.9). Anti‐platelet antibodies were identified. Three days after admission, testing was sent for genetic alterations of FOXP3, while a Japanese‐speaking physician at our institution read a prior flow cytometry study showing a deficiency of FOXP3+ CD4+ lymphocytes.
Results/Finding: Over 70 mutations of FOXP3 have been implicated in a syndrome called IPEX (immune dysregulation, polyendocrinopathy, enteropathy, X‐linked). The FOXP3 protein is a transcription factor regulatory protein constitutively expressed in CD4+ regulatory T cells (Treg), and is the “master regulator” of Treg development and function. Mutations in this gene, located at Xq11.3‐q13.3, result in decreased tolerance to self antigens and resultant autoimmune disease. Patients, all male, present prenatally or within months of birth, often with profuse watery and bloody diarrhea, and then develop a variety of autoimmune conditions (DMI, dermatitis, thyroid disease, renal failure, cytopenias). Our patient had a mutation (c.1189C>T [p.Arg397Trp]) located within the protein's DNA‐binding domain, associated with high mortality in reported cases. The mutation results in a loss of the FOXP3 protein and loss of the inhibitory action of Tregs on B cells (leading to autoantibody proliferation) and on T effector cells (leading to Th2 proliferation, IL‐5 overexpression, and eosinophilia), in addition to the overexpression of IL‐17 producing T‐cells. Not all patients with this mutation have similar clinical courses, suggesting other genetic interactions, epigenetic diversity, and environmental cofactors in disease progression. Standard of care includes immunosuppression and SCT.
Conclusion: While rare, the presentation of a neonatal patient with a positive antibody screen and DAT with a negative maternal workup is cause to consider possible autoimmune processes, including IPEX.
CP146
Benchmarking Utilization of Thawed Plasma in a Pediatric Hospital to Reduce Wastage
Kathleen Nicol*, Erin Meyer, Stephanie Townsend and Elizabeth Nartowicz
Nationwide Children's Hospital
Background/Case Studies: Per the ABBB Circular of Information, the indications for plasma transfusion are the reversal of warfarin if bleeding, management of coagulopathic patients and exchange in TTP patients. The majority of these indications are seen in adults and for which a reported plasma wastage is ∼1.8%. Fortunately in pediatrics the incidence of these indications is low despite the heterogeneity of the patient population. During the utilization review process at our primary pediatric institution, we noted a mean wastage of 8.2% over the last 5 years. With recent changes in clinical practice (liver transplants and increased trauma) and recent evidence that faster plasma improves massive transfusion protocol (MTP) outcomes, our facility decided to implement the use of thawed plasma and benchmark MTP plasma wastage.
Study Design/Method: Blood Utilization Review revealed an increase in the overall percentage of plasma wastage from 2014 to 2016, with a peak of 11.6% (range 3.2%‐11.6%). A single cause could not be readily identified prompting us to query Children's Hospital Association (CHA), as our initial external pediatric benchmarking, to determine if our wastage was comparable to other children's hospitals in addition to reviewing our “time of plasma availability” for 2016 MTPS.
Results/Finding: In 2016, MTP was activated 28 times. In 6 cases the patient did not receive any blood product and in 11 cases plasma was already available at the time of RBC allocation/issue. This left 11 cases to evaluate. The median time to plasma availability was 29 minutes (range 4 minutes ‐61 minutes). The mean plasma wastage for MTP activations was 32% (range 0‐100%). Of the 9 CHA replies, 3 were using thawed plasma and their wastage was </= 5%.
Conclusion: Increasing clinical evidence supports the prompt transfusion of plasma in the setting of MTP to decrease morbidity and mortality. Our brief review suggests that implementing thawed plasma will allow a potential decrease in plasma availability of 29 minutes. Our implementation began with thawing a single unit of plasma for “Level 1 Neuro Trauma” alerts, and we are now keeping a single unit of AB plasma thawed at all times. Plasma is now available at the same time as RBCs thus providing more effective and balanced blood product support while reducing wastage (preliminary estimates are 9.5 %) to a level consistent with external benchmarking. Prospective evaluation of this practice is ongoing at our institution and includes collaborative clinical assessment with the Trauma Team. Ultimately prospective, multi‐institutional studies in pediatric institutions are necessary to define best clinical practice and effectively benchmark blood bank practice.
CP147
Direct Antiglobulin Test (DAT) Negative Autoimmune Hemolytic Anemias in Children
Jonathan Miller*1, Anupama Narla1 and Jennifer Andrews2
1Stanford University, Dept of Pediatrics, 2Stanford University, Dept of Pathology & Pediatrics
Background/Case Studies: DAT testing is negative in 3‐11% of autoimmune hemolytic anemias (AIHA) (1‐3). The primary explanations for DAT‐negative AIHA include 1) low quantity IgG, 2) low affinity IgG, 3) IgA and IgM mediated hemolysis, or 4) cell mediated hemolysis (4). When suspicion for AIHA remains high despite a negative DAT, clinicians should consider further serologic testing. Various serologic aids exist and can be performed by specialized laboratories. Here we describe 11 pediatric cases of DAT‐negative AIHA identified with specialized testing.
Study Design/Methods: We performed a retrospective chart review of patients undergoing investigation of DAT‐negative autoimmune hemolytic anemia at Lucile Packard Children's Hospital Stanford between January 1, 2010 and August 1, 2016. Eleven pediatric cases warranted further specialized laboratory testing upon presentation to a general Hematology clinic.
Serologic testing was performed at the Immunohematology Research Laboratory (IRL), American Red Cross Blood Services, Southern California Region, in Pomona, CA. Testing included: anti‐IgA, anti‐IgM and anti‐C3; retaining low‐affinity RBC‐bound autoantibodies using cold low ionic strength saline (LISS); and detecting RBC‐bound IgG through the direct Polybrene test. All cases had positive testing and confirmed diagnosis of AIHA.
Results/Findings: Eleven cases are presented in table 1.
TABLE 1. Characteristics of children with DAT negative AIHA.
| Age (in years) | Co‐morbidities | Hemoglobin (g/dL) | Absolute reticulocytes, (K/uL) (%) | LDH (U/L) | Haptoglobin (mg/dL) | Total bilirubin (mg/dL) | IRL positive test |
|---|---|---|---|---|---|---|---|
| 25 | DBA* post stem‐cell transplant | 10.3 | 37.0 (1.30) | 632 | <8 | 2.5 | IgG |
| 11 | Aplastic Anemia post stem‐cell transplant | 11.9 | 131.8 (4.26) | 915 | <8 | 0.2 | C3 |
| 14 | positive ANA^ | 6.3 | 646.0 (29.98) | 693 | <8 | 2.5 | IgA, IgG polybrene |
| 1.4 | bronchiolitis | 8.0 | 21.1 (0.92) | 444 | <8 | 2.4 | C3 |
| 14 | ALL‡ | 9.9 | 127.0 (4.79) | ND§ | <8 | 0.8 | C3 |
| 5 | HLH∥, immunodeficiency, Fraser Syndrome | 7.1 | 63.1 (2.14) | ND§ | ND§ | 0.6 | C3 |
| 0.33 | splenomegaly | 8.3 | 270.9 (8.87) | 331 | 39.7 | 0.3 | C3 |
| 12 | Evan's Syndrome | 9.8 | 62.0 (1.73) | 744 | <8 | 0.3 | C3 |
| 13 | ALL‡ | 8.1 | 62.5 (2.7) | 239 | <8 | 0.7 | C3 |
| 0.75 | none | 5.0 | 304.7 (19.39) | 584 | <8 | 2.2 | IgG LISS |
| 4 | DBA* | 8.9 | UD# (<0.45%) | 364 | <8 | 1.6 | IgG |
DBA = Diamond‐Blackfan anemia; ^ANA = anti‐nuclear antibody; ‡ALL = acute lymphoblastic leukemia; §ND = not done; ∥HLH = hemophagocytic lymphohistiocytosis; #UD = undetectable 930
Conclusion: Specialized testing in an IRL led to definitive diagnosis in eleven cases and correct treatment at a large academic referral Hematology clinic.
References
1 Worlledge SM, Blajchman MA: The autoimmune haemolytic anaemias Br J Haematol 23:61‐69, 1972
2 Chaplin H Jr: Clinical usefulness of specific antiglobulin reagents in autoimmune hemolytic anemias Progr Hematol 8:25‐49, 1973
3 Petz LD, Garratty G: Acquired Immune Hemolytic Anemias: New York, NY, Churchill Livingstone, 1980
4 Garratty G: Immune Hemolytic Anemia Associated With Negative Routine Serology Semin Hematol 42:156‐164, 2005
CP148
Granulocyte Transfusion for Pediatric Patients Non‐Responsive to Antibiotic and Antifungal Undergoing High‐Dose Chemotherapy and Hematopoietic Stem Cell Transplantation
José Roberto Luzzi*, Daniel Bassetto Jesuino, Roberta Araújo Navarro‐Xavier, Valéria Cortez Ginani, Claudio Carneiro Borba and Edna Harumi Goto
Hospital Samaritano Blood Bank and Transfusion Service
Background/Case Studies: Bacterial and fungal infections remain a significant cause of morbidity and mortality in severely neutropenic patients with hematological disease receiving high‐dose chemotherapy and hematopoietic stem cell transplantation (HSCT). Granulocyte transfusions (GTx) have been used for over 40 years, although effectiveness, indications, and both patient and donor safety remain debated, particularly in children. To contribute to this discussion we demonstrated 5 cases of GTx in pediatric patients with age from 8 months to 16 years old, neutropenic, with severe infection resistant to antibiotics and/or antifungal therapy, undergoing HSCT and chemotherapy.
Study Design/Method: Donors: Data concerning a total of 56 granulocytes donations from 2015 to 2016 were collected from 43 health donors (21 male/ 22 female). Donors had matched blood type and serology status for cytomegalovirus when the patient was negative. Granulocytes were mobilized with a single dose of rHu‐G‐CSF (Filgrastim) subcutaneously, 5mcg/kg/dose (donors up to 70kg, maximum of 600mcg) and oral dexamethasone (8mg), 12h prior to apheresis. Apheresis was performed using Cobe Spectra® or Spectra Optia® with citrate as anticoagulant. All products were irradiated with 40Gy.
Results/Findings: Granulocytes number increased 5 times from basal levels and the median of cells collected were 4.89 x10¹⁰ (range 1.09‐9.85). In general donors reported no significant adverse reactions. From 56 donations, only in 4 was reported light paresthesia during the procedure. Patients: All patients were medicated prior to transfusions with diphenhydramine and acetaminophen. The product was transfused within 24 hours after collection, with efforts to transfuse as soon as possible. Details about the transfusions are described on Table 1. Adverse reactions for patients were minor and not frequent (4in 66 GTx) including vomiting, hypotension and headache, which resolved without serious or lasting complications, assuming that GTx is well tolerated.
Conclusion: Our study provides further evidence that GTx transfusions can be safely performed on pediatric patients.
TABLE 1. Granulocyte Transfusion profile
| Age (years) | Weight (kg) | Number of GTx |
Median cell x 1010 |
Median cell x 109/kg/transfusion |
|---|---|---|---|---|
| 10 | 40 | 5 | 5.81 | 1.45 |
| 8 months | 6 | 8 | 3.28 | 2.33 |
| 9 | 32 | 14 | 4.00 | 1.22 |
| 14 | 62 | 14 | 5.12 | 0.81 |
| 16 | 45 | 25 | 4.59 | 1.09 |
CP149
Granulocyte Transfusion in Neutropenic Patients and Patients with Granulocyte Disorder
Irina Kumukova*1, Elena Kurnikova1 and Pavel Trakhtman2
1Russian Institute for paediatric haematology, oncology and immunology, 2InstitutefFor Pediatric Hematology, oncology and immunology
Background/Case Studies: Infections cause major mortality among persons with prolonged neutropenia related to HSCT and chemotherapy and among patients with granulocyte disorder. The granulocyte transfusion therapy, a logical approach in treating patients with infections, who are refractory to antibiotics. We want to demonstrate our granulocyte transfusions experience in children who have neutropenia or defects of the immune system, with severe infections
Study Design/Method: We analyzed the retrospective data for the period 04/2012‐02/2016. Donors underwent granulocyte mobilization with G‐CSF in a dose 3‐5 µg/kg s.c. 12‐16 hrs prior to donation; granulocytes were collected with COBE Spectra, CaridianBCT. The analysis was performed through Microsoft Excel, nonparametric Mann‐Whitney's and Spearman tests
Results/Finding: Was performed 169 granulocytes collections in 153 donors (82 f, 71m), ages 18 to 58. The mean increment of WBC after stimulation was 22,6x10^9/L (9,2‐41,9 x10^9/L; f‐23,2 x10^9/L; m‐21.9 x10^9/L); in the age groups 18‐39 years (n=121) and over 40 years (n=32), the mean increment of WBC was respectively 22,2 x10^9/L (9,2‐41,9x10^9/L) and 24,02x10^9/L (12,6‐35 x10^9/L). The mean volume of treated blood was 6082ml (2343‐7645ml; f‐5554ml, m‐6710ml); the mean volume of product was 314,7ml (152‐420ml; f‐314,8ml, m‐315,2ml) (p=0,566, α=0,05). The mean number of total WBC in the product was 38,43x10^9/L (13.38‐77x10^9/L; f‐34,8x10^9/L, m‐42,7x10^9/L). Only three donors (1,96%) had apheresis‐related adverse effects
The analysis included 244 granulocyte transfusions in 35 cases of infectious complications in 32 patients. The mean number of transfusions was 6.9 (1‐60). Each patient received transfusions from mean 5 donors (1‐32); the granulocyte transfusions started at the mean 8 days (2‐30) after infection; the mean dose of WBC on the transfusion was 11.6x10^8/kg (2‐30.7x10^8/kg). WBC increment was able to estimate after 144 transfusions. WBC increment was recorded after 96 transfusions (66.7%); the mean increment was 1,12x10^9/L (0,01‐11,38 x10^9/L).
Efficacy was determined by the number of patients who survived an infection episode and amounted to 80.6%. In the cases of severe sepsis, the efficacy of transfusions was 76.2%. The frequency of post‐transfusion reactions was 22%, (n = 8): febrile nonhemolytic reactions 8,3% (n = 3); pulmonary complications 11,1% (n = 4); the anti‐HLA antibodies formation 2,7% (n = 1)
Conclusion: No significant differences in the mobilization of granulocytes and products’ volume, between men and women, or between age groups and we did not find significant relationship between baseline WBC and their increment after stimulation. The mean total WBC in the collected product and the mean volume of treated blood from men and women were significantly different. Perhaps the reason for lower cell products from women is to treat smaller blood volume. The lack of increment WBC after transfusion is not equivalent to lack of its efficacy. We found a significant association between transfused dose and increment of WBC. We deliberately did not estimate our data on the treatment of patients with sepsis and other severe infections between patients receiving and not receiving granulocyte transfusions because the need for transfusions of granulocytes indicates more severe patients, when they have infections in a neutropenia or dysfunction of the immune system, and refractory to antibiotics
CP150
Hemolytic Disease of the Newborn Due to Anti‐Rh17
Keegan Barry‐Holson*1 and Jennifer Andrews2
1Stanford University, Dept of Pathology, 2Stanford University, Dept of Pathology & Pediatrics
Background/Case Studies: Anti‐Rh17 is a rare antibody against a high incidence red blood cell (RBC) antigen (Ag) present in people with common Rh phenotypes. This Ag is missing in individuals who are Rh null or have Rh deletion phenotypes, including D‐‐/D‐‐. D‐‐ individuals strongly express D and lack C, c, E, and e Ags. The clinical relevance of anti‐RH17 has primarily been reported in pregnant women, causing mild to fatal hemolytic disease of the newborn (HDN). We present a rare case of HDN due to anti‐Rh17 alloimmunization during pregnancy in a D‐‐ mother.
Study Design/Methods: An O‐positive full term infant was born to an O‐positive G3P1 > 2 mother with a negative 1st trimester antibody screen and no prior transfusions. She had two prior pregnancies, the first resulted in a normal term singleton, and the second resulted in a spontaneous miscarriage during the 1st trimester. Father's blood type is unknown but presumably he has Rh antigens. The infant was transferred to our institution at 6 hours of life because he was found to have anemia (hemoglobin 12.0g/dL), severe hyperbilirubinemia (total bilirubin (t Bili) 9.0mg/dL), reticulocytosis (8%) and a positive direct antiglobulin test (IgG 2+). He was admitted to our neonatal intensive care unit for potential need for exchange transfusion given concern for HDN. He was treated with intravenous immunoglobulin and triple phototherapy on the day of admission, temporarily blunting his hemolysis. T bili rose to a maximum of 16.7mg/dL on day 8 of life and phototherapy was re‐started. His t bili subsequently stabilized and he was discharged home and followed in clinic. Meanwhile, his mother donated blood given there were no compatible red blood cells available in the United States via rare donor query. Nine days after discharge, he was readmitted for worsening anemia (hemoglobin 6.3g/dL) and was given steroids and washed maternal red blood cells. He was discharged and followed in clinic for several months with ultimate resolution of his anemia and hyperbilirubinemia.
Results/Findings: At delivery, the mother's antibody screen was positive and anti‐Rh17 was identified; no other alloantibodies were detected. Antibody identification was performed using polyethylene glycol, low ionic strength solution and ficin enhancement. Maternal serum was pan reactive against panel cells and non‐reactive against D‐‐ cells. Anti‐Rh17 sera did not react against maternal RBCs. Phenotyping of the mother revealed that she was D+ C‐ E‐ c‐ e‐. Molecular testing confirmed her D‐‐ genotype; Molecular BeadChip Test yielded no type due to low signal for e, E, V and VS Ags. Genotyping for Rh variant and targeted genomic RHCE testing failed to detect several RHCE exons. Father was unavailable for further testing.
Conclusion: We report a rare case of HDN due to anti‐Rh17 antibody in a D ‐‐ mother. We hope to obtain further laboratory studies in maternal relatives given the rarity of this phenotype in the general population. These studies have important implications for genetic counseling for mother's sisters.
CP151
Management of Severe Autoimmune Hemolytic Anemia: A Case Report of an Infant Treated with Manual Whole Blood Exchange with Rapid Clinical Improvement
Yunchuan Delores Mo*1, Cyril Jacquot1, Valli Criss1, Philippe P Pary1, Jay Greenberg1, Naomi LC Luban1 and Edward CC Wong2
1Children's National Medical Center, 2Quest Diagnostics
Background/Case Studies: Management of severe autoimmune hemolytic anemia (AIHA) presenting with life‐threatening anemia is challenging, particularly in the pediatric population. Mortality rates in AIHA are typically low; however, in children, the rate may be as high as 4‐11%. Although corticosteroids and immunomodulatory therapies are first line modalities, several case reports describe the use of manual whole blood exchange (WBEX) to successfully treat AIHA in older children and adults refractory to first line treatment. To our knowledge, this is the first case report in which an infant with severe AIHA has been successfully treated with manual WBEX in an acute care setting.
Study Design/Methods: Case report format.
Results/Findings: A 2 month‐old previously healthy female patient presented to the emergency department with hemodynamic instability and a nadir hemoglobin (Hb)/hematocrit (Hct) of 1.6g/dL/4.9%. WBC counts (19 x 109 /L) were mildly elevated and platelet counts (410 x 109 /L) were within normal limits. Her history was notable for upper respiratory tract infection 6 days prior to the onset of anemia. Laboratory studies on admission showed hyperbilirubinemia (total 7.1mg/dL, direct 1.4mg/dL), normal LDH (318 U/L), and undetectable haptoglobin (<7mg/dL) indicative of ongoing hemolysis. Clinical symptoms included diffuse jaundice, hemoglobinuria, lethargy, and emesis. She was admitted to the pediatric intensive care unit for further management, including right internal jugular central venous catheter placement due to poor peripheral vascular access.
The patient's blood group was O, Rh (D)‐negative with a positive antibody screen and panel demonstrating a strong panagglutinin (3‐4+ reactivity) with positive autocontrol. DAT was 4+ positive for anti‐IgG and negative for C3 despite a positive cold antibody screen.
The patient weighed 6.9kg with an estimated total blood volume of 620mL. She initially received simple transfusions totaling 20mL/kg of least incompatible group O Rh(D)‐negative RBCs with no incremental response. Manual WBEX was then performed with 463mL of reconstituted whole blood consisting of O, Rh(D)‐negative RBCs and AB fresh frozen plasma (FFP) to an Hct of 40%, utilizing the central venous catheter. No adverse events took place over the course of the 2 hour exchange. Her one hour post‐exchange Hb was 9.5g/dL and a subsequent antibody screen demonstrated reduced intensity of the panagglutinin (2+). After initiation of steroid therapy (methylprednisolone, 2mg/kg/day), she continued to improve clinically. One week later, the patient was discharged home with a Hb of 11g/dL. One month later, she experienced recurrent hemolysis requiring re‐hospitalization, at which time she had normal IgM and IgA levels with markedly elevated IgG levels (3168mg/dL). At a subsequent follow‐up visit 3 months after her initial presentation, her anemia had resolved and she had been completely weaned off steroids.
Conclusion: We demonstrate a case of severe neonatal AIHA successfully treated with manual WBEX. The main advantages of WBEX include removal of both autologous RBCs and plasma as well as infusion of allogeneic RBCs. In this case, manual exchange transfusion avoided the need for an automated apheresis procedure requiring citrate anticoagulation. In summary, manual WBEX is a potentially safe procedure that may be performed in young children with severe AIHA.
CP152
Mechanical Hemolysis in Pediatric Patients Associated with Rapid Transfusion and One‐Way Valve
Thomas John Gniadek*1, Martina Richtsfeld2, Shelley Pulkrabek1, Kayla R H Fahey‐Ahrndt3, Susan Barnett3, Nitasha Joyner4, Stephanie Kinney1, Nicole D Zantek1, Anthony Azakie5 and Claudia S. Cohn1
1Department of Laboratory Medicine and Pathology, University of Minnesota, 2Department of Anesthesiology, University of Minnesota, 3Blood Bank, Fairview Health Services, 4University of Minnesota Medical Center Fairview, 5Division of Pediatric Cardiac Surgery, University of Minnesota Masonic Children's Hospital
Background/Case Studies: Recently, four similar transfusion reactions involving infants were reported at our institution. After transfusion in the operating room, each experienced blood‐colored urine, laboratory evidence of hemolysis, and acute kidney injury. Clerical and serologic investigations revealed no cause for hemolysis. Mechanical hemolysis from transfusion rate, catheter gauge, or a recently introduced one‐way valve was considered.
Study Design/Methods: In vitro simulated transfusions were performed via syringe. Measurements included hematocrit (Hct), free hemoglobin, and visual hemolysis index. Washed and unwashed red blood cells (RBCs) were tested with or without a one‐way valve, using a 24 or 16 gauge (G) intravenous (IV) catheter. Each one‐way valve was used to test three identical samples. Constant pressure was applied manually (rapidly, 1.43+/‐0.49ml/second) or with a mechanical syringe pump (slowly, 2ml/min). A subset of the manual transfusions was timed. Control samples for baseline measurements were collected by gravity drip, without passing through the one‐way valve or catheter.
Results/Findings: The one‐way valve increased hemolysis markedly during rapid transfusion using both catheters as well as both washed and unwashed RBCs (see Table). With the 24G catheter, the mean change in Hct was ‐3.53+/‐0.69% with the one‐way valve and 0.22+/‐0.13% without (p<0.00001). Comparing the one‐way valves tested, differences in hemolysis were observed (change in Hct; p<0.0001). During rapid manual transfusion with a 24G catheter and unwashed RBCs, hemolysis was greater for samples that took longer to transfuse 4.5ml when using a one‐way valve (change in Hct versus time: r=‐0.75, p<0.0001) compared to a significantly different (p=0.0085) slight increase in hemolysis for samples that took less time to transfuse 4.5ml when not using a one‐way valve (change in Hct versus time: r=0.58, p=0.23). Correlations between time and hemolysis were similar, but insignificant using 24G with washed RBCs and the 16G IV catheter.
Conclusion: Mechanical hemolysis should be considered when investigating possible hemolytic transfusion reactions, especially with high rates of transfusion and use of a one‐way valve. During rapid manual transfusion with the one‐way valve, greater resistance was associated with increased hemolysis.
TABLE 1. CP152
| Syringe Pump | Rapid Manual Push | |
|---|---|---|
| 16G, unwashed, ‐valve | NT | ‐0.07+/‐0.15 (6) |
| 16G, unwashed, +valve | NT | ‐3.38+/‐1.37 (6) |
| 16G, washed, ‐valve | NT | 0.30+/‐0.32 (6) |
| 16G, washed, +valve | NT | ‐2.87+/‐1.05 (6) |
| 24G, unwashed, ‐valve | 0.23+/‐0.31 (3) | 0.1+/‐0.17 (9) |
| 24G, unwashed, +valve | ‐0.20+/‐0.23 (3) | ‐3.25+/‐0.69 (27) |
| 24G, washed, ‐valve | ‐0.13+/‐0.19 (3) | 0.33+/‐0.20 (9) |
| 24G, washed, +valve | 0.03+/‐0.29 (3) | ‐3.88+/‐1.31 (21) |
Values are average change in hematocrit (%) +/‐ standard error and (number of samples). NT=not tested.
CP153
Multidisciplinary Management of Gerbich Hemolytic Disease of the Newborn
Rebecca N. Levitt*1, Gregory A. Denomme2, Christoph Gassner3, Grace Banez‐Sese4, Terri Craddock4, Kathleen Ammann5, Abdus Salam6, Gloria McManama6, Theresa M. Boyd6 and Elizabeth Yang7,8
1Inova Children's Hospital, 2BloodCenter of Wisconsin, 3Swiss Red Cross, 4Inova Blood Donor Services, 5Inova Loudoun Hospital, 6Inova Fairfax Hospital, 7Pediatric Specialists of Virginia, 8George Washington University School of Medicine
Background/Case Studies: Gerbich (Ge) antigens expressed on glycophorin C are present in 99.9% of the population. Ge antibodies cause delayed hemolytic transfusion reactions and hemolytic disease of the fetus and newborn (HDFN). Ge antibodies also suppress erythropoiesis resulting in late‐onset anemia. We report a case of HDFN due to anti‐Ge3.
Study Design/Methods: A woman of Paraguayan origin with prior terminated pregnancies presented at 24 weeks gestation with passive anti‐D and an anti‐Ge3 titer of 256. She was D‐ and GE:‐2,‐3, 4 by antigen typing. Her obstetrician scheduled maternal blood collection near her due date for possible neonatal transfusion, but the woman went into labor at 37 weeks. Cord blood was DAT positive for IgG; the eluate confirmed anti‐D and anti‐Ge3. The birth hemoglobin (Hgb) was 12.6g/dL, reticulocyte (retic) was 8.6%, bilirubin (bili) was 2.8mg/dL; the infant was discharged. On day 7 of life, the infant was referred to Pediatric Hematology for lethargy and poor feeding, with Hgb 7.6g/dL, retic 2.6%, and bili 6.6mg/dL. Ge3‐ blood was not available from the blood center or rare donor registry. The mother was B Rh‐ and baby was B Rh+. Obstetrics had to authorize maternal blood donation due to her Hgb of 10.9g/dL. Maternal blood collection and RBC washing was expedited and the infant received 40mL of maternal RBCs within 24 hours, at which time his Hgb was 6.1g/dL. Post‐transfusion Hgb was 10.8g/dL. One week later, the infant was symptomatic with Hgb 7.1g/dL, retic 1.0%, bili 2.1mg/dL. A 2nd aliquot of 60mL washed maternal cells was transfused. Two weeks thereafter, the infant had Hgb 7.8g/dL, retic 0.7%, anti‐Ge3 titer 8, and needed another transfusion. The maternal blood stored for just 3 weeks had hemolyzed necessitating a 2nd maternal donation for baby's 3rd transfusion. At 6 weeks, the infant's anti‐Ge3 titer was 2, Hgb 9.2g/dL, retic 1.7%; no transfusion was necessary. At 8 weeks of life, Hgb was 10.2g/dL, retic was 3.3%, and the baby was thriving.
Results/Findings: Serologic studies at the hospital and reference blood center confirmed the antibodies and risk of anti‐Ge3 HDFN. Molecular analysis revealed that the mother was homozygous Ge3‐negative GE*01.‐03, the father had homozygous wild type GE*01, and the infant was heterozygous GE*01/GE*01.‐03.
Conclusion: The infant had HDFN due to antibodies to the high prevalence Ge3 antigen. The continued need for transfusion was consistent with hemolysis and suppression of erythrocyte production caused by anti‐Ge3. Hemolysis of stored maternal blood was consistent with the absence of glycophorin C. This case demonstrates that cooperative multidisciplinary care among the blood bank, donor center, obstetrics, and hematology in a rare case of HDFN resulted in a successful neonatal outcome.
CP154
Pediatric Blood Utilization: Optimizing Transfusions in a Very Heterogeneous Population
Ashley Bragg1, Winnie Yung1 and Jennifer Andrews*2
1Stanford Children's Health, 2Stanford University, Dept of Pathology & Pediatrics
Background/Case Studies: Patient blood management is a collaborative approach to optimize transfusion therapies to improve patient outcomes. In pediatrics, blood management is not ‘one size fits all’ given the paucity of clinical trials to guide evidence‐based practice. In addition, pediatric care encompasses a very heterogeneous patient population such that applying one set of guidelines is difficult.
Because there are no standard, evidence‐based clinical best practices regarding blood product usage in all children, unnecessary variation is occurring at our institution. We designed a robust analytics process to study baseline clinical practice and examine blood product usage, and plan to target the three pediatric sub‐specialties with highest usage to establish standards in order to decrease variation/unnecessary transfusions.
Study Design/Methods: A data base encompassing all admissions and outpatient visits to a large, tertiary care academic children's and women's hospital was established, and included all relevant patient demographics, diagnostic and procedural codes, attending physician and specialty for each visit/admission, relevant hematology/coagulation laboratory results and blood product orders. We focused on RBC orders given the TRIPICU randomized clinical trial results (1) supporting a hemoglobin trigger of 7g/dL in stable critically ill children and FFP since anecdotally we noted many children receiving this product for only minimally elevated international normalized ratio (INR) values without bleeding.
Results/Findings: In 2016, 14, 247 RBC orders occurred and the top three patient groups were: 34% in congenital heart disease patients, 25% in hematology/oncology patients and 14% in neonates in the neonatal intensive care unit (NICU). Average hemoglobin of every patient was 9.85g/dL as measured in the 72 hours prior to RBC order placement. In 2016, 3105 FFP orders occurred and the top three patient groups were: 46% in neonates in the NICU, 28% in congenital heart disease patients and 13% in pediatric intensive care patients. Average INR of every patient was 2.09 as measured in the 72 hours prior to FFP order placement.
Conclusion: We have designed a robust data base that is continually updated for children in a large, tertiary care academic children's hospital. This serves as an important benchmark in pediatric blood utilization, and we plan to leverage usage patterns to make relevant practice changes in the care of children with a heterogeneous set of illnesses.
1. Lacroix J, Hubert PC, Hutchison JS etal. Transfusion strategies for patients in pediatric intensive care units. NEJM 2007;356:1609‐19.
CP155
Phased Integration of Pathogen Reduced Platelets (PR‐PLTS) into Inventory at a U.S. Academic Medical Center: Preliminary Assessment of Impact on Pediatric Patient Care
Eric Gehrie*1,2, Bryan R. Spencer2,3, Scott Merenda2, Amit Gokhale4,5, Rita Palmarozza2, Jeanne Hendrickson2,5, Rebecca Ross5 and Edward L. Snyder2,5
1Johns Hopkins University School of Medicine, 2Yale University, 3American Red Cross, 4Yale University School of Medicine, 5Yale‐New Haven Hospital
Background/Case Studies: Bacterial contamination of PLTs remains an ongoing threat to transfusion recipients. Recently, a psoralen‐based PR technology that reduces the replication potential of pathogens in stored PLTs was FDA approved. We describe our approach to phasing PR‐PLTs into our inventory, including preliminary results of an ongoing QA study of neonatal and pediatric (PEDS) recipients of PR‐PLTs.
Study Design/Methods: Before the arrival of PR‐PLT, we undertook an educational campaign for hospital administrators, IT staff, laboratory staff, clerical/clinical aides, nurses, and physicians. We also contacted risk management and the hospital ethics committee. Phototherapy devices used at our hospital were confirmed to be compatible with the psoralen‐based PR‐PLT product. Shortly following the arrival of PR‐PLT, we introduced day 5 bacterial “safety measure” testing of our conventional (C‐PLT) supply. A PEDS QA study monitored PLT utilization and adverse transfusion event reporting relating to both PR‐ and C‐PLT transfusions. This study evaluated neonates (0‐4 months of age), infants (>4‐12 months of age) and children (>12 months‐18 years of age) who received at least one transfusion of PR‐PLTs.
Results/Findings: Risk management and the ethics committee agreed that both PR‐PLTs and bacteria tested C‐PLTs would be the hospital standard of care. PR‐PLTs were phased in and transfused to patients based on ABO compatibility and expiration date, per routine, without regard for patient age or medical condition. After 4 months, PR‐PLT represented 30% of our platelet inventory (average daily PLT inventory: 45 units). We encountered no complications with the PR platelet phase‐in, either from a clinical, informatics or logistical perspective. Due to the dual inventory, many PEDS patients in all age groups were transfused with both PR‐ and C‐PLTs (Table). Two potential transfusion reactions (TRs) were reported over the study period in teenage recipients, one associated with a C‐PLT and the other with a PR‐PLT. In both cases, the symptoms were ultimately attributed to an underlying medical condition. No rashes were observed among 16 transfused neonates (0‐4m) who received any PR‐PLTs and phototherapy.
Conclusion: With adequate coordination, PR‐PLTs can be integrated into a large blood bank without clinical or administrative complications. No unexpected adverse events, rashes, or TRs attributable to PR‐PLTs were detected in the neonatal/pediatric population studied.
TABLE 1. CP155
| Age | Patients Transfused | Patients Transfused With Both PR‐ and C‐PLTs | Patients with Reported TR |
|---|---|---|---|
| PR / C | |||
| 0‐4m | 16 | 8 of 16 | 0/0 |
| 4m ‐ 1yr | 2 | 2 of 2 | 0/0 |
| 1yr – 18yr | 24 | 23 of 24 | 1*/1* |
Febrile, determined to be most likely due to underlying disease
CP156
Rapid Blood Administration Via Small Bore Catheters Does Not Increase Potassium Concentration
Anil Panigrahi*1, Andrew Giustini2, Christopher Miller2, Maria Walker3, Raffick Bowen3, Jennifer Andrews4 and Julianne Mendoza2
1Stanford University School of Medicine, Department of Anesthesiology and Pathology, 2Stanford University School of Medicine, Department of Anesthesiology, 3Stanford University School of Medicine, Department of Pathology, 4Stanford University, Dept of Pathology & Pediatrics
Background/Case Studies: Hyperkalemia is a known complication of red blood cell (RBC) transfusion and can result in life‐threatening arrhythmias or cardiac arrest. Such episodes are more common during rapid transfusion of RBCs in neonates and infants where a small circulating plasma volume is unable to accommodate a rapid potassium bolus. Methods to decrease the magnitude of hyperkalemia in these instances include using fresh RBC, avoiding pre‐transfusion manipulation of RBC (i.e. non‐irradiated products), and slow rate of transfusion. During invasive procedures or traumas with large volume hemorrhage, slow rates of transfusion may not be feasible. Although massive transfusion in adults is often accomplished through the use of rapid transfuser systems, in pediatric patients rapid transfusion is generally achieved using syringe pushes of blood products. Increases in pressure due to forceful delivery of blood via small caliber catheters may result in erythrocyte damage, potassium leak, and higher delivered potassium concentrations.
Study Design/Method: To assess changes in potassium concentration after delivery of RBCs through IV catheters at high pressure, potassium concentrations were measured in the plasma of leukocyte‐reduced, 31‐day old, AS‐1 (Adsol) RBC units after infusion via the Belmont Rapid Infuser system (Belmont Instrument Co.). Flow rates were set at the manufacturer's stipulated maximal rate for the specific catheter or at pressures approximately 300 mmHg if flow was pressure‐limited. Blood was injected through 24 gauge (g), 22g, 20g, 18g, 16g, and 14g peripheral intravenous catheters and 4 French (Fr), 5Fr, 6Fr, 7Fr, and 9Fr central venous catheters. After injection, blood was collected and immediately separated via centrifugation. Potassium concentrations in the supernatant were determined on a Dimension RxL integrated chemistry system (Siemens) using indirect ion‐selective electrodes.
Results/Finding: Consistent with previous studies, baseline supernatant potassium concentrations in 31‐day old AS‐1 (Adsol) RBC units were elevated at 43.9 mEq/L. However, despite achieving pressures >300mm Hg during injection, no statistically significant differences in potassium concentration were observed among catheters or flow rates (ANOVA p=0.29). Potassium values remained between 43‐45 mEq/L for all conditions assayed.
Conclusion: High rate administration of RBCs via small caliber intravenous catheters using a rapid infuser system did not result in appreciable increases in potassium concentration, suggesting minimal increase in hyperkalemia risk from pressure related erythrocyte damage during rapid infusion. High potassium concentration was noted in 31‐day old AS‐1 RBC units, suggesting that fresh RBC units should be used for rapid transfusion of infants and neonates to reduce hyperkalemic risk.
CP157
RBC Transfusion in Calcineurin Inhibitor Related Hemolytic Anemia
Siddhartha Sen*1, Martha Rae Combs2, Jessica Poisson2 and Nicholas Bandarenko2
1Duke University School of Medicine, 2Duke University Hospital
Background/Case Studies: Autoimmune hemolytic anemia (AIHA) occurring after solid organ transplant is not a common entity, however cases have been reported in patients on calcineurin inhibitors. Calcineurin inhibitor‐mediated T cell suppression and dysregulated B cell proliferation have been implicated in the pathogenesis of the hemolytic anemia. While several treatment modalities are available to counter the hemolysis, there is limited information available regarding transfusion guidance and outcomes in these patients. Immunohematology workups in these cases can be complex, and transfusion support may require incompatible RBCs.
Study Design/Method: Two pediatric cases of calcineurin inhibitor related hemolytic anemia following liver transplant at Duke University Medical Center were investigated.
Results/Finding: Patient 1 presented with AIHA (Hgb < 5.2g/dl), pure red cell aplasia and thrombocytopenia approximately 1 year after liver transplant. The pre‐transfusion antibody screen identified pan‐reactive high titer alloantibodies reacting at room temperature, 37OC, and Anti‐Human Globulin (AHG) phase. Patient 2 presented with hemolytic anemia (Hgb < 5g/dl) approximately 8 months after liver transplant. Direct antiglobulin test was positive and the eluate showed a pan‐agglutinin reacting with all cells tested at 37OC and AHG. Both patients were treated with intravenous immunoglobulin (IVIG), Rituximab, and steroids, while Tacrolimus was discontinued. Multiple blood transfusions were required, and phenotype matched packed RBCs (pRBCs) that were least incompatible were transfused. Both patients responded appropriately to transfusion. Precautions to minimize the risk of transfusion reactions included division of pRBC products into aliquots and infusion at a slow rate. There was only 1 febrile non‐hemolytic reaction (FNHTR) reported. Table 1 summarizes the salient features of both the cases.
TABLE 1. CP157
| Patient 1 | Patient 2 | |
|---|---|---|
| Age (months) | 24 | 20 |
| Gender | Female | Male |
| Calcineurin inhibitor(s) | Tacrolimus, cyclosporine | Tacrolimus |
| Number of transfusion events | 20 | 24 |
| Days of transfusion support | 40 | 15 |
| Transfusion Reactions | None | 1 FNHTR |
| Patient Outcome | Discharged after stable Hgb | Discharged after stable Hgb |
| Antigens avoided with Transfusion | C, K, Fya, S | C, E, K, Fya, Jkb, S |
Conclusion: Cessation of the implicated calcineurin inhibitor is crucial in the management of related autoimmune hemolytic anemia. Many require extended transfusion support. Serologically compatible blood for transfusion may not be possible. Use of phenotype matched RBCs, division of pRBC products into aliquots, and a slow rate of infusion was not associated with serious reaction to transfusion in these 2 reported cases.
CP158
Red Blood Cell Transfusion in Pediatric Patients, Are We over Transfusing?
Christine Cahill*, Neil Blumberg, Amy E Schmidt, Scott Kirkley, Tanmay Sahai and Majed Refaai
University of Rochester
Background/Case Studies: Packed red blood cell (PRBC) transfusions are believed to improve oxygen delivery particularly in vulnerable patients such as neonates and children. However, evidence shows that hemoglobin (Hgb) in PRBCs has increased oxygen affinity and thus reduced oxygen delivery to tissues due to decreased 2,3 DPG levels. Standardization of PRBC transfusion practices in this population and the scientific evidence on which current practice is based is limited. Additionally, due to small transfusion volumes, infants may be exposed to multiple blood donors, increasing their potential for adverse events. Study Design/Method: Medical records of 60 pediatric patients receiving PRBC transfusion over a 12 month period were retrospectively reviewed. A total of 44 patients were identified as receiving allogeneic PRBC transfusion. 16 patients who received autologous blood (cell salvage) were excluded. Patient characteristics, length of stay, PRBC transfusion volume, pre‐ and post‐transfusion Hgb, and adverse events were collected.
Results/Finding: The average pre‐transfusion Hgb was 10.6g/dL with post‐transfusion Hgb rising to 14.5g/dL. The mean PRBC volume transfused was 46.3mL using a dose of 15mL/kg for all patients. Complications noted were; volume overload, thrombosis, fever/infection, hemolysis, necrotizing enterocolitis (NEC), and death (Table).
Conclusion: Evidence based transfusion guidelines are lacking in neonates and infants. A typical dose of 10‐15mL/kg in a 2kg patient, for instance, would translate into 3 full PRBC units (about 1000mL) in an average size adult. The current standard dose of 10‐15mL/kg yields very high increases in Hgb and may put these patients at risk of adverse outcomes, especially thrombosis due to increased blood viscosity. Additionally, many of these patients received volume reduced products which delivers a higher Hgb concentration per transfusion. Dosing should be based on goal Hgb and patient condition rather than weight based, though the hematocrit level at which the benefits outweigh the risks remains unclear.
TABLE 1. CP158
| N=44 | Average (Range) |
|---|---|
| Female, N(%) | 26(59) |
| Weight (Kg) | 3.27(1.07‐17.2) |
| Age (months) | 5(0‐42) |
| Mean±SD(Median) | |
| Length of Stay (days) | 34.6 ± 22.3(32) |
| Pre‐transfusion Hgb | 10.6 ± 2.17(10.6) |
| Post‐transfusion Hgb | 14.5 ± 2.3(14.5) |
| Volume RBC transfused (mL) | 46.3 ± 46(38.4) |
| Complications | N(%) |
| Volume Overload | 6(14) |
| Fever/Infection | 5(11) |
| Thrombosis | 3(7) |
| NEC | 2(5) |
| Hemolysis | 1(2) |
| Death | 4(9) |
CP159
Severe Warm Autoimmune Hemolytic Anemia in a Seven‐Month‐Old Infant Associated with a Mycoplasma Pneumoniae Infection
Daniela Hermelin*1, Cierra Wandro2, Leili Dolatshahi2,3 and Douglas Blackall1,3
1Department of Pathology, St. Louis University School of Medicine, 2Department of Pediatrics, St. Louis University School of Medicine, 3SSM Cardinal Glennon Children's Hospital
Background/Case Studies: Mycoplasma pneumoniae is associated with IgM, anti‐I cold agglutinin disease (CAD) in children and young adults. M. pneumoniae has rarely been associated with warm autoimmune hemolytic anemia, with only 3 case reports suggesting this association. However, each of these cases is confounded by other findings in addition to a Mycoplasma infection. We describe a unique case in which a pediatric patient has clear evidence of severe hemolysis, a very strongly reactive warm autoantibody, and clinical and laboratory evidence of a Mycoplasma infection without a detectable cold agglutinin. Study Design/Methods: The patient is a 7‐month‐old, previously healthy female infant who presented to the hospital with a 1‐week history of fever, fatigue, decreased appetite, and pallor. She was only treated with acetaminophen. She also developed clear rhinorrhea the day before hospital admission. At the time of her admission, laboratory testing (outside hospital) revealed a hemoglobin and hematocrit of 2.7g/dL and 9.1%, respectively, platelets of 635,000, and a reticulocyte count of 10.3%. All other elements of the complete blood count were within the normal reference range for age. A complete metabolic panel revealed no abnormalities except for a total bilirubin of 4.9mg/dL with a direct fraction of 0.43mg/dL. A FilmArray Respiratory Panel (BioFire Diagnostics; Salt Lake City, UT) detected Mycoplasma pneumoniae, while all other pathogens (19 total) were non‐detectable. The patient was started on a 5‐day course of azithromycin (Zithromax).
Results/Findings: Prior to RBC transfusion, blood bank evaluation revealed that the patient was O‐positive and had a strongly‐reactive antibody screen. Further testing demonstrated an antibody reactive with all reagent red blood cells. The DAT was strongly reactive for IgG but very weakly reactive for C3. An eluate was reactive with all reagent red cells tested. Finally, a cold agglutinin study was negative with undiluted serum. In addition to starting azithromycin, the patient was given IV methylprednisolone. During her 8‐day hospital course, the patient received 2 RBC transfusions on the day of admission and several RBC transfusions thereafter (see Table 1). Despite transfusion, her hemolytic process persisted, so she was infused with a dose of IV immunoglobulin on hospital day 6. Her hemoglobin rose to 8.4g/dL on hospital day 7 and increased to 9.5g/dL on hospital day 8. At that time, the patient was discharged from the hospital with instructions to wean her oral steroid dose over the next 2 weeks. She was followed closely by the hematology clinic and was found to have a stable hemoglobin (up to 11.2g/dL on day 57 after her hospital admission) with no recurrence of her hemolytic process. Conclusion: M. pneumoniae infection is a typical cause of CAD and has only rarely been associated with warm autoimmune hemolytic anemia. Our case demonstrates clear evidence of severe warm autoimmune hemolysis in a previously healthy infant. With the increasing use of multiplex respiratory viral and bacterial pathogen detection systems, the once rare phenomenon of a M. pneumoniae infection associated with warm autoimmune hemolytic anemia may become a more recognized entity.
TABLE 1. Laboratory Values and Therapeutic Interventions
| Days | 0 | 1 | 2 | 3 | 4 | 5 | 6 | 7 | 8 |
|---|---|---|---|---|---|---|---|---|---|
| Hgb g/dL | 2.7 | 5.5 | 7.9 | 7.4 | 5.9 | 7.5 | 6.3 | 8.4 | 9.5 |
| Retic % | 10.3 | 0.8 | |||||||
| RBC Txn | ++ | + | + | + | |||||
| Steroids | + | + | + | + | + | + | + | + | + |
| IVIG | + | ||||||||
| Zithromax | + | + | + | + | + |
CP160
Utility of Cord Blood Testing in O Positive Mothers
Robin Larson*1 and Colleen A. Aronson2
1Advocate Lutheran General Hospital, 2ACL Laboratories/ Advocate Hospitals
Background/Case Studies: A 500+ bed suburban hospital with a Level 4 NICU performs cord blood testing on all Rh negative mothers, all O positive mothers, and all mothers with previously identified clinically significant allo‐antibodies. Transfusion service (TS) staff decided to investigate whether the cord blood direct antiglobulin test (DAT) results correlated with hyperbilirubinemia diagnosis in the neonates.
Study Design/Method: All neonates with a positive DAT over a 1‐year period were tracked during their initial newborn admission for an ICD‐10 diagnosis code for hyperbilirubinemia as the principal or secondary diagnosis. The mother's blood type and presence of clinically significant antibodies was also tracked.
Results/Finding: Data for DAT testing of neonates from group O mothers and if hyperbilirubinemia was a diagnosis is listed in the table below. In 70.9% of neonates born to O positive mothers, with no other clinically significant allo‐antibody, a diagnosis of hyperbilirubinemia was not made. Eliminating cord blood testing on neonates born to O positive mothers would result in savings of approximately $2400 per year. In addition, the strength of the DAT positively correlates with the percentage of neonates diagnosed with hyperbilirubinemia (Hyper).
Conclusion: The hospital should eliminate cord blood testing on neonates born to O positive mothers who do not have clinically significant allo‐antibodies. The cord blood DAT does not consistently correlate to a diagnosis of hyperbilirubinemia, as additional testing in other departments (hematology and chemistry) is needed to support the diagnosis. Evaluation of a point of care test that measures total bilirubin directly from the neonate that is non‐invasive is available (transcutaneous bilirubinometer) and may serve to more reliably reflect when the neonates at risk for hyperbilirubinemia. The difficulty in eliminating the cord blood testing is the neonatologists’ reliance of using ABO incompatibility as part of the neonates risk assessment rather than using the point of care bilirubin testing. Currently the TS requires all positive DAT tests to be communicated to the nursing staff immediately. Given that the DAT strength positively correlates with the percentage of neonates diagnosed with hyperbilirubinemia, the TS staff may also consider notifying nursing staff only for those patients whose DAT is 3 or 4+.
| Raw # | w Hyper | % with Hyper | |
|---|---|---|---|
| DAT 1+ (1 aby pos) | 153 | 32 | 20.9% |
| DAT 2+ | 59 | 23 | 39.0% |
| DAT 3+ (1 aby pos) | 6 | 4 | 66.7% |
| DAT 4+ (2 aby pos) | 2 | 2 | 100.0% |
| O pos (4 aby pos) | 186 | 57 | 30.6% |
| O Pos w/out aby | 182 | 53 | 29.1% |
| O neg | 34 | 4 | 11.8% |
| Type O | 220 | 61 | 27.7% |
Platelet and Leukocyte Immunohematology, Testing and Genetics
CP161
A Retrospective Analysis of the HLA‐DPB1 Frequency in 10/10 HLA Matched Unrelated Hematopoietic Stem Cell Transplantation
Yan‐min He*, Su‐dan Tao, Ji He and Fa‐Ming Zhu
Blood Center of Zhejiang Province, Key Laboratory of Blood Safety Research, Ministry of Health
Background/Case Studies: Hematopoietic stem cell transplantation (HSCT) from matched unrelated donors is increasingly being used all over the world. Common protocols for HSCT with unrelated donors preferably include patient and donor matching at 10 out of 10 possible alleles at the HLA ‐A, ‐B, ‐C, ‐DRB1 and ‐DQB1 loci. Currently, HLA‐DPB1 is commonly not being taken into consideration for donor selection. The impact of HLA‐DPB1 mismatches after unrelated hematopoietic stem cell transplantation (HSCT) remains controversial.
Study Design/Methods: 106 individuals (53 pairs of unrelated donor‐recipient) who underwent unrelated allogeneic HSCT with a 10/10 HLA allele matched donor from Sep 2012 to Apr 2015 in Zhejiang province were included in this retrospective analysis. The genotyping of HLA‐DPB1 for all the samples was performed by PCR‐SBT method according to the previous report.
Results/Findings: Among 106 individuals (53 pairs of unrelated donor‐recipient), 14 different allotypes were detected and HLA‐DPB1*05:01 was the most frequency allele with the frequency of 0.3821£¬followed by HLA‐DPB1*02:01 and HLA‐DPB1*04:01. The gene frequency and the distribution of HLA‐DPB1 between the donor and recipient were listed in Table 1. Of 53 pairs, 7 pairs were complete match (2/2), 26 pairs were partial match (1/2), 20 pairs were complete mismatch (0/2). The matching rate of HLA‐DPB1 in our study is 13%.
Conclusion: The matching rate of HLA‐DPB1 in 10/10 HLA matched unrelated hematopoietic stem cell transplantation is low and the gene frequency of HLA‐DPB1 in unrelated hematopoietic stem cell transplantation was obtained ,which will help to study on the relationship between HLA‐DPB1 and unrelated hematopoietic stem cell transplantation. This work was sponsored by National Science Foundation of China (81401732), Zhejiang Provincial Program for the Cultivation of High‐Level Innovative Health Talents, the Science Research Foundation of Zhejiang Province (LY14H10001, 2015C33103)
TABLE 1. The distribution of HLA‐DPB1 allele in unrelated donor‐recipient of Zhejiang province
|
HLA‐DPB1 allotype |
donor | recipient |
N (2n=212£© |
frequency |
|---|---|---|---|---|
| 02:01 | 15 | 18 | 33 | 0.1557 |
| 02:02 | 6 | 12 | 18 | 0.0849 |
| 03:01 | 9 | 5 | 14 | 0.0660 |
| 04:01 | 9 | 11 | 20 | 0.0943 |
| 04:02 | 6 | 2 | 8 | 0.0377 |
| 05:01 | 44 | 37 | 81 | 0.3821 |
| 09:01 | 1 | 3 | 4 | 0.0189 |
| 13:01 | 2 | 4 | 6 | 0.0283 |
| 14:01 | 3 | 3 | 6 | 0.0283 |
| 15:01 | 0 | 1 | 1 | 0.0047 |
| 17:01 | 6 | 6 | 12 | 0.0566 |
| 19:01 | 0 | 1 | 1 | 0.0047 |
| 21:01 | 4 | 2 | 6 | 0.0283 |
| 41:01 | 1 | 1 | 2 | 0.0094 |
| total | 106 | 106 | 212 | 1.0000 |
CP162
Absolute Immature Platelet Count Suggests Platelet Production Suppression By Immunosuppressive Agent in the Setting of Relapsing Thrombotic Thrombocytopenic Purpura
Sirisha Kundrapu*1,2, Hamza N Gokozan1,2, Hollie M Reeves1,2 and Robert W Maitta1,2
1Case Western Reserve University School of Medicine, 2University Hospitals Cleveland Medical Center
Background/Case Studies: Thrombotic thrombocytopenic purpura (TTP) is caused by severely reduced activity of the von Willebrand factor‐cleaving protease ADAMTS13. Therapeutic plasma exchange (TPE) as well as immunosuppression minimize the morbidity and potential mortality of this presentation. Absolute Immature platelet counts (A‐IPC) have been shown to help diagnose and follow TTP patients’ responses to therapy. We report the case of a man with relapsing TTP, low ADAMTS13 with high inhibitor, treated with mycophenolate mofetil in which A‐IPC‐indicated an unexpected response to therapy.
Study Design/Method: A 56 year old male with a 7‐year history of TTP, presented with status epilepticus complicated by acute respiratory failure admitted with suspicion for relapsing TTP. Patient had been treated in prior admissions with TPE, prednisolone, rituximab, and cyclophosphamide with clinical improvement. He was on mycophenolate mofetil maintenance therapy which he last received just prior to day of admission due to consistently low platelet counts, ADAMTS13 <5% and inhibitor of 3.6. On day of admission platelet count was 95 x 109/L which decreased within five days to 14 x 109/L leading to initiation of daily TPE along with mycophenolate mofetil discontinuation just prior to TPE start. Immature platelet fraction (%‐IPF) and calculated A‐IPC (%‐IPF x platelet count) were obtained with daily pre‐TPE CBC. A‐IPC ratio was calculated from baseline.
Results/Finding: A‐IPC and platelet count were 1 x 10⁹/L and 14 x 109/L respectively. Counts improved rapidly post‐TPE initiation and after one TPE his A‐IPC tripled to 3.2 x 10⁹/L achieving the ratio of 3 previously shown to be diagnostic of TTP. On day 5 his A‐IPC and platelet counts had improved to 7.5 x 10⁹/L and 218 x 109/L respectively. Absence of anti‐PF4 antibodies ruled out heparin‐induced thrombocytopenia at this time. On day 6 he had an unexpected decrease in both A‐IPC and platelet count to 4.8 x 10⁹/L and 132 x 109/L respectively, worsening by day 8 to 1.7 x 10⁹/L and 40 x 109/L respectively despite daily TPE. Patient received 25 additional TPEs that failed to improve A‐IPC or platelets which on day 32 were 0.4 x 10⁹/L and 13 x 109/L respectively. A‐IPC had remained at this level for 16 days suggesting that the observed decrease was irreversible. ADAMTS13 activity remained <5% low with a high inhibitor. Patient's clinical condition continued to deteriorate and family placed patient on comfort care.
Conclusion: TTP patients have low A‐IPC and PLT counts at presentation, with the former improving first post‐TPE initiation. Despite appropriate therapy leading to early improvement of platelet count, patient's counts declined rapidly leading to suspicion for platelet production suppression as indicated by the sustained very low A‐IPC. In the setting of TTP, or relapsing TTP use of immunosuppression should be closely followed and A‐IPC may aid in establishing early if therapy is affecting platelet production.
CP163
Application of Luminex Bead Technology to Detect HPA‐1a, HPA‐3a, and HPA‐5a Antibodies
Su‐dan Tao*, Ying Liu, Yan‐min He, Ji He and Fa‐Ming Zhu
Blood Center of Zhejiang Province, Key Laboratory of Blood Safety Research, Ministry of Health
Background/Case Studies: Detection of antibodies against human platelet antigens (HPAs) is crucial for patients’ refractory to platelet transfusion therapy. In the text, Luminex bead coupled with anti‐GPIIb/IIIa and anti‐GPIa/IIa monoclonal antibody was implied to detect HPA‐1a, HPA‐3a, and HPA‐5a antibodies, and the sensitivity of Luminex bead technology was compared with monoclonal antibody immobilization of platelet antigens (MAIPA) assay.
Study Design/Method: Monoclonal antibodies P2 and Gi9, specific for platelet glycoproteins GPIIb/IIIa and GPIa/IIa, were separately coupled to Luminex xMAP beads. Four standard sera, containing anti‐HPA‐1a, anti‐HPA‐3a, anti‐HPA‐5a and anti‐HPA‐5b respectively, were bought from NIBSC; three negative sera without HPA antibodies were prepared from AB type blood donors. Platelets (containing HPA‐1aa, HPA‐3ab and HPA‐5aa) were collected and reacted with anti‐HPA‐1a, anti‐HPA‐3a, anti‐HPA‐5a and anti‐HPA‐5b standard sera respectively, then the antigen‐antibody reaction complexes were lysed and the lysates were incubated with luminex beads to specifically capture antigen‐antibody complexes via the epitopes on platelet glycoproteins. The beads‐antigen‐antibody complexes were then subjected to flow cytometric analysis on a Luminex100. The HPA‐1a serum was diluted to 10 serial dilutions (from neat to 1/502) to test the sensitivities of MAIPA and Luminex beads assay. The two methods were then used to test five blinded samples which were collected from FMAIT patients.
Results/Finding: Luminex bead technology showed that the MFI values of HPA‐1a, HPA‐3a, HPA‐5a standard sera samples reacted with the coupled beads were significantly higher than the negative controls (10258.81 vs 128.67, 2350.63 vs 41.97, 3092.08 vs 25.74) and cut‐off values (10258.81 vs 231.15, 2350.63 vs 46.49, 3092.08 vs 37.05), which implied that the Luminex bead technology could specifically identify negative and positive sera of anti‐HPA‐1a, anti‐HPA‐3a, anti‐HPA‐5a. Furthermore, because the platelet was HPA‐5aa, the HPA‐5b serum did not react with the coupled beads with MFI was comparable to negative control (286.59 vs 127.25). The sera were re‐tested by MAIPA and the results of which were comparable to Luminex bead technology, illustrating that detecting HPA antibodies by Luminex beads technology was successful. The sensitivity of Luminex bead assay and MAIPA to detect anti‐HPA‐1a was 1/128 (0.78IU/ml) and 1/64 (1.56IU/ml), respectively. No cross‐reactivity was observed with the samples containing HLA, ABO or other platelet antibodies. All results of five blinded samples tested by Luminex assay showed that four sera were positive for GPIIb/IIIa antibodies which were consistent with MAIPA results.
Conclusion: The Luminex beads coupled with GPIIb/IIIa and GPIa/IIa monoclonal antibodies could be successfully used to detect HPA‐1a, HPA‐3a and HPA‐5a antibodies via the epitopes on platelet glycoproteins. The sensitivity of Luminex technology was higher than MAIPA technology.
This work was sponsored by National Natural Science Foundation of China (81371905), and Science Research Foundation of Zhejiang Healthy Bureau (WKJ‐ZJ‐1509). then used to test five blinded samples which were collected from FMAIT patients.
CP164
Atypical Hemolytic Uremic Syndrome: Is Complement Pathway Mutation Analysis over‐Utilized? Experience of a Large Reference Laboratory
Sarah Tehseen*1, Rowena Punzalan2, Rupa Udani1 and Kenneth D Friedman2
1Blood Center of Wisconsin, 2BloodCenter of Wisconsin
Background/Case Studies: Atypical Hemolytic uremic syndrome (aHUS) is a thrombotic microangiopathy (TMA) characterized by the triad of microangiopathic hemolytic anemia, thrombocytopenia and renal failure in the absence of infectious toxin. The literature suggests the presence of pathogenic mutations in complement proteins in 50% of cases of aHUS. There is a lack of well‐defined recommendations regarding testing for genetic aHUS. Complement pathway mutation analysis is an expensive test so appropriate utilization is crucial to prevent undue health care costs. We reviewed the indications for genetic testing to understand physician ordering practice and determine the frequency of pathogenic mutations in the population.
Study Design/Method: We performed a retrospective review of all cases referred for complement pathway mutation analysis to a national reference laboratory from 1 January 2014 to 31 December 2016. Clinical history was solicited by genetic counselors. Cases were classified by the authors as primary aHUS (TMA and renal failure without identifiable cause), secondary TMA (TMA and renal failure with identifiable cause previously associated with TMA) or non‐TMA. The test panel identified variants in complement proteins (CFH, CFI, MCP, Factor B, C3, C4BP, THBD, DGKE, CFHR3, CFHR1, CFHR4 and CFHR5) that were classified as VUS (variances of uncertain significance), pathogenic or benign by the American College of Medical Genetics. Chi square analysis/Fishers’ exact test was used to determine differences in proportion of patients with pathogenic mutations and primary aHUS versus secondary TMA. Independent sample t‐test was used to compare differences in continuous variables between primary aHUS and secondary TMA.
Results/Finding: Of 134 patients tested, pathogenic mutations were detected in 13% (18/134) and VUS in 35% (47/134). 20% (27/134) of patients did not fulfill criteria for TMA; no pathogenic mutations were found in this group and 9 (33%) had VUS. 31% (42/134) of patients had primary aHUS; of these, 28% (12/42) had pathogenic mutations and 40% (17/42) had VUS. 48% (65/134) of patients had secondary TMA; of these, 9% (6/65) had pathogenic mutations and 32% (21/65) had VUS. In patients with pathogenic mutations, 39% (7/18) were children, 22.5% (4/18) had a positive family history of aHUS and 28% (5/18) had recurrent disease. Patients with primary aHUS had a significantly lower age at presentation (22 ± 18 vs. 33 ± 20 yrs; p‐value: 0.005) and a higher proportion of pathogenic mutations (28% vs. 9% p‐value: 0.009) compared to patients with secondary TMA. Gender distribution, hemoglobin nadir and serum creatinine levels were similar between the two groups.
Conclusion: We found a lower frequency of patients with pathogenic mutations compared to reported literature. Our data suggests that patients with secondary TMA should be carefully evaluated prior to ordering genetic testing and those without TMA should not undergo this test.
CP165
Counting of Platelets in Platelet Concentrates on Hematology Analyzers PentraXL80 and Sysmex XN9000 Compared with a Flow Cytometric Method
Farshid Ezligini1, Kjersti Roen Eriksen1, Annette Vetlesen1, Thomas Larsen Titze1 and Geir Hetland*1,2
1Oslo University Hospital, 2University of Oslo
Background/Case Studies: Hematology analyzers are made for counting of whole blood samples but are often used for quality control of blood components such as platelet (PLT) concentrates (PCs). A flow cytometric method for counting of PLT in PCs has been developed as validation tool (van der Meer etal, Transfusion 2012). Therefore, it is pertinent to evaluate PLT counting in BCs on hematology analyzers with this validation method in a flow cytometer.
Study Design/Methods: Samples from ten apheresis PCs and 33 buffy coat‐derived PCs were subjected to PLT counting on hematology analyzers PentraXL80 (Horiba ABX, Montpelier, France) and XN9000 Sysmex TOA (Kobe, Japan) (both impedance score), and additionally, diluted and stained with anti‐CD41a FITC in TrueCount tubes (BD Biosciences)(internal bead standard) for measuring in a Gallios flow cytometer (Beckman Coulter, Indianapolis IN, USA). Results were analyzed by Paired Samples Test and shown in Bland‐Altmann plots.
Results/Findings: Mean PLT values x109/L ± SD were 819 ±118, (<) 1106 ±137, (<) and 1195 ±176 for counting by Sysmex TOA, PentraXL80, and the Gallios flow cytometer, respectively. Sysmex count was the very lowest (31.4% less than for flow cytometry), but all PLT counts were significantly different (p<0.001), although least so (7.4%) between Pentra and flow cytometry.
Conclusion: As validated by the flow cytometric method, PentraXL80 seems suitable for routine quality control of PCs both because of the small difference and lower counts compared with flow cytometric method, which is too cumbersome in a routine setting. The much lower PLT count on Sysmex may reflect its optimization for PLT counting in whole blood rather than in PCs.
CP166
Fast, Precise & Easy HPA Typing with Real‐Time PCR
Jonathan Downing1, Arishma Lata1, Roland Russnak2, Zachary Antovich2, Heather Dunckley1 and Thierry Viard*2
1New Zealand Blood Service, 2Linkage Biosciences
Background/Case Studies: The interaction of membrane‐bound platelet‐specific glycoproteins with the extracellular matrix plays a significant role in hemostasis. Human Platelet Antigens (HPA) found within these glycoproteins can stimulate production of antibodies in recipients of transfused platelets or in fetus of mothers with incompatible HPA. Thus, platelet incompatibility is associated with various forms of thrombocytopenia, post‐transfusion purpura and other blood disorders. The New Zealand Blood Service performs HPA typing on a pool of platelet donors to provide compatible transfusions where the need arises.
The molecular basis of most HPAs has been characterized as generally caused by a single‐nucleotide polymorphism (SNP). HPA typing has typically been performed using PCR‐SSP, a method that utilizes time‐consuming post PCR analysis steps. The aim of this study was to evaluate the use of real‐time PCR‐based techniques in a transfusion laboratory setting.
Study Design/Method: We evaluated a commercially available solution which consists of 24 reactions that identify both variants of 12 relevant SNPs located within HPA genes (HPA‐1 through HPA‐11, and HPA 15). Genomic DNA purified from 48 blood samples, previously genotyped for HPA‐1,‐2,‐3,‐4,‐5 and ‐15 by our in house PCR‐SSP method were used in this study as validation samples.
Results/Finding: Results of the validation samples were 100% concordant with typing obtained by PCR‐SSP. The Real‐Time PCR approach overcomes the major challenges of HPA molecular typing by providing an automated solution resulting in increased laboratory productivity and decreased turn‐around time. The analysis is facilitated by a software which generates the results. With less than 10 minutes of hands‐on set‐up and no further operator intervention with the reagents, complete molecular genotyping results are provided in approximately 90 minutes. Further, since amplified products are never handled, the risk of laboratory contamination is significantly reduced.
The Real‐Time PCR approach with automated analysis was implemented by the New Zealand Blood Service Tissue Typing laboratory in late 2016 and to date has tested 749 DNA samples from 400 blood donors (349 donors were tested in duplicate). Concordance between the sample replicates was 100%. There were 24 occasions where the assay had to be repeated, giving a repeat rate of 3.2%. Occasionally a reaction peak was insufficient to trigger the software automatic allele call and a manual interpretation was required. This occurred most commonly with the HPA‐3 (4.7%) and HPA‐5 (1.2%) assays.
Conclusion: Real‐Time PCR with automated analysis provides an effective, robust an accurate method for molecular HPA genotyping. With its minimal hands‐on time workflow, it is also very easy to implement and offers a cost effective alternative to classical methods used in a transfusion laboratory setting.
CP167
Genetic Variation of CD36 Antigen Deficiency Expression in Jiangsu Chinese Han Population
Qing Chen*1, Jianyu Xiao1 and Chengyin Huang2
1Jiangsu Province Blood Center, 2Jiangsu province Blood Center
Background/Case Studies: CD36 has been implicated in the platelet refractoriness, neonatal alloimmune thrombocytopenia, and posttransfusion purpura, especially in the non‐Caucasian. CD36 deficiency varies widely among different ethnic populations, with the frequency of 3‐11% in Asians and 2.4% of African Americans, respectively. However, there is little information on the molecular basis of individuals with CD36 deficiency in Jiangsu Chinese Han population.
Study Design/Method: To investigate platelet CD36 expression levels and to determine the molecular basis of CD36 deficiency on the platelet surface of the Han population in Jiangsu region. CD36 expression levels on platelets were detected by flow cytometry among 243 blood donors in Jiangsu region. Donors without CD36 antigen expression on their platelet surface were further to be determined the expression of CD36 antigen on their peripheral blood monocyte cells. The coding exons of CD36 gene and adjacent introns were amplified and sequenced in CD36 deficient individuals.
Results/Finding: Among these 243 blood donors, CD36‐deficient and CD36‐expression individuals were 2.47% (6/243) and 97.53% (237/243), respectively. The frequencies of Type I and Type II CD36 deficiency among the study population were 0.41% (1/243) and 2.06 % (5/243), respectively. Among 237 individual with platelet CD36 expression, according to mean fluorescence intensity (MFI) value, 45, 141 and 51 individuals showed low, moderate and high expression levels of CD36, respectively, and their MFIs were 1725.9 ± 343.6, 3876.1 ± 788.5 and 8431.6 ± 529.9 (P<0.05), respectively. The type I CD36 deficiency individual were heterozygous for 1200‐13A>G and 430‐14C>G, respectively. Among Type II CD36 deficiency individuals, two harbored a T insertion at position 560 in exon 6 which caused frameshift at codon 187; one has a T>C exchange at position 538 in exon 6 which resulted in a tryptophan to arginine substitution at codon 180; one has a A insertion before the 17th bp of the start codon ATG in the promoter region; one were heterozygous for 748 + 2T>C and 1006 + 2T>G, respectively.
Conclusion: Platelet CD36 surface expression levels were diversified in the Jiangsu Chinese Han population. The frequency of the Type II CD36 deficiency was higher than that in Type I. The study findings indicated that the frequency of CD36 deficiency in the Chinese population is slightly lower than that in other Asian countries.
CP168
Large‐Samples Screening of Platelet CD36 Antigen in the Eastern Chinese Donors
Xian‐Guo Xu*, Ying Liu, Shu Chen, Yan‐Ling Ying, Xiao‐Zhen Hong, Ji He and Fa‐Ming Zhu
Blood Center of Zhejiang Province, Key Laboratory of Blood Safety Research, Ministry of Health
Background/Case Studies: CD36‐deficient phenotype can be immunized by pregnancy or transfusion, and involved in neonatal alloimmune thrombocytopenia, platelet transfusion refractoriness and other disorders. The frequency of platelet CD36‐deficient individuals widely varies among ethnic groups, with 3% to 11% in Japanese, 8% in sub‐Saharan Africans, 2.4% in African Americans, and 0.3% in Caucasians. Although some studies of CD36 deficiency are focused on the Asian populations, relatively little information has been reported in the Chinese population. Here we investigated the CD36 expression on platelets in large samples of the Eastern Chinese donors.
Study Design/Methods: Peripheral blood samples were collected from 1282 unrelated platelet‐apheresis donors in the Eastern China. The expression of CD36 antigen on platelets was determined by flow cytometry using fluorescein conjugated monoclonal antibodies (FITC‐anti‐CD36 and PE‐anti‐CD41). The isotype control (FITC‐mouse IgG) was also analyzed to calculate a reference range of CD36‐nagtive phenotype. For those donors with CD36‐negative platelets, CD36 antigen expression on monocytes was analyzed further to distinguish between CD36 type I and type II deficiency. Flow cytometric parameters were statistically analyzed by Mann‐Whitney test. The work was supported by National Natural Science Foundation of China (81570170) and Zhejiang High‐Level Innovative Health Talents.
Results/Findings: The MFI (mean fluorescence intensity) of platelet CD36 in all 1282 samples showed a continuous distribution profile, and no obvious fluorescence‐gap could be utilized to distinguish negative from positive phenotype. On account of this limitation, we classified the CD36 phenotypes using the (mean + 3SD) of the background MFI observed in isotype controls. Forty‐three samples were detected as CD36 deficiency on platelet, in which one sample was CD36 negative both on platelet and monocyte. The frequency of CD36 type I and type II deficiency in the Eastern Chinese donors was 0.08% and 3.3%, respectively. The average MFI of CD36 deficiency samples was significantly lower than CD36 positive samples (15.2 ± 7.9 vs 79.8 ± 37.8, P< 0.0001).
Conclusion: The frequency of platelet CD36 deficiency in the Eastern Chinese donors was close to Japanese and African Americans. It means that the possibility of CD36 antibody occurred by pregnancy and transfusion in this population is existed. It is useful to find and register CD36‐deficient donors by large‐samples screening for potential immune thrombocytopenia patients with CD36 antibody.
CP169
Platelet Transfusion Refractoriness Due to CD36 Deficiency in the Setting of Myelodysplastic Syndrome
Charles Harmon1, Helen Worrell*1, John Frederiksen1, Lina Shao1, Mia Sullivan2, Brian R Curtis2 and Laura Cooling1
1University of Michigan, 2BloodCenter of Wisconsin
Background/Case Studies: CD36 (GPIV, chromosome 7q11.2) is an 88 kDa glycoprotein expressed on multiple cell types including platelets (PLTs), monocytes (MONO), & erythroblasts. Although rare among whites, CD36 deficiency (CD36‐n) is observed in 3‐10% of Africans (T1264G) & is classified as either type I (CD36‐n PLT, CD36‐n MONO) or type II (CD36‐n PLT, CD36+ MONO). An acquired type II CD36‐n phenotype can also be observed in the setting of myelodysplastic syndrome (MDS). Type 1CD36‐n individuals can develop anti‐CD36 alloantibodies with PLT refractoriness & neonatal alloimmune thrombocytopenia. We report a case of profound PLT refractoriness caused by anti‐CD36 in a patient with newly diagnosed MDS.
Study Design/Method: HLA antibody testing was performed with a commercial bead‐based fluorescent assay. CD36 phenotyping (PLT, MONO) of patient & family members was performed by flow cytometry (FC). CD36 staining of bone marrow was performed by immunohistochemistry. PLT crossmatching (PLT‐XM) was performed by the American Red Cross. PLT‐specific alloantibody testing & CD36 DNA sequencing were performed at a commercial reference laboratory.
Results/Finding: The patient was an 80 year‐old, group O+ African‐American male who presented with blurry vision & lightheadedness. Complete blood count findings were significant for hemoglobin 4.4g/dL & PLT count 5K/µL. Bone marrow biopsy & cytogenetic analysis revealed multilineage dysplasia, 5‐10% blasts & a complex karyotype with del(7)(q22q34) consistent with MDS. PLT refractory work‐up was initiated after repeated PLT transfusion failures with corrected count increments (CCIs) < 5. HLA antibody testing was negative (class I panel reactive antibody (PRA)=0%). The patient was PLT‐XM‐incompatible with most donors (10/14). A trial of 4 group O, PLT‐XM‐compatible PLTs was unsuccessful (CCI ≤ 1). Subsequent testing for PLT‐specific alloantibodies identified anti‐CD36. FC‐phenotyping showed no CD36 on patient's MONO or PLT, consistent with type I CD36‐n. Preliminary DNA results show that the patient is heterozygous for T1264G. Because CD36‐n apheresis PLT were unavailable from blood suppliers, the patient's 3 children & grandson were screened as possible donors: All showed normal CD36 expression on PLTs. Trial of eltrombopag & romiplostim was attempted with no improvement in PLT count. Repeat HLA antibody testing (day +6) demonstrated new class I alloantibodies (PRA = 55%) in response to transfusion (21 apheresis PLTs, 5 RBCs). Given his PLT refractoriness & poor prognosis, the patient opted for hospice.
Conclusion: We describe a patient with CD36‐n & severe PLT refractoriness in the setting of new MDS, and 7q‐ chromosomal abnormalities. The absence of CD36 on PLT & MONO support congenital type 1CD36‐n although a contribution by the patient's underlying MDS cannot be excluded.
CP170
Rapid Platelet Donor Classification: HLA & HPA Profiles By “Leansequencing” without DNA Purification
Dipika Patel1, Kristopher Fernandez*1, Eric Senaldi2, Pascal George2, Michael Seul1 and Ghazala Hashmi1
1BioMolecular Analytics, 2Central Jersey Blood Center
Background/Case Studies: Prophylactic platelet transfusion is the standard of care for managing thrombocytopenia. In the emerging paradigm of personalized medicine, the selection of cellular products in accordance with patient immunomolecular signatures has the potential to reduce the rate of antibody‐mediated platelet clearance and thus to improve treatment efficacy. While the benefits of customizing transfusion therapy have long been recognized (Gmur1978 http://bit.ly/2q51heq), the routine, real‐time selection of platelets by immunogenetic profile has remained impractical by current methods of DNA analysis. To address this issue, we evaluated a process of platelet donor classification using buccal swab samples from apheresis platelet donors for determining the combined HLA class I and HPA signature without DNA purification using a novel “LeanSequencing” process.
Study Design/Method: Under a study protocol and informed consent, we evaluated a process for collecting and classifying buccal swab samples from ∼100 adult donors who had made ≥ 6 donations in the previous 12 months. Samples (labeled with study barcodes) were shipped weekly to BioMolecular Analytics (“bmx”) for preparation of “crude extracts” for LeanSequencing: this novel process combines a proprietary sample pooling strategy with a protocol that eliminates many traditional sample “clean‐up” steps. Briefly, after preparation of crude extracts, samples were amplified, pooled and analyzed (in separate runs) for HPA‐1,2,3,4,5,6,7,8,9,11,15 and for HLA Class 1 (A,B,C), the latter using a proprietary design that limits analysis to informative alleles in the HLA sequence; this “information‐theoretic” design permits direct allele and haplotype reconstruction using bmx‐proprietary software. A subset of crude extracts was purified and analyzed side by side with positive and negative controls.
Results/Finding: Crude extracts from buccal swabs produced viable profiles for HPA as well as HLA class I with significant savings in time‐to‐result. As an illustration, the table reports allele frequencies for platelet‐antigens (“HPA”) that are consistent with a predominantly Caucasian or Hispanic platelet donor population (http://bit.ly/2pDplF8) in HW equilibrium. Similarly, HLA‐class I haplotype frequencies were determined.
| HPA‐1 | HPA‐3 | HPA‐15 | HPA‐2 | HPA‐5 | HPA‐4 | HPA‐6 | HPA‐7,8,9,11 | |
|---|---|---|---|---|---|---|---|---|
| freq_a | 0.89 | 0.61 | 0.55 | 0.95 | 0.89 | 1.00 | 1.00 | 1.00 |
| freq_b | 0.11 | 0.39 | 0.45 | 0.05 | 0.11 | 0.00 | 0.00 | 0.00 |
Conclusion: LeanSequencing lends itself to the rapid determination of HLA‐class I and HPA signatures of platelets; the process with its streamlined lean protocol achieves additional time (and cost) savings by accommodating crude extracts produced from buccal swab samples collected and handled in accordance with the process validated in this project. The process could be readily implemented to another site using the elements and process developed. The “Pool & Plex” process and the early donor recruitment enables economies of scale for matched donor procurement.
CP171
The Serological Characteristics and Heritage Background of a Novel HLA Allele, HLA‐a *26:82
Chuan‐fu Zhu*, Yong‐hong Song, Xiang‐min Nie and Wen‐ben Qiao
Blood Center of Shandong Province
Background/Case Studies: There are 16,429 HLA alleles documented according to the IMGT / HLA Sequence Database in Janury2017, And more than 80% of them were identified in the last 10 years. Besides sequences many of the novel HLA alleles have not been analyzed their serological reactivities. HLA‐A *26:82 allele was fist detected in our laboratory during our HLA typing for China Bone Marrow Donor Program(CMDP). For further study, the serological characteristics and heritage investigation were performed.
Study Design/Methods: The routine HLA tying for the potential donors from CMDP were performed by bi‐allelic Sequence‐Based Typing method,using a commercial kit (ROSE Europe GmbH, Frankfurt, Germany). In the case of no full matched HLA typing results, group specific HLAssure‐SE SBT Typing Kit (Texas Biogene Inc., Taipei, Taiwan) was employed to identify the nucleotide sequences of the novel allele. Fresh blood samples were collected of the proband and his family members with the consent, in order to nanalysis the serological reactivities and the possible haplotype associations to the novel allele. The HLA serological specificity was indicated by One Lambda(ASN72D)HLA kit.
Results/Findings: No full matched result was obtained at HLA‐A locus in HLA typing for a donor,which suggested the possible existence of a novel allele. The latter nanalysis indicated that the proband have a nove1 nucleotide sequences at HLA‐A locus, the new sequences was most close to those of HLA‐A *26:01:01:01, but 1 nucleotide substitution in exon 4, by nt 746C‐A (codon225 ACC‐AAC), which resulted in one aminoacid substitution ,Thr‐ Asn. The novel HLA‐A allele was officially named as HLA‐A*26:82 by the WHO Nomenclature Committee for Factors of the HLA System in November 2012. The HLA typing results of the propand and his daughter were assigned as HLA‐A*26:82,33:02,B*48:01,15:01,DRB1*11:01,12:02 and A*26:82,23:01 B*48:01,50:01,DRB1*11:01,13:02, respectively. The haplotype associations to A*26:82 could be A*26:82 B*48:01 DRB1*11:01.According to the serological reactivity patterns, the novel HLA‐A allele showed the characteristics of A26.
Conclusion: A novel HLA‐A allele, HLA‐A*26:82, was identified and associated to the haplotype,A*26:82 B*48:01 DRB1*11:01, and the serological specificity was A26.
CP172
The Use of Plasmapheresis as a Second LINE of Therapy for Refractoriness to Platelet Transfusions
Anzhelika Rakhmani*, Elena Mikhaylova, Igor Dubinkin, Vera Troitskaya, Vladimir Galuzyak, Olga Kalmikova and Tatjana Gaponova
Federal State‐Funded Institution National Research Center for Hematology of the Ministry of Healthcare of the Russian Federation
Background/Case Studies: Multiple transfusions of platelet concentrates (PC) in hematological patients (>20) are a risk factor for alloimmunity and refractoriness to PC transfusions caused by allosensitization of the recipient by donor blood cells (HLA/HPA). For immunized patients it is advisable to conduct PC transfusions by individual selection, using tests with cross‐matching. In cases with multiple alloimmunity individual selection may be difficult or impossible, and the method of choice is applying plasmapheresis procedures (PPs) to eliminate circulating alloantibodies and circulating immune complexes. In this study, we assessed the efficacy of PPs in combination with the transfusion of individually selected cross‐matching PCs in patients with refractoriness to platelet transfusion.
Study Design/Methods: From October 2015 till January 2017 13 patients with refractory to PC transfusions have been treated in the center's clinic. Among them there were 2 patients with aplastic anemia (АА) and 11 patients with acute myeloid leukemia (AML). All patients underwent PC transfusions by individual selection. Considering inefficiency of the individual selection, it became necessary for these patients to receive additional PPs using the blood separator PCS2 (Haemonetics). All patients received individually selected cross‐matched PC transfusions on the day of PP. The efficacy of PPs by individually selected PC transfusions was assessed by Absolute Platelet Increment (API) and Corrected Count Increment (CCI), the level of circulating alloantibodies, probability of donor‐recipient matching. Cross‐matching and antibody activity in relative units (RU) was assessed with a Galileo‐Neo (Immucor) analyzer.
Results/Findings: 12 out of 13 patients receiving PP treatment in combination by individually selected PC transfusions showed increased API/CCIs, decreased circulating alloantibody activity: AML (n=11) median from 90 before 28 (RU), АА (n=2) ‐ median from 99 before 12‐58 (RU) and increased probability of donor‐recipient matching against former transfusions without additional PP treatment. In one patient with AA inefficiency of therapy PPs treatment plus individual cross matching selection was noted, and in this case the probability of autoimmune cytolysis of platelets, as well as increased intake syndrome, cannot be ruled out due to severe infection.
Conclusion: In case of inefficiency of individual cross‐matching PC selection in patients with refractoriness to platelet transfusions, PPs significantly improved the transfusion efficacy. Performing PPs in combination with individually selected PC transfusions decreased circulating alloantibodies activity, increased probability of donor‐recipient match, increased API and CCI, which significantly improved clinical efficacy and immunological safety of PC transfusions.
RBC Immunohematology and RBC Molecular Testing and Genetics
CP173
Novel RHD allele Involved in Severe Hemolytic Disease of the Fetus and Newborn (HDFN)
Tatiane Vendrame*1, Rosangela Person1, Afonso Cortez1, Lilian Castilho2, Flavia Latini1 and Carine Arnoni3
1Associação Beneficente de Coleta de Sangue, 2Hemocentro Unicamp, 3Associa
Background/Case Studies: Anti‐D is a frequent cause of hemolytic disease of the fetus and newborn (HDFN). As a rule, immunization occurs in D negative pregnant women, but occasionally anti‐D is also observed in carriers of D variants. Currently, maternal plasma analysis for determination of the fetal RHD status became an exciting new tool for the management of D‐negative pregnant women, but one of the challenges in non invasive fetal RHDgenotyping is the presence of D variants in the pregnant women. We present a case of a 13 year‐old pregnant woman typed as AB+, who delivered a baby affected by severe HDFN. The newborn was typed as B+ and presented a positive direct antiglobulin test (DAT) with an anti‐D identified in the eluate. The baby was treated by exchange transfusion and the mother's sample was investigated.
Study Design/Method: Serologic testing was done by hemagglutination in gel cards. Genomic DNA was extracted from whole blood by spin column and all RHD exons were sequenced by Sanger sequence method.
Results/Finding: The mother's RBCs reacted 4+ with the four monoclonal anti‐D used (IgM clones P3x61 and RUM 1 and the blends clones TH28+MS26 and D175+D415) and were typed as C‐c+E‐e+. An anti‐D was identified in her serum. Molecular analysis showed the 410C>T and 455A>C in exon 3, the SNP 509T>C changes in exon 4 and the 667T>G nucleotide change in exon 5. The set of SNPs found is similar to the molecular background of DOL3, except for 455A>C change.
Conclusion: This novel set of SNPs found in this mother is related to a novel RHD allele leading to a partial D antigen involved in the production of an anti‐D that can cause severe HDFN. This finding shows the need to elucidate the clinical significance of different RHD genotypes in various ethnic backgrounds.
CP174
The New Erytra EFLEXIS® Analyzer: An Evaluation for Routine Use in a French Medical Analysis Laboratory Together with the DG GEL® System.
Michel Bendahan*
XLABS
Background/Case Studies: Automate testing
Study Design/Methods: Eflexis bloodtyping instrument evaluation
Results/Findings: Results matches with requirements
Conclusion: The New Erytra EFLEXIS® Analyzer: An Evaluation for Routine Use in a French Medical Analysis Laboratory Together with the DG GEL® System.
J.L. Souchet, S. Pichard, J. You, M. Bendahan
Laboratoire d'Analyse médicales XLABS, CHOLET ‐ France
Background: The Erytra Eflexis® (Grifols) is a new fully automated, mid‐size analyzer that performs immunohematology testing using DG Gel®technology.
Aims: In this study, performance, usability and adaptability to different workflows in laboratory routine of the Erytra Eflexis®analyzer were evaluated in Laboratoire d'Analyse médicale XLABS Cholet, a French medical analysis laboratory.
Methods: A comparison and throughput study between the Erytra Eflexis® and Erytra® (the routine reference platform) was performed. A total of 1089 immuno hematological tests (465 ABO/D grouping (including 33 newborn samples), 12 extended erythrocytic phenotype, 562 antibody screening, 14 antibody identification, 16 DAT) and 20 crossmatches were performed on patient's whole blood samples. The Erytra Eflexis® performance was evaluated according to a protocol that was designed to simulate the routine workload using the system in its two different configurations. Concordance between systems was assessed and discrepancies were analyzed. The following performance metrics were assessed: time to first result (TTFR), turn‐around time (TAT) for the total workload from first result to last result (throughput, results/h), and manual “hands‐on” time required as well as walk‐away time, considering the two different configurations of the system. For the ease of use evaluation, different usability features were ranked and the number of steps and timing of the following activities were tracked: sample sort and loading, routine testing, post‐run procedures, consumables used, and space requirements. A threshold for in vitrodetection of anti‐D gamma globulin was also determined.
Results: Concordant results between the Erytra Eflexis® Analyzer and the reference method were obtained in 99.2% of the ABO/D tests (n=265), 99,7% of the antibody screening tests (n=377), 88,8% of the antibody identification tests (n=9) and 100% of the DAT tests (n=10). There were 4 discrepancies (2 ABO/D for the same patient, 1 for antibody screening and 1 antibody identification: In both cases, the Erytra Eflexis®could conclude whereas Erytra could not due to a poor reaction. Use of the STAT mode (incubator is reserved for urgent tests) proved its usefulness when testing several samples (time saving was more than 10 min). Detection threshold of the D antibody was assessed at 2.5 ng/ml (0.0125 UI/ml) whereas the French recommendations are 20 ng/ml. The possibility of interchanging the trays (reagents/sample) makes also possible to optimize the analyzer operation. The impressions of the technical staff were positive regarding esthetic and functional design, intuitive and easy use, as well as flexibility.
Summary/ Conclusion: Erytra Eflexis® results demonstrated velocity, sensitivity, as well as the ability to easily perform the routine workload of a medical analysis laboratory. Erytra Eflexis®meets both the requirements for French regulatory in immunohematology and for ISO 15189 accreditation.
CP175
A Case of Hemolytic Disease of the Fetus and Newborn Due to Anti‐Kpb
Georgette R Benidt*, Sheila K Moldenhauer, Brendan C Graham and Eapen K Jacob
Mayo Clinic
Background/Case Studies: Kell system antibodies inhibit erythropoiesis causing severe anemia in hemolytic disease of the fetus and newborn (HDFN). We report a case of HDFN secondary to anti‐Kpb that resulted in multiple intrauterine transfusions of Kp (b‐) donor cells and hemolytic anemia upon birth. Case: A 31 year old G5P3 presented during her fifth pregnancy with anti‐Kpb with an initial titer measured of 64. By history, the anti‐Kpb developed during her third pregnancy which ended in a spontaneous abortion before antibody titers could be initiated. The patient's antibody titers peaked at 16 during the fourth pregnancy which resulted in a healthy male without anemia or jaundice. . In the latest pregnancy, ultrasound was initiated with elevated middle cerebral artery Doppler exams (1.7 MoMs) peaking at 27 weeks. This resulted in three intrauterine transfusions. Due to potential labor and the finding of reversed diastolic flow on middle cerebral artery Doppler studies, a finding that has been associated with impending intrauterine fetal demise, Caesarean delivery was performed at 35 weeks gestation. The baby boy required phototherapy for hyperbilirubinemia. The indirect bilirubin at birth was 3.4mg/dL with 13.6g/dL hemoglobin. The baby typed as O Positive, Kp (b+) with a micro positive DAT. The antibody workup revealed an anti‐Kpb. Continued hemolysis required one more transfusion at 6 weeks of age. The positive DAT and passively acquired anti‐Kpb were no longer detected by 8 weeks of age. His hemoglobin recovered to 9.0g/dL with an indirect bilirubin of 1.4mg/dL at 9 weeks of age. All clinical signs of hemolytic anemia were resolved.
Study Design/Method: Serologic testing included PEG IAT by tube methods. Acid elution was performed using Immucor Gamma ELU‐KIT II. Molecular testing was performed using Immucor Bio‐Array HEA platform.
Results/Finding: Antibody identification on the mother was performed as well as alloadsorption studies to rule out other underlying alloantibodies. A new weakly reacting anti‐S was detected on the day of the delivery. The baby typed as S positive however the anti‐S was not detected in an eluate prepared from the baby's red cells. All of the intrauterine transfusion units were S negative.
Conclusion: To our knowledge only five case reports have been described for anti‐Kpb which resulted in moderate to severe HDFN. Pregnant mothers with anti‐Kpb detected should be monitored closely.
CP176
A Novel Flow Cytometric Method for Quantification of Red Cell Bound C3d
Ulrik Sprogøe*1, Christian Nielsen1, Berit Antonsen1 and Mark Yazer2,3
1Department of Clinical Immunology, Odense University Hospital, 2University of Pittsburgh, 3University of Southern Denmark
Background/Case Studies: In some clinical cases, the C3d‐specific DAT may be too insensitive to detect low, but significant levels of C3d, or it may be inconclusive due to spontaneous red cell (RBC) aggregation. Further, the DAT is not well suited to quantify the number of immunoprotein molecules on RBCs, since a “++++” reaction corresponds to about 500 molecules/cell. A number of flow cytometric methods for the detection of RBC‐bound C3d have been published. However, these are mainly designed to quantify the fraction of RBCs with C3d‐sensitization. The aim of this study is to present a flow cytometric method for the quantification of the level of RBC‐bound C3d.
Study Design/Method: Ten microliters (uL) of 1:80 (after documenting experimentally that this amount ensured maximum binding of anti‐C3d) mouse monoclonal anti‐human anti‐C3d (Abcam, clone 7c10) were added to 5 uL of a 2.5% RBC suspension. After incubation for 60 minutes at 4C, samples were washed x3, and 25 uL of 1:10 diluted anti‐mouse‐F(ab)2‐PE (RO480, DAKO) were added. After incubation at 4C, samples were washed and resuspended before being acquired on a flow cytometer (Becton Dickinson FACSCanto II). To enable calibration of fluorescence signals in antibody binding capacity (ABC), a calibration standard (DAKO QIFIKIT) stained with RO480 was run in parallel with all experiments. Background fluorescence (in ABC) was subtracted to yield net ABC values corresponding to specific staining with anti‐C3d.
The assay, in parallel with our routine DAT (DC‐Screening I, ID‐Card, gel card, BioRad) was applied to a series of A1 RBCs stained with 10 levels (2‐fold dilution, 1:1 – 1:512) of O serum with high titer anti‐A. To estimate the normal range of RBC‐bound C3d, EDTA‐stabilized samples from 4 healthy donors were tested. Finally, the assay was applied to a sample from a patient with clinical AIHA with an inconclusive DAT due to unspecific DAT polyreactivity.
Results/Finding: The correlation of the net level of RBC‐bound C3d (values ranging from 0 to 3,393 ABC) with level of 0‐serum dilution (used to sensitize A1 RBCs) proved to be highly linear (logarithmic vs. logarithmic plot; r2 = 0.97, p < 0.0001). Compared with DC‐Screening 1, the sensitivity of the flow cytometric assay was superior. It detected C3d sensitization at least 4 dilution steps further. The median normal level of RBC‐bound C3d was 11 ABC (range 7‐20 ABC, n=4). The assay enabled demonstration of specific C3d‐sensitization in the patient; the level of RBC‐bound C3d in the sample was significantly elevated (1,907 ABC).
Conclusion: The presented flow cytometric assay is capable of quantifying the level of RBC‐bound with a high degree of linearity and analytical sensitivity. Further, it is capable of quantifying the level of RBC‐bound C3d in DAT polyreactive samples.
CP177
ABO and Forssman (FORS) Blood Group Systems (I): Accelerated Evolutionary Divergence of the ABO and GBGT1 Genes
Fumiichiro Yamamoto*
The Josep Carreras Leukaemia Research Institute (IJC), Program of Predictive and Personalized Medicine of Cancer (PMPPC), Institut d'Investigació Germans Trias i Pujol (IGTP)
Background/Case Studies: ABO blood group system of red blood cells (RBCs) consists of A and B oligosaccharide antigens and anti‐A and anti‐B antibodies against these antigens, which are present in the sera of individuals who do not express the antigen(s)(Landsteiner's Law). Because of the expression of those antigens on some epithelial and endothelial cells in the body, the ABO matching is critical not only in blood transfusion, but also in cell/tissue/organ transplantation. In spite of the fact that both antigens and antibodies are involved, these genetic traits are specified by a single genetic locus of ABO. Forssman (FORS) system is another RBC blood group system which consists in a glycosylation polymorphism specified by the GBGT1 gene. In humans, the ABO and GBGT1 genetic loci are located on chromosome 9q34, and the functional alleles encode A and B glycosyltransferases (AT and BT) and Forssman glycolipid synthase (FS), which catalyze the last biosynthetic steps of A and B, and Forssman (FORS1) oligosaccharide antigens. The molecular genetic bases for allelism of those two systems in humans have been well‐elucidated. The ABO and GBGT1 genes are also present in some other species in addition to humans. However, the presence/absence and functionality/non‐functionality are species‐dependent. Molecular mechanisms/forces that created this species divergence, including human polymorphism, were unknown.
Study Design/Methods: Utilizing genomic information available from GenBank and Ensembl databases, the gene maps of the chromosomal region surrounding the ABO and GBGT1 genes have been constructed of 88 vertebrate species.
Results/Findings: Extensive similarities were observed in the kinds, numbers, and orders of genes, as well as their chromosomal locations. However, numerous differences were also identified. These include chromosomal rearrangements, as well as the insertions and amplifications of specific genes. Interestingly, the ABO and GBGT1 genes were found located at the boundaries of chromosomal fragments that seem to have undergone frequent inversions/translocations during species evolution.
Conclusion: Genetic alterations, such as deletions and duplications, are known to be prevalent at the ends of rearranged chromosomal fragments. Therefore, the species‐dependent divergence and polymorphism within species of those clinically important glycosyltransferase genes may have been resulted, at least partially, from unstable chromosomal structures neighboring those genes.
CP178
Alloimmunization Despite Phenotype Matching in a Patient with Sickle Cell Disease and a Complex RHCE Genotype
Jessica Kneib* and Emily Coberly
University of Missouri Health Care
Background/Case Studies: Red blood cell transfusion plays an important role in the treatment of patients with sickle cell disease. Sickle cell patients have a significantly increased risk of alloimmunization compared to the general population, and the standard of care is to provide phenotypically matched units for at least C, E, and K1 antigens to reduce this risk. Unfortunately, the genotype and true alloimmunization risk may not always be accurately represented by the red blood cell phenotype, particularly in patients with complex partial RHCE variants.
Study Design/Method: A 14 year old female with a history of sickle cell disease, stroke, and iron overload presented for routine exchange transfusion. The patient's blood type was O positive and her red cells had been previously phenotyped as C‐, c+, E‐, e+ and K1‐. An antibody screen was positive, and antibodies against C and e antigens were identified in the plasma. The patient had only received phenotypically matched units negative for C and E antigens for all previous transfusions at our institution, based on her known red blood cell phenotype. Blood samples were sent to a reference laboratory for molecular testing to look for partial RHCE variants that might explain the antibody development.
Results/Finding: Molecular testing was performed to reveal the presence of two different partial RHCE alleles, resulting in a predicted phenotype of D+, C‐, E‐, partial c+, partial e+. The probable RHCE genotype, RHCE*ceJAL/RHCE*ce733G, results in partial expression of both c and e antigens. In addition to the known risk of alloimmunization against the absent C and E antigens, this result indicates that the patient is also capable of forming alloantibodies against the absent portions of both c and e antigens. Based on these results, the patient's anti‐e was determined to be an alloantibody and not an autoantibody.
Conclusion: Although phenotypically matched units are standard of care for patients with sickle cell disease, the red blood cell phenotype may not accurately represent the alloimmunization risk in patients with complex partial RHCE genotypes. In this case, molecular testing confirmed that the patient is at risk of developing alloantibodies against C, c, E, and e antigens. As the patient had already made alloantibodies against C and e antigens, it was determined that she would require units that were molecularly matched to her RHCE variants for all future transfusions. This case demonstrates that phenotype matching for sickle cell disease patients may not be adequate to prevent alloimmunization in individuals with partial RHCE variants.
CP179
Altered Splicing in the RHD*Weak D Type 2 Allele Associated with the Skipping of Exon 9 in a Pregnant Woman and Her Newborn
Carolina Bonet Bub*1, Maria Giselda Aravechia1, Thiago Costa1, Marilia Sirianni1, Eduardo Bastos1, Leandro Santos1, Lilian Castilho2 and José Kutner1
1Hospital Israelita Albert Einstein, 2Hemocentro Unicamp
Background/Case Studies: RHD*weak D type 2 is a variant commonly found in Caucasians associated with a weak D phenotype. As previously reported (Vege etal, Transfusion 2007) the c.1154G>C change (p.G385A), which characterizes the RHD*weak D type 2 allele is a splicing variant that induces skipping of the whole RHD exon 9. We report an altered splicing in the RHD*weak D type 2 allele associated with the skipping of exon 9 in a pregnant women and her newborn with weak D expression.
Study Design/Method: The D antigen expression was evaluated with 4 commercially available monoclonal anti‐D reagents: 1 blended IgM/IgG (clones TH‐28/MS‐26), 2 IgM (clones MS201 and P3x61) and 1 IgG (MS26) in tube and on gel cards. C, c, E and e phenotyping were performed in gel. RHD genotyping was performed with the RHD BeadChip platform from Immucor. Direct automated sequencing of the 10 RHD exons and flanking intron regions was performed by the Sanger dideoxy method.
Results/Finding: Both pregnant women and newborn samples were phenotyped as D+wC–c+E+e+. The samples showed weak hemagglutination reactions (1+/2+) with all anti‐D clones used. RHD Beadchip results showed the LS* signal indicating a possible deletion of exon 9 in both DNA samples. Sequencing showed the c.1154G>C change and the intronic c.1154‐8T>A and c.1154‐31T>C substitutions, which are associated to the RHD*weak D type 2 allele.
Conclusion: Our results showed that c.1154G>C associated with c.1154‐8T>A and c.1154‐31T>C variations had probably a functional impact on splicing inducing exclusion of exon 9 in both DNA from mother and newborn. This finding is important to develop assays and interpret genotyping results, as current guidelines do not recommend anti‐D IgG prophylaxis for women with weak D type 2.
CP180
An Unusual Hemolytic Transfusion Reaction Attributed to Anti‐HLA (Bg) Antibodies
Laura Cooling, Amanda Kitson*, Sheri Hugan, Terri Tallmadge, Omar Moussa, Qing Li and Chisa Yamada
University of Michigan
Background/Case Studies: RBC are considered devoid of HLA antigens, however 50% of donors have detectable class 1 antigens on RBC by flow cytometry, especially in certain HLA types (B7[Bga], B17[Bgb], A28/A2[Bgc]; A9,A10,B12,B15). Rarely, HLA antibodies (HLAb) have been associated with shortened RBC survival & hemolytic transfusion reactions (HTR). We report a case of HTR attributed to HLAb in a transfusion (txn)‐dependent patient.
Study Design/Method: ABO type, antibody screen (ABS) & identification were by gel method. DAT was by tube method. RBC acid eluate was prepared per manufacturer's instructions & tested against RBC by tube (30’37C, PEG). HLAb testing was performed by a fluorescent bead‐based assay. RBC samples from group O, HLA‐typed, renal transplant patients were obtained from hematology.
Results/Finding: The patient was an 81‐year‐old, O+ woman with chronic anemia, thrombocytopenia, RBC alloimmunization (anti‐K1, E, Cw), cryptogenic cirrhosis, diabetes, chronic kidney disease & occult GI bleeding. She was treated with IV iron, folate, darbopoietin, & episodic RBC txns until 6/2016, followed by increasing RBC requirements which reached 1‐2 RBC twice weekly by 12/2016. During a routine RBC txn in 1/2017, she developed rigors, headache, fatigue, nausea & hypertension (BP143/63→198/74). Laboratory workup showed no clerical errors. She typed as O+ & ABS showed anti‐E. Visual hemolysis check was weakly positive on 2 specimens. Labs drawn 12 hours post‐txn showed no increase in hemoglobin (7.2→7.3gm/dL), ↓haptoglobin <10mg/dL, & ↑LDH (270 IU/L). The DAT was weakly positive (polyspecific 1+, IgG 1+, C3 0) with pre‐ & post‐txn specimens. A RBC eluate was negative against donor RBC & 3/3 panel cells. Donor RBC were K1‐,E‐,Cw‐ & crossmatch‐compatible (XM) with pre‐ & post‐txn specimens by tube, but was XM‐incompatible by gel. Additional plasma testing showed weak reactivity against 3/3 E‐,K‐,Cw‐, HLA+ panel cells (1+, tube, PEG), which was sensitive to chloroquine (0‐±). HLAb testing showed that the patient was highly alloimmunized with high‐titer HLAb to class 1 (PRA=91%) & class II (PRA=62%) antigens. In addition, weak class I HLAb (PRA=24%, MFI<3000), but no class II HLAb (PRA=0), were identified in the RBC eluate, including HLAb against B7,A2,B8,B57. Patient plasma was weakly reactive with 11/30 donor RBC & 2/5 RBC from group O, E‐,K1‐,Cw‐, HLA‐typed, renal patients positive for at least 1 antigen crossreactive with A2[B57] or B17[B15]. Subsequent RBC for transfusion were XM‐compatible by gel: An attempt to obtain HLA‐matched RBC was unsuccessful. The patient was placed on amicar & weekly IVIG with slight improvement in RBC survival & haptoglobin (82mg/dL). Due to ongoing medical issues, the patient was transitioned to hospice care.
Conclusion: We present another case of HTR & poor RBC survival likely due to high titer HLAb.
CP181
Analysis of Red Blood Cell Alloimmunization Rates in Pediatric Sickle Cell Disease Patients in the United States and Other Geographical Regions
Sirisha Kundrapu*1,2, Hollie M Reeves1,2, Venkata CK Sunkesula3 and Robert W Maitta1,2
1University Hospitals Cleveland Medical Center, 2Case Western Reserve University School of Medicine, 3Mercy Health System
Background/Case Studies: Sickle cell disease (SCD) patients require red blood cell (RBC) transfusions to minimize disease‐specific symptomatology. Previous studies have shown that more than 50% of children with SCD receive at least one RBC transfusion in their lifetime. Both simple transfusions and erythrocytapheresis are associated with increased risk of RBC alloimmunization. Published literature is lacking on the frequency of alloimmunization and geographical associations in pediatric populations, which is made difficult to compare due to lack of standardized categorization of what represents a pediatric patient population across studies. Therefore, we looked at the alloimmunization rates of pediatric patients with SCD in the Unites States (US) and other countries.
Study Design/Method: A literature search was performed for studies published on alloimmunization rates of SCD pediatric patients including HbSS, sickle beta‐thalassemia and HbSC. We evaluated the overall alloimmunization rates as number of alloantibodies per transfused patient and alloantibodies per 100 transfused units across world literature and compared them using chi‐square analysis.
Results/Finding: Fourteen studies reporting data to derive alloimmunization rates of pediatric SCD patients were found. These included eleven US studies with 1,057 patients and 3 studies from other regions (Brazil, Egypt and France) with 641 patients. Majority of patients included in the studies had HbSS disease. Patients received either episodic, chronic simple transfusions or erythrocytapheresis. Age range for the US studies was 0 to 26 years and for the other countries 0 to 20 years. Available data from 5 US studies included a total of 91 alloantibodies, the most frequent of which were antibodies to C, E, Kell, M, S and Kidd antigens (18.7%, 16.5%, 15.4%, 7.7%, 7.7% and 6.5% respectively). Alloimmunization rates were calculated as antibodies per patient in some studies and antibodies per 100 transfused units in other studies. We evaluated rates using both approaches as per available data. US had an alloimmunization rate of 16.5 % (14.1 to 19.2, 95% CI) vs. 9.4% for non‐US studies (7.3‐11.8, 95% CI) (p=0.0008) and more alloantibodies per transfused patient (0.25 vs. 0.096, p=0.0001). Similarly, the number of alloantibodies per 100 transfused units in the US, evaluated from five studies, was higher compared to a large French patient cohort (0·68 vs. 0.33, p=0·0005). Average number of RBC units transfused per patient in the US was also higher compared to data from France (77 vs. 45, p=0.0001).
Conclusion: Despite limited studies available to compare alloimmunization rates in pediatric SCD patients in the US and other countries, the overall rates are higher in the US. Though no definitive reasons could be concluded from the available data, limiting the number of RBC exposures, i.e. units transfused in non‐critical conditions could lead to lower alloimmunization rates.
CP182
Anti‐C, Only Detected in PeGTM, Implicated in a Transfusion Reaction
Jowi Laquetta McCray*, Pinkie Anderson, Jared Fry, David Lee Hanna, Christina Wiliford, Kelly Bowman, Casey Lee Cocherell, Cindy Steinmetz and Monica Kalvelage
LifeShare Blood Centers
Background/Case Studies: An 88 year old African American female admitted to the hospital with diagnosis of atrial fibrillation and anemia. The facility reported no known antibody history and no recent transfusions. Antibody detection test was positive using GEL technique. The sample was referred to the Immunohematology Reference Laboratory (IRL) for antibody identification and 2‐unit crossmatch. IRL records indicated the patient has a history of anti‐E. Antibody identification revealed a new anti‐M. Auto control and direct antiglobulin test (DAT) were negative. Crossmatch compatible, E‐, M‐ units were provided for transfusion. The next day the hospital reported a transfusion reaction. The patient's temperature, blood pressure and respiration all increased. Hemoglobinuria also reported.
Study Design/Methods: Antibody identification performed using tube technique with Gamma LO‐IONTM (Immucor, Inc., Norcross, GA). Reactions read at RT, 30 minutes at 37C and indirect antiglobulin test (IAT) using anti‐human globulin (AHG). Tube testing using Gamma PeG™ (Immucor, Inc., Norcross, GA) performed at 15 minutes at 37C, read at AHG. Gamma ELU‐KIT® II (Immucor, Inc. Norcross, GA) and reagent antisera were used in the investigation. A Monocyte Monolayer Assay (MMA) was performed to predict clinical significance of the identified antibodies. Transfusion Reaction (TRXN) investigation includes clerical check, visual inspection for hemolysis, DAT and repeat ABO/Rh on pre‐ and post‐transfusion samples and additional testing if needed.
Results/Findings: A post‐transfusion sample was referred to the IRL for a TRXN investigation. There were no clerical errors; however, hemolysis was present in the post‐ transfusion plasma/serum. ABO/Rh and crossmatches using LO‐ION™ were repeated on the pre‐ and post‐transfusion samples with no discrepancies. The post‐transfusion DAT was positive with a negative eluate. The hospital requested another unit before the investigation was complete. Antibody identification on the post transfusion sample with LO‐IONTM was negative. Suspecting a weak antibody, additional investigation using PeGTM on both samples revealed an anti‐C. No additional clinically significant alloantibodies detected in the pre‐ or post‐transfusion samples using PeG™.
Conclusion: The patient experienced an acute hemolytic transfusion reaction due to anamnestic interaction of anti‐C in the patient's plasma/serum against C antigen on the transfused cells. Anti‐C was not detected by our routine antibody identification techniques. The MMA confirmed anti‐E, ‐M and ‐C were clinically significant.
CP183
Anti‐Ena in a Prenatal Patient
Laura Bailey*1, Melissa Grohotolsky2, Lisa DeBlass1, Bala Carver1 and Kip Kuttner2
1Health Network Laboratories, 2Miller Keystone Blood Center
Background/Case Studies: The Ena antigen is a high prevalence antigen in the MNS blood group system. The antigens of the MNS system are carried on glycophorin A (GPA) and glycophorin B (GPB). Anti‐Ena is a rare immune IgM/IgG antibody made by individuals who lack all or part of the GPA protein. Anti‐Ena has been implicated in fatal HTR and HDFN. The En(a‐)phenotype can result from either a rare deletion of the GPA protein or the even rarer Mk phenotype. Because individuals with the Mkphenotype lack both the GPA and GPB protein their red blood cells type as M‐, N‐, S‐, s‐, U‐, En(a‐), Wr(b‐) and have reduced sialic acid.
Study Design/Method: 23 year old white Mennonite female G1,P0 presented to her midwife for prenatal care with the intent of home delivery. She had a positive antibody screen by solid phase at the hospital transfusion service. An antibody identification panel was done in gel. Testing for antibodies against selected cells (U‐ and Uvar) in tube with PEG enhancement and phenotyping was done. Based on MNS phenotype, anti‐Ena was suspected. The specimen was referred to an immunohematology reference laboratory (IRL). The testing included phenotyping with unlicensed antisera, ficin treated panels by tube technique, allogeneic adsorptions for antibody exclusion and identification and antibody titration. Following identification of anti‐Ena by the IRL the midwife was advised to refer the patient to a maternal fetal medicine specialist at an academic center close to the patients’ home. The midwife was also advised to consider autologous blood donation and /or testing of siblings.
Results/Finding: Testing by the hospital blood bank demonstrated positive reactivity in the antibody screen. The gel antibody panel AHG phase resulted in 2+ panagglutination and a negative autocontrol, suggesting a high prevalence antibody. The phenotype was performed and determined to be M‐, N‐, S‐, s‐, U ‐. Outdated U variant reagent cells reacted in PEG IgG phase ruling out anti‐U. Anti‐Ena was suspected and the sample was referred to the IRL. Allogeneic adsorptions were performed to rule out antibodies to common red cell antigens. Lack of reactivity on a ficin panel eliminated the presence of anti‐U,‐Wrb. Phenotyping with unlicensed anti‐U was negative and unlicensed Glycine Soja demonstrated 1+ reactivity, suggesting that the patient is En(a‐). The patient's phenotype is consistent with the Mk phenotype. Based on the lack of reactivity on the ficin panel, the antibody was identified as anti‐EnaFS. Since anti‐Ena is extremely rare, this specificity could not be confirmed due to the lack of En(a‐) cells and appropriate antisera. The baseline antibody titer was 2 at IgG phase without enhancement.
Conclusion: This case study describes the workup of a rare antibody in a prenatal patient at a tertiary care hospital. Studies performed after the patient was transferred closer to home confirmed the anti‐Ena (FS) and genotyping was performed. Three titers were performed for the remainder of the pregnancy and held at 2. Although anti‐Ena has been implicated in HDFN, a healthy infant was delivered without complications. This patient should be monitored closely through future pregnancies. Autologous donation and/or sibling testing should be considered in order to provide compatible blood for intrauterine transfusion or transfusions at or after delivery.
CP184
Autoanti‐G Found in the Absence of Anti‐D and Anti‐C
Kelly Bowman*, Pinkie Anderson, Katrina Billingsley, Monica Kalvelage and Jared Fry
LifeShare Blood Centers
Background/Case Studies: A 15 year old Caucasian male diagnosed with hemolytic anemia and no previous transfusions was referred to the Immunohematology Reference Laboratory (IRL) for antibody identification and RBC genotyping. Initial serologic testing by the referring facility and the IRL demonstrated anti‐D, anti‐C and/or anti‐G specificity with a positive auto control and IgG DAT. Anti‐G has an anti‐D, ‐C specificity and is most frequently found in rr individuals exposed to r'r cells. The G antigen is present on RBCs expressing either RhD and/or C and very rarely on D‐C‐G+ (rGr) cells. Both RHCE*C and RHD genes encode Ser103 which determines G expression. Rare RhD variant antigens lacking Ser103 are G‐.
Study Design/Methods: Serologic evaluation included tube testing using Gamma LO‐IONTM (Immucor, Inc., Norcross, GA) enhancement, elution studies (Gamma ELU‐KIT® II (Immucor, Inc.)), EDTA glycine acid treatment (Gamma EGATMKit (Immucor, Inc.)), allogeneic adsorptions with papain treated intact RBCs, reagent and patient‐derived RBCs and antisera. Molecular testing was performed with BioArray Precise Type IVD HEA Assay (Immucor, Inc.).
Results/Findings: Molecular testing revealed an RHCE*cE genotype (with a C‐E+c+e‐ predicted phenotype) and an otherwise unremarkable RBC typing report. Serologically, the antibody(ies) demonstrated an anti‐D, ‐C, ‐G specificity in the serum and eluate using Ror, R2R2, r'r, rGr and rr cells. This patient is predicted to be R2R2 (DcE/DcE) therefore, anti‐C is possible but an allogeneic anti‐D or ‐G is exceptionally unlikely. Allogenic adsorptions using papain treated Ror and r'r cells excluded anti‐C and anti‐D, leaving anti‐G as the only explanation of the initial findings. Reactivity with the patient's EGA treated (DAT negative) cells against the “neat” serum, eluate and anti‐G antisera confirmed auto anti‐G.
Conclusion: Warm autoantibodies are common findings and often have an Rh specificity; however, these antibodies usually demonstrate a broad but weaker specificity in the eluate or in the serum when enhancements are used. This anti‐G had no reactivity with G‐ cells. The differentiation of anti‐G from anti‐D and anti‐C is generally academic as transfusion recommendations are the same: provide RhD‐, C‐ units. It is relevant and clinically important to determine the presence or absence of anti‐D in RhD negative women of childbearing age who present with an anti‐G specificity. If anti‐D is excluded these women should receive RhIG as part of their prenatal care. In this case differentiating anti‐D, ‐C from an auto anti‐G was necessary to provide transfusion recommendations. Providing RhD‐ and C‐ units to give serologically compatible RBCs could result in formation of an allogeneic anti‐e.
CP185
Automated Eluates: Comparison of Solid‐Phase Red Cell Adherence and Gel Automated Eluate Testing
Jayanna Slayten*1, Christa Voliva1, Kathy Fletcher1, Heather Vaught2 and Tracie Ingle1
1Indiana University Health, 2Indiana University Health (IU Health)
Background/Case Studies: Acid Eluates (ELU Kit II. Immucor. Norcross, GA) are to be tested via tube IAT method in parallel with the recovered last wash per the manufacturer's package insert. Finck etal (Immunohematology 2011; 27:1‐5) demonstrated acid eluates may be tested in other platforms such as manual gel microcolumn assay (ID‐MTS.IgG Card. Ortho Clinical Diagnostics. Raritan, NJ) and automated solid‐phase red cell adherence systems (Echo. Immucor. Norcross, GA). Our study looked to compare the use of the automated gel microcolumn analyzer (VISION, Ortho Clinical Diagnostics. Raritan, NJ) to the solid‐phase red cell adherence analyzer (ECHO, Immucor. Norcross, GA) for the testing of acid eluates in a regional Midwestern transfusion service.
Study Design/Methods: Twenty patient samples, less than 7 days from collection and drawn in EDTA, were used to prepare acid eluates (Elu‐Kit II. Immucor. Norcross, GA) while retaining the last wash to be tested in parallel. Two samples were >2+ DAT positive, 2 were weakly DAT positive and 16 were DAT negative. The prepared eluates were observed for color (blue‐green/BG, blue‐brown/BB, blue‐purple/BP), and the pH was documented for the prepared eluate (Whatman 6.0‐8.1pH. Whatman International. Maidstone, England). The prepared eluates and last washes were tested on the VISION and ECHO against an antibody screen. If the antibody screen was positive, the sample was tested against an antibody panel to determine specificity/pan‐reactivity. Prior to the eluates being tested on the automated platforms, they were spun for 5 minutes twice to remove any RBC debris which could cause false positive reactions.
Results/Findings: The eluates prepared ranged in color: 5 BB, 14 BG and 1 BP. The pH of all eluates ranged from 6.9‐8.1 with the highest percentage of eluates at a pH of 8.1 (35%). Sixteen of the 20 eluates tested yielded the same results in both automation platforms (concordance of 80%). Four eluates with different results are summarized in Table 1.
Conclusion: The study demonstrated that both analyzers may be used for eluate investigations. Both methods yielded apparent false positive results on samples which were initially DAT negative. The ECHO was more sensitive, yielding false positive results (3) when the VISION was negative, while the VISION was false positive with one eluate with ECHO negative. There was no apparent association in the non‐correlating eluate results in relation to color of eluate, age of sample when eluate was prepared, or pH of the eluate. A larger study may be able to better elucidate the apparent false positive results noted in this study between ECHO and VISION eluate study.
TABLE 1. Non‐correlating eluate results
| # | Age | pH | Color | |
|---|---|---|---|---|
| Echo Positive, Vision Negative (False Positive in Echo) | 3 | All 4 days | 6.9, 7.2, 7.6 | All BG |
| Echo Negative, Vision Positive (False Positive in Vision) | 1 | 7 days | 6.9 | BG |
CP186
Blood Group Discrepancy Discovered after 17 Years and 38 Blood Donations: What You See Is Not Necessarily What You Get.
Mollie Bell*, David Puckett, Oscar Diaz, Lynn Jasper, Jody Hupp, Gregory R Halverson and Matthew Montgomery
Hoxworth Blood Center
Background/Case Studies: Blood agglutination observed by Landsteiner in 1900 led to the discovery of human blood groups. In the ABO system >200 alleles have been described. The glycosyltransferase encoded by most results in weakened expression of A or B or the null (Group O) phenotype. As testing methods and reagents improve, donors may appear to change their ABO type. Here we describe a frequent Group O blood donor (38 units over 17 years) who is actually Aw.
Study Design/Methods: Donations were tested with the PK7300 instrument (Beckman Coulter Inc.). Routine forward and reverse ABO testing was used to investigate the discrepancy. Molecular studies were performed by DNA sequencing of ABO introns 1,2 and 4 and exons 6 and 7. Specific primers located in the flanking intron regions of the blood group gene were used to amplify relevant exons by PCR. The template used is genomic DNA extracted from whole blood collected in EDTA. PCR‐amplified exons are subjected to bidirectional DNA sequence analysis using standard Sanger dideoxy chemistry. Seqscape software (ABI) was used to analyze sequence data by comparing the obtained sequence to a reference sequence from NCBI.
Results/Findings: Serologic results are shown in Table 1. Tests with Anti‐A, ‐A1, ‐B anti‐A,B were negative as were the A2 cells in reverse testing. The results of DNA sequencing of ABO introns/exons are shown in Table 2. The significant changes were found in exons 6 and 7. In exon 6 there was a nucleotide (NT) deletion of 261G which resulted in a shortened transcript due to a stop codon, and another NT substitution lead to the amino acid change Gly117Ala. Mutations in exon 7 included a NT substitution causing a Pro156Leu change and a NT deletion 1061C resulting in shortened transcript.
TABLE 1. Serologic Testing
| ABO Forward Anti‐ | Reverse Cells | ||||||
|---|---|---|---|---|---|---|---|
| A | A1 | B | A,B | A1 | A2 | B | |
| IS | 0 | 0 | 0 | 0 | 2 | 0 | 3 |
| RT | 0 | 0 | 0 | 0 | 2 | 0 | 3 |
| 4C. | 0 | 0 | 0 | 0 | 2 | 1 | 3 |
TABLE 2. Molecular Analysis
| Locus | Segment | NT Change | AA Change |
|---|---|---|---|
| ABO | Intron 1 | IVS1 + 22G/A | ‐ |
| ABO | Intron 2 | IVS2 + 45A | ‐ |
| ABO | Intron 4 | IVS4‐9T/C | ‐ |
| ABO | Exon 6 | c.261G/delG | p.88Thr/Pro>fs118Ter |
| ABO | Exon 6 | c.350G/C | P.117Gly/Ala |
| ABO | Exon 7 | c.467C/T | p.156Pro/Leu |
| ABO | Exon 7 | c.1061C/delC | p.354Pro/Arg>fs376Ter |
Conclusion: Serologic testing of the donor plasma with A2 cells was non‐reactive revealing the ABO discrepancy. Molecular testing confirmed the donor genotype is heterozygote A/O [ABO*O.01.01/ABO*AW.02] which predicts Aw phenotype. Normally, donor RBCs are tested with Anti‐A and ‐B and the reverse type confirmed by testing the with A1 and B cells. This ABO discrepancy was caused by the presence of anti‐A1 in the plasma causing the forward and reverse type to be interpreted as group O. According to FDA guidelines, the donor is technically group A, and as such all donations need to be labeled as group A. The donor was contacted and instructed to cease donating blood for transfusion. If donations continue, the unit labeled group A would likely test as Group O at the transfusion facility resulting in an FDA reportable error. There are numerous reports in the literature of the relative insusceptibility of A2 cells to destruction by anti‐A, however, there is one hemolytic transfusion reaction to Ax blood transfused to a patient with a potent anti‐A titer >1:1000. (Schmidt, Nacarrow etal. 1959). A review of transfusion recipients of the donor reported here did not reveal any untoward reaction after transfusion.
CP187
Blood Sample Suitability for DNA Extraction and Red Blood Cell Genotyping
Christina Tan, Emily Booth, Jessica Keller, Trina Horn and Margaret A Keller*
American Red Cross
Background/Case Studies: EDTA blood tubes are a useful source of genomic DNA (gDNA) for red blood cell (RBC) genotyping of patients and donors. RBC genotyping of blood donors is performed in batches that start with extraction of gDNA from EDTA‐anticoagulated whole blood from pilot tubes derived from the unit. DNA extraction from whole blood is performed on up to 96 blood tubes using the BioRobot Universal System (QIAGEN). There is no information on the maximum acceptable age of the blood for this purpose, either from the vendor or in peer‐reviewed literature. We set out to assess if blood up to 15 days post collection yielded suitable gDNA for downstream RBC genotyping.
Study Design/Method: 92 EDTA blood tubes collected from random blood donors were used to extract DNA from 200 microliters of whole blood on day 5, 12 and 15 days post collection. Blood samples were stored at 2‐8C before and after extraction. Tubes were brought to room temperature and rocked before loading on the BioRobot. Extraction was performed using the MDx Blood Minikit (QIAGEN). Resulting DNA samples were assessed for gDNA yield and absorbance A260/A280 using a Nanodrop 2000 (Thermo Scientific). The extracted gDNA was tested using PreciseType HEA Molecular BeadChip (“HEA”, Immucor) and failure rates on both the BioRobot and the HEA were assessed.
Results/Finding: All three extractions were successful with no invalids (result=0) on the BioRobot Universal Report. No evidence of visible clots or splatter during extraction was noted by the technologist. Out of the 92 samples, 20 samples were chosen at random and concentrations were measured using Nanodrop for each of the extracted plates. DNA concentrations ranged from 10.8 to 62.6 ng/uL. All readings with the exception of 1 (10.8ng/uL) had concentrations >= 15ng/uL. Interestingly, the one that was <15ng/uL on day 5, yielded >=15ng/uL on day 12 and 15 post collection. Over the next 3 months, 67 sets of 92 samples were extracted and tested by HEA. Eighty‐three (1.3%) failed extraction and 82 (1.3%) failed HEA. None of the samples that failed extraction were 12 or 15 days post collection; none of those that failed HEA were 15 days post collection; 3.7% were >10 <15 days post collection.
Conclusion: Based on these results it can be concluded that EDTA blood tubes up to 15 days post collection can be used as a source of gDNA for RBC genotyping without negatively effecting the concentration of the resulting DNA samples and the validity of the resulting genotyping.
CP188
Case Study: Investigation of Persistent Negative Antibody Screens on Patients Receiving Daratumumab
Raeann Thomas1, Carlos Villa1, Rachel Davis‐Rauser*1, Helen Carpenter1 and Vrunda Patel2
1University of Pennsylvania, 2Hospital of the University of Pennsylvania
Background/Case Studies: Daratumumab is an anti‐CD38 monoclonal antibody therapy that received FDA approval for treatment of multiple myeloma in 2015. Communications suggest all patients receiving therapy would have a positive antibody screen because CD38 is a common antigen expressed on red blood cells.
Currently, 154 patients have been treated with daratumumab at a large academic medical center. A wide variation of reactivity was observed, including patients who were found to have consistently negative antibody screens. While there are several potential causes, neutralization of anti‐CD38 antibodies could easily be tested by applying established techniques used for neutralizing antibody reactivity.
Study Design/Method: Samples received were drawn as a standard of care. Indirect antiglobulin testing was performed using solid phase red cell adherence and gel. Neutralization was performed by adding equal volumes of negative daratumumab treated patients’ plasma with positive daratumumab treated patients’ plasma. A dilution control was made by adding saline to each positive patient's plasma. Samples were incubated for 1 hour at room temperature and antibody screens were repeated. Serial two‐fold dilutions were also tested to determine if the neutralization could be titered. Testing was repeated using various positive patient samples to determine if negative/positive combinations resulted in different reactivity.
Results/Finding: All control samples remained positive. Positive/negative samples were negative in solid phase testing across all patient combinations at 1:1 dilutions. Variable reactivity was observed in gel. Serial dilutions showed that neutralization for 2 negative patients was observed up to a 1:4 dilution.
Conclusion: Results suggest that patients' plasma may have a substance that neutralizes the antibodies. There is a possible correlation with patients who have persistent negative antibody screens and patient response to daratumumab. Additional studies are necessary to uncover how this correlates to patient outcomes. Further studies using a standardized daratumumab‐spiked sample will be conducted.
CP189
Clinical Approach in Identifying a Rare Anti‐En(a) Antibody in a Maternal Prenatal Sample
Philip Justin Howard*1, Melissa R. George2, Kip Kuttner3, Gorka Ochoa4 and Melissa Grohotolsky3
1Penn State Hershey Medical Center, 2PennState Health Milton S. Hershey Medical Center, 3Miller Keystone Blood Center, 4Grifols Biomat
Background/Case Studies: The MNS blood group is a red cell antigen system located on glycophorin A (GYPA) and glycophorin B (GYPB). Individuals lacking GYPA or both GYPA and GYPB on their red blood cells may develop a rare antibody against the En (a) antigen. The En (a) antigen is a high‐prevalence antigen, located on GYPA. We present a case with a rare red cell phenotype and alloimmunization to the En (a) antigen.
A 28 y/o G1P0 at approximately 23 weeks gestation was discovered to have an anti‐En (a) antibody in her plasma on a prenatal type and screen. This was worrisome for both mother and fetus, as the En (a) antibody is of IgG isotype and has been implicated in both acute and delayed hemolytic transfusion reactions and hemolytic disease of the fetus and newborn (HDFN)[1,2].
Further testing with red cell antisera revealed that the patient lacked M, N, S, s, and U antigens. A multiplex, allele‐specific, PCR platform we commonly use to detect the presence or absence of red cell gene sequences failed to amplify genes specific for the M, N, S, s, and U antigens. These findings were consistent with a null phenotype for both GYPA and GYPB antigens, i.e. M (k) M (k) phenotype. The patient's husband and father of her unborn baby demonstrated a M+N‐S+s+ phenotype by the same serological and molecular means.
Given the exceedingly rare incidence of En (a‐) individuals (positive frequency >99.9), clinical encounters with alloantibodies to this antigen are limited in our experience and in the literature [1,2]. However, the existing data gives credence to its association with transfusion reactions and hemolytic disease of the fetus and newborn (HDFN). The consensus in this case was to work her up as a high‐risk pregnancy with frequent intensive monitoring which involved frequent monitoring of antibody titers. If transfusions were required for the mother or fetus, our options were to either search for rare units lacking the En(a) antigen via rare blood donor registries or directed donations from family members who match the patient's phenotype.
At term, the patient underwent induction of labor and successfully delivered a health baby boy by vaginal route. The delivery was without event. No transfusions were necessary antepartum or postpartum.
Study Design/Methods: N/A
Results/Findings: N/A
Conclusion: Anti‐En(a) is a rare antibody and there is limited data about its potential clinical sequelae, which is concerning in a pregnant woman. Providing this patient with rare En(a) negative red cells via national or international blood donor registries would have been an arduous task if needed. This patient had many compatible family members available and willing to donate blood. The M(k) null allele (s) within this family is likely due to a genetic recombination among the GYPA and GYPE genes rather than a mutation in both the GYPA and GYPB genes [3]. This results in the absence of glycophorins A and B and the constitutive antigens of the MNS blood group system. Our patient was exposed to the En(a) present on glycophorin A on her unborn baby's red cells (inherited from father) in utero with subsequent alloimmunization. In conclusion, this case report demonstrates a clinical approach in identifying a rare anti‐En(a) antibody in a prenatal sample. The clinical finding of a rare antibody in which there is limited data requires leveraging every resource available in order to predict its behavior and provide safe blood products to patients who may require it.
CP190
Clinical Outcomes of Molecular Matching in Transfusion‐Dependent Patients with Sickle Cell Disease (SCD) and Thalassemia
Mayra Dorigan de Macedo, Tamires Delfino dos Santos, Sheila Fatima Perecin Menegati, Fabricio Biscaro Pereira, Simone Gilli and Lilian Castilho*
Hemocentro Unicamp
Background/Case Studies: Transfusions are essential for patients with SCD and thalassemia to maintain growth and development during childhood and to sustain good quality of life during adulthood; however, the development of red blood cell (RBC) alloantibodies and autoantibodies complicates transfusion therapy in such patients. Routine phenotyping of blood recipients and the use of phenotype‐matched blood units for transfusion has been useful to lower the occurrence of red cell alloantibodies in chronically transfused patients with thalassemia and SCD. Nevertheless, extensive phenotyping is expensive, laborious and cannot be performed in certain situations. The molecular understanding of blood groups has enabled the design of assays that are being used to better guide matched red blood cell transfusions and to maintain an inventory of units DNA typed. Based on this, our aim was to evaluate the clinical outcomes of molecular matching performed at different levels during 3 years for patients with SCD and thalassemia.
Study Design/Method: Blood group genotypes were determined in 67 DNA samples from chronically transfused patients with SCD, in 65 patients with thalassemia and in 3000 DNA samples from blood donors. Laboratory developed tests (LDTs), HEA BeadChipTM, RHD BeadChipTM, RHCE BeadChipTM, and sequencing were used to determine the genotypes among patients and donors. Molecular matching was performed in 3 levels: (1) RH and K matching; (2) extended matching and (3) extended matching including RH variants. We considered the total of red blood cell units requested for each patient and a number of 2 donations per year for the compatible donors.
Results/Finding: According to the patients needs we performed molecular matching for 100% of our thalassemic and SCD patients at level 1, 90% for SCD patients and 70% for patients with thalassemia at level 2 and 30% for patients with SCD and 90% for patients with thalassemia at level 3. The patients were transfused with a median of 36.4 RBC units. After three years of molecular matching, we observed that this transfusion strategy avoided new alloantibodies development and hemolytic transfusion reactions in all studied patients.
Conclusion: Molecular matching has shown clinical benefits to the patients with SCD and thalassemia, contributing significantly to reduce the rates of alloimmunization to 5‐10% with C E K matching and <1% with extended matching. Improvements in the clinical outcomes of the patients have also been observed as shown by an increase in their Hb levels and reduction in the % of HbS in SCD patients, better in vivo RBC survival and diminished frequency of transfusions.
CP191
Comparison of Sensitivity and Specificity of Two Manual Tube Methods for Antibody Identification, Low Ionic Strength Solution and Polyethylene Glycol Additive with an Automated Solid Phase System
Allahna Lilly Elahie* and Sandra Fazari
Hamilton Regional Laboratory Medicine Program
Background/Case Studies: The ideal manual backup method for an automated antibody detection system is an important choice. Currently, our backup method is saline tube (6 drops plasma, 30 minutes incubation). The change to either a low ionic strength solution (LISS) or polyethylene glycol (PEG) method would reduce incubation time to 10 minutes and specimen volume to 2 drops, both important laboratory considerations. Objectives of this study were to compare the relative sensitivity, specificity, positive predictive value (PPV) and negative predictive value (NPV) of PEG and LISS, and to determine the most appropriate manual backup method for the existing automated solid phase system.
Study Design/Method: A total of 202 specimens were compared utilizing: automated solid phase red cell adherence assay (SPRCA) with manual tube PEG and LISS, some samples were not sufficient quantity to test in LISS. Identification panels were used to determine: clinically significant antibodies, warm autoantibodies, and nonspecific reactions. Calculations were based upon comparison to SPRCA.
Results/Findings: A total of 164 clinically significant antibodies were detected using SPRCA technique, as well as 9 warm autoantibodies and 97 nonspecific reactions. PEG demonstrated the highest sensitivity and lowest specificity while LISS was least sensitive and most specific for clinically significant antibodies. For warm autoantibodies, LISS was more sensitive than PEG with both being 100% specific. Both reduced the detection of nonspecific reactions. While PEG had more nonspecific reactions (30 versus 13), it identified more clinically significant antibodies (129) than LISS (93).(Table)
Conclusion: Ultimately, the decision to choose a manual backup method must be based upon the highest sensitivity for clinical significant antibodies so as to minimize failure to detect one. PEG was selected as the backup manual method even though PEG has a higher sensitivity to nonspecific reactions. This study clearly demonstrates the interplay and tradeoffs between methods, which are important to understand and consider when making method choice decisions.
TABLE 1. Comparison studies of PEG and LISS antibody identification tests
| PEG | LISS | |||||||
|---|---|---|---|---|---|---|---|---|
| Sensitivity (%) | Specificity (%) | PPV (%) | NPV (%) | Sensitivity (%) | Specificity (%) | PPV (%) | NPV (%) | |
| Clinically Significant | 77.7(129/166) | 83.3(10/12) | 98.5(129/131) | 21.3(10/47) | 58.9(93/158) | 100(9/9) | 100(93/93) | 12.2(9/74) |
| Warm Autoantibody | 88.9(8/9) | 100(193/193) | 100(8/8) | 99.5(193/194) | 100(8/8) | 100(178/178) | 100(8/8) | 100(178/178) |
| Nonspecific | 30.9(30/97) | 89.5(94/105) | 73.2(30/41) | 58.4(94/161) | 14.9(13/87) | 98.0(96/98) | 86.7(13/15) | 56.5(96/170) |
CP192
Comparison of Thiol Reagents in Denaturing CD38 on RBCs
Patricia A Arndt*1, Anthony Salazar2 and Regina M. Leger1
1American Red Cross Blood Services, 2Long Beach Memorial Medical Center
Background/Case Studies: Monoclonal anti‐CD38, e.g., daratumumab (DARA), which is used to treat patients with multiple myeloma, causes positive indirect antiglobulin tests (IATs) due to expression of CD38 on red blood cells (RBCs). This serologic reactivity cannot be removed by adsorption so other methods have been developed to detect/identify underlying alloantibodies. One popular method is to denature the CD38 antigen by treatment of RBCs with thiol reagents, e.g., dithiothreitol (DTT) or 2‐aminoethylisothiouronium bromide (AET). Chapuy etal described (2015) and validated (2016) a method using 0.2M DTT in pH 8.0 phosphate buffered saline (PBS) and Anani etal (2017) described using AET. Branch etal (1983) previously reported 0.2M DTT in pH 8.0 PBS (final pH adjusted to 8.0) denatures Kell and Yta antigens. Advani etal (1982) previously showed that 6% AET, pH 8.0 inactivates Kell antigens. Both 0.2M DTT in pH 8.0 PBS and 6% AET, pH 8.0 require special preparation processes. Branch etal (1982) also showed ZZAP (0.1% papain + 0.1M DTT), pH 6.0‐6.5 destroyed Kell antigens and Shulman etal (1984) showed 0.2M DTT in normal saline destroyed reactivity with an anti‐Yta. A commercial company now markets 0.2M DTT (pH not given; the safety data sheet lists only two ingredients: DTT & NaCl). Blood bankers use 0.01M DTT, pH 7.2 to inactivate IgM antibodies (in plasma and on RBCs).
Study Design/Methods: RBCs from five donors were treated on Day 1 with commercial 0.2M DTT (DTT & NaCl), and in‐house prepared 0.2M DTT (in pH 8.0 PBS), 0.01M DTT (in PBS, pH 7.2), and 6% AET (pH 8.0) as per the AABB Technical Manual, 17th ed. These treated and untreated RBCs were stored in Alsevers at 4C and tested on days 1, 2, 4, 5 and 8 by two methods: 1) polyethylene glycol (PEG) IAT using plasma from two myeloma patients who had received DARA (plasmas from 8 total DARA patients were tested with reactivity = 1‐3+), and 2) flow cytometry using phycoerythrin (PE)‐labeled anti‐CD38. RBCs were also tested on days 1 and 5 or 8 with a serum containing anti‐k by PEG IAT.
Results/Findings: The 0.2M DTT in pH 8.0 PBS had a final pH of 7.3 and the pH of the commercial 0.2M DTT was 6.5. Results are in Table 1; flow cytometry results from days 2, 4 and 5 (data not shown) were similar to those from days 1 and 8. RBCs treated with 0.2M DTT (both sources) or AET were nonreactive with anti‐k and plasma from all DARA patients and gave very low results (% positive events) with PE anti‐CD38 by flow cytometry for up to 8 days after treatment. RBCs treated with 0.01M DTT reacted similarly to untreated RBCs with anti‐k and DARA plasmas, and showed only some weakening (10‐30%) of reactivity with PE anti‐CD38.
TABLE 1. CP192
| RBC Treatment, 37C | Anti‐k | DARA plasmas | PE anti‐CD38 (% positive events) | |
|---|---|---|---|---|
| Days 1,5,8 | Days 1,2,4,5,8 | Day 1 | Day 8 | |
| Untreated | 3+ | Variable | 46‐75 | 53‐73 |
| 0.2M DTT, commercial (pH 6.5), 30 minutes | 0 | 0 | 2‐4 | 1‐2 |
| 0.2M DTT, in pH 8.0 PBS (final pH = 7.3), 30 minutes | 0 | 0 | 1‐5 | 1‐3 |
| 0.01M DTT, pH 7.2, 15 minutes | 2‐3+ | Variable | 36‐59 | 49‐65 |
| 6% AET, pH 8.0, 20 minutes | 0 | 0 | 3‐4 | 2‐3 |
Conclusion: RBCs treated for 30 minutes with 0.2M DTT in pH 8.0 PBS (final pH 7.3) or commercial 0.2M DTT (pH 6.5), or 20 minutes with 6% AET (pH 8.0) gave equivalent results with anti‐k and anti‐CD38 (plasmas from DARA patients and PE anti‐CD38) for up to 8 days. DTT used at a concentration of 0.01M (15 minute incubation) was inadequate to denature k or CD38. Use of pH 8.0 PBS for preparation of 0.2M DTT may not be critical for denaturation of CD38.
CP193
Correctness of Non‐Invasive Prenatal RHD Testing in Gestational Week 25 Is Not Correlated to Maternal BMI.
Marianne Jakobsen*1, Hanne Katrine Rosbach2, Katrin Löser2, Jane Maria Lyngsø2, Christoffer Dellgren1, Mark Yazer3 and Ulrik Sprogøe4
1Department of Clinical Immunology, 2The Department of Gynaecology and Obstetrics, 3University of Pittsburgh, 4Department of Clinical Immunology, Odense University Hospital
Background/Case Studies: Clinically significant hemolytic disease of the fetus and the newborn (HDN) is often caused by feto‐maternal RhD incompatibility. With the discovery 1997 of cell‐free fetal DNA (ccfDNA) in maternal plasma, it became possible to determine the RHD genotype of the fetus using non‐invasive techniques. However, the reliability of the non‐invasive prenatal RHD test (NIP RHD) is dependent on sufficient amounts of cffDNA in the maternal plasma sample. Recent studies show that the fraction of ccfDNA in maternal plasma varies significantly between pregnant women and is inversely related to maternal body mass index (BMI). Thus, high maternal BMI, may impair the validity of NIP RHD. The aim of this study was to examine the effect of maternal BMI on the correctness of NIP RHD and the correlation of maternal BMI with fraction of ccfDNA to total free DNA in the sample.
Study Design/Method: Measurements of body height and weight of pregnant RhD negative women in gestational week 12 were obtained from patient records and used for the calculation of maternal BMI. Data on BMI were combined with the results from NIP RHD (real‐time PCR targeting RHD exon 5 and 10) and sample fraction of ccfDNA (measured as threshold cycle [Ct] value of RHD) to total free DNA (measured as Ct of CCR5) in gestational week 25. The correctness of NIP RHD was determined by correlation with postnatal serological RhD determination.
Results/Finding: A total of 1618 pregnant women were included. NIP RHD was positive in 987/1618 (61%), negative in 582/1618 (36%) and inconclusive in 49/1618 (3.0%). Compared to the postnatal RhD type, 9/987 (0.1%) of NIP RHD results were false positive (FP) and 4/582 (0.7%) were false negative. In 5/49 (10%) of inconclusive NIP RHD, the postnatal RhD type was positive. Mean BMI (n=1618) at gestational week 12 was 25.3 (10‐ and 90‐percentiles: 20.0 – 32.4). There was no difference in mean BMI between individuals who tested inconclusive or false negative by NIP RHD compared to the remainder (p=0,71). The fraction of ccfDNA was calculated for 150 randomly selected NIP RHD true positive cases. Median ccfDNA ratio was 5.47 (the distribution had a highly positive skew, 10‐ and 90‐percentiles: 0.64 – 27.2). There was no statistical correlation between BMI and fraction of ccfDNA to total free DNA (r2 =0,012; p=0.49).
Conclusion: Neither the correctness of NIP RHD test result nor the fraction of cffDNA to total free DNA appear to be correlated to maternal BMI with regard to maternal plasma samples drawn in the 25th gestational week.
CP194
Delayed Hemolytic Transfusion Reaction Due to Anti‐Lan Antibody: A Case Report.
Adla DH Angelina*, Suneeti Sapatnekar and Suzanne Bakdash
Cleveland Clinic
Background/Case Studies: Lan is a high‐prevalence antigen and the sole member of the LAN blood group system. Anti‐Lan is a very rare IgG antibody, with conflicting information regarding its clinical significance and potential for hemolysis. We report a case of delayed hemolysis in a patient with anti‐Lan antibody.
Study Design/Method: The patient's medical record and available literature were reviewed.
Results/Finding: An 83 year old man, O‐positive, with a history of heart disease and bladder cancer was admitted for radical cystectomy. The antibody screen and panel were panreactive by multiple test methods (gel, LISS, PEG) with negative autocontrols and DAT and a saline antibody titer of 1, suggestive of an antibody to a high‐frequency antigen. Anti‐Lan antibody was identified by a reference laboratory. Only 1in 20,000 donors are Lan‐, but two frozen RBC units were locally available and transfused post‐operatively. The patient's siblings were tested; one O‐positive, Lan‐ sibling was identified.
Nine months later, the patient was admitted for surgical management of metastases. At this time, the antibody screen was weakly reactive with 1 cell and new antibodies were ruled out. Blood conservation measures were instituted, including limited blood draws and cell salvage for surgery. Due to bleeding during and after surgery, 4 Lan‐ RBC units were transfused over 4 days, including rare donor units and units from the sibling donor. Another surgical procedure was then performed; by post‐operative day 2, the patient had symptomatic anemia with hemoglobin (Hb) 5.3g/dL and serially increasing troponin. No Lan‐ RBC units were available. Four RBC units untested for Lan were transfused without adverse event; the units were presumed Lan+ but crossmatch compatible and phenotypically matched for the patient's other antigens. A post‐transfusion Hb of 10.2g/dL was maintained for 4 days. The antibody screen was negative on day 3 post‐transfusion, but strongly panreactive on day 6, with a positive DAT (IgG 2+, C3 1+) and anti‐Lan antibody identified in the plasma and eluate. There was also evidence of extra‐vascular hemolysis, including a progressive decrease in Hb from 10.9g/dL on day 5 to 7.4g/dL by day 8 with no bleeding identified, and increase in total bilirubin and LDH (peak 2.4mg/dL and 304 U/L on day 7) with normal haptoglobin. The patient was febrile with leukocytosis, but had negative cultures and no other evidence of infection. A Lan‐ RBC unit was transfused on day 8 with good response (Hb 8.1g/dL). The patient remained stable and was discharged to a skilled nursing facility 6 days later.
Conclusion: Transfusion of Lan+ RBCs caused a resurgence of anti‐Lan antibody and a delayed hemolytic transfusion reaction 6 days after transfusion. The rarity of Lan‐ units may require a patient with anti‐Lan to be transfused with Lan+ units, but close monitoring for delayed hemolysis is necessary even if the antibody is not demonstrable at the time of transfusion.
CP195
Delayed Serologic Transfusion Reaction Caused By Auto‐Anti‐f.
Karen Yunker*1, Andrea Gerner1, Lynne Stewart1, Carol Sostok1, Mollie Bell2 and Gregory R Halverson2
1St. Elizabeth Healthcare, 2Hoxworth Blood Center
Background/Case Studies: Anti‐f was first described in 1953 by Rosenfield and coworkers in the serum of a hemophiliac who had been multiply transfused. The f antigen is comprised of the c and e antigens alligned in cis on the same chromosome, and is the 6th antigen assigned to the Rh Blood Group System (ISBT RH6). It is capable of causing significant transfusion reactions and mild HDFN. We report in this case a 56 year old caucasian male, admitted for evaluation of suspected T‐cell lymphoma, who appears to have had a Delayed Serologic Transfusion Reaction (DSTR) due to auto anti‐f.
Study Design/Method: Antibody screen and compatibility testing was performed by automated solid phase (Echo and Neo, lmmucor, Inc). Red cell phenotyping was done by standard tube testing with commercial reagents following the manufacturers instructions. Molecular genotyping was performed using the Bloodchip assay (Grifols, San Marcos TX). Elution studies were performed using the ELU‐ Kit II (lmmucor, Inc.)
Results/Finding: The initial antibody screen (AS) was negative and the patient was transfused 1 unit O‐ RBCs. Two weeks later the patient received an additional O‐ RBC. Within 4 days the Hgb had decreased from 8.3 to 7.1g/dl, the AS and Direct Antiglobulin Test (DAT) were now positive, and O‐ units were incompatible. Anti‐f was identified in the patient's plasma and eluate. Three additional units were requested for transfusion. Due to the rarity of O‐ f‐ RBCs, the patient was transfused 3 R1R1 (DCe/DCe) RBCs with no reported complications. The patient was discharged to follow up in clinic. Molecular genotyping showed the patient was RhD deleted (RHO* del) and had normal RHCE (RHCE*ce/RHCE*ce) genes which predict a D‐C‐E‐c+e+f+ phenotype. The Rh phenotype and AS was repeated on a sample collected 18 days later. The C typing was micro positive, mixed field only after 5 minute incubation. The other Rh antigens were not mixed filed, and the AS was non reactive. However, the DAT was weakly positive with anti‐lgG. No elution study was performed.
Conclusion: The expected post 24 hour Hgb increment from the receipt of a standard unit of blood should be near 1g/dl (or 3% Hct.) Throughout this patients hospitalization, the post‐transfusion increments did not fully achieve this expectation. The first transfuion resulted in a 0.9g/dl increase, and the second unit was only 0.5g/dl. The last transfusion of 3 units increased by only 1.2g/dl. Less than three weeks later, the RhC antigen typing was microscopic/mixed field only after extended incubation, indicating the removal of 3 R1R1 units was nearly complete. In a case from 1989, Ohto and Kariyone (Transf. 1989;Vol29, No.3) reported a 51Cr ·survival study of f+ RBCs in a patient with anti‐f. They showed that the initital survival of f+ cells was fairly normal, however, after 18 days, there was a sudden increase of red cell destruction, and by day 27 all f+ cells were cleared from the circulation. It is not unusual to find auto‐anti‐f as many have been reported, however, it is unusual to find the auto‐antibody has caused the clearance of three units of f‐negative blood. This patient will be monitored to see if the autoantibody recurs and determine if it still has anti‐f specificity.
CP196
Dithiothreitol‐Treated Reagent Red Cells Are Effective for Antibody Detection after 9‐Day Storage.
S Dupuis 1, L Walker2, M Greene1, R Weinstein1
1Transfusion Medicine, UMass Memorial Medical Center, Worcester, MA, United States; 2University of Texas Medical Branch, Galveston, TX, United States
Background/Case Studies: Use of dithiothreitol (DTT) treated reagent red cells (RRBC) is increasing in blood banks as an effective way to negate the interfering panreactivity caused by Daratumumab, an anti‐CD38 drug for treatment of multiple myeloma. Daily preparation of DTT‐treated RRBC for testing of individual patients is burdensome for the laboratory and may delay patient care. We evaluated the effectiveness of batch‐prepared DTT‐treated RRBC, stored up to 9 days after treatment, in antibody detection tests.
Study Design/Methods: In‐date RRBC (Ortho Clinical Diagnostics, Raritan NJ) were selected based on phenotype to match the antisera to be tested. RRBC were treated with 0.2M DTT (Sigma‐Aldrich, St. Louis MO) and stored in reagent red cell diluent.
RRBC were tested with commercial antisera (Ortho Clinical Diagnostics, Raritan NJ and Immucor, Norcross GA) per the manufacturer's instructions for specificities from the Rh, Duffy, Kidd and MNS blood groups (see Table 1). Patient source antibodies (anti‐D, anti‐c) were also tested. Testing was performed before DTT treatment, on the day of DTT treatment and up to 9 days following the DTT treatment of RRBC. Reactions were graded using standard serological grading of 0 (negative) to 4+ (positive) reaction strength. Stored DTT‐treated RRBC were also observed for hemolysis during the storage period.
Results/Findings: See Table 1 for a summary of results. Commercial monoclonal and human source antisera, and patient source antibody, were reactive with the DTT‐treated RRBC throughout the storage period. Reactivity decreased by less than one reaction grade for all antisera and patient source antibodies tested. Mild to moderate hemolysis was noted in the DTT‐treated RRBC's during the storage period.
Conclusion: DTT‐treated RRBC showed adequate reactivity with various red cell antisera after storage for up to 9 days. This suggests that DTT‐treated reagent red cells can be stored for at least 9 days and used for the detection of alloantibodies with minimal effect on detection ability. Batch preparation and storage of DTT‐treated RRBC can increase testing efficiency and decrease turn‐around‐time when performing pre‐transfusion testing for patients receiving anti‐CD38 therapy.
TABLE 1. Reactivity and evaluation of hemolysis after DTT treatment.
| Single dose | Double dose | Hemolysis§ | |||||||
|---|---|---|---|---|---|---|---|---|---|
| Day after DTT Treatment | Day 2 | Day 4 | Day 9 | Day 2 | Day 4 | Day 9 | Day 2 | Day 4 | Day 9 |
| Antisera Tested | |||||||||
| Anti‐D (Monoclonal‐Polyclonal Blend) | 3+ | 4+ | 4+ | 0 | + | ++ | |||
| Anti‐D (Patient source) | 2+ | ++ | |||||||
| Anti‐C (Monoclonal) | 3+ | 3+ | 4+ | 0 | + | ++ | |||
| Anti‐E (Monoclonal) | 4+ | 4+ | 3+ | 0 | 0 | + | |||
| Anti‐c (Monoclonal) | 4+ | 4+ | 4+ | 0 | 0 | + | |||
| Anti‐c (Patient source) | W+ | + | |||||||
| Anti‐e (Monoclonal) | 2+ | 2+ | 2+* | 0 | + | ++ | |||
| Anti‐Fya (human source) | 3+ | 2+ | 3+ | 0 | 0 | + | |||
| Anti‐Jka (Monoclonal) | 2+ | 3+ | 2+* | 0 | + | ++ | |||
| Anti‐S (human source) | 2+ | 1+ | 1+ | 0 | 0 | + | |||
| Anti‐M (Rabbit) | 3+ | 3+ | 2+ | 0 | 0 | + | |||
Results on day 7 after DTT Treatment
+ = mild; ++ = moderate
CP197
DTT Treated Reagent Red Cells for Use in Resolving Daratumumab Interference: More Than Just Kell?
Marilyn Stewart*, Angela Treml and Geoffrey Wool
University of Chicago
Background/Case Studies: Daratumumab (DARA) is an anti‐myeloma and anti‐lymphoma agent that is known to interfere with routine Blood Bank antibody screening tests. DARA is an IgG monoclonal antibody that binds CD38 that is present on the red cell surface. At the University Of Chicago Blood Bank, we have seen many patients treated with DARA and were showing this interfering reactivity. It has been well described that CD38 is a disulfide‐linked molecule and its immune epitopes are disrupted by reducing agents such as DTT. We performed a validation of DTT‐treatment of reagent RBC to abrogate DARA interference.
Study Design/Methods: The validation was done to prove that DTT treated red cells could be used to screen patients receiving DARA and still detect clinically significant allo‐antibodies. Screening cells and panel cells selected for DTT treatment were those RBC homozygous for clinically significant antigens, therefore allowing rule‐outs of clinically significant antibodies in patient plasma. Several patients that had received the DARA drug protocol were selected for testing as well as many patients that had allo‐ and auto‐ antibodies (but not DARA treatment). Reagent screening cells and panel cells were treated with 0.2M DTT prepared using the SOP from Judd's Methods in Immunohematology and the AABB Technical Manual. The treated cells were preserved between testing episodes using Alsever's solution, stored at 2‐5C, and observed for hemolysis (none was seen) for up to 21 days. All immunohematology testing using DTT‐treated cells was performed using gel methodology. Untreated and DTT treated cells were tested with anti k before any patient testing was done. The untreated cells reacted 2‐4+ with the anti k, and the treated cells were negative. These controls were run and tested each time DTT treatment was done. Thirty eight patient samples, including six DARA patient samples were tested.
Results/Finding: Of the six patients who had DARA interference in their untreated antibody screens, all samples had negative reactions with the DTT treated cells except one patient, which had weak reactions in one cell. This specimen was repeated three times and all repeats had weak positive reactions in the same cell. This sample was sent to the ARC reference lab for DTT treatment and all clinically significant antibodies were ruled out. Patients with allo‐antibodies present in their plasma did react with the DTT treated cells as would be expected based on the underlying alloantibody, with the exception of newly formed anti‐E antibodies in 4 patients. Plasma from these four patients with a nascent anti –E all showed no reactivity with DTT treated cells. Plasma from fourteen patients with a long history of anti‐E (greater than 6 months) did react with the DTT treated cells.
Conclusion: DTT treatment eliminates DARA interference as previously described, but also unexpectedly lessens the ability of treated cells to react with nascent anti‐E. Because of the negative testing with some of the allo‐anti E antibodies, DARA‐treated patients at UCM will be given both Kell and E negative blood if they have immunohematology testing performed using DTT reagent cells.
CP198
Duffy Antigen Phenotyping Is a Useful Tool to Identify Patients with Benign Ethnic Neutropenia
Mahboubeh Rahmani*1, Monique Scott2, Garcia Curtis2, Ellice Wong2, Alexa J Siddon1 and Christopher A Tormey1
1Yale‐New Haven Hospital, 2VA Connecticut Healthcare
Background/Case Studies: Benign ethnic neutropenia (BEN) seen in approximately 25% to 50% of persons of African descent is characterized by neutrophil count of <1.5x10⁹/L with no obvious cause and no increased susceptibility to infection or any other adverse effect. At present, there is no laboratory assay used to identify this condition and it is generally diagnosed on a clinical basis. In this study, we investigated whether Duffy (Fy) blood group phenotyping would be a potentially useful modality to help identify patients with BEN; such testing could potentially be used as a surrogate test to prevent unnecessary further work up including bone marrow biopsy in the correct ethnic and clinical setting.
Study Design/Method: Cases included patients clinically diagnosed with BEN; and controls were chosen randomly from the pools of patients from whom a CBC and type and screen were checked for any other reason. Cases and controls were tested for the RBC antigens Fya and Fyb phenotype using serologic methods. The Fy phenotype, absolute neutrophil count (ANC), white blood cell (WBC), hemoglobin level, platelet count, and medical diagnoses were extracted from the medical record. Where appropriate, data were compared statistically using the Mann‐Whitney U Test with significance set at P<0.05.
Results/Finding: Subjects who were clinically identified as having probable BEN included 7 patients (mean age 48.7; all self‐identified as African‐American; 6/7 were male) and controls included 50 patients (mean age 68.5; 10 self‐identified as African American; (50/50 male). All of the cases (100%) diagnosed with BEN had Fy(a‐ b‐) phenotype. Mean ANC (1.95x10³/uL) and WBC counts (4.04x10³/uL) were significantly lower in the cases with BEN and Fy(a‐ b‐) phenotype (P=0.0008 and 0.001, respectively) compared with controls (mean ANC = 5.46x10³/uL ; mean WBC count = 8.14x10³/uL). There was no significant difference in mean platelet counts (161x103/uL vs 213x103/uL; P=0.2301) or mean hemoglobin levels (12.4g/dL vs 11.7g/dL; P=0.6031) between the two groups. None of the patients with BEN had an accompanying marrow‐suppressive hematologic disorder based on record review; however, 18 subjects in the control group had accompanying conditions that were potentially marrow‐suppressive including hepatocellular carcinoma, acute myeloid leukemia, and myelodysplastic syndrome.
Conclusion: Testing for Fy phenotype could potentially be used as a surrogate test in patients with chronic neutropenia in a correct ethnic and clinical setting for the diagnosis of BEN. Further studies regarding Fy phenotyping comparing controls with neutropenia for any reason to our BEN population are in progress to better determine the positive predictive value.
CP199
Evaluation of the IH‐1000™ Immunohematology Gel System for Use in a Hospital Transfusion Service
Melissa J.A. Laufer*1, Deanna Brown2, Marianne M Zollman1, Mandy Madole2, Elizabeth Jack2 and Candace Williams3
1Bio‐Rad Laboratories, Inc., 2CTRMC, 3Bio‐Rad Laboratories
Facility: Carson Tahoe Regional Medical Center; Carson City, NV; Bio‐Rad Laboratories, Inc.; Hercules, CA.
Background/Case Studies: The purpose of this study was to evaluate the performance of the IH‐1000™ Automated Blood Group analyzer (Bio‐Rad Laboratories, Inc.) in a transfusion service. The analyzer was compared to their existing platform; the ProVUE®(Ortho Clinical Diagnostics). The facility's objective was to continue utilizing gel technology with a different manufacturer for higher throughput and better efficiency. This hospital facility performs approximately 8K types and screens per year.
Study Design/Methods: EDTA samples were tested on the IH‐1000 with IH‐System Gel Cards for ABO/Rh (forward and reverse); antibody screening (ABS); ABO/Rh Unit confirmation; crossmatch compatibility (IgG); antibody identification (ABID); and weak D. Anti‐IgG Direct Antiglobulin Test (DAT) was performed on both EDTA samples and EDTA cord blood samples. These tests were compared to the ProVUE for concordance. Additional samples tested with Anti‐IgG,‐C3d were correlated against tube testing for the DAT and antigen typing for: C, c, E, e, and K.
Results/Findings: The IH‐1000 had 100% concordance for all blood grouping assays. For AHG assays, the IH‐1000 detected an anti‐Jka+E, anti‐Fya + warm antibody, antibody to a high incidence antigen and a warm antibody that were missed by the ProVUE. The IH‐1000 identified one additional anti‐E not identified on the ProVUE. Discrepancies were also noted with the non‐cord DAT results. Five samples were positive on the IH‐1000 with Anti‐IgG,‐C3d vs. tube testing; reflecting the increased sensitivity of gel methodology over tube. The table below summarizes the results.
| Initial ConcordanceIH‐1000 vs. ProVUE | Concordance After Discrepancy ResolutionIH‐1000 vs. True Result | |||||
|---|---|---|---|---|---|---|
| Assay | N= | # | % | # | % | Comments |
| ABO/Rh (forward & reverse) | 99 | 99 | 100% | |||
| ABO/Rh Confirm | 51 | 51 | 100% | |||
| ABS | 120 | 116 | 97% | 120 | 100% | ProVUE missed anti‐Jka+E, low frequency antibody, anti‐Fya+warm auto, & warm auto |
| ABID | 20 | 19 | 95% | 20 | 100% | ProVUE missed anti‐E |
| Anti‐C | 47 | 47 | 100% | Correlated with tube | ||
| Anti‐E | 47 | 47 | 100% | Correlated with tube | ||
| Anti‐c | 47 | 47 | 100% | Correlated with tube | ||
| Anti‐e | 47 | 47 | 100% | Correlated with tube | ||
| Anti‐K | 47 | 47 | 100% | Correlated with tube | ||
| Weak D | 25 | 25 | 100% | 25 | 100% | |
| Cord DAT (IgG) | 20 | 20 | 100% | 20 | 100% | |
| DAT Anti‐IgG | 25 | 24 | 96% | 25 | 100% | False positive on ProVUE |
| DAT Anti‐IgG,‐C3d | 35 | 30 | 86% | 30 | 86% | 5 samples positive on IH‐1000; negative with tube, discrepancies not resolved |
| AHG Xmatch (IgG) | 66 | 66 | 100% | |||
Conclusion: This study demonstrated that the IH‐1000 analyzer and associated IH‐System™ Gel Cards are equivalent to the ORTHO ProVUE. With random access capability, minimal operator touchpoints, broad test menu and excellent assay performance, the IH‐1000 is an ideal immunohematology system for the hospital transfusion service environment.
CP200
Evaluation of the New Erytra Eflexis® Analyser and DG GEL® System for Routine Use in a Large UK Hospital Transfusion Laboratory
Chris Elliott*, Susan Barnes, Fiona Lisle, Debra Smith and Whitehouse Natalie
South Tees Hospitals NHS Foundation Trust
Background/Case Studies: The Erytra Eflexis® (Grifols) is a new fully automated, mid‐size analyzer that performs pre‐transfusion compatibility testing using DG Gel® technology. Erytra Eflexis® analyzer performance, usability and adaptability to different workflows was evaluated in the routine environment of a large UK acute hospital transfusion laboratory.
Study Design/Methods: A comparison study was performed between the Erytra Eflexis® and Erytra (our routine system providing the reference platform). A total of 2944 tests were performed on 1,214 adult patient samples and 208 donor red cell units. Erytra® Eflexis performance was evaluated according to a series of scenarios designed to simulate routine workload using the system in different configurations. Concordance between systems was assessed and discrepancies analyzed. Time to first result (TTFR), overall turn‐around time (TAT) total workload from first result to last result (throughput, results/h), manual “hands‐on” time and walk‐away time were all recorded.
For ease of use evaluation, we ranked usability features with number of steps and timing of activities including sample sort and loading, routine testing, post‐run procedures, consumables used, and space requirements. Fault recognition and messaging was assessed by simulating failures e.g. reagent absence.
Results/Findings: Blood grouping, antibody screening, antibody identification (using panels), direct antiglobulin test, red cell phenotyping and serological crossmatching were successfully tested.
Concordant results between the Erytra Eflexis® Analyzer and reference method were obtained in 99.9% of samples tested. There were 4 discrepancies, all antibody screening (2 false positives, 1 failure to detect a very weak prophylactic anti D and 1 positive reaction not detected on the Erytra but panels on both systems suggested a genuine anti Cw).
TTFR and TAT depended significantly on a number of factors including; number and variety of tests requested and whether the STAT functions were activated.
The analyser seemed to prioritise antibody screening Prioritization of the group, especially for STAT samples, was considered preferable
The laboratory team found the software easy to use with some improvements over existing Ertyra software.
Physical design of the analyser was considered good with easy access to almost all areas. Probe changing was quick and simple.
While the analyser successfully flagged all error scenarios some messages were considered misleading and could be better phrased.
Conclusion: Results showed the Erytra Eflexis® offered a robust automated solution for routine transfusion testing. The device could comfortably deal with a medium laboratory (processing 80‐100 group and screens per day). It is very flexible being able to deliver grouping, antibody screening and identification, DAT, phenotyping and serological crossmatching ,compensating for its’ single probe and wash station by clever use of incubators, centrifuges and design features.
This allows a compact design with maximum flexibility without compromising on turnaround times
CP201
Evaluation of Two Monoclonal Anti‐e As Reagents for the Detection of the Rh e Antigen and Its Variants
Gregory A. Denomme*1, Kathleen Bensing1, Michael Schanen1, Cindy Piefer1, Randall W. Velliquette2, Christine Lomas‐Francis2 and Connie M. Westhoff2
1Immunohematology Reference Laboratory, Versiti/BloodCenter of Wisconsin, 2Immunohematology and Genomics Laboratory, New York Blood Center
Background/Case Studies: Monoclonal antibodies are used as reagents for automated and manual phenotyping. False negative phenotypings have implications for variant antigens; e.g. altered C antigen mistyped as a C– blood unit stimulating anti‐C in a C– recipient. The development of new reagents should include an evaluation of antigen variants to confirm fidelity. We evaluated two monoclonal anti‐e reagents with comparator reagent using a large panel of molecular confirmed Rh e variants.
Study Design/Method: Two monoclonal anti‐e clones, RD9/4 and RD12/2, and a licensed comparator anti‐e (P3GD512+MS63), all from Diagast (Loos, France), were evaluated. RBC samples were either recovered from frozen storage (N = 42) or EDTA blood from donors (N = 72) and were tested using a manual tube method or on a PK7300 automated platform. A score 6 (1+) or greater was deemed acceptable for manual tube and a positive call for automated testing. Results were tabulated by complexity of RHCE*ce alleles (Table 1).
Results/Finding: The specificity of the monoclonal anti‐e were confirmed using common Rhce haplotypes: R1R1, R2R2, R1r, and r"r. Twenty‐one different RHCE*ce alleles were included in the extensive panel: 40 were RHCE*ce that were in trans to RHCE*cE; 16 were various RHCE*ce plus RHCE*ce48C compound heterozygotes; 31 were RHCE*ce or RHCE*Ce homozygotes; 27 were various RHCE*ce and RHCE*Ce compound heterozygotes. The comparator reagent was negative or unacceptably weak for 6 RHCE*ce alleles in trans to RHCE*cE (RHCE*ceAR, RHCE*ceMO, RHCE*ceJAL, RHCE*ceHAR), with 1 RHCE*ceAR/RHCE*ce48C compound heterozygote, and with 1 RHCE*ceCF homozygote. RHCE*ceAR, RHCE*ceMO, RHCE*ceJAL, and 1 of 2 RHCE*ceCF homozygotes were detected using the comparator reagent. RD9/4 and RD12/2 failed with 4 and 1 e variants, respectively (Table 1). Failure to detect the e variants was observed using both manual tube and automated methods for the comparator and the RD9/4 clone. None of the reagents detected e antigen variant expressed on 1 example of RHCE*ceHAR/RHCE*cE.
Conclusion: RD9/4 and RD12/2 anti‐e reacted with more e variants than the comparator reagent. The e antigen encoded by RHCE*JAL and RHCE*AR is not always detected when in trans to RHCE*cE. However, double‐dose expression was detected suggesting that the 3 monoclonal reagents bind weakly to the respective altered e antigen epitopes. The e antigen encoded by RHCE*ceHAR continues to be a challenge to detect.
TABLE 1. Summary of the 3 monoclonal anti‐e reagents (Pass/Fail, acceptable/unacceptable result)
| Comparator | RD 9/4 | RD 12/2 | |
|---|---|---|---|
| Pass/Fail | Pass/Fail | Pass/Fail | |
| RHCE*ce or RHCE*Ce alleles with RHCE*cE | |||
| ce48C; ce254G; ce712G; ce733G; ce48C,733G; ceTI | 28/0 | 28/0 | 28/0 |
| ceAR | 2/1 | 3/0 | 3/0 |
| ceMO | 3/2 | 5/0 | 5/0 |
| ceJAL | 1/2 | 2/1 | 3/0 |
| ceHAR | 0/1 | 0/1 | 0/1 |
| RHCE*ce alleles with RHCE*ce48C | |||
| ce254G; ce48C,712G; ce48C,733G; ceMO; ceS; ceTI | 14/0 | 14/0 | 14/0 |
| ceAR | 1/1 | 0/2 | 2/0 |
| RHCE*ce or RHCE*Ce homozygotes | |||
| ce48C; ce245G; ce733G; ce48C,733G; ceS; ceEK | 22/0 | 22/0 | 22/0 |
| ceAR; ceMO; ceJAL; CeRN; RH:‐46 | 7/0 | 7/0 | 7/0 |
| ceCF | 1/1 | 2/0 | 2/0 |
| RHCE*ce or RHCE*Ce compound heterozygotes | |||
| ce254G + ce733G or ce48C,733G or ceS or ceTI | 6/0 | 6/0 | 6/0 |
| ce733G + ce48C,712G or 48C,733G | 4/0 | 4/0 | 4/0 |
| ce733G + ceS or ceMO or ceEK or ceEK(var) or CeRN | 8/0 | 8/0 | 8/0 |
| ce48C,733G + ce48C,712G or ceMO or ceTI | 2/0 | 2/0 | 2/0 |
| ce48C,712G/ce254G/733G; ceS/ceTI; ceAR/ceEK; ceEK/ceJAL; ceMO/ceBI | 7/0 | 7/0 | 7/0 |
| Total | 106/8 | 110/4 | 113/2 |
CP202
Evaluation of Two Targeted Next Generation Sequencing Methods for Extended Blood Group Genotyping
Meihong Liu*, Teresita Mercado, Orieji Illoh, Maria Rios and Zhugong Liu
OBRR, CBER, FDA
Background/Case Studies: Extended molecular typing of a large number of blood donors can increase the likelihood of identifying donor red blood cells (RBCs) that match those of the recipient. This is especially important in the management of chronically‐transfused patients and patients with RBC alloantibodies. Several high‐throughput multiplex blood group molecular typing platforms have been developed to determine blood group antigen phenotypes. Targeted next‐generation sequencing (NGS) provides comprehensive sequence information focusing on specified genomic regions, and allows the simultaneous detection of genetic variants from multiple genes in a large number of samples. We developed and evaluated targeted NGS assays using two different target enrichment platforms for extended blood group genotyping.
Study Design/Method: Two custom design platforms SureSelect and HaloPlex were used independently for preparation of probes that target the entire genes of 19 blood group genes associated with the expression of 56 blood group antigens from 17 blood group systems. We used the Illumina's HiSeq 2000/2500 system to perform next generation sequencing first on SureSelect‐enriched genes from 16 DNA reference samples with average target design coverage of 97.5%, and then on HaloPlex‐enriched genes from 32 DNA reference samples with average target design coverage above 97.0%. Twelve samples were enriched and sequenced in both methods to allow a direct comparison. All reference samples were previously characterized for 38 blood group genetic variants in these 19 genes using TaqMan SNP assay and Sanger Sequencing assay. Serological data were also available for these samples. The NGS data were analyzed by CLC Genomic Workbench. Sequencing variants were detected and annotated using dbSNP database. Blood group genotype calls by the two targeted NGS methods were compared with the reference results.
Results/Finding: For the two targeted NGS methods, we evaluated and compared the target enrichment efficiency, off‐target enrichment, quality of NGS, sequencing coverage, and genotype concordance. A higher percentage of the HaloPlex reads (80.54%) were mapped to the target regions relative to the SureSelect reads (29.23%). The mean sequence coverage depth of the targeted bases was around 200x for SureSelect method and 300x for HaloPlex method. Some exons, such as RHD exons 4 and 8, 10, RHCE exon 10, ERMAP exons 5 and 12, CD55 exons 10 and 11, CR1 gene (most exons) and GYPB exon 5, are consistently covered with less than 10x coverage by both SureSelect and HaloPlex targeted NGS methods. Both methods detected RHD gene deletion in a few representative samples. The genotype call concordance on 38 blood group genetic variants was assessed by comparing NGS results to TaqMan genotyping and Sanger sequencing results, and more than 90% concordance was obtained for both targeted NGS methods. Incorrect calls were restricted to four complex blood group genes: MNS, RHD, RHCE and ABO, and involved mainly heterozygous variants and indels.
Conclusion: Using two targeted NGS methods, we have correctly detected more than 90% blood group genetic variants in 19 selected genes.
CP203
Evidence RHCE*ceHAR Does Not Encode for Rh34 (HrB) Antigen
Debra J Bailey*1, Trina Horn2, Paul Mansfield2, Najmi Qazi1, Pamela Nickle2, Jessica Keller2, Margaret A Keller2 and Jan R Hamilton1
1American Red Cross Blood Services, 2American Red Cross
Background/Case Studies: The RHCE gene has many variant forms, yet for many, the phenotypes encoded by these variant alleles is unknown or incomplete. New information can be elucidated when two altered alleles or haplotypes are expressed in an individual with subsequent alloantibody formation. The RHCE*ceHAR allele was first described in 1996 and has a phenotype of C−E−c+e+wf+w, G−, Hr0+w, Hr−, hrS−, Rh:33, Rh:50 with a partial D antigen expression. We describe new information regarding an RH haplotype that includes an RHCE*ceHAR allele and its apparent Rh:−34 (HrB−) expression.
Study Design/Method: RBC typing was performed by standard tube methods with polyclonal and monoclonal antisera. Antibody identification studies were performed by standard tube hemagglutination methods by published techniques. Molecular immunohematology testing was performed on genomic DNA extracted from whole blood and included HEA, RHD and RHCE BeadChips (Immucor) and PCR‐RFLP analysis for RHCE c.254C>G and RHD c.1136C>T.
Results/Finding: A sample from an African American female with a history of an anti‐E and anti‐K was evaluated for unexpected antibodies. Her red cell serologic Rh phenotype on an untransfused sample was D+C+E−c+e+. Her plasma contained an alloanti‐S and an antibody that reacted strongly with all random E−K−S− reagent red cells except her own. The unidentified reactivity persisted following ficin and DTT pretreatment of reagent red cells. Only D−− and Dc− red cells were non‐reactive in initial tests. Differential adsorption studies excluded antibodies to all other common antigens and hrB except E, S and K. When subsequent examples of E−S−K− red cells homozygous for the RHD*DIIIa‐CE(4‐7)‐D, RHCE*ce48C,733G,1006T haplotype (i.e., r’S/r’S) and RHD*DIIIa, RHCE*ce48C,733G,1006T/ RHD*DIIIa‐CE(4‐7)‐D, RHCE*ce48C,733G,1006T (i.e., Bastiaan genotype) were found to be non‐reactive with the patient's plasma, the antibody specificity was determined to be anti‐HrB. The patient's red cell antigen genotype identified the following probable RH haplotypes: RHD*01, RHCE*ceHAR and RHD*DIIIa‐CE(4‐7)‐D, RHCE*ce48C,733G,1006T. Additional antigen typing of the patient's red cells with unlicensed antisera indicated an Hr+ (2 of 2 sources) and HrB− (2 of 3 sources) phenotype.
Conclusion: The RHD*DIIIa‐CE(4‐7)‐D, RHCE*ce48C,733G,1006T haplotype is one of the RH haplotypes expressed by the original HrB− individual Bastiaan. The HrB antigen status of red cells of individuals with the RHCE*ceHAR allele has not been described. We report an individual with the probable RHD*01, RHCE*ceHAR and RHD*DIIIa‐CE(4‐7)‐D, RHCE*ce48C,733G,1006T RH haplotypes and production of alloanti‐HrB. The specificity of the alloantibody produced and the red cell HrB serologic antigen type supports the conclusion the variant allele RHCE*ceHAR does not encode for the HrB antigen.
CP204
Excluding Clinically Significant Alloantibodies in the Presence of Interfering Antibodies with High‐Titer, Low‐Avidity Characteristics.
Suneeti Sapatnekar and NurJehan Quraishy*
Cleveland Clinic
Background/Case Studies: High‐titer, low‐avidity antibodies (HTLA) are a group of clinically insignificant antibodies (AB) directed against high‐prevalence red cell antigens. They interfere with the exclusion of clinically significant red cell AB and crossmatch testing, leading to long work‐ups and potential transfusion delays. We often use automated solid phase red cell adherence assay antibody panels (SP) when HTLA interference is seen by other methods, and undertook this study to determine its efficacy.
Study Design/Methods: A search of the laboratory information system database was conducted for patients with HTLA between 1/1/2006 and 3/31/2017. All patient samples with available records of the full serological investigation were reviewed for testing method and results, with specific attention to the value of a given test method in permitting exclusion of clinically significant AB (rule out).
Results/Findings: Over approximately 11 years, 81 patients had HTLA established at least once by titration studies. Serological investigations on a total of 118 samples using a combination of gel, SP, and PEG and LISS tube methods, and occasional DTT and ficin panels, found that HTLA interference noted most frequently in gel (primary method) was, indeed, less often seen with SP. However, the proportion of cases achieving rule out on SP was no greater than that with PEG testing (Table). For samples where rule out could not be performed with a combination of methods, patients were assigned to phenotype‐matched transfusions, or testing was referred to a reference laboratory. Reference testing on 20 samples was successful in rule out in 60% of cases. In an additional 12 patient samples, with negative antibody screens, HTLA were identified upon work‐up for incompatible crossmatches.
Conclusion: SP is useful in avoiding interference from HTLA, but this conclusion is limited because SP was performed in only 40% of samples, and the inability to use select cell panels with SP made it difficult to complete rule out on samples containing multiple AB. PEG testing was available for 71% of samples, and was at least as effective. Further, manual testing allowed flexibility in selecting test cells when other AB were present. Both SP and PEG testing may be used alone or in combination to avoid interference due to HTLA, and can potentially decrease the number of patients requiring phenotype‐matched units due to incomplete serological evaluations.
TABLE 1. Samples with Rule Out Despite HTLA Interference
| Method | Samples with Rule Out/Total Tested (% Rule Out) |
|---|---|
| SP alone | 18/47 (38.3) |
| PEG alone | 36/84 (42.9) |
| SP and PEG | 13/28 (46.4) |
| Other method combinations | 14/14 (100) |
CP205
Expansion of the RHD DAU Cluster: Identification of Two Additional Novel Alleles
Sunitha Vege*1, Lynsi Rahorst2, Julie Kirkegaard2, Christine Lomas‐Francis1, Judith Aeschlimann1 and Connie M. Westhoff1
1Immunohematology and Genomics Laboratory, New York Blood Center, 2Community Blood Center of Kansas City
Background/Case Studies: The DAU family of RHD alleles is characterized by c.1136C>T (p.Thr379Met). The DAU0 allele harbors only this change, is not associated with depressed or altered D antigen expression, and is the ancestral allele from which other DAU alleles are purported to have evolved. Srivastava etal (Transfusion 2016, 56:2520) recently summarized serologic characteristics and associated anti‐D alloimmunization for 18 DAU family alleles. We investigated two samples with the c.1136C>T change referred with weak D antigen expression.
Study Design/Method: Serologic testing was performed by standard tube methods using licensed anti‐D reagents and the ALBAclone partial RhD typing kit. Genomic DNA was isolated from WBCs and used in manual and array assays and for amplification and sequencing RHD.
Results/Finding: Sample 1 was from a 17 yo multiracial female. Her RBCs reacted 1+S at immediate spin (IS) and 3+ in IAT with Immucor Gamma‐clone and Series 4 and 5, and mi+ at IS and 4+ in IAT with Ortho BioClone anti‐D. RBCs did not react with 2 of 12 (LHM 174/102 & 57/17) anti‐D in the partial D typing kit. This pattern did not match any of the defined partial D epitope patterns. RHD BeadChip found no changes but RFLP detected c.1136C>T characteristic of DAU. RHD sequencing confirmed c.1136C>T and identified two adjacent changes, c.787G>T and c.788G>T (c.787_788delinsTT), in exon 5 encoding p.Gly263Leu. Sample 2 RBCs reacted +w at IAT with both Ortho BioClone and Quotient ALBAclone Delta, but were non‐reactive with Immucor Gamma‐clone, Series 4 and 5, and Quotient ALBAclone blend and alpha anti‐D. Papain treated RBCs were 1+s in IAT with Ortho BioClone. These results suggested a Del like phenotype. RHD BeadChip found no changes but RFLP detected c.1136C>T. Sequencing confirmed c.1136C>T and found a new c.761C>T change (p.Ser254Leu) in exon 5. The c.761T has not been reported, but c.761G encodes a stop codon (p.Ser254Stop) in Japanese (Vox Sang 2015, 109:359).
Conclusion: We report two new alleles: RHD with c.787_788delinsTT (p.Gly263Leu) and RHD with c.761C>T (p.Ser254Leu), both also carrying the c.1136C>T (p.Thr379Met) characteristic of the African DAU cluster. D antigen associated with p.263Leu is a partial D antigen with a novel epitope pattern. The p.254Leu change is associated with a Del‐like phenotype, the first observed to our knowledge for a DAU allele, and D antigen on the RBCs is not detected in IAT by 5/7 commercial anti‐D. The RHD nucleotide changes reported here are not in dbSNP database. This study brings the DAU family of alleles to 21. The number and diversity of alleles in the DAU cluster supports that the c.1136C>T change is a major ancestral African background allele (Wagner etal, Blood 2002,100:306).
CP206
Experience of Genetic Analysis of RHD and the Results in the Preliminary Test
Tae Eun Kim*
KRC BTRI
Background/Case Studies: There have been the cases of anti‐D alloimmunization caused by the transfusion of serologically D negative blood component. By analysis of genotype of the blood component, all of them were confirmed as Asian type DEL. For that reason, the application of genetic analysis for the blood donor has been required in addition to serological assay. We established the algorithm for the genetic analysis of RHDin blood donors. In this study, we would introduce the experience of the application of the algorithm and the results in the preliminary test.
Study Design/Method: From September 2016 to present day we got 130 samples of repeated blood donors who are known to be D negative, C positive and/or E negative from 15 blood centers. We obtained the consent for the test from all of the donors who provided samples. As a genetic analysis, we accomplished polymerase chain reaction with sequence‐specific primers (PCR‐SSP) for the region of promoter, exon 4, exon 7 and exon 10in RHD gene. Based on the results of PCR‐SSP, we discriminated the results into total RHD deletion, RHD‐CE‐D hybrid and RHD variant. When the results were discriminated to be RHD variant, we additionally analyzed the sequence of exon 9 to confirm the existence of c.1227G>A and c.1222T>A variations. For the sample with indeterminate results, we performed sequencing for the full region of exon. When the result was confirmed to be RHD deletion or RHD‐CE‐D hybrid, the blood components were regarded as RhD negative. When the result was confirmed to be RHDvariant, the blood components were regarded as RhD positive. Blood components were not supplied until the final results were obtained.
Results/Finding: For the 130 sample, we identified 71 cases (54.6%) of total RHD deletion, 18 cases (13.8%) of RHD‐CE‐D hybrid, and 41 cases (31.5%) of RHD variant. 39 of RHD variant were determined to be Asian type DEL with c.1227G>A variation. 2 cases of RHDvariant were regarded to be unknown variation.
Conclusion: The frequency of RHD variant in this study was 10 % higher than that of the general D negative donors not considering RhCE phenotype in a previous study. For that reason, we considered that the genetic analysis of RHD targeting the donors of D negative, C positive and/or E negative is more efficient approach to identify RHD variant and better way to improve blood safety in the transfusion medicine related with RhD negative blood donors.
CP207
Flow Cytometry Analysis of B Subtypes with Mixed‐Field Agglutination
Lei Fang Tsai*, Ping Chun Wu, Shu Hui Feng, Yi Wen Tsai, Ming Hung Chen and Shun Chung Pai
Taipei Blood Center, Taiwan Blood Services Foundation
Background/Case Studies: Certain ABO subgroups or physiologic conditions may lead to mixed‐field agglutination on ABO typing among blood donors. The B3 phenotype was found to be the most common subgroup in Taiwanese. However, it is hard to distinguish the B3 phenotype from other B subtypes also with mixed‐field agglutination using routine serology without the genotype. This study aimed to evaluate if flow cytometric method could alternatively differentiate different B subtypes with mixed‐field agglutination rather than using molecular genotyping.
Study Design/Method: Blood samples from 30 Taiwanese blood donors exhibiting known common ABO phenotypes were included to establish normal flow cytometric patterns and genotyped. Blood samples (n=52) from B subtype donors with mixed‐field agglutination by routine serology (tube method and gel card) were further analyzed by flow cytometry and genotyping. Flow cytometric method was performed by FACSCalibur flow cytometry using the Gamma‐clone anti‐A and ‐B. For genotyping, exon 6 and exon 7 of the ABO gene were amplified and sequenced. The ABO*B3.03 allele was confirmed by PCR‐RFLP analysis.
Results/Finding: Among 52 subjects with B3 or AB3 phenotypes, 47 were genotyped as ABO*B3.03. The ABO*B3.03 group performed similar characteristic flow cytometric pattern and the profile was reproducible over time. The pattern showed the main population of cells expressed no B antigen, while a percentage (37.81 ± 6.62) of the RBCs exhibited B antigen levels diminishing with increasing of fluorescence. Other 5 subjects with B3 or AB3 subjects, genotyped as ABO*B3.06(n=1), ABO*BW.03(n=1), ABO*BW.11(n=1), ABO*BW.12(n=1) and ABO*BW.29(n=1), displayed flow patterns differed from the ABO*B3.03 group. The ABO*BW.03, ABO*BW.11 and ABO*B3.06 subjects also showed a main population of cells expressed no B antigen and, however, less percentage of RBCs exhibited B antigen levels (<10% in ABO*BW.03 and ABO*BW.11 subjects and <20% in ABO*B3.06 subject). Both ABO*BW.12 and ABO*BW.29 displayed a wedge‐shaped pattern.
Conclusion: The flow cytometric method for the detection of B antigens on RBC might be useful in discriminating between B subtypes with mixed‐field agglutination, especially ABO*B3.03 genotype. This approach could assist the serological ABO subgrouping in clinical reference laboratory.
CP208
Frequencies and Specificities of “Solid‐Phase Only” Detected Erythrocyte Antibodies: Is Solid Phase Testing Worth the Headache?
Karen Finegan*, Karen Gray, Jill Adamski, Theresa Kinard and Qun Lu
Mayo Clinic Arizona
Background/Case Studies: An effort to re‐evaluate automated testing platforms (automated solid‐phase red blood cell adherence vs automated Gel column agglutination) was recently initiated due to the perception of excessive equivocal reactions from the solid‐phase resulting in “unnecessary” workup at one site of a hospital system. The data available from parallel testing on solid‐phase, Gel, and PEG performed at another cite of the same hospital system was collected and evaluated to determine the frequencies and specificities of “solid‐phase only” detected erythrocyte antibodies and to see if solid‐phase only antibody workup is necessary for patient care.
Study Design/Methods: Throughout 2016, the transfusion service used automated solid‐phase red blood cell (RBC) adherence as the primary method for antibody screening and identification. All solid‐phase antibody screen positive samples were re‐tested using both Gel column agglutination and PEG method manually in order to determine which method should be used for antiglobulin phase crossmatch of RBC products. All antibody screen results on three methods and final antibody identification results were transcribed into a spread sheet and analyzed.
Results/Findings: A total of 398 patients were positive on solid‐phase antibody screen and re‐tested on Gel and PEG antibody screen. In 12% (n=49) patients antibody reactivity observed in solid phase only and the concurrent Gel and PEG testing were completely negative. Of them clinically significant RBC alloantibodies, warm autoantibodies, clinically insignificant antibodies were identified in 22% (n=11), 4% (n=2), and 74% (n=36) of the cases, respectively. RBC alloantibodies identified in solid‐phase only included anti‐E (n=4), anti‐Jka (n=3), anti‐K (n=2), anti‐Jkb (n=1), both anti‐E and Anti‐C (n=1) (see Table 1).
Conclusion: Solid‐phase only RBC antibodies are clinically important in a significant portion of cases (roughly 1in 4 cases). Workup for solid‐phase only antibodies is not “unnecessary” workload. Transfusion of corresponding antigen negative RBCs to these patients prevented possible hemolytic transfusion reactions.
TABLE 1. Frequencies and Specificities of “Solid‐phase Only” Detected Erythrocyte Antibodies (n=49)
| Antibody specificity | Frequencies | Percent |
|---|---|---|
| Weak non‐specific antibody | 19 | 39% |
| Solid‐phase pan agglutinin | 17 | 35% |
| Anti‐E | 4 | 8% |
| Anti‐Jka | 3 | 6% |
| Anti‐K | 2 | 4% |
| Anti‐Jkb | 1 | 2% |
| Anti‐E and anti‐C | 1 | 2% |
| Warm auto antibody | 2 | 4% |
CP209
Full‐Length Nucleotide Sequence of ACKR1 Alleles Encoding Duffy (FY) Antigens in Africans of Ethiopia
Qinan Yin*, Kshitij Srivastava, Addisalem Taye‐Makuria and Willy A Flegel
DTM/CC/NIH
Background/Case Studies: The human ACKR1 gene (previously known as DARC), comprising two exons and a single intron, encodes a multi‐pass trans‐membrane glycoprotein expressing the Duffy blood group antigens (FY). The Duffy protein acts as a chemokine receptor for various pro‐inflammatory cytokines and for the malaria parasites Plasmodium vivax and P. knowlesi. The study of FY variants in the low altitude and tropical Gambela region is important, as malaria is endemic and the endogenous population is living in this region for a long time. In the present study, we determined the full length nucleotide sequence of the ACKR1 gene encoding FY antigens in donors from Ethiopia's southwestern Gambela region.
Study Design/Method: EDTA‐anticoagulated whole blood was collected from study 60 volunteers in the Gambela region (NCT01282021). The whole ACKR1 gene was amplified in one reaction covering 12,125 base pairs (bp). This primary amplicon was re‐amplified using nested primers covering 5782 nucleotides. Nucleotide sequence was obtained by 14 sequencing reactions and manually annotated using NCBI RefSeq NG_011626.2. The sequencing covered 1008 bp of both exons, 480 bp of intron, 2101 bp of 5’‐flanking region, 947 bp of 5’‐UTR, 53 bp of 3’‐ UTR and 1092 bp of 3’‐flanking region and encompassed all the 470 variations present in dbSNP and NHLBI ESP databases.
Results/Finding: Among the 60 samples, a total of 15 SNPs, including one novel SNP in 5’‐UTR were observed. 4 SNPs occurred in the exons, 5in 5'and 3'flanking region, 4in 5’‐UTR and 2 in the intron. All 60 individuals carried the SNP indicative of the common FY:2 phenotype; while 58 individuals were homozygous and 1 was heterozygous for the GATA box mutation. No splice site mutation was detected. As 46 individuals were observed as being homozygous or heterozygous for 1 SNP, we could unambiguously assign 8 distinct alleles. In the remaining 14 individuals with 2 or more heterozygous SNPs, allele specific PCR is required to identify the alleles.
Conclusion: We sequenced more than 5.5 kb of the ACKR1 gene and identified at least 8 different alleles. The present study found that the vast majority of alleles (117/120) in the Gambela population as defined by 15 SNPs, were similar to the clinically relevant FY*02N.01 allele, which in turn is defined by only 2 SNPs at positions c.1‐67T>C and c.125G>A. Out of the remaining 3 alleles, 2 were similar to FY*02 with the Fy(b+) phenotype and 1 was similar to FY*02W.01 with the Fyx phenotype. The high frequency of FY*02N.01 (95%) in this study is similar to other studies conducted in Western, central and south‐eastern regions from Gambia to Mozambique (95%‐100%). A more detailed analysis, including other regions of Ethiopia, will be useful to support transfusion care in the US for Ethiopian‐Americans, the majority of whom may be of mixed Ethiopian ethnical background.
CP210
Gene Conversion within the r'S Haplotype Complicates RHD Genotype Interpretations
Judith Aeschlimann*, Sunitha Vege, Christine Lomas‐Francis and Connie M. Westhoff
Immunohematology and Genomics Laboratory, New York Blood Center
Background/Case Studies: The homology, proximity, and inverted orientation of RHD and RHCE on the chromosome favor gene conversion events. Regions of RHD are transferred into RHCE and conversely, resulting in hybrid alleles that encode novel or the absence of high prevalence antigens. RHD*DIIIa‐CE(4‐7)‐D is the most common hybrid and is found in African Blacks. It arose by conversion of exons 4‐7 of RHCE*ceS into RHD*DIIIa and no longer encodes D antigen, rather (somewhat confusingly) encodes partial C antigen from the RHD locus. This hybrid allele is in cis to RHCE*ceS, together known as the r'S haplotype. We investigated atypical RH genotyping results in three samples; two associated with weak D typing and one patient with sickle cell disease (SCD).
Study Design/Method: Serologic testing was by standard methods. Genomic DNA was isolated from WBCs. All samples were investigated by HEA PreciseType, RHD and RHCE BeadChip, RFLP, and Rh‐cDNA sequencing. SNP‐specific sequencing was used to establish linkage/phasing.
Results/Finding: Sample 1 (male) and sample 2 (multiracial female), both C+c−E−e+ (presumed R1R1), presented with weaker than expected D typing; 1+ IS and 3+/4+ at IAT. RHD BeadChip identified the common African RHD*DIIIa‐CE(4‐7)‐D hybrid encoding partial C antigen with apparent conventional RHD in trans. These results did not provide an explanation for weak D antigen. HEA indicated RHCE*Ce /Ce, concordant with the Rh phenotype, but c.733C>G and c.1006G>T (heterozygous) was also detected. As RHCE*Ce with 733G and 1006T has not been reported, Rh‐cDNA analysis was done. Transcripts from the RHCE locus included one conventional RHCE*Ce in trans to RHCE*ceS with exons 2 and 3 replaced with RHD*DIIIa, and from the RHD locus, one conventional RHD and the hybrid RHD* DIIIa‐CE(4‐7)‐D were found in both samples. Sample 3 (SCD male), D+C−E−c+e+, by RH beadchip had one conventional RHD and RHD*DIII type 8, and RHCE*ce733G/ceS. As RHD*DIIIa type 8 has never been found with either of these RHCE alleles, Rh‐cDNA analysis was performed. Transcripts representing a unique conversion event at the RHD locus, specifically RHCE*ce(48C) exons 1 and 2 had replaced those exons in the common hybrid RHD*DIIIa‐CE(4‐7)‐D and expression of partial C antigen was lost These unique hybrid alleles have been deposited as GenBank#: KY926711and KY926710.
|
Serology predicted |
RH BeadChip | Rh‐cDNA | ||
|---|---|---|---|---|
| RHD | RHCE | RHD Locus | RHCE Locus | |
|
R1R1 n=2 |
D DIIIa‐CE(4‐7)‐D |
Ce Ce733G, 1006T |
D DIIIa‐CE(4‐7)‐D |
Ce ceS‐DIIIa(2‐3)‐ce |
|
R0r or R0R0 n=1 |
D DIII type 8 |
ce733G ceS |
D ceS‐DIIIa(3)‐ceS(4‐7)‐D |
ce733G ceS |
Conclusion: We report two different and novel complex RH rearrangements: two samples thought to be R1R1 had a unique RHCE locus representing a gene conversion into RHCE*ceS, designated RHCE*ceS‐DIIIa(2‐3)‐ce. In kind, a sample genotyped as DIII type 8 rather had a novel RHD locus representing a gene conversion into the common hybrid, designated as RHD*ce48C(1‐2)‐DIIIa(3)‐ceS(4‐7)‐D . These represent novel events on the r'S haplotype that can confound RH genotyping interpretations. Interestingly, samples 2 and 3 have weaker than expected D antigen typing, despite the presence of a conventional RHD with RHCE*Ce [R1 haplotype (DCe)]. It is important to further investigate samples with unconventional results when interpreting RH genotypes.
CP211
High‐Frequency Antibodies Anti‐Lu(b‐) and Anti‐Yt(a‐) in a Multi‐Transfused Patient: A Case Study
Nadia Baillargeon*, Carole Ethier, Cynthia Parent, Jessica Constanzo‐Yanez, Maryse St‐Louis, Marie‐Claire Chevrier and Andre Lebrun
Hema‐Quebec
Background/Case Studies: A 81‐year‐old Caucasian female was referred to our Immunohematology Reference Laboratory (IRL) for serological investigation. She was diagnosed with anemia, renal failure and cardiac history. Her hemoglobin level was recorded at 81g/L. Her pregnancy history was not provided. She had received 5 units of packed red blood cells (RBCs) in the past including 1 unit within the last 3 months. None of the transfused unit was phenotypically‐matched. The referring hospital obtained panreactivity in gel with LISS‐suspended RBCs and ficin‐treated RBCs and negative direct antiglobulin test (DAT) and autocontrol (AT).
Study Design/Methods: ABO/Rh, DAT and antibody identification were performed by Héma‐Québec's IRL according to approved techniques. In addition to LISS‐suspended RBCs and papain‐treated RBCs, trypsin‐treated and chemical‐treated reagent RBCs such as dithiothreitol (DTT) were tested. Alloadsorption were done using papain‐treated allogeneic RBCs (R1R1, R2R2, rr). ID CORE XT platform (Progenika Biopharm / Grifols, Vizcaya, Spain) was used to analyse 29 polymorphisms which determine 37 antigens including Carthright and Lutheran blood groups. PCR‐SSP (Sequence Specific Primer) and PCR‐RFLP (Restriction Fragment Length Polymorphism) were also performed to verify the absence of the high frequency antigens Yta and Lub. Sibling samples were also requested to conduct a family study.
Results/Findings: Initial serologic testing showed strongly reactive panels in gel with LISS suspended RBCs, papain‐treated RBCs as well as trypsin‐treated RBCs and DTT‐treated RBCs but negative AT in each media leading to a probable antibody directed against high‐frequency antigen. Alloadsorption procedure allowed the identification of an anti‐Jka. A select panel of high frequency antigens absent in Caucasian population was tested. The patient's sera react weakly with one Jk(a‐), Lu(a‐b‐) reagent cell. In the meantime, genotyping results confirm the probable phenotype of the patient as Jk(a‐) Lu(b‐) Yt(a‐). Additional testing in gel using Trypsin and DTT differential effects on antigens Lu(b) and Yt(a) were performed to confirm antibody specificities. No RBCs unit Jk(a‐) Lu(b‐) Yt(a‐) were available for transfusion. Selected units were Jk(a‐) and Lu(b‐) as alloanti‐Yta are known to cause none to moderate transfusion reactions. Her daughter’ sample were types as Yt(a+) and Lu(b+).
Conclusion: Serological study showed the presence of an anti‐Jka in addition to two antibodies directed against high prevalence antigen namely anti‐Lub and anti‐Yta. The association of various selected serologic procedures combined with ethnic clues and genotyping results serves to solve this uncommon antibody combination.
CP212
Identification of a Novel Kell Mod Allele
Trina Horn*, Jessica Keller, Paul Mansfield, Pamela Nickle and Margaret A Keller
American Red Cross
Background/Case Studies: The KEL blood group system, consisting of 36 antigens encoded by the KEL gene, is organized into 19 exons. There are approximately 30 KEL alleles associated with a Kell null phenotype (K0) in which no Kell antigens are expressed, and 12 alleles associated with a Kell mod phenotype (Kmod). Individuals with the Kmod phenotype express very weak amounts of antigen on the surface of the RBC, and expression levels vary based on the allele present. Here we describe the molecular and serologic testing that was performed in the case of a 53 year‐old Hispanic male blood donor whose RBCs phenotyped K‐ k‐ Js(b‐) Kp(b‐).
Study Design/Method: The blood donor was phenotyped for K, k, Kpb and Jsb antigens using standard tube agglutination methods. Adsorption and elution studies of the donor red cells were performed using commercial anti‐k antisera (American National Red Cross). Genomic DNA (gDNA) was isolated from an EDTA blood tube using standard techniques. DNA was genotyped for human erythrocyte antigens using the PreciseTypeTM HEA Molecular BeadChip (Immucor). Exons 10, 11, 12,13 and 14 and flanking intron sequences were amplified and sequenced. Total RNA was extracted using RNeasy Lipid Tissue Mini kit (QIAGEN) and KEL cDNA was amplified and the resulting PCR product was subjected to Sanger sequence analysis and aligned using Sequencher (GeneCodes).
Results/Finding: PreciseTypeTM HEA Molecular BeadChip testing predicted the sample to be K‐ k+ Kp(a‐b+) Js(a‐b+). KEL‐cDNA sequence analysis was performed and detected a single transcript species with c.578C, c.841C, 1790T, and missing the sequences corresponding to exons 11, 12 and 13. Amplification of the exons from gDNA did not identify any nucleotide changes when compared to the reference sequence and the splice sites were intact. cDNA analysis was repeated and the same aberrant transcript was detected. Adsorption and elution studies of the k antigen demonstrated weak anti‐k reactive after 37C incubation at the PEG‐IgG‐AGT phase.
Conclusion: Here we describe a donor homozygous for a novel KEL*02 allele. This donor was presumed to have a K0 phenotype based on serology, but after molecular testing, has been reclassified as a Kmod phenotype with extremely weak expression of k. The discovery of the aberrant transcript led to adsorption and elution studies to confirm the presence of weakly expressed k antigen on the red cells. The 11 variant alleles reported to date (http://www.isbtweb.org/working-parties/red-cell-immunogenetics-and-blood-group-terminology/) are associated with missense mutations. In contrast, the allele reported here is associated aberrant mRNA transcript. We propose that this allele be named KEL*02M.12.
CP213
Identification of a Possible Novel B Subgroup in a Pregnant Female
Jessica Suzanne Drouillard*1, Bhaveshkumar Delvadia2, Karen Milks1, Barbara J Bryant3 and Alexander Carterson1
1Heartland Blood Centers, 2Emory University Hospital, 3University of Texas Medical Branch
Background/Case Studies: B subgroups are uncommon and observed infrequently, especially compared to subgroups of A. Most alleles associated with weak B expression are characterized by variation in exons 6 and 7 of the B transferase gene.
Here we report a case of a possible novel B subgroup observed in a pregnant black female. The patient specimen was referred to our reference laboratory to investigate a possible ABO discrepancy. The referring facility reported the patient's red blood cells were nonreactive with reagent anti‐A and anti‐B and the patient's plasma was reactive with A cells, but nonreactive with B cells using automated gel methodology.
Study Design/Methods: Serological testing of the patient's red blood cells was performed using routine and enhancement methods. Molecular testing by PCR‐RFLP was performed to determine the patient's genetic ABO typing and predicted ABO phenotype.
Results/Findings: Serological testing of the patient's red blood cells is summarized in Table 1; similar results were obtained with multiple sources of antisera. Enzyme treatment failed to enhance reactivity. Patient sera strongly agglutinated A1 and A2 cells, but failed to agglutinate multiple sources of B cells at all phases of testing.
TABLE 1. CP213
| Anti‐A | Anti‐B | Anti‐A,B | Autocontrol | |
|---|---|---|---|---|
| Immediate Spin | 0 | 0 | 0 | 0 |
| 15 and 30 minute RT incubation | 0 | m+ | m+ | 0 |
| 4C | 0 | m+ | m+ | w+ |
Molecular testing by PCR‐RFLP resulted in an uncommon banding pattern and indicated the presence of c.261 deleted G, characteristic of O alleles, c.467T, characteristic of A2 and some uncommon O alleles, and c.703A and c.1096A, characteristic of B alleles. Genomic sequencing of exons 6 and 7 confirmed the presence of an O allele, ABO*O09 261del G, 318T, 467T), and the presence of a B allele (297G, 526G, 657T, 703A, 796A, 803C, and 930A), but did not reveal any changes associated with previously reported weak subgroups of B.
Conclusion: While serologic abnormalities in pregnancy have been reported due to decreased antigen expression, the unusually weak reactions observed when testing this patient are unlikely due to pregnancy alone. Additional ABO gene sequencing is required to determine the specific allele mutation responsible for this weakened antigen expression.
CP214
Identification of Genetic Changes in SMIM1 Leading to Atypical VEL Expression in Brazilians
Carine Arnoni*1, Tatiane Vendrame2, Janaína Muniz3, Diana Gazito2, Afonso Cortez2, Lilian Castilho4 and Flavia Latini2
1Associa, 2Associação Beneficente de Coleta de Sangue, 3Hemocentro de São José do Rio Preto, 4Hemocentro Unicamp
Background/Case Studies: After the elucidation of the molecular basis of VEL, molecular tools have been used to explain the reduced expression of Vel antigen in different populations. Negative or weak reactions are generally related to the 17‐bp deletion in SMIM1 in homozygous or heterozygous status. However, other nucleotide changes have been described to reduce the Vel expression, as for example, the major A allele of the SNP rs1175550 located in the second intron of the gene, a regulatory region in erythroblasts. This study aimed to characterize the genetic changes related to atypical Vel expression in a Brazilian population.
Study Design/Method: A total of 400 blood donor samples from the Southeast region of Brazil were typed for Vel with an anti‐Vel serum from our inventory in GEL‐IAT. Samples typed as Vel‐negative were further analyzed by adsorption‐elution. Molecular study was performed in samples with negative results, in samples reacting 2+ and in samples with reactivity of 3+. DNA was isolated from peripheral blood and SMIM1 was sequenced.
Results/Finding: From 400 donor samples studied, 4 were serologically Vel negative by GEL‐IAT but positive by adsorption‐elution, 158 presented a 2+ reaction and the remained samples showed a reactivity of 3+. Genotyping results showed that the 4 samples with negative results and 5 of 26 samples that presented 2+ reaction were heterozygous for the 17 bp deletion and presented the A allele rs1175550 in homozygous status. From the 21 of 26 remaining samples with reactivity of 2+, 19 (90%) had the A allele of rs1175550 and 14 (66.7%) had the A allele of rs6673829. In contrast, in the 16 samples with stronger reactions we found the A allele of rs1175550in 5 (31.25%) samples and the A allele of rs6673829in 3 (18.75%) samples.
Conclusion: The molecular changes rs6673829 and rs1175550 are located in intron 2 distancing 38 nucleotides. This study reinforces the association of the A allele of rs1175550 with reduction of Vel expression and suggests the involvement of a new rs6673829 change in Vel expression. In conclusion, the several patterns of Vel expression found in different populations can be influenced by different molecular changes.
CP215
Identification of Genetic Variants Discovered By Atypical Typing Results on the NEO/Echo Platforms
Jay Parker Hudgins*1, Cheryl Matsushita2, Chris Tuma3, Lauren O'Brien4 and Ira Shulman5
1Keck School of Medicine at USC, 2LAC+USC Medical Center, 3LAC+USC, 4Keck Hospital of USC and USC Norris Cancer Hospital, 5LAC/USC Medical Center
Background/Case Studies: The D antigen is the most immunogenic antigen after ABO. Consequences of misclassification of the D‐antigen in patients or donors can be severe. Some persons inherit mutations resulting in quantitative reductions of D antigen on the cell surface (weak D), some inherit Rh haplotypes that result in biochemical effects that reduce the availability of the D antigens to reagent anti‐sera (Ceppellini effect), and others inherit D genes which are qualitatively different than wild type D. These latter individuals are often not identified until after they have formed anti‐D. We hypothesize that some of these persons at risk of forming anti‐D might be uncovered if they have weak and/or disparate D typing results with reagents that recognize different epitopes of the D antigen.
Study Design/Methods: All testing was performed using microtiter‐well direct agglutination on the GalileoNEO or GalileoEcho (Immucor, Norcross,GA). Any specimen that did not react as 0 (Rh Negative), or ≥3+ on the NEO or ≥2+ on the Echo (Rh Positive) for both series 4 and series 5 anti‐D antisera were included. Patients with discrepant historical types also were evaluated. Any specimens meeting the inclusion criteria were tested on the NEO, Echo, and by saline tube method using series 4 and series 5 anti‐D antisera. Genotyping was performed from whole blood samples sent to Immucor genotyping laboratory in Warren, NJ using an algorithm of: RHD BeadChip, RHDxp (prototype assay), RHD zygosity, and RHCE BeadChip.
Results/Findings: 80 patients met inclusion criteria for molecular testing for the D antigen. Weak or RhD variants were identified in 51 of 80 (63.7%) of the samples. Ceppellini effect (i.e. C in trans to RHD) resulting in weak D reactivity was seen in 16 of 80 (20%) of samples. 67 of 80 (83.8%) of the samples that resulted in weak or discrepant reactivity had some type of genetic cause that was resolved by using our algorithm. 40 of 80 (50%) of tested samples had results indicating weak/variant D proteins with the potential to cause alloimmunization to the D antigen. The remaining 13 of 80 (17.3%) samples did not have identified genetic cause for the weak and/or discrepant D test results and were presumptively classified as wild type D.
Conclusion: Transfusion services that use the GalileoNEO or GalileoEcho to perform Rh typing should consider molecular testing of patients whose Rh typing results are discrepant, or positive but <3+ on the GalileoNEO or positive but <2+ on the GalileoEcho, as about half of these patients can develop anti‐D. This is particularly relevant for females of child‐bearing potential where avoidance of D‐positive transfusions and administration of RhIg during pregnancy is prudent until their D typing can be confirmed by molecular testing.
CP216
Impact of Presence of RHCE*(C)ceS allele on Rhd Expression
Carine Arnoni*1, Tatiane Vendrame2, Janaína Muniz3, Rosangela Person2, Lilian Castilho4, Afonso Cortez2 and Flavia Latini2
1Associa, 2Associação Beneficente de Coleta de Sangue, 3Hemocentro de São José do Rio Preto, 4Hemocentro Unicamp
Background/Case Studies: RhD and RhCE, are major protein constituents of red blood cell membrane, composing a complex together with RhAG. Many variant Rh proteins have been described and most of them affect the integration of Rh proteins in the membrane. D antigen expression can be affected by several molecular changes and also by the RHCEhaplotypes. The present study investigated the score of reactivity of samples presenting a strong reduction in D expression.
Study Design/Method: A total of 108 samples were included in the study, being 69 previously genotyped as RHD*DAR1.2, 37 RHD*DAR3.1 and 2 RHD*DAU6. The samples were phenotyped in Neo® (Immucor) to D, C/c and E/e antigens by direct agglutinationin microplate. Results obtained in Neo® were expressed in a score from 0 – 99 corresponding to the reaction intensity. Zygosity assay was performed by a multiplex real‐time quantitative PCR using a set of RHD‐specific primers in RHD exon 10. RHCE genotyping was performed by PCR‐RFLP and SSP‐PCR. The presence of a D‐CEhybridexon 3 was identified by amultiplex PCR. Sequencing and identification of RHCE variants were also performed when necessary.
Results/Finding: Zygosity results showed that 10 of 108 samples (5 DAR1.2, 4 DAR3.1 and 1 DAU6) had 2 RHD genes, were phenotyped as C+E–c+e+ and genotyped as RHCE*ce/RHCEce. RHD and RHCE genotyping in these 10 samples showed the presence of the D‐CE‐DShybrid gene. RHCE variants investigated in 2 DAR1.2 samples showed the RHCE*ceAR/ceS genotype, in 2 DAR3.1 samples the RHCE*ceVS.02/ceS genotype and in the DAU6 sample the RHCE*ceS/ce genotype. Table 1 describes the differences found in the reactivity of D among the samples carrying the (C)ces allele and in the samples homozygous for RHCE*ce.
TABLE 1. Score of agglutination of variant RHD alleles associated with different RHCEalleles
| Variant RHD | n | Score Median | C/c Phenotype | RHCE Genotype | RHCE variant Genotype |
|---|---|---|---|---|---|
| DAR1.2/RHD‐CE‐Ds | 5 | 29,0 | C+c+ | RHCE*ce | RHCE*ceAR/ceS # |
| DAR1.2* | 64 | 71,5 | C‐c+ | NT | NT |
| DAR3.1/RHD‐CE‐Ds | 4 | 76,0 | C+c+ | RHCE*ce | RHCE*ceVS.02/ceS # |
| DAR3.1* | 33 | 88,5 | C‐c+ | NT | NT |
| DAU‐6/RHD‐CE‐Ds | 1 | 79,0 | C+c+ | RHCE*ce | RHCE*ceS/ce |
| DAU6* | 1 | 92,0 | C‐c+ | NT | NT |
hemizygous; # RHCEvariants. NT= not tested
Conclusion: The results showed that the presence of RHCE*(C)ceS significantly reduces the expression of D antigen, probably due to the expression of the partial C partial antigen in trans to RhD. Additionally, the samples with reduction on D expression carrying RHCE variant alelles phenotype can be useful to provide compatible blood to some patients with rareRH variant alleles.
CP217
Implications of Asian DEL Phenotype for Blood Transfusion in the United States
DongHyang Kwon*1, S Gerald Sandler1 and Willy A Flegel2
1Department of Pathology & Laboratory Medicine, MedStar Georgetown University Hospital, 2DTM/CC/NIH
Background/Case Studies: DEL RBCs, expressing a very weak D antigen, are detected only by adsorption and elution of anti‐D or by molecular methods. Consequently, DEL RBCs type as RhD‐negative by routine serologic methods and are transfused routinely to RhD‐negative recipients. Despite the low prevalence of RhD‐negative phenotype among East Asians, as many as 17.8% of RhD‐negative East Asians are estimated have a DEL phenotype associated with an RHD(1227G>A) allele (Asian‐type DEL). Case reports from East Asia describe RhD alloimmunization when DEL RBCs were transfused to RhD‐negative recipients. Given the number of East Asians residing in the United States, it is important to know if transfused units of DEL RBCs pose a risk of RhD alloimmunization to RhD‐negative recipients in the US.
Study Design/Methods: A literature review was performed to estimate the number of units of RBCs transfused in the US, the percent of East Asian donors, and the prevalence of Asian‐type DEL phenotypes among East Asians. Calculations were performed to estimate the minimal and maximal number of DEL RBC units transfused annually to RhD‐negative recipients in the US.
Results/Findings: The prevalence of RhD‐negative phenotypes in East Asian populations varies from 0.1% to 1.0%. The prevalence of the Asian‐type DEL RHD(1227G>A) allele based on the population surveys of different East Asian populations averages 17.8%. The number of units of RBCs transfused in the US in 2015 was 13,785,000. The percent of East Asian donors in an urban Red Cross blood center was 2.2%. Using the formula in Table 1, the estimated number of Asian‐type DEL RBC units transfused annually in the United States ranges from a minimum of 54 to a maximum of 540. No cases of RhD alloimmunization attributed to transfusion of DEL RBCs have been reported in the US.
Conclusion: The most likely explanation for the absence of reported cases of DEL‐related RhD alloimmunization is the lack of active post‐transfusion hemovigilance. One initial step in addressing the potential risk of transfusing DEL RBCs would be active hemovigilance for RhD alloimmunization in communities with a significant population of East Asians. Other options already implemented in limited donor programs include screening for C and E antigens (based on a statistical association) or testing pooled donor samples for a DEL allele by PCR (5 USD in one European center).
TABLE 1. Estimated number of RBC units with the Asian‐type DEL transfused per year in the US
| Calculation | ||||||
|---|---|---|---|---|---|---|
| Estimate | RBC units transfused per year (n) | East Asians in the US (2.2% of the donor population) | RhD negative among East Asians (0.1% to 1%) | RHD(1227G>A) allele among RhD negative East Asians (17.8%) | RBC units with DEL phenotype | |
| Minimum | 13,785,000 | x 0.022 | x 0.001 | x 0.178 | = | 54 |
| Maximum | 13,785,000 | x 0.022 | x 0.01 | x 0.178 | = | 540 |
CP218
Interference of Anti‐CD47 Therapy with Blood Bank Testing
Elena Nedelcu*1, Christy Hall2, Alison Stoner3, Quentin Eichbaum1 and Claire Meena‐Leist2
1Vanderbilt University Medical Center, Department of Pathology, Microbiology and Immunology, 2American Red Cross, 3PathGroup
Background/Case Studies: Drugs are known to interfere with routine blood bank testing. A novel monoclonal humanized 5F9 antibody (Hu5F9‐G4) that binds human CD47 has been entered into clinical trials for patients with acute myeloid leukemia, non‐Hodgkin lymphoma and solid tumors. We describe two cases of patients treated with Hu5F9‐G4 (anti‐CD47) who had ABO discrepancy with extra‐reactivity in the reverse typing and a panaggutinin in the plasma.
Study Design/Method: This is a retrospective review of two cases with immunohematology work‐up showing ABO discrepancy and plasma panagglutinin. The first case is of a 69 year old female with progressive follicular lymphoma who was enrolled in Phase 1b/2 Trial of Hu5F9G4 in combination with rituximab designed for patients with relapsed/refractory B cell NHL. She had no prior transfusion history and her historical blood type was not known. Two RBC units were requested in anticipation for a surgical procedure. The second case is of a 48 year old male with refractory diffuse large B cell lymphoma enrolled in Hu5F9‐G4 clinical trial. His historical blood type was A Rh D positive with a negative antibody screen. He received three RBC units within the past month prior to testing and receiving the anti‐CD47 therapy.
Results/Finding: The ABO typing in the first case showed a discrepancy between the forward typing (4+ with anti‐A, non‐reactive with anti‐B) and the reverse typing (3+ with both A1 cells and B cells). RhD typing was positive. The extended reagent RBC panel tested with the patient's serum reacted with all cells tested at the immediate spin (IS) phase (1+ to 4+), at LISS‐37C (1+ to 3+), at LISS‐polyspecific AHG (m+), and at PEG‐anti‐IgG (m+ to 1+). Plasma reactivity at IS persisted with DTT or ficin treated red cells and was not removed by cold autoadsorption, cold alloadsorption, or RESt adsorption. Repeat testing, which avoided the IS and 37C readings, was non‐reactive in the antihuman globulin (AHG) phase using both LISS and PEG enhancements, ruling out clinically significant alloantibodies directed toward common red blood cell antigens. The Direct Antiglobulin Test (DAT) and autocontrol were negative. The RBC units issued to the patient were crossmatch compatible at 37oC AHG phase.
The ABO typing of the second case performed after anti‐CD47 administration showed a discrepancy between the forward (4+ with Anti‐A) and the reverse (4+ with both A1 and B cells). RhD typing was positive. The antibody screen performed in solid phase technology was positive with all reagent red cells. His plasma reacted with all reagent red cells at IS (2+), at 37C in LISS (2+), and LISS‐ polyspecific AHG (m+). The DAT and autocontrol were negative. His genotype was determined to be A1/O and full RBC phenotype by DNA analysis was obtained. Repeat testing which avoided the IS phase did not show reactivity at PEG‐AHG excluding all alloantibodies directed toward common red blood cell antigens.
Conclusion: Anti‐CD47 therapy interferes with Blood Bank testing by causing ABO discrepancies and panagglutinin reactivity in the plasma at IS, 37C LISS, but not at AHG phase using Gamma‐clone Anti‐IgG, unlike the anti‐CD38 interference. Knowledge of patient's blood type and phenotype before starting this therapy is critical for providing safe blood.
CP219
Investigation into an ABO Discrepancy with an Unexpected Answer in the Lewis System
Annika K Hult*1,2, Sofia Lejon Crottet3, Jill Storry1,2, Åsa Hellberg1, Hein Hustinx3 and Martin L Olsson1,2
1Clinical Immunology and Transfusion Medicine, Division of Laboratory Medicine, Office of Medical Services, 2Division of Hematology and Transfusion Medicine, Department of Laboratory Medicine, Lund University, 3Swiss National Immunohematology Reference Laboratory bei Interregional Blood Transfusion SRC
Background/Case Studies: A middle‐aged male with discrepant ABO typing results was investigated. Initial forward typing was group O but no anti‐B was seen in the reverse typing. An unexpected 3+ reaction was noted with an anti‐A,B reagent. Genotyping surprisingly showed ABO*O.01.01/O.01.01, consistent with group O. After initial testing at the referring center, samples were sent for extended analysis.
Study Design/Method: Standard serological methods and flow cytometry were used. A panel of ABO reagents (n=23) and lectins were tested with both native and papain‐treated red blood cells (RBCs). Lewis phenotyping was performed, as was genetic testing for ABO, GBGT1 and A4GALT. Papain‐treated patient RBCs were used to screen donor plasmas (n=78) and two reactive plasmas were DTT‐treated. B‐zyme treatment that specifically converts B antigen to H [J Biol Chem. 2008;283:8545‐54] and a plasma enzyme activity assay [Hult etal. Transfus Med. 2017, ePub Apr 12] were performed.
Results/Finding: Positive reactions were obtained with 3 polyclonal anti‐A,B and a monoclonal anti‐B (clone G1/2) when tested with the patient's papain‐treated RBCs. A panel of lectins gave negative results. Genetic testing confirmed the predicted group O and ruled out the presence of FORS1 or NOR antigens. The patient was Le(a–b+) and thus a secretor.
A positive crossmatch was seen with 47% of group O plasmas, while no reactivity was obtained with A or B plasmas. DTT treatment of crossmatch‐positive plasmas indicated the antibody to be mainly of IgG type. This was confirmed by positive flow cytometry cross match using anti‐human IgG secondary antibodies. Reactivity remained after B‐zyme treatment, thus excluding the normal (type 1 or 2) B antigen to be the underlying reason. Inhibition with Lewis substance significantly decreased reactivity. Enzyme activity assay showed the patient's plasma to contain a fully functional B glycosyltransferase.
On the suspicion that the patient had non‐erythroid cells producing B‐reactive type 1 chains, a sample from a hematopoietic stem cell transplant (HSCT) patient (group B secretor receiving group O donor cells) was included as a control and gave the same type of reactions.
Conclusion: The medical history of the patient was queried and he had indeed undergone an HSCT ∼15 years earlier. The reactions are likely due to uptake of recipient‐derived BLeb (type 1) antigen (ISBT no. 007006), which is the dominant Lewis antigen in the recipient's original blood group, B Le(a–b+). Interestingly, B‐zyme did not affect BLeb. Anti‐BLeb is not simply anti‐B plus anti‐Leb but an inseparable and rarely reported specificity, which appears to be common among group O donors. The phenomenon reported here has unknown clinical implications but highlights the complexities of carbohydrate blood groups.
CP220
Investigation of High‐Incidence Indeterminate and Apparent False Positive Results on the Vision® Automated Analyzer
Wen Lu*, Rochelle McNorton, Christy Hudson, Patrice Walton, Takori Brown, Jacquelyn Rigotti, Victoria Mercier, Larry Binder and Priscilla Figueroa
Cleveland Clinic
Background/Case Studies: The ProVUE® and Vision® (Ortho Scientific, Raritan New Jersey) automated analyzer use MTS‐GelTM card technology to perform immunohematology testing. Benefits of automated testing include improved efficiency and enhanced reliability. After eight years of using the ProVUE® our Transfusion Medicine service switched to the ORTHO Vision® analyzer in January of 2017. Shortly after implementation, technologists reported increased time spent performing manual resolution of indeterminate (designated as “?”) results. Additionally, some test columns were noted to be visually negative but called positive (1+) by the analyzer. The objective of this study was to investigate the cause of “?” and apparent false positive results on Vision® three‐cell antibody screens.
Study Design/Methods: With assistance from Ortho Diagnostics, analyzer archives were queried to identify the number of gel card columns used for screens, the number of columns with “?” results, and the gel card lot numbers used for testing from 1/29/2017 to 3/31/2017. Reactivity was determined to be false positive based on supervisory review of digital images and antibody panel results. Investigation also included review of daily QC records, instrument maintenance, instrument diagnostics, and camera calibration.
Results/Findings: Of 19,647 columns run as part of antibody screens, 1,633 (8.3%) columns generated “?” results. Assuming 30 seconds of technologist time per “?”, we estimate that 13.6 hours were needed to resolve and update these results. Among all potential causes investigated, only the gel card lot number was associated with the number of “?” generated (table1).
TABLE 1. CP220
| “?” columns | Total columns | Percent “?” | |
|---|---|---|---|
| Lot 1 | 430 | 7,473 | 5.8% |
| Lot 2 | 130 | 1,323 | 9.8% |
| Lot 3 | 872 | 6,360 | 13.7% |
| Lot 4 | 194 | 4,314 | 4.5% |
| Lot 5 | 7 | 177 | 4% |
| Total | 1,633 | 19,647 | 8.3% |
In 26 cases, all three columns were visually negative but the analyzer reported 1+ reactivity with 1 of 3 cells. All cases had MTS‐GelTM antibody identification panels performed, 25 of 26 also had a MTS‐GelTM ficin panel. The yield for the 51 panels performed was two routine panels with weak reactivity against HLA+ cells, and four ficin panels with weak reactivity with no apparent specificity. Fourteen patients coincidentally had a subsequent Type and Screen; 13 were negative. One patient newly demonstrated anti‐Jka. Fifty percent (13/26) of visually negative but analyzer positive samples were tested with gel card lot number 3, 38% (10/26) with lot 1, and 12% (3/26) with lot 2.
Conclusion: The incidence of “?” and visually negative analyzer positive results is dependent on the specific lot of MTS‐GelTM cards used. The difference between the lots is being investigated by Ortho Diagnostics, and remains to be explained. To avoid unnecessary waste of technologist time and other resources, with assistance from Ortho Diagnostics, we have implemented a surveillance program to assess the “?” incidence with every change in gel card lot. If unsatisfactory, the lot is replaced. Visually negative, analyzer positive screens are now repeated manually and if negative, no further testing is performed.
CP221
Laboratory Management of Patients Treated with Daratumumab: The Irish Experience
Edel Scally*, Barry Doyle, Julie Long, Kevin Sheehan, Christina Ryan and Sorcha NiLoingsigh
Irish Blood Transfusion Service
Background/Case Studies: Daratumumab (DARA) is an anti‐CD38 human monoclonal antibody licensed for use in multiple myeloma. DARA can bind CD38 on red cells in vitro causing pan‐agglutination in the indirect antiglobulin test (IAT) which can mask underlying red cell alloantibodies. DARA was released for compassionate use in March 2016 in the Republic of Ireland. All pre‐compatibility testing for patients receiving DARA in Ireland is currently performed by the Irish Blood Transfusion Service (IBTS).
Study Design/Method: The IBTS Red Cell Immunohaematology Laboratory evaluated various methods to detect known alloantibodies in the presence of DARA prior to its release: allo‐adsorption, cord cells for antibody screening and DTT treated reagent red cells. The DTT methods evaluated were: direct tube IAT technique, Low Ionic Strength Saline (LISS) tube IAT technique and gel column (GC) IAT techniques.
Retrospective analysis was performed on all samples referred to the IBTS from May 2016 to March 2017 inclusive following the introduction of the DTT method. Performance monitoring was performed during this period on the DTT LISS tube and DTT GC IAT technique and observations are described.
Results/Finding: Of the methods evaluated, the DTT method proved the most useful for mitigating DARA interference. Cord cells were effective but in limited supply and alloadsorption was ineffective. Of the three different DTT methods evaluated, the tube method initially failed which led to re‐evaluation with the addition of LISS (passed). The GC method was the most sensitive method.
Following release of DARA, samples from 28 patients (137 cross‐match samples, 301 units issued) were tested using both LISS tube and GC IAT methods.
Despite DTT treatment, the GC method remained positive by IAT in 16/28 patients. Further testing was performed in 9/16. Eight were tested for the presence of antibodies at 18°C and confirmed in 8/8. Rouleaux formation was observed in 5/9 patients, 4/5 had reactivity detectable at 18°C.
No transfusion reactions have been reported to date nor has alloantibody formation been observed to date.
Conclusion: As previously reported, the DTT method was the most useful for mitigating DARA interference. The observed interference seems to be due to rouleaux and/or cold reactive antibodies – seen least in the LISS tube IAT. This may be due to the washing phase in this technique which dissipates rouleaux formation. Reactivity due to cold reactive antibodies can be eliminated by performance at strict 37°C. Our practice is now to use both DTT IAT methods on initial patient referral, if residual reactivity in GC is observed use LISS tube in preference thereafter in these patients. A further observation is that investigation of pan‐agglutination could include the use of cord cells to confirm/exclude DARA use if suspected.
CP222
Levels of Red Blood Cell (RBC)‐Bound Immunoglobulins (Ig) on Normal Blood Donors As Measured By Flow Cytometry (FC)
Wendy Beres*1, Sandra Nance2, David Moolten3 and P. Dayand Borge3
1American Red Cross, Assay Development, 2American Red Cross, Immunohematology Reference Laboratory, Biomedical Services, 3American Red Cross, Medical Office
Background/Case Studies: The incidence of a positive direct antiglobulin test in blood donors is reported as 1/1000 – 1/3000 (Semin Hematol 2005;42:156‐164) and low levels of RBC‐bound IgA, IgG and IgM were reported by enzyme‐linked immunosorbent assay in a study of 200 blood donors (Immunohematology 2003; 19(2):47‐53). Our laboratory tested random allogeneic blood donors, and autologous donors (which were intended to represent a hospitalized patient population), to determine a mean and range of “normal” levels. This 2.5 year retrospective study was performed to assess levels of RBC‐bound IgG, IgA and IgM in normal donors.
Study Design/Method: Residual EDTA‐anticoagulated aliquots from 150 random allogeneic and 20 autologous blood donors were sequestered and tested per Institutional Review Board approved protocol. The samples were tested by FC with fluorescein isothiocyanate (FITC)‐labeled anti‐human IgG and IgA (Jackson ImmunoResearch Lab, West Grove, PA) or FITC‐labeled anti‐human IgM (Life Technologies, Carlsbad, CA) at optimized dilutions in Dulbecco's PBS containing 0.6% BSA. The Becton Dickinson FACSCaliburTM or FACScanTM(San Jose, CA) FC analyzed 50k RBCs from each sample. EDTA‐anticoagulated samples and Ig coated control RBCs were tested to determine FC settings and control for validity and cross‐reactivity. Controls reacted as expected.
Results/Finding: The FC method detects RBC‐bound Ig and reports the percent of RBCs with characterized amounts of bound Ig. The allogeneic donor samples yielded elevated levels of RBC‐bound: for IgA in 1 of 60 donors tested, IgG in 1 of 80 donors tested, and IgM in 2 of 80 donors tested. The autologous donors yielded 1 of 20 samples with elevated levels of RBC‐bound IgG. See table for data.
Conclusion: Unexpectedly, autologous donors gave lower mean values compared to allogeneic donors for IgG (43%), IgA (21%) and IgM (60%)‐ bound Ig. There were less autologous donors tested and with a mean age of 62 these donors could have been older than the allogeneic donors, but the mean age of the allogeneic donors was not captured. Despite the relatively small number of samples tested there was a higher than expected instance of allogeneic donors having elevated RBC‐bound IgA, IgG, and IgM levels. This emphasizes the need to include testing of normal donor populations in establishing expected reactivity, thus normal and abnormal ranges for flow cytometric testing.
| Donors with RBC‐Bound | Donor | Mean (X) | SD | >X+SD | Min | Max | # of Elevated Samples |
|---|---|---|---|---|---|---|---|
| IgA (n=60) | Allogeneic | 2.38 | 1.96 | 8.26 | 0.58 | 11.33 | 1 (1.67%) |
| IgG (n=80) | Allogeneic | 2.31 | 1.91 | 8.04 | 0.20 | 8.53 | 1 (1.25%) |
| IgM (n=80) | Allogeneic | 1.58 | 1.46 | 5.96 | 0.04 | 9.11 | 2 (2.50%) |
| IgA (n=20) | Autologous | 0.49 | 0.20 | 1.09 | 0.23 | 0.85 | 0 (0.00%) |
| IgG (n=20) | Autologous | 1.00 | 0.87 | 3.61 | 0.16 | 3.82 | 1 (5.00%) |
| IgM (n=20) | Autologous | 0.95 | 0.51 | 2.48 | 0.32 | 1.87 | 0 (0.00%) |
CP223
Long Range PCR Reveals the Genetic Basis of an Antibody in Pregnancy to a High Prevalence MNS Antigen
Judith Aeschlimann*1, Anna Burgos1, Virginia Lew2, Sunitha Vege1, Susan Veneman3, Christopher J Gresens3, Jonathan Hughes3 and Connie M. Westhoff1
1Immunohematology and Genomics Laboratory, New York Blood Center, 2Blood Centers of the Pacific, 3BloodSource
Background/Case Studies: Recombination events have generated many GYPA and GYPB hybrids giving rise to glycophorin (GP) variants that express low‐prevalence antigens (e.g. Mia, MINY, Mur). In rare individuals who are homozygous these alleles are associated with lack of high‐prevalence antigens (e.g. ENKT, ENEH, ENAV). Complex hybrid recombination events can make it challenging to elucidate specific alleles present in samples, particularly heterozygotes. We investigated samples from a pregnant Asian (Hmong) woman with an antibody to an unidentified high‐prevalence MNS antigen, and samples from her sister.
Study Design/Method: Standard methods were used for RBC typing with licensed and unlicensed reagents and for antibody identification. DNA was isolated from WBCs, and HEA PreciseType, exon‐specific amplification and sequencing GYPB exons 1‐6, and long range sequencing of exon 2‐6 (5.4kb amplicon) were performed. SNP‐specific primers were used to associate changes (phasing) to specific alleles.
Results/Finding: RBCs of the pregnant proband typed S–s– (Gammaclone anti‐s), and the plasma reactivity was consistent with an antibody to a high prevalence antigen, suggesting specificity in the MNS system. However, the HEA genotype was GYPB*s/s, and 3 other anti‐s (Ortho, Quotient, Bio‐Rad Seraclone) reacted 4+ with her RBCs. Her RBCs were Mi(a–) Hil+MINY+ and Wr(b–), and her plasma was compatible with En(a–) (GPA‐null) RBCs, and RBCs from 2 people homozygous for GYP*Hil. A sample from her sister reacted similar; S– s+ variable, GYPB*s/s genotype, but surprisingly, her RBCs were not compatible with the proband. On molecular investigation, GYPB exons 1, 2, 3 and 4 failed to amplify in the proband, but long range amplification and sequencing revealed GYPB with exons 2 and 3 replaced with GYPA, consistent with a GYP(A‐B) hybrid, specifically homozygous GYP*Hil/Hil. GYPB sequencing of the sister found a GYP(B‐A‐B) hybrid with exon 2 and the 5’ portion of exon 3 (up to nucleotide c.208) are heterozygous GYP B‐A and 3’ of exon 3 is GYPA. Linkage/phasing by SNP‐specific primers indicated the sister is a compound heterozygote with hybrid GYP(B‐A‐B) GYP*Bun in trans to hybrid GYP(A‐B) GYP*Hil.
Conclusion: This case illustrates that long range PCR is superior to standard exon‐specific sequencing for investigation of complex glycophorin hybrids. There is a scarcity of relevant antibodies to MNS low prevalence antigens and the incompatibility between the GYP*Hil/Hil proband and her sister was difficult to explain until it was revealed the sister is GYP*Hil/Bun. We show that GYP*Hil and GYP*Bun are associated with partial s antigen expression not detected by Gammaclone anti‐s. The antibody was compatible with En(a‐) RBCs, i.e. anti‐En(a‐), but the molecular results indicate she is also at risk for anti‐S and –s. The proband had two previous pregnancies and had been transfused for post‐partum hemorrhage. Three autologous RBC units were collect from the mother and frozen but no fetal or neonatal complications were reported and the pregnancy went to term.
CP224
Meeting the Blood Needs for Rare U Negative Units: Survey of Blood Center Practices
Margaret A Keller*1, Nanette Johnson1 and Sandra J Nance2
1American Red Cross, 2American Red Cross and American Rare Donor Program
Background/Case Studies: The U antigen, belonging to the MNS blood group system, is lacking in 1% of African Americans. Individuals lacking U can develop allo‐anti‐U and exposure to U+ red blood cells (RBCs) can result in transfusion reactions with decreased red cell survival. RBCs that type S‐ s‐ and U‐ serologically may actually express one of two known U+VAR antigens with weak antigen expression that can be missed by serologic testing (ST), unless anti‐U/GPB is used with PEG enhancement (Reid ME etal., Immunohematology 1997;13(4):111‐4). Molecular testing (MT) by RBC genotyping distinguishes between U‐ and both U+VAR types. In 2011, a survey sent to Immunohematology Reference Labs (IRLs) gathered information about the use of RBC genotyping in patients with anti‐U and in donors serologically S‐s‐ (Johnson N etal. Transfusion 51(9):SP297, 2011). Since then, MT was made a requirement for submission of U‐ donors to the American Rare Donor Program (ARDP). Here, we resurvey the same facilities to assess changes in practice.
Study Design/Method: A multiple‐choice survey of 10 questions was sent to 35 IRLs by email (SurveyMonkey). The tabulated results were examined to assess differences in practice amongst laboratories and detect changes in practice between the prior and current survey responses.
Results/Finding: Thirty‐five IRLs responded. 76% of respondents reported using MT to determine U/UVAR status in blood donors. Furthermore, 69.7% of respondents reported that nearly 100% of their S‐s‐ donors have been tested by MT with only 15% of respondents estimating 33% or less of U‐ donors have been tested by MT. About one‐third ( 34%) of respondents used MT as the primary method to determine U/UVAR status in patients with anti‐U, whereas 22.8% used ST only and 37% used ST first followed by MT in patients that tested U‐ by ST. Of the 28 respondents that reported having requested U‐ units from the ARDP, 21/28 reported routinely requesting U‐ units confirmed by MT. Of the 26 respondents that reported supplying U‐ units to the ARDP, 23/26 report supplying units confirmed by MT. Whereas 17/35 (48.6%) of respondents to the 2011 survey reported using MT for S‐s‐ donors, with some on first donation and others on subsequent donations, this increased to 27/35 (77%) of respondents in 2017. IRLs requiring MT confirmation of U‐ donor units rose from 6/23 (26%) in 2011 to 21/34 (61%) in 2017. Of those IRLs that have supplied U‐ donor units to the ARDP, those confirming U‐ status with MT rose from 15/26 (58%) in 2011 to 23/26 (88.5%) in 2017. Participants were queried about transfusion reactions in patients with anti‐U who received crossmatch‐compatible S‐s‐ blood: 1 participant reported a case where follow‐up involved MT and 2 reported cases with no MT.
Conclusion: Donor centers have increasingly adopted the use of MT for identifying and/or confirming U‐ status in donors. This trend should result in lower risk to patients with anti‐U needing RBC transfusions.
CP225
Molecular Characterization of Two Novel Weak D Type Alleles in Brazilians
Carolina Bonet Bub*1, Maria Giselda Aravechia1, Andrea Kondo1, Aline de Souza1, Araci Sakashita1, Ana Paula Yokoyama1, Sanny Lira1, Lilian Castilho2 and José Mauro Kutner1
1Hospital Israelita Albert Einstein, 2Hemocentro Unicamp
Background/Case Studies: The RhD antigen is clinically significant and immunogenic and therefore individuals who develop anti‐D are at risk of haemolytic transfusion reaction. RHD polymorphism shows substantial ethnic variability and at least 100 RHD variants associated with weak D alleles have been reported. In this study, we report two new RHD alleles in Brazilian blood donors associated with weak D antigen expression.
Study Design/Method: The D status was evaluated with 4 commercially available monoclonal anti‐D reagents: 1 blended IgM/IgG (clones TH‐28/MS‐26), 2 IgM (clones MS201 and P3x61) and 1 IgG (MS26) in tube and on gel cards. C, c, E and e phenotyping were performed in gel. Most common weak D and partial D alleles were investigated by allele specific (AS) PCR and with the RHD BeadChip platform from Immucor. Direct automated sequencing of the 10 RHD exons and flanking intron regions was performed by the Sanger dideoxy method. In order to determine RHD allelic combinations, we also performed Rh‐cDNA cloning and sequencing.
Results/Finding: Both donor samples were phenotyped as D+wC+c+E–e+. The samples showed weak hemagglutination reactions (2+) with anti‐D clones TH‐28/MS‐26, MS‐201 and MS26 and were negative with the anti‐D IgM clone P3x61. Cloning and sequencing revealed two variants with allele combinations that were not previously described. One donor was found to be weak D type 38 (RHD*c.833G>A) in cis with a hybrid exon 5 (RHD*D‐CE(5)‐D) and in trans with the RHD*950delA in exon 7. The other donor presented a new c.325A>G base change in RHD exon 2 encoding p.Thr109Ala in the transmembraneous segment 2 of the RhD protein also in cis with a hybrid exon 5 (RHD*D‐CE(5)‐D) and in trans with the RHD*950delA in exon7.
Conclusion: We have identified two novel alleles carrying the mutations associated with DV type 2 and one additional point mutation each in trans with RHD*950delA. The donors herein characterized are from the same region but non‐related. The intense process of admixture between descendants of Europeans, African and native‐Americans genes in Brazilian blood donors can contribute to this RHD gene variability.
CP226
N Typing Discrepancies Caused By Glycophorin Hybrid Genes Associated with Sta
Jessica Keller*, Trina Horn and Margaret A Keller
American Red Cross
Background/Case Studies: Donors negative for multiple common antigens or lacking a high prevalence antigen are efficiently identified using a red blood cell (RBC) genotyping panel. When serology is used to confirm antigen negative status, discrepancies are identified, albeit rarely. Investigation of the discrepancy often leads to identification of variant antigens. It is known that the set of GYP variants associated with expression of the Sta antigen can also be associated with N typing discrepancies in M+N‐ individuals (Meyer etal. Br J Haematol. 2016; 174:624‐36). The Sta allele, also described as GYP*401, is a hybrid GYPB‐GYPAtranscript with the crossover in intron 3. We sought to investigate five N typing discrepancies for which alternative genotyping methodology was performed and found to be concordant with the initial panel.
Study Design/Method: Sample set comprised of five African American donor samples predicted to be M+N‐ by PreciseType HEA Molecular BeadChip (Immucor Warren, NJ) and genomic sequence analysis, but found to be N+ by serology. Oligonucleotide primers were synthesized and PCR reaction conditions for detection of GYP hybrids encoding Sta were based on Meyer etal. 2016. PCR amplification of genomic DNA was performed and analyzed by agarose gel electrophoresis. PCR products were subjected to Sanger sequencing using GYP‐specific primers. Sequencing was performed by GeneWiz (Plainfield, NJ) and sequences were aligned to GYPA and GYPB consensus sequences using Sequencher (GeneCodes, Ann Arbor, MI).
Results/Finding: Three of the 5 samples yielded a 2773 base pair PCR product with the Sta primers while a control sample whose genotype and phenotype were known to be concordant did not yield a product. The sequence of 2 of the 3 samples matched known MNS hybrids (GYP*401, type B and GYP*401, type F) while the sequence of the other was not previously reported. The novel GYP hybrid sequence revealed GYPB exon 2 and GYPA exons 3 and 4 with the breakpoint in intron 2, rather than the breakpoint in intron 3 as observed in previously reported Staalleles.
Conclusion: N typing discrepancies where the genotype predicts the sample to type M+N‐ and serology finds the sample to type N+ may be caused by the presence of a hybrid GYP allele that encodes Sta. The implications of the N type in a donor unit transfused to a patient with anti‐N is unknown but it would be reasonable to disqualify the genotype‐predicted phenotype of N‐ in such cases.
CP227
New ABO Allele Identified in a Prenatal Patient with an A3 like Phenotype : A Case Study Approach
Cristine Clemente Dos Santos*1 and Gorka Ochoa2
1MLS(ASCP)SBB, PHD, MS, BS, 2Grifols Biomat
Background/Case Studies: A sample from a 24 years old pregnant, African American female G1P0 was sent to the blood bank for ABO/Rh and antibody screen. The sample was analyzed using the Provue analyzer (Ortho Diagnostics). The patient was typed as O pos with no reverse type discrepancy. A retype of the same sample was performed using tube method with Biorad reagents per Hospital policy due to no previous ABO/Rh history on file. The retype showed that the patient was A subgroup with Anti‐A1 antibody present in the plasma. The sample was referred for genotyping, with the suspicion of A3 like phenotype. Genetic testing did not support the serological findings of A3 subgroup and a new ABO allele, ABO*784C that has never been reported in correlation with an A3like subgroup was detected
Study Design/Method: The patient RBCs were typed with anti‐A1(Immucor) and anti‐A,B (Biorad and Grifols DG Gel). An Anti‐A1 antibody work up was performed using three different lots of A1 cells and three lots of A2cells, as well as a type O screening cell and auto control . The tubes were read at IS and also incubated at RT and 4°C for 30min. The patient ‘s initial antibody screen using Ortho gel was negative.
DNA sequencing was performed by the Sanger dideoxy method on genomic DNA extracted from EDTA whole blood. Sequenced regions included ABO Exons 1 to 7 and flanking intron regions as well as the Intron 1 enhancer. The cis vs. trans arrangement of polymorphism c.784C with ABO*O.01 polymorphisms c.261delG and c.318T was determined by amplification of a genomic DNA segment including ABOExons 6 and 7, ligation into a TOPO TA cloning vector (Life Technologies), and clone sequencing..
Results/Finding: The patient typed as A1 negative and 2+MF with anti‐A,B( Biorad)and 4+ with A,B DG Gel (Grifols). An Anti‐A1 work up revealed an IgM antibody reacting at IS, RT and 4oC only. The gel and LISS antibody screen were negative. Genetic testing showed polymorphism c.784C, which encodes an Aspartic Acid to Histidine change at position p.256, and was found on an otherwise common ABO*A background. Genomic DNA cloning and sequencing showed the patient's genotype to consist of alleles ABO*O.01 and the unreported ABO*784C.
Conclusion: The patient delivered a healthy baby boy at 35 weeks of gestation. The baby cord was sent to the laboratory. The baby serological type showed an A3B phenotype and it was referred for genetic testing. The baby RBCs showed the same ABO*784C found in the mother. The previously reported ABO*784A allele encoded an Aspartic Acid to Asparagine change at position p.256 consistent with an Aweak phenotype. Also, at least five other alleles encoding an A3 phenoytpe consisted of polymorphisms at positions c.745 through c.871, giving special characteristics to this new and unreported ABO allele. From the data collected, it can be concluded that this A3/Aweak phenotype is encoded by the variant allele ABO*784C. This highlights the clinical relevance of confirming the serology of ABO subgroups by molecular methods.
CP228
Nucleic Acid Extraction from Buccal Tissue for Prediction of Red Blood Cell Phenotype
Philip Berardi*, Jacqueline Cote, Gwen Clarke, Vito Scalia, Robert Liwski and Mindy Goldman
Canadian Blood Services
Background/Case Studies: Elucidation of the molecular basis of blood group expression has led to the development of high throughput molecular methods for predicting blood group antigens. The commonly used single nucleotide polymorphism (SNP) arrays require nucleic acid isolation which is typically achieved by extracting genomic DNA from whole blood. This method requires venipuncture and may not be an ideal approach for severely anemic patients or potential donors that are unable to provide a sample of whole blood due to their remote location. DNA extracted from buccal swab samples offers a noninvasive alternative to venipuncture and may provide a safe and efficient means of transporting samples from remote locations to reference laboratories for extended blood type prediction. Canadian Blood Services (CBS) has performed large scale DNA extraction and HLA genotyping for the OneMatch Stem Cell and Marrow Registry using buccal swabs since 2007; buccal swabs are also used by other unrelated donor stem cell registries, such as the US NMPD. We sought to assess the accuracy and reliability of using DNA extracted from buccal swabs in predicting blood group antigen expression.
Study Design/Method: We performed parallel red cell genotyping on an automated typing platform, the Progenika/Grifols IDCoreXT assay (Progenika Biopharma‐Grifols, Bizkaia, Spain) using DNA extracted from blood and buccal tissue from volunteers. For antigen systems with available serologic reagents, we also compared results with serologic typing. We evaluated three different methods of DNA extraction and performed testing regardless of DNA yield or purity. Two buccal swabs (Puritan Medical Products, Guilford, Maine) were used for each test. Swabs were stored at room temperature, and DNA extraction was performed within six days of collection. In the initial phase of the study, buccal swab samples (n = 15) were processed with the automated Biorobot M48 Robot using the MagAttract DNA Mini M48 extraction method (Qiagen, Venlo, the Netherlands). Extracted DNA had a mean concentration and purity of 38.1ng/µl and 1.83 respectively. In the second phase of the study (n = 39), DNA extractions from buccal swabs were performed using methods available in our national red cell immunohematology reference laboratory: the QIAamp DNA mini kit, using either manual or an automated QiaCube robotic workstation (Qiagen, Venlo, the Netherlands).
Results/Finding: The manufacturer's recommended analytical range for DNA concentration was 20‐80ng/μl and the recommended purity was an absorbance ratio of 1.63‐2.1 (A260/280) for use of the ID CoreXT platform. DNA extraction from buccal swab samples did not meet these specifications in several cases. However, in most cases, a lower concentration of DNA was adequate for prediction of phenotype. The Dombrock system was the most susceptible to failure of interpretation in the samples with a low DNA concentration, with “no call” results reported. There was 100% concordance in genotyping results when source DNA was extracted from whole blood or buccal tissue; there was also 100% concordance between predicted phenotype and serologic testing results.
Conclusion: This study supports the use of genomic DNA extracted from buccal tissue on the ID CoreXT for predicting RBC phenotype with high accuracy. Extraction methods may require optimization to achieve DNA yields within the recommended analytical range of the assay.
CP229
Performance Evaluation of ID RHD XT, a Genotyping Assay for the Detection of High‐Prevalence RHD Negative and Weak D Types
Araitz Molano1, Izaskun Apraiz1, María Azcarate2, Miguel Ángel Vesga2, Montserrat Rubia2, Mercedes Piedrabuena2, Fernando Puente3, Barbera Veldhuisen4, Ellen Van Der Schoot4 and Mónica López*1
1Progenika Biopharma, a Grifols Company, 2Centro Vasco de Transfusión y Tejidos Humanos, 3Banco de Sangre y Tejidos de Aragón, 4Sanquin Blood Supply Research
Background/Case Studies: It is well established that weak D 1, 2 and 3 phenotypes are not at risk for forming allo‐anti‐D, whereas a few weak D and all partial D and negative phenotypes are. Routine serologic D typing does not distinguish among them, consequently RHD genotyping is recommended, especially in patients. ID RHD XT (Progenika, Grifols) is a qualitative, PCR/Luminex® xMAP hybridization‐based genotyping test for the identification of the following RHD gene allelic variants: RHD*weak D type 1, RHD*weak D type 2, RHD*weak D type 3, RHD deletion, RHD*Pseudogene and RHD*DIIIa‐CE(3‐7)‐D and ITGB3 gene: HPA1a and HPA1b, in genomic DNA extracted from whole blood specimens. In this study the performance of ID RHD XT genotyping assay was evaluated in terms of whole system failure rate, call rate and accuracy for Rh and HPA‐1 blood group typing.
Study Design/Method: A cohort of 1000 previously serotyped samples for D antigen obtained from three European blood centers were analyzed with ID RHD XT at Progenika. Samples were distributed as recommended by the Annex of the Common Technical Specifications 2009/108/CE for a IVD product of list A (≥10% Clinical samples, >2% Neonatal Specimens and ≥2% Weak D donors). For the intended use of the product, Weak D serotyped donors were enriched (n=160, 16%). Commercial serology tests for D antigen predicted phenotype and Bi‐Directional‐Sequencing (BDS) for weak D type confirmation and HPA‐1 predicted phenotype were used for comparison.
Results/Finding: No system failure, 100% call rate and no inconclusive results were obtained. Discrepancies were found for D antigen between serology and ID RHD XT predicted phenotype results, although a 100% concordance was obtained when analyzed by BDS, considering ID RHD XT result correct. Concordance between ID RHD XT and BDS results for the Weak D type was 100%. The following ID RHD XT predicted phenotype results were obtained: D negative (n=361), No amplification variant (n=15), Weak D Type 1 (n=22), Weak D Type 1 heterozygous (n=1), Weak D Type 2 (n=32), Weak D Type 2 heterozygous (n=1), Weak D Type 3 (n=34), Weak D Type 3 heterozygous (n=1), Weak D Types 1, 2 or 3 not detected (n=533). Regarding HPA‐1 blood group, the predicted phenotype results obtained by ID RHD XT were 100% concordant with BDS results: HPA‐1a positive (n=157) and HPA‐1a negative (n=6), HPA‐1b positive (n=46) and HPA‐1b negative (n=117).
Conclusion: ID RHD XT genotyping assay performed as a reliable and accurate method for predicting the genotype and phenotype of high prevalence RHD negative and Weak D types (100% specificity and 100% sensitivity for D antigen, HPA‐1a and HPA‐1b antigens). That makes it a useful tool for the implementation of the RHDgenotyping recommendation on patient blood transfusion and anti‐D prophylaxis.
CP230
Predictors of Red Blood Cell Alloimmunization in a Brazilian Sickle Cell Disease (SCD) Cohort
Shannon Kelly*1,2, Liliana Preiss3, Carla Dinardo4, Shirley Lopes de Castilho5, Maria do Carmo Valgueiro6, Luciana Cayres7, Yuelong Guo3, Ester Sabino8, Grier Page3, Brian Custer2 and REDS‐III International‐Brazil9
1UCSF Benioff Children's Hospital Oakland, 2Blood Systems Research Institute, 3RTI International, 4Fundação Pró‐Sangue, 5Hemorio, 6Fundação Hemope, 7Fundação Hemominas, 8University of Sao Paulo, 9NHLBI
Background/Case Studies: SCD patients form red blood cell (RBC) antibodies at higher rates than other transfused populations. Multiple predictors of alloimmunization have been reported but not well replicated in large SCD cohorts. We investigated the clinical, laboratory and genetic predictors of alloimmunization.
Study Design/Method: A large SCD cohort was established in Brazil to investigate disease outcomes. At participating sites, patients are currently transfused with ABO/D/Cc/Ee/Kell matched RBCs prophylactically and extended phenotypically matched RBC after first antibody forms. Policies for matching are center‐specific and evolved to increased levels of matching over the exposure period included in this study. Transfused subjects with 1+ RBC alloantibody of defined specificity within the cohort were compared to transfused antibody negative subjects using chi squared to compare categorical variables and T‐test or Wilcoxon rank‐sum tests as appropriate to compare continuous variables. Backward elimination multivariable logistic modeling was used to generate odds ratios (OR) and identify independent predictors of alloimmunization using results of univariate analyses. All subjects had peripheral blood whole genome SNP typing performed using an Affymetrix array, which included enhanced content for blood related SNPs. Genome wide association (GWA) analyses were conducted using a logistic model to identify additive genetic effects associated with alloimmunization. A p value <=0.05 (clinical analysis) or <5x10‐8(GWA) was considered statistically significant.
Results/Finding: Of the 2795 cohort patients, 2272 (81.3%) transfused subjects were included with 129 alloimmunized children <18 years (11.0% of 1172) and 224 alloimmunized adults (20.4% of 1100). In multivariable logistic regression models, age (OR 4.2, p=0.009, for age 50+ compared to 0‐4), gender (OR 1.3, p=0.04, for female compared to male), transfusion history (OR 3.5, p<0.0001, for 81+ transfusions compared to 1‐5), site, hemolysis (OR 1.3, p=0.05, for log transformed lactate dehydrogenase) and presence of autoimmune disorders (OR 4.5, p<0.0001) were independent predictors of alloimmunization. GWA identified a single SNP of unclear biologic significance associated with alloimmunization (EEFSEC gene responsible for incorporation of selenocysteine into proteins).
Conclusion: RBC alloimmunization is primarily driven by transfusion burden in this SCD cohort. Hemolysis remained significantly associated with alloimmunization after controlling for transfusions. Presence of an autoimmune disease was also associated with RBC alloimmunization, indicating more systemic immune dysregulation may be present in SCD patients who develop RBC alloantibodies. However, the GWA did not identify SNPs in immunoregulatory genes significantly associated with RBC antibody formation in the study population.
CP231
Pre‐Transfusion Test Result Comparison of Heel Stick Sample with Placental Blood Sample.
Miriam Andrea Duque*, Patty Williams, Tiffany Lee, Rana Alissa and Agnes Aysola
University of Florida, College of Medicine
Background/Case Studies: Physiologic anemia is more severe in preterm infants and worsened by the blood loss required for laboratory tests. To reduce iatrogenic anemia, placental blood, which otherwise would be discarded, can be used for laboratory testing. Mother and infant blood are mixed in the placenta during delivery and pre‐transfusion test results potentially can be altered due to fetal‐maternal hemorrhage. There has been no published study to show if pre‐transfusion test results of placental blood give the same result as the heel stick samples, which is the standard of practice.
Study Design/Methods: Transfusion Service tested sample pairs from 32 newborns less than 2,000 gr birth weight. One of the samples was collected from the newborn as a heel stick sample, the other from the placenta. The following tests were performed on the sample pairs: ABO, Rh, antibody screen and Direct Antiglobulin Test with IgG (DAT).
Results/Findings: ABO, Rh and DAT tests were performed on 32 sample pairs. DAT test was negative on 30 sample pairs and two were positive. There was 100% concordance with the ABO, Rh and DAT tests performed on these sample pairs. Antibody screen was performed on 32 placental blood samples and 29 heel stick samples. Twenty eight sample pairs were negative with the antibody screening test. There was one positive heel stick sample, which was also positive using the placental sample. One heel stick sample was negative for the presence of an antibody but found to be positive with the placental blood sample. This antibody which was detected only in the placental sample was a passive anti‐D mother received during pregnancy. This discrepant result indicates that the placental blood sample was more sensitive to detect a weak antibody.
Conclusion: This study shows that placental blood sample is not inferior to heel stick sample regarding ABO, Rh and DAT testing. Based on this comparison study placental blood can be used for pre‐transfusion testing for < 2,000g birth weight newborns.
| Placenta blood samples | Heel Stick Samples | Study Frequency | Frequency in General Population | |
|---|---|---|---|---|
| O positive | 14 | 14 | 43.8% | 39.0% |
| O negative | 2 | 2 | 6.3% | 6.6% |
| A positive | 9 | 9 | 28.1% | 34.0% |
| B positive | 6 | 6 | 18.8% | 8.5% |
| AB positive | 1 | 1 | 3.1% | 3.5% |
| Antibody negative | 30 | 28 | ||
| Antibody positive | 2 | 1 | ||
| Not tested | 0 | 3 | ||
| DAT IgG negative | 30 | 30 | ||
| DAT IgG positive | 2 | 2 |
CP232
Prevalence of Red Blood Cell Antigen Phenotypes Among Omani Blood Donors; A Study at a University Hospital Blood Bank
Arwa Z. Al‐Riyami*, Ali Al‐Marhoobi, Saif Al‐Hosni, Sabah Al‐Mahrooqi and Murtadha Al‐Khabori
Department of Hematology, Sultan Qaboos University Hospital
Background/Case Studies: It is well known that the frequencies of red blood cell (RBC) phenotypes vary between populations of different ethnic backgrounds. Most existing data describes frequencies in the western and black populations. The prevalence in Omanis is unknown. This research aims at studying the prevalence of different RBC phenotypes among the Omani blood donors.
Study Design/Method: The study was approved by the local reserach ethics board. Blood group and RBC phenotype of enrolled Omani blood donors were serologically tested. The following blood group systems were assessed; the Rh (C,c,E,e), Kell (K, k, Kpa, Kpb), Kidd (Jka, Jkb), Duffy (Fya,Fyb), Lewis (Lea,Leb), Lutheran (Lua,Lub), MNS (M,N,S,s) and P1 antigen. The frequencies of different phenotypes were analyzed using the R software, version 3.1.2.
Results/Finding: Total of 337 Omani blood donors were tested. The most common blood group was O+(44.9%) followed by B+(20.2%), A+(17.4%), O‐(7.4%), AB+(6.8%), B‐(2.7%), and A‐(0.6%). Among the tested donors, 89.2% were D positive with R1r being the most common Rh phenotype. In the Kell blood group system, 4.5% of the donors were K positive, while the k antigen was found to be 99.4%. The most common phenotype in the Duffy blood group system was Fy(a‐b‐), while the Fy(a+b+) was found at a higher frequency compared to what has been reported in the black population. (Table)
The commonest phenotypes for the Kidd and MNS blood group systems were Jk(a+b+) and M+N‐S+s+ at 47% and 22.6% respectively. The Lea+ and Leb+ alleles were seen in 21.7% and 67.3% of donors respectively, while Lub‐ phenotype was found in 3.3% of the donors. The frequencies of the rare phenotypes Jk(a‐b‐), Le(a+b+) and Lu(a‐b‐) were 0.3% , 0.3% and 2.7% respectively, while the M+N‐S‐s‐ and M‐N+S‐s‐ phenotypes were not found. The frequency of the P1 antigen was found to be at 78.9% similar to what has been reported in Caucasians.
Conclusion: This is the first study to examine the frequencies of RBC blood group phenotypes among the Omani blood donors. The results show higher frequencies of the rare null phenotypes Fy(a‐b‐), Jk(a‐b‐) and Lu(a‐b‐) compared to what has been reported in Caucasians. The frequencies of the Duffy blood group system resemble what has been reported in the black population. This data is helpful in understanding the influence of the Arab ethnic background on the RBC blood group systems and warrants large genotype‐phenotype studies in the region.
| System | Phenotype |
Omanis (Frequencies %) |
Whites (Frequencies %) |
Blacks (Frequencies %) |
|---|---|---|---|---|
| Kell | K+k‐ | 0 | 0.2 | Rare |
| K+k+ | 4.5 | 8.8 | 2 | |
| K‐k+ | 94.9 | 91 | 98 | |
| Duffy | Fy(a+b‐) | 9.2 | 17 | 9 |
| Fy(a+b+) | 7.4 | 49 | 1 | |
| Fy(a‐b+) | 14.9 | 34 | 22 | |
| Fy(a‐b‐) | 68.5 | rare | 68 | |
| Kidd | Jk(a+b‐) | 35.4 | 28 | 57 |
| Jk(a+b+) | 47 | 49 | 34 | |
| Jk(a‐b+) | 17.3 | 23 | 9 | |
| Jk(a‐b‐) | 0.3 | rare | rare | |
| P | P1 | 78.9 | 79 | 94 |
CP233
Quantitation of Anti‐D in Serum Using Flow Cytometry
Amanda Whitelonis*, Izekial Butler, Karen Leighton, Scott Jones and Anand Srinivasan
QualTex Laboratories
Background/Case Studies: Rh(D) antibodies (anti‐D) are developed in Rh‐negative individuals when exposed to D antigens. This scenario is commonly observed in alloimmunized antenatal and volunteer immunized patients. Quantitation of anti‐D in serum is important in the clinical setting to predict the risk of hemolytic disease of the newborn. Quantitation of anti‐D is also performed in quality control operations of organ procurement organizations and plasma fractionators. It is a common practice to report the strength of anti‐D in serum as antibody titer values but quality control operations require a quantitative value. We have developed a screening assay using flow cytometry to quantitate anti‐D in serum.
Study Design/Method: We have developed a method to quantitate anti‐D in serum using flow cytometry, by modifying the protocols of Christensson etal., and Hilden etal.. Red blood cells from Rh‐positive blood samples were washed three times in phosphate‐buffered saline (PBS) at pH 7.2 and the supernatant was discharged. A dilution buffer containing 2% human serum albumin (v/v) in phosphate buffered saline was prepared. Serum samples or WHO anti‐D standards, suspended in dilution buffer were mixed with 10μl of washed red cells. The cell suspensions were incubated for 30 min at 37°C. Following incubation, FITC‐labeled anti‐IgG diluted in buffer was added and the mixture was incubated for an additional 15 min at 22°C. The samples were then analyzed by flow cytometry using gates for a typical red cell based on the forward and side‐scatter signals. Green fluorescence was collected using a band‐pass filter set for 515‐ 548nm. Events were recorded at a frequency of 1000 cells.
Results/Finding: Multiple dilutions of WHO anti‐D reference standard were tested against Rh‐positive red blood cells from five different donors. The reproducibility of the assay was determined by measuring the change in coefficient of variance due to dilution procedure, machine variation and sample storage condition. After optimizing these factors, a linear regression was calculated to establish the standard curve. The fluorescent intensity emitted by probes demonstrated a linear correlation with the concentration of Rh(D) antigens in reference standard. Serum from thirty Rh(D)‐immunized volunteers were analyzed for concentration of anti‐D and the results were benchmarked with antibody titer values.
Conclusion: Based on our study, we conclude that the quantitation of Rh antigens by flow cytometry can be used as a reliable assay to measure the concentration of anti‐D antibodies in serum. The method is reproducible and advantageous over reporting antibody titer values. The operations of this platform can be translated to a well‐plate based high‐throughput flow cytometry.
CP234
Rate of High Titer Plasma‐Containing Emergency Issue Blood Products
Sarah K Harm*1, Mark Yazer2, Nancy M. Dunbar3 and Biomedical Excellence for Safer Transfusion (BEST) Collaborative1
1University of Vermont Medical Center, 2University of Pittsburgh, 3Dartmouth‐Hitchcock Medical Center
Background/Case Studies: The use of emergency issued group A plasma and uncrossmatched group O whole blood (WB) in patients without a valid ABO group is becoming increasingly common in the USA. It is unclear if low titer products should be provided in this situation and indeed a universally agreed upon threshold that would qualify as “low titer” has not been established. This study was designed to determine the rate of high titer donors using a titer threshold of 50.
Study Design/Methods: Three academic hospitals that routinely issue group A plasma units for emergency issue participated in this study. Before issuing this plasma to patients, a 1:50 dilution of the donor's plasma in saline was produced and added to group B reagent red blood cells (RBC). If any degree of macroscopic agglutination after immediate spin was observed, the unit was considered high titer and it would only have been issued to group A or O recipients. At these three centers no temperature, plasma volume or time enhancements were performed in the titer procedure, and anti‐human globulin was not added. At one center samples were taken from the plasma of group O WB units and the same procedure was followed using A1 and B reagent RBCs; if at least one antibody demonstrated macroscopic agglutination after immediate spin, the WB unit was considered high titer and it was then centrifuged into an RBC unit for transfusion while the plasma and platelet components were discarded. Two centers provided plasma testing data for a 4‐year and 5‐year period, respectively. One center provided plasma and WB testing data for a 1‐year period.
Results/Findings: In total there were 7106 group A plasma units tested and 654 (9.2%) had a high titer anti‐B. The range of high titer group A plasma units between these three centers was 7.4%‐12.5%. Of the 1778 WB units tested, 388 (21.8%) units had a high titer; 221/1778 (12.4%) of the units had a high titer anti‐A, 61/1778 (3.4%) had a high titer anti‐B, and 106/1778 (6%) had high titers of both anti‐A and anti‐B.
Conclusion: Even at this relatively low titer threshold, a significant proportion of donors had a high titer antibody. In addition, the immediate spin titer method is likely sensitive only to the IgM component of the anti‐A and anti‐B; whether the IgG component should also be considered in determining the suitability of these units for potentially minor incompatible transfusions (especially for group O WB) requires further study.
CP235
Reagent pH Can Have an Effect on 0.2M DTT Treatment Time
Thandar Aye*1, Jennifer Prigg1, Lay See Er1 and Meghan Delaney1,2
1Immunohematology & RBC Genomics Reference Laboratory, BloodworksNW, 2Dept of Laboratory Medicine, University of Washington
Background/Case Studies: Dithiothreiol (DTT) is a sulfhydryl reagent that denatures selective blood group antigens. Reagent red blood cells (RBCs) treated with 0.2M DTT is used as a tool in identifying antibodies to high frequency antigens. Recently, DTT has become widely used in destroying CD38 on reagent RBCs and render them free from plasma anti‐CD38 drug interference. Procedures for the preparation of 0.2M DTT has been published advocating the use of buffered saline at different pH levels. In this study, an effect of pH on 0.2M DTT treatment time is investigated.
Study Design/Methods: Non‐buffered saline (NBS, Thermo Fischer Scientific Inc, Middletown, VA), used in the preparation of 0.2M DTT, was adjusted to pH7.16, pH 7.56, pH 7.96 using sodium phosphate dibasis (Sigma Aldrich, Saint Louis, MO). Reagent RBCs (Immucor, Norcross, GA)(n=3) were treated with the 0.2M DTT solutions in parallel by mixing 1:4 ratio of packed RBCs to 0.2M DTT solution followed by incubation at 37°C. For up to 45 minutes during treatment, the expression of k antigens was measured every 5 minutes by tube method using 2 different sources of anti‐k. To assure uniformity, all reactions were graded by the same investigator. Each reaction grade (in each RBC and each antiserum) is converted into a semiquantitive score and an average score was calculated every 5 minutes for each pH level. The reduction in average scores between different pHs were also calculated at every 5 minutes to measure the impact of 0.2M DTT reagent pH on the rate of k antigen destruction.
Results/Findings: The expression of k antigen, measured by agglutination grades with two different k antisera, is significantly weakened (by ≥1+) after 15 minutes of DTT treatment at pH 7.96; 15 minutes at pH7.56 and 20 minutes at pH7.16. Complete loss of k expression was seen after 25 minutes of DTT treatment at pH7.96; 35 minutes at pH7.56 and 35 minutes at pH 7.16. The reactivity patterns of k antigen tested with 2 sources of anti‐k correlate with each other. The reductions in average scores were seen between 15 to 30 minutes range of DTT treatment time when pH 7.16 was raised to pH7.56; 15 to 30minutes range when pH7.56 was raised to pH7.96; and 15 to 30 minutes range when pH7.16 was raised to pH7.96.
Conclusion: The use of higher pH buffered saline may shorten the treatment time it takes to weaken or destroy k antigen. Based on the comparison of reaction scores between different pH levels, the pH levels did not have an impact on DTT treatment up to 15 minutes and/or beyond 35 minutes of incubation. The pH of the 0.2M DTT reagent relative to the treatment time is a factor to consider during the validation of DTT‐treatment process and qualification of 0.2M DTT reagent in a laboratory.
TABLE 1. Average Scores and Reductions in Average Scores every 5 minutes
| DTT‐Treatment Time (minutes) | Average Scores | Average Reductions in Score | ||||
|---|---|---|---|---|---|---|
| pH7.16 | pH7.56 | pH7.96 | after raising pH7.16 to pH7.56 | after raising pH7.56 to pH7.96 | after raising pH7.16 to pH7.96 | |
| 5 | 8 | 8 | 8 | 0 | 0 | 0 |
| 10 | 6 | 6 | 6.33 | 0 | ‐0.33 | ‐0.33 |
| 15 | 6 | 4.84 | 4 | 1.16 | 0.84 | 2 |
| 20 | 5 | 3.34 | 0.17 | 1.67 | 3.17 | 4.83 |
| 25 | 2.84 | 1.5 | 0 | 1.34 | 1.5 | 2.84 |
| 30 | 1 | 0.34 | 0 | 0.66 | 0.34 | 1 |
| 35 | 0 | 0 | 0 | 0 | 0 | 0 |
| 40 | 0 | 0 | 0 | 0 | 0 | 0 |
| 45 | 0 | 0 | 0 | 0 | 0 | 0 |
CP236
Red Cell Antibody Frequencies and Distribution Among Prenatal Woman from a Large Reference Laboratory
Jason W Hunn*1, Mark E Brecher2 and Laura S McClannan2
1The George Washington University, 2Laboratory Corporation of America
Background/Case Studies: Data on the characteristics and frequencies of clinically significant red cell antibodies within the prenatal population have not been well established in the United States. The aim of this study was to determine if frequencies of red cell antibodies differed between geographically distinct regions within the continental United States. Study Design/Method: The aim of this retrospective study was to evaluate a cohort of prenatal patients (n = 756,221) drawn between July 1, 2013 and June 30, 2014. These patients were divided into United States Census Bureau regional and divisional categories according to their place of residence. Prenatal blood work was collected which included an ABO, Rh(D) and a screen for unexpected alloantibodies. Samples found to be positive for red cell antibodies were sent to one of nine regional laboratories for identification. Results/Finding: In total, 11,647 patients were found to possess clinically significant red cell antibodies for an overall incidence of 1.5 percent. The three most commonly encountered antibodies were anti‐D (n = 7639) 63.1%, anti‐M (n = 1288) 0.6%, and anti‐E (n = 1227) with a frequency of 10.1%. A total of 455 (3.9%) prenatal women were found to possess two or more antibodies. In general, the combination of anti‐D and anti‐C proved to be the most common, with 182 instances (40.0%) followed by anti‐E and anti‐c with 79 (17.4%), and anti‐C, anti‐e with 26 (5.7%). Of the multiple antibodies identified, 435 (95.6%) included at least one antibody from the Rh blood group. The South region had the largest number of antibodies identified with 7474 or 61.8% of the total. The West had 2111 (17.4%), the Midwest 1538 (12.7%) and the Northeast with 979 (8.1%). A contingency table, using the two‐sided Fisher's exact test, was performed comparing the Northeast, South, Midwest and West regions. The p value of anti‐D was calculated to determine nonrandom associations and values of 0.05 and below was deemed significant from a region‐to‐region perspective. With regard to anti‐D, the Pacific division comprised of California, Oregon, Washington, and Alaska, had p values below the 0.05 thresholds when compared against seven of the eight other divisions. The West South Central division (Texas, Oklahoma, Arkansas, and Louisiana) did not show statistically significant results when compared against the Pacific division (p = 0.17). Conclusion: Depending upon the antibody, statistically significant variations between geographical regions and divisions within the United States were observed. This relationship between antibody and locality requires further investigation but may be attributed to the presence or absence of red cell antigens among different racial and ethical populations.
CP237
Reduction in Repeat Testing Using Gel Technology
Amy Mata*1, Lindsy Rich1, Sherry Stern1, Sharon Wangen1 and Camille van Buskirk2
1Mayo Clinic, 2Mayo Clinic Rochester
Background/Case Studies: Our institution currently uses the IMMUCOR NEO (Immucor, Inc., Norcross, Georgia) to perform ABO/Rh and antibody screen (ABSC) testing utilizing solid phase technology. When results are unable to be obtained from the IMMUCOR NEO, testing is repeated on the manual testing bench using tube agglutination. This repeat testing can lead to significant expenses including reagents, supplies, and technologist time. It was decided by leadership in our laboratory that it would be beneficial to observe how other methodologies perform in this regard. A side‐by‐side evaluation was performed between the IMMUCOR NEO and the ORTHO VISION (Ortho Clinical Diagnostics, Rochester NY) to determine if there was a significant difference in the amount of repeat manual tube testing that needed to be performed. The evaluation looked at ABO/Rh and ABSC testing as those are the only tests that are currently automated in our laboratory.
Study Design/Method: Thirty specimens that were processed on the IMMUCOR NEO and resulted in No Type Determined (NTD) for ABO/Rh testing were selected to be tested on the ORTHO VISION. Twenty‐three specimens that were processed on the IMMUCOR NEO and produced positive results for ABSC testing were selected to be tested on the ORTHO VISION. All specimens were EDTA tubes and were collected within the previous 4 days. The timeframe between when the specimen was tested on the IMMUCOR NEO and the ORTHO VISION was 1 to 2 days.
Results/Finding: Of the 30 NTD specimens from the IMMUCOR NEO, 8 resulted in valid ABO/Rh typings on the ORTHO VISION. Three results were flagged indicating possible extra reactivity. Upon performing a visual review of all 3 results, it was determined that there was no reactivity and a valid result was present. The other 19 samples required manual tube testing to interpret the ABO/Rh and were due to mixed field, weak isoagglutinins, unexplained extra reactivity, and hemolysis. Of the 23 ABSC specimens that were resulted out as positive on the IMMUCOR NEO, 11 specimens produced a negative result on the ORTHO VISION and were confirmed to be negative with manual tube testing using PEG as the enhancement media. One specimen was flagged for fibrin, but upon performing a visual review, was determined to be negative. Nine specimens that were positive on the IMMUCOR NEO were also positive on the ORTHO VISION. One specimen proved to be an anti‐M that was seen in gel but not in tube and one specimen displayed unexplained reactivity in gel as it was negative in tube and all clinically significant antibodies were ruled out.
Conclusion: The evaluation demonstrated that using the ORTHO VISION for ABO/Rh and ABSC testing would result in an estimated 36% reduction in repeat ABO/Rh testing and a 52% reduction in No Antibody Detected workups. Additionally, this reduction in testing would result in an annual cost savings of approximately $74,000 in reagents, supplies, and technologist time.
CP238
Research for the Molecular Basis of Missense Mutation on the B Glycosyltransferase Responsible for the Abw Variant
Yan‐Ling Ying*, Xiao‐Zhen Hong, Xian‐Guo Xu, Ji He and Fa‐Ming Zhu
Blood Center of Zhejiang Province, Key Laboratory of Blood Safety Research, Ministry of Health
Background/Case Studies: ABO genotyping of donors and patients is not routine practice. However, it is helpful for resolving the cases of ABO discrepancies. The characteristic of the ABO blood subgroup is crucial for elucidating the mechanisms of the variant phenotype. Here, the molecular basis of one individual with ABw variant was studied.
Study Design/Method: The ABO antigen and serum antibody of proband were detected by the serology method. The whole coding regions and flanking introns of ABO gene were amplified by polymerase chain reaction (PCR) and the PCR products were sequenced bidirectionally. The haplotypes of the proband were analyzed by cloning and sequencing. The three dimensional model of mutant protein was built and analysis.
Results/Finding: The proband expressed weak B antigen on red blood cells by monoclonal antibodies and the ABO antibody in serum was detected by standard A, B, O cell, which was identified as ABw variant phenotype. The heterozygous sites in exon 7 (297 A/G, 467C/T, 518T/C, 526C/G, 657C/T, 703G/A, 796C/A, 803G/C, 930G/A) of the coding region of the ABO gene were identified by directly sequencing analysis. Further haplotype analysis showed that the proband was carried with A102 allele and a novel B allele. The sequence of the novel B allele was identical to B101 except for T>C at nucleotide position 518 and was nominated as Bw38 by dbRBC of NCBI. 518T>C of B allele resulted in an amino acid change of Leu to Pro at 173 position. 3D structure was showed the GT enzyme structure was changed.
Conclusion: A novel B allele was identified. The 518T>C of the glycosyltransferase B gene may decrease the enzymatic activity and result in the ABw variant, with the presence of anti‐B antibody in serum.
This work was supported by the Science Research Foundation of Zhejiang Province (LY12H08001, LY17H080003) and the Medical Science Research Foundation of Zhejiang Province (2016RCB006, 2017KY315).
CP239
RHCE*Ce286A Is a Novel RHCE Allele That Causes a Weak C Expresion and Codes for the Low‐Prevalence LOCR (RH55) Antigen
Cédric Vrignaud1,2,3, Stéphanie Ramelet1, Christelle Joffrin1, Sylvie Poupel1, Céline Narboux4, Michel Hennion4, Sandra Nance5, Gail Coghlan6 and Thierry Peyrard*1,2,3
1Institut National de la Transfusion Sanguine, 2INSERM UMR_S1134, 3Laboratoire d'Excellence GR‐Ex, 4Etablissement Français du Sang Nord de France, 5American Red Cross, Immunohematology Reference Laboratory, Biomedical Services, 6University of Manitoba, Faculty of Medicine, Rh Laboratory
Background/Case Studies: The low‐prevalence LOCR antigen (RH55) was characterized by Coghlan & al. (Transfusion 1994). The RHCE*ce286A allele (RHCE*01.15 or RHCE*ceLOCR) was later described to encode LOCR (c.286G>A, p.Gly96Ser) (Coghlan & al. Transfusion 2006). The p.Gly96Ser substitution was also reported to cause the loss of the Rh26 antigen (Faas & al. Transfusion 1997); LOCR and Rh26 are consequently considered antithetical antigens. The Rh:‐26 phenotype (partial c) was initially described in a D+C+E‐c+e+ donor who was non‐reactive with an anti‐c made by a D+C+E‐c‐e+ patient (Huestis & al. Transfusion 1964).
We describe a novel RHCE allele, RHCE*Ce286A, in several people of Western European ancestry referred for a weak C expression. As this allele shows a close molecular background to RHCE*ce286A, this prompted us to study LOCR expression.
Study Design/Method: 15 unrelated blood donor samples were referred for a weak C reactivity: 8 males, 7 females (2 with an obstetric history, 2 without and 3 unknown). The C/e expression was studied with polyclonal and monoclonal reagents (gel‐test). RHCE was analyzed by genomic DNA (n=11) or cDNA (n=5) sequencing.
Results/Finding: 11 samples were D+C+E‐c+e+ and 4 D+C+E+c+e+. All showed discrepant results with monoclonal anti‐C reagents, with a similar pattern of reactivity: 3‐4+ with MS24 (n=15), 1‐3+S with MS23 (n=9), no reaction with MS273, DGC02, P3x255 (n=14). 14 samples tested with a polyclonal anti‐C showed a 1‐3+ reactivity. 3 D+C+E+c+e+ cases tested with a polyclonal and monoclonal anti‐e (MS16, MS21, MS62, MS63) showed no weakened reactivity. RHCE sequencing (genomic DNA or cDNA) showed a c.286G>A mutation in exon 2, predicted to encode the p.Gly96Ser substitution. For 2 apparent R1R2 donors, a f‐negative type allowed the prediction of a RHCE*Ce286A/RHCE*cE genotype. Altogether, our results are consistent with the presence of a very likely RHCE*Ce286A allele (C and e in cis) in all samples.
3 D+C+E+c+e+ individuals were reactive 1+S with the original source of anti‐Rh55, slightly weaker when compared to RHCE*ce286A/RHCE*Ce RBC samples available from our cryobank (2+).
Conclusion: Our results confirm that the c.286G>A mutation alters the conformational properties of the RHCE protein, either on a ce or Ce background, and encodes the low‐prevalence LOCR antigen (RH55). The LOCR reactivity appears to be rather similar when coded by RHCE*Ce286A or RHCE*ce286A alleles. This was quite an unexpected finding, since the p.Gly96Ser substitution is close to the critical amino‐acid for C/c expression (p.Pro103Ser). None of our 15 cases made anti‐C and/or anti‐e but few were subject to a potential alloimmunization background. However, as RHCE*ce286A was reported to code for a partial c (Rh:‐26), we consider that RHCE*Ce286A likely encodes partial C and e, this being also supported by the predicted localization of the p.Gly96Ser change on the second extra‐cellular loop of the RhCe protein.
CP240
RHD Genotype Analysis of Patients with Suspected Weak D Types 1, 2 or 3.
Samantha Harris*, Shelley Fletcher, Haley Huston, Gayle Teramura and Meghan Delaney
Bloodworks NW
S. Harris1, S. Fletcher1, H. Huston1, G. Teramura1, M. Delaney1,2
1. Bloodworks NW
2. University of Washington, Department of Laboratory Medicine
Background/Case Studies: Weak D genotyping is recommended for transfusion recipients, pregnant women, and newborns who had a RhD typing discrepancy, or a serological weak D phenotype, to determine if they carried the weak D genotypes 1, 2 or 3. The purpose of this study was to analyze the underlying RHD genotypes of the patient samples received for weak D genotyping since published recommendations, in particular those found to not carry the weak D 1, 2, or 3 genotypes.
Study Design/Methods: Between 9/2015 and 2/2017 50 samples were received for weak D genotyping. Testing was performed using PCR‐RFLP targeting the sequence variants in the RHD gene that have been previously defined. Samples that did not have weak D types 1, 2, or 3 genotypes, but had evidence of RHD genetic sequences in exon 7 and/or intron 4 in preliminary testing were evaluated by Sanger sequencing for RHD and RHCE exons 1‐10 to determine the underlying RH genotype. When provided, the patient's ethnicity and presence of anti‐D was recorded.
Results/Findings: The majority of the samples were from obstetrical patients (62%) followed by transfusion patients (28%); 10% had no clinical indication provided. 34 samples (68%) were found to be weak D type 1, 2, or 3 (24, 6, and 4 samples, respectively). 5 samples (10%) appear to be genetically RHD negative. Genetic sequencing was performed on 11 samples; 9 had RHD genetic variants that were not weak D types 1, 2, or 3 (Table). All of these variant RHD samples also showed some variation in the RHCE gene. Two samples (4%) had wild type RHD alleles; further evaluation is ongoing.
| RHD Variant | RHCE Variant | Patient ethnicity provided | Did patient have anti‐D reported? |
|---|---|---|---|
| RHD*01W.91 | RHCE*ce.01 | Caucasian | No |
| RHD*DAR3.01 | RHCE*ceVS.02/ceVS.03 | African American | Unknown |
| RHD*DAR3.01 | RHCE*ce.01 | None provided | No |
| RHD*DAU5 | RHCE*ce.01/ceAG | African American | No |
| RHD*DAU5 | RHCE*ce.01 | African American | Unknown |
| RHD*DAR1.02 | RHCE*ceAR | Other | No |
| RHD*DAR1.02 | RHCE*ceAR | Ethiopian | No |
| RHD*DAR1.02 | RHCE*ceAR | Caucasian | No |
| RHD*DAR1.02 | RHCE*ceAR | None provided | Unknown |
Conclusion: Most samples tested by weak D genotyping were found to be weak D types 1‐3. Of the 11 samples that had evidence of an RHD gene and did not carry the known weak D types 1‐3 polymorphisms, 9 (82%) of were found to have other RHD variants, and 2 (18%) did not have underlying genetic variation detected in the RHD gene. The majority of the non weak D types 1‐3 variants were DAR alleles, which are often associated with anti‐D production.
CP241
RHD Genotyping of Discrepant or Weak D Samples: Over a Year's Experience.
Sunitha Vege*, Christine Lomas‐Francis, Kim Hue‐Roye, Judith Aeschlimann, Randall Velliquette and Connie M. Westhoff
Immunohematology and Genomics Laboratory, New York Blood Center
Background/Case Studies: RHD genotyping has been recommended to guide transfusion of D‐negative RBCs and administration of Rh immunoglobulin to patients with discordant or weaker than expected D typing, particularly for females and OB patients (Sandler etal. Transfusion 55: 680‐9). The recommendation is based on observational evidence, primarily from Europe (Flegel 2006, Curr Opin Hematol13:476), that individuals with weak D types 1, 2, and 3 are not at risk for clinically significant anti‐D. The implications and utility of this approach for the diverse U.S. population are not yet clear. Here we report 15 months experience with RHD genotyping on 352 samples referred with discrepant or weak D typing investigated from January 2016 to April 2017.
Study Design/Method: Serologic testing was performed by standard tube agglutination with licensed reagents. DNA isolated from WBCs was used in manual RFLP and RHD BeadChip assays and RHD sequencing for some. Ethnicity was known for 153 samples (53.3% Caucasian, 32.2% African American/African, 6.6% multiracial, 4.6% Hispanic, 2% Asian, and 1.3% other).
Results/Finding: RHD genotyping identified weak D types 1, 2, and 3in 155/352 (44%) and alleles known to encode partial D phenotypes in 168/352 (47.7%) (Table). Uncommon or rare weak D alleles including types 6, 15, 40, 42, 45, 51, 57 (n=2), 59, 61, 78, 91, and 119 were found in 13 (3.7%). The partial D alleles found were diverse, but the largest number included partial RHD*D 4.0 (n=62) and *DAR (n=46) families. Others in order of prevalence included DAU5 (n=9), DAU4 (n=7), DOL (n=5), DVII (n=5), DFV (n=4), DFR (n=4), DFW (n=3), DVI (n=2), DAU2 (n=2), DAU3 (n=2), DAU6 (n=2), DCS1 (n=2), DLO (n=2), D*780A (n=2), and compound heterozygotes DAU3/DAU4 (n=1), DAU3/DAU5 (n=1), DAU6/D 4.0 (n=1), D 4.1 (n=1), DAU12 (n=1), DBT1 (n=1), DHMi (n=1), DMA (n=1), and DMB (n=1). Nine samples had no RHD gene and were negative for RHCE variants that express D‐like epitopes (2.6%). Seven new RHD alleles were found: 2 DAU with (c.787_788delinsTT, 761C>T), 1 RHD‐CE‐D, RHD (939G>C), RHD (773T>C), RHD (463A>G), and RHD (520G>A,919G>A).
| Weak D alleles | Partial D alleles |
No RHD |
New | ||||||
|---|---|---|---|---|---|---|---|---|---|
| 1 | 2 | 3 | Other | 4.0 | DAR | Other | |||
| # samples | 88 | 46 | 21 | 13 | 62 | 46 | 60 | 9 | 7 |
| Percent | 44 | 3.7 | 47.7 | 2.6 | 2 | ||||
Conclusion: In a multiracial cohort of 352 individuals with weaker than expected D typing 44% were due to weak D types 1, 2, or 3 and would not be considered at risk of clinical significant anti‐D, but for 56% there is potential or unknown risk. These studies are important to gain insight into the prevalence of specific alleles in the U.S. multiethnic population and to continue to evaluate and refine RHD genotyping for clinical practice.
CP242
RHD*07.02 Allele Causes Discrepant Genotyping Results for RHCE SMALL C
Sabine Scholz*1, Sandra Schneider1, Sabrina König1, Susanne Helmig1 and Vicky van Sandt2
1inno‐train Diagnostik GmbH, 2Rode Kruis Vlaanderen
Background/Case Studies: In the human Rh blood group system the c, C, E, e and D antigens are expressed by the two highly homologous genes RHCE and RHD. After D, c is the most immunogenic Rh antigen. The difference between c (307C) and C (307T) is caused by the SNP on position 307 on the RHCE gene. The RHD*07.02 allele (also known as RHD cat VII type 2) carries the SNP 307T>C on the RHD gene and additionally the SNP 329T>C. This RHD*07.02 allele has been described to partially express RHc on the D polypeptide (Faas, Transfusion, 2001).
Aims: Genotyping was performed to clarify the cause of the weak c expression. Serology of a patient sample (Male, °1938) indicated a partial c phenotype with a CDe.
Study Design/Method: RhD and RhCE phenotyping was done by accredited routine protocols (monoclonal AB ID card: Diaclon Rh subgroups, seraclone anti‐c). Genotyping was performed with a TaqMan Probe assay (RBC‐FluoGene vERYfy, inno‐train Diagnostik GmbH), SSO (RBC‐Lifecodes, Gen‐Probe Inc.), in‐house SSP‐PCR (HILA, Rode Kruis‐Vlaanderen) and commercial SSP‐PCR (RBC‐Ready Gene CDE, inno‐train Diagnostik GmbH). Sanger sequencing of the RHD gene was performed using an in‐house method (inno‐train Diagnostik GmbH).
Results/Finding: Discrepant genotyping results were generated by different test systems: the TaqMan Probe based assay showed in repetition a CCee genotype, while the SSO system RBC‐Lifecodes predicted in repetition a Ccee phenotype. In SSP‐PCR the sample showed a weak c band with the in‐house method, while there was no band visible with the commercial test kit. The parallel analysis of the RHD gene with RBC‐Ready Gene CDE test system revealed a variant D cat VII RHD allele. Sequencing of the DNA sample identified two SNPs on one of the RHD alleles (307T>C, 329T>C) confirming a RHD*07.02 and one RHD*01 allele.
Conclusion: Usually genotyping provides clear answers for conspicuous serology. However, in a few cases PCR does not offer conformable results e.g. where mutations on the primer binding sites prevent the amplification. As described here there must be differences in the primer and/or probe design (in this case for the RHCE*c detection) of different test systems causing either correct or erroneous genotyping results. In this example the high homology between the RHD and RHCE genes in combination with the presence of the D cat VII SNP 307T>C lead to false positive RHCE*c (SNP 307C) SSO and SSP genotyping result. We therefore suggest to genotype of both RHCE and RHD to resolve the true nature of weak RHCE serology.
CP243
Serologic and Molecular Classification of a Novel RHD Allele
Jay Parker Hudgins*1, Sunitha Vege2, Connie M. Westhoff2 and Ira Shulman3
1Keck School of Medicine at USC, 2Immunohematology and Genomics Laboratory, New York Blood Center, 3LAC/USC Medical Center
Background/Case Studies: Serologic testing of RBCs from a 63 year old Hispanic female in preparation for surgery resulted in variable reactivity and weakly positive D reactions when using microtiter‐well agglutination versus tube testing. Determination of whether the D antigen expression represented a weak D or a variant D could not be resolved by serologic testing alone. Here we report the characterization of a novel RHD gene mutation identified by RHD gene sequencing.
Study Design/Method: Serologic typing was initially performed by microtiter‐well agglutination by automated analyzer platforms Galileo NEO and Galileo Echo (Immucor, Norcross,GA) and by standard tube testing using the Immucor Series 4 and 5 anti‐D reagents. Further immunohematologic evaluation was performed by standard tube testing (immediate spin –IS, and indirect antiglobulin – IAT) using OrthoBioclone, Immucor Gammaclone, Immucor Series 4 and Series 5, and ALBAclone anti‐D reagents. DNA isolated from WBCs was used in manual RFLP and RHD BeadChip assay (Immucor, BioArray) and RHD sequencing.
Results/Finding: RBC reactivity is summarized in the Table.
| Manufacturer | Anti‐D Clones | Immunoglobulin Class | Method | Result |
|---|---|---|---|---|
| Immucor D4 | MS201 & MS26 | IgG+IgM | Echo | 1+ |
| Neo | 3+ | |||
| IS | 2+ | |||
| Immucor D5 | MS26 & TH28 | IgG+IgM | Echo | 1+ |
| Neo | ‘?’ | |||
| IS | 2+ | |||
| Ortho BioClone | IgM+IgG |
IS IAT |
2+ 3+ |
|
| Immucor Gamma | IgM+IgG |
IS IAT |
2+ 2+ |
|
| Immucor D4 | IgM+IgG |
IS IAT |
3+ 4+ |
|
| Immucor D5 | IgM+IgG |
IS IAT |
3+ 3+ |
|
| ALBAclone: Alpha | IgM |
IS IAT |
3+ 4+ |
|
| Delta | IgM+IgM |
IS IAT |
3+ 4+ |
|
| Blend | IgM+IgG |
IS IAT |
3+ 4+ |
IS & IAT–Performed in Tube
DNA testing detected a hybrid rhesus box associated with the RHD gene deletion, indicating the patient was hemizygous for RHD. RFLP assay and RHD BeadChip did not identify any changes. RHD gene sequencing identified a new c.463A>G change in exon 3 encoding an amino acid change p.Met155Val. The predicted location of this change is within the fourth transmembrane segment of the RhD protein.
Conclusion: We identified a novel RHD allele with c.463A>G (p.Met155Val) change in exon 3. Several SNPs, deletions, and insertions have been reported with changes in Exon 3. Phenotypes of these genetic variations result in Rh negative, weak D types, and variant D. Since this change has not been previously identified, we are unable to determine if this confers a risk of anti‐D alloimmunization, but the RHD c.463A>G SNP results in serologically weak phenotypic expression of D antigen when tested by microtiter‐well agglutination on the NEO/Echo platforms. In this case the combination of microtiter‐well agglutination and DNA sequencing helped identify a new allele which would be missed by standard tube serologic testing and the current commercially available array assays.
CP244
Serologic and Molecular Detection of an Antibody to a High Incidence Antigen in Patient with History of Chronic Transfusions
Georgia Spanos*1, Juan Merayo‐Rodriguez2, Christopher Lough1 and Nancy Eckert3
1LifeSouth Community Blood Centers, 2Life South Community Blood Centers, 3LifeSouth Community Blood Center‐Headquarters
Background/Case Studies: The Joa antigen is one of three high incidence antigens in the Dombrock system. The prevalence of this antigen is 100% in most populations and greater than 99% in the black population. The Joa antigen can be resistant or enhanced with enzyme treatment (ficin/papain) and typically variable with Dithiothreitol (DTT), W.A.R.M.™ (Immucor) and ZZAP treatment. Anti‐Joa is an IgG antibody that demonstrates at AHG phase. Hemolytic transfusion reactions to the Joa antigen vary from none to moderate/severe. Hemolytic Disease of the Fetus and Newborn (HDFN) has not been observed with any antibody associated in the Dombrock system. There are two common phenotypes present in the black population:Hy negative/Joa negative and Hy weakly expressed/Joanegative.
Study Design/Methods: An antibody identification and red blood cell (RBC) units were requested for an O positive, 57 year old, African‐American female with a history of sickle cell disease and no history of pregnancy. The patient was not recently transfused, however, had a history of chronic transfusions. Last reported transfusion was three years prior to the current specimen. There were no known RBC antibodies at the time of the request. Facility reports that the patient's hemoglobin(g/dL)/hematocrit(%) (Hgb/Hct) is 6.4/18.8 and does not appear to be in sickle cell crisis. A request for phenotypically matched units, as per hospital policy, for C, E, K and S was received by our Immunohematology Reference Laboratory (IRL).
Results/Findings: Anti‐Joa was detected in patient plasma reacting with LISS and PeG (tube method) and manual Gel‐IAT. The antibody was resistant when tested with DTT treated red cells. In‐house frozen reagent RBCs negative for the Joa antigen (positive for Hy) were used to serologically prove the presence of the antibody to this high incidence antigen. An allogenic PeG adsorption was performed to rule out other common clinically significant antibodies. Anti‐Kpa was identified using this adsorbed plasma. Further testing with molecular genotyping (Grifols IdCoreXT) confirmed the patient's genotyping as antigen negative for the Joa, Kpa and positive for Hy.
Conclusion: Molecular testing is frequently performed on patients and retained donor samples from our local community donor pool throughout Florida, Georgia and Alabama. Staff is able to search our database for any combination of antigen negative phenotypes using the internal 510(k) Blood Establishment Computer Software (BECS) Integrated Blood Bank Information System (IBBIS). This enabled us to locate one refrigerated and three cryogenically preserved Joa negative RBC units. We found 251 eligible blood donors that could be recruited via an automatically generated call list. The request for RBCs was cancelled. Patient's clinical symptoms improved without transfusion and repeat Hgb/Hct increased to 7.1/21. The patient's sibling is historically negative for the Joa antigen and should future transfusions be required, it was recommended that a directed donation be made on the patient's behalf. In order to continue having blood components available to meetall our patient's needs, IRL staff is consistently screening and searching our inventory for blood components that are negative for rare antigens to retain for patients needing antigen negative units in a timely fashion.
CP245
Serologic Characterization of D Antigen Expression Encoded By Two Reported RHD Alleles: Implications for Transfusion and Pregnancy
Sunitha Vege*1, Jay Parker Hudgins2, Christine Lomas‐Francis1, Angela Novotny3, Ira Shulman4 and Connie M. Westhoff1
1Immunohematology and Genomics Laboratory, New York Blood Center, 2Keck School of Medicine at USC, 3IBR ‐ Memorial Blood Center, 4LAC/USC Medical Center
Background/Case Studies: The availability of RHD genotyping has contributed to recognition of more than 490 alleles. However, an adequate blood sample is not always available for serologic characterization of D antigen expression encoded by a new allele. We report the interpretation of D on the RBCs of two females whose samples were referred for RHD genotyping with previously reported alleles for which serologic reactivity had never been investigated.
Study Design/Method: Serologic testing was performed by automated analyzer, Galileo Echo and NEO (Immucor, Norcross, GA), and by standard tube testing with licensed anti‐D reagents and the ALBAclone advanced partial RhD typing kit. Genomic DNA isolated from WBCs was used for Immucor RHD BeadChip assay, PCR‐RFLP, and RHD sequencing.
Results/Finding: Patient 1 was a 29 yo female, C−E−c+e+, whose RBCs reacted 1+ by ECHO and 3+ by NEO with anti‐D4, and ‘?’ with anti‐D5. Testing with D4 and D5 by tube gave 2+ and 1+w on initial spin (IS) respectively and 4+ by indirect antiglobulin test (IAT). RBCs were non‐reactive at IS with Ortho BioClone and BioRad Seraclone, and +w with Immucor Gammaclone anti‐D, and all were 2+ at IAT. RBCs did not react with two (LHM 174/102 & 57/17) of 12 anti‐D in the Alba partial D kit. This pattern did not match any partial D identified by these clones. RHD BeadChip detected an inactive RHD pseudogene in trans to RHD. Gene sequencing confirmed the presence of the pseudogene, but RHD had a c.780C>A change encoding p.His260Gln. Patient 2 was a 20 yo pregnant female, C−E−c+e+, whose RBC were +w at IS and 3+ at IAT with Immucor Series 4 and 5 and Gammaclone, and moderately reactive, 2+ IS and 4+ IAT, with ALBA alpha, ALBA blend and delta anti‐D. RBCs did not react with two (LHM 174/102 & 170/45) anti‐D in the partial D kit with no known partial D pattern. DNA testing predicted she was RHD hemizygous and RHD BeadChip detected markers for RHD*DAR but exon 2 gave low signal (LS). Sequencing found a hybrid DAR with CE‐specific nucleotides in exon 2 from c.150 to c.203 encoding amino acid changes p.Ile60Leu and Ser68Asn.
Conclusion: We found two previously reported rare alleles: RHD with a c.780C>A (p.His260Gln), previously found in France (LeFloch etal. GenBank KU363612), and RHD*DAR with part of exon 2 replaced by RHCE, reported in sub‐Sahara Africa (Granier etal. Transfusion 53:3009) designated RHD*DAR(CE2:V505V‐S68N) with an allele frequency of 0.002 to 0.016. Blood samples were not available to test for alterations in D expression for either allele. We provide serologic evidence that these alleles, found in two females evaluated by RHD genotyping, inform transfusion and Rh immune globulin prophylaxis, as they encode partial D phenotypes with novel epitope expression patterns, meaning these patients are at risk of forming allo anti‐D.
CP246
Serological Observations in Patients Receiving Hu5F9‐G4 Monoclonal Anti‐CD47 Therapy
Randall W. Velliquette*1, Diana Degtyaryova2, Hong Hong2, Christine Lomas‐Francis1, Gayane Shakarian1 and Connie M. Westhoff1
1Immunohematology and Genomics Laboratory, New York Blood Center, 2Department of Laboratory Medicine, Memorial Sloan Kettering Cancer Center
Background/Case Studies: Hu5F9‐G4 is a human monoclonal IgG4 antibody recognizing CD47 that is in clinical trials to treat hematologic or solid malignancies. CD47 is a transmembrane glycoprotein that binds to signal‐regulatory protein α (SIRPα) on macrophages and functions to regulate phagocytosis. Blocking CD47 is thought to enhance phagocytosis and promote anti‐tumor responses. CD47 is also highly expressed on RBCs, and the purpose of this study was to evaluate anti‐CD47 drug interference in blood bank testing.
Study Design/Method: Serologic testing was performed by standard methods. Serial samples (n=7) from 2 patients were tested over the course of 1 month treatment. Plasma was tested at immediate spin (IS) and by IAT with R2R2, rr, D‐ ‐, Rhmod and RhnullRBCs, as CD47 expression levels vary depending on Rh phenotype. DTT and enzyme treated RBCs were also tested. Both Immucor Gamma‐clone anti‐IgG (does not detect IgG4) and Ortho BioClone anti‐IgG (total IgG) were used. For titration plasma was diluted in PBS. Allo‐adsorptions were performed with papain treated rr RBCs and eluates were made using Gamma ELU‐KIT II.
Results/Finding: Anti‐CD47 was observed in plasma as soon as 1 hour post infusion. Plasma reacted 3+ to 4+ at IS and 4+ with all panel cells in PEG IAT using Ortho anti‐IgG. D‐ ‐, Rhmod and Rhnull RBCs were non‐reactive at IS and weaker (3+ and 2+) in PEG IAT with Ortho reagent. Reactivity with all panel cells by Ortho IgG gel card was 3+. In contrast, IAT reactivity using Gamma‐clone anti‐IgG was only +w to 1+, and this reactivity was confirmed to be carry‐over agglutination. D‐ ‐, Rhmod and Rhnull were non‐reactive in PEG IAT using Gamma‐clone anti‐IgG . The anti‐CD47 titer was 1 at IS and PEG IAT with Gamma‐clone anti‐IgG, but was ≥ 256 with Ortho anti‐IgG. Plasma reacted with DTT, trypsin, papain, α‐chymotrypsin or W.A.R.M. treated RBCs. Somewhat unexpected, autocontrols were negative and DATs were non‐reactive or microscopic only. Acid eluates (n=4) were 3+ reactive with Ortho, and non‐reactive with Gamma‐clone anti‐IgG. Plasma reactivity was removed after 4X allo‐adsorption with papain treated rr cells, but in some samples low level (micro‐1+) reactivity remained. PEG adsorption was invalid due to precipitation/complexing of antibody. Robust plasma reactivity interferring in ABO reverse typing was observed, and weak spontaneous agglutination of the RBCs in the ABO forward and Rh typing.
Conclusion: Hu5F9‐G4 anti‐CD47 therapy interferes with routine pre‐transfusion testing, not only antibody screening and crossmatch, but ABO and Rh typing. High levels of CD47 expression on RBCs results in plasma agglutination at IS, mimicking reactivity observed with IgM antibodies although Hu5F9‐G4 is IgG4. Reactivity was observed in all phases and with all test methods. CD47 is not cleaved from RBCs by DTT, trypsin, papain/ficin, DTT with ficin (W.A.R.M.) or α‐chymotrypsin, and treatment of RBCs with these does not mitigate interference. Numerous adsorptions with papain treated rr RBCs were required to remove anti‐CD47 reactivity from plasma. Use of Immucor Gamma‐clone anti‐IgG, which does not detect IgG4, can mitigate interference in IAT although carryover reactivity may be observed. Due to blocking by anti‐CD47 on the patient RBCs, DAT and autocontrols were weak or non‐reactive; however eluates prepared from the DAT+ RBCs were strong and pan‐reactive using Ortho Anti‐IgG.
CP247
Severe Transfusion Reaction with K0‐Fenotype
Inna Sareneva*, Susanna Sainio, Katri Haimila, Anu Korhonen, Malla Kuosmanen, Suvi Natunen, Kati Sulin and Katri Tuomi
Finnish Red Cross Blood Service
Background/Case Studies: A Caucasian woman with history of a Caesarean section and a RBC TX in 1985. In August 2016, she was admitted to hospital for trauma surgery, ab screening was negative and two units were transfused without transfusion reactions. Five days later she was referred to a tertiary care trauma center due to a severe postop infection and need for a reoperation. Ab screening was now positive, with an antibody reacting with all panel cells detected. Because of the urgent need for RBC TX, two weakly cross‐match positive Rh+K matched units were transfused with a warning of possible alloantibodies. The patient got acute hemolysis.
Study Design/Method: A Gel technique was used in the Hospital Transfusion Laboratory. In addition, various antibody identification panels and special serological and genotyping methods were used in the Reference Laboratory. KEL sequencing was done by the International Immunohematology Center.
Results/Finding: The Hospital Transfusion Laboratory results were O RhD neg, DAT neg, and the ab identification was 2+ with untreated and 3+ with enzyme‐treated cells, with weakly positive autocontrols. A sample was submitted to the reference laboratory for additional investigation. DAT was weakly positive, while ab identification results were similar to the hospital results. Different pheno‐ and genotyping methods were used in addition to several identification panels to exclude rare blood groups. After Pk, Vel neg, Jk:‐3 etc. had been excluded, k‐phenotyping revealed a K0‐phenotype. A total of 38 silencing mutations are known for the KEL gene and the genotyping kits used did not recognize these. The Anti‐Ku antibody reacts with all cells apart from the K0‐phenotype. The presence of DTT‐sensitive anti‐Ku was confirmed with DTT‐ treated panel cells. Anti‐Ku may cause immediate and delayed hemolytic transfusion reactions. Samples were taken from the patient's two siblings and daughter. KEL sequencing revealed KEL*02N.19 with c.2023T encoding p.675Ter (reported in an individual from Austria in 2007). There are two known K0‐patients in our country, both homozygous for c.2023T. The daughter was a c.2023T heterozygote, while the siblings did not have this variant. A new operation is necessary but no K0‐donors are available in our country. With the help of the ISBT Rare Donor Working Party, a K0 O RhD neg donor was found in Japan and one unit was delivered to us for use in the next operation.
Conclusion: An alloantibody should always be suspected when autocontrol is weaker than panel cell reactions, even if the direct Coombs is positive. A combined serological and genotyping approach offers the best solution for problematic antibody cases. Compatible blood is not always available in rare blood group cases, but international co‐operation may be of help in finding a suitable donor.
CP248
Transfusion Strategy for the Serologic Weak D Phenotype in Tunisia Based on RHD alleles and RH haplotypes
Mouna Ouchari*1, Kshitij Srivastava2, Houda Romdhane3, Saloua Jemni Yacoub4 and Willy Albert Flegel1
1NIH, 2DTM/CC/NIH, 3Regional Blood Transfusion Center Sousse, 4Regional Blood Transfusion Center Sousse, Tunisia
Background/Case Studies: D antigen variants have been studied molecularly in many Arab populations, including Gaza, Tunisia, Egypt and Libya, since 2009. The Tunisian population has the largest known prevalence of weak D type 4.0 alleles, occurring in 1 of 105 RH haplotypes, compared to 1in 6,060 or less in Europe. A systematic study was missing for samples with the serologic weak D phenotype routinely found in blood donor and patient testing in Tunisia. The study was designed to obtain data on weak D type 4.0 in a population known to harbor the greatest prevalence of such allele worldwide.
Study Design/Methods: A total of 13,431 random blood donors were serologically screened for the D antigen using 3 routine techniques. Samples with weak reactivity were tested with a panel of 6 monoclonal anti‐D (Partial RhD‐Typing Set) to identify partial D phenotypes. The RHD gene was sequenced in all samples with serologic weak D phenotype. The RHCE gene was also tested molecularly by either direct sequencing or using the RHCE BeadChip kit to ascertain the RHCE allele linked to the RHD allele.
Results/Findings: A total of 67 discrepant samples (0.5%) were observed and expressed the serologic weak D phenotype. Among them, 60 carried an allele of the weak D type 4 cluster (89.6%), of which 53 samples (88.3%) showed the weak D type 4.0 allele. Only 1 sample each was found for the weak D types 1, 3 and 100 and the DVII, while 3 samples showed the consensus RHD sequence. No mutation in any of the 10 RHD exons was detected in another 3 samples. The molecular analysis of the RHCE gene showed that 59 out of 67 samples with serologic weak D phenotype (88.06%) had a variant RHCE allele and the most common associations were: weak D type 4.0 linked to RHCE*ceVS.04.01; weak D type 4.2.2 with ceAR; and weak D type 4.1 to RHCE*ceVS.02, while the other RHD alleles were linked to one of the common RHCE alleles.
Conclusion: Almost 90% of the weak D phenotypes in Tunisia were caused by alleles of the weak D type 4 cluster, of which 88% represented the weak D type 4.0 allele. Based on established RH haplotypes for variant RHD and RHCE alleles and the lack of adverse clinical reports in Tunisia, we recommend D positive transfusions for patients and no RhIG administration for pregnant women with weak D type 4.0 in Tunisia. We propose this strategy as a pragmatic clinical decision, even if eventually a rare allo‐anti‐D immunization would occur in Tunisia associated with weak D type 4.0 phenotype. There is a possibility that the RHCE*ceVS.04.01 allele, typically associated in Tunisian individuals, may protect from allo‐anti‐D immunizaton and other RHCE alleles, such as RHCE*ce more often associated in individuals of other ethnic groups, may not. However, we conclude that this conjecture has not much evidence in support at this time and would need corroboration by experimental and clinical data, before used to guide clinical recommendations.
CP249
Transient Kell and Scianna Antigen Suppression in a Ul(a+) Homozygote
Martha Rae Combs*1, Heather Simmons1, Christine Lomas‐Francis2, Gayane Shakarian2, Sunitha Vege2, Lauren Hutelmyer3, Sandra Nance4, Jessica Poisson1, Nicholas Bandarenko1 and Connie M. Westhoff2
1Duke University Hospital, 2Immunohematology and Genomics Laboratory, New York Blood Center, 3ARC PennJersey, 4American Red Cross, Immunohematology Reference Laboratory, Biomedical Services
Background/Case Studies: Plasma from a transfused, A+, 2 year old white female, post liver transplant with RBC aplasia, reacted at RT and in PEG IAT with all RBC samples tested except her own.
Study Design/Method: Standard hemagglutination methods were used for antibody ID and antigen typing. Acid eluates were prepared using Gamma ELU‐KIT II (Immucor). Genomic DNA was isolated from WBCs and used for HEA PreciseType array and KEL and SC gene sequencing. Samples from the proband and her mother were tested, as applicable.
Results/Finding: The patient's DAT was negative. Her plasma reacted with 0.2M DTT‐treated and papain‐treated RBCs, all available RBC samples lacking high‐prevalence antigens, and with phenotypically similar RBC samples [C−, K−, Fy(a−),S−]. Reactivity was detected to a titer of 64; it was not removed by prewarm technique or by 4x PEG alloadsorption. The adsorbed plasma reacted with 0.2M DTT‐treated RBCs. Extensive RBC phenotype results were unremarkable except for the following: K−, k−, Js(b−), Kp(a−b−) and Sc:−1,−3. Her plasma reacted with Ko, McLeod, Sc:−1,−2 RBC samples and DTT‐treated Sc:−1 RBCs at RT and PEG IAT but her diluted plasma and pretransfusion eluate showed relative Kpb specificity. The patient was transfused 4 aliquots of crossmatch incompatible Kp(b−), S− RBCs. Her post‐transfusion DAT was 2+ with anti‐IgG, 1+ with anti‐C3d. The eluate reacted with all RBC samples except 1 Kp(b−) sample. She tolerated additional aliquots from 4 phenotypically similar RBCs untested for high‐prevalence Kell or Scianna antigens. The HEA PreciseType predicted K−, k+, Kp(a−b+), Js(a−b+) and Sc:1,−2, discordant with her RBC phenotype. KEL gene sequencing identified a homozygous change, c.1481A>T (p.Glu494Val) (KEL*02.10) encoding the low prevalence antigen, Ula, but no changes associated with lack of Kell system antigens; however, her RBCs typed Ul(a−). SC sequencing found heterozygosity for a 5’‐2g>a change (rs12124733, 24 to 30% prevalence) and conventional SC*01, predicting Sc:1,−2,3. KEL and SC results on the mother were KEL*02/KEL*02.10, heterozygous for the SC change 5’‐2g>a, and her RBCs typed K−k+ Kp(a−b+), Sc3+, Ula+, consistent with DNA predictions. Plasma collected 7 months later was nonreactive at RT and in PEG IAT. Her RBCs were DAT− and now typed k+, Kp(a−b+), Ul(a+) Sc1+ and Sc3+,concordant with predicted Kell and Sc phenotypes.
Conclusion: We report an example of Kell and Scianna antigen suppression or blocking in the presence of autoantibody or an alloantibody in the KEL system. To our knowledge, this is the first report of a Ula KEL*02.10 homozygote. The RBCs may lack a high‐prevalence antigen antithetical to Ula. Without DNA testing and gene sequencing, the patient would be presumed to have Kell null and Sc null phenotypes, a search for Ko, and/or Sc:−1,−3 RBC units would be performed and we would not have been prompted to re‐type her RBCs when the DAT was negative.
CP250
Two Uncommon Cases of Anti‐Jka
Kimberly Ouellette*1, Maria Tavares2, Gorka Ochoa3 and Joseph Sweeney4
1Rhode Island Hospital, 2Roger Williams Medical Center, 3Grifols Biomat, 4Lifespan Academic Medical Center
Background/Case Studies: Anti‐Jka is a common antibody identified in the blood bank and providing phenotypically characterized red cells lacking this antigen is important in avoiding an acute or delayed hemolytic transfusion reaction. In nearly all cases, this antibody is identified in the context of a phenotypically homozygous Jkb patient, Jk(a‐b+). Other scenarios are quite rare. We present two cases of anti‐Jka in which this phenotype was not observed.
Study Design/Method: Patient A is a 55‐year‐old multiparous female with no known transfusion history. Her blood typed as O positive with a positive antibody screen, negative DAT, and a clearly identified anti‐Jka in plasma. The patient phenotyped as Jk(a‐b‐). Genotyping revealed the presence of the JK*B allele, but not the JK*A allele. Complete sequencing of the JK gene showed an intron 5 polymorphism in homozygosity. Specifically, the patient showed a JK*B(IVS5‐1A)genotype, associated with a Jkb null phenotype. Anti Jk3 was not identified. The conclusion was an allo‐anti‐Jka in a Jk null patient. The patient did not receive any transfusions.
Patient B is a multiply transfused 64 old female. Her blood typed as A positive with a positive DAT and antibody screen. Both the plasma and eluate revealed an anti‐Jka. Despite the recent transfusion, the patient phenotyped as Jk(a+) 4+ and Jk(b+) 2+. Genotyping showed the presence of both JK*A and JK*Balleles. Whole gene sequencing was not performed. There was no hematologic or biochemical evidence of hemolysis. The patient was considered to have an auto‐anti‐Jka and Jka negative cells used for transfusion.
Results/Findings: Patients A and B both developed anti‐Jka while having uncommon phenotypes/genotypes.
Conclusion: It is common for Jk null patients to develop anti‐Jk3. However, we speculate that expression of the Kidd glycoprotein with the Jkb epitope was below the threshold of serological detection, but enough to prevent the formation of anti‐Jk3 or anti‐Jkb. Auto‐anti‐Jka is usually reported in the context of an active hemolytic process, but Patient B illustrates an auto‐anti‐Jka without hemolysis which is more commonly observed with autoantibodies exhibiting specificity for Rh epitopes. These rare cases of anti‐Jka require phenotypic and genetic analysis for the Jkb epitope and JK*B allele respectively, and in more complex cases whole gene sequencing.
CP251
Two Unusual Polymorphisms in 1 Donor Contribute to Red Blood Cell Genotype Discrepancies
Katrina Billingsley* and Monica Kalvelage
LifeShare Blood Centers
Background/Case Studies: Donor genotyping for red blood cell antigens has become common practice in many blood bank laboratories. Package inserts for commercial assays indicate false negative results may be generated when unexpected rare mutations affect primer or probe binding and cause allele dropout or failed amplification. These outcomes may go unrecognized unless serological results are available for comparison.
Study Design/Method: A routine blood donor, self‐identified as African American, was selected for red blood cell genotyping. DNA was extracted and genotyping was performed using two commercial platforms (PreciseType, BioArray, Warren NJ; IDCoreXT, Grifols, Emeryville, CA). Genotype results were compared to historical serological results. Discrepancies were resolved by Sanger sequencing (Grifols IH, San Marcos, TX).
Results/Finding: Genotyping results showed variants in both the Duffy (FY) and Kell (KEL) blood group systems. The donor's genotype was concordant on both platforms, FY*A/FY*B_GATA, KP*A/KP*A, for a predicted phenotype: Fy(a+b‐); Kp(a+b‐). When genotype results were compared to historical serology, it was noted that the donor previously typed Fy(a‐) on 3 separate donations. No previous Kpa or Kpb serotyping was available. Sequencing of FY exon 2 revealed a 287G>A mutation, FY01*N.04, known to silence Fya. Sequencing of KEL exons 1‐19 exposed a silent polymorphism in exon 8, 846G>C. This polymorphism causes a dropout artifact yielding a false negative Kpb interpretation.
Conclusion: The discrepant FY*A result, as well as the unlikely Kp(b‐) type prompted the request for sequencing. The rare FY01*N.04 mutation has been reported in people of Caucasian descent. This is the first example of this FY mutation identified in this regional population. The Kpb antigen is present in nearly 100% of all populations. However, Kp(b‐) is most frequently seen in people of Caucasian descent. To date, 64 self‐identified African American donors have been genotyped as KP*A/KP*B at this blood center. Given the diversity of regional heterogeneity, it is feasible to identify a Kp(b‐) donor, self‐reporting as African American. Red blood cell genotyping offers an abundance of information, but cannot replace serology as the sole means of red cell antigen characterization. Donor ethnicity continues to play a key role in selection for genotyping and the search for rare and unusual red cell types. In this case, a donor selected for genotyping based on ethnicity was initially thought to have 2 genetic variants not previously reported in those of African descent. Only 1 was proven to be present. This case acts as a reminder that genotype limitations must be considered even when using licensed methodologies.
CP252
Unexpectedly Weak Anti‐B and Anti‐B Change in Strength over Time in Two Group O Pediatric Patients on Prolonged Total Parenteral Nutrition
Alesia Kaplan*1, Kimberly Gabert2 and Mark Yazer1
1University of Pittsburgh, 2The Institute for Transfusion Medicine
Background/Case Studies: Anti‐A and‐B are naturally occurring and typically develop by 4‐6 months of age in healthy individuals. These antibodies usually produce strong agglutination on reverse typing. Weak or absent anti‐A and‐B can be seen in immunodeficient, elderly patients and newborns. This case report presents two group O pediatric patients who had been on enteral feeds and had absent/weak anti‐B that became strong over time in patient 1.
Study Design/Methods: Patient 1 was a 7 year‐old male born prematurely with short gut syndrome who underwent a small bowel and liver transplant at 3 years of age. Anti‐B changed from undetectable/weak to strong at the age of 7 years. Patient 2 was a 17 month‐old female with a metabolic urea cycle disorder who underwent a liver transplant. Anti‐B was 0/+1. Both patients were on total parenteral nutrition (TPN) since birth and had strong anti‐A and normal immunoglobulin testing. ABO typing with enhancing techniques is presented in Table 1.
Results/Findings: Both patients typed as group O on forward typing. Anti‐A was strong in both patients. Anti‐B varied in strength in patient 1 with 0‐1+ reactions up to 7 years of age. Thereafter, ABO typing showed mainly strong anti‐B. Patient 2 had 0/1+ anti‐B.
Conclusion: Intestinal bacteria stimulates production of anti‐A and ‐B. Unexpected changes in anti‐B that caused ABO discrepancies are reported here for 2 children on long‐term TPN. Patient 1 had absent/weak anti‐B since birth up to 7 years of age, then developed strong anti‐B with no change in feeding regiment and medications. Patient 2 had consistently strong anti‐A and absent/weak anti‐B. These findings support the notion that normal colonization of the gut is important in the development of anti‐A and ‐B and suggests that microflora of the gut in patients on prolonged TPN is different leading to the delayed formation of these antibodies compared to individuals on normal enteral diet. Difference in strength of anti‐A and‐B could be due to stronger A than B antigen expression on gut bacteria.
TABLE 1. Summary Of ABO Typing Results
|
Forward Type |
Reverse Type |
Enhancing Techniques | |||||||
|---|---|---|---|---|---|---|---|---|---|
| Date |
Age (Years) Patient 1 |
Anti‐A | Anti‐B | A1 | B |
B RBC 15’ RT |
B RBC 30’ 4°C | B RBC:Plasma 1:4 | Testing Methods |
| 2/18/10 | 1 | 0 | 0 | 0 | 0 | 0 | 0 | NT | Gel & Tube |
| 12/30/12 | 3 | 0 | 0 | 4+ | 1+ | NT | NT | NT | Solid |
| 4/30/13 | 4 | 0 | 0 | 4+ | 0 | 0 | 1+ | NT | Gel & Tube |
| 8/2/14 | 5 | 0 | 0 | 4+ | 0 | 0 | + | NT | Tube |
| 12/17/15 | 6 | 0 | 0 | 4+ | 0 | NT | NT | NT | Gel &Tube |
| 12/6/16 | 7 | 0 | 0 | 4+ | 3+ | NT | NT | NT | Solid |
| 1/10/17 | 7 | 0 | 0 | 4+ | 4+ | NT | NT | NT | Gel |
| 1/12/17 | 7 | 0 | 0 | 4+ | 4+ | NT | NT | NT | Gel |
| 3/3/17 | 7 | 0 | 0 | 4+ | 4+ | NT | NT | NT | Solid |
| 3/6/17 | 7 | 0 | 0 | 3+ | 3+ | NT | NT | NT | Solid |
| 3/9/17 | 7 | 0 | 0 | 3+ | 3+ | NT | NT | NT | Solid |
| 3/13/17 | 7 | 0 | 0 | 1+ | 1+ | NT | NT | NT | Solid |
|
Age (Months) Patient 2 |
|||||||||
| 4/6/16 | 10 | 0 | 0 | 4+ | 1+ | NT | NT | NT | Gel |
| 11/14/16 | 17 | 0 | 0 | 4+ | 0 | 0 | 0 | 0 | Gel & Tube |
| 11/27/16 | 17 | 0 | 0 | 4+ | 1+ | NT | NT | NT | Gel |
RT‐ Room Temperature
NT‐ Not Tested
CP253
Use of a Cord Blood Panel for Daratumumab Treated Multiple Myeloma Patients in a Clinical Setting
Maria Barry*1 and Braden Armstrong2
1Methodist Hospital San Antonio, 2Methodist Hospital
Background/Case Studies : Use of an antigen typed cord cell panel in lieu of dithiothreitol treatment of reagent red cells to determine the presence of underlying alloantibodies in panagglutination is beneficial.
Study Design/Methods: Daratumumab is a monoclonal anti‐CD38 antibody used to treat multiple myeloma patients. The medication interferes with serological testing as demonstrated by panagglutination. Cord cells have demonstrated low to no amount of CD38 and have been used as an antibody screen for underlying alloantibodies in daratumumab treated patients. Antigen negative cord cells and dithiothreitol treatment were evaluated for use in the clinical setting. Reagent and supply costs, technologist labor and skill level, ease of use, and product turn‐around‐time were factored in the decision. The cord panel option was determined to be more conducive to the clinical setting. Cord cells were antigen typed to develop a cord panel that ruled out the Rh, Kell, Kidd, Duffy and MNSs blood group systems by double dose expression. Six to eight cord cells compose the final cord panel. The selected panel cells were subsequently suspended in a red cell storage solution and remain viable for up to 60 days. Antigen typing of the initial cord cells take four to eight hours to complete but no additional treatment of cells is required. Antigen negative units of antigen(s) not ruled out with a double dose expression or by genotype are selected for the crossmatch order.
Results/Finding: A daratumumab protocol was established that incorporated use of the cord panel. Multiple myeloma patients selected as candidates for daratumumab treatment were baseline tested for blood type and antibody screen, DAT and genotype. After daratumumab infusion, a two unit crossmatch was order as a precaution in the event the patient developed a reaction to the medication. Repeat of the antibody screen demonstrated panagglutination which served as a positive control for the medication. The cord panel ruled out underlying alloantibodies. Selected red cell units were crossmatched at immediate spin phase to avoid expected indirect antiglobulin reactivity.
Conclusion: The cord panel was used 28 times over a five month period to rule out underlying alloantibodies. Tests for the daratumumab protocol consisted of a routing antibody screen followed by a cord panel for resolution. The daratumumab protocol significantly reduced testing time and allowed for the provision of compatible blood products in an efficient and cost effective manner.
CP254
Use of the Microscope for Pre‐Transfusion Antibody Screens
Teresa Gorey*1 and Elizabeth Hart2
1Brigham and Women's Faulkner Hospital, 2University of Massachusetts‐Dartmouth
Background/Case Studies: The purpose of performing a pre‐transfusion antibody screen is to detect clinically significant unexpected antibodies and to decrease the probability of detecting clinically insignificant antibodies. Several antibody detection methods (Polyethylene glycol (PEG), LISS, and albumin) are routinely used in small transfusion services. The utility of PEG is to enhance the sensitivity of detecting clinically significant antibodies by the indirect antiglobulin procedure.
The Code of Federal Regulations, Title 42, CFR part 493.1271(a), states the manufacturer's instructions are followed when testing for unexpected antibodies. The package insert for Gamma PeG™ (Immucor Inc., Norcross, GA), states that negative reactions may be examined with an optical aid. Based on these directions, our institutional policy is to confirm all negative reactions using the microscope.
Study Design/Method: A one‐year retrospective document review was performed on all patient samples in which a positive antibody screen (ABSC) triggered the antibody identification (ABID) to be performed in 2016. A total of 232 samples were evaluated.
Each ABID was subcategorized; (1) as being a new antibody for our facility or in the patient's shared electronic health record within the Partners® Healthcare system and (2) whether a microscopic ABSC result triggered the ABID. Also, patients with known antibodies were grouped according to a microscopic ABSC result. A comparison of the new patients and the previously known antibody patients with microscopic results were reviewed to determine if the antibodies were clinically significant.
Results/Finding: A total of 83 ABIDs were performed on new patient samples. Of the new ABID samples, 29 (35%) had microscopic ABSC results. For the previously known antibody patients, there were 35 which accounted for 15% of the total ABIDs performed. When reviewing the total ABID workups, a total of 64 (28%) of the ABSCs had microscopic results which resulted in an ABID being performed. The antibodies identified in the 29 new antibody samples were:
| Antibody | Total |
|---|---|
| Cold auto‐antibody | 12 |
| Anti‐P1 | 4 |
| Anti‐M | 2 |
| Anti‐Sda | 6 |
| Anti‐Leb | 1 |
| Anti‐Jka | 1 |
| Anti‐K | 1 |
| Anti‐E | 1 |
| Anti‐C | 1 |
Conclusion: A total of 86% of the new antibodies identified based on a microscopic ABSC were clinically insignificant. The manufacturer's directions were followed but they do not state that an optical aid is required to confirm all negative results. Due to the results of this study, a decision will be made to: (1) discontinue the use of the microscope, (2) switch to a PEG manufacturer whose directions indicate to observe macroscopically for agglutination, or (3) define the use of the agglutination viewer as the optical aid. Decreasing the number of ABIDs will save time and money while providing potential RBCs for transfusion in a timely and efficient manner.
CP255
Warm Anti‐Anwj Associated with Acute Hemolytic Transfusion Reactions in a Patient with Severe Aplastic Anemia
Jamal Carter*1, Marina Bueno2, Traci Paige3, Karen Byrne4, James Szymanski3 and Willy A Flegel5
1Department of Transfusion Medicine, NIH Clinical Center, 2NIH, 3NIH/CC/DTM, 4National Institutes of Health, 5DTM/CC/NIH
Background/Case Studies: The AnWj antigen (ISBT Number 901009, “Anton”) has a prevalence greater than 99% in all populations. Hereditary absence of AnWj has only been described once (in a single family). However, red cell expression of AnWj may be markedly decreased to near undetectable levels in blood donors of the In(Lu) (or “Dominant Lutheran Inhibitor”) phenotype. Similarly, anti‐AnWj antibody formation is rare, with only 10 cases reported in the literature. The antibody developed in the context of hereditary absence of AnWj (i.e., a true alloantibody) in only one of the cases. In the other nine cases, the antibody occurred in the context of autoimmune or lymphoproliferative disease, where, in this context, it is believed to have developed secondary to transient AnWj antigen suppression. Most of the reported cases lacked clinical or laboratory evidence of hemolysis. However, in the most recently reported case, involving a 56‐year‐old woman with aplastic anemia, the antibody was associated with acute hemolytic reactions after RBC transfusions, necessitating transfusion support with AnWj‐negative and In(Lu) RBCs. The case was also unique in that the anti‐AnWj resulted in a direct antiglobulin test (DAT) that was positive for complement only, rather than IgG like all previous cases in which the DAT was performed and was positive.
Study Design/Method: A 59‐year‐old woman with severe aplastic anemia experienced acute hemolytic transfusion reactions (AHTR) with development of a panagglutinin on indirect antiglobulin test (IAT) screens. Prior to identifying the specificity of the panreactive antibody, the patient received 10 RBC transfusions and showed signs of hemolysis with six of them. The first three transfusions were prior to her positive IAT and were electronically crossmatched. The next seven transfusions were incompatible by anti‐human globulin (AHG) phase crossmatch, but were extended phenomatched for clinically significant antigens. The patient's AHTR signs and symptoms included fever, rigors, nausea, vomiting, dark urine, flank pain and “impending doom” anxiety; while her laboratory findings included hemoglobin decreasing below pre‐transfusion levels, and increased total bilirubin and LDH. The DAT, while initially negative during the immediate post‐transfusion workup of the transfusion reactions, eventually became positive for IgG only (1‐2+), and negative with anti‐C3b, C3d reagent. The antibody showed a peak gel‐IgG IAT titer of 32.
Results/Finding: The antibody was identified as having AnWj specificity. The patient's pre‐transfusion sample showed weak AnWj expression (w+), altogether suggesting an auto‐anti‐AnWj. Monocyte monolayer assay testing using the patient's plasma and RBCs from the AHTR‐implicated units yielded monocyte indices ranging from 33 to 83%, consistent with the clinical hemolysis observed. Given the patient's group O, Rh D negative blood type and continuing transfusion dependence, in order to avoid further AHTRs, international collaboration was necessary in order to procure and provision group O, Rh D negative RBCs that were also serologically negative for AnWj. The patient was successfully transfused three such units without further incident.
Conclusion: This is the second documented case of anti‐AnWj in a patient with aplastic anemia and, overall, the third anti‐AnWj case associated with AHTR. This case also underscores the importance of international collaboration.
CP256
Weak D Genotyping: Not so Simple!
Patrick Trepanier*, Jessica Constanzo‐Yanez, Nathalie Desjardins, Maryse St‐Louis and Marie‐Claire Chevrier
Hema‐Quebec
Background/Case Studies: Following the recommendations of the College of American Pathologists (CAP) Transfusion Medicine Resource Committee (TMRC) and the AABB (Sandler etal., 2015), Hema‐Quebec started offering weak D genotyping service in June 2016 to every hospital in the province of Quebec obtaining unusually weak serological results for women ≤45. Weak D genotyping is of particular interest in pregnancy, as it may allow the prevention of unnecessary injections of Rh immune globulin (RhIG), as well as the prevention of transfusion of scarce D negative red blood cells (RBCs), when D positive RBCs could have been safely used.
Study Design/Method: The PCR‐sequence‐specific primers (SSP) and restriction fragment length polymorphism (RFLP) assays used allow the analysis of weak D types 1, 2 and 3, as these types can safely be considered D positive. Weak D type 42 was also analysed for statistical reasons, as it is prevalent in the population (St‐Louis etal., 2011).
Results/Finding: Three hundred and ninety weak D genotypes have been determined to this day with frequencies of 21% (type 1), 5% (type 2), 9% (type 3), 25% (type 42) and 40% other than 1, 2, 3 or 42. Further investigation was conducted to determine the molecular identity of the «others». Out of 157 samples, 119 (75%) were confirmed to be legitimate serological weak or partial D, mainly deletions of exon 5 or both exons 4 and 5. A surprising amount of 38 samples were discovered to be normal RHD.
Conclusion: Along with Sandler etal. (2015) data, our findings highlight the difficulties hospitals face in interpreting serological weak D. Trend analysis was conducted regarding the reagents and technologies used by each hospital, the origin of the request and the ethnicity of the concerned patient, but no significant correlation could be identified at this point. Altogether, our findings allow to share the frequency of weak D types 1, 2, 3 and 42 obtained in serological weak D, ≤45 years old Quebec's women, and also highlight the need for further investigation of standard practices amongst hospitals regarding the management and interpretation of atypical D typing.
Recipient Non‐Infectious Adverse Events
CP257
A Pilot Study of Japanese Hemovigilance to Trace Entire Transfusion Chain
Sahoko Matsuoka*1, Hideto Ishizaka2, Asashi Tanaka3, Yuji Yonemura4, Yasuhiko Fujii5, Akimichi Ohsaka6, Hitoshi Okazaki7, Rikizo Taira8, Kuro Toyoda8, Junichi Kitazawa9, Shinichi Ohtani10, Hidehumi Kato11, Shuichi Kino12, Isao Hamaguchi1 and Japan Society of Transfusion Medicine and Cell Therapy Task Force on Hospital Information System13
1Department of Safety Research on Blood and Biological Products, National Institute of Infectious Diseases, 2Medical Administration Division, Yamato Municipal Hospital, 3Department of Blood Transfusion, Tokyo Medical University Hachioji Medical Center, 4Department of Transfusion Medicine and Cell Therapy, Kumamoto University Hospital, 5Department of Transfusion Medicine, Yamaguchi University Hospital, 6Department of Transfusion Medicine and Stem Cell Regulation, Juntendo University School of Medicine, 7Department of Blood Transfusion, The University of Tokyo Hospital, 8Blood Service Headquarters, Japanese Red Cross Society, 9Division of Clinical Laboratory and Transfusion, Aomori Prefectural Central Hospital, 10Department of Transfusion Medicine and Cell Transplantation, Kitasato University School of Medicine, 11Department of Transfusion Medicine, Aichi Medical University, 12Japanese Red Cross Hokkaido Block Blood Center, 13Japan Society of Transfusion Medicine and Cell Therapy
Background/Case Studies: Japanese main hemovigilance system has been operated by Japanese Red Cross Society (JRCS) since 1993, but relatively severe adverse events tend to be recorded because the reporting system is on a voluntary basis. To reduce the severity‐related bias, we have established alternative online reporting system to collect data every two months regularly on all transfusion bags and transfusion‐related reactions in recipients from approximately 50 Japanese hospitals since 2007.
Study Design/Methods: We started to perform a pilot study on September 2015 for the development of our hemovigilance system to cover entire transfusion chain from collection of blood components to follow‐up of their recipients, connecting donor data from JRCS with the existing recipient data. 16 enrolled Japanese hospitals and JRCS submitted their transfusion bag data according to our instructions for the study.
Results/Findings: 16 hospitals reported the data of 14,205 transfusion bags (7,436 RBCs, 2,950 PCs, and 3,819 FFPs). We linked 13,434 (94.6%) bag data to donor information provided by JRCS and analyzed the data. 771 bag data were not linked mainly because of human errors due to manual input in hospitals. 134 (1.00%) bags were disposed in hospitals. Incidences of adverse events were 0.765% (111/13,300 bags); 0.50% (35/6,982 bags) in RBCs, 3.88% (107/2,654 bags) in PCs, and 1.39% (49/3,473 bags) in FFPs, respectively. We evaluated adverse events classified by gender of donors or recipients, donor blood type, recipient age and a period from blood collection to transfusion. We found FFP caused more frequent adverse events to female recipients than to male recipients. Storage period had no significant influences on the adverse events in recipients in our analysis.
Conclusion: In this study, Japanese labile blood products are thoroughly traceable from the donation to the usage. Further upgrades of our instructions to reduce the input errors and to collect more precise information would be important for the improvement of our hemovigilance system.
CP258
Incidence of Acute Transfusion Reactions in an Oncological Hospital
Monica Manini da Silva*, Patricia Nalin de Lucena, Rafaela Guerra Maciel, Sandra Satoe Kayano, Marcos Paulo Colella and Rafael Colella
A C Camargo Cancer Center
Background/Case Studies: Acute transfusion reactions are defined as clinical signs and symptoms that appear within 24 hours of transfusion, ranging from mild to severe. The most common reactions are Febrile Non‐Hemolytic Transfusion Reaction (FNHTR), Allergic Reactions, Transfusion‐Associated Circulatory Overload (TACO) and Transfusion‐Related Acute Lung Injury (TRALI). Urticaria and FNHTR are common reactions and occurs respectively in 1‐3% and 0,1‐1% of the transfusions. TACO is classified as a relatively common reaction and occurs in less of 1% of transfusions, and TRALI is unfrequent, happening in less than 0,01% of transfusions.
Objective: Evaluate the results of transfusion reactions that occurred in patients of a reference Oncological Hospital.
Study Design/Method: Patients who received transfusion in 46 months (from August/2013 to December/2016) were evaluated. A nurse evaluated those who had any clinical signs or symptoms that could be related to transfusion and data were recorded in a specific form. All form were reviewed by a hematology physician and those reactions that could not be related to the transfusion were excluded.
Results/Finding: We analyzed 614 transfusion reactions; 217 (35.3%) occurred with erythrocytes, 320 (52.1%) with random platelets, 53 (8.6%) with apheresis and 24 (4%) with fresh frozen plasma. 449 (73.1%) were classified as allergic, being 15 moderate and 2 severe. 160 reactions (26%) were classified as FNHTR. TACO incidence was 0,6%. No TRALI happened in the period. Prophylaxis were used in 98% of patients.
Conclusion: FNHTR is described as the most common adverse event related to transfusion, but our data showed a higher incidence of allergic reactions. FNHTR occurred 3 times less than allergic reactions. This might be explained by universal leukoreduction and universal prophylaxis adopted at our institution. Further studies are necessary to evaluated the benefit of this approach.
CP259
Irradiation and Prolonged Storage of Red Cells Are Associated with Increased Inflammatory Adverse Events
Jian Chen*1, Aaron Shmookler2, Elizabeth Biller1, Junan Li1 and Scott Scrape1
1Ohio State University, 2The Ohio State University
Background/Case Studies: Red cell (RBC) transfusion is an important, often life‐saving treatment in modern medicine, which unfortunately can sometimes cause adverse events (AEs). Although recent randomized controlled clinical trials have concluded that there was no significant difference in transfusion‐associated mortality between fresh and older RBCs, the impact of storage duration as well as post‐collection modification on mild yet more common complications has not been fully investigated.
Study Design/Method: In this retrospective study, 157,087 eligible units out of a total of 189,528 RBCs were transfused to 30,030 patients with age ranging from 16 to 113 years old (median: 60) and 1:1 male to female ratio during July 2011 to March 2017. All the RBCs were leukoreduced prior to storage. Washed, deglycerolized, autologous or directed RBCs and RBCs transfused during a massive transfusion protocol have been excluded. Attributes of RBC products including apheresis vs whole blood derived, CMV serological status, and irradiation were analyzed, along with recipient's age and gender. A total of 396 RBC related AEs that were reported to the blood bank were independently reviewed by 3 pathologists for this study. After excluding AEs that cannot be associated with a specific RBC unit or were deemed unrelated to transfusion, 358 RBC transfusion AEs were analyzed. Chi‐square test and logistic regression were used to compare the AE incidences among transfusion groups.
Results/Finding: Univariate and multivariate logistic analyses showed that irradiated RBCs were associated with a significantly increased incidence of transfusion‐related AEs (p <0.05). There was a significant difference in febrile non‐hemolytic transfusion reaction (FNHTR) (0.27% vs 0.11%, p <0.001) or AEs with a non‐allergic type inflammation etiology (0.30% vs 0.14%, p <0.001) including transfusion‐related acute lung injury, transfusion‐associated dyspnea, but not transfusion‐associated circulatory overload, infections or hemolytic transfusion reactions, between irradiated RBCs and non‐irradiated RBCs. In contrast, the incidences of allergic AEs (0.028% vs 0.024%, p = 0.614) were similar between these two groups. The incidences of inflammation AEs after transfusion of irradiated RBCs that were stored for 1, 2, 3, and 4 weeks were 0.25%, 0.32%, 0.39% and 0.41%, respectively (p = 0.084, logistic regression) but there was a significant difference in the incidence of inflammation AEs caused by irradiated RBCs stored for a week (0.25%) and longer than a week (0.35%) (p < 0.05).
Conclusion: Irradiated RBCs associated with a higher incidence of transfusion inflammation AEs compared to non‐irradiated RBCs and this risk increased when RBCs were stored longer than 1 week after irradiation. While it is likely the patient population is a factor in AE caused by irradiated RBCs, it is also possible that RBC radiation damage, as shown in previous studies, contributed to this increased AE incidence.
CP260
One Hospital's Experience with Under‐Reporting of TRALI
Michael Zaleski*1 and Melissa R. George2
1Penn State Health Hershey Medical Center, 2PennState Health Milton S. Hershey Medical Center
Background/Case Studies: Anecdotally, most transfusion medicine specialists agree that transfusion reactions, particularly suspected Transfusion Related Acute Lung Injury (TRALI) cases, are under‐reported. The goal of this study was to obtain objective data on the under‐reporting of TRALI.
Study Design/Method: Our information technology (IT) department searched our electronic medical records (EMR) for patients who had been diagnosed with TRALI and possible TRALI, via icd10 codes 518.7 and J95.84. A list of patients with one of these icd10 codes was generated. The EMR was searched to find the clinical scenario in which TRALI was mentioned. These patients’ records were then searched within our laboratory information system (CoPath), to determine if they had a transfusion reaction reported to our transfusion medicine service.
Results/Finding: The search of our electronic medical record found 11 patients from 2011‐2016, who had TRALI mentioned in their chart as a diagnosis or possible/likely diagnosis. One patient was excluded from our study because TRALI was mentioned as a past medical history from an outside hospital. Only the patients who had TRALI listed as a diagnosis or possible diagnosis were included in this study. These 10 patients had clinical scenarios in which a transfusion of a blood product occurred which was followed by various forms of respiratory distress. The clinical teams caring for these patients were either giving a diagnosis of TRALI or considering TRALI as a possible diagnosis. Of these 10 cases, only 2 of them were reported to our transfusion medicine service as transfusion reactions. Of the reported cases, one was determined to be TRALI and the other one was consistent with TACO. Eight out of those 10 cases were never reported.
Conclusion: TRALI is the leading cause of transfusion related deaths. Under‐reporting of TRALI to the transfusion medicine service creates the risk of causing TRALI in additional patients who receive products from the same donor. In such cases, TRALI can be prevented if the implicated donor is identified and removed from the donor pool via indefinite deferral. It is the role of the transfusion medicine service to investigate every possible TRALI case to determine if the diagnosis is warranted and then further investigate donor blood for causative antibodies and if found, test their reactivity to the recipient's WBCs. It may be an arduous process to identify and indefinitely defer a donor who is implicated in a case of TRALI but the critical first step is for the clinical team to report the reaction. From this study we conclude that TRALI is under‐reported to the transfusion medicine service at our institution. Our results show that 80% of possible TRALI cases were not reported to our transfusion medicine service from 2011‐2016. We suspect that other institutions would show similar results.
CP261
Pulmonary Transfusion Complications Reported to the Norwegian Hemovigilance System.
Aurora Espinosa*, Christine Steinsvåg and Øystein Flesland
The Norwegian Directorate of Health
Background/Case Studies: The Norwegian hemovigilance system was implemented in 2004 as a voluntary reporting system, becoming mandatory in 2007. Both transfusion reactions, donor complications and other adverse events are reported. We use definitions from ISBT‐WP on haemovigilance and/or International haemovigilance network when possible. The definition of pulmonary edema was used in the period 2004‐09. From 2007 we have had definition for TRALI (transfusion related acute lung injury). The currently used definitions for TACO (transfusion associated circulatory overload) and TRALI were implemented in 2010. Since the implementation of the Norwegian hemovigilance system in 2004 eight transfusion related deaths have been reported, including four cases of TRALI, two cases of TACO and two cases of acute hemolytic reaction caused by the transfusion of ABO‐mismatched red blood cells. The incidence of TRALI in Norway is very low because of the general use of Octaplas since 1993.
Study Design/Method: In this his study we focused on the age, gender, clinical outcome and involved blood component for patients with pulmonary transfusion complications such as TRALI, TACO and transfusion related dyspnea (TAD) between 2004 and 2015.
Results/Finding: A total of 185 pulmonary complications were reported: 22 reports of TRALI, 99 TACO, 24 pulmonary edemas and 40 cases of TAD. In six cases (four TRALI and two TACO) the patient died as a consequence of the complication, and in 35 cases (seven TRALI and 28 TACO) the reaction was life‐threatening. There was no significant difference in the incidence of TRALI, TACO and TAD between males and females. Our data may indicate that the incidence of TACO is higher in the elderly. Only one case of TACO and two cases of TAD were reported in children. Eleven TRALI cases were reported after red blood cell transfusion and eleven cases after platelet transfusion. TRALI was never reported after Octaplas transfusion, but both TACO and TAD were reported.
Conclusion: Pulmonary transfusion complications are the leading cause of transfusion related mortality in Norway. To reduce the incidence of TRALI, screening for HLA‐antibodies in both female and male donors, or inclusion of male only platelet donors could be attempted. TACO is potentially preventable, as the risk factors are well defined. Measures to reduce TACO should be taken in patients at risk.
CP262
Therapeutic Plasma Exchange for the Prevention of Renal Failure Following a Delayed Hemolytic Transfusion Reaction
Shauna Jones*, Cheryl Peterson, Brian Park, Qun Lu, Jill Adamski and Theresa Kinard
Mayo Clinic Arizona
Background/Case Studies: Despite diligent efforts to transfuse the safest product available to patients, undetected alloantibodies may cause delayed hemolytic transfusion reactions (DHTR). This transfusion reaction is seen in as many as 1 out of 100 transfused products. Therapeutic plasma exchange (TPE) may be employed to mitigate ongoing immune mediated hemolysis, but few reports in the literature describe TPE for clinical management after profound hemolysis.
Study Design/Method: Case review of a patient was performed after diagnosis and treatment of severe DHTR.
Results/Finding: A man with a history of gastrointestinal bleeding presented to the emergency room with shortness of breath and “hematuria”. He had a known history of anti‐D and anti‐C, and was transfused two units of crossmatch compatible RBCs seven days prior during a previous admission. Readmission hemoglobin (Hb) was 8.7g/dL but declined to 7.3g/dL the next day. An antibody screen was consistent with anti‐D, anti‐C, and direct antiglobulin test (DAT) was negative. He received three units of crossmatch compatible RBCs over days 2 and 3 with poor responses. On day 4, routine labs could not be reported due to marked hemolysis, he had “worsening hematuria”, creatinine rose from 1.0mg/dL to 1.8mg/dL (reference 0.8‐1.3mg/dL), and lactate dehydrogenase was above reportable linearity, >2500 u/L (reference 122‐222 u/L). Testing revealed additional anti‐E, anti‐Jkb, DAT C3+, plasma free Hb 64.4mg/dL (reference 1‐15.2mg/dL), and hemoglobinuria. Four of five transfused RBC units were Jk(b+), one of which was also E+. One volume TPE was performed to remove free Hb on days 5, 6, and 7 using fresh frozen plasma as replacement fluid for haptoglobin supplementation. Creatinine peaked at 3.7mg/dL on day 13, decreased to 2.3mg/dL before discharge on day 21, and returned 1.0mg/dL during outpatient follow up. He remained dialysis independent.
Conclusion: This case highlights the importance of clinical recognition of a delayed hemolytic transfusion reaction, critical role of laboratory staff who may be the first to identify it, and TPE for the prevention of permanent renal failure. Currently, there are no recommendations from the American Society for Apheresis for using TPE for the treatment of acute, severe hemolysis. Case reports such as this one contributes to the existing literature to raise awareness about the potential benefits of TPE for managing profound hemolysis.
CP263
Transfusion Associated Adverse Reactions in a US Recipient Hemovigilance Program: 2014‐2015
Srijana Rajbhandary*1, Chester Andrzejewski2, Naynesh Kamani1 and Barbee I. Whitaker1
1AABB, 2Baystate Health / Baystate Medical Center
Background/Case Studies: Comparative data analysis and benchmarking are important for healthcare quality improvement. Recipient hemovigilance systems provide member hospitals platforms to report data on blood transfusions (BTs), incidents, and transfusion associated adverse reactions (TAAR) for benchmarking purposes. Here we report results from an analysis of TAAR and BT data submitted by participant hospitals to a US recipient hemovigilance program from 2014‐2015.
Study Design/Method: Monthly BT and TAAR data reported by participating hospitals in 2014 (N=72) and 2015 (N=67) were examined. TAAR were categorized by reaction type (case definition), severity, and imputability using the US National Hemovigilance Network reporting protocol. TAAR rates were calculated as the number of cases/100,000 transfused components. Inclusion criteria were TAAR reported in months where denominator reports were complete with TAAR meeting case definition criteria of definite or probable and having an imputability status of definitively, probably, or possibly related to the transfusion.
Results/Finding: A total of 1,944,797 blood components were transfused by participating hospitals during the study period. Of the total TAAR reported (N=6,863; 0.4%), 2,062 reactions did not meet inclusion criteria (30.0%). The overall TAAR rate was 246.9 cases/100,000 transfused components. Allergic reactions (ARs) (44.7%) were the most commonly reported type of TAAR with rates of 110.4 cases/100,000 transfused components. Among TAAR with pulmonary manifestations, Transfusion‐Associated Circulatory Overload (TACO) was the most frequently reported reaction type (6.5%), having a reaction rate of 16.0 cases/100,000 transfused components (∼34.0% severe or life threatening). Most TAAR were non‐severe, with only 8.7% categorized as either severe or life threatening or fatal (21.4 cases/100,000 transfused components). Among specific components, platelet transfusions (PTs) were associated with the highest reaction rate of 457.6 cases/100,000 PTs followed by red cell transfusions (234.7 cases/100,000 RBCs). There were twice as many apheresis platelets (AP) reported transfused as whole blood derived (WBD) platelets, but the reaction rate for AP was ten‐fold higher than that of WBD platelets (652 cases vs. 65 cases/100,000 PTs). The most frequently reported reactions to PTs were allergic (67.7%) or febrile non‐hemolytic transfusion reactions (25.8%).
Conclusion: TAAR rates reported to this hemovigilance quality benchmarking program are consistent with those reported previously in the US. ARs were the most frequently reported TAAR. AP transfusions were associated with the highest reaction rates by component. Comparisons of hospital hemovigilance data allows benchmarking that can further efforts in transfusion reaction definition standardizations and identify areas of quality improvement for participants.
CP264
Transfusion Associated Chest Pain (TRACH): Descriptive Analysis at a Single Institution
Colin H. Murphy*, Rugvedita S. Parakh, Ryan A. Metcalf and Monica B. Pagano
Division of Transfusion Medicine, University of Washington
Background/Case Studies: Transfusion associated chest pain (TRACH) is a rarely reported clinical symptom with a potential link to chest pathology but without a corresponding CDC Hemovigilance definition. The objective of this study is to characterize the clinical presentation of suspected transfusion reactions where chest pain was reported.
Study Design/Methods: This is a retrospective chart review of patients who developed chest pain during transfusion from 2004‐2016 at a single large academic institution.
Results/Findings: Twenty three cases were identified, of which 20 had medical records available for analysis. Ten (50%) patients were male, the mean age was 50.4 years (range 24‐76 years), 15 (75%) had an underlying hematologic malignancy or bone marrow disorder, and 3 (15%) had a history of coronary artery disease (CAD). The implicated units included 14 (70%) red blood cells and 6 (30%) platelets; 17 (85%) patients received a single unit, and 3 (15%) received two or more within the previous 6 hours; the mean volume transfused was 153.3mL (range 20‐280ml). The mean time to onset of chest pain was 92.15 minutes (SD 85 minutes), with 90% of patients presenting within 2.5 hours and 100% within 6 hours of starting the transfusion. Chest pain was present as the only symptom in 35% of the cases, and for the other cases the accompanying symptoms included dyspnea (30%), fever (25%), back pain (20%), and hypo‐ and hypertension (10%). A post‐transfusion chest X‐ray was performed in 65% of cases, and all showed no evidence of pulmonary edema to suggest possible volume overload/transfusion associated circulatory overload (TACO). Electrocardiogram was performed in 70% of cases and showed no findings to suggest acute ischemia. Three (15%) patients had a minimal increase in their troponin levels, although 1 had a history of chronically elevated troponin due to stress cardiomyopathy. Fourteen (70%) patients received some form of treatment, including increased oxygen supplementation, metoprolol, acetaminophen, morphine, and oral calcium carbonate; the pain resolved after more than 10 minutes in the majority of patients (90%). No cases resulted in new admission to the ICU or procedure cancelation.
Conclusion: Chest pain associated with transfusion was infrequent, but several such cases were identified during the review period. This symptom is not a diagnostic criterion for any of the other Hemovigilance categories and merits further characterization to determine whether blood product transfusion could be the cause of the chest pain. Larger observational studies to power clinical characterization could help to further inform hypotheses regarding a transfusion‐related mechanism, which could be interrogated by translational research studies.
Transfusion Practice
CP265
A 1:1 Blood Component Transfusion Ratio during Liver Transplantation Decreases Blood Utilization
Monica B. Pagano*1, Ryan A. Metcalf1, John Hess2, James D. Perkins3 and Martin I Montenovo4
1Division of Transfusion Medicine, University of Washington, 2Division of Transfusion Medicine, Harborview Medical Center, 3Department of Surgery, University of Washington, 4Division of Transplant Surgery, University of Washington
Background/Case Studies: During massive transfusion, the volume ratio of administered plasma (PL Vol) to RBC (RBC Vol) appears to be associated with reduced blood utilization and improved survival. The aim of this study is to evaluate the optimal transfusion threshold that decreases blood utilization in the setting of liver transplantation.
Study Design/Method: This is a retrospective study of liver transplants performed at a single institution from January 2013 through December 2015. Patients receiving at least 500mL of red blood cells were included in the analysis. Two models were used to calculate the ratios: A) PL Vol/RBC Vol, and B) [PL + PLT (platelet)] Vol/RBC Vol. Patients transfused with ≤0.83:1 ratio (low ratio) were compared to patients transfused with a ≥1:1 ratio (high ratio), considered the reference group. Multivariable analysis of pre‐operative factors was performed to identify factors associated with intraoperative RBC use. A generalized linear regression with normal distribution and Ridge estimation method with leave‐one‐out validation method was used for the analysis.
Results/Finding: A total of 188 patients were identified. Factors that were associated with increased blood loss included male gender, moderate ascites, spontaneous bacterial peritonitis, pre‐operative hemodialysis, MELD score, pre‐op bilirubin, hemoglobin and international normalized ratio (INR). When comparing RBC volume transfused using model A, the low plasma ratio demonstrated an excess RBC transfusion of 1213ml (p<0.0001) and 1230ml (p<0.0001), in the univariate and multivariate analysis, respectively. When comparing RBC volume transfused using model B, the low plasma ratio demonstrated an excess RBC transfusion of 546ml (p=0.05) and 687ml (p=0.02) in the univariate and multivariate analysis, respectively.
Conclusion: In patients undergoing liver transplantation the transfusion of plasma to RBC ratio ≥ 1 decreases the need of RBC transfusions. This benefit is more significant when the plasma contained in platelet units is included in the equation. These findings should be confirmed in prospective studies.
TABLE 1. Univariate and multivariate analysis
| Univariate analysis | Multivariate analysis | |||||
|---|---|---|---|---|---|---|
| Variable | Estimated blood loss | Confidential interval (5%‐95%) | P | Estimated blood loss | Confidential interval (5%‐95%) | P |
| Age, yrs | ‐173.9 | ‐360.8 ‐13 | 0.07 | |||
| Gender, male | ‐597.9 | ‐1035.8 – (‐160) | 0.007 | |||
| Hepatocellular carcinoma | ‐719.7 | ‐1153.5 – (‐285.9) | 0.001 | |||
| Ascites | ||||||
| No | Reference | |||||
| Slight | 562.8 | ‐40 – 1165.6 | 0.07 | |||
| Moderate | 824.1 | 454.2 – 1194 | <0.0001 | |||
| SBP | 971.5 | 535.3 – 1407.7 | <0.0001 | 565.5 | 196 – 935.1 | 0.003 |
| Pre‐op Hemodyalisis | 851.5 | 443.4 – 1259.6 | <0.0001 | 351.4 | 16.4 – 686.4 | 0.04 |
| MELD Score | 417.1 | 213.1 – 621.2 | <0.0001 | |||
| Pre‐op Bilirubin | 251.5 | 50.2 – 452.8 | 0.01 | |||
| Pre‐Hemoglobin | ‐406.4 | ‐643.6 – (‐169.2) | 0.001 | |||
| Pre‐INR | 359.5 | 185.3 – 533.8 | <0.0001 | 329.5 | 170 – 489 | <0.0001 |
| Transfusion Ratio | ||||||
| ≥1:1 | Reference | |||||
| PL:RBC ≤ 0.83 | 1213.3 | 737.2 – 1689.4 | <0.0001 | 1229.6 | 785.8 – 1673.4 | <0.0001 |
| (PL+PLT):RBC ≤ 0.83 | 546.1 | 0.5 – 1091.7 | 0.05 | 686.9 | 250 ‐ 1124 | 0.002 |
All continuous variables were standardized before undergoing ridge regression
CP266
A Case of Suspected Streptococcus Pneumoniae Hemolytic Uremic Syndrome (pHUS) with Utilization of Minor Crossmatching for Platelet Blood Products Lead to a Diagnosis of Atypical Hemolytic Uremic Syndrome (aHUS)
Yi Tat Tong*, Suhair Al‐Salihi, Yu Bai, Hlaing Tint, Kimberly Klein and Brian Castillo
University of Texas Health sciences center at Houston
Background/Case Studies: Thrombotic microangiopathy (TMA) in children is most commonly seen in the form of hemolytic uremic syndrome (HUS). However, TMA may be seen in the presence of Streptococcus pneumoniae (SPN). The action of bacterial neuraminidase of SPN results in exposure of the normally “hidden” Thomsen‐Freidenreich antigen (T‐antigen) found on erythrocytes and other tissues. Ultimately, this may lead to SPN induced hemolytic uremic syndrome (pHUS) with subsequent hemolysis and end organ damage by naturally occurring anti‐T antibodies against the exposed T antigen. Specific lectins or anti‐sera can confirm exposure of the T antigens in pHUS. Alternatively, pHUS can be identified by minor crossmatch incompatibility resulting from agglutination of exposed T antigens on recipient's erythrocytes to anti‐T antibodies in the plasma portion of blood products. We present a case of suspected pHUS that resulted in a compatible minor crossmatch leading to concern and eventually diagnosis of atypical HUS (aHUS).
Study Design/Method: A 6 months old boy presented with respiratory failure. He was found to have blood cultures positive for SPN as well as hemolytic anemia, thrombocytopenia, and acute renal failure. He was Shiga toxin negative and had normal levels of ADAMTS 13. Based on the findings, the clinical team was concerned for pHUS. Therefore, he received washed erythrocytes. For his thrombocytopenia, our institution does not routinely provide washed platelets due to decrease quality of the platelet product. As a result, a minor crossmatching was suggested and performed to determine if T activation was present.
Results/Finding: Minor crossmatch was performed with patient's erythrocytes and plasma of ABO‐identical platelets to be transfused. No agglutination was seen at immediate spin, 37 degree, or anti‐human globulin phase. Check cells were found to be 2+. These findings were conveyed to the clinical team and platelets were issued without washing. Due to the lack of identification of T activation by minor crossmatching and poor clinical response despite appropriate antibiotic treatment, additional studies were performed by the primary team for complement mutations and found to be consistent with aHUS. The patient was then treated with Eculizumab with clinical and laboratory improvement.
Conclusion: We present a case clinically consistent with pHUS. Confirmation of this diagnosis is done with lectins or anti‐sera that are not readily available. An alternative means of identifying pHUS is by minor crossmatch incompatibility. By demonstrating minor crossmatch compatibility, we further elucidated a definitive diagnosis of aHUS with appropriate management.
CP267
A Case Report of Passenger Lymphocyte Syndrome Derived Anti‐B Reactivity after Liver Transplantation
Phandee Watanaboonyongcharoen*1, Sunisa Onpuns1, Jettawan Siriaksorn1, Voranush Chongsrisawat2 and Ponlapat Rojnuckarin2
1King Chulalongkorn Memorial Hospital, 2Chulalongkorn University
Background/Case Studies: A 9‐month‐old female infant with biliary atresia underwent a successful living donor liver transplant from her father. The patient and donor had blood group B+ and O+, respectively. Her baseline hemoglobin (Hb) was 8.3g/dL. She received 30mL/kg (total 230mL) of B+ red blood cell (RBC) transfusion intraoperatively. Her immunosuppressive treatment was tacrolimus and prednisolone. On postoperative day (POD) 7, the patient‘s recovery was complicated by culture‐proven Elizabethkingia Meningoseptica septicemia, followed by Acinetobactor Baumanii from the tip of central line. The patient developed respiratory failure requiring intubation. As shown in the Table, RBC transfusion was given on POD 7 and 10 with an appropriate response. Hb dropped to 6.2g/dL without bleeding and B+ RBC was given on POD 12 and 16 without a proper increment of Hb level. RBC transfusion was requested again on POD 16. The crossmatch result was incompatible with B+ RBC.
Study Design/Method: ABO grouping and antibody screening were repeated by tube method. Direct antiglobulin test (DAT) and elution test were performed.
Results/Finding: Serological testing on POD 16 revealed anti‐B (1+) in patient's plasma. Antibody screening was negative by tube test. A positive DAT with IgG (2+) was detected using gel agglutination technique. Elution demonstrated that the patient's red cells were sensitized by anti‐B from donor. Anti‐B titer of the eluate was 4 on indirect antiglobulin test (IAT) and negative at room temperature. A diagnosis of passenger lymphocyte syndrome (PLS) was made. One dose of O+ RBC was given. The patient's sample from POD 12 was retested for DAT. The DAT was positive for IgG (1+) and complement C3d (1+). Anti‐B was eluted from her RBCs but undetectable in her plasma.
Due to the subtherapeutic level of tacrolimus, cyclosporine was used instead on POD 19. The patient was subsequently transfused with 1 dose of O+ RBC each on POD 22 and 23. Acute graft rejection was suspected on POD 30 and the immunosuppressive drugs was adjusted. Two months after transplantation, her Hb was 12.2g/dL with no evidence of ongoing hemolysis.
Conclusion: A rare immune hemolysis from IgG anti‐B in pediatric liver transplant was reported. The condition was improved after treatment with transfusion. PLS should be considered in unexplained anemia following solid organ transplantation. DAT and elution test should be performed in such cases for earlier diagnosis and prompt management.
TABLE 1. Hb pre‐ and post‐transfusion
| Postoperative day | DAT/elution | Anti‐B in Plasma | Crossmatch with B+ RBC | Hb pre‐transfusion (g/dL) | Hb post‐transfusion (g/dL) |
|---|---|---|---|---|---|
| 7 | ‐ | ‐ | Compatible | 8.0 | 10.2 |
| 10 | ‐ | ‐ | Compatible | 7.5 | 8.9 |
| 12 | 1+/Anti‐B | ‐ | Compatible | 6.2 | 6.5 |
| 16 | 2+/Anti‐B | 1+ | Incompatible | 6.0 | 5.9 |
CP268
A Liver Transplant Patient with Massive Transfusion Requirements Necessitating ABO Switch
Laurence M. Briski*, Charles Harmon, Sheri Hugan and Laura Cooling
University of Michigan
Background/Case Studies: Orthotopic liver transplantation (OLT) is a complex and technically challenging procedure that can be complicated by severe intraoperative bleeding. We report a case of massive transfusion in an OLT patient necessitating an ABO blood group switch (from O+ to A+) to sustain transfusion support and minimum group O RBC inventories.
Study Design/Methods: Type & screen (TS, gel) and anti‐A titers (tube) were performed using routine methods. A chart review was performed for pertinent medical and laboratory findings.
Results/Findings: The patient was a 63‐year‐old O+ man with cirrhosis secondary to nonalcoholic steatohepatitis and alpha‐1 antitrypsin deficiency who presented for OLT (donor O+). During OLT, the patient endured substantial bleeding from retroperitoneal collateral vessels complicated by post‐transplant coagulopathy. He required rapid high volume RBC and plasma support, which strained hospital inventories. After receiving 46 units of O+ RBCs and 26 units of O+ plasma with ongoing severe hemorrhage, he was switched to group A products. Ten units of A+ plasma were transfused to wash out anti‐A antibody prior to transfusion of A+ RBCs. Due to difficulty controlling the bleeding, biliary reconstruction and fascial closure were delayed for 7 hours post‐transplant. The patient's total estimated blood loss was >20L. He received a total of 71 units of RBCs (including 23 A+), 63 units of plasma (including 37 A+), 6 units of cryoprecipitate, and 9 units of platelets. Towards the end of the second procedure, the patient's hemorrhage was stabilized and the final two RBC units he received were O+. On postoperative day (POD) 1, a TS showed predominantly A+ RBCs with trace O+ RBCs, as well as very low anti‐A IgM and IgG titers (Table 1). He received two additional O+ RBC units (1 each on POD 4 and POD 12) with increasing O+ RBCs on TS and rising anti‐A titers. His blood type was unequivocally O+ by POD 13. The patient showed recovery of liver synthetic function on POD 1 (Factor 5 activity = 58%) complicated by cholestasis.
TABLE 1. CP268
| Pre‐Op | POD 1 | POD 4‐8 | POD 13 | |
|---|---|---|---|---|
| Anti‐A | 0 | Mixed Field | Mixed Field | 0 |
| Anti‐B | 0 | 0 | 0 | 0 |
| A1 RBCs | 4+ | 0 | 2+ | 4+ |
| B RBCs | 4+ | 4+ | 4+ | 4+ |
| Anti‐A IgM titer | 128 | 1 | 1 | 64 |
| Anti‐A IgG titer | 512 | 4 | 16 | 256 |
| Hemoglobin (g/dL) | 8.7 | 7.7 | 6.8 | 7.4 |
Conclusion: This study shows successful switching of a group O patient to group A in the setting of rapid hemorrhage and massive transfusion. By POD 13, the patient had reverted to O+ with recovery of anti‐A titers. At 3 months post‐OLT, the patient is alive with signs of improving biliary graft function.
CP269
A New RFID Transfusion Safety System
Anna Millan*1, Alfred Mingo1, Maria Isabel Gonzalez1, Antoni Mena2 and Juan Pedro Benitez2
1BST, 2AT‐Biotech
Background/Case Studies: A new Transfusion Safety System (TSS), based on processes and technologies, especially, identification by radio frequency (RFID), is currently implemented in two hospitals, a general one (H1) and an Oncology center (H2). The TSS is fully effective in protecting against incidents, and specifically offers mechanisms to detect near misses (NM) by using procedural and physical barriers, assuring that the pretransfusional sample extraction (PSE) and the blood components administration (BCA) only take place at bed side, using a location control and interacting with the clinical and transfusion information systems (TIS). The TSS allows to analyze the transfusional activity information in real time to project organizational changes in both transfusion services and hospital units, and to create a new classification of NM.
Study Design/Method: Retrospective analysis of 2016 transfusion activity in both H1 and H2 shows 7970 PSE and 12572 BCA, out of 13163 and 20676 respectively, since the TSS deployment in 2015. Retrospective analysis and classification of 6700 security events has been done.
Results/Finding: Activity results for both hospitals are shown in the table below.
TABLE 1. Results
| H1 | H2 | |||
|---|---|---|---|---|
| Activity | ||||
| PSE | 6291 (median: 17,24/day) | 1679 (median: 4,6/day) | ||
| BCA | 9217 (median: 25,25/day) | 3355 (median: 9,19/day) | ||
| Location | ||||
| BCA | Oncology/Hematology | 14,07% | Brachytherapy | 1% |
| Emergency room | 24,11% | Palliative cures | 4% | |
| Hospitalization | 31,65% | Day hospital | 23% | |
| Intensive Care | 5,33% | Oncology | 10% | |
| Surgery unit | 24,85% | Emergency room | 32% | |
| Hematology | 30% | |||
| Shifts | ||||
| BCA | 8‐15h | 39% | 8‐15h | 20% |
| 15‐22h | 43% | 15‐22 | 66% | |
| 22‐08h | 17% | 22‐08h | 14% | |
The safety events have been classified in pretransfusion sample extraction (PSE), blood component assignment (BCAS) in the transfusion service and blood component administration (BCA) near misses (NM). For H1, NM related to PSE accounted for 42.39% of all, being the mistake in concordance between patient identification and prescription order the most frequent (52.03%). The NM detected in BCAS were 12.1% of all and mostly (74.52%) occur when the patient information in the TIS does not match the one registered in the TSS. The NM detected in BCA are 45.51% of all and mostly (36%) the systems detects a not assigned bracelet. For H2, NM related to PSE accounted for the 47.49% of all, being the error in concordance between the transfusion security number in the bracelet and in pretransfusion sample the most frequent (65.84%). The NM detected in BCAS accounts for 24.48% of all and in 69.08% occurs when the patient information in the TIS does not match with the one registered in the TSS. The NM detected in BCA are 28.02% of all and in 65.61% of them the blood components were assigned to another patient.
Conclusion: The analysis of the transfusion activity information in real time allows implementing organizational changes, adjusting the work load using the timing and location information registered. TSS allows defining new NM related to the correct transfusion prescription, the correct matching of the patient transfusion order with the patient pretransfusion sample and correct assignment of the blood component to the patient. The knowledge of these new NM will allow designing new transfusion safety indicators.
CP270
Alloantibody Responder Status Fails to Predict Immune Response to Pneumovax
Kinjal Shah*1, Clifford Sullivan1, Jennifer Stowell1, Christina L Dean1, Paula Jessup2, Morgan McLemore1, Fuad El Rassi1, Sean Stowell1 and Ross Fasano1
1Emory University School of Medicine, 2Grady Memorial Hospital
Background/Case Studies: Chronic RBC transfusion therapy can induce RBC alloimmunization in patients with sickle cell disease (SCD). While alloantibody formation can directly contribute to the morbidity and mortality of patients with SCD, not all patients develop RBC alloantibodies following RBC transfusion. Despite this, the factors that contribute to RBC alloimmunization remain incompletely understood. Recent studies suggest that alloantibody responders possess an inherently distinct immune system that directly contributes to alloantibody formation. Given these differences in general immune function, RBC alloantigen responding and non‐responding patients may predict immune responses to other antigens, such as those encountered during vaccination. To test this, we examined antibody titers in patients before and after vaccination against Streptococcus pneumonia (SP) and determined whether responder/non‐responder status predicted the overall vaccine immune response.
Study Design/Methods: Chart review was performed on SCD patients receiving Pneumovax (PPV23) as a part of their routine preventive care in an outpatient sickle cell clinic. Pre‐vaccination and post vaccination SP IgG titers to 14 SP serotypes (1,3,4,5,8,9,12,14,19,23,26,51,56,68) were analyzed via a commercially available ELISA. Comparison of adequate response to PPV23, defined as ≥ 2 mcg/mL for >7 serotypes, was perform based on alloimmunization status. Statistical significance was determined by comparing means of subgroups using paired and non‐paired t‐tests.
Results/Findings: Pre‐vaccine SP titers were available in 72 patients (alloimmunized, 15); pre‐ and post‐ vaccine titers were available for 19 patients (alloimmunized, 6). Of the 72 patients, 25 were on chronic transfusions, 24 were on hydroxyurea, 11 were surgical splenectomized, 58 patients had no history of surgical splenectomy or status was unknown. Forty‐four patients had a previous history of PPV23 in the previous 10 years; 9/44 also reported previous history 13‐valent SP conjugate vaccine within the last 5 years. Baseline pre‐vaccination titers (N=72) showed no difference between alloimmunized and non‐alloimmunized patients (all p‐values >0.13). In the group with pre‐ and post‐vaccination (N=19) titers available, 11 out of 13 (85%) non alloimmunized patients had an adequate response versus 4 out of 6 in the alloimmunized group (67%, p =NS). All vaccinated patients developed a statistically significant response to all SP serotypes (all p‐values <0.03), except serotype 12 (p=0.22). There was no difference in absolute post‐vaccination titers (all p‐values >0.17) or change from pre‐vaccination titers (all p‐values > 0.16) for each serotype based on responder status.
Conclusion: Our preliminary results demonstrate that there is no difference in vaccine response to PPV23 based on responder status. However, immune response to other antigens needs to be evaluated to determine the extent to which this lack of correlation generally reflects immune reactivity with other non‐RBC antigens.
CP271
Benchmarking Transfusion‐Related Errors That Occur from “Vein‐to‐Vein”, I.e., from Sample Collection to Transfusion, and Assess Their Impact on Patient Safety
Elena Nedelcu1, Quentin Eichbaum1, Shelia Garret2, Hannah Harmsen2 and Pampee Young*1
1Vanderbilt University Medical Center, Department of Pathology, Microbiology and Immunology, 2Vanderbilt
Background/Case Studies: Blood transfusion is the most common procedure performed in the hospital setting and the transfusion process is monitored to ensure regulatory compliance. To safeguard safety, efficacy and regulatory compliance, transfusion services actively benchmark transfusion‐related errors (TREs) as they occur from “vein‐to‐vein”, i.e. from collection of pre‐transfusion sample to final infusion of product ‐ with the goal of ensuring that the right product/dose goes to the right patient at the right time. Multiple over‐lapping error documentation processes are needed to capture and report TREs from within and outside of Blood Bank (BB). We present a comprehensive error management program along with data on five years of benchmarking TREs at a large academic medical center.
Study Design/Method: TREs were detected by capturing and reporting of sample suitability, testing variances and biologic product deviations. In addition, TREs as observed and reported by providers and clinical staff (i.e. blood delays/undertransfusions, transfusions without consent, infusions with wrong fluids) were reported to the BB and hospital quality through the Veritas system, a hospital based reporting system that enables reporting any occurrence with potential for causing patient harm. All serious errors were reviewed daily and summation of TREs was discussed on a monthly basis. Mapping TREs within the “vein‐to‐vein” was performed by reviewing the five‐year of transfusion medicine quality records (from 2012 to 2016). Patient harm events recorded within the Veritas system from January to July 2016 were investigated in depth. Transfusion reactions were excluded in this analysis.
Results/Finding: An average of 114 TREs per month and 1300 per year were found over five years. 81% of TREs are associated with pre‐BB activities, 10% occur within BB, and 9% are post‐BB events. Sample collection and handling represent 80% of total TREs. Most TREs (96%) were reported by BB staff, 4% were reported by non‐BB staff. Patient harm analysis revealed an average of four Level 0 (near miss), three Level 1 (no known harm), and 0.3 Level 2 (patient harm) per month. No deaths related to TRE were detected over the seven month January to July 2016 period. Patient harm was associated with TREs occurring in the BB (17%) and post‐BB (83%). These events were reported externally (78%) and by BB staff (22%).
Conclusion: Although most TREs were detected in the pre‐BB phase, no patient harm was associated with these events indicating an efficient capture prior to causing patient harm. The TREs causing patient harm, including near miss events, were mostly reported externally and they occurred entirely in the post‐BB and BB phases. These results suggest that significant opportunities for quality improvement may be achieved in two areas: the pre‐BB phase aimed at reduction of waste associated with sample collection and handling, and the post‐BB and BB phases aimed at improving TRE detection and decreasing patient harm.
CP272
Blood Product Transfusion Characterization at a Moderate‐Sized Academic Hospital
Christopher Anh Khoa Vo*, Daniel Farrell and Minh‐Ha Tran
University of California, Irvine School of Medicine
Background/Case Studies: Use of restrictive transfusion thresholds among otherwise stable patients is a key component of evidence‐based transfusion practice. We sought to assess the degree of adherence to these thresholds for various blood products in our medium‐sized academic medical center as well as to help characterize our transfusion practices amongst different medical and surgical specialties.
Study Design/Method: A database was created by hospital informatics using Electronic Medical Record based physician blood product ordering. A total of ‘x’ orders for ‘y’ products were evaluable for the period Aug 2015 – Dec 2016. Orders were eligible for assessment if preceded within 12 hours by a relevant laboratory result. Data was imported into Tableau (version) (Tableau, Seattle, WA) and analyzed by proportion adherent orders for red blood cells (RBC), plasma, platelets, and CRYO. Primary endpoints included: proportion of evaluable RBC transfusions occuring at < 7g/dL, proportion of platelets transfusions occurring at >10K/mcL, proportion of plasma transfusions occurring at INR >1.6, and proportion of cryoprecipitate transfusions occurring at fibrinogen > 110mg/dL.
Results/Finding: Over an 18‐month period, 11.56% of RBC occurred at a Hb >7g/dL, 15.82% of plasma occurred at INR <1.6, 10.34% of CRYO at fibrinogen >110mg/dL, 54.69% at platelet count > 10K/mcL.
Conclusion: Our dataset represented over 10,000 blood products administered over the study period. We found that for evaluable orders >80% complied with thresholds for RBC, plasma, and CRYO transfusion. Over 50% of platelet orders occurred at a platelet count >10K/mcL.
CP273
Blood Product Utilization and Wastage Rates during Pregnancy‐Related Hemorrhage
Mark Yazer*1, Jansen N Seheult2, Jonathan Waters1 and on behalf of the Biomedical Excellence for Safer Transfusion (BEST) Collaborative3
1University of Pittsburgh, 2Department of Pathology, University of Pittsburgh Medical Center, 3Dartmouth‐Hitchcock Medical Center
Background/Case Studies: Uncrossmatched red blood cells (RBC) and emergency issued platelets (PLT), plasma and cryoprecipitate (CRYO) are lifesaving in a bleeding patient without a valid type and screen. Collectively termed “emergently issued products” they are issued as a bridge until pre‐transfusion testing is completed. This study evaluated the utilization and wastage rates of blood products during pregnancy‐related hemorrhage where the first products issued were emergently issued.
Study Design/Methods: A list of patients on whom blood products had been emergently issued between January 1, 2013 and March 28, 2017 was obtained from the blood bank at a regional maternity care hospital. Patients who were not experiencing a pregnancy‐related bleed (e.g., postpartum hemorrhage or bleeding relating to a complication of pregnancy such as a ruptured ectopic pregnancy or bleeding post spontaneous or therapeutic abortion) were excluded. The total number of products (emergently issued plus crossmatched or non‐emergently issued products) that were transfused, returned back into the blood bank's inventory, and wasted within 6 hours of the first emergently issued products were enumerated. Apheresis PLT units were multiplied by 5 and added to the number of individual whole blood PLTs; apheresis plasma units were multiplied by 2 and added to the number of whole blood plasma units.
Results/Findings: Seventy women who received emergently issued blood products during a pregnancy‐related hemorrhage were identified. Average age was 31.1 ± 6.3 years. Most common indications for requiring transfusions were PPH of unspecified etiology (33%), placental issues (29%), uterine atony (16%). Of the 641 RBCs that were issued on these patients in the first 6 hours after the first emergently issued products, 264 units (41%) were transfused, 375 units (59%) were returned, and 2 units (0.3%) were wasted. There were a total of 301 whole blood PLT equivalents issued to these women, which equals approximately 75 doses; of these whole blood PLT equivalents, 198/301 units (66%, approximately 50 doses) were transfused, while 85 units (28%, approximately 21 doses) were returned and 18 units (6%, approximately 4 doses) were wasted. Of the 478 plasma units issued, 264 units (55%) were transfused, 212 units (44%) were returned and 2 units (0.4%) were wasted, while 96% of the 209 individual CRYO units (∼53 doses) were transfused and 4% were wasted. RBCs were issued on 69 patients and 60/69 (87%) of the patients on whom RBCs were issued received at least one unit, while 30/44 (68%) of the patients on whom PLTs were issued received at least one dose. Similarly for plasma 41/51 (80%) of the patients on whom plasma was issued received at least one unit, while all 18 patients on whom CRYO was issued received at least one dose. In this 6 hour period, the mean RBC:Plasma ratio was 0.89 ± 0.42, and the mean RBC:PLT ratio was 1.04 ± 0.82.
Conclusion: The majority of these patients with pregnancy‐related hemorrhage who received at least one unit of emergently issued blood products received at least one unit of the product that was issued to them and few units were wasted. That PLT wastage was higher than the other products was likely due to the 4‐hour post‐pooling room temperature shelf life. Keeping wastage rates low while meeting the clinical needs of these patients is the ideal situation for the blood bank.
CP274
Comparison of Clinical Efficacy and Safety of the Pathogen Reduced and γ–Irradiated Platelet Concentrates
Muhayyokhon Azimova*, Gennadiy Galstyan, Tatjana Gaponova, Mihail Drokov, Igor Dubinkin, Vladimir Zhuravlev and Elena Mihaylova
Federal State‐Funded Institution National Research Center for Hematology of the Ministry of Healthcare of the Russian Federation
Background/Case Studies: Platelet inactivation allows increasing infectious and immunological safety of the platelet concentrates (PCs) transfusions. The use of pathogen inactivation excludes the requirement for gamma‐irradiation of PCs. The aim of this work was to compare the efficacy and safety transfusions of pathogen reduced PCs and γ–irradiated PCs.
Study Design/Methods: All leukoreduced PCs were suspended in 100% donor plasma. The median PC collection target was 5 x 10¹¹ platelets. PCs were divided in two groups. PCs from the first group (n = 107) were γ‐irradiated at a dose of 25 Gy (25GyPCs). PCs from the second group (n = 205) were treated by INTERCEPT Blood System Platelet (amotosalen+ ultraviolet A light) technology (PRPCs). In total, 106 thrombocytopenic (according WHO grading system 1‐2 grade) patients (58 men, 48 women, age from 17 to 83 years, median 36 years) received PC transfusions for prophylaxis and treatment of the hemorrhagic syndrome. The causes of thrombocytopenia were aplastic anemia (n=28), acute leukemia (n=60), lymphoma (n=18). Efficacy of PCs was assessed by corrected count increment (CCI) of platelets after 1 hour (CCI1) and 24 hours (CCI24) after PC transfusion, as well as increasing of the maximal amplitude (MA) 1 hour after transfusion (MA1) on the thromboelastography. The safety of the transfusion was assessed by the incidence of the post‐transfusion complications within 24h. A successful transfusion PC is considered as CCI1 >7.5 and CCI24 > 4.5, MA1 ≥44mm, also decrease of the severity of bleeding in therapeutic transfusions were assessed.
Results/Findings: In total, we analyzed 312 transfusions PCs (165 prophylactic and therapeutic 147 transfusions). Patient blood platelets were higher before prophylactic than therapeutic transfusions (18х109/l vs. 14х109/l, p=0.029). There were no significant differences in the frequency of effective therapeutic (55% vs. 72%, p=0.1) and prophylactic (63% vs. 54%, p=0.09) transfusions between the PRCs and 25GyPCs. We did not find significant differences between PRCs and 25GyPCs in CCI1 after prophylactic (16.0 ± 7.1 vs. 19.2 ± 8.7) and therapeutic (11.3 ± 9.0 vs. 11.8 ± 5.8) transfusions, in CC24 after prophylactic (20.0 ± 9.2 vs. 22.5 ± 12.8) and therapeutic (13.3 ± 8.9 vs. 13.9 ± 8.) transfusions. There were no significant differences between PRCs and 25GyPCs also in MA1 after prophylactic (62.2 ± 8.5 vs. 60 ± 8.5, p=0.7) and therapeutic (61.3 ± 9.9 vs. 60.9 ± 12.7, p=0.08) PC transfusions. Reduction of the severity of bleeds was obtained in 78 (86%) of the 91 cases after PRPC transfusions and in 51 (84%) of 61 cases after 25GyPC transfusions. There were no significant differences in the frequency of adverse post‐transfusion reactions between the groups (respectively, 3 and 2 cases).
Conclusion: PCs after the PI have equal efficacy with PCs, treated with γ‐irradiation.
CP275
Correction of a Potentially Harmful Error in an Electronic Bedside Transfusion Process to Maintain Patient Safety
Sophie Staples*1, Edward Fraser2, Clare O'Callaghan2,3, Julie Staves2, Alan Cook2,3 and Mike Murphy1,2
1Oxford NIHR Biomedical Research Centre, 2Oxford University Hospitals NHS Foundation Trust, 3Haemonetics Corporation
Background/Case Studies: An ‘end‐to‐end’ electronic transfusion management process including a bedside administration system was developed and implemented in this large multi‐site academic center in 2006. It enables the safe administration of blood components at the patient bedside and provides an audit trail for all blood components.
An error was identified in the electronic bedside transfusion process which was reported to our national hemovigilance scheme in 2014 under the category ‘errors relating to information technology’. This error was the incorrect use of the emergency transfusion process for non‐emergency transfusions. The standard (non‐emergency) process requires a scan of the barcode on the patient's wristband containing their identification details which is verified against the same details from the barcode on the compatibility label attached to the blood bag. The emergency transfusion option is only intended for use with ‘emergency group O RhD negative blood units’ which, unlike non‐emergency units allocated to specific patients, do not have a compatibility label. The emergency transfusion option skips the compatibility label barcode scan as the emergency units can be transfused to any patient needing urgent transfusion. It was found that the emergency blood option was being misused for non‐emergency transfusions, leading to blood units not being checked to ensure they were for the correct patient.
Study Design/Method: This center worked with the software supplier to develop a solution which corrects the weakness in the process. The revised process involves providing a universal compatibility label for emergency units so that all units (emergency and non‐emergency) require a scan of the compatibility label on the blood bag and the patient's wristband at the bedside before transfusion. The use of the emergency process was audited pre and post implementation of the new process to determine whether it was being used correctly or not.
Results/Finding: There were 593 units administered using the emergency transfusion process in the 3 months before the change was implemented. It was found that 51/593 (9%) units were non‐emergency units administered incorrectly without a bedside compatibility check. Following the implementation of the change there were no instances of incorrect administration of non‐emergency units in the next month (2530 components administered), 109/2530 (4%) were emergency units which were administered correctly. Users of the system reported the revised process was quicker, safer and unified with other functions on the device.
Conclusion: The improved process for the administration of blood in an emergency now prevents users from following the incorrect procedure for non‐emergency transfusions and missing the essential final bedside electronic check. This report indicates the need for continued vigilance of the functionality of electronic transfusion processes, and the correction of any weaknesses compromising patient safety.
CP276
Determining the Factors for Reassessment after Transfusion: A Canadian Survey
Andrew Wei‐Yeh Shih*1, Shannon Lane2, Rebecca Barty2, Mark Crowther2 and Nancy M Heddle2
1Vancouver Coastal Health Authority, 2McMaster University
Background/Case Studies: Recent recommendations indicate one red blood cell (RBC) unit should be transfused at a time with reassessment after each transfusion to determine the need for more. However, the practices of Canadian transfusion medicine (TM) experts and what constitutes a reassessment are unknown. Therefore, we conducted a survey of TM experts across Canada to gather information on their practices and criteria for reassessment.
Study Design/Method: TM experts were identified and contact information obtained from the Canadian National Advisory Committee (NAC) and from contacting least one TM expert per province. Each respondent was assigned a unique study ID after consenting to the survey, allowing for anonymity on analysis. The survey contained demographics, general practice questions, and questions regarding transfusion in: 1) a stable anemic inpatient, 2) a stable anemic inpatient to be discharged, and 3) an asymptomatic post‐operative inpatient.
Results/Finding: We identified 67 Canadian TM experts: 48 (71.6%) provided a response and most had a primary place of practice in a laboratory setting (38/48; 79.2%). For a stable, non‐bleeding, anemic inpatient, 87.5% of respondents recommended transfusing one RBC unit, then reassessing. Recommendations were more variable in outpatient settings, with 31.2% generally recommending transfusing two RBC units then reassessing. Recommendations for reassessment were mainly functional status/symptoms and vitals within a short time period (1‐2 hours), a repeat hemoglobin >18 hours later dependent on the clinical scenario, and a search for an underlying cause of anemia in outpatient settings. Lab practitioners emphasized volume status, cardiac examination, and transfusion at lower hemoglobin thresholds. With an asymptomatic patient to be discharged, fewer respondents chose to transfuse (38.1%) compared to an inpatient potentially symptomatic due to anemia (72.1%). None of the respondents suggested transfusion in an asymptomatic post‐operative patient who had a hemoglobin trending down.
Conclusion: TM experts generally recommend transfusing one unit at a time in stable inpatients. Assessment for transfusion should focus on patient symptoms, pertinent physical exam, hemoglobin levels, and an underlying cause. “Top‐up” transfusions were not recommended. These recommendations may help guide clinicians, but further research is needed to generate higher quality evidence around the clinical benefits and cost effectiveness of these practices.
CP277
Development of GMP Protocol for the Evaluation of Biotinylated Red Blood Cell Recovery after Transfusion
Tamir Kanias*1, Catherine J Dennis2, E. Michael Meyer2, Linda Moore2, Derek Sinchar1, Darrell Triulzi3, Joseph E Kiss4, Mark T Gladwin1 and Albert D Donnenberg2
1Vascular Medicine Institute, University of Pittsburgh, 2University of Pittsburgh Cancer Institute, 3Institute For Transfusion Medicine, 4Division of Hematology/Oncology, University of Pittsburgh
Background/Case Studies: Current evaluation of red blood cell (RBC) post transfusion recovery is based on ex vivo labeling of stored RBCs with radioactive chromium‐51 (51Cr). This method has several limitations including the risks associated with radioactivity, and the inability to evaluate multiple RBC populations in the recipient. RBC labeling with s‐NHS‐biotin (Bio‐RBCs) overcomes many of these limitations and offers safe and longitudinal tracking of multiple transfused RBCs in vivo. The purpose of this study was to scale up and optimize the biotinylation procedures to the current Good Manufacturing Practice (GMP) environment.
Study Design/Method: Packed RBC units (n=14) were divided into two 150mL aliquots, which were labeled with selected concentrations of s‐NHS‐biotin (3 and 30 μg/mL) in a CGMP closed system (average Bio‐RBCs hematocrit of 38.4 ± 1.6%). Optimization of labeling efficacy was determined by flow cytometric analysis of Bio‐RBCs using fluorochrome‐conjugated streptavidin (SA). Approximately 2 million RBCs were measured in triplicate. Quantum Simply Cellular Beads were used to quantify fluorochrome (molecules of equivalent soluble fluorescence, MESF) and infer number of biotin molecules per RBC. The lower limit of detection was determined for RBC labeled with varying amounts of biotin. Product quality and safety were evaluated by endotoxin and sterility testing, and by determining the levels of spontaneous hemolysis before and after RBC biotin labeling.
Results/Finding: Investigation of different fluorochromes, laser excitation wavelengths and laser power to maximize the signal to noise ratio of labeled and unlabeled RBCs revealed that 561nm excitation of phycoerythrin (PE)‐SA and high laser power (150mW) provided the best separation between the two Bio‐RBC populations, and between labeled and unlabeled RBCs. Labeling with 3μg/mL of biotin resulted in ∼50,000 MESF/RBC, and were detectable among unlabeled RBC at a lower limit of detection (LLD, 95% CI) of 1in 380,000 (0.0003%). The LLD95 for RBC labeled with biotin at 30μg/mL was ∼ 1in 1 million (0.0001%). Biotinylation was not associated with increased levels of hemolysis (0.40 ± 0.22% before labeling versus 0.34 ± 0.12% after labeling; p=0.09) or bacterial contamination.
Conclusion: The resulting manufacturing process produces large volumes (150mL/transfusion) of Bio‐RBCs with low risk of contamination or hemolysis. The flow cytometry assay can detect Bio‐RBC in unlabeled blood at very low frequency. We plan to use this technology to study the impact of donor characteristic on RBC storage stability and post‐transfusion survival.
CP278
Does a Hemoglobin‐Based Oxygen Carrier Affect Hemostatic Function?
Michael A. Meledeo*, Grantham C. Peltier, Colby S. McIntosh, Ashley S. Taylor, James A. Bynum, Anthony E. Pusateri and Andrew P Cap
U.S. Army Institute of Surgical Research
Background/Case Studies: Blood products offer resuscitation benefits in trauma over crystalloid/colloid volume expanders (which provide no hemostatic benefit or oxygen delivery), but usage is often hampered by supply or storage needs. Hemoglobin‐based oxygen carriers (HBOCs) are not red cell replacements but may supplement oxygen delivery and expand volume during transport until blood is available. Since hemostasis is critical in resuscitation, this study evaluated bovine hemoglobin glutamer‐250 (HBOC‐201) effects on coagulation parameters alongside freeze‐dried plasma (FDP) in an in vitro model of hemorrhage/resuscitation.
Study Design/Method: Whole blood (WB) was collected from healthy donors under an approved institutional standard operating procedure. In the first study (limited resuscitation), samples were: (1) WB, (2) WB+10% HBOC volume (model of two units in an adult), (3) WB+10% FDP, and (4) WB+10% HBOC+10% FDP. Samples (5)‐(8) simulated autoresuscitation by adding 25% plasmalyte to 1‐4. Susceptibility to lysis was tested with 75ng/ml tissue plasminogen activator (tPA).
Follow‐up studies were performed with severe resuscitation simulations of 50%, 60%, 75%, and 100% volume replacement with HBOC and/or FDP, with or without prior 25% plasmalyte dilution.
Coagulation parameters were obtained with a coagulation analyzer and thromboelastography (TEG). RBCs/hemoglobin were measured on a hematology analyzer. Thrombin generation was quantified by thrombogram. Platelet aggregation was measured in Multiplate and adhesion to collagen under shear in BioFlux. Viscosity was evaluated by rheology.
Results/Finding: A limited resuscitation model with HBOC and/or FDP had no effects on fibrinogen, PT, aPTT, pH, Hct, or hemoglobin. In TEG, WB, WB+HBOC, and WB+HBOC+FDP had reduced clot strength with dilution and tPA. There was increased susceptibility to tPA‐induced lysis between WB and WB+HBOC in autodilution simulation (mean lysis 4.79% vs. 16.36%; p<.05). HBOC and FDP had no statistically significant impact on thrombin generation. No effects on platelet aggregation were observed; no significant differences within diluted v. undiluted groups were seen in platelet adhesion under flow. HBOC (10%) did not significantly change viscosity.
Severe resuscitation simulations had increased PT/PTT and reduced clot strength, particularly in HBOC‐only resuscitation; however, even 75% HBOC volume replacement produced clots with acceptable TEG parameters.
Conclusion: In a limited resuscitation model with HBOC‐201, there were no significant in vitro effects on hemostatic parameters (except increased susceptibility to lysis); more severe resuscitations impacted coagulation parameters but did not prevent clotting. Considering the large impact healthy platelets have on coagulation function, further in vitro studies with impaired platelets are warranted alongside in vivo studies of HBOC+plasma as initial resuscitation of hemorrhagic shock.
CP279
Does Actual Usage of Prothrombin Complex Concentrate Reflect Recommended Indications? Characterization of Usage at a Tertiary Care Center
Paul Pokrandt*1, Sammie Roberts1, Caleb Graham1 and Mary Berg2
1University of Colorado School of Medicine, 2University of Colorado
Background/Case Studies: Four‐factor prothrombin complex concentrate (PCC) is a coagulation factor concentrate prepared from human plasma. In 2013, the FDA approved PCC for the urgent reversal of vitamin K antagonist therapy in patients with acute major bleeding. While published literature has largely focused on the efficacy and safety of PCC, actual usage practices are less characterized. Our aim was to describe the PCC usage practices within a tertiary care center.
Study Design/Method: We conducted a retrospective review of the electronic medical records of patients who received PCC between its addition to our institution's formulary in 8/2013 and 2/2015. We compiled information about the usage of PCC in these patients. Descriptive statistics were generated with Microsoft Excel.
Results/Finding: Of 81 patients, 24 were on warfarin. PCC was most frequently prescribed for hemorrhage due to surgery (43%). PCC was given for warfarin reversal in 31% of cases. A subset of patients received plasma within 2 hours prior to PCC (40%) or 24 hours after (47%). PCC was most frequently ordered in the OR/perioperative service (25%).
Conclusion: The majority of PCC usage was “off‐label” in terms of being prescribed for indications other than warfarin reversal. The most frequent indication was hemorrhage due to surgery, and PCC was most often ordered in the OR/perioperative service. Although guidelines recommend the use of PCC as a plasma alternative, plasma was administered within hours of PCC in a notable subset of patients.
| Characteristics of PCC Administration | Patients (n=81) |
|---|---|
| Sex, n (%) | |
| Female | 34(42) |
| Age(y), mean(SD) | 53.37(16.01) |
| Anticoagulation, n (%) | |
| Warfarin | 24(30) |
| Other | 16(20) |
| INR, median (range) | 2.20(1.0‐ >14.8) |
| Indication for PCC, n (%)* | |
| Hemorrhage due to surgery | 35(43) |
| Hemorrhage due to liver dysfunction | 28(35) |
| Warfarin reversal due to hemorrhage/prior to urgent surgery | 25(31) |
| Coagulopathy reversal due to liver dysfunction | 12(15) |
| Coagulopathy reversal prior to urgent surgery | 9(11) |
| Coagulopathy reversal for other reason | 4(5) |
| Hemorrhage due to non‐warfarin anticoagulant | 4(5) |
| Hemorrhage for other reason, no anticoagulant | 1(1) |
| Patients who received >1 dose of PCC within 24h, n (%) | 4(5) |
| Vitamin K co‐administered, n (%) | 23(28) |
|
Patients who received plasma within 2h prior to PCC, n (%) Plasma (u), median (range) |
32(40) 6(1‐26) |
|
Patients who received plasma within 24h after PCC, n (%) Plasma (u), median (range) |
38(47) 4(1‐92) |
| Department, n (%) | |
| OR/Perioperative Services | 20(25) |
| Emergency | 15(19) |
| Medical ICU | 14(17) |
| CT ICU/Surgical ICU | 12(15) |
| Neuro ICU | 6(7) |
| Transplant Unit | 5(6) |
| Progressive Care/Medical Specialty | 4(5) |
| Cardiac ICU | 3(4) |
*some patients had 2 indications, so this category sums to >100%
CP280
Emergency Transfusion Process Improvement Initiative
Cheryl‐Ann Capers*1, Karafa SW Badjie1, Nydia Matteu2, Carleen Van Siclen3, Elaine Barber4, Misty Oglesby5, Ashley Reid5, Cora Mendoza5, Catina Lewis5, Kelly Johnson5, Deanna Fang1 and Abba Zubair1
1Department of Laboratory Medicine and Pathology, Transfusion Medicine, Mayo Clinic, 2Mayo Clinic Florida, 3Department of Laboratory Medicine and Pathology, Mayo Clinic, 4Department of Laboratory Medicine and Pathology Information Management, Mayo Clinic, 5Department of Nursing, Mayo Clinic
Background/Case Studies: In Emergent situations, when a patient's life may be jeopardized by delaying transfusion, a physician may decide to transfuse blood emergently. However, in some cases, poor communication and lack of clear expectations between the Blood Bank and patient care areas can lead to frustration and delays in the timely provision of blood products. An incident prompted an appraisal of our emergency release protocol (ERP), which revealed gaps in communications and expectations by both the Blood Bank and nursing personnel. Thus, it is imperative that there is a standardized ER protocol with clear communications for both the Blood Bank and Nursing personnel. Reported here is the outcome of a process improvement that resulted in improved communication, expectations, and turnaround (TAT) for our ER protocol.
Study Design/Method: In 2016, several meetings were conducted with stakeholders (Critical care units (ICU), emergency department (ED), internal medicine, interventional radiology (IR) etc.) in an effort to identify process gaps, improve communications, and expectations for ER episodes. The goals was to design a process for emergent blood product request and release in life threatening situations that will; 1) Simplify and expedite the process; 2) improve communication and expectations to decrease TAT; 3) improve patient safety and meet compliance. In order to achieve these goals, a series of activities were conducted. These included meetings with all stakeholders to ensure process improvement meet the needs intended. A series of training sessions with nurse educators in ICU, ED, IR and Surgery managers were conducted. During the meetings, communication goals, and expectations were defined and agreed upon. Training sessions included PowerPoint presentations to educate staff members and performance of dry runs, to identify weaknesses and strengths with the process flow. The impact on the current process was analyzed and, as a result, led to the revision of the current SOP, addition of pre‐labeled Emergency Pack blood (4 units of O Neg RBC's) and implementation of an Electronic Emergency Blood order set.
Results/Finding: In the ten months post implementation of our improved, standardized ER Pack Protocol, A total of 61 ER episodes were received. The average TAT from order to delivery at the bedside was reduced by 50% (7.0 minutes compared to 14 minutes previously), while the compliance rate for ER orders and physician documentation was 100% (61/61), with no current wastage of blood products.
Conclusion: The implementation of the improved standardized ER protocol significantly improved communications and expectations, decreased TAT and delays in transfusions while ensuring patient safety and compliance to regulatory requirements.
CP281
Epidemiology and Outcomes of 30 Massive Transfusion Cases at a Cancer Hospital
Ashok Tholpady*1, James Kelley1, Fernando Martinez1, Emmanuel Barbosa1 and Benjamin Lichtiger2
1UT MD Anderson Cancer Center, 2The University of Texas MD Anderson Cancer Center
Background/Case Studies: Massive transfusion (MT) in the trauma setting has been extensively studied. Yet, the literature in non‐trauma areas, especially oncology is rather sparse. The following study was conducted to understand the background and outcomes of MT in cancer patients.
Study Design/Methods: This was a single center retrospective study performed at a large cancer center between February 2016 ‐ February 2017. MT was defined as the transfusion of ≥ 10 RBC units in a 24‐hour period. The following data were collected included: age, gender, primary diagnosis, surgery or acute care type, amount and type of blood components transfused, whether or not a massive transfusion protocol (MTP) was activated, and survival at 30 days.
Results/Findings: Thirty MTs occurred during a one year period. A total of 192,441 blood products were transfused during that time period. Gender distribution was 21/30 (70%) males, and the average age of all patients was 68 with a range of 21 to 70 years of age. Surgical patients accounted for 26/30 (86.7%) MTs, and 4/30 (13.3%) were critical care patients. Tumor categories included carcinomas (14/30), sarcomas (13/30), leukemias (2/30) and lymphoma (1/30). Resection of tumor followed by complex reconstruction was the cause of the majority of MTs. Metastatic renal cancer (6/30) was the most common disease seen followed by sacral chordoma (4/30). MTPs were activated in only 8/30 (26.7%) cases. Thirty‐day survival was seen in 25/30 (83.3%) patients. Only 1 of 5 mortalities was a surgical case (peritoneal mesothelioma), and the remainder were caused by GI hemorrhage (3/5) or perisplenic hematoma (1/5). The overall ratio of RBC:FFP in the entire group was approximately 1.6:1 (18 RBCs to 11 FFP). However, the ratio of RBC:FFP in the mortality group was 2.4:1 compared to 1.6:1 in the non‐fatal group. Overall, platelets were used in 23/30 of patients and cryoprecipitate in 7/30 patients.
Conclusion: MTPs were not utilized often at our institution. Survival appeared to be better in surgical cancer patients vs. critical care oncology patients and in those who received more balanced ratios of RBC:FFP compared to higher ratios of RBC to FFP.
CP282
Evaluating Colorful Plasma: Three Instructive Cases
Lalitha Anand* and Randy Levine
Lenox Hill Hospital
Background/Case Studies: Plasma is a straw‐colored supernatant of blood that is used for type and screen (T&S) and crossmatch. In the analytic phase of testing, plasma is examined prior to processing. Plasma occasionally becomes discolored, interfering with crossmatch procedures. Timely identification of the etiology allows for corrective actions and minimizes delay in transfusion.
Study Design/Method: During the analytic phase of blood bank testing, samples were evaluated for T&S and crossmatch; this identified three samples with discolored plasma. We present a series of cases that illustrate the testing process.
Results/Finding: A 54‐year‐old woman diagnosed with breast cancer presented for mastectomy with sentinel lymph node biopsy. A preoperative T&S specimen contained bright green plasma. Review of her preoperative case revealed exposure to intravenous methylene blue. This dye is known to alter the color of urine, tears, and blood with no known pharmacologic effects. Alternative causes of green plasma include other dyes used to locate sentinel nodes and oral contraceptive use. Although not ideal, this sample could be used for crossmatch by tube method, but not automated gel technique. A specimen drawn one week later contained clear plasma.
A 26‐year‐old woman diagnosed with a warm autoimmune hemolytic anemia was refractory to blood transfusions secondary to alloantibodies. Administration of a synthetic blood product resulted in dark maroon colored plasma. The most common cause of a dark red color is hemolysis of the sample, which is usually discarded. In this instance, the hemoglobin color was due to the infused product, an experimental bovine pegylated carboxyhemoglobin that affects colorimetric evaluation of blood samples. With this in mind, the sample was not discarded and testing was completed by tube method.
A 70‐year‐old woman admitted with acute stroke was treated with a thrombolytic. Her T&S revealed cloudy white plasma that could not be used for the crossmatch procedure. Common causes of white plasma include purulence, hypertriglyceridemia, and sampling of blood drawn proximal to administration of radiopaque agents such as propofol. Although an etiology could not be identified a repeat specimen drawn several hours later was clear.
Conclusion: These cases highlight the importance of an appropriate evaluation of discolored plasma. Once a discolored sample is identified, a repeat sample is required to confirm the change in color. In the first two cases, the discoloration persisted, prompting further clinical investigation. Once the etiology was identified, need for further testing and eligibility for further transfusion was determined. Testing by tube method could be performed in two cases. In the third case, repeated sampling revealed a clear sample and the transfusion process continued without delay. Decisions regarding the analytic phase of testing must include reevaluation of the sample, identification of the etiology, and comprehension regarding how to proceed when discoloration persists.
CP283
Examining the Efficacy and Outcomes of a Standard Protocol to Provide Compatible Transfusions and Avoid De Novo Alloantibody Formation in Patients Receiving Daratumumab Treatment
Caleb Wei‐Shin Cheng*1,2, Rebecca Ross2, Christopher A Tormey1,2,3 and Amit Gokhale1,2
1Yale University School of Medicine, 2Yale‐New Haven Hospital, 3VA Connecticut Healthcare
Background/Case Studies: Daratumumab (Dara) is a IgG1 monoclonal antibody therapy that specifically targets CD38, a glycoprotein highly expressed on plasma cells, where it has been successfully used in patients with refractory or relapsed multiple myeloma. Dara interferes with blood bank testing as it binds to CD38 expressed on red blood cells, causing pan reactivity. The Dara interference can be overcome with the use of dithiothreitol (DTT) treated reagent red blood cells. To minimize alloimmunization and to provide crossmatch compatible blood to treated patients, we instituted a Dara protocol in our blood bank. The purpose of this retrospective study was to identify the outcomes of our protocol, with a particular focus on the development of de novo alloantibodies during Dara treatment at our institution.
Study Design/Method: All Dara patients’ antibody workups were completed using DTT pre‐treated reagent red blood cells. If the antibody screen was negative, K antigen negative RBC products are provided. If an antibody is identified, K negative along with that particular antigen negative blood is provided. Our electronic medical record (EMR) was searched for patients who received Dara over the past eight months. Study subjects were examined to see if they had pre‐existing alloantibodies before Dara treatment and whether they formed new alloantibodies during Dara treatment. The age, gender, type and screen pre‐Dara treatment, type and screen post‐Dara, intervening blood transfusions, and the date of first Dara treatment was recorded.
Results/Finding: Overall, 54 subjects were identified for analysis. Their mean age was 67.8 years, with 29 male and 25 female subjects; all were diagnosed with multiple myeloma. We found an alloimmunization rate of 0% (0/54) prior to administration of Dara. Of these patients, 22 were transfused with red blood cells (RBCs) after initiation of Dara therapy. Following our testing/matching protocol, none of these (0%; 0/22) patients formed a confirmed, new alloantibody during Dara treatment; each of these patients underwent at least one follow‐up screen after their first RBC unit. We also found no complications in providing crossmatch compatible units to any of the 22 patients.
Conclusion: To our knowledge, this is the largest case series reporting on results of overcoming Dara interference with blood bank type and screen testing. The protocol implemented in our laboratory appears to be successful in providing compatible units and preventing alloimmunization in patients receiving Dara therapy. It is possible that the drug, targeting antibody forming cells, may have an immunosuppressive effect on the humoral response; further studies of this effect may be warranted.
CP284
Fresh Frozen Plasma and Liquid Plasma Effect on International Normalized Ratio with Concurrent Vitamin K Administration
Erin Bartels*
United Clinical Laboratories
Background/Case Studies:A multi‐facility transfusion service began stocking liquid plasma in September of 2015 for use in massive transfusion and trauma situations. Due to the infrequent occurrence of these incidents, the liquid plasma would outdate before use. A policy to use liquid plasma in non‐emergent situations when the units were nearing their expiration dates was implemented. This study evaluated the effects of that policy on INR values of plasma recipients.
Study Design/Methods:A retrospective analysis was developed to compare the effectiveness of fresh frozen plasma (FFP) and liquid plasma (LQP) in changing INR values of recipients. All plasma units transfused within the facility from September 1, 2015 through April 7, 2017 were identified. The following data was obtained from the hospital and laboratory information systems for each unit: the recipient, primary reason for transfusion of plasma, number of plasma units transfused, type of plasma transfused, pre‐ and post‐transfusion INR values, and whether or not vitamin K was administered. Patients were divided into groups based on the type of plasma units transfused and were evaluated based on primary reason for transfusion, number of units transfused, and administration of vitamin K. The change in INR for each recipient was calculated, along with the average change in INR for each group.
| Product Received | Average decrease in INR |
|---|---|
| All types | 1.60 |
| Both FFP and LQP | 0.75 |
| FFP only | 1.75 |
| LQP only | 0.97 |
Results/Findings: A total of 520 units of plasma were transfused to 242 patients. Twenty‐one patients received both FFP and LQP, 199 patients received FFP only, and 23 patients received LQP only. Change in INR was not available for 42 patients. The INR decreased in all patient groups (see table). The average decrease in INR for all plasma units was 1.60, 0.75 for patients receiving both FFP and LQP, 1.75 for patients receiving FFP only and 0.97 for patients receiving LQP only.
Patients receiving plasma due to elevated INR values showed the greatest decrease in INR among all of the transfusion reasons evaluated. Patients receiving vitamin K showed greater changes in INR through all categories.
| Products transfused | Average decrease in INR with Vitamin K | Average decrease in INR without Vitamin K |
|---|---|---|
| All types | 2.24 | 0.65 |
| Both FFP and LQP | 1.17 | 0.38 |
| FFP only | 2.34 | 0.75 |
| LQP only | 2.26 | 0.33 |
Comparison of the total number of plasma units transfused showed patients receiving FFP only had greater changes in INR values than those receiving only LQP or both FFP and LQP when 1, 4, or >4 units were transfused at once. Patients receiving 2 units of plasma showed the greatest decrease in INR when LQP was transfused. Patients receiving 3 units of plasma showed the greatest change in INR when receiving mixture of FFP and LQP.
| Number of units transfused | Average decrease in INR: both FFP and LQP | Average decrease in INR: FFP only | Average decrease in INR: LQP only |
|---|---|---|---|
| 1 |
N/A n=0 |
1.70 n=57 |
0.03 n=12 |
| 2 |
0.53 n=8 |
1.56 n=100 |
2.01 n=10 |
| 3 |
1.70 n=5 |
1.65 n=19 |
N/A n=0 |
| 4 |
0.25 n=6 |
3.19 n=17 |
0.03 n=1 |
| >4 |
0.55 n=2 |
1.6 n=6 |
N/A n=0 |
Conclusion: When attempting to lower INR values, concurrent administration of vitamin K showed greater results than transfusion of plasma alone. Transfusion of FFP showed greater changes in INR than transfusion of LQP. The results of this study should be interpreted with caution due to the small sample size of patients receiving LQP only in whom a change in INR value was available.
CP285
Gaps in Managing Gynaecological Patients with Iron Deficiency Anaemia
Ching‐Wa Lau1, Wing‐Cheong Leung2, Nga‐Sze Leung1 and Cheuk‐Kwong Lee*1
1Hong Kong Red Cross Blood Transfusion Service, 2Kwong Wah Hospital
Background/Case Studies: In gynaecological settings, most but not all relatively young anaemic women are iron deficient due to blood loss associated with menstruation. Transfusion could generally be avoided in those without haemodynamic instability. The oral antifibrinolytic drug tranexamic acid is an effective and well tolerated treatment for menorrhagia. Besides, iron replacement is often necessary for a prolonged period of time after normalization of haemoglobin (Hb). The present study attempted to look into transfusion appropriateness and the use of iron and tranexamic acid in transfused women in Hong Kong.
Study Design/Methods: Anonymous data of gynaeological patients age ≤ 60 was retrieved from a central database of public hospitals which included age, number of units of red cell transfused, pre‐ and post‐transfusion Hb, the use of iron and/or tranexamic acid during hospitalization and upon discharge. All transfusion episodes associated with surgical operations during same admission are excluded.
Results/Findings: In 2016, 2,523 unique women receiving a total of 5,889 units of red cells (RC) in 2,906 transfusion episodes were identified. Their median age was 45 (range 11 ‐ 60). The distribution of pre‐ and post‐ transfusion Hb and units of RC transfused were summarized below:
| Pre‐transfusion Hb | Median Age | RC units given | Episodes | Post‐Transfusion Hb | ||||||||||
|---|---|---|---|---|---|---|---|---|---|---|---|---|---|---|
| 1 | 2 | 3 | 4 | 5 | >5 | < 7 | 7∼8 | 8∼9 | 9∼10 | ≥10 | missing | |||
| < 7 | 45 | 77 | 777 | 525 | 77 | 3 | 2 | 1461 | 65 | 208 | 537 | 413 | 136 | 102 |
| 7∼8 | 45 | 374 | 656 | 17 | 0 | 0 | 0 | 1047 | 4 | 52 | 287 | 411 | 179 | 114 |
| 8∼9 | 45 | 148 | 117 | 1 | 0 | 0 | 0 | 266 | 3 | 8 | 43 | 76 | 85 | 51 |
| 9∼10 | 44 | 23 | 16 | 0 | 0 | 0 | 0 | 39 | 0 | 1 | 4 | 8 | 21 | 5 |
| ≥10 | 36 | 10 | 7 | 0 | 0 | 0 | 0 | 17 | 1 | 1 | 0 | 3 | 12 | 0 |
| missing | 46 | 16 | 50 | 10 | 0 | 0 | 0 | 76 | 0 | 7 | 17 | 26 | 15 | 11 |
| Total | 45 | 648 | 1623 | 553 | 77 | 3 | 2 | 2906 | 73 | 277 | 888 | 937 | 448 | 283 |
In this cohort, pre‐ and post‐transfusion Hb were absent in 46 (1.6%) and 283 (9.7%). 635 (21.9%) transfusion episodes were associated with the use of 3 units or more RC. As a result, 1385 (47.7%) episodes resulted in a post transfusion Hb ≥ 9g/dL.
Parenteral iron or tranexamic acid was uncommon during hospitalization and was given 2 (<0.1%) and 116 (4.6%) women respectively. Upon discharge, 442 (15.0%), 84 (3.2%) and 1,994 (65.8%) women were prescribed with oral iron alone, oral tranexamic acid alone or both respectively. However, neither were given to 386 (16.0%) women.
Conclusion: In the present study, it is observed that 49.7% transfusion episodes were given at Hb ≥ 7g/dL. A substantial number of episodes (71.7%) were transfused with multiple units and resulted in almost half having a post transfusion Hb level (≥ 9g/dL). For iron replenishment and bleeding control, up to 16.0% transfused women were not given iron or tranexamic acid at discharge. The results indicate that awareness of both transfusion appropriateness and iron deficiency anaemia management have to be improved. It is recommended that in‐depth education and training should be provided for a better gynaecological patient blood management.
CP286
Granulocyte Transfusions in a Patient with Relapsed B‐Cell Acute Lymphoblastic Leukemia Status Post Chimeric Antigen Receptor T‐Cell Therapy
Laurence M. Briski*1, Barry Siegfried2 and Chisa Yamada1
1University of Michigan, 2American Red Cross
Background/Case Studies: Granulocyte transfusions may be utilized to boost the immune response in patients with life‐threatening neutropenia or neutrophil dysfunction and evidence of treatment‐refractory bacterial or fungal infection. However, granulocytes are rarely administered due to uncertainty regarding efficacy, difficulty in collection, and increased propensity for adverse reactions. We report a case of granulocyte transfusion therapy following chimeric antigen receptor T‐cell (CAR‐T) therapy in a patient with severe neutropenia and multiple infections in the context of relapsed B‐cell acute lymphoblastic leukemia (B‐ALL).
Study Design/Method: Granulocytes (0.8‐1.3x10¹⁰ per unit) were collected from ABO‐identical unstimulated donors at a regional blood center. Each unit was irradiated with 25 Gy and transfused over 3‐4 hours within 24 hours after the time of collection. The patient's response and laboratory data were reviewed in the medical record.
Results/Finding: The patient was an 18‐year‐old A+ female with B‐ALL, diagnosed in 2006. She was placed on a standard‐risk protocol and achieved complete remission by 2008. However, a bone marrow (BM) biopsy in March 2010 revealed recurrent disease, prompting intensified therapy and a BM transplant (BMT) with a 10/10 HLA‐matched sibling donor in August 2010. She experienced two additional relapses, and underwent CAR‐T therapy in April 2016. Her ensuing clinical course was complicated by continued severe neutropenia with serial infections, including disseminated anti‐fungal medication resistant candidemia, disseminated HHV‐6 infection, ulcerating oral HSV mucositis, and oral wound cultures positive for Rothia mucilaginosa. A total of 6 daily granulocyte infusions were administered. The granulocytes were not HLA‐matched as the patient only had two low‐risk HLA antibodies (A23, A29). Within 24 hours of the first transfusion, her white blood cell (WBC) count increased from <0.1 to 0.6K/µL, and her oral and cutaneous candidal lesions showed clinical improvement. However, she received marginal benefit from subsequent transfusions, and her WBC count fell to <0.1‐0.2K/µL. Repeat BM biopsy revealed profound hypocellularity (<5%). Although a second BMT was considered, this was too risky in the context of active candidemia. She was placed on palliative care and expired 61 days post‐CAR‐T therapy.
Conclusion: We report a case of granulocyte transfusion. While there was clinical improvement in the patient's candidiasis, the transient increase in her WBC count was not sustained with successive transfusions. One explanation is that the dose of granulocytes transfused per unit may have been suboptimal. Coordination with the provider is crucial for successful granulocyte transfusion.
TABLE 1. Granulocyte count per unit and WBC count
| Day 1 | Day 2 | Day 3 | Day 4 | Day 5 | Day 6 | |
|---|---|---|---|---|---|---|
| Granulocyte count (x1010) | 1.2 | 1.0 | 1.1 | 0.8 | 1.3 | 1.3 |
| Pre‐transfusion WBC (K/µL) | <0.1 | 0.3 | 0.1 | 0.2 | <0.1 | 0.1 |
| Post‐transfusion WBC (K/µL) | 0.6 | 0.1 | 0.2 | 0.2 | 0.2 | 0.2 |
CP287
Human Leukocyte Antigen Alloimmunization and ABO Blood Group in Patients with Hematologic Malignancies
Ashley M. Greer*1 and Nicole Draper2
1University of Colorado Hospital, 2University of Colorado
Background/Case Studies: Patients can be tested for Class I anti‐HLA antibodies to predict immune platelet refractoriness. At our institution platelet refractoriness is most commonly identified in patients with hematologic malignancies. Determining factors associated with HLA alloimmunization can lead to cost effective testing of patients at high risk.
Study Design/Method: Patients who had not undergone hematopoietic stem cell transplantation were tested using a flow‐based assay for anti‐HLA Class I antibodies. Patients with anti‐HLA Class I antibodies (anti‐HLA group) were analyzed by diagnosis and ABO blood group in comparison to patients with hematologic malignancies who did not have identified HLA antibodies (HM group). The chi‐square test was used to compare positivity rates.
Results/Finding: There were 90 patients in the anti‐HLA group over 4 years and 270 patients in the HM group over 1.25 years. More females had anti‐HLA antibodies (62.6% anti‐HLA vs 40.0% HM, p<.0001). The most common diagnosis was acute myeloid leukemia (AML) in both groups, but AML constituted a higher percentage in the anti‐HLA group (46.7% vs 27.8%, p<0.0001). The HM group and patients with AML had ABO blood group frequencies not significantly different from reported frequencies in the general population of the United States (HM: 43.7% group O, 42.6% group A, 10.0% group B, 3.7% group AB; AML: 35.9% group O, 47.0% group A, 14.5% group B, 2.6% group AB). A significantly higher number of patients with group B blood type were identified in the anti‐HLA group (16.7% of anti‐HLA vs.10% HM group, p=0.04). This higher rate for group B was still seen when considering the subgroup of patients with AML (21.4% of anti‐HLA vs.10% HM group, p=0.01).
Conclusion: This data suggests that a diagnosis of AML is associated with anti‐HLA antibodies. An increased frequency of blood group A in patients with AML has been reported, but here no statistically significant difference between ABO blood group frequencies was found in any category except the patient's with HLA antibodies. Blood group B has a significant association with HLA alloimmunization in the studied patients. It has been reported in a large study of female blood donors that no difference in HLA antibody frequency was observed based on ABO blood group at centers using the flow‐based assay. Although the reasons for the higher rate of group B blood type among patients with anti‐HLA antibodies and hematologic malignancies is unknown, this could be due to variation in immunizing events (pregnancy vs transfusion) or immune dysregulation related to the hematologic malignancy, especially AML. Females with AML who are blood group B appear to be most likely to have HLA alloimmunization among patients with hematologic malignancies.
CP288
Implementation of Electronic Solution to Reduce Risk of Mistransfusion in a Regional Transfusion Service
Debra Lane*1, Lee Grabner1, Brenda Herdman2, Robert Fallis1, Amin Kabani3 and Charles Musuka3
1Canadian Blood Services, 2Kenora Rainy‐River Regional Laboratory Program, 3Diagnostic Services Manitoba
Background/Case Studies: Patient misidentification and improper sample labeling has been an ongoing risk for the safety of blood transfusion. The rate of mistransfusion has remained unchanged in over 50 years. Attempts have been made to reduce mistransfusion including barrier devices, barcoding and RFID. Within a Regional Transfusion Service (RTS) barcoding and RFID would require standard Admission Discharge Transfer Information Systems. Barrier methods have been shown to have workaround steps that allow the operator to bypass the barrier.
Study Design/Methods: In developing a plan to reduce mistransfusion that would work in an RTS, the barrier devices were dismissed. Barcoding & RFID are costly to implement. Requesting a second sample collected in a different colored tube issued from the blood bank to be tested prior to transfusion was determined to be impractical for rural laboratories. An approach was developed to utilize the Transfusion Medicine Laboratory Information System (LIS) to identify patients with no historical blood group on file and automatically apply a transfusion protocol that would only permit group O Rh compatible red cells to be issued. This was manageable since 100% of patients have a unique identifier and 75% had a historical ABO/Rh in the LIS. To minimize impact to group O inventory a second sample was obtained if more than 2 to 4 units were requested to confirm the ABO and allow the issue of group specific red cells. Neonatal patients continued to receive group O Rh negative red cells. Increased demand for group O was expected. Plasma components were excluded from the new transfusion protocol.
Results/Findings: The population base of the RTS served is 1.3 million and the process has been in place for one year. The number of transfused red cells increased by 4.55 O positive and 0.88 O negative red cell units per day. The process was subsequently adapted to request the second ABO/Rh sample after the first unit was requested for transfusion. The solution provides more safety for patients than performing two blood groups on one sample, although the process does not solve the problem of a patient using another person's identification.
Conclusion: In an RTS, utilizing the LIS to ensure only group O Rh compatible red cells can be issued until a second sample is tested for those patients who do not have a historical blood group on file; ensures the mistransfusion risk is reduced while incurring no delay in patient care. This proved to be a cost effective and efficient way to reduce ABO mistransfusion due to misidentification with minimal impact to group O inventory.
CP289
Influence of Donor Sex and Age on Efficacy of Erythrocyte Transfusions
Roberta Bruhn*1, Gabriel Escobar2, Vincent Liu2, Brian Custer1, Michael Paul Busch1, Edward Murphy3 and Nareg Roubinian1
1Blood Systems Research Institute, 2Kaiser Permanente Division of Research, 3Blood Centers of the Pacific‐Irwin Center
Background/Case Studies: The role of donor age and sex on hemoglobin content and susceptibility to hemolysis during storage of red blood cell (RBC) units is receiving increased attention. However, the impact of donor characteristics on efficacy of RBC transfusion has not been studied in large‐scale donor‐recipient outcomes databases.
Study Design/Methods: We conducted an analysis using blood donor data routinely collected by a blood center and transfusion recipient data from a large community hospital network between 2008 and 2011 before patient blood management initiatives. Linkage was performed between blood donor characteristics and hospitalized RBC transfusion recipients who received a single RBC unit. Studied exposures for this analysis were blood donor sex and age in addition to RBC storage age. The Wilcoxon test was used to examine changes in hemoglobin level following RBC transfusion, and multivariable logistic analysis to adjust for recipient sex, age, and estimated blood volume using Nadler's equation.
Results/Findings: We linked data on 6,766 hospitalized transfusion recipients who received a single RBC unit during hospitalization to blood donor demographic data. Median blood donor age was 49 years (IQR: 30‐60), and 58.6% of transfused RBC units were from male donors. All units were leukoreduced, and the median storage age of RBC units prior to transfusion was 19 days (IQR 10‐26). Median recipient age was 74 years (IQR: 64‐82), and 38% were male. Recipients of RBC's from male and female donors had similar pre‐transfusion hemoglobin levels (8.7g/dL; p=0.94); however, transfusion recipients of male donor RBC units had higher post‐transfusion hemoglobin levels and larger increments in hemoglobin compared to those of female RBC units (9.9 vs 9.8g/dL; 1.2 vs. 1.1g/dL; both p=0.02). Female recipients had a larger rise in hemoglobin per RBC unit compared to male recipients (1.3g/dL vs. 1.0g/dL; p<0.001). Female sex of the recipient remained a significant predictor of change in hemoglobin after accounting for recipient age and estimated circulating blood volume in multivariable analysis (p=0.01). RBC storage age and the age of the donor were not significant factors in changes in hemoglobin levels in multivariable analysis, p=0.53 and p=0.32, respectively.
Conclusion: RBC units from male donors resulted in a larger rise in hemoglobin levels compared to those from female donors, and these changes were more apparent in female recipients even after accounting for effective circulating blood volumes. This suggests that the dose of hemoglobin is lower in female than male RBC units. This analysis demonstrates the feasibility of using this approach to study the association between donor characteristics and RBC efficacy, hemolysis and other donor‐component‐recipient interactions.
CP290
Institutional Implementation and Tracking of Blood Refusal Alerts for Jehovah's Witness Patients
Yao Ma* and Alyssa Ziman
UCLA Ronald Reagan Medical Center
Background/Case Studies: People who identify as Jehovah's Witnesses (JW) comprise less than 1% of the population of the United States. However, as a group they can present a special challenge in medicine due to a religious aversion to blood products, based on biblical readings. The degree of this religious refusal can vary from individual to individual, but as institutional policy, a conservative approach is warranted. However, in large institutions where multiple teams manage a single patient, blood refusal information can be lost or poorly communicated from provider to provider. As such, a system to alert providers of patient blood refusal was recently implemented through the electronic medical record in a large west‐coast institution.
Study Design/Method: The electronic medical record (EMR) utilized in this study in an institutionally modified version of EPIC EA Best Practices Alert (BPA) was designed to trigger each time an end user attempted to place orders related to blood transfusion, transfusion‐related lab testing, or human‐derived pharmacy items on patients with blood refusal codes in their history, problem list, or religion (Jehovah's Witness) discrete data fields. The alert constitutes a “soft‐stop” in which the ordering provided is prompted to either cancel the triggering orders or acknowledge the blood refusal/religious history and override the warning with an option to select a reason for the override. Data on the triggers are automatically collected through the EMR systems and generated into a report by informatics personnel.
Results/Finding: The available data covers triggers in the two month post‐implementation of the BPA. The BPA triggered 33 times in total, affecting 15 patients and 21 users. Stratified by location, the majority of triggers occurred in the perioperative areas (18 times) and the liver ICU (6 times) with a minority occurring on the regular hospital floors and emergency department. Nurses, attendings, residents, pharmacists, and nurse anesthesiologists were the users affected. Orders that triggered the BPA included type & screens, Human albumin 25% IV solution, Human albumin 5% IV solution, Immune Globulin (Human) solution.
TABLE. End‐User Action Taken Following BPA Trigger
| User Action Taken | # of BPA firing |
|---|---|
| Acknowledge/Override Warning | 13 |
| Benefit outweighs risk (Pediatric Exception) | 2 |
| Not‐Applicable (Patient WILL accept this product) | 5 |
| See comments | 5 |
| Inaccurate Warning | 1 |
| Remove Blood Product order | 17 |
| Acknowledge/Override Warning ‐ Remove single order | 2 |
| (blank) | 1 |
| Grand Total | 33 |
Conclusion: Despite the limited and very preliminary data, the user action findings seem to indicate that the BPA is effective in halting up to half of the contraindicated orders for blood‐derived products and type & screens orders. Given the limited types of orders that the BPA is triggering on, the pattern suggests that the BPA is potentially alerting some previously unaware providers of the patient's religious status and/or the fact that certain pharmacy items are blood‐derived, and therefore unacceptable to many JW patients. Despite these positive initial findings, this is an ongoing study to track the efficacy of the BPA and more data needs to be collected for better metrics of the institutional sensitivity to patient blood refusal.
CP291
Intervention to Address Inappropriate Cryoprecipitate‐AHF Orders at a Tertiary Medical Center
Sirisha Kundrapu*1,2, Mahmut Akgul1,2, Hollie M Reeves1,2, Robert W Maitta1,2, Marcie Pokorny2, Anne Capetillo2 and Katharine A Downes1,2
1Case Western Reserve University School of Medicine, 2University Hospitals Cleveland Medical Center
Background/Case Studies: Although introduced for the management of hemophilia A, now cryoprecipitate is primarily indicated for low fibrinogen levels. At our institution the transfusion medicine service (TMS) reviews and makes recommendations to clinicians for all inappropriate cryoprecipitate orders. We aimed at analyzing the effectiveness of this intervention in reaching target fibrinogen levels in under‐estimated and over‐estimated orders.
Study Design/Method: We conducted a 7‐month retrospective study (January‐July 2016) of adult cryoprecipitate order quality assurance forms. The reference range for fibrinogen was 200‐400mg/dl with critical value of 50mg/dl. Cryoprecipitate orders for massive transfusion protocol, from operating rooms and for extracorporeal membrane oxygenation were not reviewed by the TMS. During the study period, TMS evaluated orders for appropriateness of dosing and agreement with estimated required doses. Post‐transfusion fibrinogen levels due to intervention were compared with hypothesized no intervention levels. Statistical analysis was performed using chi‐square and t‐tests.
Results/Finding: There were 301 adult (>18 years) orders reviewed by TMS out of which 299 were approved. Of the 299 approved orders, 136 (45.5%) were in agreement with TMS's estimated dose. Of 163 (54.5%) orders that were not in agreement with the TMS's estimate, 142 (47%) were underestimated and 21 (7%) were overestimated. Seventeen of 299 orders had no post‐transfusion fibrinogen levels. Without intervention, there would have been a median deficit of 23.6mg/dl (range 0.3 to 124mg/dl) and a median excess of 13.3mg/dl (range 0.6 to 155mg/dl) of fibrinogen from the target. Median difference between target and actual post‐transfusion fibrinogen level was 12mg/dl above target, which is significantly higher with intervention than without (which could have been 12mg/dl below the target; p<0.0001). Median differences between target and post‐transfusion fibrinogen levels for the group with agreement between approved and requested units was not significantly different from possible differences without intervention (11 vs. 2.7mg/dl, p=0.07). Median differences between target and post‐transfusion fibrinogen levels for the group with non‐agreement between approved and requested units was significantly different from possible difference without intervention (15 vs. ‐23.5mg/dl, p<0.0001). Seven of 299 orders were for critically low fibrinogen (<50mg/dl) and 4 of these were under‐estimated requests and reached target fibrinogen with TMS's estimate and approval of required units to be transfused. Overall most frequent orders were 10 and 5 units (59.5% and 25%) i.e. 2 and 1 pools and the most frequent orders in the disagreement group were 10, 1, 5 and 2 units (33%, 20%, 17% and 16%). There is a significant difference between agreement and disagreement groups based on clinical service ordering the units (Table).
Conclusion: Intervention by TMS to review and approve cryoprecipitate orders was associated with increased accuracy of orders and achievement of desired target fibrinogen levels. Further studies are needed to develop multidisciplinary strategies for accurate cryoprecipitate dosage.
TABLE. CP291
|
Agreement N=136 (%) |
Disagreement N=163 (%) |
P | |
|---|---|---|---|
| Oncology | 60 (44) | 45 (28) | 0.0026 |
| Surgical ICU | 24 (18) | 51 (31) | |
| Medical/ cardiac ICU | 29 (21) | 27 (17) | |
| Medicine services | 23 (17) | 40 (24) |
CP292
Is Prophylactic Plasma Transfusion Prior to Interventional Radiology Procedures Effective in Correcting INR
Christine Cahill*, Neil Blumberg, Ashwani Sharma, Amy E Schmidt, Scott Kirkley, Emily Gore and Majed Refaai
University of Rochester
Background/Case Studies: International normalized ratio (INR) is used to measure the anticoagulation effect of warfarin. Plasma transfusion is frequently used to correct elevated INR before invasive procedures. Studies have shown that INR is an unreliable test for bleeding risk assessment and that most patients with elevated INRs don't bleed, whether given prophylactic plasma or not. Many surgical/interventional society guidelines recommend correction of INR to ≤1.5 prior to invasive procedures in order to reduce bleeding complications. Here we evaluated plasma transfusion before interventional radiology (IR) procedures for INR corrections.
Study Design/Method: The medical records of 1881 adult patients requiring IR procedures over a 13‐month period were reviewed retrospectively. A total of 146 patients received plasma for INR correction. 111(76%) met our inclusion/exclusion criteria, transfusion of 1‐5 units of plasma for INR correction prior to procedure and INR measured before and after transfusion. Patient characteristics, medical records, vitamin K administration, and adverse events, were collected (Table).
Results/Finding: The average pre‐transfusion INR was 2.36 and post‐transfusion was 1.91. Only 22% of patients had their INR corrected to ≤1.5, while 28% had no change, or had increased INR. (Table). The majority (67%) of patients received ≤2 units of plasma. The mean plasma dose was 6mL/kg. There were 4 transfusion reactions reported, 1 non‐hemolytic and 3 transfusion associated circulatory overload reactions in which 1 required admission to the ICU. Two patients experienced bleeding during IR procedures (TIPS) and 1 developed a hematoma (tunneled central line).
Conclusion: The median of INR correction in this study was 1.9 with no relationship to the number of units of plasma transfused and/or if vitamin K was administered. This study suggests it may not be beneficial and may be harmful to transfuse plasma for correction when INR is ≤1.9. Randomized trials are needed to assess whether the INR is a rational tool to measure bleeding risk, and whether prophylactic treatment with plasma yields any benefit. 3 of the 111 patients experienced bleeding complications indicating that INR of 1.9 may be considered safe in some lower risk procedures. Current practices may provide little or no benefit, with substantial risk of life threatening complications.
| N=111 | Average(range) |
|---|---|
| Age(y) | 59.1(18‐92) |
| Male N(%) | 64(58) |
| Weight(kg) | 88(45.4‐230.4) |
| Mean±SD(Median) | |
| # units transfused | 2.23 ± 1.05(2.0) |
| Dose FFP(mL/Kg) | 5.99 ± 3.33(5.2) |
| INR Pre transfusion | 2.36 ± 0.67(2.2) |
| INR Post transfusion | 1.91 ± 0.42(1.9) |
| N(%) | |
| Corrected to ≤1.5 | 24(22) |
| Corrected to 1.6‐ ≤1.8 | 27(24) |
| Corrected to >1.8 | 29(26) |
| Increased above baseline | 26(23) |
| No change | 5(5) |
| Patients on Coumadin | 56(50) |
| Total patients receiving Vit. K | 32(29) |
| Patients on Coumadin receiving Vit. K | 16(14) |
| Liver abnormalities | 64(58) |
| Procedures | N(%) |
| Tunneled Central Venous Line | 80(72) |
| Percutaneous Liver Biopsy | 12(11) |
| Percutaneous Transhepatic Cholangiography | 7(6) |
| Non Tunneled Central Venous Line | 7(6) |
| Transjugular Liver Biopsy | 3(3) |
| Transjugular Intrahepatic Portosystemic Shunt (TIPS) | 2(2) |
CP293
Level One Trauma Center Experience of Using Group a Plasma in Massive Transfusion Protocol
Maryna Tarbunova*, Miriam Andrea Duque and Agnes Aysola
University of Florida, College of Medicine
Background/Case Studies: Group AB plasma, which lacks anti‐A and anti‐B antibodies, is considered to be the universal plasma donor and is used in the emergency setting before the patient's blood group is available. Approximately 4% of the population is group AB, which limits the available inventory of group AB plasma. Of group AB population, only plasma from male donors are considered suitable for transfusion since females, especially multiparous female donors, have a greater propensity to develop antibodies that can cause transfusion related acute lung injury (TRALI). This makes type AB plasma a limited resource.
Our hospital is a level one trauma center, where a significant amount of plasma transfusion is required for severely bleeding patients before their blood type is known.
Group O individuals make up 45 % of the population and have no A or B antigens on their cells. Group A is the second most prevalent blood group in the US population (40%) and has no B antigen on their cells. So, group A plasma is compatible with both group O and A patients, approximately 85% of the patient population. Before patient's blood type is known, type O red cell units are transfused with A plasma, which decreases the chance of hemolysis. To conserve AB plasma, we instituted a policy effective July 1, 2014 as follows: 2 units of group A plasma and 3 units of group AB plasma is provided for the Massive transfusion protocol (MTP) along with 5 units of O negative RBC until patient blood type is known.
Study Design/Method: This prospective study is designed to monitor the use of group A plasma in MTPs at our institution and to evaluate the risk and severity of hemolysis in patients transfused with incompatible plasma. Direct antiglobulin test (DAT) is performed if patient received incompatible plasma. If DAT is positive, lactate dehydrogenase (LDH), haptoglobin and bilirubin levels are obtained to detect possible hemolytic transfusion reaction.
Results/Finding: We reviewed 235 MTPs at our institution between July 2014 and March 2017. Twenty patients (8.5 %) were transfused with incompatible group A plasma (5 group AB and 15 group B patients). Five patients died due to severe injury, and follow‐up testing of these patients could not be performed. The remaining 15 patients had negative DAT, indicating the lack of significant amount of antibody coating their red cells, which could lead to hemolysis. None of these patients developed acute hemolytic reaction, or any other adverse effects of incompatible plasma transfusion.
| Patient Blood Type | Number of Patients |
O Type RBC Units Transfused Mean (Range) |
Plasma Units Transfused Mean (Range) |
Incompatible Plasma Units Transfused Mean (Range) |
|---|---|---|---|---|
| B | 15 | 7.3 (3‐19) | 9.3 (1‐26) | 1.9 (1‐4) |
| AB | 5 | 5.2 (4‐7) | 8.0 (4‐18) | 2.4 (1‐6) |
Conclusion: Our study adds more evidence of the safety of group A plasma transfusion in trauma patients requiring emergent massive transfusion before the patient blood type is known. Based on this and other recently published studies, starting in April 2017, our institute will provide only group A plasma for emergency release and MTP cases before the patient blood type is known.
CP294
Management of Dramatic Patient HLA Platelet Order Increase
Camilla Melland*1, Kevin J Land2 and Samantha Mack1
1Bonfils Blood Center, 2Blood Systems
Background/Case Studies: In 2013, Bonfils Immunohematology Reference Lab (IRL) sent out approximately 245 special platelets for patients with HLA antibodies. By 2016, HLA platelet orders increased dramatically and the IRL sent out over 650 special platelet products. The purpose of this abstract is to illuminate the methods used to fulfill increased client need that occurred in a short period of time.
Study Design/Methods: Bonfils Blood Center has over 10,000 donors in the database with historical HLA typing. However, only approximately 3500 of those donors actively donate. In the Denver area, one of the most common HLA types is A1 A2 B7 B8. Only 81 of the 10,000 donors have this type (0.81%). Therefore, to fill an HLA platelet order request for a common HLA type, only 28 donors in the system would be a perfect HLA match. With that low number of donors, it is not likely that there would be a platelet on the shelf ready to fill the order. After a donor is recruited and donates, it takes at least two days to fill an order. For a less uncommon HLA type like A9 A11 B17 B35, there is only 1 out of 10,000 donors (0.01%) that match perfectly. In those cases, there are no donors to recruit to fill such an order.
In some complicated cases, the IRL was provided with an HLA antibody list or Panel Reactive Antibody test (PRA). In order to find product for these patients, lists of platelets in inventory with corresponding HLA types were printed. If a patient had an antibody to A1 for example, all of the A1 positive platelets were crossed off the list. This cross‐out process would continue manually until the only platelets on the list were the ones positive for HLA antigens to which the patient did not have antibodies. These platelets are PRA matched to the patient.
In order to automate this process a report linked to the donor database was created to find both PRA platelets in inventory and donors for recruitment. The blood center medical director began suggesting that hospital clients order a PRA for each patient with platelet refractoriness. The PRA test is fast and it is a definitive method to discern HLA antibody mediated refractoriness from platelet refractoriness due to other causes.
Results/Findings: In all but the most complicated cases with rare HLA patient phenotypes, it was much easier to find a PRA patient matched platelet on the shelf than an HLA match donor. In 2012, approximately 27% of these special order platelets were PRA matched and the remaining 73% were HLA matched by donor recruitment. By 2017, approximately 59% of special platelets sent are PRA matched. This change resulted in a 2.2 fold increase of finding product in inventory to fill orders quickly.
Conclusion: Developing a system to provide PRA matched platelets is a faster alternative to finding HLA matched platelets thus contributing to better patient care.
CP295
Massive Transfusion Protocol (MTP) Utilization at a Large Academic Hospital
Zhen Wei Mei*, Ariana King, Angela Treml and Geoffrey Wool
University of Chicago
Background/Case Studies: In urgent cases where large amounts of blood products are needed quickly, maintaining a standard massive transfusion protocol (MTP) is critical to the timely delivery of these products. Each MTP pack at UCM contains 6 packed red blood cells (pRBCs), 4 fresh frozen plasma (FFP) units, and 1 plateletpheresis pack; a unit of prepooled cryoprecipitate is also given if the patient is in Labor and Delivery (L&D) or if one is requested. At UCM, blood products are generally transported through the pneumatic tube system (PTS). We undertook a review of our MTP issuing practices and efficiency patterns over the last three and half years.
Study Design/Method: The electronic archives of the Blood Bank laboratory information system and electronic medical record at our institution were queried for patients who had MTP activations. The archives were correlated to paper copies of these activations to collect data pertaining to the relevant information such as where the order originated from, how quickly the first product was sent out, how many products were transfused, and so on.
Results/Finding: Between August 2013 to March 2017, 268 MTPs were activated at UCM, of which 251 orders could be traced to the origin: 118 on inpatient floor (including ICUs), 58 in the operating rooms, 46 in the Emergency Department, 25 in Labor and Delivery, and 4 in other procedure rooms.
Of the 2207 pRBCs that were issued, 1406 were transfused (64% utilized); of the 1446 units of FFP that were issued, 901 were transfused (62% utilized); of the 359 platelet packs that were issued, 246 were transfused (69% utilized); of the 64 units of cryoprecipitate that were issued, 49 were transfused (77% utilized).
Since March 2016, the time of first product issue after the initiation of an MTP has also been tracked. Of the 84 events that fall within this time period, 39 (46%), had the first product issued in 5 minutes or less. Another 31 (37%) were issued between 5‐10 minutes, resulting in over 80% of patients being issued their first blood product within the first 10 minutes. Only 15 of 84 (17%) events had an initial time greater than 10 minutes and none were greater than 21 minutes.
Conclusion: The majority of our activations currently come from inpatient floors (primarily ICUs). As our institution anticipates the introduction of an adult level 1 trauma center, we anticipate this balance will shift. In addition, the data shows that (with the exception of cryoprecipitate) the utilization rate is nearly identical among the blood products sent during MTP activations (∼60‐70%). Again, we anticipate utilization rate of issued MTP products to increase with the introduction of a new adult trauma center. We have recently begun tracking time to last product issued during an MTP, but cannot report on that variable at this time.
Overall, our data show that our transfusion service is generally performing adequately to issue the first product within 10 minutes of MTP protocol activation. This data only reflects time to issue in the PTS; patient care areas can experience additional minutes delay in PTS delivery and arrival of product at bedside. We must continue to collaborate with our clinical colleagues to collect accurate data to provide the best and most efficient MTP care.
CP296
Modification of the Massive Transfusion Protocol (MTP) for Uninterrupted Patient Care
Mehreen Yasin*1, Shailesh Macwan1, Arline Stein1, Jane Fischman1, Nancy Nikolis1, Matthew Bank1, Lennart Logdberg1, Alexander Indrikovs2, Sherry Shariatmadar1 and Vishesh Chhibber1
1North Shore University Hospital, 2Northwell Health
Background/Case Studies: Massive bleeding is generally defined as any patient who requires 1 blood volume replacement within 24 hours and/or receives transfusion of greater than or equal to 4 units in one hour with ongoing bleeding. Our MTP was officially implemented in 2013 in preparation for an initial verification as a Level 1 Trauma Center by ACS. Our MTP has the following packages: 1st pack has a ratio of 4:4:1 (RBCS, Plasma & Platelets) and subsequent packs a ratio of 6:6:1. Our MTP also includes Prothrombin Time (PT), activated Partial Thromboplastin Time (aPTT) and Fibrinogen testing after each pack is transfused. This data is used to assess the patient and allows the transfusion service and clinical team to identify coagulopathies. However, attempts to supplement MTP packs with cryoprecipitate (CRYO) and prothrombin complex concentrate (PCC) were challenging to accomplish in a timely manner.
Study Design/Methods: Due to challenges in timely supplementation of MTP packages with CRYO and PCC, the protocol was modified in March 2016 to add CRYO and PCC at a defined point in the MTP (CRYO is included in the 3rd pack and PCC in the 4th pack). In order to validate this modification of adding these products at defined intervals regardless of laboratory data, we decided to review all patients that received >20 RBC at our institution as these massively hemorrhaging patients would receive PCC based on our current protocol. We reviewed the blood products received by these patients and their available laboratory data.
Results/Findings: We had 8 patients who received >20 RBC in 2015 and 2016. MTP had been activated for all patients and all patients received between 0.5 to 1 unit of plasma for each RBC unit transfused. Despite receiving these ratios of blood products, all patients had elevations of their PT >16 seconds and many had elevations of the aPTT and fibrinogen levels less than our institution's target of 200mg/dL (Table 1). As anticipated, improvement in the coagulation parameters was noted with CRYO and PCC supplementation.
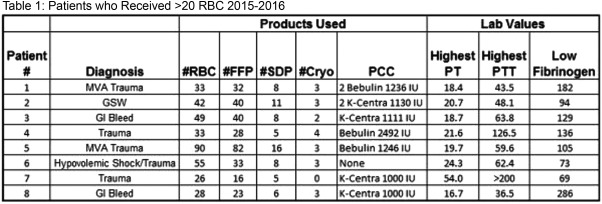
Conclusion: Our data on massively hemorrhaging patients supports a role for supplementation of our MTP with CRYO and PCC in patients who require transfusion of >20 RBC. Our current protocol with the addition of CRYO and PCC at defined intervals has streamlined the process and improved timely provision of these products in bleeding coagulopathic patients.
CP297
Non‐Hemolytic Passenger Lymphocyte Syndrome
Suhua Han* and SGerald Sandler
MedStar Georgetown University Hospital
Background/Case Studies: Red blood cell hemolysis is a key finding for a diagnosis of transplant‐associated passenger lymphocyte syndrome (TA‐PLS). However, whether a hematopoietic stem cell or organ transplant recipient experiences hemolysis when a transplant contains unintended antibody‐forming passenger lymphocytes depends, by chance, on the recipient's blood group phenotype. A living donor liver segment transplant resulted in a case of TA‐PLS with donor‐derived anti‐D that had the potential for causing a clinically significant hemolytic event. The donor's plasma contained anti‐D. Anti‐D was absent in the recipient's pre‐transplant plasma, but present in the recipient's 5‐day and 114‐day post‐transplant plasma. Although these findings established a diagnosis of TA‐PLS, hemolysis did not occur because the recipient's blood group phenotype was D‐. The conventional focus on hemolysis, rather than on the transfer of antibody‐forming lymphocytes, is a diversion from the primary pathophysiology of PLS and limits capturing the true scope of the syndrome.
Study Design/Method: To determine the standard of practice for detecting and diagnosing TA‐PLS, a retrospective 10‐year PubMed search for peer‐reviewed English‐language journal articles was conducted using key words “passenger lymphocyte syndrome.” Cases were categorized according to the presence or absence of hemolysis and whether there was a routine antibody screen to detect donor‐derived, passenger lymphocyte‐formed blood group antibodies.
Results/Finding: Of 63 published cases (31 reports) of TA‐PLS, 8 (4 reports) were stem cell and 55 (27 reports) were organ transplants. All 8(100%) stem cell transplants and 52 (95%) organ transplants were associated with hemolysis, reflecting an overwhelming bias for identifying TA‐PLS associated with hemolysis. Of the 4 reports of stem cell TA‐PLS, 3 actively screened for antibodies in the immediate post‐transplant period, and of the 27 reports of organ TA‐PLS, 1 actively screened for antibodies. These screens detected 5 cases of stem cell TA‐PLS before hemolysis became apparent and 2 cases of organ TA‐PLS with antibodies without hemolysis. It can be inferred that TA‐PLS is currently under‐diagnosed, because hemolysis is not consistently present and/or antibody screens are not performed routinely.
Conclusion: A new category of “non‐hemolytic TA‐PLS” is recommended to capture otherwise undiagnosed cases where TA‐ passenger lymphocytes form blood group antibodies in the recipient, but hemolysis does not occur, as in our aforementioned case. To ensure including the full scope of TA‐PLS, an antibody screen should be performed routinely one week after transplant and repeated as clinically indicated.
CP298
Occult Hemolytic Anemia Due to Anti‐Mur in a Patient Receiving Blood from a Region with a Prominent Asian Donor Population
Jean Oak*1, Rosario Mallari2, Marc de Asis2, Elaine Shu3, Jonathan Hughes4 and Tho Pham1,3
1Stanford University, 2Stanford Health Care, 3Stanford Blood Center, 4BloodSource
Background/Case Studies: Mur antigen is present in 7‐10% of individuals in Southeast Asia, Taiwan, and parts of southeastern China, but is rare elsewhere. Antibodies against Mur antigens are clinically significant, hence many countries in Asia routinely screen for it while other countries, including the US, does not include Mur in the standard screen. We describe a case of an occult anti‐Mur antibody causing anemia and donor ethnicity distribution in a regional blood center with a large Asian donor population.
41 year old Hispanic male with chronic myelomonocytic leukemia and plasma cell dyscrasia developed anemia. Initial antibody screen and DAT were negative, and the patient received 1‐2 RBC units every 1‐2 weeks to maintain a hemoglobin (Hb) level of 8g/dL. The patient remained stable for 5 months when his Hb level acutely dropped to 6.6g/dL. The antibody screen remained negative for an additional 2 months when it became positive for anti‐Jka and anti‐Mur. Donor ethnicity data was available for 30 of the 33 RBC units he received. 3 units were from an Asian donor, and a unit transfused 13 days prior to the Hb drop was from a Caucasian/Chinese donor.
Study Design/Method: We reviewed the ethnicity data of 64,495 donors at a hospital‐associated blood center located in a region where Asians comprise approximately 30% of the population.
Results/Finding: 6.6% of donors identified as Chinese, Vietnamese, Filipino, or other Southeastern Asian. These donors account for 5245 of 37933 (13.8%) RBC collections.
Conclusion: Identification of anti‐Mur in this patient was triggered by the presence of a concurrent anti‐Jka alloantibody. Since over 10% of the RBC supply in the local blood center was collected from Chinese or Southeast Asian donors, chronically transfused patients are at risk of developing anti‐Mur‐mediated hemolysis that could be missed on a standard screen. This finding raises a possible need for blood banks located in regions with a prominent Asian population to implement screening for anti‐Mur.
CP299
Orthovision Automated Analyzers Enable Efficient and Reproducible Measurement of Prenatal Antibody Titers Though Clinical Correlation Studies Are Necessary for Clinical Implementation
Brian Adkins*1, Princess Maynie1, Carol Chandler1, Shelia Garret1 and Pampee Young2
1Vanderbilt, 2Vanderbilt University Medical Center, Department of Pathology, Microbiology and Immunology
Background/Case Studies: Antibody titration is a testing modality vital to both obstetric and transplant services. Manual direct tube testing is associated with variability in results (poor reproducibility/precision) and is also time and resource intensive. In fact, studies have shown a three‐ to eightfold inter‐institutional difference between the antibody titers from the same samples using manual tube method. The OrthoVision automated analyzers offers automated titering of patient plasma using gel technology. Although there is intense interest in adopting automated testing technology for titering, it is well‐appreciated that titers obtained in manual gel testing are much higher than those obtained by manual/direct tube testing. The higher titer results lack clinical fetal anemia and outcome correlations, which is a barrier to their implementation. Moreover, despite the increased sensitivity of gel testing, prior studies have found variable results with regard to reproducibility and precision.3‐5 There is minimal information on the comparisons of tube titers to OrthoVIsion automated titers or assessment of the reproducibility of this automated method.
Study Design/Method: Rh and non Rh minor RBC antibody titrations were performed by manual direct tube method on clinical samples and the same samples were analyzed on three different ORTHO VISION analyzers to assess precision and inter‐instrument reproducibility.
Results/Finding: A total of 26 samples have been analyzed (Table), 17 Rh and 9 non‐Rh antigens. Titers via automated testing on OrthoVision resulted in a mean titration being 2.77 (range 1‐7) times higher. The average fold change for RhD/C/E antibody titers were 3.2, whereas the average fold change for non Rh titers was 1.03 (range 1‐2). The range for anti D titers was particularly variable, 2‐7, whereas for C/E, it was 1‐3. The overall reproducibility/precision of the automated analyzer was ∼90%. To correlate the increased titers observed with some classes of antibodies, particularly anti D, we will be performing parallel testing of obstetric samples and correlating with pregnancy outcome/fetal testing the obtained values.
| Preliminary Titration Data | ||||||
|---|---|---|---|---|---|---|
| Antibody | Vision 1 | Vision 2 | Vision 3 | Precision | Tube | Difference |
| Rh D | 64 | 64 | 64 | 100% | 8 | 3 |
| Rh D | 4 | 4 | 4 | 100% | <1 | 3 |
| Rh D | 256 | 256 | 256 | 100% | 16 | 4 |
| Rh D | 128 | 128 | 128 | 100% | 32 | 2 |
| Rh D | >1024 | >1024 | 100% | 32 | 5 | |
| Rh D | 128 | 128 | 100% | 2 | 6 | |
| Rh D | 128 | 256 | 50% | 32 | 2—3 | |
| Rh D | 128 | 128 | 100% | 32 | 2 | |
| Rh D | 4096 | 4096 | 100% | 32 | 7 | |
| Rh E | 8 | 8 | 8 | 100% | 2 | 2 |
| Rh E | 4 | 8 | 8 | 66% | 1 | 2—3 |
| Rh E | 8 | 4 | 4 | 66% | 2 | 1—2 |
| Rh E | 8 | 8 | 8 | 100% | 1 | 3 |
| Rh E | 32 | 64 | 32 | 66% | 4 | 3—4 |
| Rh E | 8 | 8 | 100% | 2 | 2 | |
| Rh E | 32 | 32 | 100% | 4 | 3 | |
| Rh E | 32 | 64 | 50% | 4 | 3—4 | |
| Fya | 32 | 32 | 100% | 8 | 2 | |
| Fya | 64 | 32 | 100% | 8 | 2—3 | |
| Fya | 1024 | 1024 | 100% | 256 | 2 | |
| Jka | 8 | 8 | 100% | 1 | 3 | |
| K | 16 | 16 | 16 | 100% | 8 | 1 |
| K | 64 | 64 | 100% | 32 | 1 | |
| K | 64 | 64 | 100% | 16 | 2 | |
| K | 4 | 8 | 50% | 2 | 1—2 | |
| M | 8 | 16 | 50% | 8 | 0—1 | |
Conclusion: Automated titration of antibodies using the OrthoVision Analyzers resulted in highly reproducible results between different instruments using the same sample. However, the automated analyzers consistently yielded higher values, particularly with Rh D, with results ∼3 times higher than in manual tube testing. Interestingly, the difference in titers of non Rh antibodies between manual tube and automated testing was not statistically significant, although our n thus far is small. In order to leverage the efficiency and reproducibility benefits of automated titering we will need to establish “critical titer ranges” which require active monitoring of the fetus.
CP300
Platelet Additive Solution Reduces the Isoagglutinin Titer in Apheresis Platelet Units
Maxim Tynuv*, Elizabeth J Furlong and Willy A Flegel
DTM/CC/NIH
Background/Case Studies: Isoagglutinins in the plasma of apheresis platelets are a concern during transfusion, as high titer anti‐A and/or anti‐B may cause a hemolytic transfusion reaction (HTR) in a recipient with cognate antigen. Apheresis platelet collections are usually reconstituted with donor plasma, however most facilities do not test for high titer of isoagglutinins, exposing recipients to the risk of HTR due to plasma incompatibility if given based on short outdate and not ABO type. At our facility testing is performed on all apheresis platelets with a cutoff titer of 250. Units above the cutoff are marked as “high titer” and only given to ABO plasma‐compatible recipients or washed with saline to reduce plasma. However, washing platelets is a time consuming process that results in a loss of up to 33% of the platelets. Platelet additive solution (PAS) is used as an alternative collection and storage solution, replacing approximately 65% of donor plasma in the final product. The goal of this study was to determine what affect PAS has on isoagglutinin titers and whether using PAS could lead to a revision of one facility's procedure for management out of group platelet transfusions.
Study Design/Method: Isoagglutinin titers of whole blood EDTA samples were compared to the final apheresis platelet unit collected in PAS (Intersol, Fresenius Kabi, Lake Zurich, IL). Using two‐fold dilution steps, plasma was tested with pooled red cells (equal mix 0.8% suspension of A1 and B cells, Ortho, Raritan, NJ) in a gel matrix test (MTS Buffered card, Ortho, Raritan, NJ) with 15 min incubation (room temperature) prior to centrifugation (MTS Ortho Workstation). Fifty two donors were group O, 32 group A, and 16 group B.
Results/Finding: Of the 100 whole blood EDTA samples tested, 26 (25 Group O and 1Group B) exceeded a high titer threshold of 250. When the PAS samples of these 26 donors were tested, only one (Group O) exceeded the same threshold. PAS specimens showed a consistent two‐fold decrease in titer compared with whole blood specimens. Nearly half of the group O donors exceeded a titer of 250 when whole blood specimens were tested.
Conclusion: Only one sample from apheresis platelets collected in PAS exceeded our clinically applied titer threshold of 250, a 96% decrease from the number of whole blood specimens exceeding the threshold. Testing the platelet bag collected in PAS instead of plasma from whole blood specimens would lower the number of units exceeding the high titer threshold, and reduce products needing to be washed. Furthermore, facilities not collecting platelets on site or without access to whole blood specimens from donors could implement the process described here and screen platelet apheresis collections for potentially clinically adverse isoagglutinin titers, whether collected using PAS or not.
CP301
Platelet Utilization in Israel in 2016
Naomi Rahimi‐Levene*1,2, Victoria Peer1, Yosef Barshai3, David Menasheof4, Tamar Tadmor5,6, Maayan Shiner7, Evelyn Shabad8, Eyal Scheinman9, Luiza Akira9, Vera Kodakin10, Evgeni Chubar10, Leah Arbov11, Pinchas Krits12, Erica Sigler12, Yossi Glick13, Golda Yaacobi13, Eilat Shinar14, Asher Moser14, Martin Ellis2,15, Lilach Bonstein16, Eldad Dann6,16, Stela Fleischer17, Oleg Pikovski17, Mira Naamad18, Mara Hareuveni19, Ilya Kirschner19, Yifat T Zivony20, Najib Dally20, Bruria Shalev21, Mark Yazer22 and Vered Yahalom21
1Blood Bank, Assaf Harofeh Medical Center, 2Sackler Faculty of Medicine, Tel Aviv University, 3Blood Bank, Barzilai Medical Center, 4Blood Bank, Bnei Zion Medical Center, 5Bnei Zion Medical Center, 6Rappaport Faculty of Medicine, 7Carmel Medical Center, 8Blood Bank, Carmel Medical Center, 9Blood Bank, Galilee Medical Center, 10Blood Bank, HaEmek Medical Center, 11Blood Bank, Hillel Yaffe Hospital, 12Blood Bank, Kaplan Medical Center, 13Blood Bank, Laniado Hospital, 14Magen David Adom, 15Blood Bank, Meir Medical Center, 16Blood Bank, Rambam Medical Center, 17Blood Bank, Soroka Medical Center, 18Blood Bank, Shaare Zedek Medical Center, 19Blood Bank, Tel Aviv Sourasky Medical Center, 20Blood Bank, Ziv Medical Center, 21Blood Bank, Rabin Medical Center, 22University of Pittsburgh
Background/Case Studies: Platelets (PLT) have a 5 day shelf life in Israel thus they are utilized rapidly, and are more susceptible to expiring, than the other components. The majority of blood components in Israel are collected and distributed by Magen David Adom (MDA), from 2 main locations. Several hospitals in Israel also collect platelets in‐house. As part of an effort to understand PLT utilization, a nationwide survey of PLT transfusion and expiration was conducted.
Study Design/Methods: Data on the disposition of all PLT units, acquired from MDA and collected in‐house, during the calendar year 2016 was requested from all hospitals in Israel. The number of PLT distributed to hospitals by MDA was also collected. PLT wastage was defined as the sum of PLT that were returned and not reissued from the hospital blood banks and PLT that expired on blood bank shelves.
Results/Findings: Sixteen of the 27(59%) hospitals in Israel, along with MDA, participated in the survey, listed as A to P. The results are presented in the table along with each hospital's distance from the 2 MDA facilities. For some hospitals, the sum of transfused and wasted PLT was slightly less than the number of PLT supplied by MDA; this is likely due to the small number of PLT that had not either been transfused or expired by the time the data collection period ended. Three of the largest hospitals (C, B and A) collected PLT in‐house in addition to acquiring units from MDA. These 3 hospitals had a lower overall rate of wastage including their own donations than the other 13 hospitals that did not collect in‐house PLT. The other 13 hospitals had wastage rates ranging between 9‐54%. No correlation was apparent between the hospital's distance from the MDA facility or its number of beds and the PLT wastage rate.
| Hospital | Hospital Beds Number | Distance from MDA (Km) | RDP 1 from MDA | SDP 2 from MDA | RDP Donated in Hospital | SDP Donated in Hospital | ||||||||
|---|---|---|---|---|---|---|---|---|---|---|---|---|---|---|
| Supplied | Transfused | Wasted (%) | Supplied | Transfused | Wasted (%) | Donated | Transfused | Wasted (%) | Donated | Transfused | Wasted (%) | |||
| A 3 4 | 960 | 1 | 601 | 585 | 16 (3) | 3616 | 3548 | 68 (2) | ||||||
| B 3 | 1044 | 8 | 10255 | 9682 | 573 (6) | 131 | 125 | 6 (5) | 110 | 110 | 0 | 3740 | 3617 | 123 (3) |
| C 3 | 1138 | 7 | 10438 | 9820 | 610 (6) | 16 | 16 | 0 | 77 | 73 | 4 (5) | 1081 | 1003 | 79 (7) |
| D | 330 | 35 | 1078 | 980 | 98 (9) | |||||||||
| E | 557 | 50 | 1575 | 1418 | 157 (10) | 1 | 1 | 0 | ||||||
| F | 742 | 19 | 3451 | 3066 | 385 (11) | |||||||||
| G | 554 | 30 | 3719 | 3319 | 400 (11) | 4 | 4 | 0 | ||||||
| H 4 | 467 | 8 | 6361 | 5761 | 1001 (16) | |||||||||
| I | 1063 | 120 | 10986 | 9080 | 1826 (17) | 784 | 754 | 30 (4) | ||||||
| J | 506 | 45 | 1911 | 1446 | 465 (24) | |||||||||
| K | 757 | 50 | 12585 | 9265 | 3320 (26) | 167 | 167 | 0 | ||||||
| L | 700 | 24 | 1928 | 1372 | 556 (29) | |||||||||
| M | 848 | 9 | 5234 | 3654 | 1580 (30) | |||||||||
| N 4 | 431 | 4 | 1819 | 1211 | 607 (33) | 109 | 95 | 14 (13) | ||||||
| O 4 | 331 | 83 | 987 | 546 | 441 (45) | |||||||||
| P 4 | 529 | 50 | 1207 | 550 | 657 (54) | 2 | 1 | 1 (50) | ||||||
1 Random Donor Platelets = RDP
2 Single Donor Platelets = SDP
3Also in‐house donations
4MDA Haifa
Conclusion: There is considerable platelet wastage in Israel. Large hospitals in Israel with in‐house donations had the lowest overall wastage rates in comparison to the other hospitals. Factors known to affect PLT utilization and wastage such as patient diagnosis mix, policies about how PLT are issued and accepted back into hospital inventory, PLT inventory size and the time of pooling of whole blood platelets relative to the time they are issued and returned to the blood bank need to be investigated and optimized in order to reduce wastage rates.
CP302
Possible Immune‐Mediated Hemolysis Due to Platelet Transfusion Masked By Underlying Hemolysis in a Patient with Blast Crisis
Sirisha Kundrapu*1,2, Christopher J Gresens3, Anne Capetillo2, Hollie M Reeves1,2 and Katharine A Downes1,2
1Case Western Reserve University School of Medicine, 2University Hospitals Cleveland Medical Center, 3BloodSource
Background/Case Studies: Transfusion‐related hemolysis with ABO‐mismatched platelets is rare with a reported incidence of <0.1%. Most commonly in such cases Group O platelets having high titer anti‐A result in clinically significant hemolysis when transfused to a Group A or AB recipient. We present a patient with a possible hemolytic reaction following transfusion of ABO mismatched platelets presenting in the setting of underlying disease associated hemolysis.
Study Design/Method: A 58‐year‐old male with chronic myelogenous leukemia in blast crisis was evaluated for possible transfusion reaction to a single donor platelet (SDP). Two hours post transfusion he developed chills, rigors, and increased blood pressure (117/65mm Hg to 205/89mm Hg) followed by hematuria (500mL). Chills and rigors resolved; blood pressure stabilized after 15 min with diphenhydramine, solumedrol, and acetaminophen.
Results/Finding: Patient was group A positive; platelet unit was group O positive. Clerical check showed no discrepancies associated with the transfusion. Post transfusion direct anti‐globulin test (DAT)‐polyspecific was negative. Anti‐A was not identified in recipient plasma. Post‐transfusion specimen had no visible hemolysis. Cultures of unit after transfusion were negative. Patient ABO group, Rh (D) type and antibody screen on pre‐ and post‐transfusion specimens showed no discrepancies. Laboratory indicators of hemolysis are summarized in Table. Notably, while total/ indirect bilirubin increased and hemoglobin decreased after transfusion other tests were indeterminate for hemolytic transfusion reaction with abnormal pre‐transfusion levels. Despite underlying disease associated hemolysis, the blood supplier of the unit was contacted to investigate into the possibility of high titer donor anti‐A. This revealed donor anti‐A titer results of 256 (IgM) and 1,024 (IgG); donor was deferred from future platelet donations.
Conclusion: While the post‐transfusion sample had no visible hemolysis and a negative DAT, increased total/ indirect bilirubin after transfusion and high titer donor anti‐A are supportive of immune mediated hemolytic transfusion reaction. The key unique aspect in this case is baseline underlying hemolysis, which may mask needs for further investigation of donor for high titer anti‐A.
TABLE 1. CP302
| Pre‐reaction | One hour Post‐reaction | 4 hours Post–reaction | |
|---|---|---|---|
| Hemoglobin (g/dL) | 9.4 | 8.5 | 8.5 |
| Hematocrit % | 26.4 | 26.3 | 26.3 |
| Total Bilirubin, g/dL | 0.8 | 1.8 | 1.4 |
| Direct Bilirubin, g/dL | 0.1 | ‐ | 0.3 |
| Haptoglobin, mg/dL | <30 | <30 | <30 |
| Lactate dehydrogenase (U/L) | 2215 | ‐ | 2268 |
CP303
Predictive Factors for Red Blood Cell Transfusion Requirements in Liver Transplantation
Ana Paula Hitomi Yokoyama*1, Leila Patricia de Sousa Fontenele1, Isabel Nagle Reis1, Carolina Bonet Bub1, Araci Sakashita1, Raffael Zamper1, Cristiane Nakazawa1, Tatiane Almeida Omura Paula1, Patricia Silva Batista1, Marcio Dias Almeida1, Fernanda Loureiro de Andrade Orsi2 and Jose Mauro Kutner1
1Hospital Israelita Albert Einstein, 2Hemocentro Unicamp‐ Universidade Estadual de Campinas
Background/Case Studies: Orthotopic liver transplantation (OLT) is a high complex procedure, fundamental to therapeutic approach for end‐stage liver disease. Despite improvements in hemostatic , surgical, and anaesthetic techniques, liver transplantation is still associated with massive blood loss and high rates of transfusion requirements. Peri and intraoperative transfusion of red blood cells (RBC) have been previously reported as major predictors of post ‐operative mortality . Identifying predictive factors for transfusion requirements may help optimise patient blood management strategies in OLT. We conducted a single center retrospective analysis of 671 cases of OLT performed between 2011 and 2015 in Brazil in order to identify predictive factors for red blood cell transfusion
Study Design/Method: A retrospective analysis in a single institution was performed, and charts of 671 consecutive patients submitted to liver transplantation between 2011 and 2016 were reviewed. The following variables were collected for each patient: gender, race, primary diagnosis, presence of hepatocellular carcinoma, age, body mass index, corrected model for end‐stage liver disease (MELD), duration of warm and cold ischemia. Categorical variables were analysed using Pearson chi‐square test. Continuous variables were analysed using t‐Student test. A forward logistic regression model was used to analyse data in a multivariate fashion, to identify independent contribution of variables previously found to be significant.
Results/Finding: In univariate analysis, female patients, absence of hepatocellular carcinoma (HCC), primary diagnosis, corrected MELD and warm ischemia time were significantly associated with consumption of RBC use in the intraoperative period. Multivariate logistic regression of these factors showed that female patients (OR 1,726 – 95% CI: 1,147‐2,597, p:0,009), absence of HCC (OR 0,295 ‐95% CI:0,199‐0,437, p:0,0), cirrhosis of any cause (OR 4,161 – 95% CI 1,816‐9,534 – p:0,001), miscellaneous diagnosis (auto‐immune, metabolic diseases, familial amyloid polyneuropathy, vascular complications) (OR 5,236 95%IC 2,212‐12,394) and retransplantation due to primary non function of the graft (OR 5,791 95%CI 1,33‐4,25,206, p: 0,019) were independently associated with RBC transfusion requirements.
Conclusion: In this study, female patients, absence of HCC, specific primary diagnosis and retransplantation due to primary non function of the graft were significantly associated with RBC consumption in intraoperative period. Determination of RBC transfusion predictors before surgery might provide important information regarding management of blood components and help optimise utilisation of resources for blood conservation strategies.
CP304
Prevalence of High‐Titer Anti‐A1/B in Group O Platelet Products.
Charles K. Childers*1, Mark Destree2, Ashley Rose2 and Theresa Nester3,4
1Madigan Army Medical Center, 2Bloodworks Northwest, 3Bloodworks NW, 4Dept of Laboratory Medicine, University of Washington
Background/Case Studies: With platelet substitution policies, minor ABO‐incompatible platelets (where donor's plasma may contain antibodies to recipient's red blood cells) are often issued in an effort to best utilize the community supply. However, rare reports of acute intravascular hemolysis have been reported from such transfusions, and can be attributed to high Anti‐A1 or anti‐B titers, typically in a group O donor. One method to reduce the risk of hemolysis is to identify high titer platelet units prior to transfusion with a subsequent intervention. The percentage of high titer Anti‐A1/B in group O platelet products is presented from a large regional blood center collected over 10‐12 months. Data from both pre‐storage pooled platelet units (PSPP) and apheresis derived platelet units (APLT) is shown.
Study Design/Method: Platelet component samples were collected in 2mL EDTA sample tubes. A single 1:150 dilution of plasma was prepared using a Hamilton MicroLAB 600 series dilutor using 2235.0 µL saline diluent and 15.0 µL platelet component sample. Using a standard transfer pipette, two drops of diluted sample were transferred to each reaction tube along with one drop of A1 or B red blood cell reagent. Reaction tubes were centrifuged immediately in a serological centrifuge at 3175rpm for 20 seconds. Reactions were read using a lighted agglutination reader. The presence of macroscopic agglutination (weak or greater) with either the A1 cells or B cells was recorded as a positive reaction, indicative of a high titer Anti‐A1 or Anti‐B. Retesting of samples was performed to confirm high titers.
Results/Finding:
TABLE 1. CP304
| Platelet product | # tested | % with high titer | Anti‐A1 %* | Anti‐B %* | Anti‐A1 and Anti‐B %* |
|---|---|---|---|---|---|
| Apheresis | 6,651 | 2.77 | 52.9 | 23.5 | 23.5 |
| Pre‐storage pooled platelet | 5,158 | 0.28 | 50.0 | 16.7 | 33.3 |
Average of 5 months.
Conclusion: The above results indicate that, when a titer cut‐off of 150 is used, approximately 3% of group O apheresis platelets will have a high titer, most commonly with anti‐A1. Less than half of a percent of PSPP units will have a high titer.
Testing units for the titer can help to change ABO out‐of‐group platelet substitution policies. In our example, the Bloodworks transfusion service was able to change from a policy of volume reducing any group O apheresis platelets being issued to a group A or AB patient, to giving high titer products to only group O patients. The subsequent decrease in episodes of volume reduction helped to improve overall availability of apheresis platelets, by maintaining their 5 day outdate. After 10 months of testing PSPP units and verifying that the products rarely had a high titer (0.28%), the blood center stopped performing this testing for PSPP units.
CP305
Red Blood Cell Exchange for Management of Passenger Lymphocyte Syndrome Post‐Hematopoietic Progenitor Cell Transplant
Ashish Manne*, Luciano Jose Costa, Marisa Marques, Antonio Di Stasi and Huy Phu Pham
University of Alabama, Birmingham at Birmingham
Background/Case Studies: Passenger lymphocyte syndrome (PLS) refers to post‐transplant hemolysis triggered by antibodies produced by donor B lymphocytes. It is a primary or secondary immune response against the recipient's red blood cell (RBC) antigens usually associated with solid organ and hematopoietic progenitor cell (HPC) transplant. PLS is listed as a category III indication for RBC exchange in the 2016 American Society for Apheresis guidelines, based on 40 patients in 3 case series.
Study Design/Method: A 24‐year old man with relapsed pre B‐cell acute lymphoblastic leukemia 11 days post minor ABO‐mismatched peripheral blood HPC transplant [patient (A, Rh+), donor (O, Rh+)] started complaining of worsening back pain two and half hours after receiving one unit of RBC for a drop in hematocrit to 19% (from 24% on the previous day). His hematocrit did not increase (18%), and over the ensuing 12 hours, he became anuric and jaundiced. Clerical checks confirmed that his forward type was A positive, which was also the type of the RBC unit transfused, but revealed anti‐A at a titer of 8 in his plasma. Furthermore, the direct antiglobulin tests (DAT) were positive for C3 in the pre‐ and post‐transfusion blood samples. Anti‐A was not detected in his plasma collected three days earlier, however. Although his plasma color was amber, he had signs of intravascular hemolysis: undetectable haptoglobin, increased lactate dehydrogenase (LDH) and total and indirect bilirubin
Results/Finding: The positive DAT in the pre‐transfusion sample pointed to ongoing hemolysis prior to the transfusion of the A RBC unit. In the setting of recent ABO‐mismatched transplant, his picture was consistent with hemolysis from newly formed anti‐A by proliferation of donor lymphocytes, or PLS. We performed an emergent RBC exchange using O RBCs with a goal hematocrit of 24% while reducing the number of A RBCs in his circulation by approximately 70%. His pain improved rapidly thereafter, and he had complete recovery of renal function.
Conclusion: PLS should be in the differential diagnosis when suspecting/investigating clinically significant hemolysis in ABO‐mismatched HPC transplant recipients, especially when the HPC source is from peripheral blood. As in our patient, it usually takes 7‐14 days for antibodies to develop and they are short‐lived (3‐5 weeks). Due to the severity of his manifestations, we performed an emergent RBC exchange successfully. Furthermore, this patient's event exposed a vulnerability in our system of issuing the proper blood type for ABO‐mismatched transplant recipients, which has since been remediated electronically
TABLE 1. Parameters before and after transfusion as well as after RBC exchange
| Pre‐transfusion |
Post‐transfusion (pre‐RBC exchange) |
After RBC exchange | |
|---|---|---|---|
| ABO/Rh | A positive | A positive | Mixed field |
| Plasma Color | Amber | Amber | Not done |
| DAT | Microscopically positive for C3 only | Microscopically positive for C3 only | Not done |
| Urine hemoglobin | Negative | Moderate | Not done |
| Antibody Screen | Negative | Negative | Negative |
| Urine RBCs @40x | Negative | 3‐10/field | Not done |
| Crossmatch | Electronic | Incompatible | Not done |
| Hematocrit | 19% | 18% | 25% |
| Total bilirubin (mg/dl) | 1.0 | 13.9 | 11.4 |
| Indirect bilirubin (mg/dl) | Not done | 4.7 | 3.4 |
| LDH (IU/L) | Not done | 1330 | N/A |
CP306
Reduction in Oneg RBC Utilization with Age‐Based Switching for Routine Transfusions
Nancy M. Dunbar*1, Maayan Shiner2, Kathleen Selleng3, Julie Staves4, Mike Murphy4, Milos Bohonek5, Faisal Mukhtar6, Emmanuel Fadeyi7, Yehudit Sharon8, Tamar Tadmor9, Mark Yazer10 and Biomedical Excellence for Safer Transfusion (BEST) Collaborative1
1Dartmouth‐Hitchcock Medical Center, 2Carmel Medical Center, 3Institute for Immunology and Transfusion Medicine, University Medicine Greifswald, 4Oxford University Hospitals NHS Foundation Trust, 5Prague City Central Military Hospital, 6University of Florida College of Medicine, 7Wake Forest University School of Medicine, 8Meir Medical Center, 9Bnei Zion Medical Center, 10University of Pittsburgh
Background/Case Studies: Group O RhD negative (ONEG) red blood cells (RBCs) are a precious resource. To conserve the ONEG inventory while minimizing the risk of RhD alloimmunization in ONEG females of childbearing age, transfusion services may automatically provide group O RhD positive (OPOS) RBCs to RhD negative males and/or RhD negative post‐menopausal females during bleeding emergencies. Despite these conservation strategies, shortages of ONEG RBCs occur. The goal of this study was to determine how the utilization of ONEG RBCs can be optimized using age‐based OPOS switching for routine transfusions in ONEG patients.
Study Design/Methods: Recipient age and ABO/RhD group were obtained for all allogeneic RBC transfusions during the 2016 calendar year from 9 hospitals. An additional hospital* provided data for August‐December 2016. RBC transfusions in patients <1 year of age, and in patients whose age and/or ABO group were unknown, were excluded from analysis. The ABO/RhD group of each RBC unit was compared to that of the recipient to determine the number of ONEG RBCs transfused to all patients, the number of RBCs transfused to ONEG patients and the number of ONEG RBCs transfused to ONEG patients. The number of ONEG RBCs transfused specifically to ONEG patients >/= 70 years was also determined.
Results/Findings: See table 1. The fraction of all transfused RBCs that were ONEG ranged from 5‐14% (row F). The percentage of ONEG RBCs transfused to ONEG patients ranged from 37‐89% (row G); thus, NON‐ONEG patients received 11‐63% of the ONEG units transfused (row H). Hospitals differed widely in the practice of issuing ONEG RBCs to ONEG patients (68%‐100%; row I). Overall use of ONEG RBCs could have been reduced by 10%‐39% if OPOS units had been given to all ONEG patients >/= 70 years old (row J).
Conclusion: During times of ONEG shortage, age based OPOS switching rules may be applied for routine transfusions. This would help to ensure the availability of ONEG RBC units for ONEG females of childbearing age.

CP307
Role of Splenectomy in Red Blood Cell Sensitization in Chronically Transfused Patients.
Rasha Eldeeb Mohammed*1, Nehad Mohammed2, Marwa Aly2 and Nashwa Fahmy2
1National Blood Transfusion Services, 2NBTS
Background/Case Studies: Sensitization to the transfused red cell may complicate further transfusion& make it increasingly difficult to find compatible blood components for those patients. Splenectomy has been shown to increase human leucocyte antigen immunization.
The aim of the study is to evaluated the effect of splenectomy on the occurrence of red cell alloimmunization in humans.
Study Design/Method: This study was conducted on 206 multitransfused patients who received blood transfusion chronically at our central blood center. They were 129 thalassemia patients (128 βthalassemia patients, one patients with α thalassemia), 10 sickle cell anemia patients and 6 immune hemolytic anemia patients (4 auto immune hemolytic anemia patients, one paroxysmal nocturnal hemoglobinemia patient, one immune thrombocytopenic purpra patients). 29 Oncology patients, 32 Chronic diseases patients. History and demographic data were documented. All the patients who received blood are examined for the presence of the spleen.Our patients were subjected to Direct & Reverse Blood grouping (ABO& Rh) tests, alloantibody screening and detection.
Results/Finding: Statistical study is done to determine what is the effect of splenectomy in increasing the rate of red cell sensitization in chronically transfused hemolytic patients. The study revealed that:32 out of 48 (67%) alloimmunized patients and 16 out of48(33%) non alloimunized patients(p<0.001) . statistical analysis show that there is high statistical significant difference between patients who performed splectomy& who did not perform splenectomy as regard form
Conclusion: Patients who had splenectomy had a higher alloimmunization rate Removal of the spleen is not recommended in those patients who are periodically in need of blood and blood components.
CP308
Systematic Reviews of Guidelines and Studies for Single Versus Multiple Unit Transfusion Strategies
Andrew Wei‐Yeh Shih*1, Aixin Liu2, Radwa Elsharawi2, Tyler Michael Cole2, Mark Crowther2 and Nancy M Heddle2
1Vancouver Coastal Health Authority, 2McMaster University
Background/Case Studies: Recent recommendations indicate that one red blood cell (RBC) unit should be transfused at a time with reassessment after each transfusion to determine the need for more. However, this recommendation may be extrapolated from literature demonstrating the benefit of restrictive transfusion triggers rather than specific evidence. Therefore, two systematic reviews of A) RBC transfusion guidelines and review articles to determine if single or multiple unit transfusion strategies are recommended and B) to identify studies comparing strategies were performed.
Study Design/Method: Methods
MEDLINE, EMBASE, CINAHL, Web of Science, National Guideline Clearinghouse, and the Trip Database were searched from inception to June 2016. Screening and data abstraction were done independently by two assessors. For review A, the proportion of articles with recommendations and articles recommending single unit strategies were assessed; stratified by guidelines, systematic reviews, and other review articles. For review B, the primary outcome was RBC utilization. Secondary outcomes included proportion of units transfused using a single unit strategy, length of stay, and mortality. Meta‐analysis was done using the Mantel Haenszel random effects model.
| Articles Included After Full‐Text Review (n=136) | ||
|---|---|---|
| Transfusion Guidelines (n=48) | Systematic Reviews (n=11) | Review Articles (n=77) |
| Articles With Recommendations n=12 | Articles With Recommendations n=13 | |
|
• Single Units Recommended n=11 • Multiple Units Recommended n=1 |
• Single Units Recommended n=12 • Multiple Units Recommended n=1 |
|
Results/Finding: Review A identified 136 articles for data abstraction, where 48 articles were transfusion guidelines. There were 12 guidelines (25%) that made a recommendation, 11 for a single unit and 1 for multiple unit transfusion strategy (Table 1). Review B identified 3 retrospective cohort studies that were eligible and data abstraction was performed. All utilized a policy encouraging single unit transfusion strategies and compared a pre‐implementation period to a post‐implementation period. Meta‐analysis could only be performed on the secondary outcome of the proportion of units transfused using a single unit strategy, which was higher after the policy intervention (OR 9.4, 95% CI 5.02‐17.60), although heterogeneity was high (I2=97%).
Conclusion: Our systematic reviews demonstrated a lack of recommendations amongst guidelines pertaining to transfusing single units of RBCs and only a few retrospective cohort studies to support benefits of the use of single unit transfusion strategies. Additional high quality studies are needed to identify the benefits of a single unit transfusion strategy and when it should be used. Guidelines groups should review research in this area to determine if a recommendation can be made.
CP309
The Effect of PR and PAS Platelets on Solitary Transfusion Events.
Barbara Mendez, Elizabeth McCabe, Delmonte Judith and Joanne Becker*
Roswell Park Cancer Institute
Background/Case Studies: Platelets made with platelet additive solution C (PAS C) and treated for Pathogen Reduction (PR) have been shown to have decreased post transfusion platelet counts from platelets stored in all plasma. With the advent of multiple types of platelets, we are evaluating whether a mixed platelet inventory has had an effect on component use. The literature from Europe has shown that platelet and red cell use does not increase when PR and PAS products are used. Evaluation of RBC use at our institution has shown no change in the number of products transfused per patient per month. We are evaluating whether the mixed inventory has led to more platelet transfusions.
Study Design/Method: We looked at occasions when patients received all of their platelet transfusions on a single day. By doing this we were able to exclude refractory patients from the analysis. The information obtained from routine Quality Management audits of transfusions between December 2016 and February 2017 was used for this analysis. The information included the ordering service, product release time, product code, pre and post counts. Statistical analysis was performed using Minitab.
Results/Finding: During the 3 months, 1723 units of platelets were transfused to 238 recipients. Over the 3 months, a median of 4 units was given to each patient with a range of 1 to 69. The overall distribution of products used was 58% plasma, 24% PR, 7% PAS F and 11% PAS C. Thirty percent of patients (N=72) received all of their products on a single day. Single units were given to 54 patients while 14, 3 and 1 received 2, 3, and 4 units respectively. The distribution by product type was 56% plasma, 25% PR, 13% PAS C and 4% PAS F. This same percentage was present for single and multiple products and was not statistically significantly different from the overall distribution of the products given during the 3 month period (P= 1.00). The distribution by service was different for the groups receiving multiple units. For single units the distribution was 44% hematologic malignancy, 22% infusion clinic (NOS), 13% solid tumor medicine, 11% surgery, and 9% pediatrics. For those receiving multiple units the distribution was 50% surgery and 16% each for solid tumor, hematology and infusion (NOS). The chi‐square test for associations showed the increase in multiple units to surgical patients to be significant with a P value of 0.022.
Conclusion: The distribution of the type of platelets given during a single event of transfusion was not significantly different from the overall distribution of platelets given during the 3 month period. The patient's clinical service was a better predictor of the use of multiple products than the type of product given. This suggests that surgical losses or the need to have a higher platelet count during a procedure was the leading factor in the use of multiple products in this transfusion scenario.
CP310
The Effect of Red Blood Cell Transfusion on Iron Metabolism in Critically Ill Patients
Margit Boshuizen*1,2, Yvemarie B.O. Somsen2, Maike E. van Hezel2, Marleen Straat2, Robin van Bruggen1 and Nicole P Juffermans2
1Sanquin Research and Landsteiner Laboratory, 2Academic Medical Center
Background/Case Studies: Anemia of Inflammation (AI) has a high prevalence in critically ill patients. In AI, iron metabolism is altered, as high levels of inflammation‐induced hepcidin reduces the amount of iron that is available for erythropoiesis. AI is treated by red blood cell (RBC) transfusions. It is known that RBC transfusions increase iron level in neonates and thalassemia patients, but the effect of RBC transfusion on iron metabolism during inflammatory processes is unknown. Since one unit of RBCs contains 220mg of iron and 25% of the RBCs are cleared by macrophages within 1 hour following transfusion, RBC transfusion could increase iron levels and iron availability for erythropoiesis. We investigated the effect of RBC transfusion on iron metabolism in ICU patients, and additionally compared the effect in septic patients to non‐septic patients.
Study Design/Method: In a prospective cohort study in 52 ICU patients who received one RBC transfusion, different iron parameters were measured before and 24 hours after transfusion, to determine the effect of a RBC transfusion over a period of time. Next, the impact of a RBC transfusion on plasma iron parameters in septic patients compared to that in non‐septic patients was analyzed. Plasma iron concentration, transferrin (saturation), ferritin, haptoglobin, hepcidin and IL‐6 levels were determined.
Results/Finding: In this cohort, serum iron levels were low and did not change following transfusion (4.1 vs. 4.3 µmol/L, p=0.69). Also, the transfusion had no effect on transferrin saturation (12 vs. 13 %, p=0.13), ferritin (531.0 vs. 599.0 µg/L, p=0.74) and IL‐6 levels (35.0 vs. 25.5 pg/ml, p=0.09). Hepcidin levels increased in these ICU patients after RBC transfusion (223 vs 332 ng/ml, p=0.01). In septic patients, RBC transfusion induced a decrease in haptoglobin levels compared to baseline, which did not occur in non‐septic patients (‐2.7 vs. 3.7 % change, p=0.05). Other iron parameters did not differ between septic and non‐septic patients.
Conclusion: Transfusion of one unit of RBCs does not increase iron levels in ICU patients. The increase of hepcidin suggests RBC transfusion induced upregulation of hepcidin, despite the absence of a significant increase in IL‐6 or plasma iron levels. This increase in hepcidin levels after transfusion can potentially further hamper iron availability for erythropoiesis. In sepsis, RBC transfusion decreases haptoglobin levels, suggestive of hemolysis. In conclusion, RBC transfusion might have a negative effect on erythropoiesis, due to the increase in hepcidin levels that are observed after transfusion.
CP311
The Effects of PAS and PR on Platelet Use
Barbara Mendez, Judith DelMonte, Elizabeth McCabe and Joanne Becker*
Roswell Park Cancer Institute
Background/Case Studies: With the anticipated release of the FDA guidance: Bacterial Risk Control Strategies for Blood Collection Establishments and Transfusion Services to Enhance the Safety and Availability of Platelets for Transfusion, the use of pathogen reduced platelets (PR) which are often produced from products made with platelet additive solution (PAS) may become more common. Our institution has been transfusing platelets made with additive solutions since 2011 and pathogen reduced platelets have been available since 2016. In our data validating PAS and PR, the post counts from transfusion of PAS‐C and PR products have been statistically lower than platelets in all plasma (PP) or PAS F products. Our study looks at whether this difference has led to a corresponding increase in the number of units of platelets transfused.
Study Design/Method: The data was obtained from the routine quality reports produced for the blood utilization committee at our facility between 2012 and 2016. During this time PAS C, PAS F and PR went from 13% to 40% of all platelet products given. All recipients had an oncology diagnosis. The data collected included the service, unit number and product code. The number of unique recipients was determined monthly. The data was converted to PLT/month/recipient for analysis. Statistical analysis was performed using the two sample T‐test
Results/Finding: The data was normalized to PLT/recipient/month. In 2011 patients received an average of 5.41 units/recipient/month and in 2016 the average was 5.39 units/recipient/month. The intervening data points for 2013, 2014, and 2015 were 5.92, 5.66, and 5.92 respectively. The 5 year average was 5.66. The slope of the graph for all 5 points was y= ‐0.004 +5.672. The two sample T‐test showed that the PLT/recipient/month from 2012 to 2016 was not statistically different with a P value of 0.81.
Conclusion: The implementation of PAS and PR platelets in the oncology environment has not increased in the number of platelet transfusions given. In additional analysis, the red cell use has decreased (data not shown). This can be interpreted as indicating that patients have not had increased episodes of bleeding. Although the post platelet count from PAS/PR platelets may be lower, we do not have evidence from our platelet transfusion data that this is leading to clinical outcomes necessitating additional products to be given.
CP312
The Use of HLA Matched Platelets to Manage Platelet Refractory Oncology Patients
Fleur M Aung*, Ron A Phipps, Benjamin Lichtiger and Vahid Afshar‐Kharghan
The University of Texas MD Anderson Cancer Center
Background/Case Studies: It is reported that the incidence of alloimmunization in AML patients is unrelated to the number of transfusions the patient receives and most patients who have HLA antibodies do not exhibit platelet refractoriness. Many cases are also found not to have any anti‐platelet antibodies detectable by standard laboratory tests. Recent data in leukemia and hematopoietic stem cell (HSCT) recipients transfused exclusively with leukoreduced products show that 4% to 8% develop Alloimmune platelet refractoriness.
Objective: To determine an improvement in platelet count with the match grade and/or the ABO blood group of the HLA matched platelets in highly alloimmunized patients with concomitant non‐immune causes for platelet destruction.
Study Design/Method: Clinically documented platelet refractory patients, who received HLA matched irradiated SDA platelets with their HLA typings for HLA‐A/‐B and HLA Antibody Identification were reviewed. There were two strategies utilized, the HLA strategy (matching recipient and donor HLA‐A/ ‐B types) and the antibody specificity prediction (patient provided with platelets from donors lacking only those HLAs to which the patient had antibodies) strategy.
Statistical Analysis: A One Sample t‐ test using Minitab 17 Statistical software was performed comparing the mean against a platelet increment of a hypothetical difference of at least 5K/ul. The analysis revealed that the mean of 9.35K/ul (n=84) had a 95 percent lower bound confidence interval platelet increment of 7K/ul (p<=0.001)
Results/Findings: 123 (median 4 range [1‐43]) HLA matched leuco‐reduced irradiated SDA platelets were transfused to 17 (6M/11F) patients, median age 60 years (range 27‐83). 15/17 (88%) patients showing broad alloimmunization to HLA Class I/Class II antigens. 2/17(12%) patients had anti‐HPA antibodies (GP IIb/IIIa and GP IIb/IIIa and GP Ia/IIa). The majority 16/17 (94%) had a diagnosis of hematologic malignancy (AML/MDS/MPN/CMML/MM); 9/11 (81%) female patients had prior exposure via pregnancy and 4/11 (24%) had a history of HSCT. 63 (51%) platelets were ABO identical‐platelet increment median 7K/uL (range ‐14 to 61), 53 (43%) were ABO compatible ‐ platelet increment median of 2K/uL (range ‐10 to 46) and 7(6%) were ABO incompatible with platelet increments median 8K/uL ( range ‐10 to 32). Platelet counts were performed within 24 hours in 73 (57%) transfusions. The HLA match grade of the transfused platelets were as follows: Grade A‐ 25 (20%) [platelet increment, median 0 (range ‐7 to 26)], Grade B‐ 87 (71%) platelet increment median 7 [range ‐10 to 61] [B1U‐17(14%), B1X‐14(11%), B1U1X‐22(18%), B1U2X‐1 (0.8%), B2U‐23 (19%) and B2U1X‐3(2.4%)] and Grade C‐11 (9%) platelet count increment median 3 [range ‐10 to 23] [C1X‐ 1(0.8%), C1U‐7 (6%), C1U1X‐3(2.4%)].
Conclusion: We found that the platelet increment was higher in patients who received HLA matched grade B (all B match grades) platelets irrespective of ABO compatibility when compared to the other HLA match grades (A /C) [Figure ‐1] . The findings will have to be confirmed in a larger cohort of patients.
Figure 1.
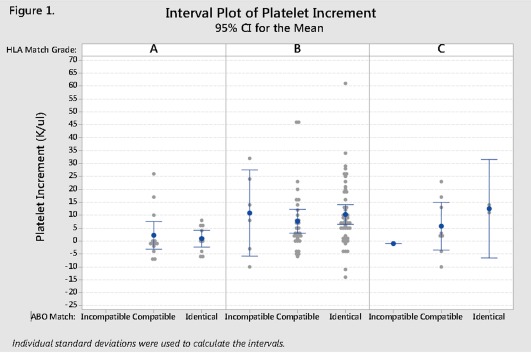
Interval Plot of Platelet Increment in 17 Platelet Refractory patients who received HLA matched Platelets. [Color figure can be viewed at http://wileyonlinelibrary.com]
CP313
The Use of Massive Transfusion Protocol (MTP) in a Community Hospital
Rohini Patel*1, Renee LeBlanc2, Dongfu Xie2, Alice Cabe1 and Yanyun Wu2
1Overlake Hospital, 2Bloodworks Northwest
The Use of Massive Transfusion Protocol (MTP) in a Community Hospital
Background/Case Studies: The establishment and use of massive transfusion protocol (MTP) have become common practice, especially in trauma centers and tertiary hospitals due to significant number of patients with massive bleeding. However, it is not well established if the use of MTP also has value in small hospitals and community hospitals, and how MTP is used in these settings, such as indication for MTP, blood products used, and the outcomes of these patients.
Study Design/Method: Retrospective review of transfusion data from a community hospital with a bed size of about 350 for 3 years (from 2014 to 2016) was performed. Patients with MTP requested are included in this study.
Results/Finding: Please see the table below for the summary of data. Notably, patients with GI bleed and OB bleed are the two most common indications for MTP, and 68 % of patients survived with the support of MTP. In one case, no blood product was used.
| GI Bleed | OB Bleed | Others | Total | |
|---|---|---|---|---|
| No (%) | 18 (34%) | 11 (21%) | 24 (45%) | 53 (100%) |
| Age: Median, Min‐Max | 66 (46‐93) | 33 (27‐42) | 69 (28‐89) | 64 (27‐93) |
| Sex: F/M, No (%) |
6/12 (33.3%/66.7%) |
11/0 (100%/0%) |
13/11 (54.2%/45.8%) |
30/23 (56.6%/43.4%) |
| 30 day mortality |
11/18 (61.1%) |
0/11 (0%) |
6/24 (25.0%) |
17/53 (32.1%) |
| RBC used: Median, Min‐Max |
9.5 (2‐27) |
5 (0‐24) |
7 (0‐16) |
7 (0‐27) |
| Plasma used: Median, Min‐Max |
4 (0‐22) |
2 (0‐16) |
4.5 (0‐13) |
4 (0‐22) |
| Platelet (apheresis platelet equivalent) used: Median, Min‐Max |
1 (0‐3) |
1 (0‐4) |
1 (0‐6) |
1 (0‐6) |
| Cryo (pool of 5) used: Median, Min‐Max |
1 (0‐6) |
1 (0‐4) |
1 (0‐5) |
1 (0‐6) |
Conclusion: The establishment and readiness of MTP can be very important in supporting patients who experience massive bleed in small hospitals and community hospitals. In these settings, MTP is most commonly used for patients with massive GI bleed and Ob bleed.
CP314
Transfusion Management of Sickle Cell Anemia in a U Variant Patient with Anti‐U Alloantibody
Faaria Gowani*, Stephen Copey and Stephanie Bates
University of Oklahoma Medical Center
Transfusion Management of Sickle Cell Anemia in a U Variant Patient with Anti‐U Alloantibody
Background/Case Studies: Providing compatible red blood cells (RBCs) to chronically transfused patients with Sickle Cell Disease (SCD) is a common challenge. If the patient develops antibodies to a high incidence antigen, finding compatible units may become impossible. Included in the MNS system, and residing on Glycophorin B (GPB), the U antigen is absent in less than 0.25% of the black population. Those with altered forms of GPB, known as U variants, can produce a diverse group of antibodies capable of causing mild to severe hemolytic transfusion reactions and hemolytic disease of the fetus and newborn (HDFN). This case illustrates the balance between the need to transfuse and avoiding complications thereof.
A 32‐year‐old Ghanaian woman with SCD and history of chronic transfusion presented with diffuse pain and a hemoglobin value of 6.4g/dL (baseline 9‐10g/dL). She is known to be E, C, K, Fya, Jkb, S, s negative, U variant, and has anti‐E, C and U antibodies. There were no eligible family donors and a nationwide search for compatible blood yielded four crossmatch compatible U variant units. The decision to transfuse was made. The patient had no change in symptoms or vital signs during transfusion but post‐transfusion hemoglobin was 5.9g/dL. A transfusion reaction work‐up was ordered. Post‐transfusion serum sample was negative for hemolysis and no new antibodies were identified. The post‐transfusion DAT was weakly positive only with complement and laboratory data revealed a decrease in total bilirubin (8.8 to 6.2mg/dL). Two additional U variant, crossmatch compatible units were transfused over the next two days restoring her hemoglobin to 6.2g/dL. The patient was discharged to home in stable condition and follow‐up hemoglobin levels continued to rise back to baseline.
Study Design/Methods: Molecular genotyping was used in donor unit selection prior to compatibility testing by transfusion services. Conventional methods were used to monitor the patient's condition pre and post‐transfusion.
Results/Findings: Each donor unit came from a different donor but all were the same GPB genotype as the patient. The patient did not experience an acute or delayed hemolytic transfusion reaction and genotype matching successfully facilitated donor unit selection in this case.
Conclusion: Transfusion of U variant red cells to a U variant patient should be undertaken with great caution due to epitope and antibody heterogeneity. This case highlights the importance of genotype compatibility in selecting donor units for a chronically transfused, SCD patient with anti‐U. Sound transfusion management of such patients requires planning and good communication on the part of clinicians and the laboratory staff.
CP315
Transfusion of Least‐Incompatible (LI) Blood Is Associated with a Lower per‐Unit Hematocrit Change in Warm Autoimmune Hemolytic Anemia (WAIHA) Patients Than Transfusion of Compatible Blood
Zohaib Ishaq*1, Rosetta Shirey1, Lorraine Blagg2, Sandra K. Thoman1 and Patricia A. R. Brunker3,4
1Johns Hopkins Hospital, 2Johns Hopkins Hospital Transfusion Medicine Dept, 3Johns Hopkins University School of Medicine, 4American Red Cross Greater Chesapeake & Potomac Region
Background/Case Studies: Patients with decompensated WAIHA may require transfusion with red blood cell (RBC) products that are cross‐match incompatible due free autoantibodies. The feasibility of blood transfusions in WAIHA patients is controversial because of difficulty in cross‐matching and increased risk of transfusion reactions, since transfused RBCs may be destroyed more rapidly in patients with active hemolysis. To study the actual vs. theoretical risk of increased hemolysis in WAIHA patients, we investigated the post‐transfusion (post‐tfn) hematocrit (Hct) change in WAIHA patients who were transfused compatible RBCs compared to those who received LI blood. We further hypothesized that a post‐tfn Hct would be inversely related to the degree of AHG‐phase incompatibility.
Study Design/Method: We reviewed all transfusions to patients in our quaternary‐care hospital with a history of WAIHA from October 2015 to March 2017. Patient Hcts were ordered by prescribing physicians for clinical purposes. A transfusion episode was defined as all units released in the interval before a post‐tfn CBC. AHG‐phase crossmatch was tube tested in saline per clinical procedure. Transfusion medicine physicians determined the release of least‐incompatible units. Statistical tests were performed with STATCALC (EpiInfo, CDC) and http://www.socscistatistics.com.
Results/Finding: There were 139 RBC products transfused to 40 WAIHA patients. Twenty‐three (57.5%) patients received at least 1 incompatible unit. The mean age was 51.4 years (range 4‐93 yrs) with 50% women. Ethnic composition was 55% African‐American, 40% Caucasian, and 5% patients of mixed/other ethnicity. One hundred fourteen (82%) of these products were released as LI products and 25 (18%) were compatible. Ninety‐three (81.6%) of the LI product transfusions had a post‐tfn Hct change of <3% whereas only 14 (56%) of the compatible product transfusions resulted in a post‐tfn Hct change of <3% (p=0.0092, χ2(1), exact methods). The mean Hct increase in the compatible group was 1.83% per unit vs. a slightly lesser per‐unit increase of 1.71% in the LI group (p=0.82, t‐test, 2‐tailed) Within the LI group, there was no difference in the per‐unit Hct change according to strength of incompatibility (Table). Strength of AHG incompatibility was not available for 12 units. Units that were 3+ incompatible had a lower mean post‐tfn Hct rise compared to all other LI units (1.49% vs. 2.15%); however, this difference was not statistically significant (p=0.38).
Conclusion: The post‐tfn Hct change for transfusions of LI units to patients with WAIHA was less than the expected 3% per unit more frequently than it was for WAIHA patients who received compatible products (81.6% vs. 56%). However, likely due to our small sample size, the mean differences were not statistically significant. Interestingly, there was no difference in the per‐unit post‐tfn Hct according to differing strengths of incompatibility in our sample, although the mean increase for the 3+ LI products was less than all other LI products combined. The increase was unexpectedly low for weakly‐incompatible units, which we are further studying. Future work includes consideration of inpatient vs. outpatient clinical status, effect of co‐incident alloantibodies, comorbidities, and medications.
TABLE 1. CP315
| Strength of incompatible crossmatch | |||||
|---|---|---|---|---|---|
| W | 1+ | 2+ | 3+ | 4+ | |
| N | 20 | 47 | 25 | 10 | 0 |
| Mean post‐tfn Hct change (%): | 0.7 | 1.82 | 1.91 | 1.49 | N/A |
| p=0.18, across 4 means | |||||
CP316
Transfusion Practice and Risk‐Adjusted Mortality According to Hospital Type: Data from the Australian and New Zealand Massive Transfusion Registry
Rosemary Sparrow*, Helen Haysom, Mark Tacey, Zoe McQuilten, Rasa Ruseckaite and Erica Wood
Monash University
Background/Case Studies: Life‐threatening critical bleeding (CB) resulting in massive transfusion (MT) occurs in many different clinical settings and is often unexpected. Opportunities to benchmark outcomes and inform practice improvements are relatively limited due to diversity and complexities across clinical areas and settings. The Australian and New Zealand Massive Transfusion Registry (ANZ‐MTR) collects comprehensive clinical and demographic data on patients who receive a MT, defined as ≥5 red blood cell units (RBCs) within any 4‐hour period. The aim of this study was to compare MT patient characteristics, transfusion practice and risk‐adjusted mortality according to treating hospital type.
Study Design/Method: All patients who received MT in participating hospitals during 2011 to 2015 were included. Patient characteristics and transfusion management was summarised by individual hospital, type and total cases. In‐hospital mortality (adjusted for age, sex, comorbidity, bleeding context and number of RBCs in the first 4‐hours from MT onset) was calculated with 95% and 99.8% control limits to indicate potential outliers. Data were analyzed using statistical software (Stata).
Results/Finding: There were 5482 MT cases from 25 hospitals (17 tertiary‐level, 6 smaller/medium sized acute‐care and 2 specialist women's). Number of MT cases per hospital ranged from 5 to 721. Patient median age was 65 years (IQR 49, 76), 62% were male and 73% required admission to intensive care. The most common clinical groups were cardiac surgery (21% cases), trauma (20%) and gastrointestinal hemorrhage (13%); however there was marked variation between hospitals. Ratios of transfused products, analyzed according to bleeding context, varied between hospital types. The pooled average adjusted in‐hospital mortality for the 17 tertiary‐level hospitals was 21% (range 13% to 33%) and 16/17 (94%) were within the 95% control limit. CB that required ≥10 RBCs within 24‐hours of MT onset occurred in 40% of cases. Comparison of transfusion management for this subset of MT cases showed that patients treated in smaller/medium sized acute‐care were less likely to receive cryoprecipitate than patients treated in tertiary‐level hospitals (67% versus 78%; p=0.03).
Conclusion: Patient characteristics and transfusion practice varied between hospitals and hospital types, however in‐hospital mortality outcomes were comparable. Results are made available to participating hospitals in the ANZ‐MTR to initiate discussion, practice review, and examination of compliance with national standards, patient blood management guidelines and to highlight areas for further investigation. Data are also available for review by governance and policy bodies at state and national level to support practice improvement activities and highlight priority areas for future research.
CP317
Transfusion Under Pressure of Warmed Platelet Concentrates Via a Bone
Lara de Laleijne‐Liefting1, Michaela van Bohemen‐Onnes2, Berry Teunissen3, Frank Kienstra3, Johan W Lagerberg1 and Dirk de Korte*1
1Department of Product and Process Development, Sanquin Blood Bank, 2Erasmus MC, 3The 37 Company
Background/Case Studies: In hospitals and medical centers, in case of big traumas often an intraosseous entrance via a bone needle is combined with a fast flow fluid warmer. With this, infusion fluids, including blood products, are administered under pressure. This is done because veins of trauma patients are often not suitable for infusion of fluids. Suppliers of pump and needles describe the possible transfusion of blood products, but this is mainly limited to plasma and erythrocytes. There is no information available concerning transfusion of platelets under pressure via a bone needle. The aim of the study was to investigate the effects of warming and administration of a platelet concentrate (PC) under pressure via a bone needle on the in vitro quality of platelets.
Study Design/Method: Pools of 5 BCs and 280mL of platelet additive solution III (PASIII) were used to produce PCs (n=5). PCs were stored on a flat‐bed agitator (60 cycles/min) in a temperature‐controlled cabinet at 22 ± 2°C for 4‐7 days. To mimic hospital conditions, PCs were warmed using a blood warmer and transfused via a bone needle to a transfer bag. On the PCs a pressure of 300mm Hg was applied. Using clamps, a flow velocity of 90‐120mL/minute was realized. Platelet quality before and after pressurized simulated transfusion was determined by means of various in vitro parameters.
Results/Finding: Due to priming of the transfusion disposable with saline, the PCs were diluted 10‐30%, resulting in a significantly increased PC volume and decreased platelet concentration after simulated transfusion. Because of loss of platelets in the disposable set, also the total number of platelets was decreased after simulated transfusion. After simulated transfusion, the PCs still fulfilled the requirements for platelet concentration (0.8‐1.6x10¹¹/L) and number (>250x109/unit).
Simulated transfusion had no effect on the percentages of CD62P and Annexin V positive cells, indicating no activation or induction of apoptosis. pH was not influenced by simulated transfusion. Due to the dilution effect, glucose and lactate concentrations were slightly lower after simulated transfusion.
Conclusion: Warming and simulated transfusion of PCs under high pressure via a bone needle has no negative effect on the in vitro quality parameters of platelets. Transfusion of warmed PCs via an intraosseous entrance via a bone needle is not expected to have a negative effect on the in vivo functionality of platelets. It is recommended to study the in vivo effects in a limited clinical study.
CP318
Utility of Low Titer a Plasma in AB Type Patients Receiving Therapeutic Plasma Exchange
Alesia Kaplan*1,2, Joan Sevcik2 and Joseph E. Kiss1,2
1University of Pittsburgh, 2Blood Systems Inc.
Background/Case Studies: Low titer A plasma has been safely used as a substitute for AB plasma in trauma patients. Low inventories of AB plasma can cause a delay in life saving therapeutic plasma exchange (TPE) procedures in AB patients needing plasma replacement. Here, 2 AB non‐bleeding patients are presented who safely received AB and low titer A plasma for TPE. One AB patient who received AB plasma only was used as control to compare hemolysis laboratory data over TPE course.
Study Design/Method: A retrospective review of TPE procedures for 3 patients was conducted from medical records. Number of procedures, volume replaced, total number of plasma units, number of A plasma units, quantity of A plasma and hemolysis laboratory data were recorded. Average quantity (ml) for A plasma and % of A plasma out of total volume of plasma used were calculated. All A plasma units were low anti‐B titer units. In the laboratory, plasma dilution 1:50 is prepared and tested with reagent B cells. If agglutination is not observed, the unit is labeled as “low titer anti‐B”. Hemolysis laboratory data was traced with linear graphs and trends were compared between patient 1 and 2 and 3 (control).
Results/Finding: All 3 patients were AB blood type. Patient 1, a 57 year old female with recurrent ADAMTS13 deficient TTP, received 2 courses of TPE (total 12 TPE procedures) for relapse and exacerbation. Ten out of 12 procedures were performed with AB and A plasma (average 916ml of A plasma or 24% of total plasma volume for 10 TPE procedures). Patient 2, a 27 year old female with thrombocytopenia, schistocytes and presumed TTP, received a total of 12 TPE procedures. Four out of 12 procedures were performed with AB and A plasma (average 1210.5ml of A plasma or 48% of total plasma volume for 4 TPE procedures). Patient 3, a 33 year old female with ADAMTS13 deficient TTP who served as a control, received a total of 10 procedures with AB plasma only. Haptoglobin, LDH, hemoglobin and total bilirubin were graphed and compared between 3 patients. The trends of hemolysis laboratory data for patient 1 and 2 were comparable with patient 3. All 3 patients had negative DAT. Only patient 3 received 2 RBC transfusions. All 3 patients had a favorable clinical outcome with TPE treatments and adequate platelet recovery.
Conclusion: In this study, TPE was effectively performed without evidence of increased hemolysis using up to 48% of low titer A plasma. This approach can reduce strains on limited supplies of AB plasma while providing a vital treatment alternative for AB patients undergoing TPE who require plasma replacement.
CP319
When CD36 Negative Platelet Unit Is Not Available for a Patient with Anti‐CD36 Antibodies
Sameer Khatri*1, Charles Harmon1, Brian R Curtis2 and Chisa Yamada1
1University of Michigan, 2BloodCenter of Wisconsin
Background/Case Studies: Refractoriness to platelet (PLT) transfusion can be caused by antibodies (Abs) against Human Leukocyte Antigen (HLA) class I antigens (Ags) or less frequently against PLT specific Ags (PSAs). Glycoprotein IV (CD36) is one of the identified PLT surface Ags and deficiency is rare, but found in Asians (3‐11%), sub‐Saharan Africans (7‐8%) and also in some people from Mediterranean descent. Two types of CD36 deficiency have been described. Type 1 deficiency is the complete lack of CD36 on both PLTs and monocyte‐macrophages whereas type 2 deficiency lacks CD36 on PLTs with variable expression (12‐99%) on monocyte‐macrophages. Transfusing PLTs in a patient with CD36 deficiency is challenging given the rarity of CD36 negative phenotype and risk of further immunization when giving Ag non‐matched platelets.
Study Design/Method: A patient with CD36 negative phenotype who received multiple PLT units was reviewed in the electronic medical record.
Results/Finding: A 21 year old man developed aplastic anemia following liver injury possibly due to a supplement for body building and required multiple PLT and RBC transfusions. He received more than 20 units of apheresis PLT units over a 2 week period without any significant increase in PLT count. Cross‐match compatible PLT unit found in 1 of 32 units and HLA matched units were tried without success. At that point, a CD36 Ab was identified in the serum and the patient's type 1CD36 deficiency was confirmed by flow cytometry. His HLA class I Panel Reactive Ab (PRA) was 95% due to multiple PLT transfusions, although all Abs were low levels. The patient initially received high‐dose prednisone and thymocyte immune globulin infusions without significant improvement in PLT increase. Following three doses of IVIG, he received a CD‐36 negative (but blood type different and HLA unmatched) PLT unit from his relative with only a slight increase in PLT count. However, he started to respond to CD36 non‐tested apheresis PLTs after receiving a fourth IVIG and two rituximab infusions. Since then, he has received IVIG every 2 weeks. Other medications include filgrastim, eltrombopag, and cyclosporine for treatment of aplastic anemia. The mean corrected count increments (CCI) when post‐transfusion PLT count was available are shown in Table. With desensitization therapy, his CD36 antibody positive reactivity in serial dilutions has reduced from 1:32 to 1:2 dilutions and his HLA Class I PRA has decreased to 37%. He is currently receiving 2 apheresis PLT units twice a week and RBC units periodically. His bone marrow (BM) has been slowly recovering evidenced by increased WBC count from zero to up to 1.0K/µL and slow increase of reticulocyte counts. Current plan is RBC/PLT transfusion support until BM recovers or a haplo‐identical transplant if BM recovery fails.
Conclusion: We report a case with anti‐CD36 Abs that received multiple PLT transfusions. This case demonstrates that decreasing Ab level with immunomodulation can be an alternative option for successful PLT transfusion when compatible PLTs are not available for patients with rare or multiple Abs to PLTs. Table: Mean available CCI for PLT Transfusions
| Type of Platelets (Number of Units) | Mean CCI |
|---|---|
| Pre‐IVIG: All PLT (17) | 0.2 |
| Post‐IVIG: All PLT (41) | 5.5 |
| Post‐IVIG: CD36‐negative PLT from relative (1) | 0.8 |
| Post‐IVIG: Single Donor Apheresis (23) | 4.3 |
| Post‐IVIG: Cross‐match Compatible (15) | 6.1 |
| Post‐IVIG: Flow Cross‐match Compatible PLT (2) | 12.6 |
Transfusion‐Transmitted Infectious Diseases
CP320
A Blood Center's Experience Screening Donations for Babesia Microti Using Enzyme‐Linked Immunoassay Methodology
Nancy Van Buren*, Jed Gorlin, Vanessa Reynolds and Deborah Anderson
Innovative Blood Resources
Background/Case Studies: Our blood center, located in an area considered to be moderately endemic for Babesia microti, implemented universal screening of red cell collections from Minnesota and Wisconsin under an investigation new drug (IND) study in Oct 2015 utilizing the Immunetics investigational enzyme‐linked immunoassay (ELISA) performed by Creative Testing Solutions (CTS). This test was selected as the most cost‐effective approach for universal screening of blood donors, as opposed to the investigational IFA/PCR test combination.
Study Design/Methods: We performed a retrospective analysis of our screening test results and deferral rates for 2016 to evaluate for seasonality, donor ABO bias, deferral rates, and outcomes of lookback investigations. Since an opt‐out of this research test was originally offered, we report donor opt‐out rates.
Results/Findings: From Jan through Dec 2016, 101,854 blood donations were screened for B microti by Immunetics ELISA. Of those, 267 (0.26%) were positive. The percent of positive donations was evaluated monthly revealing a variable reaction rate between 0.08% and 0.42%. No patient Babesia transmission has been reported since implementing this test, but we only had 4 documented Babesia TTD cases from 2007‐2017. Donors who previously tested negative demonstrated an increased seroconversion rate during the summer months, consistent with historical seasonal variation corresponding with tick season in Minnesota and Wisconsin. Test performance characteristics were analyzed by ABO group with no demonstrable differences in positive rates. The opt‐out rate of donors who chose not to be tested significantly decreased over time, reflecting an increased acceptance of this test. Of 267 positive test results, 160 lookback investigations were initiated representing 59% of positive donations. Lookbacks were only performed when there was a donation within 12 months of the new positive screening test, according to IND protocol. No confirmatory testing was performed per IND protocol or for donor counseling, so the true positive rate is unknown. In the prior IND trial, up to 80% were unlikely to transmit infection in our region, i.e. were PCR and blood smear negative. Although a small number of antibody positive, PCR negative donors may be actively infected, no transfusion‐transmitted Babesia infections were identified by lookback investigations. Notification of blood donors with positive screening results was also performed and information provided for healthcare provider follow‐up. Overall, donor deferral represented 0.25% loss of eligible donors during this follow‐up period. Deferred donors were invited to participate in other research collections not requiring volunteer donor eligibility.
Conclusion: Testing for B microti may help improve blood safety, particularly in endemic regions. Although only 0.25% of donors have a positive reaction, this represents a significant loss of eligible donors over time, most of whom are unlikely to transmit infection. A direct test capable of detecting Babesia in individuals with very low levels of organisms without the need for concurrent antibody testing would be ideal. A reinstatement protocol for donors who test positive should also be considered. Nonetheless, the current method of screening is inexpensive compared to PCR‐based methods.
CP321
A Comparative Survey of Anellovirus Loads in the Plasma of US Blood Donors and Kidney Transplant Recipients
Lirong Qu*, Holly Bilben, Diane Metes and David T Rowe
University of Pittsburgh
Background/Case Studies: Human anelloviruses are the smallest in particle size, smallest in genome size, and least complex in genetic organization of all human pathogens. They establish a chronic persistent infection in infancy or early childhood and produce a constantly detectable load in plasma thereafter. Some studies suggest they are ubiquitous, present in >90% of the human population, and that immune surveillance is required to control the level of the virus load.
Study Design/Methods: We have developed a quantitative DNA PCR assay for the most conserved region of the Anellovirus genome that detects all known genotypes of the virus. We used this assay to examine viral loads in the plasma of US blood donors and transplant recipients pre‐transplant and three months post‐transplant.
Results/Findings: For 53 blood donors, 51 were positive with an average load of 1.49x10² copies/mL of plasma, a median value of 80.5 copies/mL of plasma, ranging from 0 to 1.87x10³ copies/mL. Pre‐transplant viral loads were similar. For 41 transplant candidates, 40 were positive with an average of 3.70x10² copies/mL of plasma, a median value of 88 copies/mL of plasma, ranging from 0 to 1.18x10⁵ copies/mL. Post‐transplant viral loads were remarkably different. For 94 transplant recipients, all were positive with an average of 3.14x10⁵ copies/mL of plasma, a median value of 1.25x10⁵ copies/mL of plasma, ranging from 0 to 4.6x10⁷copies/mL.
Conclusion: These results validate the PCR assay that was developed and confirm that detectable viral loads of around 100‐200 copies were present in >90% of the blood donors surveyed. In addition, the effect of post‐transplant immunosuppressive therapy has caused an increase in the viral load of at least 2 orders of magnitude above that of non‐immunosuppressed individuals.
CP322
An Innovative Multiplexed and Flexible Molecular Approach for the Differential Diagnosis of Arboviruses
Fanny Leon*1, Albert Meyer2, François Morvan2, Jean‐Jacques Vasseur2, Myrielle Dupont‐Rouzeyrol3, Isabelle Leparc‐Goffart4, Pierre Gallian5, Vincent Foulongne1, Jean‐François Cantaloube1 and Chantal Fournier‐Wirth1
1Pathogenesis and Control of Chronic Infections (EFS ‐ Inserm ‐ Université de Montpellier), 2UMR5247, CNRS, UM, ENSCM Institut des Biomolécules Max Mousseron (IBMM), 3URE Dengue et Arboviroses, Institut Pasteur de Nouvelle‐Calédonie (IPNC), 4CNR arbovirus ‐ IRBA ‐ UMR D190 Emergence des pathologies Virales, 5EFS Alpes‐Méditerranée, UMR D190 Emergence des pathologies Virales
Background/Case Studies: The screening of blood donors and travelers returning from endemic/epidemic areas has highlighted the importance of multiplex diagnostic approaches for the simultaneous analysis of various pathogens. Furthermore, in the context of similar clinical signs, the differential diagnosis of arboviruses during acute infection is essential to discriminate the causative agent for patient management and epidemiological surveillance. The development of a flexible diagnostic approach is a key challenge to face the continuing emergence of arboviruses, belonging to flavivirus and alphavirus, such as Dengue virus (DENV), West Nile virus (WNV), Zika virus (ZIKV), Yellow Fever virus (YFV), Usutu virus (USUV) and Chikungunya virus (CHIKV).
Study Design/Method: An innovative diagnostic approach combining generic RT‐PCR amplification and identification on low cost microarrays has been developed. We have patented original polythiolated probes grafted on maleimide‐activated microplates for the robust, sensitive and specific detection of the viral genomes. Analytical performances of the test were evaluated on viral standards and on clinical samples: DENV (1/2/3/4), WNV, ZIKV and CHIKV. Forty human plasmas from blood donors with no history of contact with arboviruses were used as negative controls. We have designed two sets of degenerated primers for the generic RT‐PCR amplification of all flaviviruses and for CHIKV. Biotinylated amplicons were captured on complementary grafted polythiolated probes on microplate. After addition of streptavidin‐europium label, the molecular hybridization events were detected by time‐resolved fluorescence using a microplate reader.
Results/Finding: One original generic probe for DENV and specific probes designed for each of the four DENV serotype, WNV, the two ZIKV lineages and for CHIKV, were validated. The use of our methodology combining the amplification of the viral genomes and their identification using polythiolated probes shows 100% of specificity, with no false positive results on the 40 control samples, and no cross reactions. Using viral reference standards, we have observed sensitivities of 1 TCID50/mL for DENV‐1, DENV‐3 and CHIKV and of 10 TCID50/mL for DENV‐2, DENV‐4 and ZIKV. Finally, the first results obtained on 110 DENV(+), 69 ZIKV(+) and 50 CHIKV(+) clinical samples show 85%, 87% and 96% correlation respectively between our approach and commercial or in house real time RT‐PCR methods.
Conclusion: This innovative strategy allows the development of flexible, highly sensitive and easy to handle platforms dedicated to the multiplex screening and identification of emerging viruses. This methodology is adapted for the easy inclusion of additional molecular targets to improve the surveillance and the prevention of arboviral infections.
CP323
Babesia Microti Serological Testing with Pooled Samples: A Feasibility Study
Laura Tonnetti*, Aaron Thorp, Letitia Dixon and Susan L Stramer
American Red Cross
Background/Case Studies: Blood donation screening for Babesia microti, a tick‐borne intraerythrocytic parasite endemic in the Northeast and Upper Midwest US, is performed under an investigational study using nucleic acid and immunofluorescence assays (IFA). However, IFA is a time consuming and labor intensive procedure. With the possibility of an FDA licensed screening assay(s) in the near future, we investigated if B. microti testing by IFA in pools of plasma or serum could be a feasible screening approach.
Study Design/Method: To test if the increased amount of plasma or serum interferes with background fluorescence, pools of 4, 8, 16 and 32 were prepared from 192 plasma or 192 serum samples determined to B. microti‐negative by individual IFA screening. The pools were tested by IFA with or without a blocking step using bovine serum albumin (BSA) and goat serum to minimize background fluorescence. Potential interference from multiple pooled plasma or serum samples on the endpoint titer of positive samples was investigated by including positive samples with endpoint titers from 1:128 to 1:1024 (2‐fold dilutions) in the pools.
Results/Finding: Non‐specific fluorescence was visible in pools of 16 or higher and was not eliminated by the addition of a blocking step. Pools of 4 or 8 samples did not show significant increased background. There was no difference between testing of pooled serum or plasma samples. When one single positive sample was included in the pools of 4 or 8 samples, the pool tested positive and the final titer was the same as the positive sample tested individually. When two or more positive samples were included in the pools, the final titer of the pools was equal to the sample with the highest titer.
Conclusion: This study represents a proof of concept that serological testing for B. microti by IFA in pools of up to 8 plasma or serum samples does not increase false positivity while maintaining the sensitivity of the test.
CP324
Determination of Plasma Resistance of Microorganisms Used for Bact/ALERT®VIRTUO™ Detection System Platelet Study
Mary E. Adamik*, Mary Beth Anheuser, Jenna Klein and Parampal Deol
BioMerieux
Background/Case Studies: The rapid detection of bacterial contamination in platelets is key to reducing the risk of infection in transfusion of blood components. The BacT/ALERT VIRTUO* is an advanced, next generation system with improved automation, connectivity and with data management systems. The VIRTUO's new algorithm significantly reduces the time to detection (TTD) of microorganisms during quality control testing of platelet preparations using BacT/ALERT (BTA) BPA (aerobic) and BPN (anaerobic) bottles. As plasma is known to be bactericidal, a study was completed to evaluate plasma susceptibility/resistance for organisms considered for VIRTUO studies.
Study Design/Method: Human plasma (thawed and pooled) and saline controls were seeded with ∼100 CFU/mL of 12 organisms associated with platelet contamination and incubated at room temperature for 18‐24 hours. Colony counts were performed initially and after incubation. Plasma resistance was determined if the colony count of the seeded plasma was equivalent or higher (+ 1 Log) than the colony count of the seeded saline after incubation.
Results/Finding: The serially diluted strains and all BioBall™ strains except P. aeruginosa, NCTC 12924, were determined to be plasma resistant. The BioBall™ P. aeruginosa was susceptible to the antimicrobial effects of human plasma, but when spiked into 4mL of Leukocyte Reduced Apheresis Platelets (LRAP) and inoculated into BTA BPA bottles and loaded into the BTA 3D and VIRTUO the organism was recovered 100% .
TABLE 1. Determination of Plasma Resistance CFU Counts After Incubation
| Organism | 10‐5 | 10‐6 | 10‐7 | Resistant (R)/ Susceptible (S) | % Recovery in LRAP | |||
|---|---|---|---|---|---|---|---|---|
| Serially Diluted Strains | S1 | P2 | S1 | P2 | S1 | P2 | VIRTUO & 3D | |
| E. coli | 158 | TNTC3 | 13 | TNTC3 | 1 | 359 | R | N/A |
| E. cloacae | 738 | 223 | 140 | 17 | 10 | 2 | N/A | |
| K. pneumoniae | 120 | 76 | 11 | 6 | 1 | <1 | N/A | |
| S. marcescens | 511 | 585 | 31 | 58 | 6 | 21 | 100 | |
| S. sanguinis | 29 | 410 | 1 | 38 | 1 | 2 | 100 | |
| P. aeruginosa | 104 | TNTC3 | 16 | TNTC3 | 2 | 37 | N/A | |
| BioBall Strains | Lot 1 | Lot 2 | Lot 3 | Resistant (R)/ Susceptible (S) | % Recovery in LRAP | |||
|---|---|---|---|---|---|---|---|---|
| S1 | P2 | S1 | P2 | S1 | P2 | VIRTUO & 3D | ||
| P. aeruginosa | TNTC3 | <1 | TNTC3 | <1 | TNTC3 | <1 | S | 100 |
| C. perfringens | 1 | TNTC3 | <1 | TNTC3 | 13 | TNTC3 | R | 100 |
| S. aureus | 401 | 63 | 609 | 45 | 386 | 46 | 100 | |
| S. epidermidis | 75 | 78 | 71 | 78 | 100 | |||
| S. pyogenes | 57 | 625 | 66 | 575 | N/A | |||
| B. cereus | 87 | TNTC3 | 88 | TNTC3 | 100 | |||
| E. coli | TNTC3 | 707 | TNTC3 | TNTC3 | 100 | |||
1Saline 2Plasma 3Too Numerous To Count
Conclusion: Results confirm that previously tested organisms and additional strains are plasma resistant with the exception of P. aeruginosa, NCTC 12924. However, the BPA bottles still recover P. aeruginosa in the presence of LRAP. BPA/BPN bottles inoculated with select organisms from this panel in the presence of 4mL LRAP demonstrated 100% recovery when loaded onto the VIRTUO and 3D( Table 1). Further studies may be required to determine if higher test volumes of LRAP could affect the recovery of plasma sensitive strains.
* VIRTUO is not FDA cleared for platelet testing
CP325
Effective Inactivation of Ross River Virus in Blood Components through Nucleic Acid Targeting
Andrew Laughhunn1, Felicia Santa Maria1, Yvette Girard1, Peter Bringmann1, Marion Lanteri*2 and Adonis Stassinopoulos2
1Microbiology Department, Cerus Corporation, 2Scientific Affairs Department, Cerus Corporation
Background/Case Studies: Ross River virus (RRV) is an RNA arbovirus belonging in the Togaviridae family within the genus Alphavirus. RRV is endemic to Australia where the enzootic transmission cycle involves Aedes and Culex mosquito vectors, with kangaroos and wallabies as mammalian reservoirs for the virus. Over 40 mosquito species are competent vectors, including A. aegypti and A. albopictus, which frequently are associated with Zika virus and Chikungunya virus (CHIKV) transmission. A. notoscriptus, identified as a major urban vector of RRV, is also capable of transmitting Dengue virus 1‐4, and has recently been found in Los Angeles, illustrating an expansion in range. With the growing geographical distribution of Aedes species mosquitoes, the potential for RRV to enter local transmission cycles outside of Australia is significant. In 2014, a probable transfusion‐transmission (TT) was confirmed as the cause for an RRV infection in Australia, validating the reality that RRV TT can occur. RRV morbidity leads to clinical manifestations that are similar to CHIKV infection, with varying degrees of arthralgia, which can become debilitating. Various asymptomatic to symptomatic infection ratios have been reported, but this further increases the risk of additional TT in endemic areas and could mask the spread of the disease globally.
Study Design/Method: Platelet concentrates (PC) prepared in PAS were inoculated with RRV, amotosalen was added to final concentration of 150 µM and the units were treated with UVA light. Pre‐ and post‐treatment illumination samples were collected for titration.
AS‐5 RBC units were contaminated with RRV, mixed with processing solution/glutathione (GSH) and treated with amustaline at a final 200 µM concentration. Pre‐ and post‐treatment samples were removed prior to amustaline treatment and 3hrs after amustaline addition, respectively, for titration by plaque assay on Vero76 cells. Log reduction was calculated as the difference between the mean infectious titer in pre‐ vs. post‐treatment samples.
Results/Finding: Inactivation of RRV was achieved to the limit of detection in PC and RBC. In PC, >5.1 log10 or log10/mL of RRV was achieved, with >5.5 log10 or >5.2 log10/mL of RRV inactivated in RBC.
Conclusion: These studies illustrate that amotosalen/UVA and amustaline/GSH treatments are effective at inactivating RRV in PC and RBC, respectively. These data corroborate previous results achieved with other alphaviruses, including CHIKV and Mayaro virus which are inactivated at high titers in PC and RBC, demonstrating the ability for these systems to mitigate TT potential and maintain safe blood component availability in endemic areas.
(Data have not been submitted for FDA review and INTERCEPT for red blood cell is not approved for commercial use).
CP326
Effective Pathogen Inactivation with Amotosalen/UVA Using a Triple Storage Set for Platelet Components
Nidhi Patel1, Felicia Santa Maria2, Kelsey Goldbeck1, Andrew Laughhunn2, Cheryl Goldbeck1, Shannon McNally1, Tatiana Wilson1, Oscar Aguilera1 and Adonis Stassinopoulos*3
1Cerus Corporation, 2Microbiology Department, Cerus Corporation, 3Scientific Affairs Department, Cerus Corporation
Background/Case Studies: The INTERCEPT® Blood System for platelets is designed to inactivate pathogens and contaminating leukocytes. This photochemical treatment process utilizes amotosalen and low energy ultraviolet A (UVA) light. The current available sets include Small volume (SV; 255‐325mL), Large Volume (LV; 300‐390mL) and Dual Storage containers (DS; 300‐420mL) designed to treat platelet doses between 2.9 and 8.0x10¹¹.
The new Triple Storage (TS) set was designed to expand the dose range to 12.0x10¹¹ and the maximum volume to 650mL, generating either 2 or 3 doses of pathogen reduced platelet components (PC). The objective of this study was to evaluate the effectiveness of the system by performing log reduction assays using representative gram positive and negative bacteria and enveloped and non‐enveloped viruses in platelets suspended in PAS, or 100% plasma using TS Set.
Study Design/Methods: For each experiment, a platelet pool was prepared either in 47% plasma/53% PAS or 100% plasma with a final volume of ∼650mL and a dose of 9‐12 × 1011 platelets. These conditions represent inactivation using the lowest amotosalen concentration (135 µM) and highest concentration of platelets. Platelet units were inoculated with high titers of viruses, or bacteria and treated. Control (Pre‐UVA) and Test (Post‐UVA) samples were serially diluted and cultured. Plates with suitable media were used for bacteria, whereas viral titers were determined using plaque assays. Log reduction was calculated as the difference between the log10 titers in Control (pre‐UVA) and Test (post‐UVA) samples.
Results/Findings: The inactivation of representative viruses and bacteria (Table)
| Platelet product |
Pathogens (N=4) |
Pre‐UVA Titer | Post‐UVA Titer | Log10 Reduction/mL |
|---|---|---|---|---|
| (log10 /mL) | ||||
| 47%Plasma/ 53% PAS | E .coli | 6.0 | <‐1.0 | >6.0 |
| E. cloacae | 6.4 | <‐1.0 | >6.4 | |
| K. pneumoniae | 6.6 | <−0.1 | >6.5 | |
| S. aureus | 6.7 | <‐1.0 | >6.7 | |
| Blue Tongue Virus | 4.9 | <‐1.0 | >4.9 | |
| Bovine Viral Diarrhea Virus | 4.6 | <‐1.0 | >4.6 | |
| Adenovirus‐51 | 3.9 | <‐0.6 | >3.9 | |
| 100%Plasma | K. pneumoniae 1 | 6.5 | ≤‐0.5 | >6.5 |
| S. aureus 1 | 6.2 | <‐0.7 | >6.2 | |
| Adenovirus‐5 1 | 4.5 | <‐0.6 | >4.5 | |
1 N=3
Conclusion: High levels of viral and bacterial reduction are achieved in platelet concentrates when treated with the INTERCEPT Triple Storage Set.which are similar to the values obtained with the single dose kits.
(The triple storage set has not yet been licensed by FDA for INTERCEPT platelets).
CP327
Efficient Inactivation of Mers Coronavirus in Human Plasma with Amotosalen and UVA Light
Salwa I Hindawi1, Anwar M Hashem*2, Ghazi A Damanhouri3, Sherif A El‐Kafrawy2, Ahmed Sherif2 and Esam I Azhar2
1King Abdul Aziz University Hospital, 2Special Infectious Agents Unit, King Fahd Medical Research Center, King Abdulaziz University, 3Department of Medicine, Faculty of Medicine, King Abdulaziz University
Background/Case Studies: The Middle East Respiratory Syndrome Coronavirus (MERS CoV) is a zoonotic pathogen endemic in Arabian Peninsula and other countries in the Middle East region; it was first detected in 2012 causing severe respiratory illness in humans with a mortality rate of 36%. Dromedary camels were identified to be the reservoir of MERS CoV, transmission to humans occurs through direct and indirect contact. MERS CoV has been detected with high genomic titers of 6‐10 logs in respiratory secretions of MERS patients, and with lower genomic titers of 4‐5 logs in blood. The presence viral particles in the blood of acute patients gives rise to concerns, especially in endemic areas. The high mortality rate, especially for critically ill patients, which often require blood transfusion, raises the need for a method to safely exclude MERS CoV contamination of blood products. Pathogen Reduction with Amotosalen/UVA technology is a widely established technology with a broad range of data supporting clinical efficacy and safety of Amotosalen/UVA treated blood products. The aim of the study is the assessment of the MERS CoV inactivation efficacy in human plasma with Amotosalen/UVA pathogen inactivation technology to safely exclude the presence of infectious virus in human plasma units.
Study Design/Method: Four therapeutic human plasma units were spiked with a fully characterized MERS CoV clinical isolate followed by pathogen inactivation with Amotosalen/UVA (INTERCEPT Blood System, Cerus Corporation) at four different days. Pathogen reduced samples were taken pre‐ and post‐pathogen reduction after various processing steps to assess the infectious titer by plaque assay titration and the genomic titer by real‐time‐PCR. Samples post pathogen reduction have been passaged 3 times up to 9 days, assessing the infectious titer and genomic titer every 3rdday to exclude the presence of low‐titer infectious particles.
Results/Finding: All viral particles in the plasma units were completely inactivated with an average efficacy of ≥5.8 log infectious titer. No viral replication was observed after 9 days of passaging post inactivation. The genomic titer was only slightly affected by pathogen inactivation, which is designed to target the infectious titer, but not the physical titer.
Conclusion: Amotosalen alone had a slight effect on the infectious titer while Amotosalen/UVA effectively inactivated all infectious MERS CoV viral particles in the plasma units with an inactivation efficacy above 5 logs infectious titer, giving evidence for improved blood safety of Amotosalen/UVA treated plasma in MERS CoV endemic regions.
CP328
Estimating the Prevalence and Incidence in a National Blood Service in Taiwan for HCV Eradication Program
Yun‐Yuan Chen*1, Jen‐Wei Chen1, Chi‐Ling Chen2, Sheng‐Nan Lu3 and Pei‐Jer Chen2
1Department of Research, Head Office, Taiwan Blood Services Foundation, 2Graduate Institute of Clinical Medicine, College of Medicine, National Taiwan University, 3Division of Hepatogastroenterology, Department of Internal Medicine, Kaohsiung Chang Gung Memorial Hospital
Background/Case Studies: World Health Organization (WHO) has set a goal to eliminate HCV by 2030, and the epidemiological indicators generated from a national blood service is useful to monitor the effectiveness. This study aimed to evaluate the prevalence and incidence of HCV infection in Taiwan.
Study Design/Method: In Taiwan, anti‐HCV (since 1992) and 8‐sample mini‐pools triplex nucleic acid test of HCV, HBV and HIV (since 2013) have been used in the routine blood screening. Prevalence of anti‐HCV and HCV RNA were estimated in the first‐time donors during 1999‐2016 and 2013‐2016, respectively. Age‐standardized prevalence and its 95% confidence interval (95% CI) were calculated with adjustment of WHO world standard population 2000‐2025. For the incidence study, donors who have donated blood two or more times during 2013‐2016 and who were without a history of anti‐HCV positive before the follow‐up period were included. The incidence and its 95% confidence interval was estimated from the number of new HCV RNA positive cases divided by the person‐years of follow‐up.
Results/Finding: The crude prevalence of anti‐HCV in the first‐time donors was dramatically decreased from 15.2 per 1,000 donors (95% CI: 14.8‐15.7) to 4.0 per 1,000 (95% CI: 3.7‐4.3) during 1999‐2016, and the age‐standardized prevalence was also decreased from 27.0 per 1,000 donors (95% CI: 25.6‐28.4) to 7.7 per 1,000 (95% CI: 6.9‐8.5). The age‐standardized prevalence of anti‐HCV was generally higher in female donors before 2015, but it was significantly higher in male donors at 2016 (p‐value=0.03). A total of 1,036 HCV RNA positive cases, 1.9% of them were anti‐HCV negative, identified from 579,286 first‐time donors during 2013‐2016, and the crude and age‐standardized prevalence of HCV RNA was 1.8 per 1,000 (95% CI: 1.7‐1.9) and 5.0 per 1,000 (95% CI: 4.3‐5.7), respectively. Crude prevalence of HCV RNA was significantly higher in female donors (p value <0.0001), but no significant difference was found after age standardization (p value=0.93). Both the prevalence of anti‐HCV and HCV RNA were increased with age (p for trend<0.0001). In the incidence study, a total of 68 new HCV RNA positive cases, 23.5% of them were anti‐HCV negative, found from 1,202,165 donors followed for 2,415,668 person‐years. The incidence of HCV RNA was 2.8 per 100,000 person‐years (95% CI: 2.2‐3.5), and no significant difference was observed between both genders (p‐value=0.41) and between age groups (p for trend 0.37).
Conclusion: The prevalence of HCV infection has been dramatically decreased by 71.5% during 1999‐2013. It becomes significantly higher in male donors and that needs to monitor in the future. Incidence of HCV RNA is low in repeat blood donors and it needs to identify more incident cases to observe the epidemiological characteristics.
CP329
Evaluation of Nucleic Acid Testing for Blood Donors;four Years Study of the Egyptian Population
Dalia Ashour*1, Sahar Muhmmad2 and Dalia El Dewi2
1National Blood Transfusion Services, 2Azhar University
Background/Case Studies: Blood safety is a challenge in Egypt because of the high prevalence of HCV and HBV. Nucleic acid amplification test (NAT) technologies have the potential to detect viremia earlier than current screening methods, which are based on seroconversion. The primary benefit of NAT is the ability to reduce residual risk of infectious WP donations. The estimated reduction of the WP utilizing NAT for HCV is 70‐12 days, HIV from 22 to 11 days, and HBV from 25‐30 days. Study Design/Method: This cross sectional study was conducted in National blood Transfusion Center (Giza, Egypt) from 2012 to 2015, The total number of donor samples to be screened is 178685, The age of the donors ranged from 18 to 50 years, and they were of both sexes (M: F = 3:1).Screening by NAT Ulterio assay (Grifols Diagnostics; formerly Novartis Diagnostics) was done in parallel with EIA testing for HBsAg, HCV‐Ab and HIV Ag/ Ab. using individual donation NAT (ID‐NAT). Multiplex NAT yield samples are further tested using the discriminatory assay in order to ascertain which viral nucleic acid is present in the donor sample. Statistical analysis Chi‐square (χ2) test was used to measure the association between two qualitative variables.
Results/Finding: NAT screening detected a total of 75 NAT yield donations among 178685 (0.04%) seronegative donors. Among these 75 NAT yields cases, 53 (0.03%) were reactive for HBV, 20 (0.011%) were reactive for HCV and 2 (0.001%) were reactive for HIV‐1. We stratified the age of the donors into 3 groups; group A (18 – 28 years), group B (29 – 39 years) and group C (40 – 50 years). The prevalence of NAT yield to the three viruses was significantly higher in either group B or C, compared to group A (p = 0.0089; with 95% confidence interval (CI) = 0.0085 ‐ 0.0520 & p = 0.0247; with 95% CI = 0.0025 ‐ 0.0534 respectively).
Prevalence of NAT‐ HBV; was significantly higher in age group B, as compared with group A (p = 0.0224; with 95% CI = 0.0032 ‐ 0.0413). On the other hand, there was no statistically significant difference between groups C and A and between groups B and C. Comparing groups B and C combined with group A found a significantly higher prevalence of HBV in the former (p = 0.0335; with 95% CI = 0.0015 ‐ 0.0352).
NAT‐HCV; did not differ significantly between the three groups (p = 0.3222; with 95% CI =‐0.0089 to 0.0161 between groups A and B & p = 0.1340; with 95% CI = ‐0.0055 to 0.0270 between groups A and C & p = 0.4277; with 95% CI = ‐0.0080 to 0.0215 between groups B and C). NAT‐HIV; did not also differ significantly between the three groups (p = 0.3801; with 95% CI =‐0.0077 to 0.0077 between groups A and B & p = 0.3172; with 95% CI = ‐0.0056 to 0.0077 between groups B and C). In either group A and C, no NAT‐HIV detected. NAT yield to the three viruses was significantly higher in males than in females (p = 0.0013; with 95% CI = 0.0136 to 0.0507). NAT HBV was significantly higher in males (p = 0.002; with 95% CI= 0.0103 ‐ 0.0413), but the prevalence of either HCV or HIV did not differ significantly between males and females (p = 0.3835; with 95% CI = ‐0.0077 ‐ 0.0145 & p = 0.2751; with 95% CI = ‐0.0044 ‐ 0.0066; respectively).
Conclusion: In this study The NAT yield of 75in 178685 assumes more significance when one considers the fact that single donation is used for generating 3 components that can be used by 3 recipients. Hence, in effect the NAT yield becomes 3 times that is, 225in 178685. Saving 225 recipients from TTI out of 178685 (0.13%) is indeed very significant.
CP330
Experience with Screening Donors for Babesia Microti in an Endemic Area
Susmitha Edappallath MD*, Stuart Weisberg, Debra Kessler and Beth Shaz
New York Blood Center
Background/Case Studies: Babesia is a tick borne intra‐erythrocytic parasite. Babesia is responsible for transfusion transmitted babesiosis (TTB). Donor deferral based on the health history did not adequately mitigate the issue. Currently, there is no FDA approved blood screening test for babesia. However two platforms are available for screening under an IND.
Study Design/Method: From May 2016‐March 2017 donors were screened by an investigational enzyme immunoassay (EIA) for a combination IgG and IgM antibodies to Babesia microti (Immunetics, Inc. Boston, MA). The samples were tested by Creative Testing Solutions (CTS, Phoenix, AZ). From May 2016‐March 2017 donors were screened by Enzyme Immunoassay for a combination IgG and IgM antibodies to Babesia microti under US FDA Investigational New Drug Program (IND). Serum samples were collected from blood donors to perform the test. A signal/Cut off value (S/CO) ≥1 was considered positive. Repeat‐reactive samples were defined as those with at least two of three reactive (S/CO≥1.0) results. Donors with repeat reactive results were indefinitely deferred from blood donation and lookback performed on previous collections from the previous year.
Results/Finding: Of the 303,569 donors who were tested by our donor center, 1,386 (0.460%) were repeat reactive. A seasonal pattern in the prevalence was observed with the highest number of donors being positive in summer, and then progressively declining during the fall and winter months and increasing again in spring. There was a single case of transfusion transmitted babesiosis reported from our center during this period. A patient who was transfused with two units of packed red blood cells (RBCs) from two donors in the beginning of July presented in August for further transfusion and was found to have parasitemia in the peripheral blood smear and was subsequently diagnosed with babesiosis. The donors were called back, however one of them could not be tracked. Samples were sent to the state for further testing: An Immunofluoresence assay was performed (combination of IgG, IgM and IgA). The test was positive at 1:128 titer. The screening ELIA S/CO of this donor was 0.2782. Both donors were indefinitely deferred as blood donors.
Conclusion: Our data confirm a decreased risk in transfusion transmission with the use of a screening assay. Prior to implementation of the screening there were 6‐10 transfusion transmitted babesia cases per year from 2008‐2015 (Table 2). In the 11 months after implementation of pre‐transfusion babesia screening, one break through case of transfusion transmitted babesia was observed (1in 303,569 donors tested). Thus the babesia EIA screening test effectively prevents TTB. However, there was a substantial loss of donors due to being screen positive.
TABLE 1. CP330
| Year | Month | Tested | Initial reactive(IR) | IR% | Repeat Reactive(RR) | RR% |
|---|---|---|---|---|---|---|
| 2016 | 5 | 19,800 | 74 | 0.374 | 63 | 0.318 |
| 2016 | 6 | 33,358 | 280 | 0.839 | 248 | 0.743 |
| 2016 | 7 | 29,908 | 234 | 0.782 | 209 | 0.699 |
| 2016 | 8 | 28,128 | 206 | 0.732 | 176 | 0.626 |
| 2016 | 9 | 27,093 | 150 | 0.554 | 135 | 0.498 |
| 2016 | 10 | 27,308 | 120 | 0.439 | 102 | 0.374 |
| 2016 | 11 | 27,624 | 133 | 0.481 | 113 | 0.409 |
| 2016 | 12 | 30,675 | 96 | 0.313 | 84 | 0.274 |
| 2017 | 1 | 26,520 | 92 | 0.347 | 84 | 0.317 |
| 2017 | 2 | 24,654 | 85 | 0.345 | 73 | 0.296 |
| 2017 | 3 | 28,501 | 108 | 0.379 | 99 | 0.347 |
| Total | 11 | 303,569 | 1,578 | 5.585 | 1386 | 4.901 |
TABLE 2. CP330
| Year | BabesiaCases | RBC collections |
|---|---|---|
| 2008 | 8 | 462,960 |
| 2009 | 8 | 470,182 |
| 2010 | 6 | 441,250 |
| 2011 | 10 | 441,275 |
| 2012 | 6 | 427,100 |
| 2013 | 7 | 419,137 |
| 2014 | 10 | 404,016 |
| 2015 | 8 | 393,150 |
| 2016 | 3 | 393,040 |
CP331
Four Years of Experience with ID‐NAT at a Tertiary Care Centre in North India: Implications for Transfusion Transmission and Donor Screening.
Jasmeet Singh*, Amarjit Kaur, Gurpreet Kaur, Rajesh Kumar and Sonia Gupta
Dayanand Medical College and Hospital
Background/Case Studies: Transfusion transmitted diseases are a challenge for transfusion medicine specialists and patient care providers around the globe. Blood safety is a formidable task especially in a high population country like India. Newer technologies like ID‐NAT equip us to screen and prevent transfusion transmitted viral infections and prevent their transmission by improving over the sensitivity and specificity of conventional methods.
This study aims at examining the effect of ID‐NAT as an additional test on the safety of blood supply.
Study Design/Method: A retrospective observational study was conducted to analyze the data of 4 years of additional NAT testing at Blood Bank, DMCH, Ludhiana from September 2012 to December 2016.
Results/Finding: Results 1.73% (2041 of 118021) units were initially NAT reactive. These units were further tested, of which 90.98% were discriminated (70 HIV, 1051 HCV, 726 HBV and 10 co‐infections). The remaining 6.71% (137) were repeat non‐reactive and 1.91% (39) could not be discriminated.
Overall, NAT yield rate was one in 837, whereas virus‐specific NAT yield rates were one in 59,010 for HIV, one in 1873 for HCV, one in 1639 for HBV and one in 29,505 for HBV/HCV Coinfections, respectively.
Conclusion: ID‐NAT screening of all blood donations at our institution over past 4 years has increased the screening sensitivities to check viral load and prevented transmission of 141 probable transfusion transmitted viral infections. Assuming 100 % component preparation it saved 423 transfusion recipients from harm.
Implementation of NAT along with routine serological tests for screening of the blood donations definitely improves the transfusion safety and should be mandated across all transfusion centers.
CP332
Identification of Emerging Infectious Pathogens in Healthy Blood Donations in China Using Metagenomics Analysis
Min Xu1,2, Wei Mao3, Tao He3, Yashan Yang1,2, Zhan Gao1,2, Chunhong Zhang3, Hongmei Liao3, Jingxing Wang1,2 and Miao He*1,2
1Institute of Blood Transfusion, Chinese Academy of Medical Sciences & Peking Union Medical College, 2Sichuan Blood Safety and Blood Substitute International Science and Technology Cooperation Base, 3Chongqing Blood Center
Background/Case Studies: Many emerging infectious pathogens are known to be existed in heathy blood donations, and could be transmitted via transfusion with potential hazardous consequences against recipients. With more convenient application of high through put sequencing, it becomes much easier to investigate uncultured microbiome in qualified blood donations. Therefore, metagenomics analyses were used to reveal emerging and re‐emerging infectious diseases in healthy donations which might potentially threat the blood safety.
Study Design/Method: Pooled plasma sample were collected from 5,000 voluntary blood donors from Chongqing, China. Total DNA and RNA were extracted and amplified with random primers PCR respectively in order to construct a 250PE library to peform deep sequencing by Illumina Miseq. All reads were trimmed to remove low quality bases and adapter sequences. The fully overlapping paired‐end reads passing the quality filter were concatenated using PEAR. We classified the final reads using Kraken and a Kraken database made from complete RefSeq bacterial, archaeal and viral genomes, along with the GRCh37 human genome. The unclassified reads by Kraken were aligned to NCBI nt database using BLASTn with cut‐off E‐value as 1E‐5. The best alignment hits were used to classify the reads. Krona was used to generate all taxonomic distribution plots. Finally, the potential emerging and re‐emerging infectious pathogens were identified out of the classified microbiome by experience.
Results/Finding: 1.23 GB raw data with 2,450,046 reads were generated in the DNA library. Meanwhile, 1.98GB raw data with 3,967,242 reads were generated in the RNA library. After cleaning the human background, 211 reads from bacteria, 98 reads from viruses, and 341 reads from parasites were identified (Table 1). No hazardous viruses were identified as potential threats to blood safety. Except for viruses and bacterias which would do limited hazards to blood safety, plenty of parasites were identified in which some were already considered as threats to blood safety in some developed countries were also discovered such as Plasmodium sp. and Leishmania infantum (Table 1).
Conclusion: The investigation has revealed the metagenomics of the qualified blood donations in Chongqing, China. The results showed a though‐provoking discovery of genomic fragments of some microbes which might threat the blood safety. The displayed serious results let us have to think about regulating some reasonable screening methods as well as donor recruitment strategy in certain epidemic areas or seasons to ensure the blood safety. However, on the contrary, the results should be considered more cautiously because the existing of genomic fragments could not represent the existing of infectious pathogens. The validity of the metagenomics hints were suggested to go through epidemiological investigations and specifically tested under laboratory ways such as bacteria or virus culturing to ensure the vitality of those pathogens.
TABLE 1. Annotation of microbes in qualified blood donations
| Taxonomy | Reads | Taxonomy | Reads | ||
|---|---|---|---|---|---|
| Bacteria | Escherichia coli | 153 | Parasites | Toxoplasma gondii | 276 |
| (Partial results) | Pseudomonas sp. | 7 | (Partial results) | Spirometra sp. | 39 |
| Ralstonia pickettii | 5 | Plasmodium sp. | 4 | ||
| Propionibacterium acnes | 4 | Leishmania infantum | 2 | ||
| Staphylococcus sp. | 4 | Others | 20 | ||
| Acinetobacter baumannii | 1 | Virus | Torque teno virus | 21 | |
| Others | 37 | Avian leukosis virus | 77 |
CP333
Implementation of Pathogen Reduction in a Small‐Scale Caribbean Setting
Luigi Sille and Ashley John Duits*
Red Cross Blood Bank Foundation
Background/Case Studies: The Caribbean has become an endemic region for several emerging viruses in the last decade. After a Chikungunya outbreak in 2015 most recently Zika was shown to be endemic on the Caribbean island of Curacao. To effectively provide safe blood products in an endemic region the conventional international recommendations of donor exclusion and testing do not seem a viable option and could severely affect the local blood supply. Pathogen reduction (PR) is considered an important new approach with potential benefits. The introduction and experience of use of PR platelets in the Dutch Caribbean over a period of one year is presented.
Study Design/Method: Pathogen reduction of thrombocyte concentrates by use of riboflavin and ultraviolet treatment (Mirasol PRT, Terumo, Belgium) was introduced. All thrombocyte concentrates provided to the general hospitals on the Dutch Caribbean islands of Curaçao, Bonaire and Sint Maarten were PR and data collected over the period of 1 February 2016 to 1 February 2017.
Thrombocyte concentrates are prepared out of 4 single donation units by the buffycoat method.
Results/Finding: Over the period 260 platelet concentrates were provided to adult and pediatric patients. These included patients on the intensive care and neonatal intensive care departments. No adverse events were reported and the CCI for each transfusion was within the expected outcome.
Introduction of PR had minimal impact on the logistics of thrombocyte concentrate preparation and availability. Furthermore no transfusion related bacterial contaminations were reported.
Conclusion: PR of platelet concentrates seems viable and safe for use in a small scale Caribbean setting with endemicity for emerging viruses like Chikungunya and Zika. It offers a realistic alternative for conventional recommendations of donor exclusion and testing, thereby helping to maintain sufficient labile blood product availability.
CP334
Implementation of the 1st Zika Virus Screening Testing in the United States
Michael Phillips*1, Germán Leparc2, Phillip C Williamson1, Lani Palmer1, Ben Reynolds1, Maria Noedel1 and Lindsey Houghton1
1Creative Testing Solutions, 2OneBlood
Background/Case Studies: Due to the risk of travel and sexually transmitted Zika infections, the Food and Drug Administration issued a guidance document on February 16, 2016 recommending that blood centers in Puerto Rico cease distribution of locally collected blood products unless donors are tested or products are pathogen reduced by March 1, 2016.
With the high incidence of Zika virus (ZIKV) in Puerto Rico and uncertainty of the impact to the continental U.S. blood supply, there was intense pressure to implement a donor screening test for ZIKV. The project was initiated on February 16, 2016 and included clinical trial requirements, client onboarding and laboratory operations. Stakeholders consisted of clients, the manufacturer, Institutional Review Boards (IRB), Informational Technology (client and lab based), the Food and Drug Administration (FDA), the Centers for Disease Control CDC, and the Florida Department of Health.
Clinical trial requirements included development of instrument and assay validations, SOP creation, result reporting, assay and clinical trial training, deviation management, donor notification, and follow up sample handling. Client onboarding began with confidentiality agreements between the client and the sponsor. A Zika based webinar was created to provide an overview of the sponsor protocol, lab test system and client responsibilities. The complexity of the project increased when mosquito borne Zika transmission was identified in two counties in Florida. This required ZIKV testing to be performed on collections in both Florida and Puerto Rico. The ZIKV‐NAT is performed in singlet, unlike the MPX and WNV assays which are run in mini‐pools. This had a significant impact on instrument capacity. Despite these obstacles and the changing regulatory requirements, the ZIKV screening test was implemented within six weeks.
Study Design/Method: One metric used to measure client service levels is our ability to meet established upload time goals for individual clients. The percentage of samples released on time is evaluated daily with a running monthly total.
Results/Finding:
TABLE 1. 2016 Result Upload Performance
| Jan | Feb | Mar | Apr | May | Jun | Jul | Aug | Sep | Oct | Nov | Dec | YTD |
|---|---|---|---|---|---|---|---|---|---|---|---|---|
| 93% | 92% | 94% | 94% | 96% | 91% | 89% | 79% | 86% | 91% | 90% | 91% | 91% |
Our upload time goals were negatively impacted from July through September due to the unexpected increase in ZIKV testing, the requirement to perform testing in singlets and the resulting instrument capacity issues. Additional instruments were sourced in October and operations stabilized.
Conclusion: On February 16, 2016, the project to implement a ZIKV IND test was initiated. Six weeks later, testing was performed on the first batch of samples. Despite the changing regulatory requirements over time, the implementation was extremely successful. Initiating a new IND testing within 6 weeks is unprecedented and required exceptional collaboration between all participants and stakeholders.
CP335
Inactivation of Plasmodium Falciparum with a System Designed for Treating Whole Blood in the Developing World
Andrew Laughhunn1, Cisse Sow2, Philippe Grellier2, Soraya Amar El Dusouqui3, Nina Mufti4, Marion Lanteri*5 and Adonis Stassinopoulos5
1Microbiology Department, Cerus Corporation, 2Museum National d'Histoire Naturelle, 3Transfusion CRS Suisse SA, 4Cerus Corporation, 5Scientific Affairs Department, Cerus Corporation
Background/Case Studies: Plasmodium falciparum (Pf), an intraerythrocytic protozoan parasite, is accountable for nearly all malaria mortality in Africa. In 2015, WHO reported ∼212 million new cases worldwide, resulting in >400,000 deaths. Malaria prevalence is highest in sub‐Saharan Africa, home to 90% of all infections accounting for 92% of mortalities. Both the incidence and prevalence of malaria in Africa significantly increase the potential for transfusion‐transmission (TT), with little to no screening of products in developing countries. The objective of this study was to evaluate the inactivation of Pf in Whole Blood (WB) using a system specifically developed for the realities of the developing world and in support of the Swiss Red Cross Humanitarian Foundation for Whole Blood Pathogen Inactivation for Africa. The inability to consistently supply blood components leads to routine WB transfusion, and as transfusion‐transmitted diseases are prevalent in the developing world, the establishment of a robust WB pathogen inactivation system is desirable. The approach uses the small molecule amustaline to form covalent adducts and crosslinks within nucleic acids of leukocytes and contaminating pathogens to prevent replication. The process includes addition of 0.2mM amustaline and 2mM glutathione (GSH) and a 24h at room temperature (RT) incubation after which the treated WB unit is suitable for storage up to 7 days at RT.
Study Design/Method: For each experiment, a WB unit was spiked with ring‐stage Pf‐infected red blood cells (iRBC). A pre‐treatment sample was removed prior to addition of amustaline and a post‐treatment sample was removed 24h after amustaline addition to determine the pre‐ and post‐treatment titers to calculate the level of inactivation. These samples were serially diluted in flasks containing medium with 5% fresh RBCs. The diluted samples were used to inoculate flasks in quadruplicate and monitored for parasitemia by counting iRBC in blood smears and by flow cytometry. Pre‐treatment cultures were terminated after reaching >1% parasitemia, while no residual Pf was detected in post‐treatment cultures. Log reduction was calculated as the difference between the mean titer in pre‐ and post‐treatment samples.
Results/Finding: Robust inactivation of Pf in WB was achieved to the limit of detection, at >7.5 log10 or >6.0 log10/mL.
Conclusion: Pf was inactivated to the limit of detection in WB after treatment with amustaline/GSH, illustrating that the system has potential to mitigate the risk for Pf transfusion transmission in endemic regions that lack testing capacity and operate under the constraint of a very limited blood component supply and rely on WB transfusion.
(This system for WB is not approved for commercial use).
CP336
Increased Patient Safety and Improved Inventory Management with 7 Day Apheresis Platelets
Nancy M. Dunbar* and Zbigniew M. Szczepiorkowski
Dartmouth‐Hitchcock Medical Center
Background/Case Studies: A pathway currently exists for apheresis platelet (AP) outdate extension from 5 to 7 days using an FDA cleared rapid test (RT). In February 2016, our hospital based transfusion service implemented the use of RT on day 5, 6 and 7 to routinely extend AP shelf life to 7 days. Prior to this, we tested APs by RT on day 4 and transfused day 6 or day 7 units with physician approval when deemed medically necessary. This report describes changes observed in transfusion practice and platelet inventory management one year following routine use of 7 day platelets.
Study Design/Methods: Data were obtained for two 12‐month study periods: October 2014‐September 2015 (pre‐implementation) and February 2016‐January 2017 (post‐implementation). The interval transition period was intentionally excluded. For each study period, we determined the total number of APs transfused, RT status on the day of transfusion, total number of RTs performed, expired AP units, and APs obtained from suppliers using ad‐hoc ordering. We also obtained hospital data including inpatient admissions, surgical volumes, average length of stay and case mix index.
Results/Findings: Data are shown in Table 1. The number of AP transfusions increased by 7% post‐implementation, comparable to a 4% increase in inpatient admissions and an 11% increase in surgical volumes. The hospital length of stay and case mix index were similar for both periods. The average number of platelet transfusions per patient was not statistically different (3.16 pre; 3.12 post, p=0.91). The number of RTs performed increased by 130%. The percentage of transfused units tested at least once by RT prior to transfusion increased by 21% (p<0.0001). The outdate rate decreased from 5% to 2% (p<0.0001). Ad‐hoc ordering decreased from 21% to 9% (p<0.0001).
Conclusion: Use of an approved RT for routine AP outdate extension to day 7 was associated with increased patient safety as more transfused units underwent secondary testing prior to transfusion. Increased cost of RT was offset by reduced AP waste and less frequent need for ad‐hoc ordering.
TABLE 1. AP Transfusion Practice, Inventory Management and Hospital Volumes
| Pre‐Implementation | Post‐Implementation | |
|---|---|---|
| Total number of AP Units Available | 2182 | 2268 |
| Units obtained by ad‐hoc ordering | 462 (21%) | 205 (9%) |
| Transfused AP Units | 2070 | 2217 |
| Transfused after RT performed | 679 (33%) | 1207 (54%) |
| Expired AP Units | 112 (5%) | 51 (2%) |
| RTs performed | 917 | 2093 |
| Inpatient Admissions | 19626 | 20411 |
| Surgical Volumes | 14467 | 16050 |
| Average Length of Stay (days) | 5.88 | 5.58 |
| Average Case Mix Index | 2.02 | 2.07 |
CP337
Molecular Surveillance of Hepatitis B and C in Canadian Blood Donors
Sheila O'Brien*1, Vito Scalia1, Carla Osiowy2, Michael Carpenter2, Anton Andonov2 and Margaret Fearon1
1Canadian Blood Services, 2Public Health Agency of Canada
Background/Case Studies: The rates of hepatitis B (HBV) and hepatitis C virus (HCV) positive donations are low (6.6 and 4.9 per 100,000 donations, respectively) and most are among first time donors. We aimed to determine the frequency of various genotypes of HBV and HCV in Canadian blood donors confirmed positive for HBV and HCV.
Study Design/Methods: In 2011 the Roche multiplex assay (HCV/HIV/HBV) was implemented in minipools of 6 units. HCV NAT was in place since 1999 (using minipools of 24) but this is the first time donors have been screened by HBV NAT. HBsAg, anti‐HBc and anti‐HCV were tested using the Abbott PRISM assay. Confirmatory testing for HBsAg was by the PRISM neutralization assay. Anti‐HCV repeat reactivity was confirmed by the Inno‐Lia HCV Score Line Immunoassay. Since March 2016 all samples testing HBV NAT positive, or confirmed positive for HBsAg and all HCV NAT positive or anti‐HCV confirmed positive samples were considered positive and samples were sent to PHAC for sequencing. A sample from each positive donation was aliquoted and frozen at ‐20oC. Genotyping was carried out by sequence and phylogenetic analysis of the HBV surface antigen coding region. HCV viral RNA was extracted and subjected to reverse transcription and PCR amplification in the 5' NTR‐E1 and NS5B regions. Sanger sequencing of these regions represents approximately 15% of the genome.
Results/Findings: All confirmed positive donations were whole blood donations. There were 42 HBV positive donations. Of these, 37 had tested HBV NAT positive. Genotypes were 8 type A, 6 B, 4C, 17 D and 2 E. There were 5 samples HBV NAT negative but HBsAg positive (2 were anti‐HBc reactive). Of these, 4 could not be sequenced and one was genotype A (also anti‐HBc reactive). There were 30 samples considered HCV positive. Of these, 17 samples were HCV NAT positive. Genotypes were 5 type 1a, 3 1b, 3 2c, 2 2b and 4 3a. There were also 13 samples HCV NAT negative but anti‐HCV positive. None of these could be sequenced.
Conclusion: The first 8 months of molecular surveillance show a range of genotypes for HBV and HCV for samples identified as NAT positive. To date no samples that were NAT negative anti‐HCV reactive could be sequenced, however one NAT negative sample that was positive for HBsAg and anti‐HBc reactive was HBV genotype A. Surveillance over a longer period is required to gain a complete picture of the diversity of genotypes in Canadian blood donors and to determine if there are any samples not identified by combined NAT/anti‐HBc screening or by NAT only for HCV that can be sequenced with these methods.
CP338
Multicenter Comparison of the BacT/ALERT Virtuo and BacT/ALERT 3D Instruments for the Rapid Detection of Bacterial Contaminants in Leukocyte Reduced Apheresis Platelets
Michael Jacobs*1, Caryn E Good1, Jennifer Allen2 and Carl McDonald2
1University Hospitals Cleveland Medical Center, 2National Bacteriology Laboratory, NHS Blood and Transplant
Background/Case Studies: The BacT/ALERT 3D Microbial Detection System (BTA 3D) is currently FDA cleared for the quality control testing of Leukocyte Reduced Apheresis Platelets (LRAPs). The BacT/ALERT VIRTUO Microbial Detection System (VIRTUO) (bioMérieux, St. Louis, MO) is a new generation of BacT/ALERT instrumentation. The underlying colorimetric technology used in previous generations of BacT/ALERT is used in the VIRTUO and incorporates new instrument architecture to improve temperature stability, workflow improvement via automation of processes that are currently performed manually, an improved user interface and an enhanced algorithm to shorten time to detection. The objective of this study was to compare the performance of the VIRTUO and BacT/ALERT 3D (BTA 3D) instruments, using BacT/ALERT BPA (aerobic) and BacT/ALERT BPN (anaerobic) bottles, for the detection of a range of typical bacterial contaminants seeded into leukocyte reduced apheresis platelets (LRAPs).*
Study Design/Method: The study was performed at two institutions, one in the US and the other in the UK. Aliquots of LRAPs were seeded with low levels (1‐20 cfu/mL) of 11 bacterial species commonly associated with platelet contamination, and 20 replicates (10 per instrument) of 4mL aliquots per bottle were inoculated into BPA and BPN bottles. One set of bottles was loaded into BTA 3D and the other into VIRTUO and incubated until signaled positive by the instruments or for up to 7 days. Overall detection rates and time to detection of bacterial contaminants between instruments were compared. Additionally 98 bottles were tested in each instrument (LRAPs only, no organism) to evaluate differences in the overall negative agreement rates (detection of false positives) between instruments and to serve as sterility controls for the platelet preparations.
Results/Finding: A total of 680 bottles were inoculated from seeded LRAPs. VIRTUO detected 169/170 (99.4%) and BTA 3D detected 170/170 (100%) of the BPA bottles inoculated with seeded LRAPs. VIRTUO detected 169/170 (99.4%) and BTA 3D detected 170/170 (100%) of the BPN bottles inoculated with seeded LRAPs. The 2 seeded bottles not detected positive were negative on terminal subculture and positive on repeat testing. There was no difference in recovery rates between systems by bottle type or overall (p>0.05). VIRTUO was negative for 98/98 (100%) and BTA 3D was negative for 98/98 (100%) of the BPA bottles inoculated with LRAPs only (no organism). VIRTUO was negative for 97/97 (100%) and BTA 3D was negative for 97/98 (99.0%) of the BPN bottles inoculated with LRAPs only (no organism). There was no difference in negative agreement rates between systems by bottle type or overall (p>0.05) and only one false positive result (one BPN bottle for the BTA 3D). VIRTUO was faster than BTA 3D in detecting bacteria in BPA bottles, in BPN bottles, and overall with overall means of 12.3h (VIRTUO) versus 15.4h (BTA 3D), with an overall difference of 3.1 hours (p<0.001).
Conclusion: This study of LRAPs seeded with typical platelet bacterial contaminants showed comparable detection rates between VIRTUO and BTA 3D instruments for both BPA and BPN bottle types, with faster detection by VIRTUO.
*VIRTUO is not FDA‐cleared for platelet testing.
CP339
Nucleic Acid Testing Results in Argentina: Impact of the Voluntary Blood Donor Program
Mirta Cristina Remesar*1, Constanza Lapera1, Laura Peker1, Carolina Fernandez1, Delina Mejia1, Ana Rios Trevisan1, Guadalupe Mailen Garofalo1, Sebastian Oknaian2 and Silvina Kuperman3
1Centro Regional de Hemoterapia. Hospital de Pediatria Prof Dr J P Garrahan, 2Centro Regional de Hemoterapia. Hospital De Pediatria J. P. Garrahan, 3Hospital de Pediatría Juan P. Garrahan
Background/Case Studies: The implementation of Nucleic Acid Testing (NAT) blood screening is still a challenge in resource‐limited countries. At the same time, in these countries, higher to similar proportions of replacement to voluntary blood donors are recruited. A higher prevalence of infections is observed in relation to developed countries. As a consequence, more incident cases of infections can be expected. In our country, some hospital blood banks could not afford NAT due to high costs, but belong to a net that centralizes NAT in a reference Blood Center. The process to consolidate small blood banks in Regional Blood Centers, which will be able to implement NAT, is not yet complete. Although efforts to reduce replacement /familiar blood donations are in progress, these goals have not been completely achieved. The aims were to compare the prevalence of HIV, HCV and HBV by NAT screening in a blood center recruiting only voluntary blood donors with the prevalence in centers recruiting replacement and voluntary blood donors, and describe the NAT yield rates for HIV, HCV and HBV in a period of three and a half year experience.
Study Design/Method: A Regional Blood Donor Center (RBDC) has centralized NAT screening from centers in different regions of the country due to since August 2013. This process required to achieve adequate laboratory conditions and staff qualification and a development of software to assure sample traceability and interface for transmission of results. When a window period was suspected, the NAT screening was repeated from the plasma unit and a second sample of the blood donor was required to confirm NAT results. This RBDC have also been developed a 100% Voluntary Donor Program since 2011 and is the only center in the country that has achieved this goal.
Results/Findings: A total of 264,343blood donations were studied from August 2013 to December 2016. In the RBDC, where only voluntary blood donations are recruited, the prevalence was 18 per 100,000 donations for HIV (IC95% 8‐34:100,000); 14 per 100,000 for HBV (IC95% 7‐29:100,000) and 18 per 100,000 for HCV (IC95% 8‐34:100,000). In all other centers together, where voluntary and replacement blood donations are recruited, the prevalence was 89 per 100,000 donations for HIV (IC95% 77‐103:100,000); 70 per 100,000 for HBV (IC95% 59‐83:100,000) and 78 per 100,000 for HCV (IC95% 66‐91:100,000).
Window period infections were detected only in centers recruiting voluntary and replacement blood donations, giving NAT yield rates of 1: 66,086 for HBV; 1: 132,172 for HIV and 1: 264,343 for HCV.
Conclusion: The HIV, HBV and HCV prevalence was lower in a center where the tasks to sustain a Voluntary Blood Donor program were developed. NAT yield rates could be reduced in the region if this program could completely be applied in all centers.
CP340
Occult Hepatitis B Infection in Blood Donors from Zhejiang Province of China: Viral Loads and Molecular Characterisation
Gang Xu*, Bing Dai, Ji He and Faming Zhu
Blood Center of Zhejiang Province, Key Laboratory of Blood Safety Research, Ministry of Health
Background/Case Studies: Occult hepatitis B virus infection(OBI) in blood donors is a very important facet of HBV infection natural history observed in China. Mechanisms leading to OBI include various factors such as imperfect host's immune response and viral variation factors. This study was to determine the viral loads of OBI under currently recruitment and screening among blood donors in five Blood services of Zhejiang Province, China.
Study Design/Method: Before donation, the donors were screened and precluded with HBsAg preliminary test positive and ALT level abnormal. Following, the samples were detected for HBsAg twice using different ELISA reagents and HBV DNA using TMA or QT‐PCR techniques. Then, the samples with HBV DNA positive and ELISA negative were tested for the viral loads using TaqMan technique in COBAS S201 system. HBV S region was also sequenced.
Results/Finding: 234 OBI were found in the 230,000 donations. In the viral loads assay, 43 samples were negative and 104 samples’ viral loads were lower 20IU/ml. The mean viral loads was 1.85 ± 0.41 (log10) IU/ml in other 87 samples,while the mean viral loads with HBsAg+/HBV DNA+ samples was 2.38 ± 0.83 (log10) IU/ml. 60 samples of OBIs have analyzed the HBV genotype, which B was the most prevalent subtype (69.0%) and the other was HBV C genotype(31.0%). Compared the samples with HBsAg+/HBV DNA+ ,We found two OBI samples carrying with 318T>C mutation, which could cause an amino acid S55F.
Conclusion: In this study, the viral loads of OBI infection in donors was much low than HBsAg+/HBV DNA+, and some unique variation was identified in the OBI individuals.
CP341
Occult Hepatitis B Viral Infection in Voluntary Blood Donors – An Obscured Menace Unraveled By Nucleic Acid Amplification Testing!
Mahendrasingh Chauhan1 and Vrushali Patwardhan*2
1Medical Director, Dattaji Bhale Blood Bank, 2Blood Transfusion Officer, Dattaji Bhale Blood Bank
Background/Case Studies: As per a recent WHO report, India is considered to have an intermediate level of endemicity for hepatitis B virus (HBV) in general population. Screening of blood donors for HBV in India is primarily based upon detection of Hepatitis B surface antigen (HBsAg) in donor's sera. The current study was undertaken to determine the prevalence of occult HBV infection (OBI) in voluntary blood donors and to analyze the burden of HBV window period donations.
Study Design/Method: This is a prospective, observational, mono‐centric study performed in a national accreditation board for hospitals (NABH) accredited apex blood bank, located in Maharashtra state, India. Monolisa HBsAg ULTRA (Bio‐Rad, France)sandwich type ELISA using monoclonal and polyclonal antibodies was used for HBsAg detection in donor's sera. All the ELISA non‐reactive samples were also tested by an additional real time multiplex polymerase chain reaction (MPX‐PCR) by cobas®TaqScreen MPX test. The donors which were found to be positive for HBV DNA were followed upat 15th days, 1month, 3 months& 6 months by Monolisa HBsAg ULTRA (Bio‐Rad, France) to analyze interval of window period and to delineate the window period donations (WPD) & true OBI.
Results/Finding: A total of 97,992 samples obtained from voluntary blood donors during the study period (1st January 2013 to 31st March 2017) were initially screened for HBsAg. Of these, 800(0.86%) specimens were HBsAg positive by ELISA. Amongst HBsAg non‐reactive samples, 64,065 samples were also tested by MPX‐PCR. Of these, 69 samples (0.107%) were found to be positive for HBV DNA giving the nucleic acid amplification test (NAT) yield of 1:928. Mean age distribution of these 69 NAT positive donors was found to be 35.64 years (18‐63 years) & of these 66 (95.6%) were males and 3(4.4%) were females.Of theHBV DNA positive samples 15 (21.74%) were positive for HBsAg on follow‐up serology testing& were classified as WPD. Of these, 10 (66.6%), 2(13.3%) & 3(20%) donors tested positive on 3, 1 & 6 months respectively. Remaining 54 (78.3%) donors were found to be negative for HBsAg on follow‐up serology testing and were classified as true OBI. The prevalence of window period donation & true OBI was found to be 1:4271 & 1:1186 respectively.
Conclusion: HBsAg screening of blood donors is inadequate because of its limitations in recognizing OBI & WPD. These are thus considered an obscured menace questioning the safety of blood transfusion. Nucleic acid amplification testing plays a great role in circumventing the potential risk of HBV transmission by unravelingthe missed cases of HBV infection by HBsAg screening. Moreover, the life‐saving mantle of blood transfusion makes NAT a crucial element of modern transfusion service.
CP342
Occult Hepatitis B Virus Infection Among Apheresis Donors in a Region of Central China
Lei Zhao*1,2, Tingting Xu1, Li Yao1 and Gang Li1
1Wuhan Blood Center, 2Department of Laboratory of Wuhan University
Background/Case Studies: Occult hepatitis B infection (OBI) is characterized by hepatitis B virus (HBV) DNA‐positive, but HBV surface antigen (HBsAg) ‐negative. Since May 2015, we have been testing apheresis donors for HBV nucleic acids and improvements in laboratory testing have reduced the risk of transfusion‐transmitted infection. The number of apheresis collections increased significantly year by year, however, data on hepatitis B virus marker rates among these donors continue to be lacking. The aim of this study is to evaluate the epidemic characteristics, incidence and estimate the risk factors of OBI among apheresis donors in a region of central China.
Study Design/Method: Apheresis donors’ data from May 2015 to Dec 2016 was retrospectively analyzed. All samples were tested for HBsAg, HBV DNA, and other markers. Nucleic acids testing (NAT) was performed on the Roche cobas s201 platform using pools of 6 serologically negative samples and any pools positive would undergo NAT again individually. HBsAg negative, but HBV DNA positive were further tested for HBV DNA quantitative PCR, antibody to hepatitis B surface antigen (HBsAb), antibody to hepatitis B core antigen (HBcAb), hepatitis B e antigen (HBeAg) and antibody to hepatitis B e (HBeAb).
Results/Finding: In the evaluation, 68547 seronegative donations were screened by NAT and a total of 20 HBV DNA‐reactive/HBsAg‐negative donors were detected. No HIV RNA ‐reactive or HCV RNA ‐reactive sample was detected. Complete serologic screening of the index donations indicated that the majority of these donors had an occult HBV infection and the majority of which were married men and the fixed donors with many whole blood or apheresis donations. Age distribution of the age group 31‐55 years old showed a large proportion, who accounted for 80% of reported infections. Most of the HBV DNA cases (about 80.0%) reached senior high school education. The average HBsAg DNA positive rate was 0.029% (20/68547). Incidence among apheresis donors in this period for HBsAg DNA were 2.91/10000. These estimates were comparable to those among repeat whole blood donors.
Conclusion: The risk of occult hepatitis B virus infection among current apheresis donors exists and the introduction of NAT reduces the residual risk of transfusion.
CP343
Pathogen Reduced FFP and PF24 Cryoprecipitate Retain in Vitro Hemostatic Capacity 5 Days Post Thaw
T Berry, P Schmidt, N Lakshman, M von Goetz, A North, N Mufti and Larry Corash*
Cerus Corporation
Background/Case Studies: Cryoprecipitate (cryo) is enriched in fibrinogen (FB), Factors VIII (FVIII), XIII (FXIII) and von Willebrand Factor (vWF) to replenish FB levels in massive hemorrhage coagulopathy. Conventional practice involves pooling individual FFP cryo units with potential for pathogen transmission and limited post thaw shelf‐life of 4 hr. We developed pathogen reduced (PR) cryo derived from FFP and PF24 with 5 day stability at 22°C.
Study Design/Method: Six replicates of type‐matched pools of whole blood derived (WBD) and Apheresis (Aph) plasma were split to produce conventional control (225 ±10mL) and test components (625mL ±25mL). Test components were PR with amotosalen and UVA light. Aph and WBD FFP were produced by freezing plasma within 8 hr and WBD PF24 within 24 hr. Cryo was manufactured according to site SOPs and frozen at ‐30°C (Test 62 ± 2mL, Control 22 ± 2mL ). Test and Control Cryos were thawed at 37°C, and characterized immediately post thaw (t=0), and after 5 d storage at 22°C and tested for FB and FVIII function, thromboelastography (ROTEM) and thrombin generation (CAT).
Results/Finding: PR cryo retained sufficient FB and FVIII activity post thaw and over 5d at 22°C (Table) for hemostatic capacity. ROTEM (EXTEM) showed retention of fibrin formation (α angle) and clot quality (MCF) (Table). Thrombin generation was robust as demonstrated by multiple parameters (lag time, peak thrombin, endogenous total thrombin potential (ETP), and time to peak (tt) despite lower FVIII levels. These parameters were maintained through 5d storage at 22°C.
Conclusion: PR cryo can be processed from 3 plasma sources, including PF24, and stored at RT for 5 days. PR plasma provides adequate levels of FB with hemostatic capacity equivalent to control as demonstrated by ROTEM and CAT. Use of PF24 with stability over 5 days can increase the availability of cryo with a reduced risk of transfusion‐transmitted infection.
Cryo produced with psoralen‐treated (PR) plasma is not approved for use in the US.
| Apheresis Cryo | WBD FFP Cryo | WBD PF24 Cryo | ||||||||||
|---|---|---|---|---|---|---|---|---|---|---|---|---|
| Test | Control | Test | Control | Test | Control | |||||||
| T=0 | T=5d | T=0 | T=5d | T=0 | T=5d | T=0 | T=5d | T=0 | T=5d | T=0 | T=5d | |
| Fibrinogen (mg) |
954 ±94 |
1026 ±143 |
406 ±106 |
445 ±84 |
762 ±135 |
794 ±127 |
319 ±59 |
337 ±87 |
728 ±113 |
735 ±138 |
333 ±72 |
335 ±68 |
| Factor VIII (IU) |
237 ±63 |
212 ±56 |
129 ±32 |
92 ±30 |
242 ±36 |
171 ±46 |
134 ±19 |
84 ±25 |
218 ±32 |
206 ±46 |
167 ±43 |
127 ±26 |
| Peak thrombin (nM) |
232 ±17 |
236 ±9 |
273 ±15 |
261 ±8 |
218.0 ±21 |
223 ±24 |
252 ±33 |
241 ±18 |
167 ±14.1 |
180 ±18 |
193 ±18 |
192 ±26 |
| ETP (nM) |
2,238 ±175 |
2,267 ±89 |
2,395 ±130 |
2,388 ±201 |
2,433 ±201 |
2,449 ±231.5 |
3,113 ±204 |
2,495 ±185 |
1,615 ±119 |
1,657 ±260 |
1,812 ±127 |
1,760 ±176 |
| MCF (mm) |
75 ±6 |
78 ±6 |
87 ±5 |
109 ±4 |
66 ±3 |
80 ±6 |
77 ±7 |
123 ±7 |
69 ±5 |
73 ±67 |
74 ±5 |
79 ±6 |
| a angle (°) |
86 ±1 |
85 ±2 |
87 ±1 |
86 ±0.4 |
85 ±1 |
85 ±1 |
86 ±1 |
81 ±3 |
85 ±1 |
85 ±1 |
86 ±1 |
80 ±0.7 |
| A 10 (mm) |
71 ±4 |
75 ±6 |
83 ±6 |
84 ±6 |
63 ±4 |
68 ±6 |
70 ±8 |
72 ±7 |
68 ±4 |
70 ±6 |
71 ±5 |
72 ±7 |
CP344
Performance of a New Automated Alinity s Assay for Antibodies to T. Cruzi
Darwin Smith*1, Ed Bakker2, Anton van Weert2, Jane Bryant1, Mark Paradowski1, Lynne Fleischmann1, Mirjana Sarac3, George Chen1, George Schlauder1 and Gregg Williams1
1Abbott Diagnostics, 2Sanquin Diagnostics, 3Abbott GmbH & Co. KG
Background/Case Studies: The parasite, Trypanosoma cruzi (T. cruzi), is the cause of Chagas disease which is endemic to the Americas and infects 6‐8 million people. In order to prevent transfusion mediated transmission of this parasite in endemic countries, blood collection centers require high throughput anti‐T. cruzi assays with good specificity and sensitivity. In non‐endemic countries, selective testing of at risk donors is a strategy to avoid temporary donor deferrals. In addition, continued pressures on laboratory operations demand that assays perform on platforms capable of increased walk away time and enhanced automation in areas of reagent management, retest options, and commodity/waste management.
Study Design/Method: The performance of the new automated chemiluminescence immunoassay for the detection of antibodies to T. cruzi was evaluated on the Alinity s automated platform and compared to another on‐market chemiluminescent immunoassay. Precision was assessed over 20 days using a panel of positive and negative samples. Sensitivity was evaluated on 407 presumed antibody positive specimens and specificity was evaluated on 7621 random blood donor samples.
Results/Finding: Precision was 7% CV or less for positive samples over 20 days. The overall specificity in a blood donor population was 99.99% (7620/7621). Sensitivity was 100.00% for 407 presumed antibody positive samples.
Conclusion: These results indicated that the new automated Alinity s Chagas assay provided very good performance in sensitivity and specificity, comparable to the current on‐market anti‐T. cruzi assay, and is equally suitable for use of universal screening in endemic and selective donor screening in non‐endemic countries.
CP345
Performance of a New Automated Alinity s Assay for Hepatitis B Surface Antigen and Hepatitis B Surface Antigen Confirmatory
Randal Makela*1, Anton vanWeert2, Ed Bakker2, Jane Bryant1, Mark Paradowski1, Lynn Martin1, Daniela Kaleve3, George Chen1, Gregg Williams1 and George Schlauder4
1Abbott Laboratories, 2Sanguin Diagnostics, 3Abbott GmbH & Co. KG, 4Abbott Diagnostics
Background/Case Studies: Despite the development of sensitive NAT methods, blood transfusion in many parts of the world relies on serologic screening for Hepatitis B surface antigen (HBsAg) to prevent transfusion transmitted HBV infection. Sensitive HBsAg assays must be capable of coping with a wide range of mutants while exhibiting an uncompromised specificity. In addition, continued pressures on laboratory operations demand that assays perform on platforms capable of increased walk away time and enhanced automation in areas of reagent management, retest options, and commodity/waste management.
Study Design/Method: The performance of a new automated chemiluminescence immunoassay for the detection and confirmation of HBsAg was evaluated on a next generation automated platform, Abbott Alinity s. Precision was assessed over 20 days. Sensitivity was evaluated using 511 known positive samples, 30 commercially available seroconversion panels, the WHO standard, 23 HBsAg mutants, and 94 HBsAg genotyped specimens (A through H). Specificity was evaluated on random blood and plasmapheresis donors.
Results/Finding: Precision was less than 8% CV for positive samples over 20 days. The blood donor specificity was 99.98% (7998/8000). Sensitivity was 100% for 511 presumed positive samples. Sensitivity was 100% for all genotypes. 100% of the mutants were detected vs 83% for the comparator assay. Seroconversion detection was equivalent to the comparator assay with 157 reactive samples detected with the Alinity s assay and 154 reactive samples detected by the comparator assay. Analytical sensitivity ranged from 0.015 to 0.016 IU/ml. The Alinity s HBsAg Confirmatory Assay confirmed all known positive HBsAg specimens, including 3 HBsAg mutant samples that were not confirmed by the comparator HBsAg Confirmatory Assay.
Conclusion: The new automated Alinity s HBsAg assay provided precision, specificity, and seroconversion sensitivity comparable to the current on‐market comparator assay. However, the Alinity s HBsAg assay demonstrated a gain in sensitivity over the comparator assay through the detection and confirmation of a wider range of mutants.
CP346
Performance of a New Automated Alinity s Immunoassay Assay for HIV
Darwin Smith*1, Ed Bakker2, Anton van Weert2, Jane Bryant1, Mark Paradowski1, Kevin Callear1, Susan Sullivan1, George Chen1, George Schlauder1 and Gregg Williams1
1Abbott Diagnostics, 2Sanquin Diagnostics
Background/Case Studies: Blood donations are commonly screened to detect the presence of antibodies (or antibody and antigen) to human immunodeficiency virus Types 1 and 2 (anti‐HIV‐1/2). Blood centers require very high throughput anti‐HIV‐1/2 assays with high specificity and sensitivity to prevent unnecessary donor deferrals while maintaining a safe blood supply. In addition, continued pressures on laboratory operations demand that assays perform on platforms capable of increased walk away time and enhanced automation in areas of reagent management, retest options, and commodity/waste management. In the response for the need for such screening assays, we have evaluated an improved automated assay for the detection of anti‐HIV‐1/2 antibodies and HIV‐1 p24 antigen.
Study Design/Method: The performance of the new chemiluminescence combination immunoassay for the detection of anti‐HIV‐1/2 antibodies and HIV‐1 p24 antigen was evaluated on the Abbott Alinity s System. Precision was assessed over 20 days evaluating positive samples. Specificity was evaluated on samples obtained from random blood donors and plasmapheresis donors. Sensitivity was evaluated using presumed positive samples for HIV‐1, HIV‐2 and HIV Group O antibodies and HIV‐1 p24 antigen. Seroconversion sensitivity was evaluated with 41 commercial seroconversion panels.
Results/Finding: Precision was less than 8% CV for positive samples over 20 days. The blood donor specificity was 99.96% (8082/8085). Sensitivity was 100% for 813 presumed antibody positive samples comprised of HIV‐1, HIV‐2 and HIV‐1 Groups O, N, P, CRF and URF samples. Also, sensitivity was 100% for 102 antigen positive viral isolate samples comprised of HIV‐1, HIV‐2 and HIV‐1 Groups O, N, P, CRF and URF samples. Seroconversion detection was equivalent to the comparator assay with 136 reactive samples detected with the Alinity s assay and 135 reactive samples detected by the comparator assay.
Conclusion: These results indicate that the new automated Alinity s HIV Ag/Ab Combo assay provided acceptable performance in specificity, sensitivity and precision, while providing similar seroconversion sensitivity as the comparator assay.
CP347
Performance of a New Automated Alinity s Immunoassay for the Detection of Anti‐HBc Antibodies
Randal Makela*1, Anton vanWeert2, Ed Bakker2, Jane Bryant1, Mark Paradowski1, Joyce Siregar1, Angela Vockel3, George Chen1, Gregg Williams1 and George Schlauder4
1Abbott Laboratories, 2Sanguin Diagnostics, 3Abbott GmbH & Co. KG, 4Abbott Diagnostics
Background/Case Studies: In countries with a low prevalence of Hepatitis B, blood donations are commonly screened to detect the presence of antibodies to hepatitis B core antigen (Anti‐HBc) alongside HBsAg and HBV NAT to detect donors with occult Hepatitis B infections (OBI). Blood centers require anti‐HBc assays with high specificity and sensitivity to prevent unnecessary donor deferrals while maintaining a safe blood supply. In addition, continued pressures on laboratory operations demand that assays perform on platforms capable of increased walk away time and enhanced automation in areas of reagent management, retest options, and commodity/waste management. In the response for the need for such screening assays, we have developed an improved automated assay for the detection of anti‐HBc on the Alinity s System.
Study Design/Method: The performance of a new chemiluminescence anti‐HBc assay for the detection of anti‐HBc antibodies was evaluated on the next generation automated Abbott Alinity s System. Precision was assessed over 20 days evaluating positive samples. Specificity was evaluated on samples obtained from random blood donors. Sensitivity was evaluated using specimens characterized as anti‐HBc positive by means of serologic methods. Analytical sensitivity was assessed using the WHO 1st International standard. Seroconversion sensitivity was evaluated using 10 commercial seroconversion panels.
Results/Finding: Precision was less than 6% CV for positive samples over 20 days. The blood donor specificity was 99.93% (6946/6951). Sensitivity was 100% for 500 samples presumed to be anti‐HBc positive. Analytical sensitivity results on the Alinity s Anti‐HBc assay ranged from 0.57 to 0.62 IU/mL. Seroconversion detection was equivalent to the comparator assay with 136 reactive samples detected with the Alinity s assay and 134 reactive samples detected by the comparator assay.
Conclusion: These results indicate that the new automated Alinity s Anti‐HBc assay provided good performance in specificity, sensitivity and precision versus the comparator assay.
CP348
Performance of a New Automated Alinity s Immunoassay for the Detection of HTLV I and HTLV II Antibodies
Melanie Anderson*1, Anton vanWeert2, Ed Bakker2, Mark Paradowski1, Jane Bryant1, Tuan Bui1, Joyce Siregar1, George Chen1, George Schlauder3 and Gregg Williams1
1Abbott Laboratories, 2Sanguin Diagnostics, 3Abbott Diagnostics
Background/Case Studies: In endemic countries, universal blood screening is necessary to prevent transfusion transmitted HTLV infections (anti‐HTLV I/HTLV II). In non‐endemic countries, selective testing may avoid unnecessary temporal deferrals for donors at high risk, such as returning travelers from or donors born in countries with a high HTLV prevalence. Blood centers require high throughput anti‐HTLV I/HTLV II assays with high specificity and sensitivity to prevent unnecessary donor deferrals while maintaining a safe blood supply. In addition, continued pressures on laboratory operations demand that assays perform on platforms capable of increased walk away time and enhanced automation in areas of reagent management, retest options, and commodity/waste management. In response for the need of an assay with high specificity on a high throughput instrument we have developed a new assay for the detection of antibodies against HTLV‐I/II antibodies for the Alinity s System.
Study Design/Method: Precision was assessed over 20 days using HTLV I and HTLV II positive samples. Specificity was evaluated using 8,001 blood donor specimens from Europe and 200 diagnostic samples obtained from the United States. Sensitivity was evaluated using 500 preselected HTLV I and HTLV II positive samples. Sensitivity and specificity samples were split across 3 reagent lots during testing. Confirmation of repeatedly reactive samples was done using the MP Diagnostic HTLV Blot 2.4.
Results/Finding: Imprecision was less than 7.0% for positive samples over 20 days. Clinical sensitivity was 100.00% (500/500) on preselected HTLV I and HTLV II positive samples. The specificity was 99.98% (7,999/8,001) on a blood donor population and 100.00% (200/200) on diagnostic samples.
Conclusion: These results indicate that the new Alinity s automated HTLV I/II assay provided very good performance in specificity, sensitivity, and precision. Sensitivity and specificity were comparable to the comparator assay.
CP349
Performance of Immunoblot as a Supplementary Test for Hepatitis C Virus Infection in Colombian Blood Donors
Claudia Ramirez1, Michel Garcia*2, Fernando Palomino3 and Guillermo Orjuela‐Falla1
1National Blood Bank Colombian Red Cross, 2Universidad Del Rosario, 3FUATS
Background/Case Studies: Current hepatitis C virus (HCV) supplemental testing algorithm for blood donations in Colombia, requires that an immunoblot assay be performed on every HCV enzyme immunoassay (EIA) repeat‐reactive sample. A higher proportion of indeterminate (IND) results by immunoblot assays has been documented for non‐US donor samples, affecting donor counseling and eventually increasing costs and opportunity for the notification of infected donors. This work aimed to establish the distribution of immunoblot results in Colombian repeat‐reactive samples, as well as the frequency of band detection in both positive and indeterminate blots.
Study Design/Method: In total, 387 anti‐HCV–reactive donor samples (signal‐to‐cutoff (S/CO) ratio greater than 1.0; Abbott Architect i2000SR) underwent supplemental testing by immunoblot (either Chiron RIBA HCV 3.0 SIA or HCV Blot 3.0 test, MP Diagnostics). Negative (NEG), indeterminate (IND) and positive (POS) blot results were grouped by S/CO ranges as follows: 1‐4.99, 5‐9.99, >10. Band detection and intensity were independently analyzed for indeterminate and positive results.
Results/Finding: Immunoblot results were negative in 57.9% (224/387) of samples, indeterminate in 30.7% (119/387) and were positive in 11.4% (44/387). A direct relationship was observed between positive immunoblot and increased S/CO. The proportion of IND results were higher in the S/CO group 5‐9.99 (63.2%) compared with the 1‐4.99 (29.9%). In samples with indeterminate results, NS3_2 was the most frequent band detected (52,9%). In contrast, the most frequent band in the group of positive results was CORE (93,2%). Only one sample from the indeterminate group (0.8%) had a strong band intensity (3+), compared with 10 samples from the positive group (22.7%).

Conclusion: The proportion of indeterminate immunoblot results in this sample of Colombian donors is one of the highest ever reported, being twice as much as the proportion found in larger samples of US donors. The high proportion of IND results found in the S/CO group (5‐9.99) suggests that the optimal S/CO ratio for predicting a confirmed anti‐HCV result in this population should be higher than the one recommended by the CDC for US population (>5). Overall, these results suggest that the supplemental testing algorithm for blood donations in Colombia could be improved not only by using high S/CO ratios as an alternative to immunoblot, but also by introducing HCV genomic assays instead of immunoblots, at least for samples with intermediate S/CO ratios. NS3_1 and NS3_2 cross‐reactivity in Colombian population warrants further investigation.
CP350
Performance of the Alinity s Immunoassay for the Detection of Syphilis Antibodies
Melanie Anderson*1, Ivanka Mihaljevic2, Manuela Miletic2, Miljana Stojic Vidovic2, Irena Jukic2, Jane Bryant1, Mark Paradowski1, Angela Vockel3, George Chen1, Gregg Williams1 and George Schlauder4
1Abbott Laboratories, 2Croatian Institute of Transfusion Medicine, 3Abbott GmbH & Co. KG, 4Abbott Diagnostics
Background/Case Studies: Blood donations are commonly screened for Syphilis in order to detect the presence of antibodies to the bacterium Treponema pallidum. In addition, continued pressures on laboratory operations demand that the full panel of TTID assays perform on a single platform capable of increased walk away time and enhanced automation in areas of reagent management, retest options, and commodity/waste management. In response to those needs, we have evaluated a new automated immunoassay for the detection of antibodies to T. pallidum.
Study Design/Method: Performance of the new automated chemiluminescence immunoassay for the detection of antibodies to Treponema pallidum was evaluated on the Alinity s System. Precision was assessed over 20 days using positive samples. Specificity was evaluated on samples obtained from 9,101 blood and plasmapheresis donors from the United States and Europe and 200 diagnostic samples obtained from the United States. Sensitivity was evaluated using 514 preselected positive samples. Sensitivity and specificity samples were split across 3 reagent lots during testing. Confirmation of repeatedly reactive samples was done using a testing algorithm with 3 confirmatory assays, INNO‐LIATM Syphilis Score, and Mikrogen recomLine Treponema IgG and IgM blots.
Results/Finding: Imprecision was less than 6.0% CV for positive samples over 20 days. Clinical sensitivity was 100.00% (514/514) on preselected Syphilis positive samples. The specificity was 99.97% (9,063/9,066) for blood donor specimens and 100.00% (200/200) on diagnostic samples.
Conclusion: These results indicate that the new automated Alinity s Syphilis assay provided good performance in precision, specificity and sensitivity in line with data found for the comparator assay.
CP351
Performance of the New Automated Alinity s Assay for Anti‐HCV
Melanie Anderson*1, Ed Bakker2, Anton vanWeert2, Jane Bryant1, Mark Paradowski1, Tuan Bui1, Lynn Martin1, George Chen1, Gregg Williams1 and George Schlauder3
1Abbott Laboratories, 2Sanguin Diagnostics, 3Abbott Diagnostics
Background/Case Studies: Serological screening for antibodies to Hepatitis C virus (HCV) often in conjunction with nucleic acid testing (NAT) is used worldwide to prevent transfusion transmitted HCV infections. While NAT provides improved sensitivity and detection of HCV in the pre‐seroconversion window, serological testing provides continued detection of HCV in infected individuals and individuals with resolved infections with no detectable HCV RNA. Blood and plasma centers require very high throughput anti‐HCV assays with high specificity and sensitivity to prevent unnecessary donor deferrals while maintaining the safety of the blood and plasma supply. In addition, continued pressures on laboratory operations demand that assays perform on platforms capable of increased walk away time and enhanced automation in areas of reagent management, retest options, and commodity/waste management.
Study Design/Method: The performance of a new automated chemiluminescence immunoassay for the detection of antibodies to HCV was evaluated on the Alinity s System. Precision was assessed over 20 days evaluating positive samples. Sensitivity was evaluated using 501 preselected positive samples and 30 seroconversion panels. Specificity was evaluated on samples obtained from 8,113 blood and plasmapheresis donors from the United States and Europe and 200 diagnostic samples obtained from the United States. Sensitivity and specificity samples were split across 3 reagent lots during testing. Confirmation of repeatedly reactive samples was done using a testing algorithm consisting of the INNO‐LIATM HCV Score and NAT/HCV Discriminatory NAT assays.
Results/Finding: Imprecision was less than 7.0% CV for positive samples over 20 days. Overall clinical sensitivity was 100% on 501 preselected anti‐HCV positive samples. Seroconversion sensitivity was better than the comparator as evidenced by the new Anti‐HCV assay identifying 5 more bleeds than the comparator assay. The specificity was 99.99% (8,111/8,112) for blood donor specimens and 98.98% (194/196) when testing diagnostic samples.
Conclusion: These results indicate that the new automated Alinity s Anti‐HCV assay provided very good performance in precision, specificity and sensitivity.
CP352
Photochemical Inactivation of Zika Virus in Plasma By Methylene Blue with Visible Light
Bo Zhang*, Qin Mo and Yuwen Huang
Shanghai Blood Center
Background/Case Studies: ZIKA virus (ZIKV), which has been outbroken in South America and the United States since middle of 2015, was declared as the public health emergency of international concern by WHO in Feb 2016. In addition to mosquito, ZIKV can be transmitted via maternal‐neonatal relationship, sexual intercourse or blood transfusion. The potential for transfusion‐transmitted Zika virus was shown in French Polynesia where 2.8% of asymptomatic blood donors tested were positive for Zika virus RNA using nucleic acid test (NAT). Several case reports have confirmed that ZIKV can be transmitted by transfusion. It has been shown that among blood donors, 73.8% of the ZIKV infections were asymptomatic and the ratio of symptomatic to asymptomatic patients observed in Micronesia was approximately 1:5 to 1:6. Thus ZIKV has raised a great challenge to transfusion safety. Measures should be taken to prevent transfusion‐transmitted ZIKV, including temporary deferral of blood donors in epidemic locations, donor self‐reporting of ZIKV symptoms after donation with or without quarantine of blood components, supply by blood collected from non‐endemic areas to epidemic regions, NAT of blood donations, and pathogen inactivation of blood products. In this study, we evaluated ZIKV inactivation in plasma by using methylene blue photochemical treatment (MBPT).
Study Design/Methods: Plasma units from randomly selected healthy donors were collected and spiked with ZIKV. Samples were added by MB at a final concentration of 1μM and assayed after illumination with visible light from both sides for 5, 15, and 30min. Viral infectivity and ZIKV RNA loads (reverse transcription PCR) were measured in spiked plasma before and after MBPT and confirmed using repetitive passages in cell culture. Control was ZIKV spiked plasma without photochemical treatment.
Results/Findings: ZIKV titer of control sample was 4.5 log 50% tissue culture infectious dose (TCID50)/mL. No viral infectivity was detected after MB photochemical inactivation treatment for 5min, 15min or 30min and the losses of the infectivity were further demonstrated by 3 repetitive passages of cell culture. Meanwhile, ZIKV RNA loads decreased significantly during the initial 5min of treatment whereby Ct‐value jumped from 18.25 (control) to 25.50 (MBPT for 5min) (Table 1).

Conclusion: It showed that MB photochemical treatment could effectively inactivate ZIKV in plasma. RNA lesions were induced during MBPT process so that nucleic acid reverse transcription and amplification were inhibited. MBPT is proved to be an efficient method to prevent plasma transfusion‐transmitted ZIKV infections.
CP353
Preliminary Results on the Prevalence of Acute Hepatitis E Virus Infection in Canadian Blood Donors
Gilles Delage*1, Margaret Fearon2, Susan L Stramer3, Megan L Nguyen3, France Bernier1, Sheila O'Brien2, Vito Scalia2, Sakina Smith3, Yves Grégoire1 and Boris Hogema4
1Héma‐Québec, 2Canadian Blood Services, 3American Red Cross, 4Sanquin
Background/Case Studies: Hepatitis E virus (HEV) is known to be transfusion‐ transmissible. As part of the risk assessment for this infection, a study was carried out in 14,000 Canadian blood donors in 2013. In a subset of 4,000 donor samples the seroprevalence was 5.9%. However, no donor samples were positive for HEV by an in‐house nucleic acid test (HEV‐NAT). Since that study suggested exposure to HEV in Canada but used an HEV‐NAT with a limit of detection of 250 IU/mL, a larger study was performed using a more sensitive HEV‐NAT assay.
Study Design/Method: Donors were informed about the study in the pre‐donation reading materials. Linked samples from approximately 50,000 Canadian whole blood donors including 30,000 from Canadian Blood Services (CBS) and 20,000 from Héma‐Québec (HQ) were collected. Clinics were selected to ensure representative sampling of the donor population. All donations with available plasma samples were tested by individual donation NAT at the American Red Cross laboratory in Gaithersburg, MD, using the cobas ® HEV test (95% LOD 18.6 IU/mL, 95% CI 15.9‐25.6) for use on the cobas ®6800/8800 System. This test is not currently approved in Canada or the USA, but is available as a CE marked test. All NAT‐reactive donors are questioned concerning risk factors for recent HEV infection (travel, animal contact, food and water exposure), undergo confirmatory testing (alternate NAT, viral load, genotyping and IgM/IgG serology), are notified by letter, and deferred from donating for 6 months; in‐date products collected from the donor, and any frozen red blood cells or plasma from the previous 6 months are destroyed. Recipients will be traced in the event of any products transfused in the previous 6 months.
Results/Finding: As of April 10, 2017, 9 of 39,834 (19,395 CBS, 20,439 HQ) tested samples with valid results have been found HEV‐NAT reactive: 8 donors have been confirmed by further testing to date. Confirmation is pending in 1 donor. Of the 9 donors, 7 were from Quebec, and one each from Nova Scotia and Alberta (7 male, 2 female). Ages ranged from 21 to 70 years. Only two donors reported non‐specific symptoms (fatigue). In terms of risk factors: 6 ate pork (including 3 who ate pork liver), 4 ate shellfish, 2 ate venison, and 3 drank well water. One donor had no identifiable risk factor. Viral loads ranged from 3 to 151 IU/mL, of which 2 were <10, 3 were 10‐50, and 3 were >50 IU/mL; 2 were anti‐HEV IgM positive and 4 anti‐HEV IgG positive at index (Wantai assay).
Conclusion: The prevalence rate of acute HEV infection in this donor population appears to be around 1/4400. The data from this study will contribute to the ongoing risk assessment of transfusion‐transmitted HEV infection in Canada.
CP354
Prevalence of Malaria Parasite in Donated Blood at Nakasero Blood BANK, Uganda
Gerald Nsubuga* and Musiisi Ezra
UGANDA BLOOD TRANSFUSION SERVICE
Background/Case Studies: Introduction
Infectivity of donated blood with malaria is a significant health problem facing humanity. In Uganda, screening for malaria parasite is neither routinely done in blood banks, nor stipulated in the current Uganda National Blood Transfusion Service (UBTS) guidelines by the Ministry of Health. As a result, the proportion of donated blood that is infected with malaria is largely unknown. Malaria infection places more than half of the world's population at risk and in majority of the tropical and sub‐tropical regions of the world and about 300 to 500 million cases and 2 to 3 million death occur per year.
However the study aimed at determining the prevalence of malaria parasites in donated blood at Nakasero Blood bank, Kampala, Uganda
Study Design/Method: A cross sectional study was carried out in Nakasero blood bank, Kampala, Uganda in four hundred and seventy randomly selected donor samples at the blood bank between June and August 2014. Both thin and thick glass stained blood smears of 417 blood samples with Giemsa was examined using microscope.
Results/Finding: Of the 417 donated blood samples, 17 (4.1%) tested positive for malaria parasite (p. falciparum), although there was no significant difference in occurrence of Plasmodium in relation to sex, age and blood group (P>0.05), majority of the blood donors that tested positive belonged to blood group O (64.71%).
Conclusion: The prevalence of malaria parasite in the study was 4.1%. Regardless of the prevalence, the presence of malaria parasite (Plasmodium falciparum) in donated blood from donors that were presumed to be healthy raises a serious concern on the safety of donated blood in Uganda. The Ministry of Health should review the existing guidelines for screening malaria and mandatory universal blood donor screening policy for malaria, for exclusion of blood donors with plasmodia parasitaemia. Using methods like pathogen inactivation compared to tedious microscopic procedure to screen donated blood to be introduced to further enhance blood safety in our communities.
CP355
Qualification of the Intercept Blood System for Red Blood Cells at Banco De Sangre De Servicios Mutuos
Jannet Rodriguez1, Jose Alsina1, Alina Raffucci Pino1, Dayra O'Neill Maldonado1, Ismael Rodriguez1, Blake Warbington2, Garrett Villegas2, Anna Erickson*2 and Katharina Waldhaus2
1Banco de Sangre de Servicios Mutuos, 2Cerus Corporation
Background/Case Studies: The INTERCEPT® Blood System for Red Blood Cells (RBC) inactivates pathogens and leukocytes in RBC components for transfusion using amustaline to form nucleic acid adducts, preventing replication of a broad range of contaminating pathogens and leukocytes. Banco de Sangre de Servicios Mutuos (BSSM) is providing INTERCEPT treated RBCs for a Phase 3 study of the transfusion safety and efficacy of INTERCEPT RBCs compared to conventional RBCs in Puerto Rico. The objective of this study was to qualify the INTERCEPT process at BSSM.
Study Design/Methods: WB derived AS‐5 RBCs were prepared on the day (D) of collection, D0, and stored at 1‐6°C. Test (T) units (325 ± 22 [287‐349] mL) were treated with the INTERCEPT process within 24h of collection, while Control (C) units (315 ± 15 [278‐331] mL) were untreated. T and C RBCs were stored at 1‐6°C for 35 days. T were sampled on D1, 2 and 35 and C were sampled on D0‐2 and 35 for analysis of in vitro parameters (Table 1).
Results/Findings: Post INTERCEPT, T had volumes of 261‐320mL, with 98 ± 4% hemoglobin (Hb) recovery. T had 10‐fold less extracellular protein than C. After 35 days of storage T had higher ATP and Na+ than C while lactate and hemolysis were lower. Hct, pH, K+ and glucose were equivalent between T and C on D35. D35 hemolysis for T was 0.08‐0.31%, while for C it was 0.10‐0.57%. T and C ATP was >2µmol/g Hb, the level of ATP associated with effective RBC viability, throughout storage (Table 1).
Conclusion: The INTERCEPT Blood System for RBC was successfully qualified at BSSM. This study demonstrated that all INTERCEPT RBC units met the US criterion for hemolysis at end of storage. All measured in vitro parameters of INTERCEPT treated RBCs indicated suitability for transfusion.
TABLE 1. CP355: In Vitro Function Over 35 Days of Storage (mean ±SD, n=12)b
| Parameter | Day 2 | Day 35 | ||
|---|---|---|---|---|
| Testa | Control | Testa | Control | |
| Hematocrit (Hct, %) | 58.5 ± 2.5* | 56.3 ± 1.7 | 60.8 ± 2.7 | 61.8 ± 2.9 |
| Hemoglobin (g/unit) | 59 ± 7 | 60 ± 4 | not measured | |
| Hemolysis (%) | 0.02 ± 0.01* | 0.06 ± 0.04 | 0.16 ± 0.07* | 0.29 ± 0.14 |
| pH (37°C) | 6.9 ± 0.1* | 7.3 ± 0.1 | 6.7 ± 0.1 | 6.6 ± 0.1 |
| Total ATP (µmol/g Hb) | 7.7 ± 0.5* | 5.0 ± 0.4 | 4.6 ± 0.6* | 3.9 ± 0.5 |
| K+ (mM) | 1.5 ± 0.3* | 5.7 ± 2.5 | 53.6 ± 5.2 | 53.7 ± 5.4 |
| Na+ (mM) | 143.7 ± 0.8* | 140.0 ± 2.6 | 106.0 ± 4.3* | 98.0 ± 7.4 |
| Glucose (mM) | 25.9 ± 1.2* | 30.4 ± 0.8 | 17.6 ± 2.1 | 17.3 ± 1.2 |
| Lactate (mM) | 7.0 ± 0.8* | 4.9 ± 1.6 | 21.3 ± 3.0* | 27.8 ± 2.3 |
p‐value < 0.05 by unpaired t‐test
aINTERCEPT Blood System for Red Blood Cells is not approved for commercial use.
bThis project has been funded in whole or in part with Federal funds from the DHHS; ASPR; BARDA; Contract No. HHSO100201600009C.
CP356
Rapid Detection of Microbial Contamination in Leukocyte Reduced Apheresis Platelets during Five Day Expiry: Repeatability Testing on the Bact/ALERT® VIRTUO™ and the Bact/ALERT® 3D
Mary E. Elizabeth Adamik*, Jasmin Fernando Viray, Deborah Helms, Jenna Klein and Parampal Deol
BioMerieux
Background/Case Studies: The rapid detection of bacterial contamination in platelets is key to reducing the risk of infection in transfusion of blood components. The BacT/ALERT VIRTUO* (VIRTUO) is an advanced, next generation system with improved automation, connectivity, and with data management systems. Most importantly, the VIRTUO's new algorithm significantly reduces the time to detection (TTD) of microorganisms during quality control testing of platelet preparations using BacT/ALERT BPA (aerobic) and BPN (anaerobic) bottles. BPA and BPN bottles were tested on VIRTUO and BacT/ALERT 3D (BTA 3D) to evaluate repeatability to detect growth in seeded Leukocyte Reduced Apheresis Platelets (LRAP) without Platelet additive Solution (PAS), throughout platelet shelf life (3, 4 and 5 days after collection).
Study Design/Method: Pooled LRAP were seeded with low levels of 6 organisms commonly associated with platelet contamination at 3, 4 and 5 days post collection. The seeded LRAP were inoculated into BPA and BPN bottles on 10 different days (not consecutive) alternating between 2 teams of 2 people each. Seeded bottles were loaded into a VIRTUO and a BTA 3D and incubated until declared positive or negative (up to 7 days). Additionally, BPA and BPN bottles inoculated with 4mL of unseeded LRAP were tested on the VIRTUO and the BTA 3D (120 and 40 bottles respectively), to serve as negative controls, sterility controls, and to evaluate the risk of false positives caused by LRAP
Results/Finding: The repeatability of the VIRTUO to detect organisms in LRAP was demonstrated by a recovery rate of seeded bottles of 99.9% for the VIRTUO and 99.5% for the BTA 3D. The VIRTUO demonstrated an average improved TTD of 3.2 hours, when compared to the BTA 3D in the presence of 4mL LRAP platelets. The LRAP did not cause false positives. Additionally, the age of the LRAP units (within 5 day expiry),did not impact the TTD when seeded with organism
TABLE 1. Analysis of BPA and BPN Bottle TTD During Platelet Shelf Life
| Organism | Age of Platelets (Days) | Bottle Type | Avg TTD (H) |
|---|---|---|---|
| B. cereus | 3 | BPA | 8.2 |
| BPN | 12.3 | ||
| 4 | BPA | 8.2 | |
| BPN | 12.2 | ||
| 5 | BPA | 8.1 | |
| BPN | 11.4 | ||
| C. perfringens | 3 | BPN | 13.5 |
| 4 | BPN | 13.3 | |
| 5 | BPN | 10.9 | |
| E. coli | 3 | BPA | 10.6 |
| BPN | 9.8 | ||
| 4 | BPA | 10.6 | |
| BPN | 9.8 | ||
| 5 | BPA | 10.5 | |
| BPN | 9.7 | ||
| P. aeruginosa | 3 | BPA | 14.8 |
| 4 | BPA | 14.8 | |
| 5 | BPA | 14.6 | |
| S. aureus | 3 | BPA | 14.3 |
| BPN | 15.1 | ||
| 4 | BPA | 14.5 | |
| BPN | 15.2 | ||
| 5 | BPA | 14.5 | |
| BPN | 14.9 | ||
| S. pyogenes | 3 | BPA | 14.1 |
| BPN | 11.0 | ||
| 4 | BPA | 14.3 | |
| BPN | 11.0 | ||
| 5 | BPA | 14.3 | |
| BPN | 10.9 | ||
| Negative Control | 3 | BPA | No Growth |
| BPN | |||
| 4 | BPA | ||
| BPN | |||
| 5 | BPA | ||
| BPN |
Conclusion: VIRTUO and BTA 3D demonstrate repeatable results regardless of people and age of platelets, hence, these systems are reliable and dependable for detection of contamination in LRAP.
*VIRTUO is not FDA cleared for platelet testing
CP357
Required Zika Virus Nucleic Acid Testing for Blood Donors: One Western Laboratory's Experience
Sara Dionne*, Bryce Baker, Urlene Glassman, Scott Henderson, Hema Kantilal, Brenden O'Neale and Brian Wolfe
LABS, Inc.
Background/Case Studies: Zika Virus (ZIKV) is an emerging flavivirus that is transmitted by the Aedes aegypti mosquito and sometimes A. albopictus mosquito. Most infections are asymptomatic. ZIKV Nucleic Acid Testing (NAT) became a required test for blood donors per the FDA Guidance entitled, “Revised Recommendations for Reducing the Risk of Zika Virus Transmission by Blood and Blood Components”. Based on our geographical location, implementation of this testing began 12 weeks after this guidance was issued. We performed ZIKV NAT for donors of whole blood and blood components under an Investigational New Drug (IND) Study (sponsored by Hologic, Inc.). We performed a retrospective analysis on all NAT results as there is a potential to defer donation due to false positive screening results.
Study Design/Method: Donors that consented to donate blood and be tested for the ZIKV were obtained from three Blood Banks in Colorado and Nebraska. NAT was performed using the Procleix Virus assay which is a qualitative in vitro nucleic acid assay system that detects ZIKV RNA in plasma specimens. The assay was performed on the automated Procleix Panther system. All testing was performed according to the manufacturer package insert.
Results/Findings: In the event of a Reactive result, donors would be retested by NAT in addition to other testing (IgM antibody testing, neutralization test). Donors are deferred for 120 days barring continued ZIKV testing and NonReactive results. A total of 2,485 donors were screened for ZIKV. All donors screened for ZIKV were NonReactive by NAT.
No invalid test results were obtained. In addition the number of failed test runs due to instrument or assay issues were experienced were quite low (1.0%). This data indicates that both the assay and instrument are robust. There was a low frequency for additional testing which allows the laboratory to publish timely infectious disease results for our Blood Bank customers.
Conclusion: The reactive rate data presented here demonstrate that there is a low/zero incident rate in our region for whole blood and blood component discard due to reactive results. This screening is important to continue to ensure blood safety in the United States.
CP358
Robust Inactivation of the Yellow Fever Virus 17D Strain Can be Achieved Using Amotosalen and UVA Light for Pathogen Reduction Treatment (PRT) of Platelet Components
Andrew Laughhunn1, Felicia Santa Maria1, Yvette Girard1, Peter Bringmann1, Marion Lanteri*2 and Adonis Stassinopoulos2
1Microbiology Department, Cerus Corporation, 2Scientific Affairs Department, Cerus Corporation
Background/Case Studies: Yellow fever virus (YFV) is known to cause explosive outbreaks, such as the one in Angola in 2015. The rapidly increasing number of infections in Brazil, with hundreds of fatalities since December 2016, is of concern. YFV is a Flavivirus transmitted by Aedes mosquitoes and could spread, like Zika virus, to other parts of the Americas where the vector is endemic. With no effective antivirals and only supportive therapy available, the best mitigation strategy is through vaccination with live attenuated vaccine strains, like the 17D‐YFV strain. YFV vaccine is considered an effective and safe vaccine; however major adverse events have been reported including neurologic and visceral adverse effects. In addition, transfusion transmission (TT) of live attenuated YFV has been reported with severe clinical outcomes, especially in immunosuppressed patients. In order to prevent TT by YFV vaccine strain, the AABB recommends a 2 week‐period deferral after YFV vaccination. YFV outbreaks and vaccination campaigns may therefore reduce blood availability. This pilot study evaluated the ability to inactivate 17D‐YFV using amotosalen (S‐59) and UVA light PRT of platelet components (PC).
Study Design/Method: PC in 65%PAS (n=3) or 100% plasma (n=1) were spiked with high titers of 17D‐YFV and treated with S‐59/UVA PRT. Samples were taken pre‐ and post‐UVA illumination and infectious titers were determined, by plaque assay using Vero76 cells. The extent of inactivation was quantified by comparing titers before and after inactivation.
Results/Finding: Pre‐PRT infectious titers were 4.71 ± 0.7 Log10 PFU/mL for PC in 65% plasma and 5.19 Log10 PFU/mL for PC in 100% plasma while titers in post‐PRT samples were <‐0.7 ± 0.0 Log10 PFU/mL for PC in 65% plasma and <‐0.7 Log10 PFU/mL for PC in 100% plasma. Inactivation to the limit of detection of >5.41 ± 0.7 Log10 or inactivation of >4.71 ± 0.7 Log10 PFU/mL was achieved for PC in 65% plasma. Inactivation to the limit of detection of >5.89 Log10 or inactivation of >5.19 Log10PFU/mL was achieved for PC in 100% plasma.
Conclusion: The findings of this pilot study suggest that, similar to other Flaviviruses, including West Nile, dengue and Zika virus, S‐59/UVA PRT is efficient at inactivating the 17D‐YFV vaccine strain in PC independently of resuspension medium, and is a potential mitigation strategy for maintaining PC availability in areas affected by large YFV outbreaks with widespread vaccination campaigns. (Data for pathogen reduction of the Zika and Yellow Fever viruses by the INTERCEPT Blood System have not been submitted for FDA review).
CP359
Robustness of the Abbott Alinity s Assays to Biotin Interference
Josephine Siregar*1, Melanie Anderson1, Mark Dellamorte1, Susan Gawel1, Randal Makela1, Darwin Smith2, Mark Paradowski2, Jane Bryant2 and Gregg Williams1
1Abbott Laboratories, 2Abbott Diagnostics
Background/Case Studies: The use of biotin as a supplement has increased in recent years and many health care professionals may not be aware of the high dosage intake by their patients. This high dosage has resulted in an increased prevalence of individuals being exposed to biotin levels much greater than the recommended daily dose and as a consequence, has led to inaccurate lab results for assays that utilize the free capture biotin‐streptavidin methodology. Although Abbott's Alinity s assays do not utilize this free capture biotin‐streptavidin methodology, eight assays developed for blood screening on the Alinity s system were evaluated for biotin interference to ensure there are no unknown consequences of high biotin levels.
Study Design/Methods: The purpose of this study was to determine if the eight developed Abbott Alinity s assays would be susceptible to biotin interference by evaluating their performance in the presence of a high concentration of biotin. For each of the Alinity s assays evaluated (HIV Ag/Ab Combo, HTLV I/II, Anti‐ HCV, Chagas, HBsAg, Anti‐HBc, Syphilis, and CMV IgG), samples spiked with a concentration of biotin at approximately 1000 ng/mL were tested against a control (unspiked) sample preparation to determine if there was a difference between the control and biotin containing samples. Two samples, one negative and one positive, were tested with all assays, except the HIV and HTLV assays, which each tested two positive samples (1 HIV‐1 antibody and 1 HIV‐1 p24 antigen, and 1 HTLV‐ I antibody and 1 HTLV‐II antibody, respectively).
Results/Findings: For the negative samples, the sample to cutoff (S/CO) differences between the biotin spiked and control were 0.00 for HCV, HBc, Syphilis, CMV IgG, and Chagas, 0.01 for HIV Ag/Ab and HTLV I/II, and 0.03 for HBsAg. For the positive samples, the mean S/CO % differences between the biotin spiked and control were 0.00 % (antibody sample) and 0.36% (antigen sample) for HIV Ag/Ab Combo; 0.90% (HTLV I antibody sample) and 0.32% (HTLV II antibody sample); ‐1.43% for Anti‐ HCV, ‐2.52% for Chagas, ‐0.71% for HBsAg, ‐0.37% for Anti‐HBc, ‐1.62% for Syphilis, and ‐0.59% for CMV IgG.
Conclusion: Eight Abbott Alinity s assays were evaluated to determine if they were susceptible to biotin interference. These results indicate that the eight Alinity s assays do not show susceptibility to biotin interference at an approximate concentration of 1000 ng/mL.
CP360
Robustness of the Abbott PRISM Methods to Biotin Interference
C Fischer1, R Schneider2, W Leonard2, M Cobb3, G Schlauder3, GWilliams3, M Zuske2 M Janulis*2
1Transfusion Medicine, Abbott Diagnostics, Wiesbaden, Germany, 2ADD Diagnostics, 3Transfusion Medicine, Abbott Laboratories, Chicago, United States
Background/Case Studies: The use of biotin as a dietary supplement has increased significantly in recent years and many health care professionals do not realize their patients are taking high doses. The increase has resulted in an increased prevalence of people being exposed to biotin levels much higher than the recommended daily dose and as a consequence, potentially inaccurate lab results for assays that utilize the free capture biotin‐streptavidin methodology. The purpose of this study was to identify any Abbott PRISM assays that may be susceptible to biotin interference based on assay design and then evaluate the performance of those assays with high concentrations of biotin. After a comprehensive review of Abbott's current on market PRISM assays, no assays were identified that utilize biotin‐streptavidin capture; however, 3 assays were identified for subsequent testing as they contain biotin in their assay design.
Study Design/Methods: For the 3 PRISM assays: (HIV O Plus (LN 03L68), HTLV I/HTLV II (LN 6E50), and HCV (LN 06D18)), the Negative and Positive Controls were tested after being spiked with buffer or biotin in buffer to concentrations between 30 – 1000 ng/mL. The biotin spiked samples were then compared to the control sample preparation (buffer spike) to determine if there was a statistically significant difference between the untreated and biotin containing specimens.
Results/Findings:
TABLE 1. PRISM Assays using Biotin in the Assay Design
| Assay | Specimen | Mean S/CO of Untreated sample | Mean S/CO Difference (Range) From Untreated Sample Pool |
|---|---|---|---|
| HIV O Plus | Negative | 0.29 | 0.00 |
| Positive | 2.21 | ‐0.01 to 0.04 | |
| HCV | Negative | 0.10 | 0.00 |
| Positive | 2.83 | 0.01 to 0.06 | |
| HTLV‐I/HTLV‐II | Negative | 0.29 | 0.00 |
| Positive | 3.31 | ‐0.02 to 0.04 |
Conclusion: Three candidate Abbott PRISM assays were identified with potential susceptibility to biotin interference. These were used to test samples containing increasingly higher concentrations of biotin. No significant interference was observed for any Abbott PRISM assay at biotin concentrations up to 1000ng/mL.
CP361
Sensitive Immunoassay for the Early Detection of Bacteria in Platelet Concentrates
Ludivine Vossier*1, Lionel Valera2, Fanny Leon1, Romaric Bonnet3, Laetitia Rubrecht2, Gaelle‐Anne Cremer2, Typhaine Dagland2, Carole Chaix3, Jeannette Fareh2 and Chantal Fournier‐Wirth1
1Pathogenesis and Control of Chronic Infections (EFS‐Inserm‐Université de Montpellier), 2Bio‐Rad, R&D Marnes la Coquette & Montpellier, 3Institut des Sciences Analytiques, (CNRS‐Université de Lyon 1‐ENS)
Background/Case Studies: Bacterial contamination of platelets is the highest residual infectious risk in transfusion despite the current preventive strategies. While bacterial contamination may affect any blood component, the ambient storage temperature conditions for platelets make them most likely to facilitate bacterial growth. Based on all the precautionary measures, the final platelet concentrates include in the worst cases a very limited viable bacteria number estimated from 10 to 100 colony forming units (CFUs)/bag (i.e. 0.03 to 0.3 CFU/mL). One major difference between viruses and bacteria is that bacteria have the ability to grow up to a concentration of 108‐109 CFU/mL over the 5 days product shelf‐life. Moreover, a large diversity of strains is found in contaminated platelets representing a key challenge for the development of a generic bacterial test. The aim of this study was to develop an economic and easy diagnostic approach for the early, rapid, sensitive and generic detection of bacteria in platelet concentrates. The adaptability of the process with the blood transfusion services requirements was of major concern. Hence, attention was focused on an easy to automate technique able to deliver results on Day 2 after collection.
Study Design/Method: A large panel of bacteria involved in transfusion reactions including clinical isolates and reference strains was established and used for mouse immunizations, antibody screening and platelet spiking steps. An original approach was used to produce and select monoclonal antibodies directed against bacteria to develop our generic immunoassay. As recommended, 24 hours (Day 1) after collection a sampling volume of spiked platelets (0.1‐1 CFU/ml) was tested after a short generic culture, lysis and capture of bacteria on magnetic microparticles in a microplate format. An immunoassay was performed for the detection of the captured bacteria.
Results/Finding: This approach was tested on a panel of 25 bacterial strains involved in transfusion reactions. The pre‐analytical steps and the capture of bacteria on microparticles were improved to avoid false negative results and to enhance the sensitivity of detection. The full test developed in this study combining a pre‐analytical culture step followed by an immunoassay easy to automate allows a sensitive detection of 10 CFU/mL for all Gram negative bacteria tested and 102 CFU/mL for Gram positive ones.
Conclusion: In this study, a new approach of rapid bacterial culture followed by microplate immunoassay was developed for the generic and sensitive detection of bacteria in platelet concentrates, able to be easily implemented in transfusion services to deliver tested platelets as soon as on Day 2 after collection. This original approach could be adapted for the bacterial detection of other blood products.
CP362
Serological and Molecular Characterization of Occult Hepatitis B Virus Infection in Blood Donors
Xiaofei Wu*, Yao Jia, Bo Zhang, Yuwen Huang, Qin Mo and Xun Wang
Shanghai Blood Center
Background/Case Studies: Hepatitis B Virus (HBV) infection is the most important factor causing hepatitis, liver cirrhosis and hepatocellular. HBV infects over 350 million people worldwide and the prevalence of HBsAg is as high as 7.18% in Chinese population. Occult HBV infection (OBI) is defined as the detection of HBV DNA in the serum and/or liver tissue of individuals with HBsAg tested negative, which is a potential risk of HBV transmission through blood transfusion after HBsAg screening. Genetic mutation was one of the mechanisms resulting in OBI strains generating and appeared to have certain diversity in different regions infected with different HBV genotypes. This study was performed to investigate the serological characterization and mutations in surface (S) protein and basal core promoter/precore (BCP/PC) regions of OBI strains from blood donors in east China.
Study Design/Method: Blood donor samples confirmed HBsAg negative and HBV DNA positive were collected in a regional blood center. Serum anti‐HBc and anti‐HBs were tested by enzyme‐linked immunosorbant assay (ELISA). HBV DNA loads were determined by Roche COBASAmpliPrep/COBAS TaqManHBVTest v.1.0. HBV S and BCP/PC regions were amplified using nest‐PCRs and products were cloned in the TA cloning kit for sequencing. S nucleotide sequences were translated into amino acid sequences according to the open‐reading frames by DNAMAN software and HBsAg serologic subtypes were predicted from the amino acids sequences at position 122 and 160. HBV genotypes were determined by Blast in Genebank. S protein and BCP/PC gene mutations were determined by comparing with wild‐type HBV sequences in Genbank database.
Results/Finding: A total of 78 samples confirmed HBsAg negative and HBV DNA positive were collected, of which 70 samples with anti‐HBc and/or anti‐HBs positive were classified as OBI and 8 seronegative samples were classified as window period (WP). There were 23 samples positive for anti‐HBs and 18 were weakly reactive for anti‐HBs (<100IU/L).HBV DNA loads of all 70 OBI samples were less than 200IU/mL and lower than those of WP samples significantly (P<0.01). S regions were amplified in 27/78 samples, including 22 OBIs samples (12 genotype B and 10 genotype C) and 5 WP samples (3 genotype B and 2 genotype C).Of the 22 OBIs, 12 were adw subtye, 7 were adr subtype, 1 was varied to ayw subtye and 2 had unknown changes. S protein mutations were identified in 18 of the 22 OBI samples with relatively high incidences of Q101K/R, M103T/I, T126A/P, F134L and D144A in 10 genotype B, and S114T / A, T118K / R, K141T, S143T in 6 genotype C. The mutation rate and average number of amino acid substitutions of OBI samples were higher than those of HBsAg positive blood donors (P<0.05). No mutations were observed in 5 WP samples. BCP/PC regions were amplified in 32/78 samples (27 OBIs and 5 WPs) and 19 OBIs had nucleotide mutations with relatively high incidences of G1896A, A1762T and A1764A, A1752G.
Conclusion: We found that most of the HBsAg‐negative/HBV DNA‐positive blood donors were OBIs with very low HBV DNA loads in east China. Amino acid substitution in S protein and nucleotide replacement in BCP/PC region may be important mechanisms for the occurrence of OBI in these carriers infected with genotype B and genotype C HBV.
CP363
The Pivotal Role of Blood Establishments in Eradicating HCV in Taiwan
Ching‐Chuan Yeh*
Chinese Blood Donation Association
Background/Case Studies: Taiwan is a high endemic area of liver disease and HCV infection in general population. The HCV prevalence rates reported to be between 2% and 4%. However, incidence rates were difficult to obtain. McEwan etal. (2014) estimated, by back‐projection approach using observed hepatocellular carcinoma incidence, there are about 550,000 patients living with chronic HCV infection now in Taiwan.
Taiwan Blood Services Foundation (TBSF) initiated Anti‐HCV ELISA routine test since 1992 and HCV RNA NAT routine test since 2013 for every donation, so the prevalence and incidence of HCV among Taiwanese could be estimated by blood donor database.
Study Design/Method: To achieve WHO goal of HCV eradication by 2030, Taiwan had established a National Hepatitis C Program Office (NHCPO) to coordinate the multidisciplinary national plan, including health education, screening and prevention, treatment and follow‐up, research, surveillance and evaluation.
There are many stakeholders are involved in HCV eradication program, including government authority such as Centers for Disease Control and Prevention, National Health Insurance and Health Promotion Administration, and private property like hospitals, medical societies, pharmaceutical and vaccine industries, NPOs and academia.
Results/Finding: TBSF is a private nationwide single blood services program in Taiwan, and performs Anti‐HCV screening test and NAT confirmatory test on every collected blood, which is a large‐scale population screening of HCV in Taiwan because of its high blood donation rate (7.5%). TBSF confirmed positive test result of repeated blood donors, and can identify HCV RNA seroconversion cases as recently‐infected hepatitis patients. Those infected patients would be referred to physician for further medical care and deferred permanently by TBSF to secure blood safety. By interviewing the newly‐infected cases, the risk factors of HCV patients can be studied and then help identifying and eliminating sources of HCV infection. TBSF also contribute to health education by teaching our donors being aware of potential risks of HCV infection and keep monitoring every parameters of HCV epidemiology to evaluate the efficacy of HCV eradication program.
Conclusion: In HCV eradication program, TBSF can not only secure blood safety but also participate in health education, disease screening, etiology finding and prevention, surveillance and evaluation. Thus, among all stakeholders, TBSF is particularly important and can play a pivotal role in eradicating HCV by 2030 in Taiwan.
CP364
The Theraflex UV‐Platelets Technology Efficiently Inactivates Transfusion‐Relevant Bacteria Species in Contaminated Platelet Concentrates
Ute Gravemann1, Frank Tolksdorf2, Wiebke Handke1, Thomas H. Müller1 and Axel Seltsam*1
1German Red Cross Blood Service NSTOB, 2Maco Pharma International, GMBH
Background/Case Studies: The THERAFLEX UV‐Platelets system (Macopharma) is a UVC‐based pathogen inactivation system for platelet concentrates (PCs). Inactivation efficiency has been shown for a broad range of viruses, bacteria, and protozoans. Previous studies with the first set of bacteria species of the WHO International Repository of Platelet Transfusion Relevant Bacterial Reference Strains revealed a high inactivation capacity for clinically relevant bacteria. Aim of the current study was to investigate the bacteria inactivation efficacy of the THERAFLEX UV‐Platelets system for Enterobacter cloacae, Pseudomonas fluorescens, Staphylococcus aureus and Streptococcus bovis which have recently been added to the WHO International Repository.
Study Design/Method: PCs were produced from 5 buffy coats using the additive solution SSP+ (MacoPharma) with a residual plasma content of 35%. For inactivation kinetics, PCs (n=3) were spiked with bacteria to a final concentration of approx.106colony forming units (CFU)/mL and irradiated with increasing doses until the full UVC dose was achieved. Samples were taken for the bacterial titer determination after each irradiation step. For sterilization studies, two PCs were pooled and inoculated with bacteria to a final concentration of approximately 0.3 CFU/mL. Bacteria were allowed to grow for 6h in the PCs at 22 ± 2°C under agitation. After splitting, one PC remained untreated (growth control) while the other one was UVC‐treated. After storage for seven days, samples were taken from both bags for sterility testing by BacTALERT (Biomerieux) and for determination of the bacterial titer in the untreated control units.
Results/Finding: Bacteria in PCs were inactivated in a dose‐dependent manner by treatment using the THERAFLEX UV‐Platelets system. Mean log10reduction factors ranged from 6 to 7 for Enterobacter cloacae (6.3 ± 0.6, PEI‐B‐P‐43), Pseudomonas fluorescens (7.1 ± 0.4, PEI‐B‐P‐77), Staphylococcus aureus (6.6 ± 0.4, PEI‐B‐P‐63), and Streptococcus bovis (7.0 ± 0.3, PEI‐B‐P‐61).
PCs (n=12 for each species) spiked with these different bacteria species were efficiently sterilized (12 out of 12). Treated PCs remained sterile during storage for 7 days, while bacteria in non‐treated PCs grew to high titers of 106 – 108CFU/mL.
Conclusion: The THERAFLEX UV‐Platelets system efficiently inactivates a broad range of different bacteria species, including the WHO reference strains. Sterility is maintained over a storage period of 7 days. These results suggest that the UVC‐based pathogen inactivation technology will significantly improve the bacterial safety of platelet transfusions.
CP365
Transfusion Transmissible Infections Among Blood Donors and Strategy on Direct Laboratory Testing Cost of Blood Screening at National Blood Bank Center, Addis Ababa, Ethiopia
Abraham Zewoldie*
National Blood Bank Service
Background/Case Studies: blood and its components are life saving; however, they are also associated with life threatening hazards such as transfusion transmitted infections (TTIs). Hepatitis B virus (HBV), Hepatitis C virus (HCV), human immunodeficiency virus (HIV) and syphilis are the most serious infections transmitted during blood transfusion. Serious of blood shortages especially in developing countries and reliance on unsafe family replacement or paid donors also contribute to an increased risk of TTIs. Knowing the current prevalence of TTIs among blood donors will be crucial in donor program strategy development and cost effective alternative strategies of blood screening are highly required especially in resource limited setup.
Study Design/Method: A retrospective analysis of blood donors’ record covering the period from July 1, 2008 to July 30, 2013 was conducted. The data was collected from the Nation al Blood Bank (NBB) center Donor Data base. In addition, direct laboratory costs of parallel versus sequential strategy of blood screening were compared using the current price of the laboratory costs. Data was first exported to SPSS version 16 software for analysis. Data analysis was performed using scores and odds ratio using same software to look for an association between dependent and independent variables. P values less than 0.05 were considered significant.
Results/Finding: A total of 173, 207 consecutive blood donors were screened between 2008 and 2013. The overall seroprevalence rate of HBV, HIV, HCV and syphilis of blood donors was 5.0%, 1.6%, 1.4% and 0.1% respectively. The HIV‐HBV co‐infection was higher among blood donors 135(41.79%) followed by HBV‐HCV co‐infection whish accounts about 103(31.89%). Significantly increased sero‐prevalence of TTIs was observed in among Family replacement donors, factory workers, daily labors and the age group of 26‐35. In this study the difference in cost between the current in use strategy (parallel) versus the newly proposed designed sequential testing algorism was 746,773.9 Ethiopian Birr.
Conclusion: A significant percentage of the blood donors harbor TTIs. The NBB center should work on voluntary blood donor mobilization and develop culture of voluntarism. The direct laboratory cost analysis using current in use strategy (parallel) was higher than the newly designed sequential testing algorithm. Thus, the new strategy can be implemented to make screening of TTIs cost effective in NBB center.
CP366
Transfusion Transmitted Malaria in a 14 Month Old Infant
Patricia Davenport*1, Geeta Paranjape1 and Laurie Sutor1,2
1Carter BloodCare, 2UT Southwestern Medical Center
Background/Case Studies: In 2017 at a large pediatric hospital, a 14 month old infant was supported for 31 days by extracorporeal membrane oxygenation (ECMO). Over this time 113 blood products were transfused. About 10 days after end of ECMO support, a routine blood smear examination revealed inclusions in some of the patient's red cells. The patient had also been having intermittent fever. Malaria was confirmed by PCR as Plasmodium ovale (P. ovale). Because the patient had no other risks, the infection was suspected to be transfusion related and was reported to our blood center which had supplied all transfused products.
Study Design/Method: The investigation began by focusing on donors of red cell products, since the chance of an apheresis platelet product transmitting malaria is relatively small, and that of a frozen product is remote. We identified 27 donors of red cell products. Each donor was contacted and was asked four questions. Additional questions were asked for clarification if needed. Based on donor response, risk for active malaria infection was assessed. We also considered areas where P. ovale is, or is not found. Donors identified as having possible risk were tested for antibodies and parasitic DNA.
| Additional Questions for Malaria Risk Assessment | Y | N | |
|---|---|---|---|
| 1 | Since your last donation, have you felt ill or had fever? | 5 | 22 |
| 2 | In the last 3 years, have you been outside the U.S. or Canada? | 10 | 17 |
| 3 | Have you ever been a resident of or lived in another country? | 3 | 24 |
| 4 | Have you ever been diagnosed with malaria? | 0 | 27 |
Results/Finding: The five donors who had been ill all had common cold or bronchitis like symptoms. Donors who traveled went only to non‐risk areas. Three donors were former residents of another country and may have risk because they lived in malaria endemic countries since birth and came to the U.S. as adults. It was discovered that one of these three did not meetall donor criteria. The donor had failed to disclose that he had not completed 3 years stay in the U.S. after emigrating from Cameroon, an area endemic for P. ovale. He had not travelled anywhere after coming to the United States in October 2014 and answered “No” to travel. Antibody tests on this donor were positive for P. ovale and P. falciparum, but PCR tests were negative. Another possible at‐risk donor, a former resident of Iran was tested and was PCR and antibody negative. The third donor has not yet been tested but the country of residence does not have P. ovale malaria.
Conclusion: While it could not be definitively proven that the donor with antibodies to P. ovale had active malaria at the time of donation, the donor was indefinitely deferred and referred to an outside physician for treatment.
CP367
Transfusion‐Transmitted Babesiosis Outside an Endemic Area: A Case Report
German Felix Leparc*
OneBlood
Background/Case Studies: An 81 y.o. male patient was admitted to the Emergency Room for severe acute gastrointestinal bleeding, caused by an arterio‐venous malformation later located in the proximal jejunum that was clipped endoscopically. During this admission, he received a total of 13 units of Red Blood Cells. Approximately 4 weeks later, he was re‐admitted due to another episode of GI bleed manifested by melena. As part of his routine evaluation, a CBC was performed in which a blood smear revealed the presence of intraerythrocytic parasites consistent with Babesia sp.
Study Design/Method: Upon notification of a suspected case of Transfusion‐Transmitted Babesiosis, lookback of all donors involved in prior transfusion event was initiated.
Results/Finding: To confirm the presumptive diagnosis of babesiosis, PCR was performed and Babesia microti DNA was detected. An evaluation of the patient's risk factors revealed that prior to the GI bleed episode for which he received transfusions, eight months earlier he was also transfused during open heart surgery. No travel history to the US Midwest, and while he travelled to New England two years ago he did not spend time outdoors. He was splenectomized in his mid 20's. Donor lookback identified a donor who lived in New London County, Connecticut but spent the winter season in Central Florida, where the blood donation (double RBC collected by apheresis) took place. He had never been diagnosed with babesiosis, but participated regularly in outdoor activities in Connecticut that put him at risk for tick bites (although he never noticed being bitten or showing signs of it). Upon testing, he was found to be negative for B. microti on PCR as well as IgM antibodies, but had IgG antibody titers of 1:256. The recipient of the other RBC unit collected in the same donation was deceased within hours of transfusion, so no follow up could be performed. During phone interviews, none of the remaining donors had risk factors for babesiosis, and all but four were tested and found serologically negative.
Conclusion: While transmission of babesiosis through the zoonotic route is confined to regions were the appropriate hosts and vector coexist, people from areas where it is endemic may establish temporary residency and donate blood in non‐endemic locations facilitating transmission through transfusion as illustrated in this case. Once licensed assays for Babesia microti become available, testing schemes will have to be formulated through policies that take this issue into consideration.
CP368
Transfusion‐Transmitted Stenotrophomonas Maltophilia from a Red Cell Unit: A Case Report
Ashley C Gamayo*1, Andrea J Linscott2 and Donny Dumani3
1University of Queensland‐Ochsner Clinical School, 2Clinical Microbiology Laboratory, Ochsner Health System, 3Department of Pathology and Laboratory Medicine, Section of Transfusion Medicine and Histocompatibility, Ochsner Health System
Background/Case Studies: Transfusion‐transmitted bacterial infections (TTBI) are rare, but serious complications of blood product transfusions. From 2011‐2015, 8% of 173 transfusion‐associated fatalities reported to the FDA were attributed to bacterial contamination. Red cell units are rarely implicated in severe and fatal TTBI. When present, contaminants are often gram‐negative rod (GNR) bacteria with psychrophilic properties. We present a case of a sickle cell patient who developed definitive sepsis after receiving a red cell unit contaminated with Stenotrophomonas maltophilia (S. maltophilia).
Study Design/Methods: A 27‐year‐old female with sickle cell disease was admitted to the hospital for possible pain crises. Pre‐transfusion blood and urine cultures collected on Day 1 of hospitalization showed no growth after five days. On Day 3, the patient required a blood transfusion for which she was issued a CMV‐safe, irradiated, HbS‐negative, crossmatched, O‐negative red cell unit. The 318mL unit had been aliquoted via sterile connecting device 12 days prior for a pediatric patient. All 26mL of the pediatric aliquot were transfused without adverse effects. The patient's pre‐transfusion temperature was 37.1°C. Within 45 minutes of starting the transfusion, the patient's temperature increased to 39.3°C and subsequently reached a maximum of 39.5°C. The transfusion was stopped and the blood bank notified immediately. Gram stain of the remainder of the transfused component revealed GNR bacteria. Blood was collected from the patient for culture and antibiotic treatment initiated.
Results/Findings: Initial transfusion reaction work‐up revealed no evidence of clerical errors with negative post‐transfusion antibody screen and direct antiglobulin test. Blood cultures from both the patient post‐transfusion and the implicated red cell unit grew GNR bacteria identified as S. maltophilia. Further microbial testing revealed the cultured pathogen was able to proliferate at 4‐6°C; a finding not characteristically observed in S. maltophilia. Conclusion: This is the first definitive case of TTBI with S. maltophilia. This bacterium is a globally emerging GNR that is widely spread in the environment, causing both community‐acquired and nosocomial infections in immunocompromised and debilitated patients. Contamination was unlikely due to an asymptomatic donor. There was laboratory evidence of the pathogen in both the transfusion recipient and the transfused component. The patient was not infected with the pathogen prior to transfusion, and no other potential exposures could be identified. The patient recovered following appropriate antibiotic treatment, but endured prolonged hospitalization. The transfusion reaction was classified as definitive, severe TTI of definite imputability.
CP369
Validation of Commercial Immunoassays for Detecting HBsAg and HIV Antibodies in Production Pools
Karen Leighton, Izekial Butler and Scott Jones*
QualTex Laboratories
Background/Case Studies: Plasma fractionators test plasma production pools for HBsAg and HIV antibodies as a qualitative limit test for the control of impurities, to safeguard against errors in donation testing or pooling. The European Medicines agency (EMA) has published guidelines for the validation of immunoassays for the detection of HBsAg and HIV antibodies in production pools. The aim was to validate commercial immunoassays for the testing of production pools for HBsAg and HIV antibodies utilizing the EMA guidelines.
Study Design/Method: A lower calculated cutoff value for the ABBOTT PRISM HBsAg and HIV O Plus assays was determined by calculating the mean signal‐to‐cutoff ratio (S/CO) plus 3 standard deviations of four different types of plasma production pool samples. The calculated cutoff values were utilized for the rest of the validation. The detection limit was determined by testing in triplicate, serial dilutions of WHO HBsAg and HIV antibody standards diluted in plasma. A normalized detection limit was calculated for the HBsAg assay using production pools containing low, typical and high anti‐HBsAg titers. Intra‐assay variability was determined by testing a minimum of 6 determinations of a low positive control in 1 run. Inter‐assay variability was determined by testing at least 3 representative negative production pool samples, at least 1 low positive sample (about 3S/CO) and a titration series of WHO standard spiked into plasma production samples. Runs were performed on six separate days using two different instruments and two different lots of assay reagents.
Results/Finding: The lower calculated cutoff values for the HBsAg and anti‐HIV assays were both below the manufacturer cutoffs of 1.00 and were 0.72 and 0.48 respectively. The HBsAg assay detection limit was 0.065 IU/mL for source plasma and 0.120 IU/mL for recovered plasma samples. The normalized detection limit study demonstrated that one and a half hours was the maximum amount of time the pool samples could sit at 15‐250C where all samples were still reactive for HBsAg. The anti‐HIV lowest positive dilution for all replicates varied between 1:10,000 to 1: 1,250,000 depending on subtype and group. The % CV of the S/CO values of the replicates of the intra‐assay variability validation were less than 5% for both assays. The %CV of the S/CO values of the panel of samples of the inter‐assay variability validation were less than 14%.
Conclusion: A lower calculated cutoff value could be determined for commercially available immunoassays for HBsAg and anti‐HIV. These immunoassays could meetall of the recommendations in EMA validation guidelines. The ABBOTT PRISM HBsAg and HIV O Plus assays can be utilized to test production pool samples.
CP370
Zika Virus Donor Screening–First Year Experience of a Community Blood Center
Randal Covin* and Kim‐Anh T Nguyen
Blood Bank of Hawaii
Zika Virus Universal Donor Screening–First Years’ Experience
Background/Case Studies: Due to Hawaii's geographical location, presence of Aedes mosquitoes, and recent outbreaks of dengue virus (DENV), we began universal, individual donor testing for ZIKV on August 22, 2016. The findings represent the first 7 months of testing.
Study Design/Methods: Procleix ZIKV TMA, under Hologic Inc. investigational new drug protocol, was performed by Creative Testing Solutions, Tempe, AZ. Initial reactive samples were repeated in duplicate. Supplemental testing including ZIKV qRT‐PCR (plasma and red cells), ZIKV IgM antibody‐capture ELISA, ZIKV IgG ELISA, and DENV IgG ELISA were performed by Blood Systems Research Institute, San Francisco, CA. If a ZIKV antibody test was positive, a reporter viral particle neutralization test was performed. Trioplex RT‐PCR on serum and urine and ZIKV IgM ELISA were performed by the Hawaii State Department of Health (DOH). Donors with reactive donations were informed of their results and assessed for risk factors by the medical director. Donors with reactive ZIKV NAT results were invited to participate in a follow up study with additional samples drawn at approximately one week intervals. Lookback was performed per FDA recommendations.
Results/Findings: From 8/22/16‐3/22/17, ten initially reactive donations were identified from 30,493 donations, for an initial reactive rate of 1 per 3049 donations tested. Repeat and supplemental testing were negative for all donations. No donors had risk factors for ZIKV infection. Follow up testing was performed on 6 donors (3‐17 days after the index donation) ‐ 3 donors in the follow up study and 3 tested by the DOH. No donors tested by the DOH participated in the follow up study. Follow up testing was negative for all 6 donors. DENV antibodies were negative in 9 donations and equivocal in 1. Our initial reactive rate is higher than that reported to date for the Procleix ZIKV TMA of 1 per 23,342 [P. Williamson, etal Transfusion, in press].
Conclusion: Universal testing under IND was successfully implemented and incorporated into blood center operations. We have noted an initial reactive rate of 1 per 3049 for ZIKV‐NAT. The reason for the higher initial reactive rate is unclear but does not appear related to prior infection with DENV.
TABLE 1. False positive donations
| Case | Collection Date | S/CO | Repeat S/CO | Donor Age | Donor Gender |
|---|---|---|---|---|---|
| 1 | 8/24/2016 | 28.01 | 0.00 0.01 | 57 | M |
| 2 | 9/5/2016 | 16.73 | 0.00 0.00 | 69 | F |
| 3 | 9/12/2016 | 15.34 |
0.00 0.00 |
17 | F |
| 4 | 9/14/2016 | 30.51 |
0.00 0.07 |
74 | M |
| 5 | 2/8/2017 | 1.10 |
0.00 0.10 |
62 | F |
| 6 | 2/8/2017 | 1.32 |
0.00 0.00 |
17 | M |
| 7 | 2/9/2017 | 1.61 |
0.00 0.00 |
50 | F |
| 8 | 2/9/2017 | 1.58 |
0.00 0.00 |
55 | F |
| 9 | 2/9/2017 | 1.20 |
0.00 0.00 |
73 | M |
| 10 | 2/9/2017 | 2.34 |
0.00 0.00 |
45 | F |
CP371
Zip Code as a Surrogate of Income and Education Level to Predict Cytomegalovirus Seroconversion in Healthy Donors in South Texas
Rachel Beddard* and Samantha Ngamsuntikul
BioBridge Global
Background/Case Studies: Cytomegalovirus (CMV) is a herpesvirus that usually produces mild or no symptoms in healthy people but can cause severe neurologic effects in unborn infants and immunocompromised patients. Although leukoreduction is widely accepted as equivalent to seronegativity, many hospitals still order CMV seronegative red blood cell and platelet units for their highest risk populations. CMV seropositivity has been associated with age, ethnicity, education level, income level, having young children in the household, and having high risk jobs such as healthcare workers or daycare workers. Studies report higher education and income levels are associated with lower CMV seropositive rates. With the need to maintain an inventory of CMV seronegative RBCs and PLTs, this center investigated the use of donor zip code as a surrogate marker for income and education level to predict CMV seroconversion.
Study Design/Method: Retrospective data was collected for the period April 1, 2012 through March 31, 2017. The information collected included total number and number of positive CMV antibody tests stratified by zip code of donor residence. Median income and % of residents with a college degree was obtained for each zip code from census data for the year 2014. CMV antibody was assayed by passive particle agglutination for IgG or IgM (Beckman Coulter).
Results/Finding: Only zip codes with census data on median income and % of residents with a college degree were included in the analysis. In addition, only zip codes with over 50 tests during the 5 year period were included. A total of 156 zip codes are included in this analysis. The median household income ranged from $14,578 to $102,229 per year per zip code. The % of residents with a college degree ranged from 2.9 to 62.9% per zip code. The CMV seroconversion rate ranged from 0 to 3.92% per zip code. Statistical analysis showed a correlation coefficient of 0.038 for median household income and % CMV seroconversion and a correlation coefficient of 0.049 for % of residents with a college degree and % CMV seroconversion.
Conclusion: Donor zip code cannot be used as a surrogate marker for income level or education level in order to predict CMV seroconversion rate. Other demographics that should be analyzed for their potential to be used to predict CMV seroconversion rate include gender, age, race, ethnicity or a combination of these.
Administrative Oral Abstract Session: Program Development in Quality and Managerial Work Plans
A1‐A03C
Benefits of Centralized Team‐Based Quality Auditing
Meta Helsing*, Michelle Guidry and Carolyn Dobbins
Blood Systems, Inc
Background/Case Studies : Growing the geographic footprint has been a priority for the organization since 2014. Over a four year period, the organization doubled the number of blood centers, with continued growth expected. With the current challenges in the blood industry, the audit program needed to be flexible, maximizing efficiency and capacity utilization, and without increasing compliance risk. The internal audit function was centralized in late 2011, for which the program consisted of 2 types of audits, an operational compliance audit and a support systems compliance audit. Each type was performed twice per year at each main center. This model was no longer serving the changing organization.
Study Design/Methods: Lean Six Sigma concepts were applied to this project. Survey results and brainstorming aided in capturing the strengths of the current program, opportunities for improvement, and ideas for a redesigned program. This information was the primary input to the SWOT Analysis (Strengths, Weaknesses, Opportunities, and Threats) for the purpose of understanding performance of the current program, as well as elements that could impact the future design. Potential solutions were placed into a Pugh Matrix, which was used to facilitate a disciplined, team‐based process for concept generation and selection. Each potential solution was compared to criteria for evaluation and selection of the best solution.
Results/Findings: The program was re‐designed to perform internal audits annually as a single, team‐based comprehensive audit. Remote auditing was incorporated to require less on‐site time, less disruption, improved auditor work/life balance, and cost savings. A formula was created to determine on‐site audit time that included adjustable risk factors. The audit reporting process was also automated for simplification, efficiency, and to meet stakeholder needs. The team‐based approach leverages auditor strengths, fosters a learning environment, and increases detectability of organization‐wide concerns.
| Audit Metric | Initial Centralized Model | Team‐based Comprehensive Model | % Improvement |
|---|---|---|---|
| # Centers Covered/Auditor | 14 | 22 | 57% |
Conclusion: The comprehensive team‐based approach, and other program improvements, has been effective in responding to organizational growth without sacrificing Quality or increasing compliance risk. External inspection performance has achieved record performance levels the past year. Diversity of auditor skills led to a stronger skill presence, which was consistently applied across system. Auditing is more efficient and effective. Stronger collaboration among audit team members provided stronger objectivity, fairness, and consistency across the system. Auditors and auditees have increased in knowledge, and the internal quality audit program has improved.
A2‐A03C
Validation of New Blood Bags for Blood Fractioning Using Reveos System
Robert Fernandez1, Silvia Bertran1, Jeff Blakeslee2, Susanne Marschner2, Nuria Martinez1, Elena Valdivia1, Lluis Puig1 and Susana G Gomez*1
1Banc de Sang i Teixits, 2Terumo BCT
Background/Case Studies: In many places, blood banking is using semi‐automated systems to perform fractioning in different blood components (red blood cells, platelets and plasma). Banc de Sang i Teixits (BST), adopted the fully automated Reveos system (Terumo BCT Inc, Lakewood, CO) few years ago to manufacture blood components. In June 2016, BST started a validation of new blood bags manufactured by Terumo BCT with different variables on platelet volume after processing and a kit to perform platelets pools with a new filter.
Study Design/Method: To perform this validation, 300 blood donations were used under different conditions (see Table below). The current filter evaluated for the platelet pool (LRF‐XL, Haemonetics Corporation) was compared to a new filter (Terumo BCT Inc.). The new blood bags were manufactured using a new vinyl supplier. A portion of these processed blood components (red blood cells, platelets and plasma) was used for different quality control (QC) tests (routine QC performed at BST following European Directorate for Quality of Medicines & Healthcare; cytokine analysis, such as P‐Selectin and platelets recovery through the filter).
Results/Finding: The results are very similar between both bags, current and new one, as well as filters. All the analysis done to evaluate the quality of the blood components were similar in all conditions. Also, it was shown a better performance on platelets pools, when they came from bags centrifuged with 60ml of plasma, vs. 30ml of plasma and additive solution.
TABLE. A2‐A03C
| Leukoreduction (WBC x106) | Platelets/uL | RBC/uL | pH (Day 5) | Median platelets recovery (%) | |
|---|---|---|---|---|---|
| current bag & new filter (30ml of plasma) | 0.04 | 1.159 | 1.054 | 6.98 | 96.04 |
| new bag & new filter (30ml of plasma) | 0.09 | 1.150 | 1.037 | 6.88 | 96.57 |
| new bag & new filter (60ml of plasma) | 0.10 | 1.431 | 1.028 | 7.05 | 96.51 |
Conclusion: These new bags and filter have shown a similar behavior when using them for manufacturing blood donations with Reveos system in our blood bank. Regarding the new platelets pooling kits, a better manipulation by the operator was observed; although the tubing is shorter and it meant being more difficult when manipulating the pools. No issues should be found if they are implemented in routine use. It's planned to start this implementation during this year, 2017; so then there will be larger results in order to have a proper procedure qualification.
A3‐A03C
Modeling the Cost of Implementing Pan Genera Detection (PDG®) Testing in a Multi‐Hospital Healthcare System
Wen Lu*, Christy Hudson, Karen McCasson, Patrice Walton and Priscilla Figueroa
Cleveland Clinic
Background/Case Studies: FDA Draft Guidance for Industry titled, “Bacterial Risk Control Strategies for Blood Collection Establishments and Transfusion Services to Enhance the Safety and Availability of Platelets for Transfusion” when finalized would require secondary testing of day 4 and day 5 nonpathogen‐reduced platelets. The purpose of this study was to assess the cost of implementing platelet bacterial risk control strategies across our healthcare system. As pathogen‐reduced platelets are not yet available in our region and our blood suppliers are not implementing secondary testing, we modeled the implementation of the Platelet Pan Genera Detection (PDG®) test (Verax Biomedical, Marlborough Massachusetts).
Study Design/Methods: The anticipated volume of platelets needing testing was extrapolated from retrospective data from 2015 to 2016. Costs were included for PDG kits [for validation, daily quality control (QC), proficiency testing (PT), and training], other reagents, personnel, additional sterile connecting devices and heat sealers, and courier costs for transporting tested platelets to hospitals. Personnel costs considered test performance, result entry, inventory management, and platelet packing. Costs were separated into one‐time costs associated with implementation (equipment, validation, training) and recurring costs [routine testing, daily QC, PT, annual competency, additional staff (FTE)]. Three different testing models were assessed. Completely centralized testing where the highest transfusion volume hospital manages the platelet inventory and performs PDG testing for the healthcare system; regionalized testing with three testing and distribution hubs; and local testing by each hospital. Supplier platelet availability was assumed to remain comparable to current inventories.
Results/Findings: Platelet inventory and usage data revealed that approximately 16,000 day 4 and day 5 platelets would need to be tested per year at a cost of $403,800 for PGD kits alone. We estimate an additional $14,000 per year of model independent system cost for repeat duplicate testing and discarded platelets. The table shows total costs exclusive of repeat testing and platelet discard.
TABLE. A3‐A03C
| Centralized | Regionalized | Local Testing | |
|---|---|---|---|
| Total One‐time Costs | $26,387 | $35,933 | $170,675 |
| • FTE | • $4,995 | • $9,825 | • $22,085 |
| • Equipment, PGD kits, other reagents, and disposables | • $21,392 | • $26,108 | • $148,590 |
| Recurring Costs | $571,813 | $601,028 | $624,397 |
| • FTE | • $84,240 | • $107,147 | • $129,502 |
| • PGD kits, QC reagent, and disposables | • $423,739 | • $463,343 | • $494,895 |
| • Packing, courier | • $63,834 | • $30,538 | • $0 |
Conclusion: Under current conditions with limited availability of product and testing options, implementation of platelet bacterial detection testing for our healthcare system, regardless of the strategy used, would be associated with yearly costs exceeding a half million dollars. Our models likely underestimate the true financial impact as reduced platelet availability and associated patient management consequences are not considered.
A4‐A03C
American Rare Donor Program (ARDP): Provision of Units for High Prevalence Antigen Requests
Joan L Maurer*1 and Sandra Nance2
1ARDP, 2American Red Cross and American Rare Donor Program
Background/Case Studies: The American Rare Donor Program is a national database of donors identified, qualified, and registered as rare donors (frequency of less than 1:1000 donors) by the 87 ARDP facilities. Donors found to be negative for a high prevalence antigen comprise approximately 10% of the total registered rare donors. At the end of 2016, there were 65,801 active donors in ARDP, approximately 6,580 lacking a red cell antigen of high prevalence. From a perspective of obtaining all the units required for a request, these have seemed most challenging to fill. This study focused on interrogating the data on number of units requested and number of units obtained to authenticate the observation.
Study Design/Method: The ARDP software program contains the donor database as well as the requests from ARDP members. Requests received to locate high prevalence antigen negative units were tabulated for 2016. The data gathered included the number of requests for each type (or system) and the number of units obtained.
Results/Finding: In 2016, there were 686 requests to the ARDP and 1475 rare units shipped. Of the total requests, 480 (70%), were for units lacking high prevalence antigens. The requests, categorized by requested antigen negative specificity are shown in the table. Data in the table is focused on the high prevalence antigen negative type requested, but frequently, the patient also has antibodies to common or low prevalence antigens, complicating the request. Types for which no units were available or shipped from ARDP member facilities were At(a‐),Cr(a‐), En(a‐), I‐ , In(b‐), MER2‐, Rhnull, Sc:‐1,‐2,‐3, and Wes(b‐) which were 4% of the total (18 of 480). Combining D+ and D‐ requests for U‐, there were 166 requests (of 480, 35%), making this the most requested type with the most units obtained. The table contains data on other types of interest.
TABLE. A4‐A03C
| Type Requested | # of Requests | # Units obtained | Type Requested | # of Requests | # of Units obtained |
|---|---|---|---|---|---|
| AnWj‐ | 2 | 2 | Kp(b‐) | 11 | 19 |
| At(a‐) | 1 | 0 | Lan‐ | 6 | 5 |
| Co(a‐) | 7 | 13 | Lu(a‐b‐) | 5 | 3 |
| Cr(a‐) | 1 | 0 | Lu(b‐) | 13 | 16 |
| Di(b‐) | 9 | 10 | LW(a‐) | 3 | 0 |
| En(a‐) | 1 | 0 | McLeod | 3 | 6 |
| GE System‐ | 20 | 21 | MER2‐ | 1 | 0 |
| H‐ | 5 | 10 | Molec. Match* | 35 | 40 |
| Hy‐ | 4 | 7 | PP1Pk‐ | 6 | 12 |
| I‐ | 4 | 0 | Rhnull | 4 | 0 |
| In(b‐) | 1 | 0 | Sc:‐1,‐2,‐3 | 1 | 0 |
| Jk(a‐b‐) | 16 | 21 | U‐ D+ | 149 | 240 |
| Jo(a‐) | 11 | 10 | U‐ D‐ | 17 | 23 |
| Jr(a‐) | 2 | 1 | Vel‐ | 36 | 87 |
| Js(b‐) | 21 | 34 | Wes(b‐) | 1 | 0 |
| Ko | 4 | 3 | Yt(a‐) | 33 | 59 |
| k‐ | 46 | 100 |
Molec. Match = Molecular matched unit request, includes RHCE Variants
Conclusion: Patients requiring rare blood products are rare, and those lacking high prevalence antigens are the most challenging for whom to obtain antigen negative blood. It is clear that some requests for exquisitely rare types are not able to be filled with current donors. Molecular testing of large numbers of donors has likely helped to identify more rare donors in recent years. It is recognized that commercial platforms do not include many of these making these rare types even more challenging to find. Consideration should be given to testing more donors of all ethnicities to identify more rare donors.
A5‐A03C
Assay Development of a Laboratory Developed Test (LDT) on Different Models of Flow Cytometers
Wendy Beres*1, Sandra Nance2, David Moolten3 and P. Dayand Borge3
1American Red Cross, Assay Development, 2American Red Cross, Immunohematology Reference Laboratory, Biomedical Services, 3American Red Cross, Medical Office
Background/Case Studies: As part of the required quality program, assay validation must be performed for in‐house LDTs. Performance characteristics relating to analytical validity are established for the use of the test system in the lab environment. A LDT to detect red blood cell (RBC)‐bound IgG was developed for the Becton Dickinson FACSCaliburTM and FACScanTM (San Jose, CA). Assay validation included the optimization of the working dilution for the fluorescent antibody and development normal ranges prior to study testing. The normal range was determined for each new lot of anti‐human IgG reagent by calculating the mean ±3 standard deviation (SD) of RBC‐bound IgG levels of donors in a similar approach to clinical instruments. The optimal dilution and normal ranges for each instrument were established.
Study Design/Method: Residual EDTA‐anticoagulated aliquots from blood donors were utilized with Institutional Review Board approval. A group O donor pool was created from 10 donors, 4 aliquots made and the separate aliquots were coated by tannic acid treatment with IgA, IgG, and IgM. The untreated pool and Ig coated cells were evaluated by flow cytometry (FC) with fluorescein isothiocyanate (FITC)‐labeled anti‐human IgG (lot #119973)(Jackson ImmunoResearch Lab, West Grove, PA) at dilutions of 1/100, 1/200, 1/300, 1/400, and 1/500 in Dulbecco's PBS containing 0.6% BSA. The optimal dilution of 1/300 was chosen, and 30 donor samples were evaluated by both instruments in 3 batches of 10 on 3 separate days of testing. The Becton Dickinson FACSCaliburTM and FACScanTM (San Jose, CA) FC analyzed 50k RBCs from each sample. In each test run controls reacted as expected.
Results/Finding: The optimal anti‐IgG dilution was chosen by calculating the percent difference between the IgG coated RBCs and the IgA and IgM coated RBCs; to minimize cross‐reactivity. The anti‐IgG dilution of 1/300 had the highest percent difference; 99.95% for the FACSCaliburTM and 99.71% for the FACScanTM. The FC detects RBC‐bound IgG and reports the percent of RBCs with bound IgG. The mean value of 30 donors tested by the FACSCaliburTM for RBC‐bound IgG was 1.93%, SD of 1.13, minimum value of 0.40%, maximum value of 4.87%, and calculated normal range of 0 – 5.33%. The FACScanTM had a mean value of the same 30 donors for RBC‐bound IgG of 2.59%, SD of 1.65, minimum value of 0.52%, maximum value of 7.07%, and calculated normal range of 0 – 7.53%.
Conclusion: The calculated normal range of the same donor samples, tested minutes apart yielded the same optimal antibody dilution, but the RBC‐bound IgG normal range on the FACScanTM was 41% greater when compared to the FACSCaliburTM. This data suggests it is not only important to performed assay validation for each instrument, with separate reagent qualifications and normal range. This data also supports the CLIA requirement to have method comparisons performed on like instruments used for the same test method.
A6‐A03C
Potential Impact of AABB Bulletin #17‐02 Updated Strategies to Limit or Prevent Iron Deficiency in Blood Donors
Samantha Ngamsuntikul*, Randal Birkelbach and Rachel Beddard
BioBridge Global
Background/Case Studies: In March 2017, AABB published Association Bulletin #17‐02 Updated strategies to limit or prevent iron deficiency in blood donors. The Association Bulletin recommends the following to limit or prevent iron deficiency: updating educational materials and implementing one or more of the following strategies: donor iron supplementation, ferritin testing or lengthening of interdonation intervals/decreasing the number of donations per year. In addition, AABB asked blood collection facilities to focus on the following at risk groups: young donors, premenopausal females, frequent donors and donors near hemoglobin cut off values.
Study Design/Method: In order to determine the potential impact of the AABB bulletin, BECS data for donors collected from April 1, 2015‐ April 27, 2017 was used for this analysis. The following data was analyzed: gender, number of donations, hematocrit and age.
Results/Finding: In order to evaluate the potential impact, data was pulled for donors most at risk for iron deficiency.
TABLE A. Data for at risk groups over a 2 year period
| Number of donors | Percentage (%) of total donor base | |
|---|---|---|
| Number of 16‐18 year old donors | 39, 972 | 31.49% |
| Number of premenopausal donors (ages 19‐55) | 56, 125 | 45% |
| Females with a hematocrit between 38‐39% | 18,219 | 14.35% |
| Males with a hematocrit between 39‐41% | 9,375 | 7.39% |
| Total | 123, 691 donors over 2 years |
TABLE B. Additional at‐risk category: Frequent donors
| Frequency of donation in 2016 | Number of donors | % of total donor base in 2016 |
|---|---|---|
| Males donating > 3 times | 5,036 | 4.38% |
| Females donating > 2 times | 10,964 | 9.54% |
| Total | 16, 000 donors/year | 13.92% |
Recommendation #1: Updating donor educational material to provide more comprehensive information on risks of iron deficiency and recommendations on iron supplementation.
Updating our educational materials will likely have a minor impact.
Recommendation #2: Implementing strategies such as iron supplementation, ferritin testing or increasing interdonation intervals for all donors or those groups most at risk for iron deficiency. Initial implementation would likely be either iron supplementation or ferritin testing for at risk groups only and implementation of either one of these strategies would potentially affect over 120, 000 donors.
The recommendation to limit the number of donations would have a substantial impact. For this analysis, the focus was on 16‐18 year olds and premenopausal women (ages 19‐55) donors. On average, 16‐18 year olds donate 1.3 times a year and premenopausal women donate 1.49 times a year. If both of these groups were limited to donating once a year, a total of 4,845 donations from 16‐18 year olds and 9,272 donations from premenopausal donors would not be collected.
Conclusion: After analyzing the impact of the AABB Association Bulletin #17‐02, the bulletin will have a significant impact on both donors and our local blood supply. More than half of donors would receive either ferritin testing or iron supplementation. If the only measure employed is limiting the number of times a donor could donate for 16‐18 year olds and premenopausal women, this recommendation would have a substantial impact on our ability to provide blood products to local hospitals.
References
Association Bulletin #17‐02. Updated Strategies to Limit or Prevent Iron Deficiency in Blood Donors. Bethesda, MD: AABB, 2017. [Available at: http://www.aabb.org/programs/publications/bulletins/Docs/ab17-02.pdf]
Administrative Oral Abstract Session: Transfusion Management ‐‐ Teaching, Challenges and Emergencies
A7‐A03G
How to Best Teach Transfusion Medicine to Medical Students
Mojca Konia1, Martina Richtsfeld2, Claudia S. Cohn3, Andrew Johnson1, Micheal Lougee1 and Shanna Morgan*1,4
1University of Minnesota, 2Department of Anesthesiology, University of Minnesota, 3Department of Laboratory Medicine and Pathology, University of Minnesota, 4American Red Cross
Background/Case Studies: Transfusion medicine knowledge deficits are apparent among medical students, residents and practicing physicians. These deficiencies may be due to the frequency and type of education. The majority of medical students in the United States receive four or fewer hours of transfusion medicine education. The Transfusion Medicine Academic Award Group published educational content guidelines for medical school, residency and fellowships. However, the frequency and educational methods remain poorly evaluated and with little guidance. We investigated the effects of different educational techniques on transfusion medicine knowledge acquisition in novice learners.
Study Design/Method: Three educational pathways were developed to teach principles of transfusion medicine while allowing learners to recognize problems and develop solutions for transfusion medicine complications. The simulation group received all educational activities within a 2.5 hour in‐person, high‐fidelity live session. The hybrid group received some educational component online and also attended an in‐person high‐fidelity simulation session. The online only group received all educational materials online, including a pre‐recorded‐video simulation session. The learners were second year medical students enrolled at one institution. The same faculty members taught all live sessions and developed all online materials ensuring the content was the same. A pre‐ and post‐test was created to address blood groups, blood donation, blood testing, blood component indications and transfusion complications. The educational session was evaluated by the Likert scale survey which ranges from zero (poor/unsatisfactory) to five (outstanding).
Results/Finding: 97% (101/104) of the simulation group students improved their post‐test scores and had an average Likert scale rating of 4.1 (very good). 89% (63/71) of hybrid group students improved their post‐test scores and had an average Likert scale rating of 4.2 (very good). 89% (90/101) of online only students improved their post‐test scores and had an average Likert scale rating of 3.0 (good). The average changes in scores were statistically significant within all training groups (p value < 0.0001). Additionally, the simulation group had a larger increase in average post‐test scores when compared to the online only group (p<0.0001) and the hybrid group (p<0.0001).
Conclusion: Our study demonstrated that a faculty taught high‐fidelity transfusion medicine simulation curriculum consisting of an in‐person didactic session and simulation session for second year medical students produces greater knowledge acquisition compared to an online only or hybrid curriculum. The high‐fidelity simulation curriculum is also preferred over the online only education as indicated by the Likert survey results.
A8‐A03G
Diagnostic Management Teams in Transfusion Medicine
Aaron J Wyble*, Yeon Mi Kim and Barbara J Bryant
University of Texas Medical Branch
Background/Case Studies: Diagnostic management teams (DMTs) are an innovative way to bridge the communication gap between the laboratory and clinical services thereby facilitating the delivery of improved patient care. DMTs employ a multidisciplinary approach which integrates clinical and laboratory data into succinct interpretations and recommendations. The interpretations must be of moderate to high complexity in order to be clinically valuable. Recommendations are made regarding future testing, timing of testing prior to blood component needs, and other pertinent concerns to allow for improved coordination of patient care. The timeliness of the DMT reporting is vital to patient management. The inherent design of a DMT also provides an educational opportunity for trainees at academic centers.
Study Design/Method: The transfusion medicine service at a large university‐based academic medical center implemented a DMT in 2016. All cases involving complex antibody identification workups, transfusion reactions, deviations from standard operating procedures, consultations for blood component utilization, and massive transfusion protocols from July 2016 through January 2017 were evaluated by transfusion medicine residents. The electronic medical record (EMR) of each patient was also reviewed to determine relevant clinical history. All significant findings were presented at the Transfusion Medicine DMT conferences. The DMT was comprised of physicians from Transfusion Medicine, Hematology/Oncology, Anesthesiology, Transfusion Service technical staff as well as visiting clinical staff from Surgery, Obstetrics and Gynecology, Transplant Services, and Pediatrics. The DMT integrated the clinical and laboratory data to formulate relevant interpretations and recommendations. The final DMT reports were placed into the EMR for access by health care providers. Financial benefits of a transfusion medicine DMT were also evaluated.
Results/Finding: In a 7‐month period, 504 cases of complex antibody identification workups (65%), transfusion reactions (2%), consultations for blood component utilization (6%), and deviations from standard operating procedures and massive transfusion protocols (27%) were presented at the Transfusion Medicine DMT conferences. The placement of DMT narratives in the EMR as progress notes and laboratory reports provided informative and timely communications. Residents participating in DMTs demonstrated improved clinical and laboratory correlation skills. As a result, resident competency in transfusion medicine was enhanced. Over $68,000 of revenue was generated utilizing the standard professional component CPT codes.
Conclusion: DMTs encompassing multiple aspects of transfusion medicine improved patient care through enhanced communication between laboratory and clinical services. Additional benefits of a DMT program include resident, clinician, and technical staff education and the generation of revenue for the institution.
A9‐A03G
Streamlining a Blood Center and Hospital Transfusion Service Supply‐Chain with an Informatics Vendor‐Managed Inventory Solution
Hamilton C. Tsang*1, David Lancaster2, Dianne Geary2, Robert Scott1, Anh Thu Nguyen1, Adam Garcia2, Raina Shankar1, Leslie Buchanan1 and Tho Pham2
1Stanford Health Care, 2Stanford Blood Center
Background/Case Studies: Inventory management is both a major challenge and an integral part of hospital transfusion service (HTS) and blood centers (BC) operations. The current process at our institution involves twice‐per‐day shipments from the BC to the HTS, with each shipment predicated upon current stock levels at HTS. Manually obtaining inventory levels for each product is time‐consuming. The manual determination is also error‐prone. We aim to enhance inventory management operations by developing an informatics solution to (1) streamline the ordering process to accurately reflect inventory status and transfusion practices and (2) re‐allocate valuable HTS tech time.
Study Design/Method: At our HTS, the general inventory accounts for over 50 product categories broken down by component, blood type, irradiated status, and CMV‐serology status. We therefore sought to establish an electronic method to reliably infer the general inventory level. Since the raw electronic inventory report comprised both the general inventory and physically sequestered units (e.g. special antigen units, cross‐matched units), over a 5‐month calibration period we performed linear regression between electronic and the gold‐standard manual count to impute from the electronic census the number of units of each product category in the general inventory. Once we had a reliable electronic method to determine inventory levels, we implemented a 3‐month pilot period. We analyzed various metrics pre and post pilot implementation to ensure non‐inferiority of our electronic system: (1) the ratio of units transfused per week to the number stocked (T:S), (2) the number of products ordered as STAT, and (3) the number of expired products. We created in‐house programs on Visual Basic for Applications (Microsoft, Redmond, WA) for both the calibration and pilot periods. 2486 lines of code were written for both programs, including 2 class modules and 34 distinct subroutines.
Results/Finding: During the pilot period, we investigated our system's non‐inferiority. The average weekly T:S ratio for cryoprecipitate, plasma, and RBC, respectively, were 1.03, 1.21, and 1.48 before the pilot period compared with 0.88, 1.17, and 1.40 during the pilot period. These differences did not reach statistical significance (p=0.28). We also monitored the number of stat ordered products before and during the pilot period, which were 27 and 31 stat units per week, respectively (p=0.86). Lastly, we also monitored the number of monthly wasted products due to expiration as an indicator of inventory mismanagement before and during the pilot period, which were 226 and 196 units, respectively (p = 0.28). An estimated 7 hours per week of technologist time was reallocated to other tasks once the electronic census was adopted. This translates to 0.175 FTE and $18,200 per year saved from labor costs per year if permanently adopted.
Conclusion: We created an in‐house electronic ordering system to enhance information fidelity, re‐allocate technologist time, and further standardize ordering. Our system showed non‐inferiority to the labor‐intensive manual system, by not changing the number of stat orders, having the same T:S ratio, and not increasing the number of expired products. This is achieved while freeing up over 360 hours of staff time per year. Future directions include full automation with involvement from HTS informatics department.
A10‐A03G
Transfusion Practice Improvement: Gaining Traction through the Use of a Provincial Transfusion Quality Improvement Plan
Denise Evanovitch*1, Yulia Lin2, Troy Thompson1, Allison Collins1 and Sheena Scheuermann1
1Ontario Regional Blood Coordinating Network, 2Sunnybrook Health Sciences Centre
Background/Case Studies: A provincial regional blood coordinating network (PRBCN) held a “Quality Focus Day” (QFD) in 2014 to explore transfusion quality indicators to be included in a province wide quality improvement plan (QIP). The plan's main goal is to reduce patient harm by improving transfusion practice in hospitals through the reduction of inappropriate use. The following recommendations were made:
Select a blood component that most hospitals could monitor
Display progress in a public forum so that hospitals could compare themselves to peers
Strike a province‐wide transfusion QIP committee to guide the development of the plan, supporting resources and ongoing improvement initiatives
Study Design/Method: A provincial transfusion quality improvement plan (PTQIP) committee was formed and included broad representation: the provincial patient blood management coordinators, physicians, technologists, nurses, administrators, clinicians, quality/risk managers from all regions of the province and the provincial blood advisory committee, the blood supplier and a patient. There was further collaboration with other organizations such as the provincial health quality division, Choosing Wisely Canada, the Local Health Integration Networks (LHIN), Canadian Society for Transfusion Medicine and the Healthcare Insurance Reciprocal of Canada.
Results/Findings: The PTQIP was launched in April 2016 in a toolkit format in conjunction with Choosing Wisely Canada. The toolkit contains:
A narrative template based on the provincial health quality division's model for hospitals to adapt to their own needs
Clinical practice recommendations for blood components in adult inpatients
Transfusion order set template
Choosing Wisely Canada screensaver
SOP, algorithm, and training aid for technologist prospective blood order screening
After the launch, an informal survey indicated that 74 of the province's 158 hospitals were interested or had already adopted portions of the PTQIP. To further assist hospitals in advancing their QIPs, a technologist prospective screening educational module was developed in addition to an electronic tracking tool with which hospitals can enter their baseline data and subsequent audit data and track their success. Both hospital and provincial reports can be generated from the tracking tool. A more formal survey conducted in 2017 indicated that 93% plan to implement or already have implemented the PTQIP and 43% of the respondents already have put prospective order screening by technologists in place.
Conclusion: Helping hospitals through the development of standardized templates, instructions, education and other tools for transfusion quality improvement increases the ability of hospitals to uptake quality improvement initiatives. Taking a standardized approach across the province allows for both aggregate and hospital data comparison analyses.
A11‐A03G
Challenges of Developing a Multi‐State Pre‐Hospital Transfusion Service: A Health System Perspective
Louise Helander*1, Caroline Raasch Alquist2, Jefferey Kuo3 and Donny Dumani2
1Department of Pathology, Louisiana State University Health Sciences Center, 2Department of Pathology and Laboratory Medicine, Section of Transfusion Medicine and Histocompatibility, Ochsner Health System, 3Ochsner Flight Care, Ochsner Health System
Background/Case Studies: Military and civilian trauma‐based studies have demonstrated the advantages of transfusing blood products prior to a patient's hospital arrival, a process known as Pre‐Hospital Transfusion (PHT). Helicopter emergency medical services (HEMS) worldwide have implemented this protocol with great success, despite a current lack of guidance or advisory publications. There is a need for literature that addresses the regulatory requirements and logistical challenges associated with developing a PHT program. Herein, we report our experience as a large hospital system embarking on the development of a multi‐state PHT service.
Study Design/Method: In October 2016 a work group was formed to establish PHT services for the HEMS providing care to over thirty regional hospitals. Composed of flight care staff, emergency physicians and transfusion medicine specialists, the group identified the major tasks to be addressed: Federal/State Regulations; Inventory Structure/Management; Product Storage/Testing; Tracking/Traceability; Emergency Release Protocol; and Staff Training. While there are no specific regulations governing PHT, the regulations pertaining to blood product storage, validation, and monitoring apply. The FDA, AABB, and state agencies were each consulted to ensure compliance with all directives.
Results/Finding: The largest hospital within this system, already acting as a reference site, was designated to perform all confirmatory testing on products supplied to the multi‐state HEMS. Similarly, this hospital was tasked with remote monitoring of all blood refrigerators at the helipad sites. The system's FDA licensed blood supplier was deemed responsible for product consignment and transport between the four HEMS sites. The blood inventory at each site was designed to contain: group O positive RBCs, group A low anti‐B titer liquid plasma, and four‐factor prothrombin complex concentrate. A military‐tested in‐flight medical record system will be used to transfer transfusion information to non‐affiliated hospitals as needed. Validated in‐flight coolers, protocol for product emergency release, inventory tracking system, and re‐stocking schedule were also requisite to this plan. Staff competencies regarding emergency release guidelines, transfusion reactions, and the handling/storage of products are maintained by the HEMS medical director with additional oversight provided by transfusion medicine physicians.
Conclusion: Our work group successfully identified the challenges associated with a multi‐state PHT helicopter based service, which spans blood product management, adaptation of existing transfusion procedures and operating policies, licensing requirements, and personnel training. Our PHT service will go live in 2017. Publishing this experience may benefit future sites as they launch similar PHT initiatives.
A12‐A03G
Blood Transfusion during Humanitarian Emergencies
Yetmgeta E. Abdella*1, Rana Hajjeh1 and Cees Th. Smit Sibinga2
1World Health Organization Regional Office for the Eastern Mediterranean, 2International Quality Management (IQM) Consulting
Background/Case Studies: More than 76 million people are affected by humanitarian emergencies in the Eastern Mediterranean Region of the World Health Organization (WHO), where some of the most affected countries in the world are located. In these countries, the health systems have been weakened or destroyed and health workers provide health services under difficult circumstances. Humanitarian emergencies increase the demand for blood transfusion and make its delivery challenging and complex. Despite these obvious needs, across the Region, there is a lack of information on the emergency preparedness and response capacity of blood transfusion and on the challenges countries and health responder's face in meeting the needs of the patients during emergencies.
Study Design/Method: We searched PubMed and Index Medicus for the WHO Eastern Mediterranean Region for data on availability and safety of blood transfusion in humanitarian emergencies. We conducted a structured survey of blood transfusion services (BTS) in all countries in the Region to identify the following: type of humanitarian emergencies between 2006 and 2016; current strategies to ensure availability and safety of blood transfusion during emergencies; coordination and collaboration between countries; and gaps and challenges. Additional information was collected during a regional consultation (Eastern Mediterranean Region) held in May 2016 in Tunisia.
Results/Finding: We found 24 publications on disaster from five countries in the Region and 16 publications on disaster preparedness and blood transfusion in casualties and severe trauma outside the Region. However, none dealt with the questions of availability and safety of blood transfusion during emergencies. Twelve countries (54.5%) responded to the survey. Armed conflicts and terrorism are the commonest types of emergencies with estimated 10‐85% of the injured requiring blood transfusion. Nine countries have emergency preparedness and response plans for BTS. Potential blood donors are mobilized through public calls, besides a direct appeal on regular and replacement donors. Seven of the responding countries keep an emergency blood stock. Collaboration between the different stakeholders exists in seven countries. Lack of adequate and competent human resource, transport and cold chain deficits, shortages in supply of consumables and maintenance of equipment, lack of reliable power supply, and shortage in finances are the gaps identified.
Conclusion: There is a need to integrate BTS in the overall national emergency preparedness and response, collect and disseminate updated information on factors affecting provision of blood transfusion in humanitarian emergencies, provide technical and financial assistance to affected countries, strengthen mechanisms for coordination and collaboration among different parties, and develop a regional emergency blood services system and management expertise.
Administrative Posters
Collections
AP1
A Blood Center's Experience with Blood Donation and Testosterone Replacement Therapy
Nancy L Van Buren*, Jed B Gorlin, Anita Hove, Tracy French and Janis Thoreson
Innovative Blood Resources
Background/Case Studies: Polycythemia frequently develops in individuals on testosterone replacement therapy (TRT). Given this risk factor for the development of cardiovascular disease, physicians frequently request therapeutic phlebotomy to keep the hemoglobin under 18g/dL.
Study Design/Method: We reviewed the therapeutic phlebotomy requests for donors on TRT at our blood center over a 3 year period from 2014 through 2016, as well as the total number of therapeutic phlebotomy collections.
Results/Finding: The total number of therapeutic collections during 2014, 2015, and 2016 was 475, 500, and 569, respectively. The total number of TRT collections during this same period of time was 193, 212, and 239, respectively. These numbers represented 41‐42% of the total therapeutic collections each year. The total number of TRT donors increased proportionately each year (63, 85, and 108 for 2014‐2016). The number of collections per registered TRT donor varied significantly, ranging from 0 to 12 therapeutic draws/donor per year. Excluding those that didn't present for a therapeutic blood collection, the average number of TRT collections/donor per year decreased from 3.8 to 2.8 between 2014 and 2016.
Conclusion: Our blood center has experienced an increasing number of therapeutic phlebotomies, as well as individuals on TRT referred for therapeutic phlebotomy due to elevated hemoglobin values from 2014 through 2016. It is not clear from information provided by the ordering physician whether this is intended as a temporary measure to decrease the hemoglobin while the patient is on TRT, or whether the dose was being adjusted or discontinued due to the known risk factor of cardiovascular disease in patients with polycythemia; however, the average number of donations per TRT donor decreased during this timeframe. The percentage of men on testosterone who present as regular blood donors at our blood center is not known, since this hormone is not reason for deferral. Our findings raise the concern, however, that regular phlebotomy is necessary to reduce the risk of testosterone‐associated polycythemia in this population. As it is our duty to provide a safe and adequate blood supply, our blood center also has concerns about perpetuating the misperception that repeat phlebotomy, particularly if required more frequently than 56 days, is sufficient to mitigate the risks of testosterone therapy. Hence, we have made the decision to discontinue offering phlebotomy services to this population of donors other than for those on testosterone that meetall donor eligibility requirements.
AP2
Approaches Involving the Use of a Vein Illumination Device in a Blood Donor Center
Sara Matheson*, Kimberly J Duffy, Audrey E Traun, Mary M Benike, James R Stubbs and Justin D Kreuter
Mayo Clinic
Background/Case Studies: Venipuncture is a critical step in blood collection and locating a suitable vein for this procedure can be a challenge. Unacceptable vein selection or incorrect needle placement can lead to incomplete collection or infiltration. In a blood donor center, the primary selection of a vein is done by palpation within the antecubital area. Prior to needle insertion, the skin at the site must be prepared and contact avoided until after needle is placed. Vein illuminator (VI) devices are available to aid in visual display of potentially suitable veins. Such a device was made available to staff in March of 2010. After an initial testing and instructional period, the VI has since not been used by staff. The objective of this study is to discover reasons why staff does not use the VI to identify potentially suitable veins.
Study Design/Method: A staff survey was developed and distributed to staff in March 2017 to inquire about usage of the VI and obtain feedback about the device. At the time that the survey was sent, the device had been available for several years. The survey included questions involving frequency of use, adequacy of training, comfort with using the device, knowledge of the device's storage location, willingness try the device, and general feedback.
Results/Finding: The survey had a 77% response rate (n=33). Of these, 78.8% have never or very rarely utilized the VI. Self‐reported reasons for low utilization focused on two dominant themes. First, that the device is not needed and second that it doesn't accurately show veins. 87.9% of respondents are aware of where the VI is stored and a more accessible location to share the device was not identified. Although 93.9% of respondents have been provided training on using the VI, the group was mixed regarding their comfort level in using the device independently. Only 48% of the group was willing to try VI.
Conclusion: Infiltration and incomplete collection account for approximate 3% (770 units/year) of qualified blood donors, yet VI does not appear to be a viable solution for our blood donor program. There seems to be both an opportunity and challenge with VI implementation. The opportunity is to create critical awareness of problems with vein cannulation. The challenge is to identify a device that is more effective at visualizing deeper veins necessary for blood donation.
AP3
Benefits of Converting From MCS+ To Alyx
Penny Schroeder* and Elizabeth Parker
Indiana Blood Center
Background/Case Studies: In 2015, apheresis red cells (aRC) represented 4.7 % of total red cell collections at our center. HAE MCS+ LN8150 was utilized to collect aRC. Due to the age of the instruments, challenges with collections on mobiles as well as the need to increase collection of right type products, the decision was made to change technologies.
Study Design/Method: Fresenius Kabi demonstrated the Fenwal Alyx technology as well as the business case to the primary stakeholders. All implicated departments were involved in the initial impact assessment. A multi‐department kick off meeting was held and project team formed. Due to product demands, the decision was made to validate aRC and plasma apheresis. The primary departments affected were Blood Collection and Production. Fresenius Kabi provided sample validation plans, SOPs, training and training materials for use. Four mobile‐carts were purchased for easy transportation of Alyx and quick‐connect feet for installation on mobile buses.
The Lead Trainer and the BC Technical Administrator traveled to an affiliate blood center to observe their Alyx program and identify best practices. A team of Blood Collection trainers and preceptors were the initial group trained and validation performed. This team also served as the subject matter experts and field preceptors. Fresenius Kabi returned for Advanced Alyx Operator training. The training plan targeted previous MCS+ operators first and then operators new to apheresis with a training goal of 30% of mobile staff. Validation of the 12 Alyx began 06/01/16 and took approximately 45 days to complete. During this time, Fresenius Kabi conducted Alyx education and apheresis recruitment training to all Collection and Recruitment staff. The MCS+ machines were removed from service 07/08/16. Alyx Go‐Live occurred 07/13/16. Additional operator training continued through September 2016.
Results/Finding: Due to ease of mobility and use of Alyx, reduced procedure time compared to MCS+ and donor conversion training we increase components collected.
|
MCS+: Oct 2015‐Mar 2016 Alyx: Oct 2016‐Mar 2017 |
MCS+ | Alyx |
|---|---|---|
| % Red Cells | 7.99 | 10.44 |
| Plasma procedures | 0 | 119 |
| Staff injuries from loading/unloading instrument | 2 | 0 |
Alyx disposable kit includes pre‐attached solution containers reducing ancillary items required to pack and carry to mobiles. This decreased kit cost by $19.21 each providing an estimated annual savings of $239,000.
Conclusion: With the multiple Alyx donation types we were able to increase our collection of right type procedures by approximately 2.5% and decrease our kit costs by 22%. With Alyx the collection plasma on mobile blood drives is now possible. Due to ease of use, operators have embraced this technology and we have consistently met our monthly collection goals from October 2016‐March 2017.
AP4
Changes in Minimal Hemoglobin and Interdonation Intervals; Impact on Hemoglobin Deferral
Mindy Goldman*, Qi‐Long Yi and Sheila O'Brien
Canadian Blood Services
Background/Case Studies: High frequency of donation is a risk factor for iron deficiency. Because females’ iron stores are generally lower than males’ before they start their donation career, females who donate frequently are particularly high risk. Minimum hemoglobin (Hb) has long been the same for males and females at 125g/L, but for males this falls below the normal limit. As a first step to mitigate iron deficiency, criteria for whole blood donors were modified for males (minimum Hb increased to ≥ 130g/L) and for females (minimum interdonation interval increased from 56 to 84 days). The longer interdonation interval in females was gradually implemented, starting with donor messaging in October 2016, changes in rebooking of donation appointments in December 2016 and culminating with eProgesa criteria changes on March 5, 2017. Both these changes are expected to initially result in donation loss, but may be partly counteracted by a decrease in Hb deferral rates in female donors. We aimed to assess the impact of these changes on Hb deferral rates.
Study Design/Method: Percentages of Hb deferrals were calculated as the number of donation attempts that resulted in Hb deferral divided by the number of successful donations plus Hb deferrals multiplied by 100. Percentages were calculated for male and female donors before and after changes were made.
Results/Finding: The percentage of Hb deferrals increased in male donors from 0.89% in the 3 weeks pre‐ implementation to 2.16% in the 3 weeks post‐implementation of the change in the Hb criterion. Hb deferral rates for female donors were 12.6% in September, 12.0 % in October/November, and 9.9 % from December to March, 2017.
Conclusion: Hb deferral was more frequent in male donors after the minimum Hb was increased to 130g/L. The gradual implementation of increased interdonation interval for females resulted in a reduction in deferrals, thus the initial donation loss associated with this change may be partly offset over time by decreased Hb deferrals. A longer observation period is necessary to confirm these findings and assess impact on phenotyped blood and donor retention.
AP5
Collection and Distribution of Blood Components from Healthy Donors for in Vitro Research Use over 18 Years at a Hospital‐Based Blood Center
Kamille West*, Sandra Amamoo‐Kakra, Sylvia Pomrenke, Yu Ying Yau, Susan Leitman and Cathy Conry‐Cantilena
National Institutes of Health
Background/Case Studies: Research investigators performing in vitro studies involving human blood need a reliable source of blood components, derived from screened donors to minimize the risk of potential transfusion‐transmissible infections (TTI). These resources may be difficult or costly to obtain. A protocol was developed to collect blood components for in vitro research use from healthy volunteer donors at a hospital‐based blood bank. Our objective is to describe the long‐term successful operation of the protocol.
Study Design/Method: Subjects are recruited and enrolled on an IRB‐approved protocol to donate blood and apheresis components for research. Prior to initial donation, donor eligibility is determined by a pre‐assessment, including a donor history questionnaire and TTI testing. Donor screening is performed at the time of each donation. Blood products are collected according to standard phlebotomy and apheresis techniques. Donors are compensated for their participation. Research blood components are de‐identified prior to distribution. Tracking, allocation and issue of blood components to investigators was performed with the aid an electronic database system.
Results/Finding: Over 18 years, 2059 donors enrolled in the research blood donor program; M:F ratio = 1.4:1, average age 47 years, Caucasian 56.9%, Black/African‐American 29.7%. 847 donors were active in the research program in the last 3 years, representing 14.7% of all active blood donors at this center. Donors are recruited from the community, or from the allogeneic blood donor pool after temporary or indefinite deferral. Donors with hereditary hemochromatosis contribute 41% of research whole blood donations. In the past 8 years, 59,223 blood products, derived from 10,509 procedures, were distributed to 185 different investigators in over 200 laboratories. Whole blood was the most common product (45.2%), followed by unmanipulated mononuclear cell collections (28.6%), and elutriated monocytes or lymphocytes (19.8%). Less common requests included platelets (2.5%), plasma (2.5%) and granulocytes (0.8%). Adverse donor reactions were infrequent (0.33% of procedures).
Conclusion: We report the feasibility of a program for collecting and distributing blood for investigators to obtain blood components for in vitro research use, utilizing the staff and resources of a hospital‐based blood bank. Research blood donation is essential to support laboratory research and to maintain positive relationships with donors who have been deferred from allogeneic transfusion.
AP6
Hospital‐Based Blood Donor Center's Experience with Implementing Platelet Pathogen Reduction System
Kimberly J Duffy*, Mary M Benike, James R Stubbs and Justin D Kreuter
Mayo Clinic
Background/Case Studies: The safety of platelet products has been continually improving due to testing despite the continued emergence of microbial threats. The recent FDA approval of platelet pathogen reduction technology will protect transfusion recipients regardless of the new microbial dangers. In order for platelet products to use the pathogen reduction technology, the volume, platelet yield (dose), and concentration must be collected within tight specifications. The objective of this study was to determine the optimal collection settings to enable 100% collection of pathogen reduced platelets while limiting the loss of products.
Study Design/Methods: The collection instrument evaluated for this study has FDA approval for platelets suspended in 100% plasma. The corresponding pathogen reduction system used for the study has 3 kits with 3 different collection specifications. All apheresis collections occurred at a fixed site and pre‐platelet counts were performed on a hematology analyzer. The yield scale factor has been established for correlation between the hematology analyzer and apheresis collection device. In order to determine the optimal collection targets, the apheresis collection instrument had a variety of multiple yields and volumes established for collections. Staff was instructed to collect the highest available yield per donor. After collection, volume, platelet yield, and concentration data was obtained. This data was used to determine if the product met the specifications for one of the available kits, and if the actual platelet yield was higher than 6.8 x10¹¹, thus meeting the criteria for a double product.
| Collection Instrument settings | ||||||
|---|---|---|---|---|---|---|
| Platelet Yield (x1011) | Platelet Concentration (x103/µL) | Collect volume (mL) | Total complete collections | Outside of pathogen reduction kit specifications (% of collections) | Double Products | Platelet Split Rate |
| 7.2 | 1800 | 400 | 33 | 5 (15%) | 22 | 1.5 |
| 7.0 | 1750 | 400 | 221 | 6 (3%) | 134 | 1.6 |
| 7.0 | 1867 | 375 | 2 | 1 (50%) | 0 | 0.5 |
| 6.8 | 1700 | 400 | 69 | 4 (6%) | 33 | 1.4 |
| 4.2 | 1400 | 300 | 82 | 6 (7%) | 0 | 0.9 |
| 4.0 | 1333 | 300 | 91 | 7 (8%) | 0 | 0.9 |
| 3.5 | 1167 | 300 | 7 | 2 (29%) | 0 | 0.7 |
Results/Findings: A higher platelet concentration product is ideal to produce a double product, but targeting products with a platelet concentration greater than 1800 x 103/µL was more likely to be outside the specification of the pathogen reduction kit. The platelet concentration target of 1867 x 103/µL results in discarding products and was quickly removed from instrument settings. Collections with a platelet yield as low as of 3.5 x10¹¹ and platelet concentration of 1167 x103/µL were more likely to produce a product that was not within the specification of the pathogen reduction kit.
Conclusion: The loss of both triple platelet products and lowered post‐processing platelet recovery requires the collection of platelets to be far more precise. The goal of platelet collection has shifted from simply maximizing each platelet collection to an approach that considers optimal collection within the limits of kit specifications. Final collection instrument configurations are platelet yield of 7.0 x10¹¹ and 6.8 x10¹¹ at the volume of 400 mls and platelet yield of 4.2 x10¹¹, 4.0 x10¹¹, and 3.5 x10¹¹ at the volume of 300 mls.
AP7
Moving from Subjective to Objective Donor Eligibility Screening Platforms: A Blood Center's Journey
Angela Dirr*1 and Steve Cihura2
1Bonfils Blood Center, 2BBC / BSI
Background/Case Studies: In 2012, the device used by Bonfils Blood Center to determine donor hemoglobin and donor eligibility was reaching its end of life, and BBC needed to define a path forward for a reliable replacement device.
Study Design/Method: BBC evaluated 3 devices with the following criteria in mind: 1) device disposable costs, 2) reagents/controls/quality control, 3) objective Hgb/Hct measurement, 4) portability and durability for a mobile environment, 5) ease of use, 6) donor experience, 7) battery life, 8) validation requirements plans, 9) blood center suitability, and 10) ability to link to BECS. Multiple departments including Donor Care, Equipment Management and Validation, Quality, and Regulatory Affairs were involved in the evaluation and product selection. BBC tested 50 donors per each device at both a fixed and a mobile site. BBC also considered donor feedback for the choice of replacement technology. The project started February 2013 with a targeted implementation date of July 2013. After creating necessary SOPs and adopting existing SOPs, BBC successfully completed the validation of the devices, and chose the CompoLab technology from Fresenius Kabi as the new device for BBC blood bank.
Results/Finding: The CompoLab was selected as it met project scope and selection criteria. It was important for BBC to reduce paperwork and daily tasks. The CompoLab eliminates daily QC reducing paperwork, time and improves error management.
After converting to the new technology, BBC donor deferral rates increased by approximately 15%. As a consequence to this increase, BBC conducted reminder training with BBC staff to ensure proper sampling technique and higher sample quality. Over time, BBC deferral rates stabilized to 4.59% in 2014 and 4.29% in 2015. During this time period, BBC also successfully recruited new blood donors to BBC program, which may have contributed to an increase in deferral rates. In 2016, the deferral rate increased again, probably due in part to the FDA Final Rule “Requirements for Blood and Blood Components Intended for Transfusion or for Further Manufacturing Use”, which went into effect in May 2016.
| Hct / Hgb Deferrals | 2012 | 2013 | 2014 | 2015 | 2016 |
|---|---|---|---|---|---|
| Percent of Total Draws | 3.56 | 4.22 | 4.59 | 4.29 | 4.90 |
Conclusion: During the evaluation for new equipment, BBC learned that it is critical to understand the equipment's life cycle and the effect the equipment has on all aspects of the business. After comprehensive evaluation of multiple donor eligibility screening platforms, the CompoLab device was selected at BBC facility. It met the majority of all aspects of the project scope and qualifying criteria. BBC also learned that continuous refresher training of the staff ensured optimal device performance, and how external factors such as changes to the regulatory environment may impact deferral rates.
AP8
Studies on Prediction of Vasovagal Reactions Using Laser Doppler Flowmetry on Platelet Apheresis.
Tetsu Yamamoto*1, Ayumi Araki1, Hiromi Sanyoshi1, Hiromi Kanai1, Hiroya Kikuchi2, Katsushi Tsukada2 and Kazuhide Mure2
1Hokkaido Red Cross Blood Center, 2Japanese Red Cross Hokkaido Blood Center
Background/Case Studies: Vasovagal reaction (VVR) is known to be the most common adverse reaction to blood collection, but effective measures for preventing VVR have not yet been developed. Effective timing of interventions during apheresis donations in particular should hold the key to predicting VVR, but no research has been done on the topic.
Study Design/Methods: This study investigated the potential to predict VVR from fluctuations in peripheral blood flow measured by laser Doppler flowmetry in platelet apheresis donors, a population highly likely to experience VVR. Data were collected from 354 individuals who donated platelets during the 6‐month period between February and August 2015, and data from the 30 donors who experienced VVR were analyzed. To calculate the level for issuing VVR alert, the percent decrease in blood flow (DBF) and the percent decrease in heart rate (DHR) were calculated, the time from alert to VVR was estimated for three DBF levels, and the detection performance of each alert level was calculated.
Results/Findings: Eight of the 156 men (5.1%) and 22 of the 198 women (11.1%) experienced VVR. One donor did not experience VVR during blood collection, but had a delayed reaction while resting afterward. Mean maximum DBF in the 30 donors in the VVR group was 64.7 ± 13.7%, which was significantly higher than the 25.6 ± 11.7% in the non‐VVR group. At a maximum DBF threshold of 45%, sensitivity for discriminating between VVR and non‐VVR donors was 93.3% and accuracy was 94.4%. When 45% DBF was used as the alert level, alerts were issued for 44 donors, including 25 in the VVR group. Therefore sensitivity for predicting VVR was 83.3% and specificity was 94.1%. Mean time from alert to diagnosis in the VVR group was 4.03 ± 4.35 minutes, and accuracy of the alert was 56.8%. Some of the VVR could not be predicted even the value of maximum DBF exceeded 45%. The reason was supposed to be the difference of donor susceptibility on DBF.
Conclusion: We investigated whether VVR in platelet apheresis donors can be prevented by prediction and found that it is possible to predict VVR early enough before onset to intervene by monitoring DBF in real time during blood collection using laser Doppler flowmetry. Future research must also investigate whether the incidence of VVR can actually be reduced by interventions such as adjusting extracorporeal circulation.
AP9
The Risks of Alloimmunization in Sickle Cell Patients Using C, E, K Negative Blood: Experience of a Hospital Apheresis and Transfusion Service
Grace Banez Sese*1,2, Salam Abdus3 and Shabrina Shah3
1Inova Blood Donor Services, 2Inova Fairfax Medical Campus, 3Inova Fairfax Medical Campus Transfusion Services
Background/Case Studies: Red blood cell (RBC) transfusion is often a lifesaving measure for patients with sickle cell disease (SCD). It is critical in the management of SCD complications such as splenic sequestration, stroke, priapism, iron overload and acute chest syndrome. A well‐recognized complication of chronic transfusion in SCD patients is alloimmunization to RBC antigens. To prevent alloimmunization, transfusion with RBCs negative for C, E, and K antigens has been advocated. This has led to reports of reduction in the rate of alloimmunization and a decrease in hemolytic transfusion reactions. We report a summary of our three year experience with the prophylactic transfusion of RBC units negative for C, E, K antigens for SCD patients during red blood cell exchange transfusions (RBCx).
Study Design/Method: Retrospective review of 10 SCD patients with a history of stroke, refractory sickle pain crisis and priapism was done. RBCx was performed every 4 to 8 weeks from December 2013 to March 2017. Blood bank work‐up used the MTS gel method for antibody screen and identification. Our hospital‐ based donor center proactively works with the hospital blood bank in preparing these units in a timely manner.
Results/Finding: A total of 10 patients, 3 females and 7 males, who underwent a total of 178 RBCx from October 2013 to March 2017, using an average number of 7 RBC units per RBCx. RBC units negative for C, E, and K antigens were used during RBCx for 8 patients. Two patients positive for C antigen underwent RBCx, using E and K antigen negative RBC units. Review of the antibody screen test results performed prior to each of the 178 RCE showed that no new clinically significant alloantibodies were formed after exposure to multiple RBC units.
Conclusion: Although there is no consistent standard of care in transfusion practice related to the extent of antigen matching for SCD patients, studies suggest that the standard of care for transfusion of all patients with SCD is to provide RBC negative for C, E, and K antigens. This ability to find these rare units is also affected by the characteristics of one's institution and blood supplier. It is an advantage to have a hospital based donor center to work with, as we proactively collaborate with them to provide these rare units. The approach by our institution to transfuse RBC units negative for C, E, K or any of its combination based on the SCD patients’ phenotype, showed that no new clinically significant alloantibodies were detected for the past 3 years. Possible randomized clinical trials in the future may help elucidate the significance of transfusing C, E, K negative RBC units in SCD patients to reduce or prevent alloimmunization.
AP10
Temporal Variation of Serum Immunological Indicators after Blood Donation Among 168 Blood Donors
Ru Yang*, Ming chao Yuan and Xiaohao Ke
wuhan blood center
Background/Case Studies: To investigate the temporal variations and recovery of blood immunological indicators after 400ml blood donations in healthy fixed volunteers.
Study Design/Method: Venous blood specimens of 168 healthy volunteers were collected before blood donation and after blood donation immediately, 1 day, 1 week, 4 weeks, and 12 weeks among men and 16 weeks among women. Immunoglobulin G (IgG), immunoglobulin M ( IgM) , immunoglobulin A ( IgA)and complement component 3 ( C3) , red blood cell (RBC), white blood cell count ( WBC) , hemoglobin (Hb), hematocrit (HCT), and serum iron (Fe) , were measured to monitor he dynamic changes of these biomarkers and blood quality.
Results/Finding: the level of IgG slightly decreased after blood donated immediately, IgA and C3 decreased significantly but still within their normal ranges, IgM did not change after blood donation. The level of IgA significantly decreased at 12 weeks among men and 16 weeks among women, while C3 significantly increased at the same time period. IgG, RBC, Hb, HCT and Fe started to recover 1 week after blood donated and reached their levels before blood donated within 12 weeks among men and 16 weeks among women.
Conclusion: the biomarkers mutually changed over the course of 12 weeks among men and 16 weeks among women. Donating 400ml blood will not significantly affect overall blood quality.
AP11
Utilizing Amicus Dxt Relay Data Managment Solution to Increase Platelet Split Rate and Improve Amicus Productivity
Janelle Wilhelm* and Jennifer Kaluza
Memorial Blood Centers
Background/Case Studies: With the increase in platelet demand and the opportunity to export products we set an initiative to increase the platelet products collected form our existing donor base. We also faced the challenge of managing multiple collection sites in multiple states. The decision was made to implement Amicus DXT Relay Data Management Solution to provide us insight into procedure details to make data driven decisions. Day to day variability previously dipped as low 40% split forcing reactive planning.
Study Design/Method: Incorporate DXT to strategically plan our day to day operations. DXT reports were monitored by management and with the Fresenius Kabi team for productivity by site, phlebotomist and device. Reports measured target vs actual yield, donor parameters, and procedure events to perform a donation opportunity analysis. This allowed us to adjust configuration settings when appropriate to improve the accuracy of the yield prediction. Reports by phlebotomist were utilized for training on how to optimize the donor's gift to donate an additional platelet or plasma product(s) and increase procedure success rate.
Results/Finding: The monthly DXT report analysis resulted in device configuration improvements, phlebotomist and center manager accountability, effective training, and donation optimization we increased our overall platelet split rate 15 percent and increased concurrent plasma collections by 24 percent. With utilization of the DXT reports we are able to take a proactive approach allowing us to predict product availability, with day to day variability dropping no lower than 62 percent split. Phlebotomist QNS rates were easily monitored regularly (daily, weekly monthly) resulting in a decrease in our overall QNS rate to consistently below 3 percent.
Conclusion: DXT was easy to implement, is very user friendly and will continue to help improve our platelet collection and process improvements between donor centers. DXT provides invaluable tools for the Operational Supervisors to monitor their staff and improve productivity at their multiple sites. Next step is to develop the plan for implementation of paperless documentation with DXT and Healthcare‐ID. The ability to immediately review data directly from Amicus was key in the productivity improvements realized.
Education and Training
AP12
Evaluating the Impact of a Transfusion Practice Training Program Among Registered Nurses in a Tertiary Hospital in Singapore
Zhong Xinni*, Eileen Lew and Joyce Lam Ching Mei
KK Women's & Children's Hospital
Background/Case Studies: As blood and blood products are limited and expensive resources, they are prescribed, handled, stored and transfused according to hospital guidelines established to ensure that the best practice standards are maintained for patient safety. It is a prerequisite for all Registered Nurses (RNs) involved in blood and blood product administration to possess fundamental knowledge of transfusion practice.
Aim: The aim of this study is to evaluate the impact of a hospital‐based transfusion practice training program among registered nurses, through administration of a knowledge‐based questionnaire before and after implementation of the program. The results gathered would identify gaps in assimilation of knowledge and suggest improvements to the design and implementation of specific content in the nurse‐led transfusion training programme.
Study Design/Method: All RNs from various units and departments were invited to participate in the blood transfusion knowledge questionnaire in October 2015. After which, a formal transfusion practice training programme was introduced, consisting of an online learning platform and in‐service training sessions. The same questionnaire was administered to the RNs one year later in September 2016 for post‐training programme evaluation. Individual item scores and proportion of nurses with perfect scores was compared pre‐ and post‐implementation.
Results/Finding: In 2015 and 2016, a total number 1,097 RNs and 965 RNs completed the questionnaires, giving a response rate of 78.5% and 67.4% respectively. The overall mean score in 2015 was 6.24 points (range 0 to 8). The mean score in 2016 was 6.57 points (range 2 to 8). The percentage of RNs having perfect scores of 8 increased from 8.8% in 2015 to 20.5% in 2016.
Table I below shows the results for each question item.
TABLE 1. Number of correct answers in 2015 and 2016
| Questions | 2015 (n= 1,097) | 2016 (n=965) |
|---|---|---|
| Questions | Number of correct answers, n (%) | Number of correct answers, n (%) |
| 1. Validity of a GXM sample | 871 (81%) | 750 (78.2%) |
| 2. Obtaining informed consent before an elective transfusion | 1,018 (96%) | 947 (98.1%) |
| 3. Administration of blood and blood products through a blood set with filter | 950 (89%) | 911 (94.8%) |
| 4. Priming of blood set with 0.9% Normal Saline prior | 499 (47%) | 588 (61.1%) |
| 5. Fever is an absolute contraindication for transfusion | 536 (52%) | 502 (52%) |
| 6. Obtaining baseline vital signs 1 hour prior | 693 (65%) | 701 (73.1%) |
| 7. Blood and blood products to be checked and put up within 30minutes of arrival | 989 (95%) | 938 (97.2%) |
| 8. Blood and blood products to be transfused within 4hours | 1,031 (97%) | 937 (97.2%) |
Conclusion: The implementation of a hospital‐based, nurse‐led transfusion practice training programme has led to encouraging improvement in blood transfusion knowledge amongst RNs. Further training may be needed in the preparation of blood sets and management of fever.
AP13
A Global Survey on Awareness, Accessibility and Utilization of Continuous E‐Education Programs for Clinical Use of Blood
Cees Th. Smit Sibinga*1 and Maruff Akinwale Oladejo2
1IQM Consulting, 2University of Lagos
Background/Case Studies: Clinical use of blood has shown to be the least developed part in the vein‐to‐vein transfusion chain. This global survey was therefore carried out in order to investigate the level of awareness, accessibility and utilization of e‐continuous learning and quality of blood use among blood prescribing clinicians and nurses.
Study Design/Methods: A descriptive ‘ex‐post facto’ survey design was used; 264 purposively selected blood prescribing clinicians and nurses from 60 hospitals in 13 countries of the 4 Human Development Index (HDI) groups (Low, Medium, High, and Very High) participated. Three research questions were answered, while seven null hypotheses were tested at .05 level of significance. Descriptive statistical tools (frequency counts and percentage) were used to analyze the demographic backgrounds, while inferential statistics ‐ Pearson Product‐Moment Correlation Coefficient (PPMC), Analysis of Variance (ANOVA), were used to analyse the hypotheses.
Results/Findings: Quality of clinical use of blood was positively and significantly correlated with levels of awareness (r= .137; p=.03; df=262) and accessibility (r=.184; p=.01; df=262) to e‐continuous learning among blood prescribing clinicians/nurses. There was significant difference in levels of awareness [F(3,260) = 53.942, p = .01], accessibility [F(3,260) = 38.582, p = .01], and utilization [F(3,260) = 24.858, p = .01] of e‐continuous learning among blood prescribing clinicians/nurses based on HDI grouping, particularly between Very High and Low HDI. There was significant difference in levels of accessibility [F(6,257) = 6.444, p = .01] and utilization [F(6,257) = 13.704, p = .01] of e‐continuous learning among blood prescribing clinicians based on clinical specialty/department and a significant difference in quality of clinical blood use based on clinical specialty/department [F(6,257) = 9.677, p = .01].
Conclusion: Today e‐continuous learning has become a conditio sine qua non to effective and quality clinical use of blood. The higher the HDI level the better the awareness, accessibility and utilization of continuous education, both through e‐learning and conventional programs. There is a better awareness among clinicians routinely prescribing blood as compared to others involved only incidentally in blood transfusion. Accessibility of e‐learning depends highly on the presence of a sustained societal infrastructure which is less guaranteed in the Low and Medium HDI countries; reliable power supply, maintenance of hardware tools and updated software programs, together with the necessary knowledge and skills of e‐technology are prominent factors. The results are used for policy and strategy recommendations to improve knowledge and clinical practice through continuous e‐learning programs eg, starting at undergraduate medical and nursing schools and continuing at postgraduate vocational medical specialization institutes, principles of clinical transfusion practice should be comprehensively included through appropriate and timely curricula; creation of a technical climate to guarantee access to e‐learning courses and materials; stimulation of national and international exchange of e‐learning programs focused on continuing education; creation of an e‐learning mentoring network through professional societies, associations and education institutes.
AP14
ABO Leaders: A Community of Practice for Transfusion Medicine Education
Ryan A Metcalf*1, Monica B. Pagano2, Andrea McGonigle3, Sara Bakhtary4, Morvarid Moayeri4 and Jennifer Andrews5
1Division of Transfusion Medicine, University of Washington,, 2Division of Transfusion Medicine, University of Washington, 3Johns Hopkins Hospital, 4UCSF Health, 5Stanford University, Dept of Pathology & Pediatrics
Background/Case Studies: Transfusion medicine (TM) didactic teaching materials for pathology residents are not widely available to share among residency training programs. The Advancing Blood KnOwledge (ABO) Leaders project is a novel approach wherein education materials are created collaboratively through a community of practice (CoP). Educational theorist Etienne Wenger defined CoPs as groups of people who share a concern or passion for something they do and learn how to do it better as they interact regularly.
Study Design/Method: As a pilot project, 7 junior faculty co‐investigators from 5 west coast institutions each had 2 months to create a 30 minute PowerPoint presentation on a fundamental TM topic, after which 2 other members had 2 months to review and edit. Therefore, each member created 1 and reviewed 2 presentations (three total steps). During each step, members wrote 2 multiple‐choice questions for those particular topics. In the end, each topic would have 6 quiz questions to assess learning. At completion, 7 evidence‐based, peer reviewed presentations would be available for all members to use for teaching pathology residents. Three methods were planned to measure effectiveness of these materials: 1) Pre and post‐lecture ABO Leaders exam using the questions made for each topic to assess learning; 2) Pre and post‐lecture 20 question validated examination (BEST Collaborative) to assess learning; 3) Resident In‐service examination trends specific to TM.
Results/Finding: Six presentations were developed as 6 of the 7 ABO Leaders members continue to participate in this CoP for TM education. ABO Leaders and BEST pre‐test results are shown in tables 1 and 2. ABO Leaders pre‐test data could not be obtained for institution B, and 3 trainees declined to participate in the examinations at institution A. Challenges experienced by the CoP have included heterogeneity between institutionsÕ resident schedules, balancing time dedicated to the group given busy schedules, and difficulty in giving all 6 presentations during the defined institution‐specific teaching period. Post‐test results will be included when assessments are complete.
Conclusion: Despite logistical and organizational challenges, it is feasible to create a multicenter CoP for TM education. The impact of such a group on resident learning will be assessed and plans for growth will be evaluated.
TABLE 1. ABO Leaders Pre‐Test Results By Institution
| ABO LEADERS PRE‐TEST | Institution A | Institution B | Institution C | Institution D |
|---|---|---|---|---|
| Participants (N) | 4 | NA | 4 | 8 |
| Low Score (%) | 22 | NA | 53 | 28 |
| High Score (%) | 61 | NA | 58 | 56 |
| Mean Score (%) | 43 | NA | 56 | 41 |
| Median Score (%) | 44 | NA | 57 | 37.5 |
TABLE 2. BEST Pre‐Test Results By Institution
| BEST PRE‐TEST | Institution A | Institution B | Institution C | Institution D |
|---|---|---|---|---|
| Participants (N) | 4 | 6 | 4 | 8 |
| Low Score (%) | 20 | 35 | 55 | 25 |
| High Score (%) | 70 | 80 | 85 | 65 |
| Mean Score (%) | 50 | 59 | 69 | 48 |
| Median Score (%) | 55 | 62.5 | 68 | 50 |
AP15
Dramatic Clinical Vignette As an Educational Tool in Transfusion Medicine
Rebecca Marrero Rolon, Elizabeth Crowe, Erika Hissong, Amy Patel, Lauren Mecca, Robert DeSimone, Yen‐Michael Hsu, Ruchika Goel, Melissa Cushing and Ljiljana Vladimir Vasovic*
Weill Cornell Medicine
Background/Case Studies: The traditional educational curriculum for the pathology residency program is primarily based on didactic lectures, case‐based presentations, and discussion of on‐call cases. The use of dramatic vignettes has proven to be an effective educational tool to illustrate complex and multidisciplinary topics in medicine. Our goal is to use and evaluate the relevance of this approach in resident education.
Study Design/Method: A clinical vignette based on a placenta accreta case was written by a pathology resident during the transfusion medicine rotation. During a two‐week laboratory management course, residents prepared for the dramatic vignette performance with a focus on transfusion medicine and laboratory management topics. Each resident completed a 10 question pre‐ and post‐test on topics related to the vignette. Several meetings for review and adaptation of the script, topic discussion, and rehearsals were held. There were several commonly encountered problems and deviations from the standard operating procedures that the residents in the audience were asked to identify prior to the performance. During the skit, each resident presented at least one major transfusion management teaching point.
Results/Finding: The educational activity, including the 40 minute vignette performance and the 20 minute discussion, was completed with a focus on: communication between the operating room and the blood bank during surgery, maximum surgical blood order schedule, pre‐transfusion testing, transfusion safety, informed consent, massive transfusion protocol, emergency release blood products, thromboelastometry interpretation, patient safety, adverse events, and root cause analysis. All performers significantly improved their scores in the post‐test (mean 95 + 4%) when compared to the pre‐test scores (mean 67 + 26%) ttest p<0.017. During the vignette discussion, residents together identified all the intended non‐conformances and answered related questions. Residents in the audience actively participated in the post skit discussion and 90% reported a satisfactory learning experience.
Conclusion: Dramatic clinical vignettes can illustrate multidisciplinary complex interactions that are of pivotal importance in the daily activities and professional development of pathology residents. With specific structured goals, clinical dramatic vignettes can be used as a complementary educational tool to illustrate challenging topics in an integrative way that is enjoyable and easy to understand and remember. The skit performers benefit from the activity further by preparing and extensively studying the topics to deliver a multifaceted and coherent presentation with emphasis on the integral role of the laboratory and transfusion medicine in patient care.
AP16
Education and Training Program for Hospital Customers in Finland
Hannele Sareneva*, Susanna Sainio, Inna Sareneva, Tiia Kivipuro and Taru Jaske
Finnish Red Cross Blood Service
Background/Case Studies: The Finnish Red Cross Blood Service (FRCBS) is the nationwide blood service provider in Finland, responsible for collection, testing, processing and distribution of blood products to all hospitals and health care providers. The FRCBS serves as the National Blood Group Reference Laboratory and provides a wide range of other laboratory services e.g. tests for hemostasis and tissue typing for possible donors as well as patients waiting for organ or stem cell transplantation. FRCBS also performs antenatal blood group and RBC antibody tests covering whole country. As a sole national operator we are providing educational services to ensure the safe use of blood products as well as accurate use of our laboratory services.
Study Design/Methods: We have performed customer surveys to healthcare professionals to assemble the needs for education. Based on these results and continuous feedback FRCBS provides hospital customers in blood banks and clinics the following additional services:
* regular education
* e‐learning application of transfusion medicine
* Handbook for Blood Products on the web site
* reports to hospitals for their use of blood products
* annual national blood safety reports
Regular elements of our educational program are the practical, problem solving course for blood bank personal and safe transfusion training day for clinicians.
For every education we collect numerical feedback as following: “How did the education responded Your expectations” and “Can You utilize the knowledge in practice”. We also inquire “How likely You would recommend the training for Your colleges” indicating net promoter score (NPS).
Results/Findings: More than 350 healthcare professionals participate training days at FRCBS annually. In addition our experts give tens of lectures at hospitals across Finland. Feedback from educations has been very good, varying between 8.3 to 9.4 (in the range of 4‐10). NPS varies between 83 and 98.
According to customer surveys FRCBS provides appropriate education to healthcare professionals. This score has increased 2011‐2016 from 8.4 to9.0.
Conclusion: Feedback, NPS scores and surveys ensure that education and training program of FRCBS responses to customer needs. Hospitals can utilize annual courses of FRCBS in their own initiation programs. Together with clinical contact persons in hospitals our aim is to ensure Patient Blood Management (PBM) and to optimize use of blood products. We also have plans to increase e‐learning applications and the courses of transfusion medicine for nurses and medical students.
AP17
Educational Outreach and Effect on Reporting Septic Transfusion Reactions
Kathleen M Grima*1, Anne Eder2, Beth A. Dy1 and Mary O'Neill1
1American Red Cross, 2Georgetown University
Background/Case Studies: Hemovigilance programs to monitor adverse events after transfusion depend on clinicians’ ability to recognize and report reactions to the blood center. About 1in 100,000 apheresis platelet donations are implicated in septic transfusion reactions (STRs), but this could underestimate the risk because of the difficulty in recognizing delayed or mild reactions. A large blood center designed an educational outreach program to increase awareness of STRs and assessed its effect on the rate of STR reporting to its national hemovigilance program.
Study Design/Method: In Dec. 2015, a large blood center developed a web based course on STRs for CME/CEU credit. Letters were sent to 2,300 hospital customers about recognizing and reporting STRs, and alerting them to the availability of the course. Blood center physicians and staff in sales and marketing also engaged hospital customers directly in discussions about recognizing and reporting STRs, using the online educational content. The physicians tracked their interactions. The blood center's national hemovigilance program compared the number of STRs reported in the 12 months before and after launching the educational outreach.
Results/Finding: The web based course was completed by more than 700 participants; 117 were physicians. Based on a review of the evaluations, the course was highly valued with 93% of participants rating it excellent or very good. The blood center physicians gave over 200 presentations to hospital customers. Reporting of suspected STRs in 2016 increased by 23% compared to the prior year. The increased reporting came from 2 specific regions. The total number of STRs that met the hemovigilance definitions for definite (culture‐confirmed) and probable STRs in the nationwide system increased but did not change significantly compared to the previous years.
| Surveillance Year | Number of STRs reported | Definite or Probable STRs, (number of Aph Plts) |
|---|---|---|
| 2015 | 100 | 8 (6) |
| 2016 | 124 | 12 (10) |
Conclusion: The educational initiative was designed to deliver a consistent message on the risks, recognition and reporting of STRs. While the number of reports of suspected STRs in two regions increased, there was no meaningful change in the overall reporting of suspected or confirmed STRs across the national blood system. This finding could reflect that hospitals already recognize and report medically significant reactions or that the target audience was laboratory personnel and physicians in transfusion medicine, but not the clinicians closest to patient care at the bedside. More targeted educational efforts provided by personnel who interface with hospitals could be used to address identified professional practice gaps in transfusion medicine.
AP18
Implementation of Subscription‐Based cGMP e‐Learning
Laurie McGraw*, Courtney Saphier, Helene Belton, Sallie Bittner and Ward Scott
Gulf Coast Regional Blood Center
Background/Case Studies: Previous cGMP e‐learning courses we developed required 30‐45 minutes for learners to complete. While feedback was positive, manufacturing areas struggled to schedule time for staff to complete courses within their assigned schedules. At the same time, a shift in design trends suggest that subscription‐based learning is more effective (Thalheimer, 2014.) Subscription‐based e‐learning utilizes 5‐7 minute modules, delivered at regular intervals. This changes the learning process from a singular event to a regular interaction that reinforces learning and keeps the content at the top of the learner's mind.
Study Design/Method: We began developing cGMP subscription‐based e‐learning in 2016 by selecting our first five series topics: Equipment, Personnel, Labeling, SOPs, and Records. The first topic, Equipment, was divided into modules on Selection, Validation, Calibration, Quality Control, and Maintenance. These modules, and pre‐ and post‐quizzes for the Equipment series, were developed and assigned to employees in manufacturing‐related jobs using our learning management system.
The pre‐quiz was assigned to employees in June 2016, with a new Equipment module assigned each month for the following five months. The series concluded in December 2016 with the post‐quiz.
Results/Finding: Using surveys, assessments and incident reports, we evaluated the training effectiveness using three of the four Kirkpatrick levels.
Level 1: Reaction
While our previous cGMP courses received good ratings from learners, the Equipment series received the highest rating of 3.5 on a 4‐point scale. Of employees who completed all versions of our cGMP courses, the majority preferred the Equipment series over all previous courses combined. Comments clearly demonstrated that learners preferred the short, subscription format over the previous courses with 21 positive and 1 negative comment.
Level 2: Learning
The average score of users increased 13% from the pre‐test to the post‐test, with the greatest improvements noted in the scores from laboratory employees. A two‐sample t‐Test determined the result to be statistically significant with a t‐Critical value of 1.647 and a t‐Stat value of 5.641.
Level 4: Results
While equipment‐related errors decreased by 20% after training, there is not enough data to demonstrate a statistical significance.
Conclusion: Our Level 1 and 2 evaluation data validated that the subscription approach was effective. Knowledge increased from the pre‐ to post‐quiz, learners reported that they appreciated the shorter training, and they completed the modules without special scheduling requirements. As a result, we are continuing development of the remaining series.
AP19
Interprofessional Blood Conference: Assessment By Collaborative Practice Competencies
Julie Sobolewski*, Justin D Kreuter, Kristin Volbrecht and Fazi Amirahmadi
Mayo Clinic
Background/Case Studies: The interdisciplinary nature of transfusion medicine requires the collaboration of multiple work units for efficient patient care, but departmental “silos” impede collaboration between transfusion‐related care teams. We hypothesized that regular educational meetings would improve knowledge and awareness of each department's role, so in October 2013, a multidisciplinary educational meeting called Friday Blood Conference (FBC) began as a collaborative, interprofessional forum involving frontline staff of our transfusion practice. During these monthly meetings, which are also broadcast online for those unable to attend in person, presenters from different work units share background information and patient cases before opening the floor to constructive discussion.
Study Design/Method: A survey was sent to FBC participants (n=151) to retrospectively capture the effect of FBC on interdepartmental collaboration. The survey was structured to obtain formative feedback using the published Interprofessional Collaborative Practice Competencies (ICPC) as a guide. These core competencies target maintaining a climate of mutual respect, communicating within and between departments, fostering teamwork, and understanding everyone's role in patient care.
Results/Finding: Our survey response rate was 35%. Of those, 96% endorse that FBC creates a climate of respect within our transfusion practice, 94% believe it has improved communication between work units, and 98% feel that FBC leads to increased understanding of interdepartmental processes. Notably, laboratory scientists and transfusion nurses have the highest attendance rate. Furthermore, those attending via the online broadcast report the lowest satisfaction, with only 56% responding positively. The main reasons individuals attend FBC are to increase knowledge about transfusion medicine, interact with and learn from other departments, hear about patient case studies, and understand the “big picture” of one's role in patient care. Suggestions for improvement include preparing questions to help initiate discussion, increasing representation of other areas for broader perspectives during interdepartmental dialogue, and posting recordings of FBC for later viewing.
Conclusion: The application of ICPC in transfusion medicine was an effective lens to assess the value of interprofessional collaboration. Although there is room for improvement, the results support that FBC has contributed to better communication between transfusion‐related care teams and has increased understanding of interdepartmental processes within our transfusion practice.
AP20
Novel Approach to Curriculum Development: Demystifying Transfusion Medicine
Ritcha Saxena* and Ananya Saxena
All Saints University School of Medicine
Background/Case Studies: Transfusion medicine is an essential element of education required for the future physicians in various disciplines like surgery, internal medicine and anesthesiologists to work effectively with the blood bank personnel. Transfusion carries considerable advantages as well as risks. Consequently, educational initiatives are required to identify the particular knowledge deficits in transfusion medicine and subsequently, bridge the gaps. And the challenge is to update the undergraduate medical curriculum to reflect the latest enhancements in transfusion medicine.
Study Design/Methods: 41 students of undergraduate Semester 3 and 59 students of Semester 4 participated in the study. Self‐directed learning resources combined with modules of interactive instruction were implemented in a TBL course design. Five education modules focusing on quality management, blood collection, transfusion reactions, precise utilization of blood products and innovations in component safety were designed for the students. The students’ reaction to TBL in Transfusion Medicine was evaluated using qualitative and quantitative assessment tools to analyze knowledge attainment and critical thinking development along with team continuity. The participants were first assessed with Readiness Assurance Testing (RAT) to guarantee that they understood the concepts and their application followed by case study based test questions.
Results/Findings: Students’ reaction to TBL was primarily positive, with 86% of students giving a positive feedback. Evaluation through Readiness Assurance Testing (RAT) illustrated improved team knowledge acquisition in implementation of effective quality management systems over knowledge acquired through individual study. Students grasped a conceptual knowledge of principles of transfusion medicine and achieved confidence in dealing with transfusion‐related complications. Anecdotally, students significantly attained perception in blood component preparation, storage and their optimal utilization along with developments in safety techniques in blood donation.
Conclusion: Our study suggests that reforming the medical curricula for undergraduate medical students, with specific educational modules designed to focus on blood banking and blood transfusion principles and latest advances in transfusion medicine, is much required in the interest of patient care and safety, by the future physicians. TBL is an interesting and efficient way to deliver the key aspects of transfusion medicine to the students.
AP21
Open Doors, Open Minds: Blood Bank Open Houses Welcome the Hospital Community
Julie Katz Karp* and Joy Gould
Thomas Jefferson University Hospital
Background/Case Studies: Despite interacting with countless hospital employees and departments, the Blood Bank (BB) is, by nature, a closed‐door facility. The presence of an irradiator, and the requisite associated security measures, can make the BB an even more unwelcoming place. In an attempt to make the hospital community more familiar with the BB and Transfusion Medicine, the hospital community was welcomed during a series of BB open houses.
Study Design/Method: BB open houses were advertised on the hospital intranet webpage. Blood donors at the hospital blood donor center were invited via email to all BB open houses. The surgery and anesthesia departments were invited via email to the second and third BB open houses. Clinical laboratory staff were invited via email to all BB open houses, with the third BB open house occurring in conjunction with Medical Laboratory Professionals Week.
Results/Finding: Open house attendees were given tours of the BB, led by a BB attending, BB residents, BB supervisor, or BB Quality Coordinator. The Patient Blood Management nurse was also in attendance to answer attendee questions and educate about Patient Blood Management. Light refreshments were offered to the attendees in the BB break room. The first BB open house was held on Wednesday, 12/7/16 from 9‐11am. There were 17 attendees, including a second‐year medical student, four regular blood donors at the hospital blood donor center (who were also employees in Facilities Management and the University Office of Admissions, respectively), a hospital senior vice‐president, six apheresis nurses, two clinical laboratory staff, two medical laboratory science students, and one additional staff member from the University Office of Admissions. The second BB open house was held on Thursday, 4/20/17 from 7‐11am. There were 14 attendees, including 2 regular blood donors (who were also employees in the Office of International Affairs and Supply Chain, respectively), a hematology/oncology fellow, and 11 surgical residents. The third BB open house was held on Thursday, 4/27/17 from 7‐11am. There were 15 attendees, including 8 regular blood donors (who were also employees in Risk Management, Wound Care, University Administration, Cancer Center Clinical Research/Clinical Trials, Performance Improvement, and Electronic Medical Records, respectively), 2 additional wound care nurses, a technologist from Microbiology/Immunology, two additional individuals from Clinical Research/Clinical Trials, and two minor children participating in Take Your Child to Work Day.
Conclusion: BB open houses allowed individuals from different departments and backgrounds to familiarize themselves with the BB and Transfusion Medicine. BB open houses can facilitate collaboration and foster relationships with other hospital departments and improve understanding about what goes on behind the closed doors of the BB.
AP22
Phamcalcs: Validation of a Web‐Based Application for the Calculation of Parameters Related to Simple, Partial, and Exchange Transfusions
Elizabeth M Staley*1, Tim Kennell1, Sabrina Macksoud1, Lawrence Albert Williams III1, Seung Park2 and Huy P. Pham1
1University of Alabama Birmingham, 2Community Health Systems
Background/Case Studies: Simple, partial, and exchange transfusions are routinely performed in patients with sickle‐cell disease (SCD) with the goal to increase the oxygen carrying capacity of the blood and reduce the relative percentage of sickled cells. It is essential for clinicians to be able to rapidly estimate the effects of the available therapeutic modalities using clinical information to minimize the risk of red blood cell exposure. Given that the formulas for these calculations are complicated, we developed and validated an online calculator to assist physicians with such tasks.
Study Design/Method: A web application was generated (http://www.Phamcalcs.com). The performance of the simple transfusion and partial manual exchange calculators were validated by comparing the predictions to clinical data. The performance of the automated and depletion RBCx calculators was validated using the Terumo BCT (Lakewood, CO) calculator up to a fraction cells remaining (FCR) ≤50% as patients with FCR ≤50% may benefit from delaying the procedure for performance in the future. Validation process included (1) a Deming regression to globally assess the predicted vs. actual results and (2) an individual comparison wherein validation was contingent on the (predicted‐expected results)/(expected results) demonstrating |Δ|≤15%. Validation was performed for hematocrit (Hct) and hemoglobin S (HgbS) level post‐transfusion for simple and partial manual exchange and volume of replacement fluid for automated and depletion RBC exchange.
Results/Finding: See Table 1 for validation results.
Conclusion: http://Phamcalcs.com allows the performance of complicated calculations from any wifi accessible location. The formulas have been rigorously validated. The formulas for automated and depletion RBCx perform well, having a |Δ|≤15% when compared to expected results. The Deming regression detected a small degree of bias in both the volume of red blood cells calculated for the automated exchange and the replacement for depletion RBCx. However, deviations were minute (<10mL/unit). The formulas for partial and simple transfusion demonstrated no detectable bias via Deming regression. However, not all of the results were validated to have |Δ|≤15% from anticipated results. The calculations slightly underestimate the post therapeutic Hct and HgbS. Potential sources of error include variability in the Hct of transfused units inaccurate patient weight parameters.

AP23
Simulation Education As an Effective Technology for Creation of Target Competencies to Implement Patient Blood Management into the Routine Practice
Alexander Igorevich Kostin*1, Yury Ivanovich Logvinov1, Andrey Yulievich Bulanov2 and Ekaterina Morzhikova1
1Moscow Health Municipal Clinical Hospital named after S.P. Botkin, 252 Moscow Health Municipal Clinical Hospital
Background/Case Studies: With the focus on new technologies the modern medicine requires more expenses. Despite the increase in the target impact on patients there is still a risk of adverse reactions to medical treatment. The issues that are currently under discussion: the use of standardized or personalized approach, for doctors – being multidisciplinary or having a narrow specialization, integration of new technologies, the need for more trainings resulted from knowledge deficiency. In Russia, the development of insurance medicine creates the demand for more intensive and cost‐effective treatment programs. As a multidisciplinary approach, PBM optimizes the transfusion practice reducing the risk of adverse effects and improving the financial performance of a health care institution. However, the prosperous implementation of PBM also requires supplemental medical competencies that provide harmonization of dialogue logistics: administrator – clinician – transfusiologist.
Study Design/Method: At the Medical Simulation Centre of hospital there has been a unique opportunity to launch an educational program for the medical specialists practicing blood components transfusion. The main innovative features of the training course are an interdisciplinary approach, intensive learning performance, comprehensiveness of learning methods. During 2 days (18 academic hours) the trainees can attend 6 lectures, discuss the methodical materials, participate in 3 seminars, 2 interactive clinical discussions, a Master Class and a game that presents the modelling of working processes. Since initiating the project in June, 2016 with the group capacity of up to 35 people the number of medical specialists who have attended the training is nearly 450.
Results/Finding: The medical competencies gained:
knowledge of modern recommendations on the use of blood components
the ability to interpretall parameters of the haemogram, coagulogram and tromboelastogram
the ability to unveil the indications and contraindications for urgent and scheduled blood component transfusion
personalization of the blood transfusion risks
using a personalized approach on selecting the type and the dosing of transfusion habitat
predicting the efficacy of transfusion
the correction of anemia and hemostasis system malfunctions using the medicinal treatment
performing the macroscopic assessment of blood component before the transfusion procedure
performing the differentiated diagnostics and ability to prescribe the adverse effect treatment
ability to carry out the auditorial check of health cards
Conclusion: The launch of the program “Guidance for safe and effective blood use in adult patients of multi‐field hospitals” is aimed to meet the educational and professional needs of medical specialists, develop the algorithmic thinking and a range of useful motivations in case of Patient Blood Management and reach the Compliance in practice.
AP24
The Effect of Emergent Situation Drills on Technologist Teamwork and Comfort Levels
Abigail Neils*, RaeAnne Stensgard, Rebecca Wren, Elisabeth Greer, Amy Mata and Camille van Buskirk
Mayo Clinic Rochester
Background/Case Studies: Teamwork and composure are essential for technologists when dealing with emergent situations in a large hospital‐based blood bank where multiple situations can occur simultaneously. In an effort to reduce errors and improve emergency response, a group was formed to evaluate the effectiveness of emergency situation drills (ESD). The ESD were based on common emergent situations encountered in the lab and were run once per month per shift. The main goal of ESD was to improve teamwork and comfort level during real emergent situations; therefore reducing the amount of unplanned standard operating procedure (SOP) deviations.
Study Design/Method: Prior to ESD implementation, a survey was sent to all technologists to determine baseline comfort levels associated with various emergent situations. One year post ESD implementation the same survey was sent to all technologists to reassess the comfort levels for the same situations. The surveys asked employees to rate satisfaction and comfort level on a grading scale of 1‐100; 1 being least satisfied/comfortable and 100 being most satisfied/comfortable. The pre and post survey results were evaluated by calculating lab average comfort levels per situation and survey. In addition, unplanned SOP deviations related to emergent situations were counted for one year before and one year after ESD implementation.
Results/Findings: Out of 35 total technologists, 31 technologists took the pre ESD survey and 25 technologists took the one year post ESD implementation survey. Table 1 shows the lab averages from the pre and post surveys as well as the percent difference. Out of the employees who responded to the post survey, 19 (76.0%) answered “true” to the statement “ESD have improved my comfort level with emergent situations.” In the year prior to ESD implementation there were 14 unplanned SOP deviations; in the year after ESD implementation there were only 5 deviations.
TABLE 1. Averages of ESD Survey Results for Lab Staff Comfort Levels
| Pre‐EDS* | Post‐EDS* | Percentage Difference | |
|---|---|---|---|
| Teamwork Satisfaction | 73 | 81 | 10.4% |
| Multiple/Mass Casualties | 65 | 70 | 7.4% |
| Stat Blood Orders | 90 | 93 | 3.3% |
| Massive Blood Transfusion | 89 | 90 | 1.1% |
| Code/Uncrossmatched | 87 | 87 | 0.0% |
Survey results based on a grading scale of 1‐100. With 1 being least satisfied and 100 being most satisfied.
Conclusion: All but one area increased in comfort level post ESD implementation. Also most technologists agreed that the ESD helped improve their overall comfort level with emergent situations. The goal of implementing ESD has been met based on the unplanned SOP deviation decrease and technologist satisfaction increase; therefore ESD were deemed effective. Monthly ESD will continue to be run with the hope of continual improvement in teamwork, comfort levels and deviation levels.
AP25
Therapeutic Red Blood Cell Exchange: Explaining the Big Picture to Little Patients
Louise Helander*1, Kathleen Clark2 and Caroline Raasch Alquist3
1Department of Pathology, Louisiana State University Health Sciences Center, 2Child Life Specialist, Ochsner Health System, 3Department of Pathology and Laboratory Medicine, Section of Transfusion Medicine and Histocompatibility, Ochsner Health System
Background/Case Studies: Category I indications for red blood cell exchange (RBC exchange) in children with sickle cell disease include following acute stroke and for stroke prophylaxis, as well as for iron overload prevention. As described in the first installment of this series about therapeutic plasma exchange (TPE), the challenges of access, volume management, and instrumentation persist, as along with the need to address the psychological and emotional well being of this population. RBC exchange is a complicated procedure to explain to adults and becomes an even more intimidating task when translating into the language of childhood. Nevertheless, pre‐treatment education is shown to decrease the anxiety associated with medical care. Providing age appropriate specific treatment information to pediatric patients decreases negative behaviors, reduces stress and promotes faster recovery. A previous project explaining TPE to the pediatric population revealed the lack of age specific literature for apheresis procedures in general, including TPE and RBC exchange.
Study Design/Method: In collaboration with a Child Life Specialist, an age‐appropriate story‐driven explanation of the RBC exchange procedure was adapted from a previously implemented project related to TPE. Artwork was produced with the aid of a medical illustrator to complement the story‐line.
Results/Finding: The story board addresses why RBC exchange is performed, the steps involved in preparing for and performing the procedure, and strategies for coping before, during and after the procedure. The idea of long‐term therapy is also briefly addressed, to prepare these children for the concept of ongoing therapy. The booklet is in production in concert with our hospital's medical illustrator and will be available on our hospital website for patient use.
Conclusion: Using the previously illustrated story as a guide, an explanation of red cell exchange was created to provide education and reduce anxiety. This second installment continues the pediatric series helping to explain apheresis procedures to pediatric populations in the hopes of reducing patient stress and promoting age appropriate coping strategies.
AP26
Transfusion Safety Officer Resource Manual
Leonor De Biasio*
Ontario Regional Blood Coordinating Network (ORBCoN), Sunnybrook Health Sciences Centre
Background/Case Studies: The report from the Royal Commission of Inquiry on the Blood System in Canada was released in November 26, 1997; as a result, the role of a Transfusion Safety Officer (TSO) was established to enhance the safety and quality of blood transfusions in Canada. The TSO's fundamental role is to improve patient safety in all aspects of transfusion practice. This position comes with several responsibilities that encompass the following areas: technical and clinical, utilization management, quality and risk, professional and educational, and research. A guide to assist a healthcare professional's transition into the role of a TSO is advantageous; however, there are limited resources to date.
Study Design/Methods: In 2013, the clinical project coordinator‐transfusion safety nurse from a provincial blood coordinating network visited various large healthcare institutions. Information was collected through observations and discussions with the TSOs about the daily activities and responsibilities. The TSOs from each institution identified that there was minimal guidance and limited resources to assist with their transition into the role. Each acknowledged that TSOs might come from diverse backgrounds in healthcare, which could contribute to limitations in the understanding of clinical or technical terminology and gaps in communication. Experienced TSOs from six large provincial healthcare institutions were closely involved in the development of this resource.
Results/Findings: The resource manual delivers detailed information regarding the roles and responsibilities of a TSO, and the expected time commitments for each. The resource provides information on the following:
TSO Job Description
Abbreviations & Glossary of Terms
Committees and Organizations
Useful Links
Investigation and Reporting of Transfusion Reactions
Recalls/Withdrawals
Product Administration Guidelines (monographs)
Equipment used for infusion of blood
Conclusion: The resource manual was developed as a reference guide for Medical Laboratory Technologists, Registered Nurses and other healthcare professionals appointed to the TSO role. It is also intended to be utilized by hospitals that do not have a formal TSO position but which have delegated the responsibilities to other staff. The resource provides helpful information to assist with education in transfusion safety, adverse event investigation and reporting, product administration guidelines or monographs, and links to information about the equipment used for infusion of blood. The resource manual will serve as a useful reference tool to assist with a healthcare professional's transition into the TSO role.
AP27
Turning on Pathogen Reduction: A Case of Flipping the Switch
Kassandra Poffenberger*, Darla Wendt, Jennifer Vrieze and James R Stubbs
Mayo Clinic
Background/Case Studies: A critical aspect of implementing a new method in manufacturing blood products is to develop a training plan that adequately prepares staff but doesn't interfere with production or cause delays in patient care. With the implementation of Pathogen Reduction Technology (PRT) using INTERCEPT® Blood System for Platelets it was understood that we would need more collections to make up for the loss of products, specifically our triple collections. Our institution collects the majority of its blood products and supplements inventory from a major blood collection center. It was crucial for the Component Laboratory to maintain daily processing levels while learning the new method in order to sustain optimal platelet inventory levels without relying on purchasing additional platelets from external vendors. Our approach in introducing PRT for apheresis platelets was to “flip the switch” and process all products with the new method rather than a step wise roll out with a dual inventory.
Study Design/Method: It was essential to prioritize who would be trained first. Collections occur Monday through Friday from 0600 to 1600. The first group to be trained was those who would be performing training (a two person team) and product validation; they were trained by Cerus deployment team. The second group was those who would process platelets on weekends and evening hours without direct management support. The last group was the technologists who would be working during normal hours with direct management support. PRT processing for platelets in 100% plasma is broken up in to two days. On Day 0 platelets are treated with amotosalen and placed in a Compound Adsorption Device to remove residual amotosalen for 12‐24 hours. On Day 1 products are removed from the CAD and modified into final product codes and labeled. Each technologist was trained one on one, over a one week period. The trainers alternated training processing days for Day 0 and Day 1. In the weeks following training it was important that each technologist rotated back thru PRT processing to maintain proficiency.
Results/Finding: 13 of 18 employees were trained in a two month time period. Prior to “flipping the switch” the daily average of products collected was 21. For the two month training period the daily average rose to 23.
Conclusion: Our “flip the switch” training plan for implementing PRT platelets in 100% plasma has been highly successful for our laboratory; training while implementing the new technology did not create a bottle‐neck in the process. It was imperative to prioritize who would be trained first to insure complete coverage during off hour shifts. Technologists were able to become proficient with the new process while maintaining daily processing expectations and sustaining an optimal platelet inventory.
AP28
Using Drills to Improve Transfusion Service Response Time in Massive Transfusion
Sarah Young1, Michael Bridges1, Meshell Johnson1,2 and Elizabeth St. Lezin*1,2
1San Francisco Veterans Affairs HCS, 2Univ of Calif San Francisco
Background/Case Studies: Massive Transfusion Protocols (MTP) have been implemented widely for indications other than trauma. Rapid and consistent response by Transfusion Service (TS) staff to MTP orders is essential. We used a combination of simulations involving ICU and TS staff and simple TS‐only drills to improve MTP training effectiveness and improve TS response to MTP activation.
Study Design/Method: All TS staff were trained on the MTP SOP and checklist prior to the study period. Mock code simulations that incorporated an MTP scenario were performed with ICU nurses and physicians. TS‐only drills consisted of generating an MTP order on a test patient. All TS technologists participated in at least one drill. Technologists were aware of the general timeframe of a planned drill, but not the actual start time. Simulated units were prepared by photocopying actual in‐date products. Order and issue times were recorded as part of the real and drill procedures. Uncrossmatched RBC and other products (6RBC/4FFP/1 PLT) were issued manually. For ICU simulations, photocopies of units were delivered by pneumatic tube. Time in minutes was measured between initiation of the MTP order and issue of first RBC unit, first unit plasma, and platelet. Goal times were <10 min for RBC and PLT and <30 min for FFP. Deviations from SOP were identified and staff coached as part of debriefing.
Results/Finding: TS with and without ICU staff conducted 5 drills/simulations and measured performance in 14 actual MTPs between Jan and Dec 2016 (total 19 MTP). In Q1 (baseline), the TS met goal time to issue product in 80% of MTP activations or drills for RBC, 29% for FFP and 38% for PLT. In Q4 (follow up), the TS met goal issue time in 100% of activations for RBC and FFP and 75% of the time for PLT. For RBC, median time between order receipt and issue improved from 6 (range 1‐46) min at baseline to 2 (range 1‐5) min at follow up. Median issue time for PLT improved from 14 (4‐51) min at baseline to 9 (2‐18) min at follow up. Median time to issue for FFP did not change from baseline to follow up, but the range in issue times was smaller: median issue time 29 min at baseline (range 13‐46 min) and 29 min at follow up (range 20‐30 min).
TABLE 1. % of MTP Activations Meeting Goal for Order to Issue Time by Product Type
| Baseline MTP | Follow Up MTP | |||
|---|---|---|---|---|
| % MTP Activations Meeting Goal | % MTP Activations Meeting Goal | |||
| Product | Q1 | Q2 | Q3 | Q4 |
| N=8 | N=4 | N=2 | N=5 | |
| RBC | 80% | 75% | 100% | 100% |
| FFP | 29% | 100% | 100% | 100% |
| PLT | 38% | 66% | 100% | 75% |
Conclusion: An audit of TS MTP performance (time of activation to issue of first product) showed improvement was needed. ICU simulations and TS‐only MTP drills improved TS response time for RBC and PLT issue and improved consistency of performance in MTP situations. Improvement in FFP issue time may not be possible unless a policy to maintain thawed plasma for MTP is implemented. Simple MTP drills can be incorporated into TS training and competency assessment.
AP29
When Medicine Meets Religion: Preparing for the Bloodless Needs of the Jehovah's Witness Patient
Kael Vaun Mikesell*, Darcy Dore and Leon Binette
Eastern Maine Medical Center
Background/Case Studies: Over 8 million Jehovah's Witnesses (JW) are present throughout the world with nearly 1.2 million residing within the United States. Due to their beliefs, these patients abstain from receiving major blood fractions (MABF), while minor blood fractions (MIBF) may be accepted depending on each individual's conscience. Due to these unique medical challenges, it is important for caretakers to have an understanding of their beliefs in order to provide optimal care. We describe the process of identifying JW in our hospital and communicating treatment needs to staff.
Study Design/Methods: Proper treatment of JW requires the ability to identify the patient and his/her needs. When a JW is admitted to our hospital, our electronic medical record (EMR) triggers several processes based on the patient's listed religion. One process creates an order that reminds caretakers to complete the Declining Blood Consent (DBC) with the patient. The DBC contains language declining MABF and reviews the MIBF with the patient to identify any that would be accepted. The EMR order regarding the DBC provides educational links that include a bloodless policy, step‐by‐step instructions on obtaining the DBC, and information on alternatives to transfusion.
A second EMR process triggers a stop‐gate to prevent the completion of any MABF order or MIBF order for a product that the patient has declined. A third enrolls patients in the Minimal Blood Volume Labs Protocol which uses microtainers, partial‐fill vacutainers, and blood reservoir sets to reduce blood loss during draws.
Additionally, at Registration, a Bloodless Packet is added to the patient's paper chart. This Packet contains the DBC, a glossary of DBC terms, a bloodless sign to be placed over the patient's bed, a bloodless wristband to be worn by the patient, and two bloodless chart stickers that are added to the outside of the chart. These steps remind the caretakers of the patient's special requests.
Finally, the Patient Blood Management (PBM) Department receives EMR developed reports which identify JW presenting to the hospital. These patients are followed by the PBM nurses and medical director during the duration of care. Treatment plans to optimize hemoglobin, oxygen carrying capacity, and hemostasis are discussed with the bedside caretakers and implemented as needed.
Results/Findings: Nearly 100% of JW that enter our hospital have a DBC completed. This has resulted in increased education of the medical staff. In addition, patients have reported better communication with caretakers leading to a more inviting environment for the patients.
Conclusion: Our hospital has found success by using an education‐based team‐oriented approach involving EMR, PBM, and caretakers when caring for the JW patient. This approach has set up a foundation for treating other bloodless medicine patients.
Management, Finance, and General Marketing
AP30
Activity‐Based Costing Concepts As Supply Control Tool in an Adverse Economic Scenario in a Mid‐Size Transfusion Service
José Roberto Luzzi*, Rafael Calil Luzzi, Elizabeth Irochi Marchezi, Daniel Bassetto Jesuino and Roberta Araújo Navarro‐Xavier
Hospital Samaritano Blood Bank and Transfusion Service
Background/Case Studies: Transfusion services should provide safe blood components from vein to vein with donors acting as suppliers and patients as final customers. This process involves labor‐intensive activities, critical materials, human resources, facilities and highly coordinated processes. Cost management has a great impact on technical processes guiding decisions upon supplies and technical staff. Activity‐based costing (ABC) is a method to determine cost drivers within activities and determine process or product final cost allowing managers to take precise decisions. We demonstrate how an effective ABC approach can result in financial savings without compromising process quality in a mid‐size transfusion service.
Study Design/Method: Materials costs can represent as far as 90% of an activity. In 2015 we had a central storage supplying satellite storages at each department and replacement was done independent of residual stock. Purchases were performed on demand. At the end of 2015 we performed a supply inventory on all departments to plan future purchases and control residual stocks. In 2016, we implemented annual purchases and satellite storages were supplied only to replenish programmed stock. Cost drivers were defined upon activities on standard operational procedures (SOPs) resulting in a 2016 cost estimate. Technical staff was involved in cost driver calculations to indicate possible changes to SOPs, supplier and deliveries. To minimize seasonal fluctuations we compared last quarter 2015 (Q4/15) with last quarter 2016 (Q4/16). In this work we present activity data from blood collections to illustrate ABC method.
Results/Finding: In Q4/15 1756 blood bags were used compared to 1998 in Q4/16, demonstrating an activity ↑13.78%. Price negotiation resulted in 12.58% readjustment. Both indicated an estimated cost ↑28.10% with a possible impact of over US$ 35,000. We have identified a real cost ↓2.31% in Q4/16, representing an overall ↓14.89% and US$ 3,716.72 (R$12,235.16) savings.
Conclusion: Economy had deteriorated in our country in 2016 with higher inflation and exchange rate variations, directly impacting imported materials, most of them critical. Even with adverse economy, ABC showed to be an effective tool that allowed cost decrease without significant changes in critical materials and processes. Cost drivers calculations demanded review of SOPs and suppliers by technical staff resulting in optimization of activities. Also, staff involvement reduced discharged materials since costs were well‐known to area supervisors and satellite stocks were reviewed briefly.
AP31
Automated Verification of Immunohematology Results and the Impact to Donor Testing
Barbara J Bachman*1, Candace Williams1, Carmen Meyer2, Paul Lamonby1, Anne Cleverley1 and Silke Milbradt‐Pohan1
1Bio‐Rad Laboratories, 2Diamed Gmbh
Title: Automated Verification of Immunohematology Results and the Impact to Donor Testing
Background/Case Studies: Staffing challenges in today's blood banks require instrumentation with minimal operator intervention. Technology advances have developed where every immunohematology result does not necessarily require operator visual review. This study evaluates the impact of automated result verification on the Bio‐Rad IH‐1000™ Immunohematology System through the IH‐Com™ Data Management System (DMS) for donor processing laboratories.
Study Design/Method: A multi‐center study was performed on donor samples as shown in Table A evaluating two of the most commonly used IH‐System Gel Cards available in the US. Workflow data was analyzed using Process Modellar APP (iPad). This study focused on post‐analytical steps of result verification, evaluating with and without automated result verification to determine the impact on quality (# operator touchpoints, visual result review occurrence), result accuracy, and speed (time from result interpretation to LIS data transfer). Operator touchpoints during the post‐analytical phase are only required when doing visual result verification and are software defined. Speed metrics were analyzed using Minitab v17, statistical significance was accessed using the paired t‐test, p values of <0.05 considered significant.
Results/Finding: Using automatic result verification option, only 0.65% out of 4,320 samples evaluated for ABO/Rh testing would require visual verification by the operator. This would result in a 98.8% reduction in operator touchpoints during the post‐analytical test phase (p < 0.001) and a labor saving of 292 minutes (4:51 hh:mm) for ABO/Rh testing. For 3,037 pooled antibody screens (ABS), automated verification of results would result in 98.7% reduction in operator touchpoints during the post‐analytical test phase (p < 0.001) and a labor savings of 135 minutes (2:14 hh:mm). No ABO/Rh or ABS misinterpretations occurred when the results were automatically verified.
TABLE A. AP31
| Scenario 1: All samples require visual result verification | Scenario 2: Exception* samples only require visual result verification | ||||||||
|---|---|---|---|---|---|---|---|---|---|
| Assay | IH‐Gel Card | N= | Total Operator Touchpoints | AVG Touchpoints/sample | Total Time (hh:mm) | n= | Total Operator Touchpoints | AVG Touchpoints/sample |
Total Time (hh:mm) |
| ABO/Rh | IH‐Card ABD(DVI+)+Rev.A1,B | 4,320 | 8,696 | 2 | 5:02 | 28 (0.65%) | 112 | 0.026 | 0:11 |
| Pooled Antibody Screen | IH‐Card AHG Anti‐IgG | 3,037 | 6,094 | 2 | 2:16 | 10 (0.33%) | 40 | 0.013 | 0:02 |
Exception results are antigen typing results <2+,?, mixed field, overall NTD due to Forward/Reverse mismatch or positive control.
Conclusion: This study demonstrated that the auto‐verification option in the IH‐Com DMS with the IH‐1000 resulted in a significant reduction in the amount of operator time and touchpoints for routine pooled ABS and ABO/Rh testing with no impact to accuracy of results in a donor environment.
AP32
Evaluation of the Impact of Advancements of New Automation on Future Challenges
Tony S. Casina*
Ortho Clinical Diagnostics
Background/Case Studies: The ongoing challenges of recruiting qualified medical technologists into transfusion medicine often stretches the capacity of the transfusion service (TSV) to meet the patient care needs expected by clinicians. Automation in the TSV has had positive impact to counterbalance these challenges. Previous generations of automated instruments have had some impact on alleviating a certain amount of the workload labor intensity. This study evaluates the potential impact of a newer instrument ORTHO VISION®(VS) compared with a current state instrument Immucor ECHO™(EC). The only automated testing done currently is the Type & Screen (TS), averaging about 60‐70 TS's per day. STAT TS may or may not be automated depending on instrument status. All other testing profiles are completed manually in tube.
Study Design/Method: The study was conducted in 2 phases using a current state (CS)/future state (FS) approach. Direct observation of processes employing timing studies was used to compare workflows utilizing the 2 instruments. Evaluation consistency was achieved through using at least 3 observations of each process and results averaged. The metrics evaluated were for cycle timing (CT) (mins:secs) of manual labor/ instrument time, turnaround time (TAT) and consumable waste.
Results/Finding: The CS timing for tests follows: TS‐EC (33:06), manual STAT TS (22:08), AbID (34:55), patient ABO/RH (3:46), neonatal Type (2:58), Cord Blood (CB)(14:00) and Titration (TT) 85:00. The majority of measured time for manual tests was in labor and vigilance (time that requires the technologist presence and attention). The waste generated by the EC equated to 40% of all solid phase strips tested. To avoid waste, holding of samples to process was observed in some cases resulting longer TAT. Often STAT TS were directed to the manual workbench to avoid these issues. For the FS (VS) and automated processing of TS, ABO/RH, AbID, CB, and TT, the laboratory achieved improvement in labor time and improved CT. The CT was for TS (31:06), AbID (33:00), patient ABO/RH (13:00), CB (17:00), and TT (35:00). The total TAT for TS was often shorter for VS as samples were held for EC testing to avoid waste. The average STAT TS on VS resulted in an improvement of 7% in TAT and 9% in STAT TAT compliance respectively. Automating AbID testing provided an 82% labor improvement with 29 minutes of walkaway time over the manual AbID allowing for focus on other critical TSV activities. Automating CB and TT delivers an additional 96% and 80% labor reduction. Overall, 75 labor hours were recovered moving to the FS.
Conclusion: Based on gains in labor reduction delivered by VISION, the TSV has modified the CS workflow process utilized with the ECHO system, to deliver improvements in TAT and adequate staff in times of resource challenges
AP33
Experiencing the Birth of Twins: Simultaneous Move of a Hospital and Implementation of a New EHR System
Michele DeRee*1, Lisa Martini1 and Chris Gresens2
1Sutter Health, 2BloodSource
Background/Case Studies: California's seismic laws recently necessitated building a new hospital to replace one of two existing facilities which no longer met current earthquake standards. In August 2015 the outdated facility merged onto the site of the other hospital, forming a single, larger campus. A new electronic health record (eHR) system was activated on the same day because the new campus was not designed to maintain and store paper records. Preparation for bridging cultures between the two separate facilities, training staff for a new work environment and using the new eHR began in 2014. This study examines the impact on the transfusion services as staff prepared for the various workflow changes associated with implementation of the new eHR and integration of patient workflows at a new location.
Study Design/Method: In order to ensure an effective transition and implementation the transfusion services developed a training module tailored to the use of the new blood ordering module (BOM) within the eHR. The BOM requires a 2‐part order: one for testing/product, the other for the transfusion order. This represents a new workflow for affected nurses and physicians. The transfusion team collaborated with multiple user groups to educate them regarding the new processes. A gap analysis was performed to determine the optimal delivery process for blood products, with key stakeholders invited to review the options. The use of the pneumatic tube system to deliver blood throughout the entire campus was investigated to determine whether it would be a viable option given the expanded size of the new campus.
Results/Finding: User groups requested additional training sessions as questions arose regarding use of the eHR for blood ordering. Because the pneumatic tube system would be heavily used, and due to concerns that blood products could become “lost”, it was decided this would not be the best route for delivery of blood. Department educators requested support to create job aids specific to workflow changes impacting their departments, such as how to order Rh immune globulin, a cord blood workup, etc.
Conclusion: Leadership was challenged to provide a stable and positive environment during a complex set of changes. The simultaneous hospital move/merger and implementation of a new eHR constituted an arduous task that would not have been possible had substantial preparations not been initiated a year in advance. Training is essential to the success for a scope of change this big and should not be minimized. While training was thorough prior to the move, gaps were nonetheless discovered following the move.
AP34
Impacts of Development Parteners Support and Government Commitment Towards Establishing Sustainable and Safe Blood Supply System in Ethiopia
Abraham Zewoldie*
National Blood Bank Service
Background/Case Studies: Millions of lives saved each year through blood transfusions globally. However, in most developing countries including Ethiopia people still die due to inadequate supply of blood and its product. Since year 2004 the government of USA grant called CDC Blood safety project were the sole development partner organization supporting BTS in Ethiopia. Assessing the impact of partners support and government commitment level towards establishing sustainable and safe blood service program will have major inputs for continuity of health care delivery in Ethiopia
Study Design/Methods: A retrospective analysis on US government CDC Blood safety grant awards in the project periods of 2004‐09 and 2010‐2016 and review on Ethiopian government GMS, national blood donor database records covering 2005‐2015 and review on new blood service strategy implementation status was also made, so as to understand the impact of the grant and government commitment level.
Results/Findings: Grant project periods covering 2004‐09 and 2010‐2016 analysis reveals that the first project period was found challenged by government underutilization, poor GMS and delayed grant budget release. The review on the second project period highlights that grant level increased from 500 USD up to 3500 USD per annum following good performance and proper fund utilization rate of the government. The review on new strategy implementation status indicates that the increased government commitment level initiated by developing new strategy in 2005 and full reversion of the blood service administration from Red Cross society to the government health care system made in 2013. Funding agent support focusing on government new strategy implementations and its identified impacts on national blood service are establishment of nationally coordinated BTS and independent government budgeted institution with initial year budgetallocation of 4.5 million USD in 2015, construction of 21 new standard non Hospital based blood bank centers furnished with standard equipment and trained man power, procurement of 46 new mini collection van enabled to increase mobile blood collection teams from 2 to 31, mobile sites from 27 to 3200, number of Hospital utilizing safe blood from 45in 2012 to 314in 2015 and year round awareness creation effort. The total annual blood donation trend analysis also shows increasing from 25004in 2004, 54693 in 2012 to 142345 donation in 2015 with increased proportion of voluntary donation 23 %, 28% and 97.4% respectively.
Conclusion: strategic development partners funding and support based on newly developed government strategy on Blood service with commitment of the government has brought a positive impact in establishing sustainable and safe national blood service program in Ethiopia. Even though the identified positive impacts mentioned are achieved, the BTS remains with multiple challenges and needs continuity of funding and more partner support and government commitment.
AP35
Pilot Implementation of a Comprehensive Hybrid Performance Management System at National Blood Service Zimbabwe
Blessing Mukwada*, Judith J Parirewa and Tonderai Mapako
National Blood Service Zimbabwe
Background/Case Studies: The National Blood Service Zimbabwe (NBSZ) introduced its first Performance Management System (PMS) in 2006. In the 2015‐2018 NBSZ strategic plan it was noted that the current PMS lacked objectivitety and there was no relationship between perfomance and remuneration. In order to revise the PMS, the NBSZ set up a three membered committee at the Executive Management level to spearhead the revamp of the NBSZ PMS. The aim of the new PMS was to achieve a shared vision of the purpose and objectives of the organization, helping each staff member to understand and recognize the contribution to the strategic plan. In this paper, we share how NBSZ revamped and implemented its new hybrid PMS that derived its inputs from established PMSs and NBSZ monitoring and evaluation (M&E) process that have been linked together. One‐selected departmental results for one quarter are shared to demonstrate how the system works.
Study Design/Method: PMS Committee developed and shared with Executive Management a PMS conceptual and implementation framework. Consultations including field visits were done on three established PMS to assess suitability for NBSZ adoption. A hybrid PMS was adopted for NBSZ and a pilot application for one quarter on selected department was done. Review of policy, procedures to including hybrid PMS templates and forms were done. PMS Committee trained all staff on how to implement an integrated scorecard, how to conduct appraisal, how to develop scorecards, how to measure performance using the new PMS, how weighted performance reward systems based on all layers of performance for bonus payments works using standardised tools. Throughout the process risk assessment were done.
Results/Finding: The NBSZ Hybrid PMS is based on five levels of planning namely Strategic, departmental, branch, sectional and individual. The four‐coloured traffic light reporting system is central in uniformly assessing performance at all levels. The levels of accountability were properly defined for each level of planning. A weighted overall integrated individual scorecard (IIS) is determined based on 60% individual and 40% for the other four levels (10% for each). The bonus (%) is calculated based on the IIS as follows; Category A: 100% (IIS >=75%), Category B: 75% (IIS: 50 ‐ <75%), Category C: 50% (IIS: 25‐<50%) and Category D: 0% (IIS < 25%). On the pilot implementation, the individual scores for 12 staff ranged from 71% to 100%. The IIS were 76% to 81%. The number of staff in each bonus categories were 11, 92% (Category A) and 1, 8% (Category B).
Conclusion: The new hybrid PMS was generally accepted by all staff and it was easily implemented at various staff levels. This provides a basis for the full implementation of the new PMS and this simplified PMS can be easily be adapted in similar settings to ensure all staff contribute sufficiently and objectively to the realisation of the organisation strategic vision.
AP36
Rare Donor Engagement with American Rare Donor Program (ARDP)
Margaret C Manigly*1, Deborah R Fludd1 and Sandra J Nance2
1American Rare Donor Program and American Red Cross, 2American Red Cross and American Rare Donor Program
Background/Case Studies: Rare donors are defined as a blood type occurring in less than 1in 1000 people in a given population. These donors are discovered by testing new donors in a random or targeted way and require testing many donors to find one rare donor. Once found, if the facility is a member of the American Rare Donor Program (by being an AABB Accredited or American Red Cross accredited IRL), the donor is registered in the ARDP database as a rare donor. In 2016, there were 65,801 active rare donors in the ARDP. With the mobility of the population in the USA, it is important that as donors relocate, that they are recognized as a rare donor when they donate and their unit can be identified and used for a patient with a rare blood need. In addition, when recruitment is needed for a patient need, correct contact information on the donor is required.
Study Design/Method: The ARDP procedure for ARDP members requires that donors be contacted every six months to ensure that ARDP (or the facility) has their latest contact information. The timing is determined by the postal service time limit of six months to forward mail to a new address. This contact ensures that if recruitment is required to obtain blood for a patient with a rare blood need, the donor can be contacted by the collecting center to donate. This contact is achieved by ARDP sending a contact card by postal mail twice yearly to all donors for whom the ARDP has address demographics.
Results/Finding: The ARDP reports on the information obtained from the contact cards returned in the ARDP Annual Activity Report to the ARDP Members at the AABB Annual meeting. Of the 6398 (9.7% of total active donors) returned contact cards alerting ARDP of changes in calendar year 2016, 355 (5.5%) were donors moving from one ARDP facility to another, 1369 (21.4%) were donors no longer eligible to donate, and an additional 4324 (68.4%) were address changes. Other changes were 115 (1.8%) reactivated donors and 235 (3.5%) donors who we were notified were deceased, or did not want to be listed in the ARDP. In 2016, 5390 new rare donors were submitted to ARDP for registration. The number of donors that could potentially be lost to follow‐up in 2016 was 4709 (355 + 4324), which would be 87.4% of the new donors submitted.
Conclusion: With nearly a 10% response rate for donors receiving the mailed contact cards, it is clear that rare donors (and their families) are responsive to the ARDP contact card, and inform ARDP of address changes and changes in their health status that affects their ability to donate. This is evidence of the importance of the card in ensuring correct donor contact information. In 2016, 4709 donors changed their addresses which often are not known to the collecting facility until the donors donates again, after their move. The ARDP contact card is effective in retaining the relationship with the ARDP registered donors and keeps the address information of rare donors current.
AP37
Workflow Comparison of Two Gel Analyzers in a Large Transfusion Service
J Peter Pelletier*1, Barbara J Bachman2, Mike Leamy2, Susan Olson2 and Candace Williams2
1University of Florida College of Medicine, 2Bio‐Rad Laboratories
Background/Case Studies: Vendor‐assisted workflow studies are becoming more popular as analyzer choices and capabilities vary in the market. The purpose of this study was to evaluate the ProVue (Ortho Clinical Diagnostics) against the IH‐1000 (Bio‐Rad Laboratories, Inc.) in a large volume transfusion service using LEAN process flow.
Study Design/Method: Twenty‐two (22) runs of one to six (6) samples per run were observed for two Ortho ProVues alternating testing at a large Transfusion Service performing 153,000 Types, Screens, Type & Screens (T&S) annually. The workflow patterns observed were then repeated on the IH‐1000 and compared. Each process was mapped in detail by direct observation using Process Modellar APP (iPAD). The evaluation started at sample centrifugation completion and ended with results sent from analyzer to LIS (Lab Information System). Each was evaluated for quality (testing process steps, biohazardous exposure episodes, and maintenance tasks), speed (operator/analyzer time) and cost (testing/maintenance personnel hours recaptured). Time studies were analyzed using Minitab v17, and statistical significance was assessed using the paired t‐test, with p values of <0.05 considered significant.
Results/Finding: Detailed process steps, biohazardous exposure episodes, and published analyzer maintenance tasks were evaluated/compared (Table, Part A). Time studies focused on operator testing time, analyzer time, and operator maintenance time (Table, Part B).
Regardless of quality or speed metrics evaluated, the IH‐1000 demonstrated a significant reduction (improvement) in process steps and associated times when compared against the Ortho ProVue (p < 0.001). IH‐1000 process steps and time studies addressed in the table below did not account for the IH‐1000 reagent storage capacity. In reality, the improvements would be greater than what was displayed here in a real‐life operation.
Evaluating the total number of maintenance tasks required annually, as well as the times associated with maintenance performance, there was a significant reduction on the IH‐1000 (77% reduction, a difference of 43 hours/year).
Conclusion: This study verified the IH‐1000 provided significant efficiencies and cost avoidance over the Ortho ProVue for a large volume Transfusion Service.
TABLE 1. Results
| Part A: Quality Metrics | ProVue | IH‐1000 | % Change IH‐1000 vs. ProVue |
|---|---|---|---|
| Process Steps/Test Run | 82 | 47 | 43% |
| Biohazardous Exposure Episodes | 13 | 6 | 54% |
| Annual Maintenance Tasks | 2869 | 208 | 93% |
| Part B: Speed Metrics | |||
| Operator Testing Time/Test Run | 14 min | 1 min | 93% |
| Analyzer Testing Time/Test Run | 38 min | 30 min | 21% |
| Annual Operator Maintenance Time | 56 hrs | 13 hrs | 77% |
AP38
Workflow Comparison of Two High Volume, High Throughput Analyzers
Aaron Samson*1, Kimberly Monnin1, Barbara J Bachman2, Kyla Warren2, Susan Olson2 and Candace Williams2
1Clinical Pathology Labs, 2Bio‐Rad Laboratories
Background/Case Studies: Few workflow studies have been performed on high volume, high throughput blood bank analyzers in large volume testing facilities. The purpose of this study was to evaluate the Galileo® Neo (Immucor) against the IH‐1000™ (Bio‐Rad Laboratories, Inc.) using LEAN process flow.
Study Design/Method: A total of 12 separate test runs of 72 or 144 samples per run were observed over a three day period on the Galileo Neo at a reference laboratory annually performing approximately 211,500 Type & Screens (T&S). The workflow patterns observed were then repeated on the IH‐1000 and compared. Each process was mapped in detail by direct observation using Process Modellar APP (iPAD). The evaluation started at sample centrifugation completion and drop‐off in testing area and ended with results sent from analyzer to LIS (Lab Information System). Each was evaluated for quality (process steps, biohazardous exposure), speed (operator/analyzer time) and cost (testing/maintenance personnel hours recaptured). Time studies were analyzed using Minitab v17, and statistical significance was assessed using the paired t‐test, with p values of <0.05 considered significant.
Results/Finding: Detailed process steps, biohazardous exposures, and published analyzer maintenance tasks were evaluated/compared (Table, Part A). Time studies focused on operator time, analyzer time, and maintenance time (Table, Part B). Regardless of quality or speed metrics evaluated, the IH‐1000 demonstrated significant reduction (improvement) in process steps and associated times when compared against the Galileo Neo (p < 0.001). Evaluating the total number of maintenance tasks required annually, as well as the times associated with maintenance performance and downtime, was a significantly reduced on the IH‐1000 (difference of 120 hours/year).
Conclusion: This study verified the IH‐1000 provided significant efficiencies and cost avoidance over the Galileo Neo for high volume/high throughput testing facilities.
TABLE 1. Results
| Part A: Quality Metrics | Galileo Neo | IH‐1000 | % Change with IH‐1000 vs. Galileo Neo |
|---|---|---|---|
| Process Steps/Test Run | 191 | 55 | 71% |
| Biohazardous Exposure Risk | 50 | 20 | 60% |
| Annual Maintenance Tasks | 1934 | 208 | 89% |
| Part B: Speed Metrics | |||
| Operator Testing Time | 99 min | 82 min | 17% |
| Analyzer Testing Time | 127 min | 57 min | 55% |
| Operator Maintenance Time | 133 hrs | 13 hrs | 90% |
| Total Downtime for Maintenance/Year | 245 hrs | 56 hrs | 77% |
AP39
Workflow Impact of Automated Result Verification for Patient and Donor Blood Typing
Barbara J Bachman*1, Candace Williams1, Carmen Meyer2, Paul Lamonby1, Anne Cleverley1 and Silke Milbradt‐Pohan1
1Bio‐Rad Laboratories, 2Diamed Gmbh
Background/Case Studies: Immunohematology facilities face many challenges including standardization, process control, productivity, staffing and patient safety. To alleviate these challenges, the IH‐1000™ instrument and complementary IH‐Com™ Data Management System (DMS) were designed to provide lean automation to enhance blood testing facility workflow. The purpose of this study was to focus on the lean functionality of automated result verification on the IH‐1000 and IH‐Com DMS and determine its impact on workflow.
Study Design/Methods: Internal and external studies using the IH‐1000 with the IH‐Com DMS were performed with patient and donor samples. Assays included ABO/Rh blood grouping and antibody screening (ABS) as shown in Table A. Workflow data was analyzed using Process Modellar APP (iPad). The evaluation focused on post‐analytical steps of result verification, evaluating with and without automated result verification to determine the impact on quality (operator touchpoints, visual result review occurrence, result accuracy), and speed (time from result interpretation to LIS data transfer). Operator touchpoints during the post‐analytical phase are only required when doing visual result verification and are software defined. Speed metrics were analyzed using Minitab v17. Statistical significance was assessed using the paired t‐test, with p values of <0.05 considered significant.
TABLE A. AP39
| Scenario 1: All samples require visual result verification | Scenario 2: Exception* samples only require visual result verification | |||||||
|---|---|---|---|---|---|---|---|---|
| Assay | N= | Total Operator Touchpoints | AVG Touchpoints/sample | Total Time (hh:mm) | n= | Total Operator Touchpoints | AVG Touchpoints/sample | Total Time (hh:mm) |
| ABO/Rh (Forward & Reverse | 6,339 | 12,560 | 2 | 7:24 | 59 (0.93%) | 236 | 0.04 | 0:23 |
| ABS | 8,750 | 17,686 | 2 | 6:32 | 93 (1.06%) | 372 | 0.04 | 0:14 |
Exception results are antigen typing results <2+,?, mixed field, overall NTD due to Forward/Reverse mismatch or positive control.
Results/Findings: Using automated result verification, only 0.93% out of 6,339 samples evaluated for ABO/Rh testing would require visual verification, resulting in a 98% reduction in operator touchpoints (p < 0.001) and a labor saving of 444 minutes (7:01 hh:mm) for ABO/Rh testing. For 8,750 antibody screens, automatic validation of results would result in 99.5% reduction in operator touchpoints (p < 0.001) and a labor savings of 378 minutes (6:18 hh:mm). No false positive or false negative typing results or false negative screenings occurred with results auto‐verification.
Conclusion: This study demonstrated that lean operation and workflow improvements are achieved with the IH‐1000 and IH‐Com DMS when the auto‐verification feature is employed. This option resulted in a significant reduction in operator touchpoints and operator time with no risk to patient safety.
Product Manufacturing, Inventory Management, Storage and Distribution
AP40
A Blood Center Generated Survey on O Negative Red Cell Usage Increased Awareness and Decreased Net Sales
Jennifer Curnes, Michael Feierstein, Sue Johnson and Kathleen Puca*
BloodCenter of Wisconsin
Background/Case Studies: Demand for O Rh(D) Negative (O Neg) red blood cells (RBC) has remained, and in fact is proportionally increasing while blood usage has notably declined in the era of patient blood management. Over the past 2 years a steady increase in demand for O Neg RBC compared to other blood types has been observed at our blood center. Utilization metrics for hospital customers are monitored monthly for overall trending and forecasting and the data shared with them during regular visits. Despite heightening awareness, percent O Neg RBC sales continued to rise by 1% annually and peaked at 16% in mid 2016. To better understand this increased demand a survey was conducted to gather insight for improved utilization. We speculated that during the survey an observer effect, or change in the staff behavior, would result in reduction of O Neg RBC sales.
Study Design/Methods: A tie tag was designed as a survey tool and attached to each O Neg RBC distributed to hospital customers for an 8‐week period in late 2016. Hospital transfusion service staff were asked to record the final disposition of the O Neg RBC (transfused, wasted, returned) on the tie tag. Information on the survey objective and instructions for tie tag completion were communicated via customer meetings, emails and reminders sent by blood center drivers. Completed tags were returned to the blood center. Customers are allowed to return RBC units with greater than 10 day shelf life remaining. Units with tie tags attached were in hospital inventories for up to 3 months due to the shelf life of RBC. Return rates and percent of net sales (gross sales minus returns) by ABO/Rh type were tracked monthly before, during and after the survey.
Results/Findings: Participation was 100% of the 56 hospitals surveyed. Mean percent O Neg RBC gross sales for a 3 month period before, during, and after the survey was 16.6%, 16.0% and 16.5%, respectively. Mean percent O Neg net sales during the 3‐month survey fell to 13.5% compared to an average of 15.4% in the 3 months prior. During the 3‐month survey period O Neg RBC monthly return rate increased to an average of 28.4% compared to an average of 23.0% in the 3 months prior. For the 3 months after the survey the average O Neg RBC return rate further increased to 28.9% while mean percent O Neg RBC net sales trended slightly upward to 14.1%. When customer hospitals were queried whether any process changes occurred, no major changes to policy or inventory levels were reported.
Conclusion: During and after the survey percent O Neg RBC gross sales was fairly constant indicating that target inventory levels and transfusion service staff ordering practices remained unchanged. However, during the same period the increase in O Neg RBC return rate and corresponding decline in percent net sales suggests improved O Neg RBC utilization. Increased awareness from participating in the survey and staff knowing they were being observed likely played a role in the lowering of percent O Neg RBC net sales. Tracking of monthly metrics will provide ongoing review to determine if the effect is transient or sustained and identify other opportunities for improving O Neg RBC utilization.
AP41
Acoustophoretic Separation of Platelets from Whole Blood: A Relevant and Practical Alternative to Centrifugation
Pierre Bohec*1, Jeremie Gachelin1, Veronique Ollivier2, Thibaut Mutin1, Xavier Telot1, Benoit Ho Tin Noe2 and Sandra Sanfilippo1
1Aenitis Technologies, 2Hôpital Bichat, INSERM U1148
Background/Case Studies: Shear‐induced platelet activation is an unwanted side effect of the centrifugation‐based procedure currently used in blood banks to prepare platelet concentrates. Transfusion of partly activated platelets could indeed increase the risk of adverse transfusion reactions.
Aims: Here we evaluated the effectiveness of an innovative acoustic‐based fractionation device by carrying out a qualitative and functional in vivo analysis of isolated human platelets.
Study Design/Method: Whole blood was obtained from 14 donors and fractionated using an acoustic‐based device. Platelet recovery and purity were determined by quantifying blood cell subpopulations in the microchannel outlet samples. Quality of isolated platelets was evaluated using the surface expression of two activation markers (P‐selectin, PAC1) using flow cytometric methods while their procoagulant ability was investigated using in vivo experimentation. Platelets isolated using a soft‐spin protocol, were used as inactivated control.
Results/Finding: Fractionation using the acoustic‐based device led to a red blood cell clearance ratio from whole blood greater than 80 % (p< 0.001) and a purity of platelets close to 91.0 %. We did not find any difference in terms of quality and functionality of platelets from the same donors isolated using the acoustic device versus the soft‐spin protocol.
Conclusion: This acoustic‐based blood processing method led to excellent preservation of platelet quality and functionality providing a novel promising technique for whole blood fractionation in clinical settings.
AP42
Automation in Blood Bank Processing: Where We Go?
Robert Fernandez, Lluis Puig, Pilar Ortiz, Joan Ovejo, Nuria Martinez, Elena Valdivia and Susana G Gomez*
Banc de Sang i Teixits
Background/Case Studies: Nowadays, blood banking is requiring new strategies to manufacture blood components, due to the increase on their production. At Banc de Sang I Teixits (BST), we have implemented during the last years automation manufacturing, including lean management methods, to be able to process our needs of over 250.000 blood donations for an area with more than 7 million people.
Study Design/Method: The automation of blood donations process, BST has done different changes on the equipment. In 2005, Orbisac (Terumo BCT) was the equipment to obtain buffy coats and from this product, we got platelets concentrates. It was in 2007, when we moved from this equipment to Atreus 2C (Terumo BCT), to get red blood cells, buffy coat and fresh frozen plasma. Then we did some updated on Atreus; in 2011 we changed to Atreus 3C (Terumo BCT) and finally in 2013, we moved to Reveos system (Terumo BCT). Since the changes in 2007, our blood components were red cell concentrate, plasma, platelets and a leukocyte residue.
While all these changes in processing equipment, we added also some automation in our registration (donation ID, weight and temperature) and labeling steps, implementing two homemade robots.
And finally, to get better results and more efficacy in our production, in 2009, BST incorporated an engineer to introduce lean manufacturing methods. These methods are based on the identification and analysis of problems, and then chose all these activates that add some value to the procedure.
Results/Finding: Once all these changes have been updated, we have evaluated the quality of blood components, such as red cells and platelets, also the number of donations that we were missing and working hours that were necessary to process our blood donations. This evaluation was done for processes during 2008 and 2016.
| 2008 | 2016 | |
|---|---|---|
| No. blood donations (x103) | 287 | 253 |
| Hemoglobin (g) | 52.2 | 56.0 |
| Platelet average/pool |
2.5x10¹¹ (with 5 units) |
3.1x10¹¹ (with 4 units) |
| Plasma volume (ml) | 267 | 267 |
| Working hours/100 blood donations | 25.7 | 17.8 |
| Red cells production lost | 1.11% | 0.81% |
| Platelets production lost | 1.2% | 0.3% |
Conclusion: With these results, it's obvious that automation in blood banking makes more efficient the manufacturing of blood components, getting better quality of them and also in a cheaper way. We encourage maintaining lean philosophy in order to keep improving our methods and identifying those activities that add value to our processes and get rid of those ones that are not necessary. In a globalized and industrialized world, where everything changes very fast, these improvements are necessary to be on top of the field and be a state of the art blood bank.
AP43
Benefits of Using Compotrace RFID Enabled Inventory Management System to Manage Blood Components
Amy Heuss Wilharm*, Adam Prieboy and Janet Keller
Heartland Blood Centers
Background/Case Studies: Improved supply chain efficiencies and cost containment requirements initiated a review of established practices in the management of our blood supply. Fresenius Kabi's CompoTrace RFID Enabled Inventory Management System was implemented to assist in the management of blood component inventories at two hospital blood banks (BB). In addition to the management of component inventories, the hospitals used the CompoTrace Ordering module to communicate their daily replenishment needs replacing the established practice of ordering via the phone. Starting in June and July 2016, we began two 90‐day hospital studies to identify opportunities for improved efficiencies in the blood component supply chain.
Study Design/Methods: CompoTrace system components include RFID tags, computer kiosk, RFID reader and barcode scanner. Blood center (BC) distribution team applied RFID tags to blood components and recorded inventory into CompoTrace using RFID reader and barcode scanner as hospital orders received. Hospital BB used CompoTrace RFID reader to receive blood components into their inventory. Hospital also used the RFID reader to record change in blood component inventory status: 1) issued units, 2) returned units into BB inventory 3) disposed units and 4) returned units to BC. Each hospital in study continued to use their BB system for critical decision making and tracking of blood components (Meditech and HCLL). BB staff used CompoTrace Ordering daily to communicate replenishment needs for standard, timed and STAT orders.
Results/Findings: Having visibility to the frequency of blood component movement in hospital BB provided great insight to opportunity costs. Issued components compared to targeted inventory levels provided an opportunity to discuss inventory right‐sizing. On‐line ordering resulted in reduction of miscommunication of inventory needs of hospital BB and added process efficiencies. Size of equipment was not a barrier for use at study sites.
Hospital A – Leukocyte‐reduced RBC (LRBC) and Days Inventory On Hand (DIOH)
| 6/15/2016‐9/19/2016 | O+ | O‐ | A+ | A‐ |
|---|---|---|---|---|
| Initial Target Inventory Level | 15 | 6 | 15 | 6 |
| Avg Daily Actual Unit Usage | 2.7 | 0.4 | 1.8 | 0.4 |
| DIOH at Target Inventory | 5.6 | 15.7 | 8.4 | 14.9 |
| Adjusted Target Inventory Level | ||||
| 7 DIOH | 19 | 3 | 13 | 3 |
| 5 DIOH | 13 | 2 | 9 | 2 |
| 3 DIOH | 8 | 1 | 5 | 1 |
Hospital B – LRBC and DIOH
| 7/5/2016‐9/19/2016 | O+ | O‐ | A+ | A‐ |
|---|---|---|---|---|
| Initial Target Inventory Level | 12 | 8 | 12 | 4 |
| Avg Daily Actual Unit Usage | 4.9 | 2.4 | 3.6 | 1.1 |
| DIOH at Target Inventory | 2.4 | 3.3 | 3.4 | 3.6 |
| Adjusted Target Inventory Level | ||||
| 7 DIOH | 35 | 17 | 25 | 8 |
| 5 DIOH | 25 | 12 | 18 | 6 |
| 3 DIOH | 15 | 7 | 11 | 3 |
Conclusion: CompoTrace data assisted in identifying opportunities to right‐size inventories and optimize deliveries. Technicians found the system easy to use and applying RFID tags were not problematic. Continue to partner with hospital to monitor par levels and best practices.
AP44
Changes in Workflow after Implementing Remote Blood Allocation Devices
Lindsy Rich*1, Amy Mata1 and Camille van Buskirk2
1Mayo Clinic, 2Mayo Clinic Rochester
Background/Case Studies: The laboratory envisioned an automated blood product delivery system that extended blood access to the bedside through the use of Remote Blood Allocation Devices, or “smart blood refrigerators” to improve patient safety, provide timely access to blood products, and potentially reduce laboratory workload. As part of this initiative, BloodTrack HaemoBanks (HB) (Haemonetics, Braintree, MA) were installed and interfaced to the existing SafeTrace Tx (Haemonetics, Braintree, MA) Laboratory Information System. One HB was installed in the Methodist Hospital (RMH) campus which includes a busy outpatient Infusion Therapy Center (ITC).
Study Design/Method: An assessment of the current blood supply chain revealed improvement opportunities for both nursing and blood bank staff. Frequent daily trips to and from the blood bank take nurses away from the patient beside and can create congestion at the blood bank window during peak times. For the ITC, with a daily outpatient volume of 140‐160 patients and an average, round‐trip travel time of approximately 15‐minutes, even small delays waiting in line at the blood bank window would produce profound ripple effects. ITC nurses faced the additional challenge of maintaining nurse‐to‐patient ratios and providing timely patient care. About 30% of patients in the ITC have same‐day transfusion orders, adding to the blood bank workload and creating unpredictability in workflow. Often for patients in the ITC, nurses had to repeat pre‐transfusion vital signs because too much time had elapsed between gathering vitals and obtaining the blood. These inefficiencies resulted in longer patient wait times and, ultimately, a longer stay in the ITC.
Results/Finding: HB devices allow nursing staff to access red blood cells (RBC) for the majority of their patients at the point of care. Since implementing in November 2015, the HB has significantly improved the turnaround time of RBC issue —from 15‐minutes to less than 60‐seconds— and helped maintain nurse to patient ratios and reduced traffic at the blood bank issue window. Prior to HB implementation, blood bank staff at RMH were issuing approximately 750 RBC per month out of the window for non‐surgical patients. This has been reduced to approximately 300 RBC per month, a 60% average monthly reduction.
Conclusion: Having the HB located in the ITC has helped to expedite the care of patients and more easily manage blood products for patients with same‐day orders. The use of HB devices has not resulted in a reduction in blood bank FTE, but rather a shift in workload; from issuing products to monitoring inventory and restocking.
AP45
Civilian and Military, Working Together‐ Providing Blood to Air National Guard
Dianne Geary*
Stanford Blood Center
Background/Case Studies: The 131st Rescue Squadron is a unit in the California Air National Guard 129th Rescue Wing. Established in 2003, it consists of registered paramedics that are pararescue specialists and helicopter personnel. When in combat, the squadron conducts personnel recovery operations and rescues downed airmen. When stationed in the US, they mitigate in state emergencies and perform aeromedical evacuations.
In 2015, they supported a civilian medical emergency and the patient needed a transfusion in the field. They procured blood products from a distant air force base with adjacent medical facility. At the debriefing, members of the 131st Rescue Squadron (131 RQS) decided to find a local civilian blood supplier. The Master Sergeant contacted our blood center and set up a contract for blood supply.
Study Design/Method: Blood center representatives met with the 131 RQS Master Sergeant in January 2016. We asked what 131 RQS's order and delivery expectations were. He said sporadic use and the blood order would be 2 RBCs.
We wrote a procedure for consignment and packaging, using standard blood transport boxes. We developed a communication template for staff to anticipate the 131 RQS needs. Staff was trained based on data from January 2016 meeting. We contacted the 131 RQS in September 2016 to perform a trial run.
At that time, we learned the Master Sergeant was shipped out to military theater. We invited his replacement to the blood center. This pararescue Senior Airman had just returned from Syria and was assigned to civilian duty. He had no prior knowledge of the 131 RQS association with a civilian blood center. Based on his field experiences, he changed the blood order from 2 to 6 RBCs. He introduced blood transport containers, used in military operations, saying they were easier to carry during water and land pararescue missions.
We rewrote the procedures, incorporated his transport containers, and made a pictorial job aid to assist staff on packaging blood using these containers. The blood center and 131 RQS performed a mock run on October 31, and we felt prepared for any future events.
Results/Finding: On November 11, 2016, the 131 RQS was deployed to a civilian aeromedical evacuation. We anticipated a 6 RBC order. The actual order was 7 RBCs and 4 FFP. Staff was preparing frozen FFP to ship, as was their norm for filling hospital orders. Realizing that they could not thaw plasma in flight, we contacted the 131 RQS and offered Liquid Plasma instead, which they accepted. Product was consigned and picked up at 4:30am by the 131 RQS. The patient was transfused in the field and then taken to a nearby hospital.
At our joint debriefing on November 28th, we established a maximum blood order of 10 RBC and 4 Liquid Plasma, noting future orders may request fewer products, yet meet the preferred 2 RBC; 1 Plasma transfusion ratio.
Conclusion: Military personnel are adapted to instantly adjust to an ever changing environment. Regulated blood centers are not as adaptable. With clear and comprehensive communication and anticipation on the blood center's part, we now supply civilian blood products to the Air National Guard.
AP46
Comparison of Cryoprecipitated AHF Fibrinogen Concentration and Differences in Manufacturing Processes
Katherine France*1, Jerome Gottschall2 and Sue Johnson3
1BloodCenter of Wisconsin, Part of Versiti, 2Blood Center of Wisconsin, Inc, 3BloodCenter of Wisconsin
Background/Case Studies: The minimum potency requirement for a single unit of Cryoprecipitated AHF (Cryoprecipitate) is 150mg/donor unit. AABB Technical Manual recommends estimating a Fibrinogen (Fib) concentration of 250mg/donor unit for calculation of Cryoprecipitate dosage. However Fib levels have been shown to be variable in Cryoprecipitate. The intent of this study was to determine the extent of variability in Fib concentration and the impact manufacturing processes have on Fib concentration at different blood centers.
Study Design/Method: Fib levels were measured from 17 blood center laboratories from January 2012 through January 2015. A 12‐question, cross sectional survey gathered data about blood centers’ manufacturing processes between June 2014 and December 2014. The survey was sent to all 17 sites.
Results/Finding: The overall study mean Fib concentration was 345mg/donor unit (Table 1). The highest mean Fib concentration was 535mg/donor unit; lowest mean Fib concentration was 264mg/donor unit. All sites had a mean Fib concentration at least 100mg/donor unit above the FDA minimum requirement of 150mg/donor unit.
Fifteen of 17 blood centers completed the manufacturing process survey. One used a leukocyte reduction filter with AHF destined plasma. All blood centers manufactured single donor Cryoprecipitate; 12 manufactured pooled donor Cryoprecipitate. Most froze plasma in a ‐18°C or colder blood bank freezer. One froze plasma using dry ice, and one used a blast freezer. Two blood centers method of thawing frozen plasma took longer than 10 hours.
Conclusion: Blood centers consistently met the overall Fib minimum requirement with a mean of 345mg/donor unit, over double the FDA requirement. However there is variability in Fib levels amongst blood centers. In general, manufacturing processes were similar with a few exceptions. Blood centers should inform their hospital customers of their average Fib level in Cryoprecipitate in order to most appropriately care for patients receiving this product.
TABLE 1. Fibrinogen Concentration in AHF Unit by Blood Center (site).
| Location | Fib. Min1 | Fib. Max1 | Fib Mean1 |
|---|---|---|---|
| Site 1 | 286 | 575 | 362 |
| Site 2 | 143 | 1014 | 420 |
| Site 3 | 164 | 465 | 293 |
| Site 4 | 313 | 746 | 535 |
| Site 5 | 154 | 615 | 264 |
| Site 6 | 153 | 622 | 329 |
| Site 7 | 188 | 527 | 305 |
| Site 8 | 169 | 738 | 356 |
| Site 9 | 172 | 374 | 273 |
| Site 10 | 140 | 725 | 414 |
| Site 11 | 77 | 459 | 240 |
| Site 12 | 285 | 581 | 451 |
| Site 13 | 151 | 362 | 272 |
| Site 14 | 232 | 513 | 341 |
| Site 15 | 177 | 546 | 291 |
| Site 17 | 216 | 769 | 380 |
| Study Mean | 189 | 601 | 345 |
1Unit of measure is mg/donor; FDA minimum requirement is 150mg/donor. Site 16 excluded from data analysis (<30 data points).
AP47
Compliance & Productivity Improvement Via Engineered‐ Staffing/Scheduling Calculator Application (APP)
Mary Deck, Mark Angelelli and Kevin Lee*
American Red Cross
Background/Case Studies: The healthcare industry, particularly the blood banking industry continues to experience tremendous pressures not only with ensuring patient safety and quality daily, but managing and maintaining an efficient operation with a cost competitive structure. Applications of basic Industrial Engineering tools, coupled with Lean‐Six Sigma techniques such as time study analysis, bottleneck elimination & process standardization to reduce variation has been transformed into an Application (for short “APP”), which can be utilized to determine process and staffing optimization and provide flexibility to the dynamic nature of changing needs in blood banking.
Study Design/Methods: A time study analysis offers valuable data about the process requirements. Once this baseline has been established, translating the data into a user‐friendly APP would enable ease and practical use to facilitate business decision‐making as well as effectively manage daily operations. Important concepts such as Lean‐Pull Production System, bottleneck elimination, work‐load balancing together with basic development of the APP using MS Excel software will be demonstrated.
Results/Findings: Successful rollouts and implementations of the Staffing/Scheduling Calculator APP across pilot facilities, then onto facilities nationwide, has yielded improved productivity together with a sustainable compliance scorecard. The APP interactive‐based approach, programmed via a commonly used software, MS Excel, was used to analyze how to optimize staffing requirements together with staff‐scheduling (i.e. match incoming volume/work content to staffing availability).
The Staffing/Scheduling Calculator APP has been utilized by executives to evaluate “what‐if” scenarios (sensitivity analysis) as well as a planning toolkit to proactively manage the changing demands of blood banking.
Conclusion: Besides providing a key mechanism for increased productivity and sustained compliance – a top priority for blood banks – the Staffing/Scheduling Calculator APP will highlight continuous improvement opportunities and spring‐board to system‐wide acceptance and standardization.
Staffing/Scheduling Calculator Application (APP):

AP48
Coolers Fail to Maintain the Temperature of the Blood Products at 1‐6°c When Units Are Placed on Top of the Ice
Zhan Ye*1 and Darrell Triulzi2
1Institue For Transfusion Medicine, 2Institute For Transfusion Medicine
Background/Case Studies: Transfusion services typically validate coolers for blood storage with red blood cell (RBC) units at the bottom and ice on top. However coolers are often returned from the operating rooms with RBC units on top of the ice so the units are wasted. This study determined what the maximum time RBC units will maintain a temperature of 1‐6 oC when the ice is placed at the bottom of the cooler and units on top.
Study Design/Method: Five different brands and size coolers (large red Igloo, large blue Igloo, large Rubbermaid, medium Rubbermaid and small blue Igloo) were tested with 10 RBC units in the large coolers, 6 units in the medium cooler and 4 units in the small cooler.
All coolers were prepared in a walk‐in refrigerator. Two scoops of wet ice or two ice packs were placed at the bottom of large/medium or small coolers, respectively, with RBC units on top of the ice. A quality‐controlled thermometer was placed on top of the RBC units. A control thermometer was place at the interface between the ice and the RBC units in one large and one medium cooler. The start temperature was recorded and then the temperature was recorded every 15 minutes for a 12 hour period or until the temperature exceeded 6°C.
Results/Finding: The temperature recorded from the thermometer on top of the units in all five coolers reached >6°C in ≤75 minutes as shown in Table 1. The control thermometer recorded temperatures maintained at 1‐6°C for the entire 12 hour observation period in both the large and medium cooler.
TABLE 1. AP48
| Cooler | Time (min) to >6.0 oC |
|---|---|
| Large Rubbermaid | 60 |
| Large Blue Igloo | 45 |
| Large Red Igloo | 45 |
| Medium Rubbermaid | 75 |
| Small Blue Igloo | 45 |
Conclusion: When units are placed on top of the ice in a cooler, the temperature is not reliably maintained at 1‐6°C for more than 45 minutes. These data support a policy of wasting units that are returned to the blood bank with RBC units on top of the ice.
AP49
Cost and Shelf Life Implications of Pathogen Reduced Platelets: A Hospital Budget Impact Model
Katherine M. Prioli*1, Nina M. Lyons2, Julie Katz Karp3, Jay H. Herman4 and Laura T. Pizzi1
1Rutgers University, 2Thomas Jefferson University, 3Thomas Jefferson University Hospital, 4Thomas Jefferson Univ. Hospital Blood Bank
Background/Case Studies: An FDA draft guidance has highlighted the need to reduce the risk of bacterial contamination of platelet components (PC) via pathogen reduction (PR) or secondary rapid testing (RT). Hospitals must understand the cost implications that may result. Our objective was to create an interactive model to analyze the budget impact for different PC types across the range of existing US hospitals.
Study Design/Methods: An Excel model was built and populated with base case costs and probabilities identified through literature search as well as through a survey administered to 27 US hospital transfusion service directors. The model was reviewed and refined by a panel of seven transfusion medicine physicians. The model allows base‐case assumptions to be overwritten with values specific to the institution. Three scenarios were generated to compare annual costs of plt acquisition, testing, wastage, dispensing /transfusion, adverse events (AE), shelf‐life, and reimbursement for a hospital that purchases all of its PCs: 100% conventional (C‐PC), 100% PR‐PC, and mix of 75% C‐PC/25% PR‐PC.
Model Assumptions :
· 8,138 apheresis plt units purchased/year, with a 5‐day shelf‐life
· 60.7% C‐PC are gamma irradiated
· PR replaces irradiation, CMV testing, and bacterial detection (BD)
· Unit cost:
o C‐PC: $524.00 purchase
o C‐PC irradiated: $602.60 purchase
o PR‐PC: $603.75 purchase
· 26.3% of PC transfusions are for outpatients (reimbursable)
Results/Findings:
TABLE 1. Annual Costs, Outpatient Reimbursement, Shelf‐Life
| 100% C‐PC | 100% PR‐PC |
75% C‐PC / 25% PR‐PC |
|
|---|---|---|---|
| Acquisition | $4,652,578 | $4,913,318 | $4,717,763 |
| Positive primary bacterial culture | $0 | $0 | $0 |
| Wastage (expiration) | $149,283 | $119,306 | $141,480 |
| Wastage (mishandling) | $69,286 | $73,168 | $70,566 |
| Dispensing and transfusion | $260,721 | $260,721 | $260,721 |
| AE | $10,025 | $2,737 | $8,203 |
| Total hospital cost | $5,141,893 | $5,369,249 | $5,198,732 |
| Outpatient reimbursement | $979,109 | $1,075,363 | $1,003,172 |
| Maximum usable shelf‐life (hours) | 48.0 | 63.2 | 51.8 |
Conclusion: The model predicts a modest (∼4%) cost increase for PR‐PC compared to C‐PC depending on the degree of PR conversion; this takes into account cost offsets such as elimination of BD and irradiation, decreased waste due to increased shelf‐life, and outpatient reimbursement. The effective PC shelf‐life is potentially increased with PR due to elimination of BD, and is dependent on NAT turnaround time. Benefits not captured by the model include transfusion‐transmitted infectious risk mitigation from emerging pathogens, which may impact cost/benefit analyses. Future iterations of this model will also enable hospitals to consider scenarios in which RT is used. This model can serve as an important tool for hospitals considering PR adoption.
AP50
Effect of Donor Notification and Inventory Reduction on Rare Donor Donations
Lisa M Scott*, Craig D Tauscher, Sheila K Moldenhauer, Justin D Kreuter, James R Stubbs and Eapen K Jacob
Mayo Clinic
Background/Case Studies: In an attempt to increase the number of donations by rare donors, a new process of donor notification was implemented in January 2011. A report was created to identify donors previously classified as rare according to the American Rare Donor Program (ARDP) criteria. Donors are classified as rare by meeting one of the following: high‐prevalence antigen negative, multiple common antigen negative, or IgA deficient. The new process utilized the report and involved sending a letter to the donors notifying them of their rare donor status and encouraging them to continue to donate. A database was created to track the letters sent to rare donors. In August 2013, inventory reduction efforts were implemented to gradually decrease the number of allogeneic red blood cells (RBC) collected to minimize unit age at transfusion. The inventory reduction occurred in phases and was completed by January 2015. A study was performed to determine the impact of the inventory reduction on the number of rare donor donations.
Study Design/Methods: The total number of allogeneic RBC donations, rare donor donations, and number of rare donor letters sent was analyzed from 2010 to 2016 (see Table). The percentage of rare donor donations per year was calculated.
Results/Findings: In 2010, the number of allogeneic RBC donations was 29,334 units compared to 22,367 units in 2016. This was an inventory reduction of 6,967 units over seven years. Donor letters were implemented in 2011 and a total of 309 letters were sent to rare donors. This includes rare donors who donated in 2010 and 2011. The number of rare donor donations increased by over 200 donations from 2010 to 2011. In 2013, inventory reduction measures were implemented yet the number of rare donor donations decreased by only 7 donations from 2012 to 2013. Since 2011, the percentage of rare donor donations compared to the total number of donations per year has maintained an average of 3.47%.
Conclusion: Despite inventory reduction efforts, we have maintained the number of rare donor donations. One possible explanation is the letter educating the donors of their rare status. The decrease in number of letters sent while maintaining a consistent percentage of rare donations indicates many of the rare donors are repeat donors.
TABLE 1. Donations per Year
| Year | Number of Donations | Rare Donor Donations | % of Rare Donations | Number of Letters Sent |
|---|---|---|---|---|
| 2010 | 29,334 | 728 | 2.48% | NA |
| 2011 | 28,321 | 935 | 3.30% | 309 |
| 2012 | 28,064 | 890 | 3.17% | 92 |
| 2013 | 25,972 | 883 | 3.40% | 86 |
| 2014 | 23,964 | 873 | 3.64% | 39 |
| 2015 | 22,604 | 801 | 3.54% | 75 |
| 2016 | 22,367 | 845 | 3.78% | 60 |
AP51
Effects of Rapid Implementation of Zika Virus (ZKV) NAT Blood Donor Screening in High‐Throughput Testing Laboratories
Joan Dunn Williams*1, Nancy Haubert1, Larry Morgan1, O'Dina Hurlburt1, Lindsey Houghton1, Randall Spizman1, Jennifer L Ritter1, Michelle Humphries1, Ami Macke1, Sally Caglioti1, German Leparc2 and Phillip C Williamson1
1Creative Testing Solutions, 2OneBlood
Background/Case Studies: Blood Centers (Clients) often carry low inventory of blood and blood components. Laboratories performing donor screening therefore, have limited time to determine the presence or absence of infectious disease within these products. In order to measure and ensure expedited donor screening we implemented a daily performance metric consisting of upload time goals for release of results to Clients. In 2016, ZKV‐ NAT testing was implement for travel deferral donors (July), followed by universal individual donor screening in September and November in response to the FDA recommendations for “Reducing the Risk of ZKV Transmission by Blood and Blood Components”. Per the FDA guidance we implemented mandatory ZKV testing for Clients with proximity to areas with locally acquired mosquito‐borne cases of ZKV within 4 weeks (Sept. Phase 1) and nationwide within 12 weeks (Nov. Phase 2). ZKV testing is performed on individual samples, unlike all other NAT tests that are performed in mini‐pools (16‐donations). Therefore ZKV testing has a disproportionate impact on the turnaround times for testing, which we analyzed in this study.
Study Design/Method: Within two regional testing labs, participating in the same clinical trial, Lab 1 had 86% and Lab 2 had 77% of Clients requiring universal ZKV testing. We evaluated a 12‐month test result upload performance period to determine the impact of ZKV test implementation.
Results/Finding: During 2016, Lab 1 upload time performance ranged from 92% to 94.2% from January to July; upload time performance fell between August through November, returning to 94.2% performance in December. Lab 2 upload time performance ranged from 91.4% to 95.3% January to August. Performance fell September through December 83.3% ‐ 88.5%. Lab 1 experienced a low of 75% upload time performance during Phase 1 when there was a rapid implementation; 69% Clients required ZKV NAT. Improved performance was observed during Phase 2, with a 16% increase in ZKV Clients. For Lab 2: Phase 1 experienced a modest decline of upload performance ranging from 83.3% to 88.5% with 33.3% of Clients implementing ZKV NAT. Performance was 87.1% in Phase 2, when an additional 43.3% of Clients implemented ZKV testing.
Conclusion: With an unprecedented rapid implementation of ZKV testing our laboratories experienced a short period of reduced ability to maintain our upload time performance metric.
| Month | *Lab 1 | % Clients ZKV | *Lab 2 | % Clients ZKV |
|---|---|---|---|---|
| Jan | 94.2% | 0 | 95.0% | 0 |
| Feb | 92.1% | 0 | 95.2% | 0 |
| March | 93.8% | 0 | 95.3% | 0 |
| April | 93.8% | 0 | 95.0% | 0 |
| May | 94.0% | 0 | 95.0% | 0 |
| June | 92.0% | 0 | 91.4% | 0 |
| July | 92.0% | 27 | 93.2% | 10 |
| Aug | 88.1% | 29 | 94.2% | 10 |
| Sept | 75.0% | 69 | 88.5% | 33 |
| Oct | 86.6% | 73 | 83.3% | 37 |
| Nov | 89.9% | 86 | 87.1% | 77 |
| Dec | 94.2% | 86 | 88.5% | 77 |
Upload Time Goal Met
AP52
Enhanced Platelet Bacterial Screening in an Eight‐Hospital System
Robin Larson*1 and Colleen A. Aronson2
1Advocate Lutheran General Hospital, 2ACL Laboratories/ Advocate Hospitals
Background/Case Studies: In response to two platelet‐related septic transfusion reactions and the draft FDA guidance released in March 2016 regarding bacterial risk control strategies for transfusion services, an eight‐hospital system implemented the Verax PGD enhanced platelet bacterial screening test in 6 of the 8 hospital transfusion services. The 2 sites that did not implement the test arranged for fresh platelets to be rotated in from the blood supplier. The 6 sites which implemented the Verax PGD test perform testing on all day 4 and day 5 platelets to be issued for transfusion. This abstract summarizes the data collected for the first 5 weeks of testing.
Study Design/Methods: Platelet bacterial testing logs were reviewed over the entire time period studied for platelets tested on day 4, day 5, and those that were tested twice. Inventory reports were reviewed for platelets issued on day 2 or day 3 that did not require testing, and for the total number of platelets issued over the time period studied.
Results/Findings: In the month of February (1 week of performing the test), 48.1% of all platelets issued by the 6 participating transfusion services were day 2 or day 3 platelets. In March that number dropped to 29.9%. It is expected that this number will level off at some percentage at or below 29.0% with further data collection. In February 25.9% of platelets were tested twice prior to final issue from the transfusion services. In March 32.2% of platelets were tested twice. Looking only at platelets tested on day 5, in February 75% of those were tested twice. In March 80.7% were tested twice. This represented an added supply cost to the transfusion service of $1104.00 in February and $6348.00 in March. Finally, in February 102.2% of total issued platelets were tested at least once and in March 113.3% of total issued platelets were tested at least once.
Conclusion: The percent of platelets issued fresh (day 2 or day 3) will likely level off at some number at or below 29.9% due to inventory management from both the blood supplier and the individual transfusion services.
Testing platelets twice is undesirable. Ideally, no platelets would be tested twice as this represents a high cost for both the test reagents as well as the staff time to complete the testing. In addition, 5 of the 6 sites performing testing are Level 1 Trauma Centers and need to have tested platelets available at all times. This will require some amount of double testing, but the goal is to have this number be as low as possible, so that the percent of tested vs issued platelets does not exceed 100%. As the transfusion service staff becomes more comfortable with judging inventory levels and performing testing, it is expected that the amount of double testing will decrease.
| All Sites | ISSUED FRESH (DAY 2 OR 3) | TESTED DAY 4 | TESTED DAY 5 | TESTED 2X | OUTDATED | TOTAL TESTED | TOTAL PLTS ISSUED |
|---|---|---|---|---|---|---|---|
| FEB | 87 | 121 | 64 | 48 | 24 | 185 | 181 |
| MAR | 226 | 516 | 342 | 276 | 133 | 858 | 757 |
| TOTALS | 352 | 730 | 471 | 375 | 174 | 1201 |
AP53
Evaluation of Pooled Platelet Concentrates Function during Storage in Polyvinylchloride Blood Bags Plasticized with Bthc after Filtering Leukocytes
Zeng He*, Dingding Han, Rui Zhong, Xuejun Zhang, Shen Li, Yang Zhou, Weinan Li, Peipei Sang, Jiaxin Liu and Hong Wang
Institute of Blood Transfusion ,Chinese Academy of Medical Sciences and Peking Union Medical College
Background/Case Studies: In order to make up for the deficiency of the apheresis platelets in clinical application, and also to improve the comprehensive utilization of blood, we investigate the feasibility of preparation of pooled platelet concentrates(PCs) for providing a reliable source for clinical application. To speed up the storage research of pooled PCs in China, we evaluate the changes in platelet function after filtering leukocytes with leukocytes filter for PCs and the quality changes during storage in PVC‐BTHC blood bags.
Study Design/Method: PCs were prepared from 400mL virus free whole blood by platelet–rich plasma (PRP) method. Five or six bags of ABO–matched PCs were pooled and filtered with leukocytes filter for PCs(n=7). The swirling phenomenon, pH, automatic blood count, platelet aggregation, hypotonic shock response (HSR), the extent of shape change(ESC), CD62p expression, ATP level in platelet, glucose and lactate concentration were detected before and after filtering, and on days1, 3, 5 and 7 of storage, respectively.
Results/Finding: The platelet recovery ratio of a therapeutic dose of pooled platelet concentrates after filtering leukocytes was (86.7 ± 1.6)%, relative change rate of HSR was (3.87 ± 12.75)%, the residual leukocytes were (0.15 ± 0.15)×106. The pH, HSR, and the CD62p expression of pooled platelet concentrates before and after filtering were (7.00 ± 0.17) vs (7.06 ± 0.16), (66.96 ± 12.35)% vs (63.22 ± 8.26)% and (28.94 ± 14.25) % vs (31.60 ± 16.77)%. There is significant change for WBC after filtering (P<0.01). During storage in PVC‐BTHC blood bags, the biochemical parameters of pooled platelet concentrates changed with increasing storage time, as shown in table 1.
TABLE 1. Results (mean ± SD) for 7 pooled platelet concentrates stored in BTHC‐PVC bags
| Day 1 | Day 3 | Day 5 | Day 7 | |
|---|---|---|---|---|
| swirling phenomenon | Yes | Yes | Yes | Yes |
| pH | 758 ± 192 | 733 ± 189 | 707 ± 187 | 662 ± 162 |
| PLT (×109/L) | 8.4 ± 0.3 | 8.6 ± 0.1 | 8.9 ± 0.2 | 9.3 ± 0.6 |
| MPV (fL) | 15.9 ± 0.1 | 16.0 ± 0.1 | 16.0 ± 0.1 | 16.0 ± 0.2 |
| PDW | 7.31 ± 0.11 | 7.28 ± 0.19 | 7.17 ± 0.25 | 6.89 ± 0.41 |
| platelet aggregation (0.5g/L Arachidonic acid, %) | 94.0 ± 6.5 | 83.8 ± 8.3 | 87.5 ± 27.6 | 63.8 ± 31.1 |
| HSR (%) | 63.57 ± 8.01 | 75.11 ± 9.73 | 68.67 ± 4.79 | 62.64 ± 25.41 |
| CD62P (%) | 33.18 ± 9.31 | 31.85 ± 11.71 | 39.42 ± 14.36 | 41.68 ± 12.58 |
| ESC (%) | 14.84 ± 2.12 | 11.51 ± 3.80 | 8.95 ± 4.72 | 5.67 ± 4.37 |
| ATP (µmol/1011Plt) | 5.27 ± 1.65 | 4.92 ± 1.09 | 5.31 ± 0.91 | 3.98 ± 1.27 |
| lactate (mmol/L) | 7.18 ± 2.61 | 12.81 ± 3.30 | 12.99 ± 3.02 | 17.39 ± 3.81 |
| glucose (mmol/L) | 24.31 ± 1.42 | 22.60 ± 2.21 | 20.70 ± 2.19 | 19.16 ± 2.84 |
Conclusion: Storage in PVC‐BTHC blood bags for five days, the quality of pooled PCs met the requirements of Chinese standards (GB 18469‐2012). It can be a complementary source for apheresis platelets supplement in China.
AP54
Evaluation of Samplok® Segment Sampler to Obtain and Measure Samples from Blood Component Tubing Segments
Abbejane Blair*
AJBlair Laboratory Consulting
Background/Case Studies: Current methods used to obtain samples from blood component tubing segments are cumbersome and present a significant risk for exposure to biohazards, sharps injury and cross contamination.
ITL BioMedical has developed SampLok® Segment Sampler (SS), a device for obtaining measured samples from sealed tubing segments that is less cumbersome and offers improved safety, eliminating the need to manually cut and squeeze tubing segments.
SS was evaluated with the goals of reducing the number of steps required to obtain a measured sample, and, reduce biohazards and sharps exposure.
Study Design/Method: SS obtains fluid samples from sealed tubing segments into a needleless syringe. It consists of two chambers with recessed internal needles located at the top of the device and a female port located at the bottom of the device. A needleless syringe is attached to the female port, the sealed tubing ends are then aligned with the SS chambers and, gently pushed onto the needles to pierce each end of the segment. The sample from the segment is then withdrawn into the syringe.
The study was performed at Rhode Island Blood Center (Providence, RI) using tubing segments from three bag manufacturers to demonstrate ease of use on the following processes: segment alignment over needles and piercing, ability to draw sample into syringe, ability to expel air bubbles from syringe, fluid leaks, ease of transfer of sample from syringe to tube and to collect user feedback. Two lengths of tubing segments were filled to contain sample volumes of 500µL and 1000µL. Two users then evaluated the SS tubing segment types with 500µL or 1000µL samples for a total of 10 data points. Samples were collected into the attached 1mL or 3mL syringe then a measured sample was transferred from the syringe into a test tube or micro‐centrifuge tube. Results were tabulated as PASS or FAIL.
Results/Finding: A total of 10 SS were evaluated by two users. All samples were successfully collected and transferred into tubes. Insertion of the segment edge requires observation to ensure placement onto the needles. Any air bubbles collected into the syringe could easily be moved to the top by flicking the syringe with finger‐tip and expressed back into the segment. The results are summarized in the Table.
TABLE. AP54
|
Collection Bag Manufacturer |
Part/Cat. # |
Tubing Volume, µL |
Syringe Used, mL | SS Tested, # | Test Results | ||
|---|---|---|---|---|---|---|---|
| 500 | 1000 | 1 | 3 | PASS/FAIL | |||
| Haemonetics | 126‐92 | √ | √ | 1 | PASS | ||
| 732‐80 | √ | √ | √ | 2 | PASS | ||
| Terumo BCT | 1BBWGQ506A2 | √ | √ | 2 | PASS | ||
| 80400 | √ | √ | √ | √ | 4 | PASS | |
| Fenwal | 4R3429 | √ | √ | 1 | PASS | ||
Conclusion: The SampLok® Segment Sampler provides an easier more efficient method for obtaining a measured volume of sample from a tubing segment and improves safety by reducing the potential exposure to biohazards and sharps.
AP55
Hospital‐Based Blood Donor Center's Experience with Platelet Management
Emily L McIntire*, Shelby N Morcomb, Joy Gomez, Scott A Hammel, Kimberly J Duffy, Audrey E Traun, Mary M Benike, James R Stubbs and Justin D Kreuter
Mayo Clinic
Background/Case Studies: The management of platelet inventory is crucial due to a number of factors including the 5 day product outdate, the allocation of staff due to the lengthy donation process, the increasingly small donor pool, and the high cost of production (e.g. platelet collection kits, testing, product processing). The use of a platelet inventory management tool has the potential to enhance the understanding of units transfused, optimize inventory, increase efficiency, and reduce waste. The objectives of this assessment were to decipher if the platelet inventory management tool has reduced the amount of outdated platelet products, total cost of platelet production, and full time equivalent (FTE) allocation.
Study Design/Method: In January 2015, a platelet inventory management process was implemented which uses a spreadsheet based tool to predict the amount of platelet collection procedures needed to be scheduled each day. The tool uses daily historical transfusion data from the last five weeks. Additional calculations are included to account for deferrals, no shows, incomplete collections, and product split rate. The number generated from the calculations correlates to how many platelet collection procedures to schedule for the specific day of the week considering testing release and historical daily transfusion trends. The effectiveness of the tool was verified by comparing platelet collections, platelet products outdated, and FTE information for a one year period prior to the implementation of platelet inventory management to one year period following implementation.
Results/Finding: By implementing a platelet inventory management tool, collections have been lowered or shifted to accommodate the transfusion needs. The staffing adjustments and targeted collections have lowered FTE and outdate cost by 22%. The platelet outdate rates dropped after implementing the platelet inventory tool from 14% (1324 units) to 11% (874 units); a 21% decrease. FTE was able to be monitored closely with the donor schedule and lowered from a yearly average of 7 FTE to 6.2 FTE, lowering FTE by 11%.
Conclusion: Considering historical transfusion data for potential platelet demand has had a positive impact on scheduling platelet collections. Staffing requirements and outdating products have decreased since implementation of the platelet management spreadsheet tool, leading to less waste both in terms of staffing and platelets. Given these positive results, we are beginning to develop a similar tool for our whole blood collections.
AP56
Identifying Opportunities to Right‐Size Hospital Inventory Using Compotrace Radio Frequency ID Inventory Management System
Nanci Fredrich*1, Jaclyn McKay1, Jennifer Curnes1 and Rowena Punzalan1,2
1BloodCenter of Wisconsin, 2Children's Hospital of Wisconsin
Background/Case Studies: The ability to track inventory of blood components in real time is challenging for both hospital transfusion services (TS) and blood centers (BC) using current blood bank information systems (BBIS). In addition, determining if established par levels of individual components meet or exceed daily transfusion needs is difficult to ascertain. A pilot was designed to track and monitor all blood components from distribution at the BC to issue in a hospital TS using Fresenius Kabi CompoTrace Radio Frequency ID (RFID) enabled Inventory Management System. The objectives were to determine feasibility of the CompoTrace system and analyze CompoTrace data for real‐time usage and optimal inventory levels.
Study Design/Method: A 3 month pilot was conducted at a pediatric hospital and its BC using both BBIS and CompoTrace systems to track all adult‐size blood components. Staff were trained on use of CompoTrace system. Upon receipt of order from pilot hospital, BC staff applied RFID tags to all component bags and scanned components into the CompoTrace system. Components were transported and delivered to TS following established procedures. Upon receipt at the hospital, components were scanned into inventory using both the TS BBIS and CompoTrace systems. Dual scanning of components occurred upon issue to or return from floor, component modification or return to BC. Products for emergency use or at time of high demand were not RFID‐scanned. A priori, the pilot would stop if the CompoTrace system hampered current workflow, component issue was delayed or if TS errors increased. No inventory changes were made during the pilot.
Results/Findings: Real‐time data from CompoTrace system provided actual usage for all blood components including component disposal and shipment to and from BC. Average daily RBC inventory levels and usage for selected blood types is shown in table.
| Average Daily Inventory and Usage | |||
|---|---|---|---|
| 10/31/2016‐2/15/2017 | O+ RBC | O‐ RBC | B+ RBC |
| Target Inventory Level | 24 | 24 | 2 |
| Avg Daily Unit Usage (Adult) | 5.5 | 1.4 | 1.0 |
| Avg Target Inventory Days On Hand | 4.4 | 17.3 | 2.0 |
| Avg Daily Discarded Units (Adult) | 0.05 | 0.05 | 0.0 |
| Avg Daily Units Shipped From BC | 4.8 | 2.9 | 0.9 |
| Avg Daily Units Returned to BC | 0.6 | 1.5 | 0.0 |
Lessons learned related to equipment and workflow: (1) Use of smaller irradiation canister may damage RFID tag, which was resolved by relocating tag, (2) TS workflow and STAT orders challenged consistent use of dual processes to track component status. However no increase in TS errors or delay in issue of components occurred.
Conclusion: Use of RFID to track blood components from BC to final disposition is feasible. Real‐time data from CompoTrace system identified optimal inventory levels for RBC at the pilot TS. Use of real‐time RFID to track inventory and adjust target levels based on actual daily usage over time may reveal seasonal influences that affect target inventory.
AP57
Impact of Implementation of Electronic Crossmatch on Red Blood Cell Inventory and Cost
Allison Kelly*
University Medical Center
Background/Case Studies: To demonstrate the electronic crossmatch, EXM, has improved the efficiency of the Transfusion Service by decreasing technologist time as shown by the crossmatch‐to‐issue (C:I) ratio and lowering costs by reducing red blood cell (RBC) inventory.
Study Design/Methods: A retrospective cross‐sectional study which involved data review of red blood cell inventory from January 2009 – June 2016. Different categories of information were captured due to the changing policies in the Transfusion Service, as demonstrated in Table 1. The number of RBC crossmatched, dispensed, transfused, and wasted were entered into Microsoft Excel and the C:T ratio, C:I ratio, and cost were calculated. The red blood cell inventory levels was tracked starting May 3, 2014. Total red cell units available and crossmatched were entered into a Microsoft Excel spreadsheet daily. The daily averages were calculated for each time period as seen in Table 1.
Results/Findings: The mean, standard deviation and a t‐test with a 0.05 level of significance was performed to determine the statistical significance of the decrease in the C:T ratios and the C:I ratios over the 7 time periods. The C:T ratio mean was 1.91, standard deviation was 0.24, and t‐test was ‐1.861 with a p‐value of 0.03. The C:I ratio mean was 1.36, standard deviation was 0.27, t‐test was ‐3.936 with a p‐value of 0.00004.
Conclusion: This study shows that implementation of the EXM has helped transfusion services become more efficient at lowering inventory levels with little impact from physician ordering practices. Lowering the levels of blood held for patients, the transfusion service decreased total stock levels for RBCs by 48%, reduce wastage, and thus lower the blood cost for the hospital by $27,813 at a red cell cost of $219 per unit.
TABLE 1. Red cell inventory activity with C:T and C:I ratio for time periods when major changes were made in blood management by the UMC Transfusion Service.
| Period and Changes Made | C:T Ratio | C:I Ratio | % XM | Total in Inventory | % Change From Baseline |
|---|---|---|---|---|---|
| 1. Baseline | 2.0791 | 1.7664 | 39% | 267 | NA |
| 2. Transfusion guidelines implemented | 2.1012 | 1.6114 | |||
| 3. Decreased days held in crossmatch | 2.0721 | 1.4222 | 32% | 196 | ‐27% |
| 4. EXM implemented | 2.0079 | 1.3394 | 25% | 167 | ‐37% |
| 5. No hold for non‐surgical patients | 1.9721 | 1.3132 | 14% | 146 | ‐45% |
| 6. No hold for pre‐operative patients | 1.6246 | 1.0861 | 10% | 140 | ‐48% |
| 7. Prepare only with a send blood request | 1.5168 | 0.9943 | 6% | 141 | ‐47% |
AP58
Impending National Blood Product Shortage: A Transfusion Service Management Strategy
Kerry OBrien*1,2, Monique Mohammed2 and Lynne Uhl1,2
1Harvard Medical School, 2Beth Israel Deaconess Medical Center
Background/Case Studies: Physicians expect blood to be available at all times. Following a national appeal in July 2016 for donors based on a predicted summer shortage with high likelihood of extending into the fall, our transfusion service (TS) recognized a potentially dire situation given the institution's patient acuity. Our hospital‐based TS supports a full range of services: a Level I trauma service; stem cell and solid organ transplant services; a brisk cardiothoracic surgical program; a high risk obstetrical service; and high acuity medical/surgical services. A regional donor center supplies our blood products. To insure appropriate response to patient needs, the TS created a management plan, with input from multiple stakeholders, to assist with product management in times of extreme shortages. The approach is described herein.
Study Design/Method: At the direction of the Transfusion Committee (TC), TS directors presented the concern for impending shortages to the hospital Quality Directors (QD) committee. The QD committee consists of clinicians and non‐clinicians trained in health care quality/regulatory affairs who are responsible for institutional Health Care Quality (HCQ) activities. The QD recommended creation of a multidisciplinary team: “the blood shortage task force (BSTF)”, analogous to an existing task force started for management of drug shortages.
Results/Finding: With HCQ and TC support, the TS created the BSTF and blood shortage management algorithm (BSMA). Standing Members of the BSTF include TS Medical Director (Chair), Senior Vice President (SVP) of HCQ, SVPs of Clinical Services Director of Regulatory Affairs, Legal Counsel, and representatives from Ethics, Social Work, Pharmacy, Patient Referrals, and Communications. Ad hoc members include those whose patients would be most impacted by the specific shortage. The BSMA designed by the BSTF provides a framework for TS's to conduct operational and therapeutic assessments of potential impact and defines criteria for convening the BSTF. Trigger criteria include: marked TS concern; essential product; high likelihood of inventory depletion; broad patient impact. Once convened, the BSTF is responsible for situational assessment and formulation of a management plan, with a goal of maintaining quality patient care.
Conclusion: Faced with the potential for limited blood supply, the TS reached beyond the laboratory and engaged the TC and members of HCQ to assemble a robust, multidisciplinary task force. This resulted in an inclusive plan which can be activated at any time to address shortages, and assist in management of impacted patients.
AP59
Implementation of a Remote Blood Storage Program
Andrea Pelock*1 and Colleen A. Aronson2
1Advocate Christ Medical Center, 2ACL Laboratories/ Advocate Hospitals
Background/Case Studies: A large Midwest 750 bed hospital with very active Level I trauma center struggles to get blood from the Transfusion Service (TS) to the patient in an emergency situation. Multiple processes have been evaluated to lean the Emergency Release (ER) process as well as the Massive Transfusion Protocol (MTP). Automated blood dispensers were evaluated but due to the high cost and the incomplete interface with the Laboratory Information System (LIS) this solution was abandoned. A manual tracking process was created to ensure that blood was tracked to the correct patient.
Study Design/Method: Process and requirement review was completed. A discussion with the Operating Room (OR) nursing staff helped determine needs, responsibilities and training. Two sets of 2 O negative Red Blood Cells (RBCs) were packaged together with Transfusion Administration Records (TARs) and a Remote Blood Record (RBR). This form indicates the date and time blood was received by OR staff and placed into the OR refrigerator. When the units are removed by designated staff, the RBR is completed to indicate patient demographics (patient label), date and time RBCs were utilized and individual removing units from the refrigerator. Return of the RBR to the TS indicates that replacement units are needed. Auditing of process includes completion of the RBR as well as completion of the TAR. Program was started on 10/20/2016 and data was evaluated through the end of March 2017.
Results/Finding: There were 27 events where blood was utilized for 20 different patients. Seven events involved the same patient taking all 4 units rather than just 2 (1 set). A “Doe” patient was involved in 48.1% of the events. It was determined that 33.3% of the time the receiving information was not completed on the RBR but only 18.5% of the time the blood use information was incomplete. There were 3 events where the patient identification was not recorded on the RBR. Follow up was required for these events to find the identification either on the TAR copies or the medical record.
Conclusion: The TS was uncomfortable with not having RBC units under complete TS control and very hesitant to allow other areas to have blood stored remotely. Due to the continued demand caused by the high number of trauma events, those concerns had to be set aside. The OR and TS staff continue to work together to identify the issues on a real‐time basis so that process review and additional training can be completed as soon as possible. This program was expanded to the Emergency Department (ED) in February of 2017 due to the high number of traumas and the need for blood as part of patient resuscitation. The evaluation of this process shows that the blood is needed faster than the TS can send and although we struggle with documentation, this type of process is needed to accommodate the patients and surgeons in hopes of saving lives.
AP60
Improving Cryoprecipitate Collection Operations Using Operations Research and Analytics‐Based Methods
Mary Deck1, Kevin Lee*1, Chelsea White2 and Turgay Ayer2
1American Red Cross, 2Georgia Institute of Technology
Background/Case Studies: Cryoprecipitate (for short “cryo”) plays a critical role in clotting and controlling hemorrhaging, and is often used in the treatment of massive trauma and major diseases, including metastasized cancers, cardiac diseases, hepatic failures, and organ transplants. The collection process of cryo is particularly challenging; due to fact to be processed into cryo units, the collected whole blood has to be shipped to the production facility and be processed within 8‐hours after collection. This tight 8‐hour time constraint between collection and production can only be satisfied with precision collection planning and extra courier services; which makes the collection for cryo units more costly than other products.
Study Design/Methods: The American Red Cross (ARC), in partnership with researchers from the Georgia Institute of Technology (GT), has developed a blood collection model to increase the amount of whole blood that can be processed into cryoprecipitate. After reviewing blood collecting and processing schedules, collection locations, and other factors, ARC‐Cryo subject matter experts together with GT researchers were able to analyze the problem structurally with several analytic/dynamic programming properties, and developed a near optimal solution algorithm or mathematical model.
Results/Findings: To facilitate implementation, a Decision Support Tool (DST) was developed to systematize the selection of the collection sites; determining when and from which mobile collection sites to collect blood for cryo production and how to schedule the courier services such that the collection targets are met and the total collection costs are minimized.
The implementation of the DST led to an increase in the number of whole blood units satisfying the tight 8‐hour completion time constraint for cryo production (capacity expansion). In particular, during the 4th‐Quarter of 2016, a blood processing region was able to process about 1000 more cryo units/month (an increase of 20%) at a slightly lower collection cost (cost avoidance), resulting in an approximately 40% reduction in the per unit collection cost for cryo.
Conclusion: By utilizing Operations Research toolkits, a mathematical model or near‐optimal algorithm could be developed to optimize the cryoprecipitate collection process, ensuring the time constraints and product consistency levels are achieved.
This interdisciplinary improving cryoprecipitate collections collaborative project has been selected as a Finalist on the 2017‐The Franz Edelman award, recognizing outstanding achievements and practices in Operations Research.
Figure 1.

AP60. [Color figure can be viewed at http://wileyonlinelibrary.com]
AP61
Inventory Management and Transfusion Practice before and after 7‐Day Apheresis Platelets
Sarah K Harm*
University of Vermont Medical Center
Background/Case Studies: The shelf life of apheresis platelet (AP) units stored in plasma may be extended from 5 to 7 days in the USA using an FDA cleared rapid test (RT). In August 2016, our hospital based transfusion service began using a RT on day 6 and 7 to routinely extend AP shelf life to 7 days. This report describes changes in platelet inventory management and transfusion practice six months following routine use of 7‐Day AP.
Study Design/Methods: Data were obtained for two study periods: September 2015‐February 2016 (pre‐implementation) and September 2016‐February 2017 (post‐implementation). The study periods were intentionally made to span the same months of the year due to seasonal variability in platelet transfusion rates in our region. The transition period from 5‐Day to 7‐Day AP inventory was excluded. The following data was collected for each study period: the total number of AP transfusion recipients, AP units transfused, expired AP units, AP units ordered ad‐hoc from suppliers, inpatient admissions, surgical volumes, and average length of stay.
Results/Findings: Data are shown in the Table. The number of AP transfusions decreased by 3% post‐implementation while inpatient admissions and surgical volume increased by 1% and 3%, respectively. The hospital length of stay was similar for both periods. AP inventory decreased by 36% post‐implementation and the outdate rate decreased from 29% to 15% (p<0.0001). Ad‐hoc ordering was not statistically different between study periods (p=0.10). The average number of AP transfusions per patient between pre‐ and post‐implementation periods was not statistically different (2.1 and 1.9, respectively, p=0.65).
Conclusion: Use of 7‐Day platelets decreased waste and helped reduce standing order volumes. Approximately one third of AP units underwent secondary bacterial testing prior to transfusion, thus increasing patient safety.
TABLE. AP61
| Pre‐Implementation | Post‐Implementation | |
|---|---|---|
| Total number of AP Units in inventory | 985 | 629 |
| Units ordered ad‐hoc | 174 (18%) | 99 (16%) |
| Total number of AP Units transfused | 660 | 642 |
| 6‐ and 7‐Day AP units transfused | n/a | 188 (29%) |
| Total number of AP Units expired | 290 (29%) | 96 (15%) |
| Total Inpatient Admissions | 13,798 | 13,895 |
| Surgical Volume | 6,827 | 7,025 |
| Average Hospital Length of Stay (days) | 3.0 | 3.17 |
AP62
Is Residual White Blood Cell Testing in Red Blood Cells Reliable Beyond the Manufacturer Recommended 48hours?
Joel Steele1, Kevin J Land*2, Hany Kamel3 and Ralph R Vassallo3
1Bonfils Blood Center, 2Blood Systems, 3Blood Systems, Inc.
Background/Case Studies: The FDA states in the “Guidance for Industry: Pre‐Storage Leukocyte Reduction of Whole Blood and Blood Components Intended for Transfusion” to test for residual WBC (rWBC) count within 48 hours after collection, or per the manufacturer's directions for the cell counting methodology. BD Biosciences states in their package insert to prepare and run samples within 48 hours following leucoreduction. Following an event that required an excessive number of rWBC confirmation testing, we hypothesized that testing samples using the BD LeucocountTM Kit would produce valid results when the test time exceeded the required 48 hours following leukocyte reduction.
Study Design/Method: A total of 8 red blood cell units were tested within 48 hours of leukocyte reduction using the BD LeucocountTM Kit within the Quality Control department at Bonfils Blood Center. Each unit exceeded the allowed rWBC count of 5 million, stayed within the upper linear limit of the testing assay (350 WBC/mcL), and resulted in an average WBC count of 51,950,730. These 8 units were properly stored for a total of 14 days following leukocyte reduction. On each consecutive day, a sample was removed from each unit and tested using the BD LeucocountTM Kit. The results for each consecutive day were compared to the original result that was tested within the required 48 hours following leukocyte reduction.
Results/Finding: Of the 8 units tested, 4 (50%) demonstrated a decrease in rWBC of 20% or more when tested on day 14 compared to the result tested within 48 hours following leukocyte reduction. When reviewing all results obtained, it was noted that 8 (100%) of the units tested on day 10 demonstrated a decrease in rWBC of less than 20% (an average % difference of ‐12%; range from ‐6% to ‐19%).
| D2 WBC/Unit | D2 | D3 | D4 | D5 | D6 | D7 | D8 | D9 | D10 | D11 | D12 | D13 | D14 | |
|---|---|---|---|---|---|---|---|---|---|---|---|---|---|---|
| Unit 1 | 53x10^6 | 100% | 102% | 98% | 100% | 93% | 93% | 92% | 94% | 91% | 86% | 80% | 81% | 80% |
| Unit 2 | 78x10^6 | 100% | 92% | 88% | 89% | 85% | 82% | 88% | 93% | 81% | 83% | 79% | 73% | 77% |
| Unit 3 | 9x10^6 | 100% | 109% | 97% | 101% | 89% | 89% | 100% | 104% | 93% | 91% | 73% | 86% | 91% |
| Unit 4 | 18x10^6 | 100% | 103% | 97% | 107% | 107% | 94% | 101% | 106% | 88% | 84% | 90% | 89% | 98% |
| Unit 5 | 13x10^6 | 100% | 103% | 88% | 91% | 99% | 92% | 100% | 95% | 83% | 79% | 82% | 80% | 91% |
| Unit 6 | 45x10^6 | 100% | 98% | 84% | 89% | 91% | 88% | 88% | 89% | 83% | 82% | 180% | 78% | 77% |
| Unit 7 | 100x10^6 | 100% | 90% | 86% | 90% | 83% | 84% | 82% | 80% | 88% | 75% | 77% | 72% | 71% |
| Unit 8 | 101x10^6 | 100% | 99% | 97% | 99% | 93% | 97% | 91% | 90% | 94% | 40% | 89% | 83% | 87% |
| Average | 52x10^6 AVG | 100% | 96% | 91% | 94% | 90% | 89% | 89% | 90% | 88% | 71% | 93% | 78% | 80% |
Conclusion: In this study, it was concluded that completing rWBC testing using the BD LeucocountTM Kit would yield reliable results when tested up to 10 days. During extenuating circumstances, extending the allowable timeframe to perform rWBC testing beyond 48hours may provide blood centers with a realistic window to assess the leukocyte reduction status of a large number of otherwise transfusible red blood cells.
AP63
Lipaemic Donations, to Transfuse or to Discard?
Maha Etman*1, Hala S Boules2, Reem Al Radwan3, Hanan Alawadhi2, Bedoor Dousery1 and Aziza Yousef1
1Kuwait Central Blood Bank, 2Kuwait central blood bank, 3Kuwait central Blood Bank
Background/Case Studies: Lipaemia is a naturally occurring phenomenon that may cause the appearance of blood products to be milky. Studies in the 1950s, identifies triglycerides (TG) as the lipids associated with lactescent samples. Lipaemia itself does not affect the safety of a product but might interfere with the ability to perform viral marker testing.
Kuwait Central Blood Bank (KCBB) is the only facility in Kuwait which is responsible for blood collection, testing, processing, and distribution.
The objective of this study is to evaluate the current policy of dealing with lipaemic donations to improve the performance of KCBB.
Study Design/Method: A retrospective study was done that include statistical analysis of number of tested and discarded units due to lipaemia in (KCBB) during the period from 2012 to 2016. During this time, units were discarded either due to gross lipaemia or in moderately turbid cases due to TG levels more than 200mg/ dL as derived from Piccolo Xpress chemistry analyzer insert instructions.
Furthermore, a new “rejection threshold” for lipaemic products will be implemented. This threshold represents the TG concentration above which viral marker testing for donor screening will be affected. In KCBB Abbott's Prism Assays are used for: HBsAg, anti‐HCV Ab, anti‐HIV Ab, anti‐HTLVI/II .
Results/Finding: Using data management system and file records in KCBB as regard discarding blood components due to lipaemia during the last five years (2012‐ 2016), it was demonstrated that number of discarded RBCs due to lipaemia during the whole period was 4892 units. Number of discarded different plasma, platelets, and cryoprecipitate components during the last two years due to lipaemia was 8546, 24, and 2 units respectively. The mean number of discarded RBC units of the five years of the study exceeds 50% of the tested ones.
Literature about guidelines on the management of lipaemic donations were reviewed in order to minimize donation loss, and establish an accurate rejection threshold for lipaemic donations. By reviewing sample requirements for viral marker testing in KCBB, the accepted level for TG in blood samples is below 1000mg/dL, and so the rejection threshold for lipaemia is level equal to or more than 1000mg/dL.
Conclusion: Many blood product units are discarded needlessly in KCBB due to lipaemia in the last five years (including 4892 RBCs, 8546 plasma products and 24 apheresis platelet units).
In an effort to reduce the waste of potentially lifesaving products, the rejection threshold for lipaemic products is recommended to be changed from 200mg/dL to 1000mg/dL which does not affect blood safety.
A follow up study is recommended after applying the new threshold to evaluate the new policy.
AP64
Logistical Management of the Incorporation of Pathogen Reduced Single Donor Platelets (PR‐SDP) into Inventory at a U.S. Tertiary Care Medical Center
Eric Gehrie*1,2, Rebecca Ross3, Debra Mraz3, Anne Baker3, Zenna Neal3, Melanie Champion3 and Edward L. Snyder2,3
1Johns Hopkins University School of Medicine, 2Yale University, 3Yale‐New Haven Hospital
Background/Case Studies: The approval of PR‐SDP by the FDA provided an opportunity to improve the safety of our platelet inventory across all patient demographics. We outline our approach and address issues we faced during the first 4 months of PR‐SDP availability.
Study Design/Methods: Our nursing education team provided presentations to the nursing and clinical unit support staff. A company‐sponsored trainer staffed sessions for the evening/night shifts on the clinical wards. Presentations to physicians were made by the blood bank medical staff. Information Technology personnel created a new product type in the blood bank computer system, tested the ABO/Rh truth tables, and ensured that billing codes were in place. The necessity for transiently supporting a dual inventory of PR‐SDP and conventional platelets led to consultation with the ethics committee and risk management, to confirm that PR‐SDP and conventional platelets (C‐PLTs) tested for bacteria (“safety measure” testing) could both be considered the hospital standard of care. We chose to not gamma irradiate any unit of PR‐SDP, consistent with the package insert.
Results/Findings: The ethics committee and risk management confirmed that informed consent was not needed for transfusion of PR‐SDP. PR‐SDP available from our blood supplier incremented monthly. Over the first four months of PR‐SDP availability, 777 PR‐SDP were transfused at our hospital (out of a total of 3286 platelets transfused). After 4 months of scale‐up, PR‐SDP were approximately 30% of inventory. Questions received during the nursing and medical conferences related to: the risk of bacterial contamination with C‐PLTs vs. PR‐SDP; toxicology of the PR process; scanning PR‐SDP labels into the electronic medical record; and the need to irradiate PR‐SDP. Our use of a “safety measure” addressed concern over bacterial contamination of C‐PLTs. Published PR‐SDP toxicology data comparing the content of psoralens in food products such as grapefruit (∼12mg per 100g) to the content in PR‐SDP (<1 ng per mL) addressed toxicology concerns. Nursing/IT allayed concern over scanning issues with a simple demonstration. Finally, we ensured that all parties were aware that FDA did not require irradiation of PR‐SDP. Presentations at the medical conferences were also used as an opportunity to provide transfusion‐transmitted disease training and information on platelet utilization. Company personnel did not present at medical or nursing conferences per institutional policy. No complaints were received following the PR‐SDP roll‐out despite the presence of a dual inventory.
Conclusion: Using an inclusive approach to staff training, PR‐SDP can be seamlessly added to the blood bank inventory.
AP65
Optimization of the Apheresis Collection Process: Improving the Platelet Supply Capability While Maintaining the Same Donor Population
Marie‐Pierre Cayer, Eric Ducas, Marie Joelle de Grandmont, Nathalie Dussault, Synthia Sauvageau, Isabelle Rabusseau, Luc Lévesque, Annie Jacques and Danny Brouard*
Héma‐Québec
Background/Case Studies: Ensuring platelet supply capability represents a challenge in terms of donor recruitment and inventory management operations. In September 2017, the apheresis collection process (ACP) was completely revised to increase the number of products per donation by maximizing the rate of double‐platelet donations (DPD). The process review has led to several changes, including the substitution of the pre‐donation platelet (PLT) count measurement before donation type allocation, in favor of the use of the donor's past donation records. Multiple processing steps were eliminated, and the evaluation of PLT concentration as a function of time, deduced from complete blood count (CBC) measurements, allowed the centralization of the analysis at the QC Department. Finally, introducing the concept of non‐optimal donations has led to an increase in the proportion of DPD.
Study Design/Method: At the donation centers, whole blood (WB) from 10 donors was collected in K3EDTA tubes. PLT concentrations were determined at the QC Department using the Coulter AcT 5 diff hematology analyzer (Beckman Coulter). Sample tubes were stored at 20‐24°C and measured at 24, 48 and 72 hours post‐collection. Single platelet donations (SPD) or DPD were collected using the Trima Accel. Units were pooled and split in ELP (Extended Life Platelet, Terumo BCT) storage bags to mimic SPD (250mL; n=8) or DPD units (500mL; n=4). PLT pools were stored at 20‐24°C under mild agitation for seven days except for DPD, which were split in two 250‐mL bags after 18 ± 1h. Samples were taken on days 1 and 7. pH, pO2 and pCO2, hypotonic shock response (HSR), extent of shape change (ESC), CD62p expression, ATP content, lactate and glucose concentrations were used as in vitroquality markers.
Results/Finding: PLT concentration as a function of time, determined from WB CBC measurements, showed no significant difference at 24h (247 ± 32 PLTx109/L), 48h (247 ± 27 PLTx109/L) and 72h (247 ± 32 PLTx109/L) post‐donation. DPD can be stored in the same collection bag for 24h after donation without any significant impact on PLT quality markers. PLT concentrations were within the manufacturer's acceptable limits (1141‐1526 PLTx109/L) before splitting. On day 1, lactate and pCO2 concentrations increased, and pO2decreased in DPD. However, these values normalize to those of control units at the expiration day.
Conclusion: This project was approved by Health Canada and implemented in our organization in March 2017. There are numerous operational and cost benefits from this process optimization initiative, without significant impact on safety and quality. Post‐implantation efficiency data will be compared to the targeted 12% increase in the targeted number of PLT units per donation ratio.
AP66
Phased Implementation of Pathogen‐Reduced Platelets in a Health System
Elizabeth S. Allen*1, Colleen Vincent2 and Patricia Kopko1
1University of California ‐ San Diego, 2American Red Cross
Background/Case Studies: Pathogen reduced platelets (PRP) provide improved safety compared to conventional apheresis platelets, but collection and manufacturing are complex. Early evidence shows only 40‐45% of double platelet collections meet requirements for pathogen reduction treatment.1 Blood centers need hospitals to implement PRP to start manufacturing, but hospitals may not wish to use PRP until they can provide the product to all patients. Scaling up manufacturing at the blood center and phasing in PRP across patient populations meets both parties’ needs. We evaluated this strategy at our university health system (transfusion volume: 9,500 apheresis platelets annually), which includes two hospitals (750 inpatient beds) and an outpatient cancer center.
Study Design/Method: Before initiation, approval and funding were obtained from the hospital quality council and administration, and stakeholder groups such as hematology/oncology were educated and consensus gained. Live training was provided for nurses in the outpatient cancer center (week 0) and the bone marrow transplant (BMT) ward (week 6). An e‐mail communication explained the change to all physicians and nurses. In Phase 1, we implemented PRP in the outpatient cancer center. These patients are immunocompromised and do not have access to the immediate advanced critical care of the inpatient environment should a septic reaction occur. In Phase 2, we expanded usage to include the inpatient BMT ward. In Phase 3, we lifted all restrictions so PRP could be used throughout the health system, with the goal to reach 100% PRP within 6 months.
Results/Finding: In Phase 1 (weeks 1‐6), we requested 31 PRP products weekly, based on typical usage in the outpatient cancer center. Our blood supplier provided an average of 23 PRP weekly (range 9‐33), and PRP constituted 44% of platelet transfusions in the cancer center. In week 2, excess PRP inventory required use of PRP in the inpatient BMT ward ahead of schedule, a practice which continued throughout Phase 1. In Phase 2 (weeks 7‐8), we formally expanded issuing of PRP to include the inpatient BMT ward and requested 91 PRP products weekly. Our blood supplier provided an average of 57 PRP weekly (range 44‐69), and PRP constituted 53% of platelet transfusions in the phased‐in areas. In Phase 3 (weeks 9‐10), we began issuing PRP throughout the health system. Our supplier provided an average of 70 PRP weekly (range 61‐78), and PRP constituted 43% of all platelet transfusions. Scaling‐up is ongoing.
Conclusion: Phased implementation of PRP by patient group prioritizes patients who stand to benefit most from the product, and allows time for the blood center to scale up manufacturing. Flexibility to use PRP in different areas is needed to accommodate variations in number of transfusions. Physicians, nurses, and staff have been receptive to the change, and no complaints have been received.
Reference: AABB, America's Blood Centers, American Red Cross. Comments regarding Docket No. FDA–2014–D–1814. April 12, 2017.
AP67
Platelet Waste Reduction and Improvement in Patient Care Using an Inter‐Hospital Platelet Sharing Program (Round Robin)
Susmitha Edappallatth*1, James Martone1, Jennifer Dikeman2, Nancy Nikolis1, Rakijah Galloway‐Haskins1, Arline Stein1, Lennart Logdberg1, Sherry Shariatmadar1, Alexander Indrikovs3 and Vishesh Chhibber1
1North Shore University Hospital, 2Long Island Jewish Medical Center, 3Northwell Health
Background/Case Studies: Maintaining adequate inventory of platelets without significant outdating and waste of product is a constant challenge for many institutions, especially for smaller community hospitals. Our Health System comprises 21 hospitals including smaller community hospitals (SCH) and larger tertiary care medical centers (TCMC). For several years, we have been using a limited internal process of platelet sharing between some of our institutions to successfully reduce platelet wastage. This encouraged us to analyze platelet usage throughout our health system and devise an expanded novel concept of platelet distribution, in partnership with our blood supplier that would allow us to maintain an inventory of 2 apheresis platelet (AP) units at our smaller community hospitals without significantly increasing platelet waste and the associated cost.
Study Design/Methods: A “Round Robin” (RR) transportation system for platelet delivery and pick up was strategically developed with the regional blood center to align with routine delivery of red blood cell (RBC) standing orders. An efficient delivery system was implemented so that the regional blood center would realize reduced supplemental and emergency deliveries of blood components to our hospitals. Platelets are transferred at the time of RBC standing order delivery based on a predetermined route schedule. Each day, 2 AP are delivered to the SCH and the previous day's platelets retrieved (if not transfused), packed in blood center transport boxes, and then picked up by the blood center driver. These platelets typically have a 48 hour shelf life remaining. The same process occurs at the next SCH on the route. All retrieved platelets from the SCH are delivered to the TCMC which is the last stop on the route. Thus, the SCH has adequate number of units available for regular transfusion and massive transfusion protocol.
Results/Findings: Review of our RR process revealed a significant benefit to our smaller community hospitals as we were able to routinely maintain an AP inventory for patients requiring urgent platelet transfusion. An additional benefit was further decrease in AP waste (Table 1) resulting in a cost savings of $50K. An additional cost savings of approximately $25K was noted due to decreased cost of emergent platelet transportation.

Conclusion: Our novel RR process of platelet distribution has resulted in improved platelet availability at our smaller community hospitals while maintaining the reduced level of AP waste at our health system from our previous platelet sharing process. We anticipate additional decreases in AP waste as we further streamline our process. With the trending merge of health delivery systems, we predict that other health systems will adopt similar processes to improve platelet availability and reduce waste.
AP68
Post Implementation Adjustments of Our Pathogen Reduction Process
Jacqueline Carlson*1, James R Stubbs1, Scott A Hammel1 and Manish Gandhi2
1Mayo Clinic, 2Mayo Clinic‐Rochester
Background/Case Studies: The implementation of Pathogen Reduction for Apheresis Platelets using Cerus® INTERCEPT System for Apheresis Platelets was a substantial endeavor encompassing many different areas. As with any process change, adjustments and modifications can occur along the way. After implementing 100% Pathogen Reduction Technology (PRT) for Apheresis Platelets, we made two additional adjustments to our sampling processes to ensure accurate labeling/categorization/branding of our final products.
Study Design/Method: Our PRT Validation consisted of 100 Apheresis platelet products. Each product was tested pre‐processing for white blood cell (WBC) content and platelet yield, along with post processing platelet yield. This data was used to calculate our yield and volume retention during processing. We anticipated products with preprocessing yields of 3.0, 3.1, and 3.3 x10¹¹ may end up below a 3.0 in the final storage bag and would need a post‐processing sample to ensure the product met criteria at ≥3.0x10¹¹ platelets.
Results/Finding: During the validation, we discovered one collection was not leukoreduced and two collections started at a 3.4 yield but ended with a yield below 3.0. These two discoveries led to adjustments in our PRT platelet process. With the WBC failure, we reviewed the WBC count on the Sysmex XE‐2100D preprocessing report to see if it would alert us to a potential WBC failure. The review discovered that 99 of 100 results were 0.00 or 0.01x10³/mcL with the exception being the WBC failure with a count of 0.29. Further monitoring of the WBC counts discovered a result of 0.04 which was tested on the ADAM r‐WBC for WBC count and determined to not be leukoreduced. We decided all Sysmex WBC results from the pre‐processing Sysmex report would be reviewed prior to processing and a WBC result of 0.03 will be tested on the ADAM to confirm a leukoreduced product. We also discovered 2 of 4 (50%) of the 3.4 preprocessing yields products ended with a post processing yield <3.0. We decided to increase the yields requiring post processing samples to include the 3.4.
Conclusion: We are continuing to sample all collections for a post processing yield so we can be confident that we are releasing products into inventory with a yield of ≥3.0x10⁶ platelets and to have enough data to accurately determine our volume and yield loss during processing
AP69
Predicting Daily Platelet Usage at a Large Academic Medical Center
Alexander Fenwick*1, Dennis Williams1,2, Duncan MacIvor1, Julie O'Brien1 and Leonard Boral3
1University of Kentucky, 2Kentucky Blood Center, 3University of Kentucky Medical Center
Background/Case Studies: The University of Kentucky Medical Center (UKMC), a large academic hospital with level I trauma center, is supplied with blood products by the Kentucky Blood Center (KBC) on a consignment agreement‐based contract. UKMC is KBC's largest consumer of blood products. As platelet usage can vary widely day to day platelet usage projections are provided to KBC by the UKMC blood bank, thereby allowing KBC to act accordingly with a given day's stock (i.e. import vs export). Daily platelet projections are based on phone calls asking clinicians working in high‐demand locations to estimate their needs. This process can be easily confounded by multiple factors and has undergone multiple adjustments to improve its accuracy.
Study Design/Method: Daily platelet projection forms from 9/16‐12/16 were retrospectively reviewed and compared to actual usage data over that same time. The prediction system used in the UKMC BB up to that time (estimated clinical need + 6) was evaluated for effectiveness based on: total number of days under‐predicted, number of days with large under‐prediction, average number of units under‐predicted, and average difference between prediction and usage. The prediction system was subsequently changed based on this data in 2017; the revised prediction method (estimated clinical need + 11) was then evaluated retrospectively using the same data sources covering 1/17‐4/17 and then compared to the prior method.
Results/Finding: The average number of platelets transfused from 9/16‐12/16 was 18.2 U/d with a standard deviation of 5.3 U/d; the predicted amount was 13.7 U/d. The difference between the predicted amount and the number of units used was ‐4.5 U/d. 79% days (23d/month) were under‐predicted (average: 6 U/d). 17% of days (10) were under‐predicted by ≥10 U (average: 12 U; max: 15 U (4x)).
The average number of platelets used from 1/17‐4/17 was 17.5 U/d with a standard deviation of 4.4 U/d; the predicted amount was 18.3 U/d. The difference between the predicted and units used was a +0.8 U/d. 38% days (11d/month) were under‐predicted (average: 3.5 U/d). One day (1%) over this period was under‐predicted ≥10 U (11 U).
Conclusion: Review of clinical platelet usage over this time identified a relatively stable average daily clinical demand. Adjustment of our prediction system to ensure that no, or as few as possible, days were projected for less than that average has markedly reduced catastrophic shortages (17% à 1%), reduced the number of days under‐predicted (79% à 38%), and decreased the discrepancy on those under‐predicted days (5.9 U à 3.5 U). These improvements in estimating usage allow for an increased ability to handle unpredictable events without suddenly straining KBC's supply flexibility or severely limiting UKMC clinical settings.
AP70
Rapid Implementation of Zika Virus (ZKV) NAT Blood Donor Screening
Joan Dunn Williams*1, Maria Noedel1, Nancy Haubert1, Kenneth Hudson1, Larry Morgan1, Robert Shaw1, Tracy Fickett1, Jamie Jue1, Valerie Winkelman1, Sally Caglioti1, German Leparc2,3 and Phillip C Williamson1
1Creative Testing Solutions, 2Creative Testing Soutions, 3OneBlood
Background/Case Studies: On 08/26/16, FDA issued a guidance document for “Reducing the Risk of ZKV Transmission by Blood and Blood Components”. In response, a plan was implemented for mandatory ZKV testing for all Clients with locally acquired mosquito‐borne cases of ZKV within 4 weeks; nationwide in 12 weeks. This organization performs testing for Clients (blood centers, hospitals) across the country. We report on 1 of 2 manufacturers' (Sponsor) provided Investigational New Drug (IND) protocols. A single Project Management (PMO) system was used to control all required processes.
Study Design/Method: Project focus included: clinical trial requirements, Client onboarding, lab operations (Labs). Our objectives were to implement ZKV testing for 44 Clients within 4 weeks, and an additional 21 Clients within 12 weeks. To minimize the impact to Labs a staggered implementation was used with tracked/streamlined communications from stakeholders: Vendors, Institutional Review Board (IRB), IT (client and lab based), Client Services and Labs.
Results/Finding: Clinical trial requirements increased the complexity of implementing an unlicensed test. Documents included donor notification, informed consent, protocol training, staff certification, deviation management, and result reporting. Multiple IRB documents were required. To ensure accuracy in IND commitments a Principle Investigator was assigned to Labs with Client sub‐investigators. Deliverables were multiple including Client requirements, Vendor responsibilities and Labs. Client onboarding included confidentiality agreements between Client and Sponsor. An immediate ZKV based webinar provided materials and understanding of Sponsor protocol, lab test system, and Client/donor based responsibilities. To facilitate and ensure effective communication, twice weekly conference calls were held. Clients sent questions which were facilitated by Labs and directed to Sponsor. Specific to Clients were IRB documents, IT updates/validation for ZKV test ordering and result receipt. Labs were multifaceted: vendor instruments, assay materials, package inserts, staff training. Assessments included: ZKV sample volume, throughput, instrument capability/capacity. Work requirements included Vendor installation, equipment, assay and reagent qualifications, staff training, competency assessments, result reporting. All Clients were provided with ZKV testing within required timeframes.
Conclusion: The success in meeting a rapid implementation of ZKV testing was largely due to a centralized PMO system which provided a controlled process for Sponsor, Client, Vendor and Labs. Within lessons learned strength was found in a multi‐Client onboarding process. A weakness was in understanding instrument test volume capacity throughput which was exceeded during the 4‐week period but overcome during the 12‐week cycle.
AP71
Red Blood Cells Baby Units Traceability and Discard in Kuwait Central Blood Bank and Five Hospitals
Marwa Moemen Al Deeb*1, Hala Samuel Boules1, Fatemah Saleh Al Matroud1, Rabab Hussien Ali Dashti1, Hanan Alawadhi2 and Reem Al Radwan3
1Kuwait Central Blood Bank, 2Kuwait central blood bank, 3Kuwait central Blood Bank
Background/Case Studies: Ill children are more likely to receive Red Blood Cells (RBCs) transfusion than any other patient age group. RBCs are the component most often transfused during neonatal period. Small volume aliquots are used to limit donor exposure, prevent circulation overload and decrease donor related risk. Traceability is the ability to trace each individual unit from donor to recipient or disposal. Blood component should be fully traceable from collection to final disposition. The Kuwait Central Blood Bank (KCBB), is preparing baby units and distributing it to all hospitals all over the country. KCBB, being accredited by the American Association of Blood Banks (AABB), is following the AABB's regulations in tracing every component.
Study Design/Method: This is a retrospective study to assess final deposition and the percentage of discard of prepared packed RBCs baby units in the KCBB and five hospital blood banks (HBB). Also, to assess the levels of traceability as a reflection of the improvement in the efficient use of these blood products.
Methods: A total of 3000 RBCs baby units were randomly chosen to be traced to their final deposition from the year 2012 till 2016. Half of them (1500 units) were traced in KCBB. Tables showing the numbers of the chosen units were distributed to the five governmental HBB (60 units for each year of the study period).
Results/Finding: Preliminary results show that the tracing of RBCs baby units in the KCBB is 100% efficient. Results from other hospitals are under process. Statistical analysis of the traceability will be done as soon as the data is collected. The study will analyze the usage of the baby units in different departments and the percentage of discarded units.
Conclusion: The traceability of RBCs baby units in the KCBB is excellent, this is due to good management and training of the working staff and the use of an electronic system in registration and issuing. Most of the Kuwait governmental hospitals are using electronic systems, so the traceability should be up to the recommended levels.
The percentage of discard of the baby units in the hospitals is very high. This may be due to the practice of using fresh blood (<5 days of donation) and the reservation of the baby units of the same donor to the same baby to reduce the hazards of multiple donor exposure.
The creation of a national policy for using RBCs baby units is highly recommended to reduce the discard of such units.
AP72
Reduction in Unnecessary Use of Type O‐Negative RBCs in a Level I Trauma Center
Emma J Sorkin1 and Jessica Lynn Jacobson*2
1The Brearley School, 2Bellevue Hospital‐NYULMC
Background/Case Studies: Our hospital's percent of O‐negative RBCs purchases (11.2‐13.3%) has been much higher that of our supplier's customer average (9.3‐9.9%). Our hospital is a level I trauma center serving a diverse predominately non‐Caucasian population. Historically we stocked our trauma blood bank monitored refrigerator with 2 O‐negative RBCs. Trauma requested that we stock additional RBCs to be able to initiate a MTP for multiple patients at the same time. Believing that most of our trauma patients are male, elderly, or Rh‐positive, we agreed add 2 type O‐positive RBCs to the stock. Rules for determining which units to use were established. O‐positive RBCs are to be given to 1A) all adult males (AM), 1B) women of non‐childbearing age (WNCBA), and 1C) if both O‐negative RBCs were used but not yet restocked, and O‐negative RBCs are to be given to 2A) women of childbearing age (WCBA) and 2B) children until the patient's ABORh type are determined. We sought to assess the impact of this change on our usage and purchases of O‐negative RBCs.
Study Design/Method: All patients issued emergency release trauma RBCs following the addition of O‐positive RBCs were assessed. Adherence with the rules was judged. Overall O‐negative RBC purchases were analyzed and compared to historic monthly purchases.
Results/Finding: From 3/2/17 to 4/5/17, 16 patients received at least 1 (range 1‐4) RBCs from the trauma refrigerator. MTP was activated in 56.3%. Patients received a mean of 8.5 RBCs (range 1‐38), 4.3 plasmas (range 0‐18), and 1.2 SDPs (range 0‐4) in the first 24 hours. 93.4% of patients were Rh‐positive. 50% of patients were O‐positive, 37.5% were A‐positive, 6.3% were A‐negative, and 6.2% were B‐positive. 62.5% were male. 12.5% were WCBA. The mean age was 63.8 (range 25‐93) years. 75% were given to trauma patients and 25% to emergency medicine patients. 68.8% patients definitely required emergency trauma RBCs. No patient who should have received O‐negative was given O‐positive RBCs. 17 O‐positive RBCs were appropriately given to AM and WNCBA. 12 O‐negative RBCs were given although only 2 patients met the criteria to receive O‐negative RBCs (2 WCBA). 79% of O‐negative RBCs were used inappropriately. Quarterly O‐negative RBC purchases averaged 55 units in 2015 and 2016. In 3/2017 we purchased 17 (30.9%) fewer O‐negative RBCs without adversely impacting on our daily O‐negative inventory par level.
Conclusion: Stocking O‐positive RBCs saved 17 O‐negative RBCs for patients who require them and enabled the lab to purchase 30.9% fewer type O‐negative RBCs in March 2017. If all trauma RBCs were issued according to the rules, only 3 of 29 units (10.3%) would have needed to be O‐negative. The addition of O‐positive RBCs to our trauma refrigerator will enable us to markedly reduce our purchases of O‐negative RBCs.
AP73
Saving Apheresis Platelets through Use of Verax Point of Care Testing
Jennifer Rhamy*1 and Rebecca Wride2
1St. Mary's Regional Blood Donor Center, 2St. Mary's Regional Medical Center
Background/Case Studies: Our rural hospital‐based blood center serves 17 hospitals and a diverse patient population including acute trauma. Because of the varying need for platelet products (varies between 0 and 8 per day in 2017), we investigated the use of the Verax point‐of‐care test to better manage our valuable inventory.
Study Design/Methods: Verax testing was implemented on September 1, 2016. Testing followed manufacturer directions. Products were tested before expiration on days 5 and 6. The total products tested on days 6 and day 7 were tabulated along with the number of products expired and transfused. We also calculated the number of false positive results. The study traced all products through mid‐March 2017.
Results/Findings: A total of 339 products were tested. Fifteen units (4%) had a false positive result and could not have their life span extended. Of the fifteen reactive units, two repeat donors were identified and their charts were marked to not test subsequent donations. Cross‐reactive antibodies were identified in all 15 by the vendor and none were true positives by re‐culture. Of the 324 units that were successfully tested, 200 were tested again on day 6 for use on day 7(62%). There were 166 platelets transfused (51%) and 158 expired after day 7 (49%).
The cost to test the products including controls was $12,970 and our calculated cost to produce 324 products would be $77,436. If we had needed to import products to meet needs, the cost would be roughly $91,300 without shipping costs which are estimated at $14,815.50. We averaged 40 expired platelet products per month (range 6‐67) before Verax testing and 26 (range 9‐40) after implementation.
Conclusion: Using Verax point‐of‐care testing saved 166 platelet products from discard. The cost savings were $93,145.50 from importing and $64,466 from producing a replacement for those 324 products. The average discard rate per month went from 40 to 26 after Verax implementation. Extending platelet shelf life to 7 days more than paid for the cost of testing and ensured products were available for patients who needed them.
AP74
Secure Text Messaging in Transfusion Medicine: Can Texting Decrease Wastage?
Melanie Estrella* and Elsie Lee
George Washington University Hospital
Background/Case Studies: Secure text messaging in hospital settings allows for quick, easy, and HIPAA compliant communication between members of patient care teams. It works on a mobile phone or computer, and provides read‐receipt confirmation and a temporary record of team communications. Secure texting has potential to be a useful management tool in Transfusion Medicine in reducing blood product wastage. For example, it provides a relatively low‐burden means for busy clinicians to provide feedback to the Transfusion Service about scenarios of potential wastage. This information can be used to identify areas in which management strategies could be developed. It also allows for personalized educational opportunities between clinicians and the blood bank about usage guidelines and how to reduce future wastage. The goal of this study is to use secure texting to investigate wastage, evaluate the responses from clinicians, and evaluate the potential effects on reducing wastage. It is hoped that the results will identify secure texting as a useful management tool in Transfusion Medicine. Study Design/Method: Wastage records that were investigated without the assistance of secure texting from July to December 2016 were reviewed to identify the most common scenarios of preventable blood product wastage. Wastage records from January to April 2017 were reviewed, and wasted products that were considered preventable were investigated using secure texting to communicate with the ordering physician. Results/Finding: For 2016 data, 129 units were investigated without the use of secure texting. Of these, 118 units were identified as preventable wastage, and 11 wasted units were considered beyond the control of the clinician. The categories for preventable wastage were defined as follows: 1) Product not released after procedure/ or when patient stabilized (42) 2) Product returned outside of appropriate temperature range (40) 3) Clinician unaware product was assigned (36). Thus far in 2017, wastage records have identified 31 units of preventable wastage. Secure texting was used by a Transfusion Service physician to investigate. Twelve responses provided useful feedback for future management strategies, 11 responses thanked the Transfusion Service for the information, and in 8 instances, the message was read with no reply. Conclusion: Secure text messaging has the potential to improve communication in Transfusion Medicine. It is easy to use, HIPAA compliant, and helps identify strategies for reducing wastage by improving communication and allowing personalized educational opportunities between ordering physicians and the Transfusion Service.
AP75
Sequence of Reagent Adding for Cryopreservation Freezing Solution
Guoling Chen*, Xu Zhao, Andrew Tiss, Sasha Turner, Devin Emerson, Manijeh Shemirani, Sharon Novak, David Garvin, John Eng and Wanxing Cui
MedStar Georgetown University Hospital
Background/Case Studies: Dimethyl sulfoxide (DMSO), plasmalyte‐A (Plas‐A), Human Serum Albumin (HSA) are widely used to prepare cryopreservation freezing solution. Some use autologous plasma instead of Plas‐A and HSA. This study is to identify the choice of reagents and the optimal sequence of adding these reagents when making freezing solution.
Study Design/Methods: Materials: 99.9% DMSO, Plas‐A, 25% HSA, autologous plasma extracted. Containers: transfer pack (bag) and polystyrene tubes.
The Freezing Solution recipe used in this study is (volume ratio) 99.9%DMSO: Plas‐A : 25%HSA=1:2:2.
Plas‐A and HSA are kept at room temperature (20‐25°C, RT) and refrigerated at 4°C, plasma at RT (to simulate the end‐of‐centrifuge temperature), DMSO at RT (due to high freezing point 18.5°C).
Different combinations of the reagents choice, storage temperature, adding sequence, are tested with photo taken. Total 14 tests. At least 10 minutes cooling after DMSO, before adding the next reagent.
Results/Findings:
See table:
(1) After directly adding 99.9% DMSO alone to bag, the bag turned from transparent to white, so DMSO should not add first.
(2) In tube, autologous plasma first, DMSO next, powder‐like precipitates.
(3) In tube, DMSO first, HSA next, precipitated instantly, a layered appearance.
(4) & (5) In tube, Plas‐A first, then HSA, DMSO at last, precipitates formed; RT Plas‐A and HSA combination formed a thicker precipitate than those kept at 4°C.
(6)&(7) In tube, HSA first, DMSO next: precipitation formed heavily, sculpture shape. Precipitation in the 4°C group is slightly milder/slower than RT group. So HSA should not be added first.
(8)&(9) Trace of HSA(<1ml) was mixed into the Plas‐A bag (500ml). In tube, such “HSA‐contaminated” Plas‐A was added first, then DMSO, small fragments of precipitates formed, so DMSO should not add last.
(10)‐(14) In tube, Plas‐A first, from RT or 4°C, then DMSO, then either plasma or HSA, all are clear.
Conclusion: The ideal sequence is to add Plas‐A first, then DMSO, after cooling down sufficiently, add 25%HSA or plasma at last.

AP76
Statistical Model Predicting Hospital‐Wide Daily Platelet Usage to Minimize Wastage
Leying Guan, Xiaoying Tian, Saurabh Gombar*, Allison Zemek, Robert Tibshirani and Tho Pham
Stanford University
Background/Case Studies: Maintaining a robust blood product supply is an essential requirement to guarantee optimal patient care for all major hospitals. However, daily blood product use is difficult to anticipate. Platelet products are the most variable in daily usage, have short shelf lives, and are also one of the more expensive products to produce, test, and store. Due to the combination of absolute need, uncertain daily demand, and short shelf‐life, platelet products are also frequently wasted due to expiration. Sophisticated data analysis has the potential to accurately predict hospital wide platelet needs and therefor reduce wastage.
Study Design/Method: We have investigated platelet usage patterns at our institution, and specifically interrogated the relationship between platelet usage and aggregated hospital‐wide patient data over a recent consecutive 29‐month period. Using a convex statistical formulation, we have found that platelet usage is highly dependent on several factors. These include day of week, number of abnormal CBC, location‐specific hospital census data, and other less important factors. We exploited this relationship to develop a mathematical model to guide collection and ordering strategy.
Results/Finding: This model minimizes waste due to expiration while never allowing for a shortage; the number of remaining platelet units at the end of any day never drops below 10 in our model. Compared with historical expiration rates during the same period, our model reduces the expiration rate from 10.5% to 3.2%. With an annual platelet usage of approximately 13,000 units, this reduction equates to approximately 950 units saved from expiration annually. Depending on platelet pricing in different regions, this accounts for annual savings between $450,000 to $650,000, per institution.
Conclusion: To our knowledge our research is the first such use of hospital wide data to inform real‐time donor recruitment strategies based on anticipated patient demand.
AP77
Thawed Plasma Implementation: Signficant Cost Savings and Decreased Plasma Wastage
Morvarid Moayeri*1, Russell Thorsen1, Rosaline Ma1, Antonio G Insigne1, Amy DeCourten1, Florence Panganiban1, Patricia McKean1, Cyril Jacquot2, Sara Bakhtary1 and Ashok Nambiar1
1UCSF Health, 2Children's National Medical Center
Background/Case Studies: Plasma (FFP, PF24, PF24RT24) stored at 1‐6C outdates 24 hours after thawing. If collected in a functionally closed system, it may be relabeled as Thawed Plasma (TP), extending expiration to 5 days from the thaw date. Although coagulation factor levels decrease over this period, they remain above hemostatic levels. As TP can be safely used for the vast majority of patients requiring coagulation support, we implemented use of TP in our multi‐site tertiary care system, with the aim of decreasing costs and minimizing wastage.
Study Design/Methods: The massive transfusion protocol at our instiution already allowed the use of group AB TP. Following a review of literature and practice at other large centers, the Transfusion Committee extended the approval of TP to all patients. Neonates (<4 months), patients undergoing plasmapheresis and those with factor deficiency or other disorders for which concentrates are not available continue to be supported with thawed FFP. We designed and deployed a dynamic blood product inventory dashboard monitor to facilitate easy inventory look up, identify plasma units nearing expiration, and assist with rotation of thawed inventory between different transfusion service hospital sites to minimize wastage. Data on number of plasma units transfused (TR) or outdated (OD) was obtained from LIS reports on disposition of units.
Results/Findings: Plasma disposition over 16 months prior and 9 months after implementation of TP was reviewed (table). Before implementing TP, 36% of all thawed plasma units were wasted. This decreased to 14% after implementation, a 60% reduction in likelihood of a unit being wasted. Mean number of plasma units wasted/month decreased by 332 (473 to 141), a monthly savings of $19,247 ($230,961/year) in blood procurement costs. We also noted a significant decrease (not quantified) in technologist time and effort, as less time was expended on the following: thawing units, printing inventory reports and reporting/record‐keeping for discarded units.
Conclusion: In many large facilities, providers frequently order more plasma units than are ultimately transfused, leading to high plasma wastage rates due to limited (24 hr) shelf‐life. TP has an extended shelf‐life, and can be used interchangeably with FFP and PF24 for most patients. Implementing TP in a multi‐site tertiary health care system resulted in sustained decrease in plasma wastage, saving thousands of dollars and helping conserve a precious resource.
TABLE 1. Plasma disposition statistics before and after TP implementation
| BEFORE (16 mo.) | AFTER (9 mo.) | |||||
|---|---|---|---|---|---|---|
| Total | Mean ± SD | Median (Min‐Max) | Total | Mean ± SD | Median (Min‐Max) | |
| # Transfused (TR) | 13727 | 858 ± 109 | 802 (725‐1016) | 7618 | 846 ± 66 | 823 (769‐959) |
| # Wasted (OD) | 7569 | 473 ± 56 | 481 (393‐563) | 1271 | 141 ± 29 | 137 (95‐183) |
| % Wasted (OD/TR+OD) | 35.5 | 35.7 ± 4.0 | 36.1 (29.2‐41.0) | 14.3 | 14.3 ± 3.0 | 14.2 (9.2‐18.9) |
AP78
The Merging of Immunohematology Reference Lab's (IRL) Inventories‐ Using Technology to Create Advanced Search Functions
Alexander Delk1 and Richard Gammon*2
1OneBlood, 2Oneblood, Inc.
Background/Case Studies: Immunohematology reference labs (IRLs) must maintain diverse inventory of antisera to aid in antibody identification, antigen type RBC units, and meet regulatory requirements. When our current organization was established, two IRL sites had independent inventory management systems. Although the purpose of maintaining the antisera inventory was the same, organization, storage, & access to instructions for use (IFUs) were not. Our IRL developed a synergistic method to organize and store antisera coupled with in‐house designed custom Excel spreadsheet to organize and search antisera and view IFUs.
Study Design/Method: A list of similarities and differences was constructed. Best practices of both methods were identified. We determined that our antisera could be broadly classified/organized into two main categories: rare and bulk for screening. Sequential lab assigned numbers were given to antiserum for each category: S (rare Sera) and B (Bulk sera). A dynamic/static freezer box storage system that was inter‐box static and intra‐box dynamic was determined to be best option to combine two inventories while conserving elements of each allowing for library growth. Antisera assigned to a box remained in that box, but may be moved within the box. The box itself may be moved among freezers. To track boxes, location and movement within the box, a custom Excel spreadsheet was created. Its location tracking feature allowed for two different storage methods to function in one spreadsheet. The spreadsheet had a tab for S and B antisera categories. ABO group, desired and unwanted antibodies filters allowed quick search for appropriate antisera. The spreadsheetalso had hyperlinks to scanned IFUs.
Results/Finding: Sequential lab S and B numbers were assigned to new additions using a dynamic/static storage system. An Excel spreadsheet with scanned IFUs (hyperlinks) was used. Pre‐merger systems, it took on average 5‐8 minutes to choose an antiserum and obtain the appropriate IFU. Post‐merger system was reduced to on average 2‐5 minutes. (Table)
Conclusion: The merging of two IRL's antisera inventories resulted in a need for innovation to create an inventory management system with an advanced search function and hyperlinked IFUs. This process saved valuable technologist time and organized the antisera more efficiently.
| IRL 1 | IRL 2 | Merged IRLs | |
|---|---|---|---|
| Lab ID# | Sequential Lab Assigned | Source* Number | Sequential Lab Assigned |
| Storage Arrangement | Dynamic | Static | Dynamic /Static |
| IFUs | Accessible by hyperlink | Manual Card | Accessible by hyperlink |
| Primary Antisera Listing | Access Spreadsheet | Paper Record | Excel Spreadsheet |
| Number of Unique Antisera | 218 | 496 | 714 |
Number assigned to patient or donor (e.g., medical record number, donor ID number)
AP79
Transfusion Service Dashboard: How to Build and Deploy an in‐House Tool for Managing Inventory
Russell Thorsen, Peter Suslow, Rosaline Ma, Elizabet Lomeli, Sara Bakhtary, Morvarid Moayeri* and Ashok Nambiar
UCSF Health
Background/Case Studies: Although data analytic tools greatly aid blood inventory management, laboratories may lack resources to access this technology. We used in‐house skills to design and deploy a fully automated, dynamic, web‐based, multi‐site Transfusion Service (TS) electronic dashboard.
Study Design/Method: Dashboard uses Hyper Text Markup Language (HTML), Cascading Style Sheet (CSS), and Hypertext Preprocessor (PHP). Data is extracted in real‐time from Sunquest (v7.3) Laboratory Information Systems Database (InterSystems Cache). The webpage that delivers data to client is distributed via Microsoft Group Policy shortcuts; webserver is hosted internally at our center and data secured both at rest and when in transit to the client workstations (Secure Socket Layer certificates).
Results/Finding: Laboratory Informatics and TS collaborated to build the dashboard over 6 weeks. Prototypes were tested by our technologists. Their feedback helped make the tool user‐friendly and integrate seamlessly with workflow. Dashboard data was validated before go‐live in 2016. Dashboard is accessed via a desktop shortcut and also displayed on large monitors in the lab. Data refresh automatically every 2 min. Webpages are completely customizable and afford flexibility for updating pages on the fly, as well as capability to run them against a test environment. Five different tabs provide site‐specific information. The ‘Product Inventory’ tab displays the following variables for RBC units: ABO/Rh, CMV status and units awaiting ABO retype. The Children's Hospital dashboard provides more details for RBCs: age < 5 days, divided units, and expiration time of washed units. Pages also display units required to replenish inventory, with a color code scheme to alert Staff. For platelets, ABO/Rh and CMV status are shown and for plasma and cryoprecipitate, ABO type is displayed. The ‘Units Available’ tab displays unit number, component type, ABO/Rh, expiration date and time. Different colors display units expiring in > 24 hours, < 24 hours and < 10 hours and a flashing display alerts Staff to units expiring in <1 hour. Expired units continue to flash until they are removed from shelf and their status updated in our database. ‘Units Allocated’ tab includes truncated patient name (to protect privacy), unit number, component type, allocation and expiration date/time, and time since allocation, with a flashing alert for units expiring in < 4 hours. The XM/HLA Platelets tab provides patient names and status of units allocated. A ‘TRXN/XMPLAT’ tab lists pending transfusion reactions and platelet cross match reports. Dashboard eliminated the printing (several times/shift) of lengthy computer‐generated reports, simplified thawed plasma inventory management and helped decrease plasma wastage (from 34% to 14%).
Conclusion: Using in‐house talent and minimal capital expenditure, we designed and implemented a dynamic web‐based dashboard for managing blood product inventory across a multi‐site transfusion service. The dashboard is stable, customizable and requires little maintenance. Initially built to optimize inventory display for thawed plasma implementation, the dashboard was expanded to include all allogeneic blood products. Over the past year, this tool has replaced manual processes for monitoring and rotating inventory and directly helped decrease plasma wastage.
AP80
Use of Deglycerolized Red Blood Cells for Hospital Transfusion Service Inventory Management
Ronnie L. Hill*, Jason Corley and Lizabeth Ostiguin
US Army
Background/Case Studies: Regional blood shortages have been documented across the United States during the winter holiday timeframe. Deglycerolized Red Blood Cells (DRBCs) have been shown to be an effective alternative though more expensive to manufacture. This study looks into the fiscal and inventory efficacy of using DRBCs to meet the needs of transfusion services during times of blood shortage.
Study Design/Method: On three separate occasions, a medium sized DoD donor center used its frozen blood inventory to produce type O DRBCs to meet the needs of two regional transfusion services. All frozen red cells were manufactured by an offsite facility with the Haemonetics ACP‐215 using the low glycerol (40%) freezing method and frozen at ≤ ‐65°C within six days of collection. Thawing occurred in a 32°C water bath in the following order: 7 O Positive and 1 O Negative on 3 January 2017; 7 O Positive and 1 O Negative on 7 February 2017; and 8 O Negative on 22 February 2017. Deglycerolization occurred on site using the ACP‐215 with all units passing internal QC requirements. DRBCs were shipped the same day to a hospital transfusion service, allowing for 13 days of shelf life prior to expiration.
Results/Finding: During the three events, all supported transfusion services and the blood center were below minimum inventory requirements for standard type O red blood cells (RBCs). O Positive RBCs were only available through NBE at $240‐280 and had the limitation of arrival on the next business day. Collection and processing time of liquid RBCs takes approximately two days including: donor screening, phlebotomy, component processing, testing, and labeling. DRBCs cost the DoD on average $400 per unit to produce and distribute. DRBCs have a shorter shelf life, 14 days versus the 21+ days for other RBCs, but are washed during deglycerolization and thus produce fewer transfusion reactions. One tech can operate up to four ACP‐215's and deglycerolize four units at a time. In January and February 2017, it took one tech four hours per iteration of eight units to include thawing, labeling, and packing for shipment.
Conclusion: While not as readily available as traditional RBCs, DRBCs can be an effective product to bridge the inventory gap when small numbers of units are needed due to reduced inventory. Collection and processing of whole blood into components takes approximately two days, but can produce greater numbers of units in that timeframe. Based on this, DRBCs can be ready faster than freshly collected units of blood. There is an increased cost associated with manufacturing FRBCs which is compensated for by the longer available shelf life of 10 years. Having a small contingency supply of frozen red cells and deglycerolization equipment has been effective on three occasions in ensuring availability of type O red blood cells for hospital transfusion services.
AP81
Validation of a Human Anti‐Tetanus Toxoid Immunoglobulin Assay Performed on the Abbott c8000
Izekial Butler*1, Karen Leighton1, Scott Jones1 and Rachel Beddard2
1QualTex Laboratories, 2BioBridge Global
Background/Case Studies: Plasma fractionators require anti‐tetanus quantitative testing to be performed on plasma samples collected from individual donors or plasma production pools. This testing serves as a quality control test and helps estimate the antibody potency of the product. The Binding Site, Human Anti‐Tetanus Toxoid Immunoglobulin Liquid Reagent Kit is for use on a turbidimetric analyzer. The aim was to optimize and validate the Human Anti‐Tetanus Toxoid Immunoglobulin Liquid Reagent Kit for use on a photometric analyzer.
Study Design/Method: Experiments were performed in order to determine the optimal amount required of reagent buffer and latex reagent from the anti‐Tetanus Toxoid immunoglobulin kit utilizing the Abbott c8000 instrument. Precision of the new assay parameters was determined by testing 10 replicates of a panel of samples at three concentrations of tetanus antibody in a single testing run. The panel samples were created by spiking appropriate amount of a WHO tetanus antibody standard into Sodium Citrate plasma. Accuracy was determined by testing a series of samples ranging from 1 IU/mL to 60 IU/mL of tetanus antibody. The samples for the accuracy study were created by diluting an appropriate amount of a WHO tetanus antibody standard with sample diluent from the reagent kit. Linearity regression was determined by using the accuracy study values within the range of 2.0 to 45.0 IU/mL. Stability of samples was determined by testing samples stored at 2‐80C and ≤ ‐200C in triplicate at various time intervals.
Results/Finding: The %CV for the optimized anti‐tetanus assay for all antibody levels determined in the precision study varied from 1.2855 to 1.3142. So, precision was acceptable since the %CV for all samples tested was ≤ 5%. The mean values for the samples tested in the accuracy study were all ±10% of the expected value which was much lower than the acceptance criteria which was ±15% of the expected value. The linearity of the assay was acceptable with a R2 ≥ 99.0%. The linearity study established that the known tetanus concentration was a statistically significant predictor of the observed concentration. The sample stability studies demonstrated the ability to quantitate tetanus antibody concentrations in samples stored up to 14 days at 2‐80C and up to 1 month at ≤ ‐200C.
Conclusion: The data presented shows the successful optimization of the Human Anti‐Tetanus Immunoglobulin Reagent Kit for use on a photometric analyzer. Validation studies of this optimized assay demonstrate excellent accuracy, precision and linearity using samples stored for 14 days at 2‐80C and stored up to one month at ≤ ‐200C.
Quality Management
AP82
A Deep Dive Audit of Intravenous Immunoglobulin Use for immune Thrombocytopenia: Is Its Use Inappropriate?
Jiajia Liu*
University of Toronto
Background/Case Studies: Intravenous immunoglobulin (IVIG) is a generally safe and effective therapy for immune thrombocytopenia (ITP) but is only suggested for scenarios when a rapid increase in platelet count is desired or as first line therapy if steroids are contraindicated. Due to concerns regarding adverse effects, cost and resource availability, an IVIG request form was implemented in our jurisdiction in 2010 to track utilization and appropriateness. A recent audit of these request forms from four academic institutions found a lack of compliance with form requirements and inadequate documentation of efficacy which led the authors to conclude that the use of IVIG was broadly inappropriate (Shih etal, 2017). As such, we aimed to conduct an extensive chart review of patients who received IVIG for ITP at our institution to assess appropriateness of use.
Study Design/Method: We conducted a retrospective chart review of all patients with ITP who received IVIG in our institution from April 1, 2014 to March 31, 2015. Local research ethics board approval was obtained.
Results/Finding: 40 patients received IVIG for ITP at SMH over the study period for a total of 76 unique IVIG infusions. The most common indications for IVIG within currently accepted guidelines were: active bleeding (13, 17%), pre‐operative or antepartum care (22, 29%), a platelet count of less than 10 and contraindication to corticosteroids (8, 11%). Additional indications that still fell within accepted guideline recommendations included: patients with arterial/venous thromboembolism or risk thereof requiring initiation of antithrombotic therapy; and patients requiring myelosuppressive chemotherapy. Indications that fell outside of guidelines included: use of IVIG as a diagnostic challenge where the etiology of thrombocytopenia was unclear and use prior to international travel for patients with difficult‐to‐treat chronic ITP despite a platelet count between 30‐50 x 109/L. 6 patients received IVIG for a likely diagnosis ITP while being investigated for alternative explanations for thrombocytopenia. Three patients were refractory to all other therapy for ITP and were dependent on regular IVIG infusions. 18/76 (24%) of infusions consisted of 2g/kg over 2 days; the remainder of infusions consisted of 1g/kg. Of those who received 2g/kg,3 of patients (17%) had evidence of partial remission after a first 1g/kg dose. IVIG was generally well tolerated and infusion reactions were mitigated with use of corticosteroids, antipyretics and/or antihistamines.
Conclusion: We found, at our institution, that use of IVIG for ITP was generally appropriate and carefully considered even in cases that did not meet current guideline recommendations. We believe that IVIG remains an important treatment for ITP particularly in the aging population where prevalence of conditions complicating bleeding risk is increasing. Detailed utilization/ knowledge data inquiries are required to develop tools and policies to enhance appropriate IVIG use in multiple settings. We believe that there is an opportunity to promote administration of a single 1g/kg dose to minimize unnecessary utilization of IVIG amongst hematologists who manage ITP.
AP83
A Process for Improving Crossmatch Bench Ergonomics
Janet Dornfeld*, Sheng‐Chung Cheng, Ann Eggebrecht, Beth Greer, SavannahSue Rondeau, Brian Rognholt and Beth Taylor
Mayo Clinic
Background/Case Studies: A mission of our institution is to reduce the risk of work‐related injuries. Accordingly, each year an ergonomic survey is undertaken as a component of a general Department of Laboratory Medicine and Pathology safety audit. Our 2016 survey identified potential musculoskeletal risks that suggested a redesign of our crossmatch benches.
Study Design/Methods: A seven item ergonomics survey of the working environment was sent to 32 staff members in early February of 2017. Twenty‐two technologists responded for a 69% response rate. The below table below reports the survey items and responses.
Results/Findings: The most problematic area was the available workspace. Of the respondents, 81% indicated that workspace size was insufficient and 71% that the chairs at the fixed height benches were problematic. Problems noted were difficulty with climbing up into a chair and backing down and with the chairs holding the chosen height. Our laboratory Lean Team Operational Support Group was tasked to aid with the bench redesign and to choose products for improving the workspace. Our goals were to design a layout to streamline testing workflow and better utilize lab space, including our plasma thawing and sink space, eliminating dead space. The configuration of the new workspace was guided by the survey findings. Adjustable height workstations were recommended to replace our fixed height bench. We worked with our facilities design contactor to purchase adjustable benches and plan add‐on cabinet shop work. The benches were assembled off site, which allowed a bench top layout to be determined and installation of cabinet shop add‐ons of a drawer for supplies and a pull out breadboard as a writing surface. The opportunity to assemble off site streamlined the process of installation, resulting in minimal disruption of testing.
Conclusion: The survey was effective in identifying working areas for improvement. Employee comments have been positive for the new workstations. An effectiveness assessment will follow, using the original survey, to assess the success of the project.
TABLE 1. AP83: Crossmatch bench ergonomic survey
| Crossmatch Bench Items | % Reporting Problem or Difficulty | Solutions Implemented |
|---|---|---|
| Workspace | 81 | Enlarged & flexible Relocation from under counter Sit with feet on floor/Adjustable benches Larger and adjustable Task focused Slide in under bench Adjustable: Sit/Stand |
| Keyboard placement | 76 | |
| Chairs at workstation | 71 | |
| Computer monitor use | 68 | |
| Lighting | 68 | |
| Placing saline cube | 67 | |
| Bench height/Chair | 62 | |
| combination |
AP84
A Retrospective Study of Emergency Department Initiated Type and Screen Testing: Were Patients Transfused after Testing?
Sandra Lamm*1, Neil Bangs1 and Kimberly Sanford2
1VCU Health System, 2Virginia Commonwealth University
Background/Case Studies: Type and screen (T&S) testing is often ordered on patients presenting in the Emergency Department (ED). If the patient does not have a historical type, a second sample is drawn with an additional phlebotomy for type confirmation. If the patient does not need a transfusion of red blood cells (RBCs), the testing and second phlebotomy is an inefficient use of resources and time.
Study Design/Method: As part of a Performance Improvement initiative in Transfusion Medicine, we performed a retrospective study of all T&S orders that were initiated in the ED from 1/1/2015 to 6/30/2015 to determine if testing was subsequently followed by transfusion of blood products. Patients were stratified by ED department, time from T&S draw (TSD) to transfusion (<4 hours, > 4 hours < 24 hours), and if a second sample was required.
Results/Finding: A total of 3144 T&S orders were initiated from the ED in this time period. 2787 (88.7%) patients were not subsequently transfused any type of blood product within 4 hours of TSD and 2584 (82.2%) patients were not subsequently transfused any type of blood product within 24 hours of TSD. A total of 2119 (67.3%) patients required a second sample. Of these patients requiring a second sample, 1960 (92.5%) were not subsequently transfused any type of blood product within 4 hours of TSD and 1886 (89%) were not subsequently transfused any type of blood product within 24 hours of TSD.
Conclusion: Routine ordering of T&S testing is not an efficient use of resources and time as many patients are not subsequently transfused. Ultimately unnecessary T&S and second sample collection and testing for those patients not subsequently transfused within 24 hours of TSD amounted to an estimated $699,706 in unnecessary patient charges and approximately 628.7 nursing hours for phlebotomies in a six month period.
AP85
Anti‐D from Alloimmunization Versus Rh Immune Globulin: Detective Work in the Blood Bank and Transfusion Medicine Services (BBTMS)
Margaret DiGuardo*1, Debra Berry1, Yunchuan Delores Mo2 and Gay Wehrli1
1University of Virginia Health System, 2Children's National Medical Center
Background/Case Studies: The Institute for Healthcare Improvement Triple Aim incorporates enhancing patient satisfaction by providing high quality, safe care. Towards these goals the BBTMS is charged with communicating to obstetric physicians (OBs) a patient's antibody specificity with associated hemolytic disease of the fetus/newborn risk. Thus, when anti‐D is detected in a female of childbearing age, it is critical to determine whether this represents Rh immune globulin (RhIG) or alloimmunization (alloanti‐D). Review of a patient's electronic health record (EHR) helps quickly identify RhIG administration, but if this documentation is missing, then it is easy to assume presence of alloanti‐D. RhD alloimmunization impacts mom, fetus, newborn and future pregnancies. Therefore, without a national, comprehensive health information exchange (HIE) system, it is imperative to investigate beyond the on‐site EHR whether a patient received RhIG at an outside hospital (OH). We report an IRB approved (exempt) case series where detective work revealed RhIG administration at OHs.
Study Design/Method: Over a two month time period, anti‐D was identified in four pregnant women. Review of their EHRs did not reveal a history of RhIG administration; nor did subsequent direct communication with their obstetricians (OB) reveal a history of RhIG. Based on each patient's home address, the BBTMS of any nearby OHs were contacted as was a primary care physician if listed in the EHR.
Results/Finding: Investigations beyond the EHR and OBs revealed each of the four patients received discontinuous prenatal care with presentations at multiple sites. Through phone calls to the BBTMS of OHs, a history of one or more RhIG administrations within the preceding three months was found for each patient. Our BBTMS records and EHR were amended to reflect the presence of a passive anti‐D due to RhIG, rather than alloanti‐D. The changes were also directly communicated with the OB caring for each patient.
Conclusion: When a new anti‐D is identified in a pregnant female, investigation is required to determine whether it is passive RhIG versus alloanti‐D. When neither the EHR patient history or OB reveal a RhIG history, it remains in the patient's best interest to investigate further. Through phone calls to OH we revealed a history of RhIG administration in four patients. Finding and communicating this critical information helps enhance the quality and safety of patient by ensuring subsequent RhIG administrations when indicated, at our institution. Future strategies for avoiding similar situations include expanding our national HIE for critical information such as BBTM history and allergy history and expanding use of wallet‐size patient identification cards with RhIg and alloantibody histories.
| Case | Age (Years) | Gravida (G)/Para (P) | Date of RhIG administration at outside hospital |
Date: ABO/Rh Antibody Screen Results (AbSc solid phase method: cells 1/2/3 reactivity) |
|---|---|---|---|---|
| 1 | 19 | G2P1 | 12/3/15 |
12/10/15: O Neg AbSc: 4+/4+/0 |
| 2 | 29 | G5P1 | 1/3/16 |
2/4/16: B Neg AbSc: 4+/4+/0 |
| 3 | 24 | G6P2 | 12/23/15 |
2/19/16: O Neg AbSc: 3+/3+/0 |
| 4 | 23 | G3P1 | 3/7/16 |
3/24/16: O Neg AbSc: 3+/3+/0 |
AP86
Auditing Massive Transfusion Protocol
Colleen A. Aronson*1, Elizabeth Halperin2, Sharon Breining2 and Mona Papari3
1ACL Laboratories/ Advocate Hospitals, 2Advocate Health Care, 3ITxM
Background/Case Studies: A large Midwest hospital system with 5 Level I trauma sites evaluated how to audit the Massive Transfusion Protocol (MTP). The possibility of real time audits is impractical due to the unpredictability of these events. A search of the internet found an example from New Zealand for post process evaluation. This was shared with a team as a starting point and then adjusted for system specific priorities. To start the audit, the initiation of the MTP needed to be determined as events are often started as a verbal request but then followed up with either downtime or computer orders.
Study Design/Method: The Transfusion Service (TS) was determined to be the source of truth for all of the MTP events. A tracking sheet was created to capture the patient demographics, start and stop time, number and type of products issued and wastage. This was then passed onto nursing quality staff that used the tracking form and the patient chart to enter an event into the error management data base as a focused event. The focused event was built to include patient demographics and other information from the tracking form as well as where the event was called (Surgery (OR), Emergency (ED), Labor and Delivery (L&D), etc.), type of event, use of tranexamic acid (TXA), calcium chloride (CaCl), temperature monitoring and pre/ post lab results. A trial was started and 3 months of data were evaluated that contained 29 events.
Results/Finding: There was an equal number of events that were initiated in the ED and the OR (12). Male patients were involved 69% of the time and 31% of time the patients expired. Trauma of some type was the majority of the cause but 13.8% of the cases involved GI Bleed and only 6.9% were obstetric cases (see chart). The lowest hemoglobin (Hgb) was found to average 7.1 with the post Hgb average of 9.7. Ratios of 1:1 for Red Blood Cells (RBC) to plasma as well as RBC to Platelets (PLT) and Cryoprecipitate (CRYO) were also determined with a target of 4:1. It was found that the RBC: plasma was 1.9:1, RBC: PLT was 5.9:1 and RBC to CRYO was 7.4:1. Use of TXA was only 24.1% and CaCl was utilized in 58.6% of cases.
Conclusion: Although this data is for a short period of time it has pointed out several opportunities for improvement. The use of MTP in GI cases was not previously understood but opens up a new group of people for which education and understanding of the MTP process is needed. The low use of TXA needs to be evaluated and already has started conversations about how this drug should be stored and accessed for the MTP process. The product ratio numbers were suspected of being off but now that data is available, it is much easier to speak to this issue and look for improvement. The process will now be expanded to the Level II trauma sites in the system and routine evaluation will be shared with all sites.
AP87
Automated Report Significantly Reduces Turnaround Time for RBC Antibody Alert
Jessica L Dillon*1, Jody A Barna1, Donald E Ulinski1 and Nancy M. Dunbar2
1Dartmouth Hitchcock Medical Center, 2Dartmouth‐Hitchcock Medical Center
Background/Case Studies: Clinically significant antibodies should be promptly and clearly communicated to the patients’ healthcare team to avoid potential transfusion delays in blood availability or complications of incompatible transfusion. At our institution, all newly identified clinically significant antibodies are immediately resulted in the electronic medical record (EMR). An interpretative comment is also entered by the Transfusion Medicine Service (TMS) Physician after the antibody work‐up has been reviewed (this may be up to 2 weeks after the antibody is identified). This comment describes the antibody(ies) identified, indicates the need for crossmatch compatible blood and alerts clinicians of possible delays in providing crossmatched units. Since clinicians may not always review these results, the TMS Physician also simultaneously adds an “Allergy to Red Blood Cells” alert in the patient EMR at the time the interpretive comment is entered.
Study Design/Methods: In July 2016, we implemented an automated report to reduce the turnaround time (TAT) for entry of the allergy alert. The report contains all detected red cell antibodies in the prior 24 hours and is provided to the TMS Physician during daily morning rounds (Monday through Friday) for manual entry of allergy alerts. This study describes a three month comparison both before and after the automated report intervention, to evaluate the TAT for allergy alert entry into the EMR.
Results/Findings: Between August 2015 and November 2015 (pre‐implementation), newly identified clinically significant antibodies were resulted for 56 patients compared to 51 patients between the months of August 2016 and November 2016 (post‐implementation). The TAT for allergy alert entry for both periods is shown in Table 1. We observed that 57% of allergy comments were performed within 24 hours in the post‐implementation period versus only 30% pre‐intervention (p=0.0067). Using the new process, nearly all of the alerts were entered into the EMR within 72 hours of antibody resulting and none of the entries were missed.
Conclusion: There was a significant improvement in the TAT for allergy comment entry following implementation of an automated report. This project illustrates how information technology can be leveraged to facilitate timely communication of antibody identification.
TABLE 1. Comparison of TAT before and after allergy comment entry process improvement
| August 2015 – November 2015 | August 2016 – November 2016 | |
|---|---|---|
| Patients | n=56 | n=51 |
| ≤24 hours | 17 (30%) | 29 (57%) |
| 24‐48 hours | 3 (5%) | 11 (22%) |
| 48‐72 hours | 5 (9%) | 6 (12%) |
| 72 hours – <7 days | 11 (20%) | 3 (6%) |
| >7 days | 10 (18%) | 2 (4%) |
| Not entered | 10 (18%) | 0 |
AP88
Blood Bank Verbal Tool Implementation for Cardiovascular Surgery
Rita Louie*1, Shailesh Macwan1, Nancy Nikolis1, Arline Stein1, Janelle Richardson1, Manju Bagu1, Lennart Logdberg1, Alexander Indrikovs2, Vishesh Chhibber1 and Sherry Shariatmadar1
1North Shore University Hospital, 2Northwell Health
Background/Case Studies: Our institution is a tertiary care facility performing over 1500 cardiovascular surgeries (CVS) in 2016, an increase of 117% after the healthcare system CVS integration in 2015. Transfusion support of these patients includes preoperative preparation of PRBCs according to a maximum surgical blood order schedule. Additional blood components are issued as orders are placed. Until December 2016, the additional written orders were submitted to the blood bank via the pneumatic tube system without further communication. After 2 reported events in Q3 2016 that resulted in delays in blood transfusion, we examined our process very closely and identified opportunities for improvements. In collaboration with CVS, the Blood Bank implemented a new workflow process to enhance communication with the CVS team, reduce turnaround time and improve patient safety.
Study Design/Method:
Open discussions and collaboration between blood bank and CVS nursing teams
Mapping the process using flowcharts for additional blood orders from CVS.
Identify bottlenecks and brainstorm solutions.
A verbal CVS order process and form was implemented to improve communication between CVS and Blood Bank, which solidified communication by including the time of the order, patient identifiers, caller identification, ordering prescriber, staff receiving order, the quantity and kinds of products ordered, the mode of order delivery, and anticipated future orders. A Read Back was also documented for verification of the order.
The blood bank staff immediately processes this order while waiting for the written order to arrive. Upon receipt of the written order the blood is issued to the OR.
Follow Plan‐Do‐Check‐Act. The Transfusion Safety Officer reviews each order for the following parameters: number/type of products, turn around times (TAT), wastage/returned products and overall efficacy since implementation of this process.
Results/Finding: A significant improvement was noted in communication and TAT after implementation of the process described above. For the period 12/23/16‐4/7/17 the blood bank has received 327 verbal orders with varying product combinations. The table below represents average turn‐around times to issue blood products:
Table 1: Mean TAT for Blood Product Issue

Conclusion: The introduction of the verbal order tool for CVS has streamlined the blood ordering process leading to increased efficiency and lower TAT. Effective communication between the OR team and transfusion service is the key to timely provision of blood products for these critical patients.
AP89
Challenge of Blood Type Testing for Multiply Transfused Sickle Cell Disease Patients
Jayanna Slayten*1, Tracie Ingle1 and Heather Vaught2
1Indiana University Health, 2Indiana University Health (IU Health)
Background/Case Studies: We report our Midwestern, University Transfusion Service challenge of obtaining the correct blood types in RBC exchanged Sickle Cell Disease (SCD) patients tested by our primary testing method, solid‐phase red cell adherence analyzer ECHO (Immucor. Norcross, GA). The ECHO Operation Manual in Chapter 12‐6 and Appendix D it states: ”Warning: The Galileo ECHO cannot reliably detect hemagglutination reactions that are graded as 1+ or less in tube methodology. The Galileo ECHO does not generate as interpretation of mixed‐field. Such a mixed‐field reaction will be interpreted as positive, negative, or equivocal.” We report of a challenge with this analyzer limitation which impacts the assignment of the correct blood type for multiply transfused SCD patients.
Study Design/Method: Two SCD when initially tested by the ECHO as O, D Negative; however, each patient was historically O, D Positive. Both patients had received a RBC exchange transfusion with 8‐11 O, D Negative red blood cells over 30 days previously. Repeat testing of the samples was completed by the VISION (Ortho Clinical Diagnostics. Raritan, NJ), NEO (Immucor. Norcross, GA), and by standard ABO/Rh manual testing (anti‐A, Anti‐B, Anti‐D Series 4, Anti‐D Series 5, A1 cell and B cells. Immucor. Norcross, GA). The repeat testing was compared to verify the patient's ABO/Rh typing and the results were entered into the computer system to allow for assigning the patient's ABO/Rh typing and electronic crossmatch.
Results/Finding: Table 1 summarizes the initial and repeat testing with the two patient samples. Although the ECHO failed to interpret or flag the blood type as mixed‐field, the other methods identified the transfusion of O, D Negative blood with the detection of mixed‐field in the D typing or by failing to interpret the ABO/Rh as not type determined (NTD). The VISION and manual ABO/Rh typing yielded the easiest mixed‐field to interpret macroscopically.
Conclusion: Our results agree with the findings of Summers etal (TRANSFUSION 2009;49:1672‐1677) who reported the challenge detection of mixed‐field with the use of the ECHO compared to improved detected with automated gel column agglutination. When the samples were tested by multiple automated and manual ABO/Rh methods, the expected mixed‐field was detected. The failure of the ECHO to detect the mixed‐field is acknowledged by manufacturer, but there is a risk that a facility may mistype the ABO/Rh when there is not a historical ABO/Rh to compare. To avoid this risk, it may be appropriate to re‐type first time SCD patients by other methods rather than the ECHO to avoid this challenge. Consistent with Summers etal, the most consistent mixed‐field may be observed with the VISION or manual ABO/Rh testing.
TABLE 1. Initial and Repeat Testing of Historically O, D Positive Patients
| Immucor ECHO |
Ortho VISION |
Immucor NEO |
Manual ABO Anti‐D Series 4 |
Manual ABO Anti‐D Series 5 | |
|---|---|---|---|---|---|
| Patient 1 | O, D Negative |
Gp. O D, Mixed‐field |
NTD |
Gp. O D, Mixed‐field |
Gp. O D, Mixed‐field |
| Patient 2 | O, D Negative |
Gp. O D, Mixed‐field |
NTD |
Gp. O D, Mixed‐field |
Gp. O D, Mixed‐field |
AP90
Closing the Gap between Transfusion Medicine and Patient Care
Nicole M Crews*1,2, Barrett Lawson2 and Jun Teruya1,2
1Texas Children's Hospital, 2Baylor College of Medicine
Background/Case Studies: Safe transfusion ordering requires knowledge of a patient's transfusion reaction history. Multiple health care providers are involved in patient care and information hand off is crucial to patient safety. Repeated exposure to transfusions can increase the risk of transfusion adverse events further warranting effective tools of communication which the transfusion safety officer (TSO) can facilitate. The Accreditation Council for Graduate Medical Education (ACGME) has requirements for transition of care with resident involvement.
Study Design/Method: 1. From April 1 to December 31, 2016, transfusion reactions reported to the National Health and Safety Network (NHSN) hemovigilance and recurrence of allergic reactions were evaluated. Documentation gaps in the electronic medical record (EMR) in Epic™ were evaluated. The TSO implemented measures to ensure reporting of transfusion reactions from the transfusion medicine team to the direct care provider utilizing the electronic medical record (EMR). The frequency of the care provider updating the EMR versus the TSO was evaluated.
2. From June to December 2016, plan, do, study, act (PDSA) methodology was used to incorporate a systematic hand off from the resident to the day transfusion medicine team and the transfusion safety officer (TSO). The focus was on the creation, implementation and revision of a standardized hand‐off template and an intranet “drop box”. Utilization compliance was assessed.
Results/Finding: 1. A total of 24,003 components were issued to 4,727 patients with 102 transfusion reactions (rate of 4.2 per 1,000 components) from April to December 2016. Allergic transfusion reactions accounted for 84.3% (86 of 102) of which 7 patients experienced a repeat reaction all requiring premedication escalation. Three patients required volume reduction and 1 required washed product. Only one patient experienced a repeat reaction associated with lack of pre‐medication. The frequency of the TSO versus the direct provider updating the EMR shown in Table:
| TSO completed | Direct care provider completed | Total | |
|---|---|---|---|
| Allergy section | 34% | 66% | 100% |
| Problem list | 78% | 22% | 100% |
| FYI tab | 80% | 20% | 100% |
2. Resident reports to the intranet “drop box” increased from 53.7% to 69.3% to 100%, each over 2 month time spans.
Conclusion: Safe transfusion ordering requires a team approach to ensure the right information is available to the ordering provider at the right time. Safe ordering prevented recurrent allergic reactions in our patient population. The TSO plays a pivotal role in ensuring the full circle of communication occurs. Processes that integrated the pathology resident improved with PDSA cycles and impacted the quality and timeliness of hand off. Finally, the data provided from the residents enabled efficient participation in hemovigilance.
AP91
Decreasing Process Exceptions Related to the Testing of Whole Blood Donor Samples
Marc Douglass*, Takeya Miller, Neil Bowlus, Douglass Armstrong, Jamie Washington and Shanell Williams
QualTex Laboratories
Background/Case Studies: We track exceptions in the laboratory which we define as instances that results for the testing of whole blood donor samples were not sent to the client within the contractual 10‐12 hour turnaround time. Failure to release test results within the contractual turnaround time affects the availability of client's blood products available and can possibly negatively affect patients. The aim was to significantly decrease the number of exceptions in the Laboratory. The baseline level of exceptions was 17.4 exceptions per day or 10,370 defects per million opportunity (DPMO). A lean Six Sigma approach for process improvement was utilized to identify root causes and develop countermeasures in order to decrease exceptions in the lab.
Study Design/Method: Daily exception counts were tracked and graphed from 9/1/2016 thru 3/26/2017. The 5 Whys were performed to determine root causes of exceptions. A Gemba walk was performed on all of the lab testing processes to help identify areas for improvement. The process Improvement team met with frontline staff to develop new process where needed. Countermeasures were generated and implemented. The Student's t‐test was utilized to determine the statistical significance of the number of exceptions observed pre‐implementation of the counter measures when compared to the number of exceptions seen post‐implementation of the counter measures.
Results/Finding: The main root cause determined was that there was no standard work process. SOPs were being followed but there was no standard work process that included the details so testing was not following the most efficient work flow. Counter measures implemented included implementing a standard work process, visual cues were added to the work process, and a samples awaiting testing report was created for the Batch Release Department. Specific locations were identified within the work cells in the lab to place samples based on their phase/stage of testing. After counter measures were implemented, the number of exceptions decreased from 17.4 per day or 10,370 DPMO to 6.3 per day or 3,539 DPMO. This is a statistically significant difference since the p‐Value calculated was 0.002.
Conclusion: A lean Six Sigma approach for process improvement was utilized to identify root causes and develop countermeasures in order to decrease the number of exceptions related to the testing of whole blood samples in the laboratory. This approach and counter measures statistically significantly decreased the number of exceptions seen in the whole blood testing process.
AP92
Developing an Integrative Set of Key Performance Indicators to Optimize Blood Bank Inventory in a Large Regional Hub Hospital
Andrew Wei‐Yeh Shih*1, David Wing Pi1,2, Lawrence Sham1, David Zamar2, Kristine Roland1,2 and Monika Hudoba1,2
1Vancouver Coastal Health Authority, 2University of British Columbia
Background/Case Studies: Maintaining sufficient red blood cell (RBC) inventory is a key role of a hospital blood bank to balance ensuring that shortages do not affect patient care and excessive stocking/expiry. Previous approaches have focused on shortage (BSR) and outdate rates (ODR); and do not account for regional distribution. Many large hospitals acting as regional hubs for redistribution may appear to have optimized inventory based on ODR and BSR, but we hypothesized that these are crude key performance indicators (KPIs) requiring redevelopment.
Study Design/Method: KPI redevelopment occurred in a large tertiary care hospital blood bank in Canada, responsible for 75% and 20% of transfusions in the region and province respectively. RBC supply, inventory, and disposition data were retrospectively assessed from February 2014‐June 2015 as the baseline period. A “demand‐driven inventory planning policy” (DDIP) was instituted to assess and implement the optimal RBC reorder quantity based on the difference between the historical maximum and minimum RBC inventories during weekdays; that would not lead to blood shortages. Shelf‐life inventory (SLI) was chosen as the main surrogate marker for the assessment of efficiency of the supply chain process, calculated by the differences between age of blood transfused (ABT) and received (ABR). Iterative simulation modeling (R statistical software) was then performed to optimize SLI in a post‐implementation period from June 2015‐October 2016.
Results/Finding: Modeling predicted observed RBC disposition. Through simulation, optimization of SLI was found to occur by optimizing a set of KPIs for each ABO blood group (Table 1). This led to a reduction in observed overall SLI (7.2 ± 1.8 days vs 6.0 ± 1.5 days, p<0.01) and ODR (0.9% vs 0.5%). The BSR was not significantly increased during the post‐implementation period.
Conclusion: Optimization using simulation modeling of multiple factors other than BSR and ODR led to further efficiency gains in a large tertiary care hospital blood bank. Hospital blood banks should use an integrative approach with a set of KPIs to optimize the supply chain. This approach requires validation in other blood banks and jurisdictions.
TABLE 1. Comparison of Key Performance Indicators Optimized (All Blood Groups)
| Blood Supply Management KPIs | |||
|---|---|---|---|
| KPI | Baseline Period | Post‐Implementation Period | P‐value |
| ABR (Mean, SD) | 19.4, 9.0 | 12.7, 7.0 | <0.01 |
| RBC Units Received from Redistribution (%) | 20.7 | 12.8 | |
| Blood Inventory Management KPIs | |||
| Daily RBC Inventory : RBC Transfusion (I/T) Ratio (Mean, SD) | 5.1, 2.1 | 4.2, 1.8 | <0.01 |
| Daily ABO Mismatching to Prevent Expiry : RBC Transfusion Ratio (%) | 11.4 | 8.5 | |
| Daily Crossmatch : RBC Transfusion (C/T) Ratio | 1.5 | 1.4 | |
| SLI (Mean, SD) | 7.2, 1.8 | 6.0, 1.5 | <0.01 |
| DDIP Compliance | N/A | ||
| ODR (%) | 0.9 | 0.5 | |
AP93
Electronic Medical Records: A Tool for Performing Lookback Notifications and Documentation
Katheryne Igo*, Bruce Millward and Priscilla Figueroa
Cleveland Clinic
Background/Case Studies: If a hospital has transfused a unit of blood which is potentially HIV or HCV infectious, the CMS Condition of Participation (42 CFR 482.27(b)(6)) requires that the hospital make reasonable attempts to notify the patient (or the patient's physician), counsel the patient, and offer testing. The hospital must maintain records of this Lookback notification as part of the patient's medical record. Paper records of Lookback notifications are less accessible than electronic records and are at greater risk of being damaged or lost. To facilitate the Lookback process and reduce paper documentation we sought to use the Electronic Medical Record (EMR) to perform and document notifications.
Study Design/Method: Representatives from Transfusion Medicine (TM) and Information Technology (IT) worked together to define minimum and optimal EMR solutions. Minimally, a completed paper packet could be scanned into the EMR. This solution had no advantages in terms of ease of use, process control, or transparency. Desired optimal functionality includes the ability to send letters in the EMR, document control so that original communications may not be altered, opportunity for patient's physician to electronically sign and return responses, letter and form templates that can be individualized, and the ability to track when and by whom notifications were sent and received. The EMR system at our institution, Epic (Epic Systems Corp., Verona, WI), has a function called “Letters” with the capacity to do all these tasks. A series of five templates were developed: HIV and HCV letters to physicians, response forms for physicians to return to the transfusion service, and a blank letter template to be used for specially tailored letters. Templates are opened within the patient's EMR and demographic information is automatically populated by Epic (eliminating many possibilities for clerical errors), the blood product transfused (e.g. RBCs or plasma) is selected from a drop‐down menu, and the date of transfusion is manually entered by the sender. The completed letter is then routed to the patient's physician; it shows up automatically (and instantly) in their electronic In Basket as well as in the patient's EMR. Physicians may electronically complete and return the response form within Epic, or print it and return the form by fax.
Results/Finding: Between January 2014 and December 2016 thirty‐five (35) notifications were sent to physicians using Epic Letters and of those, fourteen (14) responded to the Epic Notification and five (5) used the provided electronic response form. For these cases the time to mail or hand‐deliver paper notifications was avoided. The remaining 21 cases required follow‐up paper notification, but the electronic Letter remains as permanent, easily accessible documentation of when the transfusion service first notified the physician.
Conclusion: Lookback notifications within the EMR makes compliance with government requirements more transparent and records more accessible to caregivers, patients, and assessors. Secondarily, efficiency may be improved by reducing the need to print and mail/deliver letters.
AP94
Evaluation of Ordering Practice in the Operating Rooms and Its Impact on Product Wastage
Alexandra Budhai*1, Denden Benabdessadek2, Annu George2 and Alexandra Jimenez2
1Westchester Medical Center, 2New York Blood Center
Background/Case Studies: Blood product wastage is an issue that many hospitals aim to address. The OR was identified to have the highest rate of wastage within our hospital. In this study, we assessed the appropriateness of the product order and utilization by the OR to understand its impact on wastage.
Study Design/Methods: Data on product orders, issue, and return for two months were analyzed. The hospital CPOE and product requisition forms were used to collect this data. The surgical procedures and number of ordered units were compared to the hospital's maximum surgical blood order schedule (MSBOS). Trends for inappropriate orders for products by physicians were evaluated.
Results/Findings: A total of 941 orders were reviewed. Approximately, 30% of these products were issued to the OR. We found that the physician orders were within the guidelines of the MSBOS for most cases (89%), but of the issued products, all were returned to the blood bank in 40% of cases.
We observed that the percentage of products ordered and used compared with the products ordered and returned in cardiac surgeries are nearly equal. In addition, all of the products ordered for C‐sections were not used; albeit ordering frequency being significantly lower than for cardiac cases.
Conclusion: The data analyzed demonstrates that the majority of surgeons are adhering to our institutional MSBOS guidelines. It was noted that surgeons are requesting products be issued for invasive procedures where rapid exsanguination is possible. Our analysis revealed that the hospital's MSBOS does allow for an excess in blood ordering for some surgical procedures. The MSBOS should be updated to reduce the suggested maximum product order. In general, the data does not imply that the blood product wastage in the OR is due to the ordering practices of the surgeons.
A larger period of surgical blood ordering practices should be analyzed to detect blood product ordering, utilization and wastage trends in other subspecialties.
AP95
Evaluation of Vision® Turnaround Time Under Routine Daily High‐Volume Practice
Wen Lu*, Rochelle McNorton, Christy Hudson, Paul Kopin, Karen McCasson and Priscilla Figueroa
Cleveland Clinic
Background/Case Studies: The Vision® and Vision® Max (Ortho Diagnostics, Raritan New Jersey) are ID‐MTSTM Gel card‐based automated immunohematology analyzers marketed for small to medium, and high‐volume [> 50 type and screens (T&S) per day] blood banks1, respectively. Our laboratory which serves a large 1278‐bed multispecialty academic hospital and receives 275‐300 T&S specimens per day needed to replace three ProVUE analyzers prior to the availability of the Vision® Max. We implemented three Vision® analyzers to work with our existing NEO® and ECHO® (Immucor Inc, Norcross Georgia). A recent multicenter field application trial of the Vision® reported a mean turnaround time (TAT) for T&S and ABO, Rh typing (ABO/Rh) of 32.2 ± 4.5 and 27.5 ± 5.6 minutes2, respectively. The objective of this study was to determine Vision® TATs under routine daily high‐volume practice.
Study Design/Methods: One Vision® was in operation during a five‐week period (phase I), and then two additional analyzers were brought into service (phase II). TATs are defined as the time when the order is received by the instrument to when the test is completed and available for review. Three‐cell screen and ABO/Rh TATs, and number of Vision® antibody panels were collected for a nine‐week period. The TAT for the screen was used as the TAT for the T&S because the screen is the rate determining step. All testing was performed using in‐service analyzers on routine patient samples by trained technologists. Samples were not deliberately batched but were placed on the analyzer based on the volume and flow of work at the time.
Results/Findings: Under the high volume conditions of our laboratory with three Vision® analyzers, the mean T&S TAT was 30% longer and had a larger standard deviation (S.D.) than the published trial result of 32.2 ± 4.5. During phase I Vision®1 performed 263 panels. During phase II Vision® 1 performed 351 of the 361 Vision® panels.
TABLE 1. TAT (mean ± S.D. minutes), mean samples per day (d) for phase I and II
| Instrument |
ABO/Rh Samples/d |
ABO/Rh TAT |
Screen Samples/d |
Screen TAT |
|
|---|---|---|---|---|---|
| Phase I (35d) | Vision® 1 | 128 | 41.8 ± 22.9 | 120 | 52.7 ± 23.3 |
| Phase II (28d) | Vision® 1 | 29 | 30.5 ± 12.7 | 28 | 41.8 ± 11.75 |
| Vision® 2 | 79 | 76 | |||
| Vision® 3 | 94 | 85 |
Conclusion: Our Vision® analyzers are used under high volume conditions more suitable for the Vision® Max. When balanced with the testing menu, including ability to perform select cell panels, our TATs using three analyzers were satisfactory. The large standard deviation indicates that opportunities remain for improving TATs through workflow improvement.
References
1 FDA Clears ORTHO VISION(R) Max Analyzer for High‐Volume Transfusion Medicine Labs. (2016, Oct 22). Retrieved Apr 26, 2017, from http://www.prnewswire.com/news-releases/fda-clears-ortho-visionr-max-analyzer-for-high-volume-transfusion-medicine-labs-300349477.html 2. Aysola A, Wheeler L, etal. Laboratory Medicine 2017 Feb;48(1):29‐38.
AP96
From West Nile Virus to the Emergence of Zika Virus: A Nationwide Survey of How Regulators Are Keeping the Blood Supply Safe and Available
Falisha Atwell*1, John Roback2, Ronald Arkin1, Michael Bartlett1, Robert Geiger1 and Jaxk Reeves1
1University of Georgia, 2Emory Hospital
Background/Case Studies: With the emergence of ZIKV in the United States, it is important to assess the FDA's response time in providing guidance to ensure the safety and availability of blood products in the face of newly emerging infectious diseases. This research compares the responsiveness of the FDA during West Nile Virus (WNV) and Zika Virus (ZIKV) outbreaks to evaluate our current preparedness.
Study Design/Methods: The literature review was conducted to analyze FDA's response time during the WNV crisis and determine if it was effective and efficient. The research survey was performed to determine if the Donor History Questionnaire (DHQ) adequately screens donors for ZIKV as the sole preventive method (as per the February 2016 Guidance for Industry: Recommendations for Donor Screening, Deferral and Product Management to Reduce the Risk of Transfusion‐Transmission of Zika Virus) and to determine if the current regulatory practices (including the August 2016 Guidance for Industry: Revised Recommendations for Reducing the Risk of Zika Virus Transmission by Blood and Blood Components) are perceived to be effective and efficient in the face of the current ZIKV outbreak. Survey Monkey was used and participation was anonymous. Over 4,000 emails and web‐links were sent to members of AABB, SCABB, SEABB, and personal network with a 10% target response rate. Participants self‐selected or deselected based on the inclusion and exclusion criteria listed in the consent letter.
Results/Findings: The literature review revealed that the FDA's response was slow during the WNV outbreak, while the ZIKV response is efficient thus far. A total of 317 participants responded to the survey (7.94% response rate). Statistically, participant agreement with FDA's decisions was performed by “t” test (with n‐1=317‐1=316 df) of the null hypothesis that the mean=0 vs. the alternative that the true mean is > 0. Overall participants had favorable opinions of the FDA's decisions. Statistically, whether participants in different levels of the demographic variables (region, profession, and years of experience) answer significantly differently, one way ANOVA models were used with Likert‐scale question responses as if they were continuous. The F‐statistic and P‐value are for the null hypothesis that all levels of the explanatory variable have the same mean for the response variable. There were no significant differences in the years of experience and profession variables for participants. Region was determined to be unreliable due to undefined states for each region listed.
Conclusion: The research revealed that industry experts conclude that the current system of DHQ and FDA guidance documents, if issued timely, are adequate.
TABLE 1. CT Breakdown (min:sec)
| DM | TS | AbID | UC(6 units) | |||||||||
|---|---|---|---|---|---|---|---|---|---|---|---|---|
| CT | ST | LT | CT | ST | LT | CT | ST | LT | CT | ST | LT | |
| Current State | 20:18 | 1:05* | 7:28 | 43:05 | 3:41* | 3:05 | 47:20 | 25:00 | 22:20 | 9:07 | 0:35 | 8:32 |
| Future State | 16:43 | 13:40* | 3:03 | 32:32 | 0:10* | 2:35 | 43:25 | 4:40 | 4:30 | 31:24 | 0:10 | 9:59 |
*All VT
AP97
Impact Study of a New Automation System on Transfusion Medicine Operations
Tony S. Casina*
Ortho Clinical Diagnostics
Background/Case Studies: When evaluating a new instrument solution for pre‐transfusion testing, it is important to consider the operational impact of the system on the lab. There are a variety of operational, performance and system metrics that can be evaluated to determine this impact including: test workflow, hands on time, and automation time. Study Design/Methods: The study involved a current state to a future state comparison of testing processes with an instrument ORTHO ProVue® (PV) and manual testing vs. an instrument ORTHO VISION® (OV). Data collection methods included direct observation, time studies, and interviews. The PV bench performs Type & Screens (TS) on the PV and manual AbID/selected cell panels in the gel test. All other testing; cord blood(CB), DAT, unit confirm(UC), patient type confirm(PC) and crossmatch(XM), etc. are done manually in tube. The future state incorporated the OV. TS, AbID and UC were evaluated in both states. Cycle time(CT) was averaged based on 3 run cycles. CT was comprised of 3 metrics; instrument time(IT), standby time(ST) and labor time(LT). ST may be comprised of 2 components, time that could be utilized as “walkaway” time or vigilant time (VT) which requires operator presence but not operator action. For automated instruments, VT for each cycle was measured as instrument access unavailable. Instrument daily maintenance (DM) CT was evaluated as well. Similarly, timing of manual tube test processes used these metrics. For repetitive activities within a process, such as UC or XM, a time per individual process was captured and then multiplied per unit. Results/Findings: Table 1 provides details about the metrics of current state and future state processes. Tube based test timing is as follows: PC (2:50), XM (32:23), CB (13:18) and DAT (10:00). By implementing the future state, an average ∼1.3 min. LT and VT is saved on each sample loaded for TS equating to a 73% labor reduction over the current state. A 19% improvement in TAT on the TS was achieved in the future state. Moving from manual AbID to automated processing resulted in a 59% LT reduction. On average, a 38 min. continuous walk‐away time is achieved for each automated AbID. UC had less impact on labor time with minimal difference however allowed for focus on consistency and quality metrics. Conclusion: Based on the metrics evaluated and compared between current state and future state, the OV has demonstrated improvement in lab operations to both the labor required and result TAT delivery. Opportunity exists to automate workflows on other tests that are still manually performed.
AP98
Implementation of a Fully Automated Analyzer Using Gel Technology at a Blood Bank in a Regional Trauma Center
Denden Benabdessadek*, Maria Parascandola, Armilyn Bowen, Byron Forrest, Shankar Rayannavar, Cathy Reid‐Huey, Alexandra Jimenez and Bruce S Sachais
New York Blood Center
Background/Case Studies: High throughput and efficient automation of serologic tests is crucial in the workflow of a blood bank that tests ∼100 type and screen samples per day. The Erytra® (Grifols) is a fully‐automated walkaway analyzer utilizing 8‐column gel cards for pretransfusion testing. The blood bank validated and implemented the use of Erytra® for ABO/D typing, antibody screening and identification of patient samples as a replacement for a solid phase testing platform. The blood bank also validated automation of donor unit retypes. The instrument has bidirectional interface to the blood bank lab information system (LIS), HCLLTM (Hemocare Life Line, Mediware). Instrument validation and implementation were done in conjunction with the software version upgrade of HCLLTM and an interface system change to MaestroTM.
Study Design/Method: Correlation testing of the Erytra® results with the manual tube testing (PEG IAT; reference method) was performed on 100 patient samples for ABO/D typing and antibody screening; of which at least 10 had a positive antibody screen. Out of the 10, 5 had known antibody specificities. Forty‐two RBC units were also tested for ABO/D confirmation; of which 17 were D(‐) and 25 were D(+). Calculations of concordance, sensitivity, and specificity were performed. Precision studies were also done. Interface testing of Erytra®, HCLL and the hospital's information system using the MaestroTMinterface system was performed and validated.
Results/Finding: Concordant results between both methods were obtained in all of the 100 patient and 42 donor samples tested (100% concordance). All 10 samples with positive antibody screens were obtained by both methods. All clinically significant antibodies were detected by both systems. Erytra® gave 100% sensitivity and specificity. The precision studies showed that both methods gave the same type and screen results for 5 samples at 3 different testing events.
After validation of the LIS upgrade and interface system change, a bidirectional interface with HCLLTMwas established. The instrument has been operational in our lab for over 3 months.
Conclusion: Erytra® was found to be reliable and accurate and can handle the high workload of our lab. Users found the instrument easy to use; hence training, proficiency, and competency of the users are achievable and manageable. The validation of the the instrument is straightforward. The major challenge and delay in the implementation experienced by this blood bank were attributed to the concurrently occurring LIS upgrade and migration of the data integration system. A post‐implementation workflow assessment would be ideal to perform to ensure that the instrument is being used at its full potential.
AP99
Implementation of a System‐Wide Platelet Inventory Report Optimizes Platelet Utilization and Reduces Unit Wastage
Elly Landolfi*1, Craig Fletcher2 and Peter Millward1
1Beaumont Hospital, 2Beaumont Health System
Background/Case Studies: A sufficient number of blood components should be available to meet routine and emergent hospital needs. This must be assured while minimizing outdating of scarce and expensive blood components – an inherent challenge with platelet units which have a short 5‐day shelf‐life. We report the results of a quality improvement project implementing a custom computerized Platelet Inventory Report designed to mitigate the most common cause for platelet wastage at our institution: high platelet outdate rates. The report includes blood type, product code, unit number, respective product attributes, supplier and availability status of all platelet units for each hospital location. All system blood banks receive a morning fax of the report which facilitates transfer of units prior to expiration and adjustments are more readily made for product orders to the supplier.
Study Design/Method: The study was conducted in the hospital‐based blood bank and based on available platelet inventory and wastage quality data. The report went live October 2014 and quality data was reviewed from August 2013 to December 2016. The collected data was then analyzed using descriptive statistical methods.
Results/Finding: Data from 2016 indicates platelet wastage comprised 1% of total received platelets and 79% of these wasted platelet units were due to expiration. Other reasons included failed visual inspection, blood dispensed but not used and wasted on the floors, potential tube station problems or short‐dated units transferred into our blood bank from another facility. The mean of monthly wasted platelet units 12 months pre‐implementation of the report was 13 units, compared to 11 units 12 months post‐implementation and 5 units 24 months post‐implementation. Wastage rates improved from 6% (wasted yearly platelets/total received yearly platelet units) in 2014, the year of report implementation, to post‐implementation rates of 3% in 2015 and 1% in 2016 (see table). Importantly, this occurred despite a greater than 30% increase in platelet inventory between 2014 and 2016 and resulted in cost savings of over $60,000 in this period.
Conclusion: Study limitations included restricting data collection to one campus. The option to transfer expiring platelet units to another blood bank was available to all 4 participating sister hospitals. It would have been interesting to see the effect of the report on those hospitals which have lower transfusion rates and different ordering practices. Aside from lowering platelet wastage within 2 years of implementation, additional benefits to the report included facilitating ordering from the blood supplier. Cornerstones of a successful inventory management plan include daily inventory monitoring and, ideally, coordinated system‐wide efforts to share platelet units. We have shown achievement of this end is facilitated by a customized daily Platelet Inventory Report ‐ an efficacious and easily adaptable tool with demonstrable gains.
| Year | No. of Discarded Plt Units | Total Received Plt Units | Discarded Plt Units/Total Received Plt Units (%) | Cost of Discarded Units (Cost per unit = $450) |
|---|---|---|---|---|
| 2013 (Sep‐Dec) | 44 | 1007 | 4.0 | $19,800 |
| 2014 | 193 | 3242 | 6.0 | $85,850 |
| 2015 | 104 | 3020 | 3.0 | $46,800 |
| 2016 | 55 | 4349 | 1.0 | $24,750 |
AP100
Implementation of an Electronic Transfusion Ordering System in the Emergency Department of a Level I Trauma Center
Valerie Halling*1, Lisa Marie Button2, Lori Scanlan‐Hanson2, Karen Koch2, Janet Finley2, Deepi Goyal2 and Camille van Buskirk3
1Mayo Clinic‐Rochester, 2Mayo Clinic, 3Mayo Clinic Rochester
Background/Case Studies: Transfusions in the Emergency Department of a Level I Trauma Center were ordered using a handwritten order form. The Transfusion Lab's (TL) management team and Medical Director met with Emergency Department (ED) leadership and IT resources in 2014 to define the needs of a successful electronic blood transfusion system. The handwritten order forms had several potential error sources which could lead to a delay in filling the order pending correction (in the best of circumstances) or could lead to transfusing the wrong patient or the wrong product if the error was not detected. The potential error sources included clerical errors involving the patient's name or medical record number (MRN), writing two different names on the order form (because there were two locations to record patient name), two product types ordered on one form when the requirement is for one product type per order, no priority indicated (STAT or Routine), or not including the prescriber call‐back information. The number of ED reported transfusion related events in 2013 and 2014 were 63/1187 (events/ED transfusions 2013‐2014).
Study Design/Method: Electronic ordering for the ED was implemented March 31st 2015. Any transfusion orders generated from the ED are now electronic, unless in the case of electronic downtime. The system electronically fills in the patient's name and MRN, controls for the type of blood product being ordered, requires an order priority and provides service contact information. It was designed to accommodate transfusion ordering needs for adults, pediatric patients <35kg and pediatric patients >35kg. The pediatric orders had three critical fields identified that are required for the order to be processed including patient weight, product volume, and infusion rate. The electronic system was designed so that an order cannot be submitted unless all critical fields are completed.
Results/Finding: The electronic ordering system has been in place for 2 years (April 2015 – March 2017), and during that time there was 1 instance of blood being ordered for an unintended patient 0.09% (1/1081). This was because a previous patient's medical record was accessed rather than the intended patient's medical record. There have been no instances of clerical errors (name misspelled or MRN transposition etc.), missing service contact information, missing order priority information, more than one product type ordered on a single order, or two patient names on one order. Electronic ordering also provided a place for the transfusionist to chart against, leading to increased transfusion documentation compliance. Prior to electronic order implementation, in 2013, 17/651 (2.61%) units were transfused in the ED but not charted in the patient's medical record. In 2014, 18/536 (3.36%) transfusions were not charted. However, in 2016, the first full year of electronic transfusion order capability, only 4/462 (0.87%) transfusions were not charted in the patient's medical record.
Conclusion: Electronic ordering in the ED has essentially eliminated ordering errors in this area resulting in less rework for both technologists and physicians. It allowed the order to be processed more quickly by TL, resulting in a faster turnaround time. Improvement in the overall quality of transfusion ordering through electronic ordering reduced the influence of human factors in order placement and provided an added benefit of having a specific order to chart against.
AP101
Implementation of Blood Bank Automated Attendant
Lok Tse*, Gerald Motta and Maria Aguad
Brigham and Women's Hospital
Background/Case Studies: The Blood Bank receives numerous non‐emergent phone calls on a daily basis. These calls not only occupied valuable time but also made the lines unavailable when a real emergency occurred. The Hospital is categorized as a Level 1 trauma center, with over 700 inpatient beds and over 50 operating rooms. A proposal to implement a Blood Bank automated attendant was recommended to decrease phone calls, minimize errors due to distraction from phone calls, free team members to perform other duties and have a direct line designated for requesting trauma coolers, massive transfusion protocol (MTP) and emergency release of blood products.
Study Design/Method: The first step was to categorize the types of phone calls received by the Blood Bank by creating a phone log. Data were collected and analyzed for four weeks. The blood bank collaborated with nursing, hospital administrative staff and telecommunication team to evaluate the possibility of implementing an automated attendant to minimize phone calls. It was very important to maintain patient safety and quality of service at the same time. The automated attendant consist of: Option 1 (Urgent) for trauma, emergency release, MTP and obstetric hemorrhage emergency release; Option 2 (Verbal) for verbal orders and coolers set up; and Option 3 (Staff) to speak with staff member. Instructions were also given for specimen inquiry and product availability in the hospital information system.
Results/Finding: The data in Table 1 showed that most of the incoming calls fall into three categories (specimen inquiries, product order inquiries, and other inquiries). Most of the calls were from nursing staff inquiring about the length of wait time for blood products and specimen availability. There was an overall decrease in phone calls by 68% with the implementation of an automated attendant.
TABLE 1. Pre‐ and Post‐ Automated Attendant Implementation Data
| Specimen Inquiries | Product Order Inquiries | Other Inquiries | Total Calls documented | |
|---|---|---|---|---|
| Pre – Automated Attendant | 138 | 190 | 103 | 431 |
| Post – Automated Attendant | 39 | 53 | 44 | 136 |
Conclusion: With the implementation of an automated attendant, the blood bank team was able to identify and respond accordingly and efficiently to urgent requests and verbal phone orders. The decrease in phone calls freed up team members to perform other critical tasks in the department.
AP102
Improved Detection of Wrong Blood in Tube Errors: Implementation of a Two‐Sample Blood Type Verification Process
Ariana King*1, Steven Zibrat1, Geoffrey Wool2 and Angela Treml2
1University of Chicago Medicine, 2University of Chicago
Background/Case Studies: Our organization used a blood bank identification (BBID) band system for pre‐transfusion testing and detection of Wrong Blood in Tube Errors (WBIT). Additionally, type & screen results were compared to patient's historical records; the specimen was retyped by a second technologist if historical results were not available. The BBID bands were prone to clerical errors and excessive specimen rejections, and believed to miss some WBIT errors. In 2015, Blood Bank accounted for 48% of all rejected clinical laboratory samples, yet comprised only 5% of total laboratory volume; 88% of rejected Blood Bank samples were due to BBID band issues. The WBIT error rate detected by BBID‐based system was 0.006%.
Study Design/Method: A multidisciplinary workgroup was formed to review data and best practices. The decision was made to discontinue BBID bands and implement a two‐sample verification process, in keeping with Standards. A new laboratory test order was created in the EMR system and embedded into the existing T&S order. Providers are prompted to order the ABO verification test only when no previous ABO/Rh typing results are found. Education was provided to all clinical staff in the form of in‐services, emails, and annual competencies completed electronically. The new process went live in September 2016.
Results/Finding: In the five months following implementation, four WBIT errors were detected with the second sample. These may have been missed using the BBID band system. Improved detection revealed a WBIT error rate of 0.128%, three times the national average of 0.043%. Under the new system, rejected Blood Bank samples decreased from an average of 50% to 28% of all rejected laboratory samples, a 43% decrease. Implementation of the new process produced a net savings of $55.8K.
Conclusion: Replacing the BBID band system with two‐sample verification successfully improved our ability to detect WBIT errors among patients who lacked historical blood bank results. Additionally, discontinuation of the BBID system decreased the incidence of clerical errors and unnecessary specimen rejections, and also saved money for the organization. Next steps are for Blood Bank and Laboratory Quality leaders to partner with nursing leadership to drive down WBIT error incidence.
AP103
Improved Documentation of Blood Product Culture Results with an Automated Email Alert
Barbara A. Hewitt*1, Mary E. Koury1 and Nancy M. Dunbar2
1Dartmouth Hitchcock Medical Center, 2Dartmouth‐Hitchcock Medical Center
Background/Case Studies: Culturing of the residual blood product occurs when there is clinical suspicion for a septic transfusion reaction (STR). Final culture results are typically available within 5 days in our Laboratory Information System (LIS) but these results do not cross over to the associated patient's electronic medical record (EMR). Phone notification only occurs when cultures are positive. EMR documentation of the product culture result occurs when the Transfusion Medicine physician manually enters the result as an addendum to the transfusion reaction clinical note. In an effort to improve the turnaround time (TAT) for culture result documentation, we collaborated with LIS staff to develop an automated email alert to notify the Blood Bank Medical Director and Transfusion Safety Officer when final culture results are available. The purpose of this project was to determine whether this intervention decreased TAT for EMR documentation of culture results.
Study Design/Methods: We implemented the automated email alert on August 16, 2016. We manually reviewed transfusion reaction clinical notes for all cultured residual products from February 1, 2016 until August 15, 2016 (pre‐implementation period) and August 16, 2016 until February 28, 2017 (post‐implementation period). We measured the number of days between the original transfusion reaction note and the entry of the addendum with the final culture results. We used a student's t test to determine whether there was a statistically significant difference in the mean TAT for result addendum entry in the post‐implementation period compared to the pre‐implementation period.
Results/Findings: In the pre‐implementation period, we cultured 19 residual products for suspected STR. The TAT for final culture result entry into the patient's EMR was 5‐78 days (mean 19 days, SD 20). In the post‐implementation period, we cultured 22 residual products for suspected STR. The TAT for final culture result entry into the patient's EMR was 5‐12 days (mean 7 days, SD 2; p=0.0082). There were no positive cultures during either study period.
Conclusion: Our study demonstrates that TAT for documentation can improve with the use of information technology to notify the Transfusion Medicine physician when results are available for documentation in a patient's EMR.
AP104
Improved Turnaround Time of Type and Screen Samples
Michaelene Hultman*1, Marcus Holme1, Johnathan Bakst1, Gunta Musa1 and Angela Treml2
1University of Chicago Medicine, 2University of Chicago
Background/Case Studies: The primary test performed in the Blood Bank with regard to pre‐transfusion testing is the Type and Screen (TYS). The current target for this institution's blood bank is an 80 minute turnaround time (TAT). In April of 2016, the blood bank was forced to move to a temporary location due to building construction, which necessitated a switch from automated solid phase methodology to manual gel method. The average number of outliers increased 104%. TAT analysis of a representative one week sampling per month showed an increase in outliers from 28 per month to 57 per month. Average monthly TYS samples performed is 2758. These numbers did not improve even upon returning to the original facilities.
Study Design/Method: Two Ortho Clinical Diagnostics Vision® Analyzers (Raritan, N.J.) were purchased for the blood bank. The instruments were set up with a bi‐directional interface allowing for samples to be continuously loaded without manually ordering the tests. Batch testing was eliminated allowing samples to be run as received. The results were auto interpreted, and transmitted to the laboratory information system (LIS) based on predetermined rules. Only results in need of manual review or interpretation were held back. Final verification of results was performed by the technologist within the LIS. Reagents and other needed consumables could be preloaded on the instruments eliminating the need to repeatedly load consumables with each sample run. Key quality indicators including TAT continued to be monitored throughout implementation. Data was monitored for significant changes and improvements in patient care. The go‐live date was 12/20/2016.
Results/Finding: The average number of outliers decreased 61% from 57 per month to 22. Further benefits include a reduction in the number of technologists needed to perform TYS testing. Additionally, reduced waste due to better utilization of supplies by the instruments along with less repeat testing has resulted in projected cost savings of $134,000 for fiscal year 2017.
Conclusion: The use of gel technology, in combination with a two way interface and a continuous load instrument can result in a significant decrease in TAT over manual gel method.
Table‐ Representative One Week Random Sampling of Outliers per Month. [Color table can be viewed at http://wileyonlinelibrary.com]

AP105
Improvements in the Timely Reporting of Final Product Culture Results in the Patient's EMR.
Barbara A. Hewitt*
Dartmouth Hitchcock Medical Center
Background/Case Studies: In certain transfusion reactions it is required that a culture of the returned blood product be performed. These cultures are reported in our Cerner operating system but those results do not cross over to the patient's EMR . The finalized product culture results are entered into the patient's EMR as an addendum to the transfusion reaction clinical note. A review of the Transfusion Reaction database revealed that there were occasions when the final product culture results were not entered into the patient's EMR in a timely manner. It is important to the patient's care for the Transfusion Medicine Service and the patient's primary provider to know if a transfusion reaction is related to a contaminated product or the patient's general overall health. This information is also crucial to the supplier of the product to determine if others have received components of the affected unit and to possibly determine if there are any quality control issues at the donor facility.
Study Design/Methods: A review of a specific 7 month period revealed that the timeframe in which the finalized product culture results were entered into the patient's EMR ranged from 0‐65 days with a mean of 13.64 days. It was determined that this was not in the interest of improving patient care. In collaboration with Laboratory Information Services a report was created in which once product culture results were finalized an email would be generated notifying the Medical Director and the Transfusion Safety Officer that results were available.
Results/Findings: Data was collected for 7 months following the implementation of this report and it was noted that timeliness of finalized product culture results being entered into the patient's EMR improved to a range of 0‐7 days with a mean of 2 days.
Conclusion: Improvements in patient care require diligence and timely reporting of finalized culture reports to determine potential causes of transfusion reactions. This process can be made easier when the correct tools are used.
AP106
Improving RBC Transfusion Practices to Prevent Graft Versus Host Disease
Omer Ilyas*1 and Randy Levine2
1Northwell Health, 2Lenox Hill Hospital
Background/Case Studies: Transfusion of non‐irradiated blood in patients with hematologic malignancies and those receiving cytotoxic chemotherapy can result in life‐threatening Graft Versus Host Disease (GVHD). After noting several instances where non‐irradiated blood was transfused in patients requiring irradiated blood, we designed a quality improvement project with educational sessions involving the oncology unit and blood bank.
Study Design/Method: The project was separated into three parts. In the first part, data on transfusion practices was retrospectively collected over a four month period on the oncology unit. The variables collected included date and time of transfusion, pre‐ and post‐ transfusion hemoglobin, patient diagnoses, and whether or not blood was ordered to be irradiated and if so, whether or not irradiated blood was issued by the blood bank. All patients with hematological malignancies and all patients receiving cytotoxic chemotherapy were candidates for irradiated blood. The second part of this project was an educational intervention. Residents, oncology floor nurses, and blood bank staff were given lectures on the importance of transfusing irradiated blood on the oncology floor. Residents were also instructed to order irradiated blood for all patients on the oncology unit. In the third part of this project, repeat data was collected over a two month period to assess whether the intervention was successful.
Results/Finding: Pre‐intervention, 67 units were transfused on the oncology floor with 38 units (57%) requiring irradiation and only 22 of those 38 units (57%) ordered as irradiated. Since the blood bank occasionally issues irradiated blood without a specific order, 9 additional irradiated units were issued (31/67; 46%).
Post‐intervention, 29 units were transfused on the oncology floor with 15 units (52%) requiring irradiation and all 15 of those units (100%) ordered irradiated specifically to prevent GVHD. Eight additional irradiated units were ordered with no requirement for irradiation; thus 23 of the 29 (79%) total units were ordered as irradiated. Again, 4 additional irradiated units were issued (27/29;93%) without a specific order by the blood bank. The results are summarized in the accompanying table.
TABLE. AP106
| pRBC Units Transfused | Ratio of Ordered or Issued Units/ Total Number of units transfused | Ratio of Units Ordered or Issued/Units Requiring Irradiation | Percentage of pRBC units Transfused | ||
|---|---|---|---|---|---|
| Pre‐intervention | Total | 67 | N/A | N/A | 100% |
| Required Irradiation | 38 | 38/67 units | N/A | 57% | |
| Ordered Irradiated to prevent GVHD | 22 | N/A | 22/38 units | 57% | |
| Ordered irradiated | 22 | 22/67 units | N/A | 33% | |
| Issued Irradiated | 31 | 31/67 units | N/A | 46% | |
| Post‐intervention | Total | 29 | N/A | N/A | 100% |
| Required Irradiation | 15 | 15/29 units | N/A | 52% | |
| Ordered Irradiated to prevent GVHD | 15 | N/A | 15/15 units | 100% | |
| Ordered irradiated | 23 | 23/29 units | N/A | 79% | |
| Issued Irradiated | 27 | 27/29 units | N/A | 93% |
Conclusion: This quality improvement project demonstrates that educational intervention can succeed in changing clinical practices. Continued monitoring of ordering practices will ensure that compliance continues. We plan to expand the quality improvement project to other settings, including the emergency department and surgical floors. We expect that adherence to transfusion guidelines in this patient population will reduce the incidence of adverse events.
AP107
Instrument Flags and Quality Control Failures
Samantha Ngamsuntikul*1, Charlotte Van Dyke2, Dina Garza Van Hoose2 and Rachel Beddard1
1BioBridge Global, 2South Texas Blood and Tissue Center
Background/Case Studies: At our blood center, apheresis platelets and red cells are collected on Trima Accels and double red cells on Haemonetics 8150s. In addition to routine quality control (Qc), Qc is performed for instrument flags on collection instruments. Quality control for apheresis platelets includes: volume variance and rWBC; quality control for apheresis red cells includes: product volume, volume variance, hemoglobin and red blood cell mass.
Study Design/Methods: During the period of January 1, 2016 to April 19, 2017, 2,097 total collections were flagged for additional Qc by our Trima Accels and Haemonetics 8150 instruments. Quality control at our center is tracked by our quality control software management system, HemaTerra's HemaComply which allows the ability to track and retrieve this information.
Results/Findings: The Trima Accels flagged 851 units for additional Qc‐ 808 Trima apheresis platelet procedures (out of 16,285) and 43 Trima red cell procedures (out of 4,330). The Haemonetics 8150s flagged 1,246 double red cell procedures (out of 18,008 total procedures) for additional Qc.
Trima apheresis platelet procedures additional Qc failures: 96 total failures/808 units flagged
| Volume Variance | 55 (57.3% of failures) |
| rWBC | 41 (42.7% of failures) |
Trima apheresis RBC procedures additional Qc failures: 5 failures/43 units flagged
| Volume Variance | 3 (60% of failures) |
| Hemoglobin (Hgb)/RBC Mass | 1 (20% of failures) |
| Volume Variance/Hgb/RBC mass | 1 (20% of failures) |
Haemonetics 8150 procedures additional Qc failures: 54 failures/1246 units flagged
| Volume Variance | 4 (7.4% of failures) |
| RBC Mass | 1 (1.9% of failures) |
| Product volume/Hgb/RBC Mass | 1 (1.9% of failures) |
| Hemoglobin (Hgb)/RBC Mass | 40 (74% of failures) |
| Hemoglobin (Hgb) | 7 (13% of failures) |
| Volume Variance/Hgb/RBC mass | 1 (1.9% of failures) |
Conclusion: The majority of products flagged for instrument Qc pass and are released for distribution. A small percentage, however do fail Qc leading to loss of product. Quality control data can be retrieved and monitored for trends using a quality control software management system.
AP108
IQCP Tool Implementation for Performing Quality Control Tests on Cellular Products
Andrea Wilson*
Dana Farber Cancer Institutes
Background/Case Studies: In 2015, The Centers for Medicare & Medicaid Services (CMS) rolled out a plan for implementing IQCP (Individualized Quality Control Plan) as a new quality control option based on a risk management plan for CLIA laboratories performing non‐waived testing. This plan was meant for CLIA approved tests, but serves as a good tool for labs performing non‐traditional and traditional tests on non‐traditional samples.
Study Design/Method: CLIA Clinical laboratories can either follow traditional clinical CLIA QC requirements according to the regulations or Implement IQCP. While we perfrom traditional QC assessments on all the tests we perfrom on our cellular products we did decide to implement the IQCP program within in our Quality Control Laboratory.
We followed the IQCP process for assessing some of our QC tests used to assess the safety, purity and potency of our cell based products. One test in particular where we applied this tool was in the review of our QC sterility testing method and found it to be a very useful in improving the overall process. The tool walks you through three process requirements: 1) Risk Assessment, 2) Quality Control Plan and 3) Quality Assessment for the pre‐analytical, analytical and post analytical phases of testing.
Results/Finding: Risk Assessment Results
Conclusion: The integration of the IQCP into the Quality Control Laboratory was determined to be a success. The IQCP tool was successful in identifying gaps within the sterility testing process. This tool will be used on additional quality control tests and manufacturing processes. The implementation of the IQCP program ensure regulatory QC requirements appropriate for testing performed. We were able to revise our procedures, reeducate those involved in the process and hopefully minimize potential sources of error.
AP109
Objective Performance of Massive Transfusion Protocols at a Single Institution
Gustaaf de Ridder*1, Rachel Jug1, Kimberly Ingersoll1, Nicholas Bandarenko2, Nicole Guinn3 and Jessica Poisson2
1Duke Health Pathology, 2Duke University Hospital, 3Duke Health Anesthesiology
Background/Case Studies: Hemorrhage is both a leading cause of mortality in trauma patients and morbidity in non‐trauma patients. Using a balanced 6:6:1 transfusion ratio (TR) for massive resuscitation is recommended based on trauma data. Objective performance during Massive Transfusion Protocol (MTP) activations is poorly studied and there may be differences based on site or medical service of MTP initiation. With the impending release of a unified, redesigned Exsanguination Protocol (ExP) at our institution, we established baseline performance characteristics for our existing MTP and Obstetric Massive Transfusion Protocol (OBP).
Study Design/Method: Following Institutional Review Board approval, we performed a retrospective study on blood product utilization and outcomes of MTP and OBP activations from July 2015‐December 2016. Data were manually collected from transfusion service paper records, electronic (SafeTrace) records, and an automated data report from the electronic medical record (Epic).
Results/Finding: During the study period, there were 50 OBP and 72 MTP activations. The RBC:plasma:platelet (apheresis):cryoprecipitate transfusion ratio (TR) for the OBP was 5.2:2.4:1:2.1 and 7.4:5.3:1:0.86 for the MTP. Among MTP cases, there were 39 trauma and 33 non‐trauma cases. The non‐trauma TR was 5.6:4.1:1:0.87 and the TR was 10.1:7.2:1:0.84 for trauma cases. There were 34 MTP activations in the Emergency Department (TR=9.3:6.4:1:0.88), 25 in the operating rooms (TR=6.8:5:1:0.78), 11 in the ICUs (TR=4.4:3.6:1:1), and 2 “other” (TR=8:4:0:0). Mortality (M) at 1 and 30 days, and mean length of stay (LOS) in the hospital are listed in the table below.
TABLE. AP109
| RBC | PLASMA | PLT | CRYO | LOS±SE (days) | 24h‐M | 30d‐M | ||
|---|---|---|---|---|---|---|---|---|
| OBP | N=50 | 119 | 55 | 23 | 49 | 3.7 ± 0.3 | 0% | 0% |
| TR | 5.2 | 2.4 | 1 | 2.1 | ||||
| MTP | N=72 | 835 | 604 | 113 | 97 | 22 ± 4 | 32% | 8% |
| TR | 7.4 | 5.3 | 1 | 0.86 | ||||
| MTP‐ED | N=34 | 297 | 205 | 32 | 28 | 30 ± 8 | 29% | 6% |
| TR | 9.3 | 6.4 | 1 | 0.88 | ||||
| MTP‐OR | N=25 | 403 | 296 | 59 | 47 | 16 ± 3 | 28% | 4% |
| TR | 6.8 | 5 | 1 | 0.78 | ||||
| MTP‐ICU | N=11 | 84 | 69 | 19 | 19 | 9 ± 4 | 45% | 18% |
| TR | 4.4 | 3.6 | 1 | 1 | ||||
| MTP‐Trauma | N=39 | 456 | 325 | 45 | 38 | 27 ± 7 | 33% | 3% |
| TR | 10.1 | 7.2 | 1 | 0.84 | ||||
| MTP‐Non‐ trauma | N=33 | 379 | 279 | 68 | 59 | 15 ± 4 | 30% | 15% |
| TR | 5.6 | 4.1 | 1 | 0.87 |
Conclusion: We observed considerable variability in transfusion practices during acute hemorrhage depending on the service and location of activation. Trauma activations demonstrated the sharpest deficit in platelet transfusion, whereas all groups lagged somewhat in transfused plasma relative to packed red blood cells. LOS and mortality varied among groups, likely reflecting underlying medical conditions and indications for massive transfusion. We have identified an opportunity for improvement in MTP transfusion ratios observed in trauma cases, the specific environment from which the 6:6:1 ratio was derived, and in which the impact of protocol‐driven blood resuscitation is most efficacious.
AP110
Patient Identification Improvement Strategy to Help Reduce Unacceptable Specimens
Arline Stein*1, Nancy Nikolis1, Linda Benison1, Ruthmire Thelusca1, Renee Liberty1, Sherry Shariatmadar1, Alexander Indrikovs2 and Vishesh Chhibber1
1North Shore University Hospital, 2Northwell Health
Background/Case Studies: Our blood bank (BB) processes approximately 60,000 specimens per year. BB specimens are unacceptable when they are unlabeled, unsigned or missing necessary documentation. In such cases, a new specimen is requested to be drawn as per protocol. Our investigation of unacceptable specimens previously included generation of a report by the blood bank staff that was subsequently submitted to the BB supervisor for completion. Following completion, the report was sent to the Nurse Manager of the patient care unit (PCU) for follow‐up and investigation with the staff members involved. This process was cumbersome, taking a few days before the staff member of the PCU was alerted to the deviation in protocol. At times, residents or float staff involved were difficult to identify and it was often challenging to track down the staff and do the necessary investigations and in‐services.
Study Design/Method: In June 2016, a Patient Identification Improvement Strategy was implemented jointly by the department of nursing and the BB to address mislabeled, unlabeled and unsigned specimens as part of a Patient Safety Initiative. Currently, following this strategy, when an unacceptable specimen is received, the Nurse Manager (NM) of the PCU is immediately notified by BB Staff. The NM promptly initiates a debrief process with the staff involved in drawing the specimen. A debrief form (tool) was created to guide the discussion. This process is followed 24/7. The NM will also engage other available staff in a huddle to review the incident and reinforce the policy. The debrief form is then submitted to hospital QA and the BB with preventative actions included.
We believe in using the JUST CULTURE MODEL to help us understand the reasons why the staff did not label the specimen according to policy. Just culture helps promote shared accountability to ensure we have the proper systems and processes in place to deliver high quality care.
Results/Finding: The table below represents the percentage of unacceptable specimens identified by the BB since the second quarter of 2016.
Table 1: BB Unacceptable Specimens Q2 2016 through Q1 2017

The implementation of this new process has led to a decrease in the number of unacceptable specimens up to 30% quarterly following its implementation. The opportunity for direct intervention by the NM with the staff involved has risen from 75% to 96%, due to the immediate debrief process.
Conclusion: The Patient Identification Improvement Strategy allows for real time engagement of the BB and PCU staff to promptly investigate and institute corrective/preventive actions when there is a deviation from policies related to specimen collection. The heightened awareness of correcting patient specimen labeling errors can only improve patient safety and the patient experience.
AP111
Platelet Transfusion Practices Among Pediatric Oncology Patients: A Single Institutional Experience
Nicole M Crews*1,2, Morgan Rockwell2, Joseph Hagan1, Jun Teruya1,2 and Shiu‐Ki Hui2
1Texas Children's Hospital, 2Baylor College of Medicine
Background/Case Studies: Despite advances in adult platelet transfusion (PTx) literature, questions persist regarding pediatric transfusion thresholds, dosage and responses. Therefore, PTx are commonly guided by local institutional recommendations (IR). The aim of this study was to determine the degree of adherence of PTx practice to IR at a pediatric tertiary institution.
Study Design/Method: Retrospective review of PTx practices including transfusion thresholds, responses and dosages were collected. Platelet counts within 24 hours pre and post transfusion were evaluated. Patients (0‐18 years) receiving prophylactic PTx from July to December 2016 admitted to the oncology acute care unit with diagnosis of leukemia or lymphoma were included. For prevention of volume overload, the IR for PTx were < 10ml/kg for patients < 35kg and one apheresis unit (AU) for patients >35kg; therefore, patients were separated into 2 groups: < 35kg and > 35kg.
Results/Finding:
| Demographics | ≤ 35kg | > 35kg |
|---|---|---|
| Patients (n) | 40 | 29 |
| Weight range (kg) | 9‐35 | 37‐103 |
| Transfusions (n) | 206 | 233 |
| Platelet threshold | < 35kg | > 35kg |
|---|---|---|
| <20 X 103/µL | 67% | 45% |
| >20 X 103/µL | 33% | 55% |
| Frequency of orders outside of patient threshold | 20% | 13% |
| Dosing for < 35kg | Percentage |
|---|---|
| < 5mL/kg | 27% |
| > 5 ‐ 10mL/kg | 61% |
| > 10mL/kg | 13% |
| Dosing for >35kg | Percentage |
| 1 apheresis unit | 89% |
| 2 apheresis units | 11% |
| Change in platelet count | Increase in platelet (x103/µL) | p‐value |
|---|---|---|
| < 35kg | ||
| < 5mL/kg versus > 5mL/kg ‐ 10mL/kg | 31 ± 19 versus 41 ± 28 | p = 0.015 |
| < 10mL/kg versus >10mL/kg | 37 + 26 versus 46 + 26 | p = 0.156 |
| > 35kg | ||
| 1 versus 2 apheresis units | 20 + 15 versus 26 + 15 | p = 0.218 |
A significant proportion of orders for both < 35kg and > 35kg did not meet patient platelet threshold criteria (p<0.001).
Conclusion: PTx threshold above IR for both groups were 31 (≤ 35kg) and 48% (> 35kg). Most common reason for above IR threshold was an invasive procedure or low molecular weight heparin therapy. Greater than 10% of PTx dosage in both groups were above IR, however the platelet response did not increase significantly (p>0.05) with a higher dose vs. IR dose. This study demonstrated that there were still considerable deviations from IR in PTx practice among pediatric oncological patients. In addition, the false assumption that a higher dose will yield a better response can put patients at increased risk for transfusion related adverse events. Each institution should conduct a quality assurance review to determine PTx practice.
AP112
Pre‐Surgical Sample Process Improvement to Enhance Patient Safety and Compliance
Lisa Marie Button*, Stephanie Saathoff, Jered Luedke, Benjamin Colvin, Umalkair Amare and James R Stubbs
Mayo Clinic
Background/Case Studies: Our institution provides the option for pre‐surgical samples (PSS) to be drawn up to 56 days prior to surgery as long as the patient reports not being transfused with a blood or blood component containing allogeneic red cells and they have not been pregnant in the preceding 3 months from the date of PSS collection. When PSS patients returned for surgery, the patient's service was required to ask the patient again about their transfusion and pregnancy history to determine if there had been any new opportunities for allogeneic red cell exposure, however, there was no process to capture the information the patient reported for the time between the PSS draw to the day of surgery/possible transfusion.
Study Design/Method: An electronic fix was designed that was applied to the surgical intake process. A new set of questions was added to the A.M. Admit questionnaire that must be completed prior to the patient's surgical procedure. The questions ask the patient if they have been pregnant or transfused in the preceding three months and if the answer is affirmative, the computer system runs a blaze rule causing an alert in the blood bank. The blood bank techs review the alert and inactivate the patient's PSS based on the new transfusion/pregnany information. One year post‐implementation of the electronic fix, Transfusion Lab performed a retrospective review of all PSS alerts generated during a three‐month period.
Results/Finding: The results of the review were analyzed and are displayed in the Table. It was determined that only 2.1% of patients with a PSS Alert had an active sample requiring inactivation.
TABLE. AP112
| Oct 2015 – Dec 2015 | |
|---|---|
| PSS Alerts Generated | 805 |
| • PSS Alerts with an active sample | 17 (2.1%) |
| • PSS Alerts for a patient with no sample | 788 (97.9%) |
| Indications for PSS Inactivation | |
| • Patient reported blood in past 3 months | 624 (77.5%) |
| • Patient reported pregnancy is past 3 months | 195 (24.2%) |
| • Patient reported both pregnancy and transfusion | 14 (1.7%) |
Conclusion: Implementing an electronic solution that requires documentation about PSS eligibility upon return for surgery has resulted in an estimated 3220 (805x4) PSS Alerts in the blood bank each year. Of these Alerts, it is estimated that approximately 68 patients (17x4) per year are identified as no longer eligible for PSS status. Once this retrospective review was performed, it was shared with the project stakeholders to determine if the electronic questionnaire could be further tailored to patient's based on age, gender, and PSS status. While the benefit of having fewer false positive PSS alerts (97.9%) was recognized as an ideal future state, it was not compatible with the institution's current IT project of implementing a new Electronic Medical Record (EMR) system. The safety enhancement provided by the current electronic fix will remain as is and the improvement suggestions were shared with the team creating the parameters for the new EMR with the intention of targeting only patients with an active PSS in the blood bank, rather than all surgical patients.
AP113
Redesign of Electronic Blood Product Ordering Process Using Failure Modes and Effects Analysis (FMEA)
Kathleen M Crowley*1, Michelle Evangelista2, Stephanie Forest3, Sylvia Parker Jones4, Dian Lo5, Kathleen Kane2, Anna Nachamie6, Ljiliana Vasovic6, Joseph Schwartz7 and Melissa Cushing6
1NewYork Presbyterian Hospital Weill Cornell Med. Ctr., 2NewYork‐Presbyterian Hospital, 3NewYork Presbyterian Hospital Columbia University Medical Center, 4NewYork‐Presbyterian Hospital Columbia University Medical Center, 5NewYork‐Presbyterian Hospitla Weill Cornell Medical Center, 6Weill Cornell Medicine, 7Columbia University School of Medicine
Background/Case Studies: Blood ordering is a complex, high‐risk process with multiple steps that have the potential for errors and delays. Risks associated with this process, from ordering through pick‐up, require evaluation and strategies for mitigation. Given the complexity and high–risk nature of blood ordering a proactive risk assessment (PRA) for blood product ordering using the FMEA methodology was conducted. The goal of the project was to proactively assess the effect of a redesigned electronic order set on the quality and safety of blood ordering
Study Design/Method: To evaluate the electronic blood ordering redesign process, a PRA was completed using the FMEA methodology. The team identified each step and sub‐step of the electronic blood ordering process, all failure modes and causes, and then scored each by severity occurrence and detectability to determine the Risk Priority Number (RPN). All RPNs with a score above the threshold were reviewed and rescored based on mitigation strategies designed to address the failure mode.
Results/Finding: The group scored the identified failure modes by categories used in root cause analyses. The electronic blood order process has internal logic and alerts that improve communication and reduce the risk score. Several mitigation strategies that will reduce the risk of the identified failure modes include type and screen status within the RBC order, streamlined alerts when the order does not meet the laboratory threshold, a nursing task list for transfusion, and a change to the pickup process that is linked to the product ready status in the laboratory information system. A transfusion history will be available to providers when ordering blood products to further reduce communication risks.
Categories for failure modes included Clinical,Communication,Equipment People,Process and System. The average overall failure mode RPN was reduced by 29% with the communication category average RPN having the greatest reduction of 72%. Conclusion: An FMEA of an electronic blood ordering process can proactively improve quality and patient safety by preventing transfusion delays and errors in blood product administration. Accurate and timely information in the blood ordering process has the potential to reduce risks associated with ordering,preparing and dispensing blood.
AP114
Reducing Turn Around Time for Type and Screens in the Blood Bank
Kimberly Ouellette*1, Karen King1 and Joseph Sweeney2
1Rhode Island Hospital, 2Lifespan Academic Medical Center
Background/Case Studies: Expeditious turn‐around times (TAT) in the blood bank are critical to provide fully tested and crossmatch compatible blood in a timely manner. The Blood Bank at Rhode Island Hospital, a level 1 trauma center and teaching hospital associated with Brown University, was originally designed to accommodate tube testing by all technologists. The original setup of the lab was split into three sections allowing for preparation and issuing of units in the first section, bench testing in the second, and the receipt of components in the third. As technology changed, the blood bank adopted first the manual gel station and then the automated gel system (Ortho Provue®) but did not adapt the space. The second section of the blood bank contained the manual and subsequently automated gel stations with no other changes. The process of sample receipt through completion of testing and issuing of units remained segmented and inefficient. The average TAT for type and screens was 80 ± 32 minutes.
Study Design/Method: The Blood Bank design was remodeled to make for a more open concept to allow for collaboration amongst technologists as well as the best use of space and technology. The first section of tables were removed and replaced with a center console to allow for movement about the entire front of the laboratory. A wall was constructed to separate the main work flow, automated gel testing and issuing units, from the area for complicated workups and inventory receipt. The third section remained, but was repurposed for teaching medical technology students and residents. In addition to the remodel, the blood bank retired the Ortho Provue® for the Ortho Vision®, which is considered a true continuous feed machine. Although the inter‐device TAT is not significantly different (30 minutes for the Provue® and 28 for the Vision®) the Vision® is built with a scheduler that effectively handles the system and processes samples efficiently. The Vision® is also equipped with two centrifuges to process samples, which further reduces TAT when multiple samples are onboard. A bi‐directional interface was designed to allow for test orders (type and screens) to go to the Vision® and test results to go directly from the Vision® to the LIS without the need to manually order the tests or transmit the results. Data on TAT were collected and analyzed using independent t tests and chi square.
Results/Finding: The mean TAT pre‐ and post‐ reconfiguration and implementation of the Ortho Vision® and a fraction of samples with TAT over 90 minutes are shown in the table.
TABLE. AP114
| Pre | Post | p value | |
|---|---|---|---|
| n | 102 | 301 | |
| Mean TAT | 80 ± 32 | 56± 17 | <0.01 |
| TAT >90 minutes (%) | 27% | 7% | 0.02 |
The results show a reduction in TAT by 14 minutes with a 20% reduction of TAT greater than 90 minutes.
Conclusion: A combination of new technology and space remodeling can lead to a significant reduction of TAT of testing in the blood bank.
AP115
Reducing Type and Screen Rejection Rates
Caleb Wei‐Shin Cheng*1,2, Lorna Orengo3, Monique Scott3 and Christopher A Tormey1,2,3
1Yale University School of Medicine, 2Yale‐New Haven Hospital, 3VA Connecticut Healthcare
Background/Case Studies: The type and screen (T&S) is a fundamental laboratory test that allows the blood bank to provide compatible blood for patients. Despite this, erroneous blood product administration may occur as much as 1in 19,000 blood transfusions. To prevent errors, adequate specimens such as those lacking hemolysis and those with proper specimen labeling are necessary; otherwise the specimen is rejected, leading to a second blood draw and a delay in medical/surgical management. Hemolysis rates for T&S specimens are reported to be as high as 25% prior to interventions, but may potentially be reduced to as little as 1.5%. However, there is little published data on non‐hemolysis‐related type and screen rejections. An initiative was undertaken to reduce the rejection rate in the blood bank to a sustained rate of <5%, with a particular emphasis on non‐hemolysis‐associated forms of rejection.
Study Design/Method: A root cause analysis (RCA) was performed over the preceding 6 months to obtain a baseline understanding of the errors involved. T&S submission at our facility involves standard completion of the specimen label plus completion of a unique witness form to confirm the identity of the patient from whom the specimen was collected; specimen and witness form must be submitted simultaneously. When a specimen was rejected, we recorded the patient name, medical record number, and the reason for rejection. Following RCA, an intervention was created to resolve the most common issues documented that resulted in rejection. Approval for the intervention was granted by the Department Chair, Transfusion Committee, Forms Committee, and the Medical Executive Committee. After implementation, prospective data will be collected for several months in the same manner as before to determine the effectiveness of the intervention.
Results/Finding: Over the study period, the T&S rejection rate averaged 8.2%. Reasons for specimen rejection were divided into 5 groups: 1) hemolysis, 2) blood bank witness collection form errors, 3) quantity not sufficient, 4) duplicate sample, and 5) specimen tube labelling errors. The highest percentage of rejections was due to improperly‐filled witness forms (Table 1). After multiple form redesigns and approval by appropriate committees the new form was implemented. Preliminary data collected thus far demonstrates a 6.8% rejection rate with only 1 rejection relating to witness form errors.
Conclusion: Rejected T&S specimens are an impediment to safe clinical care as it may delay medical/surgical management. Rejection rates could be reduced through simplification of blood bank specimen collection forms. Care providers have multiple tasks that need to be performed in a short amount of time, therefore, simplification is often times necessary to reduce human error. Future quality initiatives will aim to simplify complex healthcare processes without compromising patient care.
TABLE 1. Type and Screen Rejections RCA (6‐month period)
| # of rejections | % of rejections | |
|---|---|---|
| Hemolysis | 35 | 27% |
| Witness Form | 56 | 42% |
| QNS | 7 | 5% |
| Duplicate Draw | 19 | 14% |
| Tube Labelling Issues | 6 | 12% |
AP116
Reduction of Failed Whole Blood Donor Testing Runs on the Roche Cobas s 201 System
Christopher Shahan*1, Christina DeJesus1, Mosi McCall1, Fallon Hampton1, Tangi Herring1, Judy Davis1, Anjali Patel1, Sonya Gomillion1 and Bonnie Maltby2
1QualTex Laboratories, 2QualTex laboratories
Background/Case Studies: As part of our quality control program, we track the number of technician related failed runs observed on the Roche cobas s 201 System. This system is used to test whole blood donor samples for Human Immunodeficiency Virus (HIV) RNA, Hepatitis C Virus (HCV) RNA, Hepatitis B Virus (HBV) DNA and West Nile Virus (WNV) RNA. Technician related failed testing runs can cause the laboratory to report results outside of the contractual 10‐12 hour turnaround time. Failed runs also cause retesting which increases reagent utilization for the system. Currently 42% of whole blood donor testing turnaround time delays are due to issues and failed runs on the s 201 system and we have 3 technician related failures per week. A Lean Six Sigma approach for process improvement was utilized to identify root causes and develop countermeasures in order to decrease the number of technician related failures on the s 201 system.
Study Design/Method: The number of technician related failed runs on the s 201 system were tracked from 10/11/2015 thru 12/11/2016. A Pareto chart was used to determine that technician related errors was the largest controllable factor causing run failures. The 5 Whys were performed to determine root causes of technician related failed runs. A Gemba walk was performed on all of the lab testing processes to help identify areas for improvement. The process Improvement team talked, met, observed, and worked directly with staff that operate the s 201 system. Roche was also contacted to provide guidance on how to help decrease technician related failures.
Results/Finding: The main root cause determined was that there was no current process flow map for whole blood donor testing using the s 201 system. Counter measures implemented included creating a two phase process map. One phase was related to the processes related to start‐up of the system and the second phase was related to the processes involved in processing of samples. Roche provided a job aid for the technicians which provides clear steps technicians should take when handling and cleaning up crashes and failed runs on the s 201 system. After counter measures were implemented, the number of technician related failed runs decreased from 3 to 1.2 failures per week, which was a 58% decrease.
Conclusion: A Lean Six Sigma approach for process improvement was utilized to identify root causes and develop countermeasures in order to decrease the number of technician related failed runs on the cobas s 201 system. This lean six sigma approach and counter measures significantly decreased the number of technician related failed runs by 58%.
AP117
Second Specimen Process and Conditional Orders
Jane Fischman*1, Chandni Patel1, Nancy Nikolis1, Emily Castro1, Vlad Volel1, Andrea Restifo1, Kerri Scanlon1, Lennart Logdberg1, Alexander Indrikovs2 and Vishesh Chhibber1
1North Shore University Hospital, 2Northwell Health
Background/Case Studies: Our Blood Bank processes approximately 4,400 specimens per month. Since 1998, the requirement of having a second blood type on record was met by:
Utilizing the historical blood type and the current specimen, OR
Having second type performed on same specimen by different technologist, AND
Each type and screen specimen signed by 2 staff, one being a licensed practitioner attesting the identification of the patient was done accurately at bedside.
To comply with the AABB Standards 29th edition, #5.16.2.2 a decision was made to change our practices. We considered challenges encountered at other hospitals and collaborated with nursing and IT to create a streamlined and safe process. In April 2016, the second specimen procedure was implemented addressing the following:
Prevent drawing 2 specimens at the same time.
Eliminate need for RN to “track down” a provider to order ABORh.
Minimize drawing unnecessary second specimens.
Avoid delays in providing blood for emergency situations.
Study Design/Method: I. A “conditional order” was created and validated by IT. This order appears in the Electronic Medical Record (EMR) for patients who had a type and screen ordered, but did not have a historical result. The steps to the new process are:
Provider enters order for T&S in EMR.
Conditional ABORh order appears along with T&S (if no previous history).
Patient care staff collects T&S.
T&S arrives in BB.
Blood order arrives in BB.
-
BB determines if a second specimen is required. If Yes:
a. BB calls RN to activate conditional order.
b. ABORh specimen is drawn
In order to eliminate delays, for Emergency Room patients, their specimens are hand delivered and staff are told at point of drop off if a second specimen is needed.
II. Extensive education was provided to all involved in the process prior to implementation including a learning module prepared by blood bank and nursing collaboratively.
Results/Finding:
There was a minor adjustment period with more phone calls made to blood bank to explain the process.
There was minimal impact on turn around times for release of components.
ABORh retype workload decreased from 1500 to 950 (35% to 20% of T&S volume) per month.
Unnecessary blood draws minimized, improving patient experience.
No emergency release requests due to absence of a second specimen.
Conclusion: The second specimen process with the conditional order has been beneficial to our blood bank as well as patient care services. Overall feedback from staff on the process has been positive. Our workload has decreased which results in cost savings and increased efficiency allowing us to devote more resources to the growing services at our institution.
AP118
Snapshot: Assessment of Transfusion Practice at a Large Urban Hospital and Factors Associated with Inappropriate RBC Transfusions
Rahul Lakhotia*, Cathy Conry‐cantilena, Sailaja Pindiprolu, Linda Self and Catlett Joseph
Medstar Washington Hospital Center
Background/Case Studies: The hazards of transfusion are well recognized and in certain cases restrictive transfusion strategies compared to liberal transfusion strategies may be associated with better clinical outcome. With this in mind, AABB and others published guidelines for transfusion, but even with guidelines in place, rate of inappropriate blood transfusions is reported to be as high as 15 to 48%. Computerized Provider Order Entry (CPOE), is a process of electronic medical order entry for medical practitioners with instructions and guidelines for treatment. The objective of this study was determination of transfusion practice quality by thorough chart and electronic medical record review, with measures in place to avoid inappropriate transfusion. Additionally, factors associated with inappropriate transfusion were examined.
Study Design/Method: In our 926 bed hospital, a retrospective chart review was performed (07/01/15‐12/31/15) on hospitalized internal medicine patients. CPOE with hospital guidelines for RBC transfusions were in place. Transfusion thresholds in different clinical settings were determined by a thorough literature review of studies analyzing restrictive transfusion strategy, and transfusion guidelines by various medical societies. Charts for patients who were transfused for pre‐transfusion hgb >7g/dl with resulting post‐transfusion hgb >9g/dl were reviewed. Demographics, medical history, provider identity, indication and transfusion complications were abstracted & compiled individually by 11 volunteer internal medicine residents. Group discussion for each case ensued before determination of transfusion appropriateness occurred. Principal investigator/attending physician then made final determination of appropriateness of RBC transfusion.
Results/Finding: 265 patient charts were reviewed. 91 were excluded for bleeding and cardiovascular instability. 106/174 (60.9%) were determined to be transfused inappropriately. There was no difference in appropriateness of transfusion with respect to age or sex. Patients with solid tumors (76.19% vs 55.73%, p=0.0181) and anemia of chronic disease (76.47% vs 54.1%, p=0.006) were more likely to be inappropriately transfused. Patients who had higher pre‐transfusion hemoglobin were more likely to be inappropriately transfused (median hgb 7.7g/dL vs 7.3g/dL, p<0.0001). Inappropriately transfused patients also had higher median post‐transfusion hemoglobin (9.9g/dL vs 9.4g/dL, p<0.0001). Moreover, lab evalutions revealed association with lower folate levels (median 8.1 nmol/L vs 15.7 nmol/L, p=0.029). 29/106 (27.3%) patients were inappropriately transfused at least in part because they received more than one unit without an interval hemoglobin check in between. 7/64 providers were responsible for 32.3% of all inappropriate transfusions. 1/68 appropriately‐transfused patients experienced an FNHTR. 3 deaths unrelated to transfusion occurred (1 in appropriate, 2 in inappropriate group).
Conclusion: Physicians in training are interested in promulgating optimal RBC transfusion practice. This study identified patient factors (such as solid tumors and anemia of chronic disease) that correlate with a higher likelihood of receiving an inappropriate transfusion. Beyond CPOE, educational intervention at individual level should be designed for specific providers responsible for more inappropriate transfusions.
AP119
Successful Implementation of a Blood Bank Information System in a Small‐Scale Caribbean Blood Bank: A Structured Step‐Wise Approach.
Luigi Sille*1, Willem Martin Smid2 and Ashley John Duits1
1Red Cross Blood Bank Foundation, 2Sanquin Consulting Services
Background/Case Studies: An important tool for complying with GMP quality standards is the effective use of a blood bank information system (BIS). Validation and implementation of a BIS is described for centralized large blood bank and literature and guidelines are lacking for the non‐automated small scale blood bank environment. .
Small‐scale blood banks face specific challenges for computerization in relation to economies of scale and existing processes requiring special attention. For the introduction of a BIS at the blood bank of the Dutch Caribbean island of Curaçao a specific procedure was designed based on existing guidelines and adapted to the local setting.
Study Design/Method: The Red Cross Blood Bank Foundation Curaçao is the sole provider of labile blood components for the Dutch Caribbean islands of Curaçao, Bonaire and Sint Maarten. After selection of the BIS provider for implementation ISBT and BCSH guidelines for validation of information systems in blood establishments were carefully analyzed to prepare the design of local procedures. These procedures were meant to evaluate and validate the features of a BIS (e‐Delphyn, Hemasoft America, Miami, USA) before introduction. The outcome of the approach was entered in worksheets that were evaluated by the implementation team and management. From this the implementation plan was designed and implemented. An external auditor (Sanquin Consulting Services, Amsterdam, Netherlands) was invited to evaluate the implementation and validation plan and its practical implementation. The evaluation was performed according to risk assessment of critical process steps.
Results/Finding: Based on the ISBT and BCSH guidelines a process flow chart describing the relevant phases and critical steps for introduction and validation of a BIS was designed. Comparison of the current processes and procedures were compared to the BIS characteristics making use of 8 worksheets. With these worksheets the existing gaps with the BIS procedures were carefully described. These gaps and the appropriate procedural changes for BIS or blood bank were effectuated.
The worksheets also provided the basis for staff training in a separate training environment before BIS introduction. During the early validation phase all procedures and processes were audited by an external auditor. With the feedback of the expert several improvements were added for the validation and subsequent implementation processes.
Conclusion: With the use of existing international guidelines a validation and implementation plan was designed to prepare for successful introduction of a BIS in a small scale Caribbean blood bank. The program as designed seems well suited for small scale blood banks contemplating introduction of a BIS.
AP120
Time and Cost Savings through Implementation of a Remote Blood Fridge
Jessica Peters*1, Dee Dee Cassidy1, Jed B Gorlin1,2 and Nancy L Van Buren1,2
1Hennepin County Medical Center, 2Innovative Blood Resources
Background/Case Studies: Rapid delivery of emergency release group O red blood cells (RBC) are vital to patient care. Commercial remote blood fridge packages are available but have large upfront and maintenance costs. We implemented a remote blood fridge directly in our Emergency Department (ED) using an under counter fridge requiring ID access, and a self‐developed IOS application that scans, tracks and real‐time alerts Transfusion Service (TS) to products used and to whom they were dispensed. Prior to ED fridge implementation, RBC units were verbally requested and an ED blood runner would pick up and return the cooler. Given that our ED is located in a separate building from the TS, this meant 10 or more minutes may be required for transit of units often released in less than 5 minutes. The net effect was that providers would routinely order products to ensure they were at the bedside for patient arrival as a precaution, only to return them when not required. Implementing a blood fridge at bedside resulted in the predicted outcome of delivering emergency release RBCs more quickly, with the observed benefit of decreasing wasted staff time.
Study Design/Method: The remote blood fridge was implemented in July 2016. Data for RBC requests in coolers, RBC returns and RBC transfusions from the ED was collected and compared. Baseline data included January 2015‐ June 2016, and post change included August 2016‐ December 2016. July 2016 data was excluded as it included both the pre and post processes.
Results/Finding: Baseline data shows that the ED requested an average of 99 RBC/month in coolers. Post change this dropped to 62 RBC/month, thus less blood was requested from the transfusion service in coolers as units were being used from the fridge. Baseline data also shows that an average of 54 RBC/month were returned (55%). Post change, the average RBC/month returned was 27 (44%), this represents an absolute 50% reduction in number of returned products. Each RBC dispensed and returned takes approximately 20 minutes to complete paperwork and transport, therefore this change saved an average of 540 minutes per month. It was also noted that the average RBC/month transfused was 44 for baseline and 57 post change. This confirms that the decreased requests and returns were not due to decreased patient volume or severity. The fridge was also successful at decreasing delivery time of blood to patient bedside, as baseline delivery time of 15‐20 minutes (estimated) was reduced to 3‐5 minutes.
Conclusion: Implementing a remote blood fridge and moving blood access closer to patient bedside ensures a faster delivery of blood to the patient. This change has an additional benefit of decreasing wasted time, and hence cost, by decreasing unnecessary product requests and returns. Implementing a blood fridge can also be done at a reduced cost through homegrown processes.
AP121
Towards Internet of Things in Transfusion Medicine: A Low‐Cost Real‐Time Individual Intravenous Blood‐Transfusion Monitoring System
Basile Spyropoulos*
Biomedical Engineering Department, Technological Education Institute of Athens
Background/Case Studies: Internet of Things (IoT) Technology enables automation of an increasing number of Medical and Nursing Procedures in modern Health‐care. Intravenous Blood, Red‐cells Fresh‐frozen Plasma etc. Transfusions are everyday procedures and over 250 Patent‐applications have been filed related to “Transfusion Medicine” and over 400 related to “Transfusion Alarm”, during the last 30 years, employing numerous technical settings, aiming to support automated supervision of the mentioned actions. The aim of this contribution is to present a developed low‐cost real‐time individual Intravenous Blood‐Transfusion monitoring system, based on the Internet of Things.
Study Design/Method: The designed system is based on a commercially available Pan–Tilt–Zoom (PTZ) camera, employing an 1/4 inch color CMOS Sensor, providing effectively 1.0 MP, a 3.6mm Lens, IR‐cut, Day/Night Minimum Illumination 0.1 Lux/F1 and 80° Viewing Angle.
The camera is focused on the droplets and acts as VIS/IR Detector with a 24 Hz sampling‐rate. Custom‐developed software supports droplets’ rate‐monitoring, causing acoustic alarm‐signals if necessary (e.g. clotting, blood or other suspensions depletion etc.) and enables, if necessary, wide‐angle image‐capturing.
The Video Image‐Audio Settings provide for Compression H.264, Video Frame Rate (FPS) 1‐30/s, Refresh Rate 50 Hz and Audio Input, through bidirectional built‐in Microphone.
The acquires an IP‐address, the connection mode is Wireless, the Network Interface is Wi‐Fi/802.11/b/g, the supported Protocols include DHCP, TCP/IP, UPNP, HTTP, SMTP and P2P is provided. Typical 5V Power‐Supply, sized 165x125x101mm and weighing 370g. Client Software is required.
The IR range is 10‐15m; IR‐Cut Filters, Remote Access, Dual Stream, Motion Detection, Day/Night and IR Night Vision Distance of 10m are offered. Two‐way radio‐link is provided, as well as, Trans‐Flash (TF) recording and storage on a 32 GB SD‐Card. Pan/Tilt‐Horizontal 355o and Pan/Tilt‐Vertical 90o movements can be performed.
The system facilitates, if needed, also patient's position monitoring and readings of other monitoring displays, such as NIBP, ECG, and SPO2, if present.
Results/Finding: The system and is being presently tested in a laboratory (non‐clinical) environment, by simulating the virtual patient, with a custom‐made “phantom”, combining flow‐rate, negative pressure and viscosity resistance regulation.
Conclusion: The system can measure infusion‐speed with a deviation lower than ± 3 %. The developed IoT‐system takes advantage of the existing Hospital Wi‐Fi networked environment and offers a low‐cost solution, under 20 $ for each monitoring‐set. It allows for even multi‐platform (IOS, Android, Windows) smart‐phone, short‐range connectivity, for up to 4 participants, for example Nurse, Physician etc.
AP122
Two Potential Approaches for the Quality Control of BacT/ALERT® Culture Media Using Various BioBall™ Organism Preparations
Patricia Rule*, Michelle Keener and Christine Crawford
bioMerieux Inc.
Background/Case Studies: The BacT/ALERT® BPA and BPN culture bottles are used with the BacT/ALERT Microbial Detection System for rapid screening and detection of microbial contamination in Leukocyte Reduced Apheresis Platelets (LRAP). Recent changes in the CLIA quality control guidelines and AABB accreditation program will require additional quality control of manufactures media that is both lot specific and shipment specific to ensure recovery of bacterial growth. A study was conducted using commercially prepared organisms evaluating both a comprehensive organism panel as well as a streamlined method utilizing only two organisms from the panel.
Study Design/Method: The general protocol consisted of three replicates each of each organism inoculated into two lots each of BPA and BPN by two different analyst. The study was two part in that Aspergillus brasiliensis, Candida albicans, Bacillus subtilis subsp. spizizenii, Pseudomonas aeruginosa, Escherichia coli, Clostridium sporogenes, Staphylococcus aureus and Streptococcus pyogenes were prepared from BioBall SingleShot (30 CFU), MultiShot 550 CFU or HighDose 10K organism preparations at a low level (< 50 CFU) and evaluated on the same day of preparation as method validation. The second part of the study utilized Escherichia coli and Staphylococcus aureus prepared and frozen at a higher level and then evaluted over a 14 day study as a stream line approach to routine quality control testing of the BacT/ALERT culture bottles. Inoculation preparations were enumerated in duplicate to confirm the level at each inoculation time point. Inoculated BPA and BPN bottles were loaded into the BacT/ALERT Microbial Detection system at 36 ºC for automatic monitoring of growth. Negative BPA and BPN bottles were included in duplicate at each day of testing.
Results/Finding: Escherichia coli, Staphylococcus aureus, Streptoococcus pyogenes and Bacillus subtilis subsp. spizizenii were positive in both the BPA and BPN culture bottles. The aerobic Aspergillus brasiliensis, Candida albicans, and Pseudomonas aeruginosa grew and were reported positive in only the BPA aerobic culture bottle as expected. While the obligate anaerobe, Clostridium sporogenes was positive only in the anaerobic BPN culture bottles. Bacterial cultures were positive in the BacT/ALERT BPA and BPN bottles < 1 days and the fungal organisms in < 2 days. The overall agreement was 99.8 % in 698 bottles tested here. No significant differences were observed in the time to detection between the different lots or between the different analyst.
Conclusion: The BioBall prepared organisms demonstrated a reproducible method as both a comprehensive and streamline approach for the quality control of BacT/ALERT BPA and BPN culture media. The method was simple and did not require additional microbial preparations or storage of live organisms by the laboratory.
AP123
Use of an Electronic Patient Identification System for Blood Banking Specimen Labeling Found to be Superior over Historical Armband Approaches
Annie Newton*1, Diane Schafer2, Debra Brown1, Jesse Cox3, Scott Koepsell3 and Sara Shunkwiler3
1Nebraska Medicine, 2The Nebraska Medical Center, 3University of Nebraska Medical Center
Background/Case Studies: Anticipating the implementation of the new (30th addition) AABB standard concerning the confirmation of patient ABO blood typing of Type and Screen (crossmatch) specimens performed prior to the issue of crossmatched blood products, laboratory and organizational leadership evaluated the practical application of an electronic patient identification system to label blood bank specimen collections versus the traditional use of blood bank armbands. Continued use of the armbands would require a second sample for ABO confirmation of patients that did not have a historical blood type on file. Concern was raised regarding the amount of increased workload of staff and delayed results availability based on the number of increased specimens that would be generated, as well the potential for increased iatrogenic blood loss and patient dissatisfaction. Moreover, 2nd sample collection alone would not improve the rate of mislabeled specimens observed, which is of supplementary concern.
Study Design/Method: Current organization employment of an electronic patient identification system for the labeling of other laboratory specimen collections made it feasible for applying this technology to the blood bank as well. An in‐depth evaluation, including a failure modes and effects analysis (FMEA) spanning several days, was completed to ensure that the use of the electronic system would produce comparable or superior safety results to its armband counterpart. An alternate process for specimen labeling and ABO confirmation (which would satisfy the new standard) was established to support care areas that did not have the capability of using the electronic system. Extensive education was provided to all staff (physicians, advanced practice providers, phlebotomist and nurses) to ensure comprehension as well rational for the new process. Alerts were congruently built into the electronic health record (EHR) to supplement any information regarding crossmatch testing expiration that may not be readily available by the elimination of the armband use.
Results/Finding: Within days of implementing the new process (September 11, 2016), there was a noticeable reduction in the amount of mislabeled blood bank specimens received, totaling 4in 6 months post implementation compared to 144 in the 6 months prior. In addition, the vast majority of specimens received into the blood bank are henceforth collected and labeled using the electronic system and thus have reduced the amount of potential 2nd specimen collections needed for ABO confirmation.
Conclusion: Use of an electronic patient identification system for labeling blood bank specimen collections in lieu of traditional blood bank armbands has proven to improve patient safety and department efficiency by substantially reducing the occurrence of mislabeled specimens and negate the need for 2nd specimen collections, reducing potential iatrogenic blood loss and improving patient satisfaction.
| Mislabeled Blood Bank Specimens | |||
|---|---|---|---|
| Pre Collection Lab Manager | Post Collection Lab Manager | ||
| Month | Amount | Month | Amount |
| March 2016 | 31 | October 2016 | 1 |
| April 2016 | 19 | November 2016 | 1 |
| May 2016 | 37 | December 2016 | 0 |
| June 2016 | 18 | January 2017 | 1 |
| July 2016 | 19 | February 2017 | 1 |
| August 2016 | 20 | March 2017 | 0 |
| Total | 144 | 4 | |
| *September 2016 | 8 | ||
| *9/11/16 Go‐live of CLM | |||
AP124
Use of Intravenous Immunoglobulin in Hemolytic Disease of the Newborn : A Retrospective 11‐Year Study
Florence Blais, Christian Lachance, Andreanne Villeneuve and Nancy Robitaille*
CHU Sainte‐Justine
Background/Case Studies: Based on a few small randomised controlled trials (RCTs) performed in the late ‘90s and in early 2000, intravenous immunoglobulin (IVIG) use has been suggested as a potential treatment to avoid exchange transfusion (ET) for Rh hemolytic disease of the newborn (HDN). This treatment modality is now routinely used for Rh‐HDN and has been extended to HDN caused by ABO incompatibility or by other red blood cell antibodies. However, larger RCTs performed since 2010 have shown that prophylactic IVIG did not reduce the need for ET, the duration of hyperbilirubinemia, the maximum bilirubin levels nor the need for top‐up red blood cell transfusions. The primary objective of this study was to describe the usage of IVIG for HDN at a tertiary academic referral hospital.
Study Design/Methods: A retrospective chart review was performed of all neonates who received IVIG for HDN in the neonatal intensive care unit (NICU) from January 1, 2005 to June 30, 2016. Data collected included patient demographics features and diagnosis, indications for IVIG, neonatal laboratory results, treatment details, adverse events and patient outcomes.
Results/Findings: Ninety‐seven neonates received IVIG during the study period: 57% were female and 7% were less than 34 weeks of gestational age. None had co‐existing G6PD deficiency, pyruvate kinase deficiency or spherocytosis. All neonates received phototherapy prior to IVIG treatment. Indications for IVIG were ABO‐HDN (41%) and Rhesus‐HDN (59%). Antibodies most often implicated in Rh‐HDN were anti‐D (22/57), anti‐D and anti‐C (22/57) and anti‐c (5/57). Sixteen infants with Rh‐HDN had received intrauterine transfusions. The mean cumulative dose of IVIG was 1g/kg (range from 0,3g/kg to 3,8g/kg). Neonates received one to four IVIG administrations. Table 1 shows the number of patients receiving IVIG during two time periods. Three adverse reactions were noted during IVIG administration: cutaneous rash, hypotension and fever. Of all neonates, 14 required an ET for Rh‐HDN and 3 for ABO‐HDN. Forty‐five (46%) patients needed top‐up transfusions during hospitalisation and until three months of age: 8 with ABO‐HDN and 37 with Rh‐HDN. The mean number of transfusions was three (range:1 to 7).
Conclusion: Although initially described for RH‐HDN, ABO‐HDN is now one of the most frequent indications for IVIG in neonates. The optimal use of IVIG in ABO‐HDN needs to be better characterized. Our study shows a wide variation of IVIG dosing and a significant proportion of neonates requiring top‐up transfusions. Further research is required to evaluate whether anemia in ABO‐HDN might be exacerbated by hemolysis from IVIG isohemagglutinins and if it is dose‐dependent.
TABLE 1. Use of IVIG
| 2005‐2010 | 2011‐2016 | |
|---|---|---|
| ABO‐HDN (n) | 14 | 26 |
| Rh‐HDN (n) | 33 | 24 |
AP125
Use of the Electronic Medical Record in Blood Product Irradiation
Jerry Squires*, Heather Toeppner, Karen Garner, Mary Riddle, Chrystal Ledbetter and Catherine Kalemba
Medical University of South Carolina
Background/Case Studies: Background: One of the most serious adverse reactions to transfusion is the development of graft versus host disease. Symptoms include the development of a characteristic cutaneous rash, enteritis often resulting in watery diarrhea, elevated liver function tests and ultimately pancytopenia. The clinical course is rapid with an over 90% case fatality rate. The patient population at risk is reasonably well‐defined including patients who are immunocompromised due to disease process or therapy, the fetus and low birth‐weight neonates, recipients of HLA‐matched cellular blood products and the recipients of cellular blood products donated by blood relatives. The basic etiology of TA‐GVHD is the inability of the transfusion recipient to mount an effective immune response against donor T‐lymphocytes. Treatment options for TA‐GVHD are ineffective, making it imperative that cellular blood components be irradiated prior to transfusion which virtually eliminates the risk of the complication.
Study Design/Methods: Most transfusion service information systems have mechanisms to alert transfusion service staff to patients who have been previously identified as needing irradiated blood components. However, if these patients are not identified to the transfusion service at the time of the initial hospital visit or the time at which the qualifying diagnosis, these patients can erroneously receive non‐irradiated blood components. Following a “near‐miss” situation, our hospital information department developed a 4‐part program to minimize the risk that the transfusion service is not notified of patients newly requiring irradiated blood components.
Results/Findings: Our blood products ordering system has been redesigned to include 3 specific queries to identify those patients who required irradiated cellular blood products. First, physicians have been notified to include the need for blood product irradiation in the patient Problems List. Once this is included in the list, the transfusion service will be notified of the need for irradiation on all subsequent transfusion orders until the Problem List is modified by the clinical staff. Second, if irradiated blood components have ever been requested on a patient, an alert will be generated for the ordering physician even if the requirement for irradiated products has not been included in the problem list. Finally our system will automatically default to request irradiation on all cellular products ordered for children less than 4 months of age to comply with local irradiation policies.
Conclusion: We believe that our approach can be further enhanced by including a list of specific diagnoses typically requiring blood product irradiation within our computer algorithm. We believe that this list will provide an additional level of safety in insuring that patients receive irradiated blood components when appropriate.
AP126
Using Lab Information System and a Dynamic Dashboard for Labeling and Tracking Coolers
Russell Thorsen, Rosaline Ma, Peter Suslow, Gina Giannarelli, Sara Bakhtary, Ashok Nambiar and Morvarid Moayeri*
UCSF Health
Background/Case Studies: Our tertiary‐care transfusion service routinely issues blood products in validated coolers to high acuity areas such as ORs, ICUs, Cath‐Lab, etc. Coolers are also used for emergency release and massive transfusion protocols, and for shipping products between our different hospital sites. A robot that can hold one cooler delivers products to locations not served by the pneumatic tube. On average, 30 coolers are issued every day. Cooler set‐up is a multi‐step, labor‐intensive process. Transfusion Service staff track cooler location and elapsed time‐in‐use and notify clinical teams to return/recharge coolers to avoid product wastage. We developed a lab information system (LIS)‐based solution to manage cooler labelling and tracking more efficiently.
Study Design/Method: Nine cooler test batteries were built; the batteries for RBC, plasma, platelet and cryoprecipitate (2 each) are identical, whereas the final battery designated for the cooler delivered by robot (containing plasma and RBCs with variable expiration times) is slightly different. The second battery in each pair was built to avoid duplicate test cancellation by LIS when a second cooler (for same component type) is being set up for the same patient. Each battery consists of tests capturing the following information: cooler location, cooler ID, number of units issued, and expiration. Custom barcodes representing each test battery and 45 different locations can be scanned from a ‘quick‐pick list’, avoiding need for manual entry. When coolers are returned, a final entry is made in the test battery, updating LIS. A dynamic cooler tracking dashboard with live‐feed from LIS displays data captured in the test battery. Elapsed time, starting from cooler set‐up (which is identical to time cooler battery is ordered in LIS) is captured automatically. Color codes alert users to coolers that have less than 1 hour before expiration. A flashing alert pops up for coolers that have expired.
Results/Finding: We replaced our manual process (hand‐write patient information and expiration time on 2 separate tags; affix one tag to cooler and retain second one to track cooler location and expiration) with a novel LIS‐driven labeling and tracking system. Each time a cooler is set up, a test battery is ordered and resulted in LIS by scanning the related custom barcodes. A single LIS‐generated label is printed and attached to each cooler. Cooler expiration is defaulted to 10 hours (per our current cooler validation) from the time the test battery is ordered during cooler set up. Techs pay attention to expiration of each product they place in a cooler. If an individual product outdates before the cooler expiration time, this information is entered in the test battery and gets displayed on the dashboard as a cooler expiration time, distinct from the system‐driven countdown. Color‐coded visual display and alerts greatly simplify cooler monitoring, and the elimination of some manual steps has improved staff satisfaction.
Conclusion: Using LIS for cooler set‐up and deploying a linked dynamic dashboard to display cooler locations and expiration time makes cooler management more efficient. These tools reduce manual steps and decrease likelihood of wastage by aiding cooler tracking.
AP127
Vision Titers ‐‐ Easier or Problematic?
Jayanna Slayten*1, Heather Vaught2 and Tracie Ingle1
1Indiana University Health, 2Indiana University Health (IU Health)
Background/Case Studies: Our Midwestern University‐Based Transfusion Service (TS) evaluated the appropriateness the automated platform VISION (Ortho Clinical Diagnostics. Raritan, NJ) for prenatal titration studies. It has been established from previous publications that the micro‐column assay, of which the VISION is based, may lead to higher titer results compared to standard tube titrations. This study sought to evaluate the transition from manual to automated titer studies from a sensitivity as well as cost perspective.
Study Design/Method: Twenty‐three prenatal retention plasma samples were tested as part of the evaluation of titration studies of the VISION. The samples were manually tested with a standard two‐fold serial dilution. The titer was reported as the last tube to demonstrate a 1+ reaction by macroscopic observation. The titer studies were then repeated using the VISION. The results of the manual and automated processes were compared and categorized as “< 2 grade” or “> 2 grade” difference between endpoints. This analysis is similar to the acceptable ranges used for evaluating College of American Pathologists (CAP) proficiency survey challenges. A cost analysis was completed based on the direct and indirect cost for each method, excluding the cost of an analyzer.
Results/Finding: Table 1 demonstrates a summary of the samples tested by manual titer study and VISION titration method. The VISION titer results (mean, median, and mode) were higher than the manual tube titer results. Less than half of the samples (48%) were > 2 titer results higher, while the majority was ≤ 2 titer results different (52%). The cost analysis is summarized in Table 2. The indirect cost (labor) was significantly lower with the use of the VISION. The reduction in pre‐analytical technical time for manual preparation of the titration is eliminated with the VISION completing the titration as part of the profile of the titer study of the analyzer.
Conclusion: With an estimated 41% decrease in the cost of a VISION titer compared to manual tube method, the change in practice would clearly be a cost and efficiency measure in the blood bank. However, the VISION demonstrated the expected increase in titer results compared to manual tube titer results. This would impact the critical values currently utilized. An impact assessment for clinical staff would be necessary to adequately implement the change in method. Consideration must be given to changes in the computer logic for critical values on titer studies and training of physician and nurse obstetric practitioners for changes in the critical values. In addition, as part of changing to the VISION an implementation period will be necessary to ensure that manual titers are compared to previous manual titers and not to VISION titer results which would be higher and may be interpreted as a significant change for clinical care of the patient.
TABLE 1. Comparison of Manual Tube vs. VISION titer results.
| Manual | VISION | p | |
|---|---|---|---|
| Mean | 32 | 256 | 0.001 |
| Median | 16 | 128 | |
| Mode | 8 | 256 | |
| Min | 4 | 1 | |
| Max | 256 | 1024 |
TABLE 2. Cost Analysis Results. Estimate only, due to not including the price of the instrument
| Basic Cost Comparison | Manual | VISION |
|---|---|---|
| Estimate of Direct Cost of Titer | $12.14 | $ 11.40 |
| Estimate of Indirect Cost of Titer | $35.63 | $16.40 |
| Total Cost | $47.77 | $27.80 |
| Difference | ‐$19.97 | |
AP128
What Is the Best Practice for Testing Residual White Blood Cells in Blood Components for Monthly Routine Quality Control?
Janja Pajk*
General Hospital Celje
Background/Case Studies: We wanted to discover what is the best routine quality control practice for testing residual white blood cells in blood components. Our aim was to validate the Adam device for counting thne number of residual white blood cells (WBC) in leucocyte depleted and in non‐leucocyte depleted blood components (BC) and to compare with standard counting method by microscopy in Fuchs Rosenthal chamber (FRC) used in GHC and with Flow cytometry (FC).
Study Design/Method: After 23 samples of red blood cells (RBC), platelets (PLT) and fresh frozen plasma (FFP) (leucocyte depleted in top and top (T/T) bags and non‐leucocyte depleted in top and bottom (T/B) bags) were stained with propidium iodide (PI) on r‐Slides; Adam – rWBC device was messured fluorescent images of stained WBC nucleus. Data were analised by image analysis software and later compared with results of testing samples in FRC by microscopy and with FC.
15 samples of BC were microscopic tested in FRC at Department of laboratory medicine in GHC; another 8 samples were measured with FC in UCC Maribor.
Results/Finding: 15 samples (6 RBC, 3 PLT, 3 FFP‐ all leucocyte depleted and 3 non‐leucocyte depleted FFP) were tested in triplicates on Adam and with FRC once.
Coefficient of variation of (KV%) of samples measured on Adam for leucocyte depleted BC varied for: RBC from 44,10 – 173,21; PLT from 86,60 – 100,00; FFP from 86,60 – 173,21; and for non‐leucocyte depleted FFP from 0,69 ‐ 8,85 (Table 1).

8 samples (2 RBC, 2 PLT, 2 FFP – all leucocyte depleted and 2 non‐leucocyte depleted FFP) were tested in triplicates on Adam and with FC once.
KV% of samples measured on Adam for leucocyte depleted BC varied for: RBC from 91,65 – 114,56; PLT from 78,06 ‐ 173,21, FFP from 66,67 – 173,21; and for non‐leucocyte depleted FFP from 11,17 – 15,91 (Table 2).
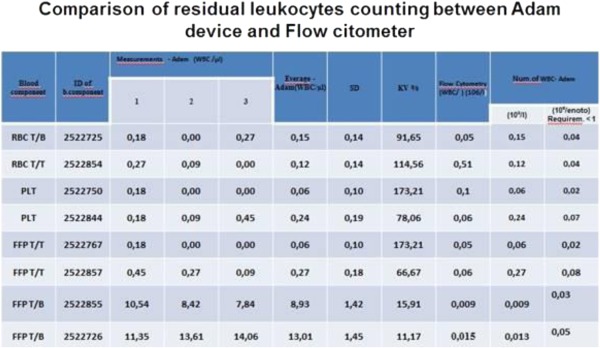
High percentage of KV was noticed in samples with low numbers of WBC (in leucocyte depleted BC; low percentage of KV in non‐leucocyte depleted FFP, with higher amount of WBC was observed.
Conclusion: All samples tested with Adam met expected criteria for WBC in BC in European Union (less than 1x10⁹/unit for leucocyte depleted or 1x10⁶/unit for non‐leucocyte depleted) and were comparable with those tested with FC; the correlation with microscopy in FRC was worse.
With use of disposable r‐slides, the risk of exposure to the potential hazardous blood samples is grately reduced, the method is more precise and not time consuming.
From January 2017 we changed our protocol for testing residual WBC in BC with Adam device and we advise it as the best practice for monthly routine quality control.