

Summary
Two tests were developed that allow the detection and genotyping of infectious bronchitis virus (IBV) and other closely related gammacoronaviruses. The first test employs a one‐step, reverse transcription‐polymerase chain reaction (RT‐PCR) assay in which the amplification is monitored in real time using a TaqMan® probe. This real‐time RT‐PCR test was used to examine a panel of field samples and its performance compared to virus isolation in embryonated fowls’ eggs. A total of 323 field samples were tested; 176 samples were positive using the real‐time RT‐PCR method, but only three were positive by virus isolation. Sequencing was used to confirm the positive real‐time RT‐PCR results for a subset of samples. The test is suitable for swabs and post‐mortem samples and has been shown to be highly sensitive and specific. The second test, a genotyping method, was developed for identification of the strain of IBV present in field samples based on nucleotide variations within the gene encoding the S1 subunit of the surface spike (S) glycoprotein. This method was developed to provide a tool to inform vaccination decisions and for ongoing surveillance to detect new and emerging strains of IBV within the UK. The performance of the test was evaluated using laboratory isolates of IBV and field samples. Both tests are suitable for use in a high‐throughput diagnostic laboratory.
Keywords: gammacoronavirus, infectious bronchitis virus, molecular diagnosis, real‐time RT‐PCR, genotyping
Introduction
Gammacoronaviruses are known to infect many species of birds, including chickens, turkeys, pheasants, greylag geese, mallard ducks and pigeons, often with different tissue tropisms (Cavanagh et al., 2001, 2002; Cavanagh, 2005; Jonassen et al., 2005). More specifically, turkey coronavirus (TCoV) causes a highly contagious enteric infection, which can lead to mortality and growth retardation (Guy, 2000; Cavanagh, 2005), while, in contrast, pheasant coronavirus infection (PhCoV) typically affects renal and respiratory tissues with consequent disease signs related to those body systems (Cavanagh, 2005). Infectious bronchitis virus (IBV), recognized as the prototypic gammacoronavirus, primarily causes disease in chickens that is characterized by upper respiratory tract signs, including nasal discharge, ‘snicking’, ‘râles’, watery eyes and lethargy (Ignjatovic and Sapats, 2000; Cavanagh, 2007).
Infectious bronchitis virus is of huge economic importance to the poultry industry worldwide, and the economic impact of disease is exacerbated in part by the existence of multiple serotypes of the virus, a property which complicates the detection and prevention of the disease (Ignjatovic and Sapats, 2000). Multiple serotypes are known to circulate within a location (Worthington et al., 2008), while new variants frequently spread to different geographical regions. For example, the QX strain, which was initially identified in China, was first detected in Western Europe in late 2003, but was not identified in the UK until 2007 (Landman et al., 2005; Gough et al., 2008; Worthington et al., 2008). Different serotypes of the virus derive from variation in the S1 subunit of the spike (S) glycoprotein. The S1 subunit induces neutralizing antibodies in the host, and differences of only a few amino acids may exist between the S1 subunits of different IBV serotypes (Cavanagh, 2003, 2005).
The poultry industry has adopted vaccination as a disease control strategy to limit the economic impacts of IBV infections, although the situation is complicated as different serotypes may not offer cross‐protection. Consequently, birds may have to be vaccinated with multiple serotypes of the virus, including those contemporaneously circulating in the field (Cavanagh, 2003). This makes constant surveillance and testing necessary to identify cases of IBV and to determine the strains of IBV currently circulating within a location to ensure that the most suitable and cost‐effective strategy is implemented.
Detection of IBV infection has traditionally been carried out using virus isolation, the current gold standard test (World Organisation for Animal Health (OIE) (2008). However, this method is expensive and time‐consuming and is unable to deliver a rapid diagnosis in a cost‐effective manner (De Wit, 2000). More recently, nucleic acid detection methods such as RT‐PCR have been shown to be rapid, cost‐effective and suitable for use in a high‐throughput diagnostic environment. Real‐time RT‐PCR has been used as a diagnostic method for IBV (Jackwood et al., 2003; Callison et al., 2006; Escutenaire et al., 2007), and the use of a TaqMan® probe to follow the PCR provides an additional level of specificity. Nucleic acid amplification methods can also be used for IBV strain identification, as the amplicons generated by RT‐PCR can be sequenced to provide phylogenetic data (De Wit, 2000; Ignjatovic and Sapats, 2000).
We describe the development and validation of a one‐step real‐time RT‐PCR for the detection of IBV‐like gammacoronaviruses from a range of sample types. The diagnostic test amplifies a 175‐bp region within the 3′ untranslated region (UTR) of the viral genome. This diagnostic test can be used in conjunction with amplification and sequencing of the S1 viral gene to identify the strain of IBV present within a sample. These assays have been designed specifically to be used routinely, in a high‐throughput diagnostic laboratory, for the rapid detection and strain identification of IBV from clinical samples.
Materials and Methods
Transport and initial processing of field samples
Tissue samples (kidney, brain, liver, oviduct, bursa and respiratory and intestinal tracts) were collected from a variety of bird species (chicken, turkey, pheasant and pigeon) at post‐mortem from cases with respiratory disease or suspected coronavirus infection based on clinical observations. The samples were transported in Eagle’s minimum essential virus transport medium (VTM). Tissue samples were homogenized, ground or cut into small pieces before making a 10–20% (w/v) suspension in phosphate‐buffered saline (PBS) containing antibiotics (0.1 M PBS solution, pH 7.2 containing 50 mg/l gentamycin, 1 × 10⁶ units/l penicillin G, 10 g/l streptomycin sulphate and 5 × 10⁶ units/l of nystatin). The suspension was left for a minimum of 60 min at room temperature before centrifugation to deposit debris and the supernatant decanted for testing by virus isolation and real‐time RT‐PCR.
Wire‐stemmed ENT swabs (MW&E, Corsham, Wiltshire, UK) were used for cloacal or tracheal sampling and were transported either ‘dry’ (no transport medium) or ‘wet’ in Eagle’s minimum essential medium (VTM). For wet swabs, the Eagle’s minimum essential VTM was diluted 1 : 2 with PBS with antibiotics (as previously described), and the resulting liquid was tested by virus isolation and real‐time RT‐PCR. Dry swabs were processed by being introduced into 1 ml of brain heart infusion broth (BHIB) with antibiotics (1000 IU/ml penicillin G, 10 μg/ml amphotericin B and 1 mg/ml gentamycin) and agitated briefly. This liquid was used for testing by virus isolation and real‐time RT‐PCR.
Testing of field samples using virus isolation in embryonated chicken eggs
For virus isolation, 0.2 ml of processed sample was inoculated into either the allantoic or amniotic cavity of 9‐ to 11‐day‐old embryonated specified pathogen‐free (SPF) fowls’ eggs. Eggs were examined daily by ‘candling’, using a bright light shone on the egg to examine the development of the embryo, which is compromised or altered if virus replication has occurred. Samples underwent a minimum of two passages, while three passages were used when testing samples from cases where the clinical signs strongly suggested the involvement of coronaviruses.
Nucleic acid extraction
Samples were initially processed as described above, although for ‘wet’ swabs, the undiluted Eagle’s minimum essential VTM was tested. For tissue samples and wet swabs, an automated nucleic acid extraction was carried out using the MagNA Pure LC extraction robot, with dedicated buffers contained in the MagNA Pure LC Total Nucleic Acid Isolation kit (Roche, Burgess Hill, West Sussex, UK). Nucleic acid extractions were prepared from 200 μl of sample following the manufacturers’ instructions. For material eluted from dry swab samples, an automated extraction was made from 140 μl of the BHIB (see Transport and initial processing of field samples) using the BioRobot Universal extraction robot (Qiagen, Crawley, West Sussex, UK) according to the manufacturers’ instructions using the ‘single‐plate swab extraction’ protocol. Briefly, 420 μl lysis buffer AVL (Qiagen) was added to the BHIB. This solution was then applied to a silica filter, the filter was washed to remove impurities, and the RNA was eluted from the filter in elution buffer AVE (Qiagen).
Diagnostic IBV real‐time RT‐PCR assay
This real‐time RT‐PCR assay used the following primer and probe sequences: IBVRT1 forward primer CTA TCG CCA GGG AAA TGT C, IBVRT2 reverse primer GCG TCC TAG TGC TGT ACC C, IBVRT3 TaqMan® probe FAM – CCT GGA AAC GAA CGG TAG ACC CT – TAMRA. The primer sequences are truncated versions of those described by Cavanagh et al. (2002) and were previously shown to detect PhCoV (Cavanagh et al., 2002). A novel TaqMan® real‐time PCR probe that recognizes IBV, turkey coronavirus and pheasant coronavirus sequences was designed and incorporated into the test allowing amplification to be followed in real time. One‐step RT‐PCR reactions were performed using the Qiagen One‐Step RT‐PCR kit. Each 25 μl reaction contained the following components: 5 μl One‐step reaction buffer, 1 μl 25 mm MgCl2, 1 μl 10 mm dNTP mix, 0.8 μm IBVRT1 primer, 0.8 μm IBVRT2 primer, 0.2 μm IBVRT3 TaqMan probe, 0.25 μl RNasin ribonuclease inhibitor (between 5 and 10 units of enzyme), 1 μl one‐step enzyme mix, 11.75 μl nuclease‐free water and 2 μl extracted nucleic acid. The reactions were run on the following programme using a Stratagene MX3000p real‐time PCR instrument: 50°C for 30 min, 95°C for 15 min, followed by 50 cycles at 95°C for 20 s and 50°C for 30 s. Fluorescence data were collected during the 50°C step. This reaction was performed in triplicate on each nucleic acid extract, and samples were deemed to be positive if amplification was recorded in two or more of the triplicate reactions.
Sequencing of amplicons formed by the diagnostic IBV real‐time RT‐PCR assay
The amplicons formed by the diagnostic IBV real‐time RT‐PCR assay were purified using a Multiscreen HTS 96 well plate (Millipore, Watford, UK) according to the manufacturers’ instructions. The purified PCR products were sequenced by dye‐terminator cycle sequencing using BigDye v3.1 kits (Applied Biosystems, Warrington, Cheshire, UK) with either the IBVRT1 or the IBVRT2 primer. The products of these reactions were analysed using an ABI Prism 3130xl DNA Analyzer (Applied Biosystems). The sequence data generated were then used to search the NCBI public sequence database using the BLASTN search tool (Altschul et al., 1990).
Determination of the sensitivity of the diagnostic IBV real‐time RT‐PCR assay using in vitro transcribed RNA
To determine the analytical sensitivity of the IBV real‐time RT‐PCR, the amplicon produced by the assay was cloned into the pGEM T‐easy plasmid vector (Invitrogen, Paisley, Renfrewshire, UK), and the identity of the plasmid was confirmed by sequencing. This plasmid was then used as the template to produce RNA transcripts by in vitro transcription using the Megascript® kit (Applied Biosystems). The DNA template was digested using Turbo DNase (Applied Biosystems), and the RNA was then purified using Trizol® (Invitrogen).
The concentration of the RNA was then determined using a Nanodrop instrument (Fisher Scientific, Loughborough, Leicestershire, UK), and the value obtained was used to calculate the number of RNA template molecules present in the RNA preparation, based on the molecular weight of the transcript and Avogadro’s number. This was used to set up a 1 in 10 serial dilution of RNA template containing a known number of template molecules. This dilution series was then used as the template for duplicate diagnostic IBV real‐time RT‐PCR reactions, and also for duplicate reactions containing the primers and probes in the absence of reverse transcriptase.
Amplification and sequencing of the S1 gene of IBV
The genotyping RT‐PCR uses a panel of ten forward and eighteen reverse primers (Table 1). Each primer contains a specific sequence to amplify the S1 gene of certain known IBV strains, together with a generic M13 primer sequence (either an M13 forward or reverse sequence, as appropriate). The primers were designed to amplify the strains of IBV currently in circulation in Europe (Worthington et al., 2008), along with other strains such as VICS and V18‐91 that are not commonly found in Europe.
Table 1.
Primers used in the S1 genotyping RT‐PCR
| Primer name | Primer sequence |
|---|---|
| S1 For 1 | GTAAAACGACGGCCAGTGGTTTACTACTACCAGAGTGC |
| S1 For 2 | GTAAAACGACGGCCAGTGGTGTACTACTACCAAAGTGC |
| S1 For 3 | GTAAAACGACGGCCAGTGACATACTATTACCAGAGTCAG |
| S1 For 4 | GTAAAACGACGGCCAGTGGTTTACTACTACCAAAGTGC |
| S1 For 5 | GTAAAACGACGGCCAGTGAATTATTACTACCAAAGTGC |
| S1 For 6 | GTAAAACGACGGCCAGTGGTGTACTACTACCAGAGTGG |
| S1 For 7 | GTAAAACGACGGCCAGTGGTGTATTACTACCAGAGTGC |
| S1 For 8 | GTAAAACGACGGCCAGTGGTCTACTACTACCAAAGCGC |
| S1 For 9 | GTAAAACGACGGCCAGTGGTGTACTACTACCAAAGCGC |
| S1 For 10 | GTAAAACGACGGCCAGTGGTCTACTACTACCAAAGTGC |
| S1 Rev 1 | CAGGAAACAGCTATGACCATGACATCTTGTGCAGTACCATTAAC |
| S1 Rev 2 | CAGGAAACAGCTATGACCATGACATCTTGTGCTGTACCATTAAC |
| S1 Rev 3 | CAGGAAACAGCTATGACCATGACATCTTGTGCGGTGCCATTAAC |
| S1 Rev 4 | CAGGAAACAGCTATGACCATGACTTCAACAGCAGTGCCATTTAC |
| S1 Rev 5 | CAGGAAACAGCTATGACCATGCTTGTGCGGTACCATTAATAAAG |
| S1 Rev 6 | CAGGAAACAGCTATGACCATGATATCTTGCGCAGTACCATTTTC |
| S1 Rev 7 | CAGGAAACAGCTATGACCATGACATCCTGTGCAGTACCATTAAC |
| S1 Rev 8 | CAGGAAACAGCTATGACCATGACATCATGTGCAGTACCATTGAC |
| S1 Rev 10 | CAGGAAACAGCTATGACCATGACGTCTTGTGCAGTACCATTAAC |
| S1 Rev 11 | CAGGAAACAGCTATGACCATGACATCTTGTGCGGTACCATTAAC |
| S1 Rev 12 | CAGGAAACAGCTATGACCATGACGTCTTGTGCGGTACCATTAAC |
| S1 Rev 13 | CAGGAAACAGCTATGACCATGACGTCTTGTGCAGTACCATTACC |
| S1 Rev 14 | CAGGAAACAGCTATGACCATGAGAATAACATCTTGCGCAGTACC |
| S1 Rev 15 | CAGGAAACAGCTATGACCATGAAAATAACATCTTGTGCAGTACC |
| S1 Rev 16 | CAGGAAACAGCTATGACCATGACATCATGTGCGGTGCCATTAAC |
| S1 Rev 17 | CAGGAAACAGCTATGACCATGCTTGTGCGGTGCCATTAATAAAG |
| S1 Rev 18 | CAGGAAACAGCTATGACCATGAAAATAATATCCTGTGCAGTACC |
To produce amplicons for sequencing, one‐step RT‐PCR reactions were performed using the Qiagen One‐Step RT‐PCR kit. Each 25 μl reaction contained the following components: 5 μl one‐step reaction buffer, 1 μl 25 mm MgCl2, 1 μl 10 mm dNTP mix, 0.4 μm of primer S1for2, 0.4 μm of primer S1rev3, 0.04 μm of each of the remaining primers, 0.25 μl RNasin ribonuclease inhibitor (between 5 and 10 units of enzyme) (Promega, Southampton, Hampshire, UK), 1 μl one‐step enzyme mix, 12.75 μl nuclease‐free water and 2 μl of extracted nucleic acid. The reactions were run on the following programme using an MX3000p real‐time PCR instrument: 50°C for 30 min, 95°C for 15 min, followed by 50 cycles at 94°C for 30 s, 54°C for 30 s and 72°C for 30 s.
The amplicons generated were sequenced using the M13F (GTAAAACGACGGCCAGTG) and M13R (CAGGAAACAGCTATGACCATG) generic primers. The forward and reverse sequences were aligned, and a 140‐bp region of the sequence data generated was compared to a library of 36 sequences of well‐characterized IBV strains using the ABI Prism SeqScape v2.6 software (Applied Biosystems). The IBV S1 sequence files were taken from the public access Genbank database and included representatives of the major groups of IBV strains that are currently circulating in Europe (Worthington et al., 2008) alongside other IBV strains (see Fig. 1). A neighbour‐joining phylogenetic tree was constructed using the Molecular Evolutionary Genetics Analysis package (MEGA v4) with the Kimura 2‐parameter algorithm (Tamura et al., 2007).
Figure 1.
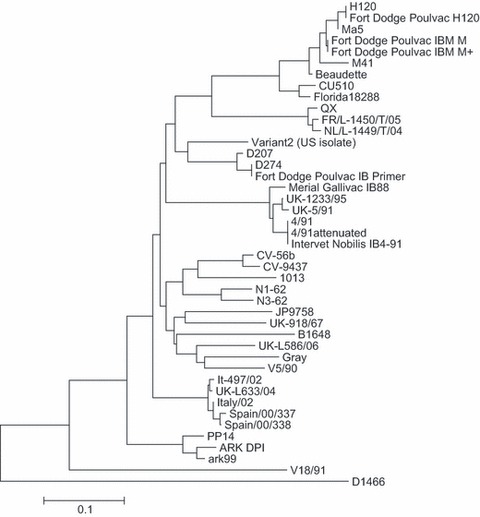
Phylogenetic tree showing relationships of sequences contained within the infectious bronchitis virus (IBV) S1 sequence library. Neighbour‐joining tree showing phylogeny of IBV S1 sequences. Bar indicates 10% sequence divergence. Aligned sequences were 140 nucleotides in length. The following Genbank sequences were present in the sequence library: Spain/00/38 (Genbank accession number DQ064814); Spain/00/00/337 (DQ064813); Italy‐02 (AJ457137); It‐497‐02 (DQ901377); UK/L‐633/04 (DQ901376); UK/918/67 (X64737); V5/90 (AIU29520); V18/91 (U29521); D207 (M21969); D274 (X15832); Variant 2 (AF093796); 4/91 (AF093794); UK‐1233‐95 (AJ618984); UK/5/91 (Z83978); Ark99 (L10384); ARK DPI (AF006624); PP14 (M99483); 1013 (AF027508); Gray (L18989); UK/L‐586/06 (DQ901375); N1/62 (U29522); N3/62 (U29453); JP9758 (AY296746); CV‐56b (AF027509); CV‐9437 (AF027513); H120 (M21970); Ma5 (AY561713); M41 (X04722); Beaudette (M95169); CU510 (AY561716); Florida 18288 (AF027512); D1466 (M21971); B1648 (X87238); FR/L‐1450T/05 (EF079118); NL/L‐1449T/04 (EF079116); 4/91 attenuated (AF093793). The sequence library also contains the sequence for AV2150/07, a UK QX‐like strain.
Results
Design and calibration of IBV real‐time RT‐PCR
To confirm that the modified test was suitable for detecting contemporary UK field strains of IBV, a panel of laboratory isolates of IBV representing the major genotypes currently circulating in the UK was tested (Worthington et al., 2008). The panel included M41, Italy‐02, 4/91, D1466, D274 and three UK QX‐like strains isolated from field samples originating from poultry flocks in Great Britain. The modified real‐time RT‐PCR successfully detected all of the IBV strains tested.
Determination of the analytical specificity of the real‐time RT‐PCR assay to detect IBV‐like coronaviruses in chicken, turkeys and pheasants
A wide range of microorganisms, both bacterial and viral, can be responsible for respiratory disease in avian species and might be present in clinical submissions. To investigate the possibility of cross‐reactivity of the assay, nucleic acid extracts from the organisms listed in Table 2 were prepared and used as the template for the gammacoronavirus diagnostic test. No cross‐reaction with any of the organisms was detected, indicating that the test is specific for IBV‐like gammacoronaviruses and false‐positive results will not be caused by the presence of these additional organisms in field samples. The importance of this was reinforced following testing of field samples, as several samples that were negative in the molecular diagnostic test were shown to contain other viruses, i.e. infectious laryngotracheitis virus and adenoviruses, using alternative testing methods (data not shown).
Table 2.
Organisms used to test the specificity of the assay
| Organism | Subtype/strain |
|---|---|
| Avian influenza | H5N7 |
| Avian influenza | H5N1 |
| Avian influenza | H7N1 |
| Avian influenza | H9N2 |
| Infectious laryngotracheitis virus | |
| Reovirus | |
| Newcastle disease virus | B1 vaccine strain |
| Adenovirus | Celo |
| Avian metapneumovirus subtype A | F83 |
| Avian metapneumovirus subtype B | Nemovac |
| Avian metapneumovirus subtype C | 247 |
| Ornithobacterium rhinotracheale | Field isolate |
| Bordetella avium | NCTC number 12033 |
| Mycoplasma synoviae | |
| Mycoplasma gallisepticum |
Determination of the sensitivity of the diagnostic IBV real‐time RT‐PCR test
Two approaches were used to estimate the analytical sensitivity of the diagnostic real‐time RT‐PCR test. To investigate the analytical sensitivity of the test in toto including the extraction process, its performance was correlated with the current standard test, virus isolation in embryonated SPF fowls’ eggs (World Organisation for Animal Health (OIE) (2008). A tenfold dilution series of the IBV laboratory isolate 793/B was made, and 0.2 ml of each dilution was tested in parallel by both tests. Virus isolation had a limit of detection between the 10−5 and 10−6 dilutions, and it was calculated that the original 793/B virus pool had a titre of 105.5 median egg infectious doses (EID50) in 0.2 ml. The limit of detection of the real‐time RT‐PCR test was the 10−6 dilution.
To investigate the analytical sensitivity of the real‐time RT‐PCR alone, in vitro transcription of a cloned target sequence was used to prepare an RNA target template. The RNA produced was used to introduce a known number of RNA molecules into the real‐time RT‐PCR assay. Parallel reactions lacking reverse transcriptase (RT) enzyme were also run. This experiment demonstrated that the limit of detection of the real‐time RT‐PCR reaction was between 10 and 100 copies of template. The absence of any amplification in the ‘no‐RT’ control wells demonstrated the absence of contaminating plasmid DNA in the preparation of the RNA transcribed in vitro.
Testing of field samples
To further determine the performance of the diagnostic test, it was necessary to test its ability to identify positive and negative field samples correctly. Samples received for routine testing using virus isolation were tested in parallel using the diagnostic IBV real‐time RT‐PCR. The panel contained field samples from a variety of species of birds (chickens, turkeys, pheasants and pigeons) and also a range of sample types including both swabs and post‐mortem tissue samples.
A total of 323 samples were analysed during the course of this study, and while only three samples were found to be positive using virus isolation, 176 samples were positive by real‐time RT‐PCR, including in this number the three samples that were positive by virus isolation (Table 3). As the results obtained using virus isolation were not comparable to those obtained using the real‐time RT‐PCR, some of the amplicons formed using the diagnostic test were sequenced. For 118 of the 176 real‐time RT‐PCR‐positive samples, amplicons were generated using the IBVRT1 and IBVRT2 primers and sequenced using these primers. Because of sample degradation, amplicons were no longer generated when retesting the remainder of the samples. Good‐quality sequence data were generated from 41 of the 118 amplicons, but the sequence data obtained for the other samples were of insufficient quality or length to interpret. For 40 samples, the sequence data generated were shown to be most similar to IBV, while for one sample, the most similar sequence within the Genbank database was shown to be turkey coronavirus. The original samples for which the real‐time RT‐PCR results could be confirmed by sequencing included cloacal swabs (16 samples), oropharyngeal and respiratory tract swabs (four samples), intestines and intestinal contents (eight samples), caecal tonsils and caecal contents (five swabs), and trachea and tracheal contents (three samples).
Table 3.
Results from testing field samples using the diagnostic infectious bronchitis virus real‐time RT‐PCR assay
| Species | Total number of samples tested | Positive by virus isolation | Positive by real‐time RT‐PCR | Real‐time RT‐PCR‐positive result confirmed by sequencing |
|---|---|---|---|---|
| Chicken | 251 | 3 | 153 | 31 |
| Turkey | 29 | 0 | 6 | 2 |
| Pheasant | 1 | 0 | 1 | 0 |
| Pigeon | 10 | 0 | 0 | 0 |
| Unknowna | 32 | 0 | 16 | 8 |
| Total | 323 | 3 | 176 | 41 |
aSamples were classified as unknown where species information was unavailable.
Real‐time RT‐PCR‐positive results were generated for several poultry species (turkeys, pheasants and chickens), but the ten pigeon samples tested were all negative (Table 3). It was also demonstrated that gammacoronaviruses could be detected from a range of sample types using the molecular IBV real‐time RT‐PCR (Table 4). Positive results were obtained from chickens using oropharyngeal and cloacal swabs (both dry and in VTM). Positive results were also obtained from a variety of post‐mortem sample types, including kidney, small intestine, trachea, caecal tonsils, mixed kidney and oviduct, and caecal contents from chickens. Positive post‐mortem sample types from turkeys included intestine and intestinal contents, while coronavirus was detected in mixed lung and trachea samples from pheasants.
Table 4.
Results from testing different clinical sample types using the diagnostic infectious bronchitis virus real‐time RT‐PCR assaya
| Species | Sample type | Total number of samples tested | Positive by real‐time RT‐PCR | Positive by virus isolation |
|---|---|---|---|---|
| Chicken | Oropharyngeal and respiratory tract swabs | 102 | 40 | 0 |
| Chicken | Cloacal swab | 94 | 77 | 0 |
| Chicken | Intestinal samples and intestinal contents | 7 | 4 | 0 |
| Chicken | Respiratory tract tissue samples | 10 | 3 | 0 |
| Chicken | Brain | 1 | 0 | 0 |
| Chicken | Caecal tonsils and caecal contents | 7 | 3 | 3 |
| Chicken | Mixed tissues | 16 | 9 | 0 |
| Chicken | Kidney | 4 | 3 | 0 |
| Turkey | Intestines and intestinal contents | 9 | 7 | 0 |
| Turkey | Caecal contents | 2 | 0 | 0 |
| Turkey | Sinus swabs | 5 | 0 | 0 |
| Turkey | Faeces | 2 | 0 | 0 |
| Turkey | Bursa | 2 | 0 | 0 |
| Pigeon | Viscera | 5 | 0 | 0 |
| Pigeon | Intestines | 5 | 0 | 0 |
| Pheasant | Trachea/lung | 1 | 1 | 0 |
aN.B. For some of the samples tested during this study, information was not available regarding the sample type. These samples have been excluded from this table.
Development of a method to identify the strain of IBV present in a field sample
The diagnostic IBV real‐time RT‐PCR described here has been demonstrated to be a highly sensitive and specific test, which is eminently suitable for demonstrating the presence of gammacoronavirus nucleic acid in field samples. However, because of its design, it will detect both field and vaccine strains of IBV. To allow determination of the strain of IBV present within a field sample, an S1 genotyping method was designed for routine use within a diagnostic laboratory setting. Samples of live attenuated IBV vaccines currently in use in the UK were sequenced using this method, and the sequence data generated used to populate the sequence library used during interpretation of the sequence data generated by the S1 genotyping test. Analysis of the sequences present in the sequence library demonstrated the sequences clustered in several main IBV serotypes including the so‐called Massachusetts, Italy 02, 4/91 (also known as 793/B and CR88), Arkansas and QX‐like serotypes (Fig. 1). The variation within sequences in these different groups has been shown to be <5%, equivalent to seven base changes in the 140 bp region used for sequence analysis. In contrast, greater variation is seen between the different serotypes, with the amount of variation between serotypes exceeding 15% of the nucleotides within the region sequenced.
Initially, to demonstrate that this method was performing well, it was used to test a panel of laboratory isolates representing IBV strains currently circulating in the UK (Worthington et al., 2008). The panel included M41, Italy 02, D1466, D274 and 4/91 along with three QX‐like isolates derived from poultry in Great Britain. Gel electrophoresis was used to demonstrate that the S1 RT‐PCR was able to amplify the S1 gene of these IBV strains. The amplicons generated were also sequenced, and when the data generated were compared to the IBV sequence library, the IBV strain present within each sample was correctly identified.
Identification of the IBV strain present in field samples
To determine whether the IBV genotyping method was capable of identifying the strain of IBV present in a field sample, the method was used to test a panel of ten field samples, which had previously tested positive using the diagnostic IBV real‐time RT‐PCR. The panel included both swabs and post‐mortem tissue samples from chickens. The results from this testing are shown in Table 5. Five of the field strains of IBV were most closely matched at the sequence level to strains of the 4/91 serotype, three of the field samples were identified as being QX‐like strains, and the remaining two field samples were identified as having closest sequence matches within the D274 and Italy 02 serotypes, respectively.
Table 5.
Results from testing a panel of field samples using S1 genotyping method. The results show the closest sequence in the S1 sequence database, along with the number of mismatches between the sample sequence and the closest match within the database for the 140‐bp region compared
| Sample name | Sample type | Closest sequence match in library | Number of mismatches |
|---|---|---|---|
| AS67 | Swab | D274 | 1 |
| AS68 | Trachea | UK/L‐633/04 | 0 |
| AS48 | Throat swab | 4/91 Pathogenic | 1 |
| AS50 | Trachea | 4/91 Pathogenic | 2 |
| AS87 | Trachea and kidney | 4/91 Pathogenic | 0 |
| AS85 | Caecal tonsils | 4/91 Pathogenic | 2 |
| S1FS10 | Trachea | QX (AV2150/107) | 2 |
| S1FS84 | Oropharyngeal swab | FR/L‐1450T/05 | 2 |
| S1FS85 | Oropharyngeal swab | NL/L‐1449T/04 | 2 |
| S1FS31 | Oropharyngeal swab | 4/91 Pathogenic | 0 |
Discussion
This paper describes the development and validation of a TaqMan® real‐time RT‐PCR for the detection of IBV, turkey coronavirus and pheasant coronavirus, and an IBV S1 genotyping method to enable the subsequent identification of the strain of IBV present. Unfortunately, it was not possible within the scope of this study to determine whether the diagnostic IBV real‐time RT‐PCR assay can detect pigeon coronaviruses. Although clinical samples from pigeons with suspected disease were tested, these were not positive using the diagnostic real‐time RT‐PCR. Comparison of the sequence of the pigeon coronavirus 3′ UTR to the sequence of the primers and probe used within this study shows several differences at the nucleotide level, suggesting that although amplification may occur, this could be inefficient and it may be preferable to use an alternative RT‐PCR to detect pigeon coronavirus.
The real‐time RT‐PCR assay targets the 3′ UTR of the IBV genome, adjacent to the poly A tail, which, unlike some other regions of the genome, is highly conserved in all gammacoronaviruses (Williams et al., 1993; Sapats et al., 1996; Dalton et al., 2001). Because of the transcriptional strategy employed by coronaviruses in which sets of 3′ coterminal nested RNA molecules are produced, the 3′ UTR of the virus is present not only in the genomic RNA but also in the mRNA molecules produced by the virus. This means that there may be more copies of the viral 3′ UTR present within a field sample than other regions of the viral genome, making this region an ideal target for a diagnostic RT‐PCR where a high level of sensitivity is required.
During this work, for each of the three samples that tested positive by virus isolation, a positive result was also seen using the diagnostic IBV real‐time RT‐PCR assay, and the presence of IBV within these samples was additionally confirmed by sequencing the amplicon generated by the diagnostic assay. Furthermore, a substantial number of field samples were positive using the molecular diagnostic assay, but no virus was isolated following attempted virus isolation in SPF embryonated fowls’ eggs. Unlike virus isolation, real‐time RT‐PCR does not require the presence of viable virus particles. Therefore, the molecular method will be less affected than virus isolation by adverse storage and transport conditions that field submissions may be subjected to prior to receipt for testing which may result in degradation of the viral particles. This could account for the discrepancy between the results obtained with virus isolation and the real‐time RT‐PCR. The validity of the result obtained for 38 of the 173 real‐time RT‐PCR positive, virus isolation negative samples could be confirmed by sequencing of the amplicon generated by the diagnostic RT‐PCR. However, it was not possible to generate good‐quality sequence data from all of the 116 amplicons tested, and we hypothesized that this may be attributed to degradation of the viral RNA after the long periods of storage and repeated cycles of freeze‐thawing that the RNA extracts were subjected to. Alternatively, this may be caused by the short length of the amplicon used, as short stretches of sequence information could be difficult to identify using the BLASTN‐based method utilized within this study.
Infectious bronchitis virus RNA has been detected in tracheal swab samples by other real‐time RT‐PCRs for at least 21 days post‐vaccination (Callison et al., 2006) and has been isolated from faecal samples in some infected birds as long as 227 days post‐infection (Alexander and Gough, 1977, 1978), making it essential to be able to differentiate between vaccine and field strains for diagnostic purposes. S1 genotyping to identify an IBV strain is used widely (Kingham et al., 2000; Farsang et al., 2002; Bochkov et al., 2006; Worthington et al., 2008) and has been found to correlate with serotyping of the viral strain (Wang and Tsai, 1996; Keeler et al., 1998), although it has been demonstrated (Bochkov et al., 2007) that genotyping IBV strains using either the S or N genes can offer a different perspective on the relationship of IBV strains. Genotyping of the hypervariable region (HVR) of the S1 gene has also been reported to yield the same result as genotyping the entire S1 gene sequence (Wang and Huang, 2000). The S1 genotyping method described in this paper amplifies a region, including the HVR 2, which is known to show variation at the sequence level between different IBV strains (Cavanagh et al., 1988). The use of a panel of both forward and reverse primers should allow the identification of the majority of IBV strains currently circulating in Europe, as well as offering the opportunity to detect novel IBV genotypes as they arise, which is crucial for informing vaccination strategies. It is also recognized that performing such a genotyping assay in a routine testing environment offers an extra challenge in the form of data interpretation, particularly when distinguishing field from vaccine strains. It seems likely, as discussed (Worthington et al., 2008), that identification of strains with sequences identical to those of vaccine strains is likely to indicate the presence of the vaccine strain within the sampled birds. However, it cannot be discounted that theoretically, these could be separate field strains.
In the present study, comparison of the sequence of a 140‐bp region of the S1 gene of IBV allowed field strains to be clustered within the main recognized IBV serotypes. The sequence of strains within a serotype was shown to differ with <5% nucleotide identity, which is comparable with previous studies looking at different strains from within a particular serotype and comparing the sequence of the entire S1 gene (Cavanagh et al., 1988, 1992, 2005). Analysis based on the sequence of a 140‐bp region suggested that different groups of serotypes differed at the level of nucleotide identity at >15% in this region, consistent with published data that suggested that different serotypes varied at approximately 70% when comparing the first 560 nucleotides of the S1 gene (Cavanagh et al., 2005).
One of the drawbacks to this method of IBV strain identification is the possibility of multiple IBV strains being present within a single field sample, as may occur after routine vaccination of birds with a live attenuated IBV vaccine followed by a field challenge with a genetically distinct strain of IBV. While this remains a limitation of the method, evidence exists that more virulent strains of IBV may replicate to higher titres than more attenuated strains in infected birds (Cavanagh and Gelb, 2008) and should therefore be detected preferentially by this method.
The coupling of a generic diagnostic real‐time RT‐PCR to detect IBV with a strain genotyping method based on the S1 HVR provides a rapid and cost‐effective method suitable for the routine detection and identification of IBV and closely related gammacoronaviruses in field samples, and use of such tests within a diagnostic setting enhances existing scanning surveillance capabilities to detect both extant, contemporary IB viruses and new and emerging IBV variants in poultry.
Acknowledgements
This work was funded by the Veterinary Laboratories Agency (VLA) Test Development Projects, TD0022 and TD0069. The authors thank staff from the VLA Regional Laboratories and from private veterinary practices who submitted samples for this study, and the vaccine companies who provided vaccines for use in this work. The authors also thank Robin Sayers for his help with the statistical analysis of the data, Jo Mayers, Vaneesa Ceeraz and Shital Patel for technical assistance, and Richard Gough, Mike Collins, Jason Sawyer and Kath Webster for their advice and support.
References
- Alexander, D.J. , and Gough R.E., 1977: Isolation of avian infectious bronchitis virus from experimentally infected chickens. Res. Vet. Sci. 23, 344–347. [PubMed] [Google Scholar]
- Alexander, D.J. , and Gough R.E., 1978: A long‐term study of the pathogenesis of infection of fowls with three strains of avian infectious bronchitis virus. Res. Vet. Sci. 24, 228–233. [PubMed] [Google Scholar]
- Altschul, S.F. , Gish W., Miller W., Myers E.W., and Lipman D.J., 1990: Basic local alignment search tool. J. Mol. Biol. 215, 403–410. [DOI] [PubMed] [Google Scholar]
- Bochkov, Y.A. , Batchenko G.V., Shcherbakova L.O., Borisov A.V., and Drygin V.V., 2006: Molecular epizootiology of avian infectious bronchitis in Russia. Avian Pathol. 35, 379–393. [DOI] [PubMed] [Google Scholar]
- Bochkov, Y.A. , Tosi G., Massi P., and Drygin V.V., 2007: Phylogenetic analysis of partial S1 and N gene sequences of infectious bronchitis virus isolates from Italy revealed genetic diversity and recombination. Virus Genes 35, 65–71. [DOI] [PMC free article] [PubMed] [Google Scholar]
- Callison, S.A. , Hilt D.A., Boynton T.O., Sample B.F., Robison R., Swayne D.E., and Jackwood M.W., 2006: Development and evaluation of a real‐time Taqman RT‐PCR assay for the detection of infectious bronchitis virus from infected chickens. J. Virol. Methods 138, 60–65. [DOI] [PMC free article] [PubMed] [Google Scholar]
- Cavanagh, D. , 2003: Severe acute respiratory syndrome vaccine development: experiences of vaccination against avian infectious bronchitis coronavirus. Avian Pathol. 32, 567–582. [DOI] [PMC free article] [PubMed] [Google Scholar]
- Cavanagh, D. , 2005: Coronaviruses in poultry and other birds. Avian Pathol. 34, 439–448. [DOI] [PubMed] [Google Scholar]
- Cavanagh, D. , 2007: Coronavirus avian infectious bronchitis virus. Vet. Res. 38, 281–297. [DOI] [PubMed] [Google Scholar]
- Cavanagh, D. , and Gelb J., 2008: Infectious bronchitis In: Saif Y.M. (ed.), Diseases of Poultry, 12th edn, pp. 117–137. Wiley‐Blackwell, Hoboken, NJ, US. [Google Scholar]
- Cavanagh, D. , Davis P.J., and Mockett A.P., 1988: Amino acids within hypervariable region 1 of avian coronavirus IBV (Massachusetts serotype) spike glycoprotein are associated with neutralization epitopes. Virus Res. 11, 141–150. [DOI] [PMC free article] [PubMed] [Google Scholar]
- Cavanagh, D. , Davis P.J., Cook J.K., Li D., Kant A., and Koch G., 1992: Location of the amino acid differences in the S1 spike glycoprotein subunit of closely related serotypes of infectious bronchitis virus. Avian Pathol. 21, 33–43. [DOI] [PubMed] [Google Scholar]
- Cavanagh, D. , Mawditt K., Sharma M., Drury S.E., Ainsworth H.L., Britton P., and Gough R.E., 2001: Detection of a coronavirus from turkey poults in Europe genetically related to infectious bronchitis virus of chickens. Avian Pathol. 30, 355–368. [DOI] [PubMed] [Google Scholar]
- Cavanagh, D. , Mawditt K., Welchman D.de.B., Britton P., and Gough R.E., 2002: Coronaviruses from pheasants (Phasianus colchicus) are genetically closely related to coronaviruses of domestic fowl (infectious bronchitis virus) and turkeys. Avian Pathol. 31, 81–93. [DOI] [PubMed] [Google Scholar]
- Cavanagh, D. , Picault J.P., Gough R., Hess M., Mawditt K., and Britton P., 2005: Variation in the spike protein of the 793/B type of infectious bronchitis virus, in the field and during alternate passage in chickens and embryonated eggs. Avian Pathol. 34, 20–25. [DOI] [PubMed] [Google Scholar]
- Dalton, K. , Casais R., Shaw K., Stirrups K., Evans S., Britton P., Brown T.D., and Cavanagh D., 2001: cis‐acting sequences required for coronavirus infectious bronchitis virus defective‐RNA replication and packaging. J. Virol. 75, 125–133. [DOI] [PMC free article] [PubMed] [Google Scholar]
- De Wit, J.J. , 2000: Detection of infectious bronchitis virus. Avian Pathol. 29, 71–93. [DOI] [PubMed] [Google Scholar]
- Escutenaire, S. , Mohamed N., Isaksson M., Thoren P., Klingeborn B., Belak S., Berg M., and Blomberg J., 2007: SYBR Green real‐time reverse transcription‐polymerase chain reaction assay for the generic detection of coronaviruses. Arch. Virol. 152, 41–58. [DOI] [PMC free article] [PubMed] [Google Scholar]
- Farsang, A. , Ros C., Renstrom L.H., Baule C., Soos T., and Belak S., 2002: Molecular epizootiology of infectious bronchitis virus in Sweden indicating the involvement of a vaccine strain. Avian Pathol. 31, 229–236. [DOI] [PMC free article] [PubMed] [Google Scholar]
- Gough, R.E. , Cox W.J., Welchman D.de.B., Worthington K.J., and Jones R.C., 2008: Chinese QX strain of infectious bronchitis virus isolated in the UK. Vet. Rec. 156, 99–100. [DOI] [PubMed] [Google Scholar]
- Guy, J.S. , 2000: Turkey coronavirus is more closely related to avian infectious bronchitis virus than to mammalian coronaviruses: a review. Avian Pathol. 29, 207–212. [DOI] [PubMed] [Google Scholar]
- Ignjatovic, J. , and Sapats S., 2000: Avian infectious bronchitis virus. Rev. Sci. Tech. 19, 493–508. [DOI] [PubMed] [Google Scholar]
- Jackwood, M.W. , Hilt D.A., and Callison S.A., 2003: Detection of infectious bronchitis virus by real‐time reverse transcriptase‐polymerase chain reaction and identification of a quasispecies in the Beaudette strain. Avian Dis. 47, 718–724. [DOI] [PubMed] [Google Scholar]
- Jonassen, C.M. , Kofstad T., Larsen I.L., Lovland A., Handeland K., Follestad A., and Lillehaug A., 2005: Molecular identification and characterization of novel coronaviruses infecting graylag geese (Anser anser), feral pigeons (Columbia livia) and mallards (Anas platyrhynchos). J. Gen. Virol. 86, 1597–1607. [DOI] [PubMed] [Google Scholar]
- Keeler C.L. Jr, Reed K.L., Nix W.A., and Gelb J. Jr, 1998: Serotype identification of avian infectious bronchitis virus by RT‐PCR of the peplomer (S‐1) gene. Avian Dis. 42, 275–284. [PubMed] [Google Scholar]
- Kingham, B.F. , Keeler C.L. Jr, Nix W.A., Ladman B.S., and Gelb J. Jr, 2000: Identification of avian infectious bronchitis virus by direct automated cycle sequencing of the S‐1 gene. Avian Dis. 44, 325–335. [PubMed] [Google Scholar]
- Landman, W.J.M. , Dwars R.M., and De Witt J.J., 2005: High incidence of false layers in (re)production hens supposedly attributed to a juvenile infectious bronchitis virus infection. Proceedings of the 54th Western Poultry Disease Conference.
- Sapats, S.I. , Ashton F., Wright P.J., and Ignjatovic J., 1996: Novel variation in the N protein of avian infectious bronchitis virus. Virology 226, 412–417. [DOI] [PMC free article] [PubMed] [Google Scholar]
- Tamura, K. , Dudley J., Nei M., and Kumar S., 2007: MEGA4: Molecular Evolutionary Genetics Analysis (MEGA) software version 4.0. Mol. Biol. Evol. 24, 1596–1599. [DOI] [PubMed] [Google Scholar]
- Wang, C.H. , and Huang Y.C., 2000: Relationship between serotypes and genotypes based on the hypervariable region of the S1 gene of infectious bronchitis virus. Arch. Virol. 145, 291–300. [DOI] [PMC free article] [PubMed] [Google Scholar]
- Wang, C.H. , and Tsai C.T., 1996: Genetic grouping for the isolates of avian infectious bronchitis virus in Taiwan. Arch. Virol. 141, 1677–1688. [DOI] [PMC free article] [PubMed] [Google Scholar]
- Williams, A.K. , Wang L., Sneed L.W., and Collisson E.W., 1993: Analysis of a hypervariable region in the 3′ non‐coding end of the infectious bronchitis virus genome. Virus Res. 28, 19–27. [DOI] [PMC free article] [PubMed] [Google Scholar]
- World Organisation for Animal Health (OIE) , 2008: Avian infectious bronchitis. Chapter 2.3.2. Manual of Diagnostic Tests and Vaccines for Terrestrial Animals, 6th edn OIE, Paris. [Google Scholar]
- Worthington, K.J. , Currie R.J., and Jones R.C., 2008: A reverse transcriptase‐polymerase chain reaction survey of infectious bronchitis virus genotypes in Western Europe from 2002 to 2006. Avian Pathol. 37, 247–257. [DOI] [PubMed] [Google Scholar]