

Abstract
In this study, newly identified host interactors of hepatitis C virus (HCV) proteins were assessed for a role in modulating the innate immune response. The analysis revealed enrichment for components of the nuclear transport machinery and the crucial interaction with NS3/4A protein in suppression of interferon‐β (IFNB1) induction. Using a comprehensive microscopy‐based high‐content screening approach combined to the gene silencing of nuclear transport factors, we showed that NS3/4A‐interacting proteins control the nucleocytoplasmic trafficking of IFN regulatory factor 3 (IRF3) and NF‐κB p65 upon Sendai virus (SeV) infection. Notably, importin β1 (IMPβ1) knockdown—a hub protein highly targeted by several viruses—decreases the nuclear translocation of both transcription factors and prevents IFNB1 and IFIT1 induction, correlating with a rapid increased of viral proteins and virus‐mediated apoptosis. Here we show that NS3/4A triggers the cleavage of IMPβ1 and inhibits nuclear transport to disrupt IFNB1 production. Importantly, mutated IMPβ1 resistant to cleavage completely restores signaling, similar to the treatment with BILN 2061 protease inhibitor, correlating with the disappearance of cleavage products. Overall, the data indicate that HCV NS3/4A targeting of IMPβ1 and related modulators of IRF3 and NF‐κB nuclear transport constitute an important innate immune subversion strategy and inspire new avenues for broad‐spectrum antiviral therapies.

Keywords: HCV, importin‐α, importin‐β, IMPβ1/KPNB1, innate antiviral immunity, interferon‐β, IRF3, microscopy‐based high‐content screening, NF‐κB p65, NPC, NS3/4A protein, nuclear pore complex, nuclear translocation, nucleocytoplasmic transport, RNAi screen, SeV, virus‐host interaction
Hepatitis C virus (HCV) hijacks the cellular host machinery to promote replication and to evade immune response. Using a microscopy‐based High Content Screening (HCS) assay, we demonstrated that HCV‐host interactors involved in nuclear transport are crucial for IRF3 and NFκB‐p65 signaling of IFNB1 response. To subvert innate immunity, NS3/4A interacts and cleaves IMPβ1, a key nucleocytoplasmic transport receptor, to prevent nuclear translocation of IRF3 and NFκB‐p65 transcription factors. Future studies will confirm if IMPβ1 is a prime target for several viruses to evade host defense.
1. INTRODUCTION
Several viruses interact with components of the nucleocytoplasmic trafficking to facilitate viral replication. Indeed, many proteomic and functional RNAi genetic screens revealed that modulation of nuclear pore complexes (NPCs), nuclear transport receptors and the RAN‐GTPase system have profound effects on viral replication.1, 2, 3, 4, 5 For instance, interactions between viral proteins, nucleoporins (Nups), RAN, importin‐α (IMP‐α), importin‐β (IMP‐β) and exportin (EXP) have been observed with hepatitis C virus (HCV),1, 6, 7 picornavirus,8 and human immuno‐deficiency virus (HIV)‐1.9, 10 In HCV infection, viral proteins (core, NS2, NS3 and NS5A) harbor a nuclear localization signal (NLS) and/or nuclear export signal (NES)11, 12 suggesting that nuclear‐cytoplasmic shuttling is important for it virus life cycle that is mostly within the cytoplasm.6 Indeed, Nups were reported to accumulate in virus‐induced endoplasmic reticulum (ER)‐derived membranous structures where HCV replication occurs (so‐called membranous webs), indicating that Nups can gate these cytoplasmic compartments to promote viral RNA replication and to prevent cytosolic RIG‐I‐like receptor (RLR) sensing of viral RNA.6, 7, 13 This is further supported by the findings that silencing IMPβ1, TNPO1 (KPNB2) and RAN, all involved with nucleocytoplasmic transport and elucidated to interact with NS3/4A protein, decreases HCV replication.1 For many negative‐sense RNA viruses (NSV) including Sendai virus (SeV), the nuclear trafficking of the matrix protein has been reported to be critical for efficient production of viruses and to their pathogenesis.14 Viruses also co‐opt nucleocytoplasmic trafficking to facilitate transport of viral RNAs. Influenza A virus, one of the few NSV to replicate in the nucleus, uses NS1 to form an inhibitory complex with nuclear RNA export factor 1 (NXF1) and NTF2‐related export protein 1 (NXT1/p15) to block mRNA export,15 while interaction of its nucleoprotein (NP) with NXT1 promotes the nuclear export of viral ribonucleoproteins (vRNPs) in an EXP1‐dependent manner.16
Viruses also interact with nucleocytoplasmic trafficking of transcription factors (TFs) of the immune responses as a viral strategy to promote viral growth. Highly pathogenic mononegavirale members such as the Nipah virus interacts with IMPα4 (KPNA3) and IMPα3 (KPNA4) for its viral protein nuclear localization to inhibit the activation of the IRF3‐responsive promoter,17 while Ebolavirus interacts with IMPα5 (KPNA1), IMPα6 (KPNA5) and IMPα7 (KPNA6) to disrupt their interaction with tyrosine‐phosphorylated STAT1 for nuclear import, inhibiting IFN‐stimulated gene (ISG) production.18, 19 Similarly, positive‐sense RNA poliovirus and rhinovirus are shown to disrupt nucleocytoplasmic trafficking by proteolytic cleavage of specific Nups that inhibit host antiviral defense pathways.20, 21, 22, 23 Nidovirales like porcine reproductive and respiratory syndrome virus (PRRSV) degrades IMPα5 to block IFN‐stimulated gene factor 3 (ISGF3) nuclear import, while SARS coronavirus (SARS‐CoV) tethers IMPβ1 to ER and Golgi membranes, blocking STAT1 nuclear import.24, 25 Finally, HCV NS3/4A interacts with IMPβ1 to prevent nuclear translocation of STAT1 and subsequent induction of ISGs.1 Thus, viruses have evolved multiple strategies to exploit nucleocytoplasmic transport pathways to avert the host innate immune response and facilitate their replication.
NPCs are ~60 to 120 MDa structures involved in the trafficking of macromolecules between the nucleus and the cytoplasm26 that are composed of at least 30 different Nups.27, 28, 29 These include the transmembrane Nups (POMs) that anchor to the NPC in the nuclear envelope, structural Nups that form the skeleton of the NPC, and the intrinsically disordered Nups that constitute the permeability barrier with their disordered phenylalanine‐glycine‐rich regions (FG‐Nups). The translocation of macromolecules (>40‐60 kDa) across the NPC is facilitated by the IMP‐β family proteins, which are nucleocytoplasmic transport receptors (NTRs) that primarily carry nuclear proteins and small RNAs as their cargoes through the nuclear pores. The human genome encodes 20 species of IMP‐β family NTRs, of which 10 are nuclear import receptors, 7 are export receptors, 2 are bi‐directional receptors and RanBP6 that the function is undetermined.30 IMPβ1 is one of the best‐studied member of the IMP‐β protein family that mediate import of proteins into the nucleus either directly or indirectly through binding of adaptor proteins that belong to the IMP‐α family.30 These adaptors recognize proteins that contain a classical NLS and connect IMPβ1 and cargo molecules for their translocation in the nucleus. As such, IMPβ1 contains 19 tandem HEAT sequence repeats, which binds cargo‐IMP‐α complex through HEAT repeats 7‐19,31 RAN via HEAT repeats 1‐3, 6, 7, 13 and 1432, 33 and FG‐Nups via HEAT repeats 5 and 6 for the translocation of cargo through NPCs.34 Many proteins are also recognized directly by specific NTRs of the IMP‐β family (TNPO1, TNPO2, TNPO3/IPO12) without the intervention of IMP‐α, and often contain a proline‐tyrosine NLS (PY‐NLS) motif.27 Conversely, EXP‐1/CRM1, through interaction with NES, and others such as EXP‐2/CSE1L, ‐5, ‐6, ‐7, ‐t and RanBP17 facilitate protein export to the cytoplasm. Finally, the direction of cargo transport is mainly controlled by GTP‐binding nuclear protein Ran (RAN) across the nuclear envelope. RAN in the nucleus dissembles NTR‐cargo import complexes, releasing the cargo and allowing NTRs to translocate back to the cytoplasm,35 whereas RAN bound EXP‐cargo complexes in the cytoplasm are dissembled when RANGTP is hydrolyzed to RANGDP by GTPase‐activating protein 1 (RANGAP1) and RAN binding proteins.36
In this study, HCV‐host interactors previously identified by liquid chromatography‐mass spectroscopy (LC‐MS/MS) analysis are investigated for their effect on IFNB1 transcription in response to SeV infection by gene silencing. Factors with the greatest inhibitory effects are functionally associated with protein transport by Gene Ontology (GO) analysis. Notably, all candidates were determined to interact with NS3/4A protein, which is well‐known for its role in evading the antiviral response. The effects of silencing proteins associated to nucleocytoplasmic trafficking were investigated for IFNB1 production through the nuclear translocation of IRF3 and nuclear factor‐kappa B(NF‐κB) p65 TFs upon viral infection. By a microscopy‐based high‐content screening combined to gene silencing, we identified several proteins that reduce the number of IRF3‐ and p65‐positive nuclei within a 10 hours period post‐infection decreasing IFNB1 production. We also identified proteins that delayed, increased or had a differential effect on IRF3 and NF‐κB p65 nuclear translocation, and similarly reduced IFNB1 production upon gene knockdown. Depletion of the main import carrier IMPβ1 showed the most significant decrease in IFIT1 (ISG56) expression, which correlated with rapid increase of viral protein levels and virus‐mediated apoptosis. We found that expression of NS3/4A triggers the cleavage of IMPβ1 to evade IFNB1 production in cells that are knockout (KO) for mitochondrial antiviral‐signaling protein (MAVS) and reconstituted with an NS3/4A cleavage‐resistant MAVS variant (C508R). Moreover, expression of cleavage‐resistant IMPβ1 variant fully restores signaling and IFNB1 induction, similar to the treatment of infected cells by BILN 2061 protease inhibitor, correlating with the disappearance of IMPβ1 cleavage products. The data underline the targeting of key regulators of IRF3 and NF‐κB nuclear trafficking of IFNB1 antiviral response as a viral subversion strategy to promote viral replication and pathogenesis.
2. RESULTS
2.1. Effect of silencing HCV‐interacting proteins on IFNB1 antiviral response
We previously identified hundreds of human proteins interacting with HCV by an immunoprecipitation (IP)‐based approach using a 3X‐FLAG peptide in fusion with viral proteins and LC‐MS/MS analysis.1 This HCV interactome study led to the identification of selective host interactors to one of the viral proteins Core, NS2, NS3/4A, NS4B, NS5A and NS5B. The biological significance of these host proteins with an RNAi silencing screen further revealed that majority of these interactors are not affecting virus replication. However, HCV replication is often monitored in the RIG‐I deficient Huh7.5 cell line such that one cannot assess if the viral‐host protein interactions benefit the virus through subversion of the innate immune response resulting in increased viral replication and pathogenesis. To test this hypothesis, we silenced 132 selective HCV‐host interactors (Figure S1, Supporting Information) using ~5 independent short hairpin RNA (shRNA)‐expressing lentiviruses, and measured the induction of IFNB1 promoter‐driven firefly luciferase upon SeV infection of A549 human lung carcinoma cells and Human Embryonic Kidney (HEK)293T cells. We previously showed that SeV infection predominantly activates the RLR pathway in these cells, leading to the nuclear translocation of NF‐κB and IRF3 TFs, induction of IFNB1 mRNA and secretion of IFN‐β cytokine.37 In parallel, cells harboring a luciferase gene driven by the nonimmune endogenous elongation factor 1 alpha (EEF1A1) promoter were used to assess the effects of shRNAs on basal transcription. The gene silencing screens revealed 35 modulators of antiviral response in HEK293T cells and 29 modulators in A549 cells (Figure 1). In total, 53 HCV‐host interactors, with 11 identified in both cell lines, specifically altered IFNB1 reporter expression by at least 2 independent shRNAs without affecting the constitutive expression of the EEF1A1 promoter (Table S2). The effect of silencing these 53 genes on modulation of HCV replication and antiviral response is summarized in Figure S2. Notably, 12 proteins significantly affected both viral replication and IFNB1 induction. Overall, the data provide evidence that viruses can hijack cellular processes that contribute to the innate immune response and viral replication giving a dual growth advantage.
Figure 1.
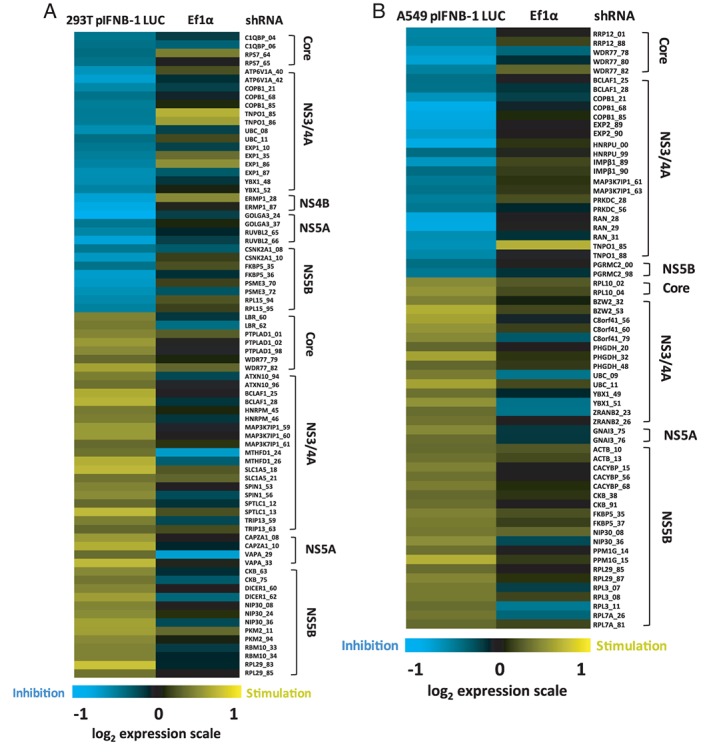
Modulation of virus‐mediated interferon‐β (IFNB1) production by gene silencing of host interactors of hepatitis C virus (HCV) proteins. Heat map visualization of the IFNB1 promoter activity upon silencing expression of 53 HCV‐host interactors in Sendai virus (SeV)‐infected cells (log2 scale). The screens are performed with Human Embryonic Kidney (HEK)293T (A) and A549 (B) cells stably expressing the firefly luciferase under the control of the IFNB1 promoter and transduced with lentivirus‐encoding short hairpin RNA (shRNA). Results were normalized according to cells treated with control shRNA non target (NT) (set to 1—black) based on an average of 2 independent experiments. The following criteria were applied to select modulator hits: at least 2 shRNAs per gene with >25% effect on IFNB1 promoter activity without affecting the nonimmune elongation factor 1α (EF1α) promoter‐driven luciferase activity. Hits are clustered by their corresponding HCV binding partners, and the last 2 digits correspond to the shRNA number of The RNAi Consortium (TRC).
2.2. GO analysis
GO enrichment was performed to determine whether these 53 virus‐host interactors associated with one another through a particular complex or cell process. Table 1 lists 10 statistically significant enriched terms (P < .05) in order of association, as well as the respective genes. The 2 most enriched terms are “protein import into the nucleus,” “docking” (enriched 72‐fold with 4 proteins: IMPβ1/KPNB1, TNPO1, EXP1/XPO1 and EXP2/CSE1L, and “nuclear pore” (enriched 23‐fold with 6 proteins: IMPβ1, TNPO1, lamin‐B receptor [LBR], EXP1, EXP2 and RAN). As previously indicated, HCV proteins such as NS3 contain an NLS that contributes to the compartmentalization of viral replication within NPC‐containing virus‐induced membranous webs to limit access of pathogen‐recognition receptors (PRRs) to these sites. Moreover, except for LBR, all 5 proteins associated with the nucleocytoplasmic transport have been shown to interact with NS3/4A, which is the main player in the evasion of the innate immune response through the cleavage of important signaling adaptors, such as MAVS and TRIF in the RLRs and Toll‐like receptors (TLRs) pathways, respectively.38, 39, 40 In addition, NS3/4A protein is known to interact with IMPβ1 to prevent STAT1 nuclear translocation in response to type I IFN‐mediated JAK‐STAT pathway activation in HeLa human cervical cancer cells.1
Table 1.
Gene ontology (GO) terms enrichment of HCV‐host interactors affecting virus‐mediated IFNB1 induction
| GO term | Gene count | Genes | Fold enrichment | P value |
|---|---|---|---|---|
| Protein Import into Nucleus, Docking (BP) | 4 | EXP2. IMPβ1, TNPO1, EXP1 | 72 | .00002 |
| Nuclear Pore (CC) | 6 | EXP2, IMPβ1, LBR, RAN, TNPO1, EXP1 | 23 | .000005 |
| Translation Elongation (BP) | 7 | RPL10, RPL15, RPL29, RPL3, RPL7A, RPS7, UBC | 21 | .00000073 |
| Protein Import into Nucleus (BP) | 5 | EXP2, IMPβ1, RAN, TNPO1, EXP1 | 18 | .00016 |
| Ribonucleoprotein Complex (CC) | 11 | ACTB, DICER1, RPL10, RPL15, RPL29, RPL3, RPL7A, RPS7, UBC, EXP1, YBX1 | 6.5 | .0000038 |
| RNA Processing (BP) | 6 | DICER, RBM10, RPS7, WDR77, YBX1, ZRANB2 | 3.4 | .029 |
| Nucleoplasm (CC) | 8 | ACTB, CSNK2A1, IMPβ1, PRKDC, RAN, RUVBL2, UBC, EXP1 | 2.8 | .021 |
| Cell Cycle (BP) | 7 | PHGDH, PPM1G, PSME3, RAN, SPIN1, TRIP13, UBC | 2.8 | .035 |
| Membrane‐enclosed Lumen (CC) | 13 | ACTB, C1QBP, CACYBP, CSNK2A1, IMPβ1, PRKDC, RAN, RPL3, RPS7, RRP12, RUVBL2, UBC, EXP1 | 2.1 | .011 |
| Nucleotide Binding (MF) | 14 | ACTB, ATP6V1A, CSNK2A1, CKB, DICER1, GNAI3, MTHFD1, PHGDH, PKM2, PRKDC, RAN RBM10, RUBVL2, TRIP13 | 1.9 | .018 |
GO biological process (BP), molecular functions (MF) and cellular compartment (CC) terms significantly enriched (P < .05) are indicated with their respective list of genes and fold enrichment. The GO terms incorrectly list EXP1/XPO1 as being involved in protein import, when it is the main carrier for protein export.
2.3. Microscopy‐based high content screening of nuclear transport of IRF3 and NF‐κB p65 upon viral infection
The interaction of a set of nuclear transport factors with HCV proteins and their combined effects on increased viral replication and subversion of innate immune response encourage further mechanistic studies. Owing to their physiological function, we hypothesized that the observed effects on IFNB1 induction are associated with the nuclear translocation of IRF3 and NF‐κB p65 in response to a phosphorylation event upon viral infection.41, 42 The nucleocytoplasmic shuttling of IRF3 and NF‐κB have been reported to be mediated via IMP‐α/β and EXP1‐dependent pathways,43, 44, 45, 46 while a more recent study indicated that the import of NF‐κB p65 mainly relies on the canonical IMPα1/IMPβ1 pathway following tumor necrosis factor‐α (TNF‐α) stimulation.46 The Nups involved in these processes, however, are yet to be determined. To test our hypothesis, we developed a microscopy‐based screen to quantify the translocation of IRF3 and NF‐κB p65 to the nucleus in a kinetic analysis of SeV infection. Figure 2A details the RNAi microscopy screening methodology. Briefly, nucleocytoplasmic trafficking genes are silenced in A549 cells cultured in transparent 96‐well plates by lentiviruses encoding shRNA for 4 days to allow for the efficient knockdown of the targeted gene. Five independent lentiviruses per gene (1 per well) are used at a multiplicity of infection (MOI) of 10. A control shRNA expressing a non‐target sequence (shRNA NT) is included in each 96‐well plate. Knockdown cells are then infected with SeV for 1, 3, 5, 8 and 10 hours, fixed, and permeabilized prior to nuclear labeling with Hoechst and IRF3 or NF‐κB p65 immunostaining. Images are captured in 9 pre‐determined fields per well, under an Operetta High Content Screening (HCS) microscope. Images are then processed using the Harmony software to delimitate the nuclear region and to measure the fluorescence intensity of IRF3 or NF‐κB p65 within the nucleus. For each 96‐well plate, a fluorescence cut‐off is set to allow the automated discrimination of cells with (green) or without (red) IRF3 or NF‐κB p65 nuclear staining (Figure 2A). This information allowed us to calculate the percentage of cells with IRF3 or NF‐κB p65 nuclear staining, and to evaluate the effect of each shRNA on SeV infection‐induced nuclear translocation of TFs.
Figure 2.
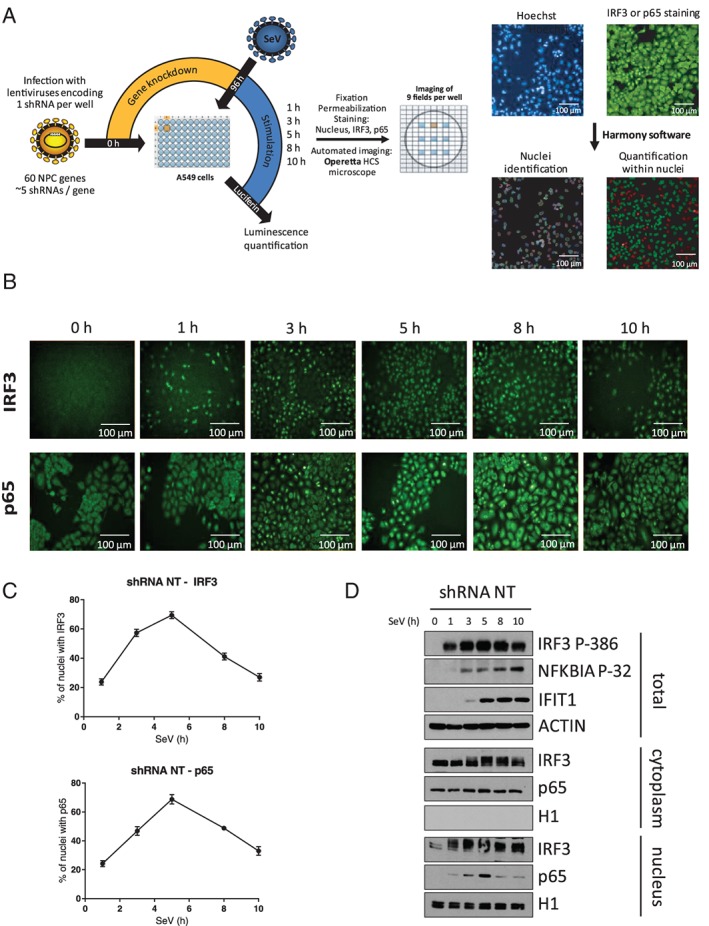
Microscopy‐based High Content Screening (HCS) of IFN regulatory factor 3 (IRF3) and NF‐κB p65 nuclear translocation. A, Overview of the microscopy‐based gene silencing screen. A549 cells plated in 96‐well plates are transduced with 5 independent lentivirus‐encoding short hairpin RNA (shRNA) per gene (1 shRNA per well) at a multiplicity of infection (MOI) of 10 for 4 days to silence expression of 60 nuclear transport factors. A control shRNA NT is included in each 96‐well plate. Cells are infected with Sendai virus (SeV) for 1, 3, 5, 8 or 10 hours before fixation, permeabilization, Hoechst nuclear labeling and antibody staining of IRF3 or NF‐κB p65 with Alexa Fluor 488 (green). Images of cells are captured in 9 pre‐determined fields for each well using an Operetta HCS Microscope. Images are processed using Harmony software to delimitate the nuclear region and measure the fluorescence intensity of IRF3 or NF‐κB p65 within the nucleus. For each 96‐well plate, a fluorescence cut‐off is set to allow automated discrimination of cells with (green) or without (red) IRF3 or NF‐κB p65 nuclear staining and to calculate the percentage of cells for each shRNA‐mediated gene knockdown. Scale bar is equal to 100 μM. B, Representative time course imaging performed with the control shRNA NT showing the nuclear translocation of IRF3 or NF‐κB p65 over a 10‐hour Sendai virus (SeV) infection (1 representative of 9 field images). Scale bar is equal to 100 μM. C, Graphic representation of the microscopy image‐based analysis showing an increase in the percentage of cells with positive nuclear staining for IRF3 or NF‐κB p65 culminating with ~75% of positive cells at 5 hours post‐infection followed by a decrease to ~30% of positive cells at 10 hours. D, Immunoblot analysis of total cell lysates, cytoplasmic and nuclear extracts of A549 cells infected with lentivirus‐encoding shRNA NT at a MOI of 10 for 3 days and infected with SeV for 0, 1, 3, 5, 8 and 10 hours prior to cell harvesting
A representative time‐course experiment performed with control shRNA NT‐transduced cells showed the nuclear translocation of both TFs over a 10‐hour SeV infection (Figure 2B). Graphical representations of these results are plotted using the percentage of positive nuclear staining for IRF3 or NF‐κB p65 (Figure 2C). Over the course of a 10‐hour SeV infection, we observed an increase in both IRF3 and NF‐κB p65 nuclear staining culminating to ~75% positive cells at 5 hours post‐infection, followed by a decrease to ~30% at 10 hours. The microscopy data are confirmed biochemically with cell fractionation and western blot analysis (Figure 2D). As expected, we observed that IRF3 phosphorylation on Ser386 began at 1 hour, culminated at 5 hours and then decreased at 10 hours post‐infection, consistent with the amount of total nuclear IRF3 observed at these time points. The phosphorylated forms of IRF3 could also be observed using the anti‐IRF3 antibody in both cytoplasmic and nuclear fractions. Moreover, phosphorylation of the NF‐κB negative regulator NFKBIA on Ser32—which triggers its ubiquitination and degradation—gradually increased from 1 to 10 hours post‐infection. NFKBIA degradation then allowed for NF‐κB p65 nuclear translocation, which began at 1 hour, culminated at 5 hours and subsequently decreased at 10 hours post‐infection. Cytoplasmic and nuclear fraction purity was confirmed by exclusive histone 1 (H1) staining in the nucleus and constant cytoplasmic NF‐κB p65 levels (coupled with the absence of NF‐κB p65 in the nucleus in the absence of SeV infection). With respect to gene expression, IRF3 and NF‐κB p65 nuclear translocation led to the induction of antiviral response genes, including ISG56 (IFIT1) protein, which are detectable starting 3 hours post‐infection. Collectively, these biochemical observations correlated with the results of HCS imaging analysis, thus validating our approach.
Applying the screening methodology, we were able to directly measure the effect of silencing 60 proteins associated with the NPC, nuclear transporters and RAN system. Each independent shRNAs targeting a specific gene was compared with that of control cells transduced with lentivirus‐expressing shRNA NT. To facilitate their visualization and analysis, results obtained with control shRNA NT were normalized to 0 for every time point, allowing the effect of independent shRNA to be represented as relative percentage of each TF in the nucleus of viable cells. The shRNA screen revealed 33 proteins for which knockdown significantly affected IRF3 or NF‐κB p65 nuclear translocation with at least 2 independent shRNAs following SeV infection (Table 2). Notably, knockdown led to decreased translocation for 25 proteins, delayed translocation for 4 proteins (IMPα4, NUP43, NUPL2 and TNPO2), increased translocation for 2 proteins (IMPα3 and EXP1), and to differential effects on IRF3 and NF‐κB p65 translocation for 2 proteins (IMPα6 and RANBP3). We further divided these 33 proteins into subgroups based on their function and localization, respectively.
Table 2.
Identification and functional classification of nuclear transport genes affecting IFNB1 production
| Protein | Role | IRF3 | p65 | |
|---|---|---|---|---|
| IMP‐α adaptors | ||||
| IMPα1 | Dual | Negative | −20 | −30 |
| IMPα3 | Dual | Positive | 30 | 10 |
| IMPα4 | Dual | Negative | −20 | −30 |
| IMPα5 | p65 | Negative | 0 | −30 |
| IMPα6 | Dual | Negative | −20 | −40 |
| IMPα6a | IRF3 | Positive | 30 | 0 |
| IMPα7 | p65 | Negative | 0 | −20 |
| IMP‐β import receptors | ||||
| IMPβ1 | Dual | Negative | −40 | −35 |
| IPO4 | Dual | Negative | −10 | −10 |
| IPO7 | Dual | Negative | −15 | −15 |
| IPO8 | Dual | Negative | −15 | −35 |
| TNPO1 | Dual | Negative | −40 | −30 |
| TNPO2 | Dual | Negative | −5 | −5 |
| IPO12 | Dual | Negative | −20 | −20 |
| IMP‐β export receptors | ||||
| EXP1 | Dual | Positive | 30 | 20 |
| EXP2 | Dual | Negative | −40 | −40 |
| RANBP3 | p65 | Negative | 0 | −25 |
| RANBP3a | IFR3 | Positive | 20 | 0 |
| mRNA export | ||||
| NXT1 | Dual | Negative | −25 | −15 |
| NXT2 | Dual | Negative | −10 | −20 |
| NXF1 | Dual | Negative | −30 | −40 |
| NXF2 | Dual | Negative | −25 | −25 |
| RAN gradient | ||||
| RAN | Dual | Negative | −40 | −30 |
| NUTF2 | Dual | Negative | −25 | −30 |
| RCC1 | Dual | Negative | −30 | −30 |
| FG‐Nups | ||||
| RANBP2 | Dual | Negative | −25 | −25 |
| NUP214 | Dual | Negative | −25 | −25 |
| NUPL2 | Dual | Negative | −20 | −15 |
| Outer‐ring Nups | ||||
| NUP160 | Dual | Negative | −35 | −30 |
| NUP107 | Dual | Negative | −25 | −25 |
| NUP43 | Dual | Negative | −20 | −30 |
| Linker Nups | ||||
| NUP93 | Dual | Negative | −15 | −25 |
| NUP88 | Dual | Negative | −20 | −25 |
| Central FG‐Nups | ||||
| NUP54 | Dual | Negative | −20 | −30 |
| NUP35 | Dual | Negative | −10 | −20 |
| NUPL1 | Dual | Negative | −25 | −25 |
At 8 h post‐infection.
2.4. Analysis of IMP‐β NTRs and Nups knockdown on virus‐mediated IRF3/NF‐κB p65 nuclear translocation and IFNB1 production
The analysis revealed that the silencing of IMP‐α proteins (KPNA1‐6) led to a distinct phenotype for 5 of the 6 adaptors, with a major decrease in NF‐κB p65 nuclear translocation at 3 hours post‐SeV infection, the only exception being with IMPα3 (KPNA4) knockdown cells (Figures 3 and S3). Notably, the effect of these adaptors on IRF3 was more variable—but IMPα3 also increased IRF3 translocation; whereas IMPα6 (KPNA5) knockdown resulted in delayed IRF3 and diminished NF‐κB p65 nuclear translocation. Alternatively, functionally grouped NTRs mostly attenuated nuclear translocation (Figures 4 and S4), which are expected of IMP‐β nuclear import receptors; however, TNPO2 knockdown showed delayed translocation for both TFs, and differed from TNPO1's knockdown phenotype (Figures 4B and S5). Moreover, knockdown of the main export carrier EXP1 increased nuclear translocation of TFs, in contrast to EXP2 (CSE1L), with transient and sustained kinetics for IRF3 and NF‐κB p65, respectively (Figures 4C and S6). Interestingly, IMPα6 and RANBP3 knockdown both caused a delay in IRF3 translocation and a transient decrease in NF‐κB p65, suggesting that RANBP3 utilizes IMPα6 as an adaptor (Figures 4C and S6). Figure 5 displayed a decrease of IRF3 and NF‐κB p65 nuclear translocation for the knockdown of most Nups that are categorized by their localization within the NPC, with the exception of NUPL2 (Figures 5A and S9) and NUP43 (Figures 5B and S10). Specifically, NUPL2 knockdown cells increased IRF3 translocation at very early stages of infection, and correlated with EXP1 knockdown effect, which is expected as NUPL2 promotes EXP1 function.47 Furthermore, NUP43 knockdown cells showed a similar nuclear translocation phenotype for both factors, as seen with IMPα6 and RANBP3 knockdown, suggesting that NUP43 plays a functionally significant role in RANBP3‐IMPα6 import complex through the NPC.
Figure 3.
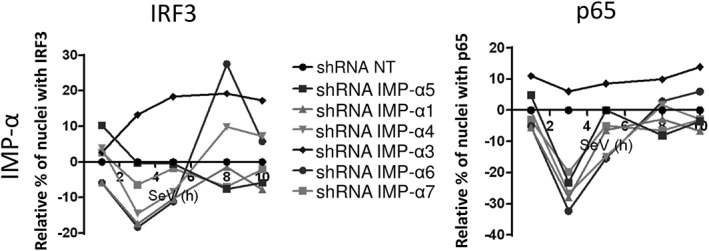
Effect of silencing importin (IMP)‐α adaptors on IFN regulatory factor 3 (IRF3) and NF‐κB p65 nuclear translocation. IMP‐α adaptors are silenced in Sendai virus (SeV)‐infected cells. Relative percentage of cells containing IRF3 (left) and NF‐κB p65 (right) in the nucleus after normalization of the control short hairpin RNA (shRNA) NT to 0 for all time points. Results are presented as average of all shRNAs for each IMP‐α. Individual shRNA results on IRF3 and NF‐κB p65 nuclear translocation, IFNB1 promoter activity and cell proliferation and survival are described in Figure S3
Figure 4.
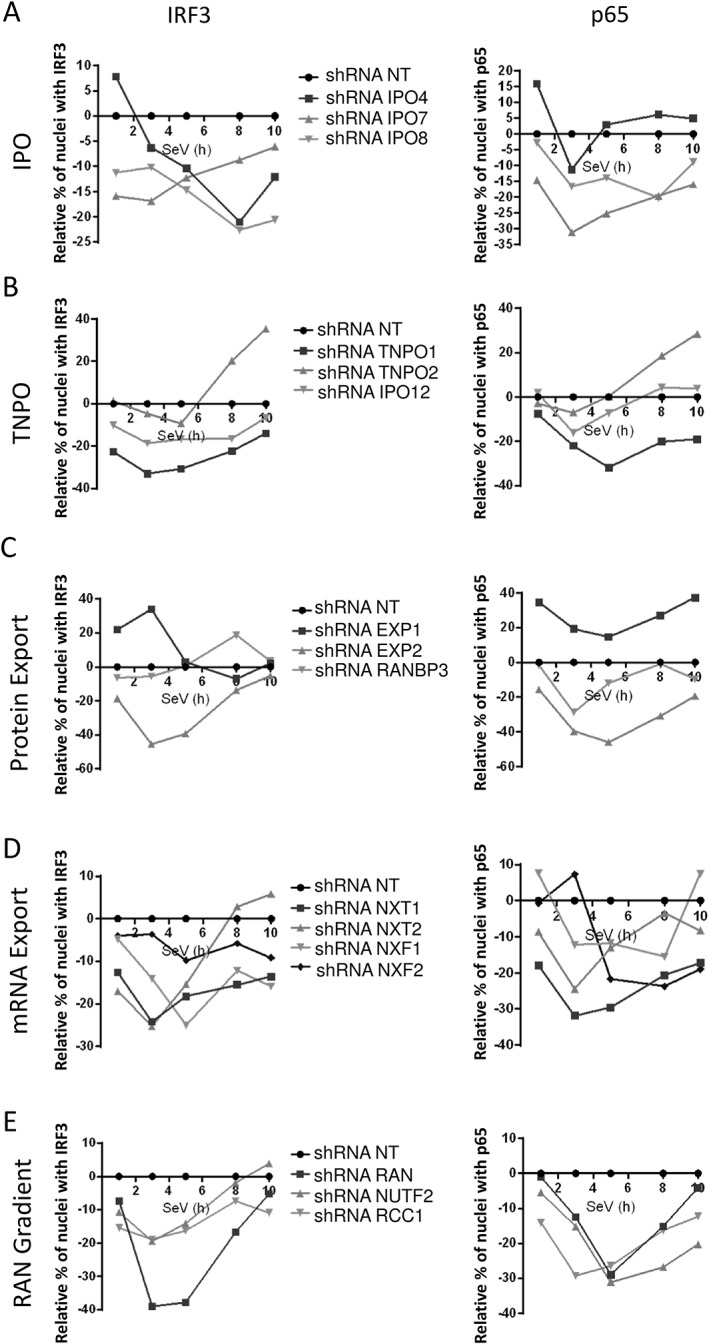
Effect of silencing importin‐β (IMP‐β) nucleocytoplasmic transport receptor (NTR) and RAN components on IFN regulatory factor 3 (IRF3) and NF‐κB p65 nuclear translocation. Importins (IPO4, IPO7, IPO8), transportins (TNPO1/IMPβ2, TNPO2/IPO3, TNPO3/IPO12), as well as proteins involved in protein export (EXP1/XPO1, EXP2/CSE1L, RANBP3), mRNA export (NXT1, NXT2, NXF1, NXF2) and RAN gradient (RAN, NUTF2, RCC1) are silenced in Sendai virus (SeV)‐infected cells. Results are presented as the average of all short hairpin RNAs (shRNAs) in relative percentage of cells containing IRF3 and NF‐κB p65 in the nucleus after normalization of the control shRNA NT to 0 for all time points. Individual shRNA results on IRF3 and NF‐κB p65 nuclear translocation, IFNB1 promoter activity and cell proliferation and survival are described in Figures S4‐S8
Figure 5.
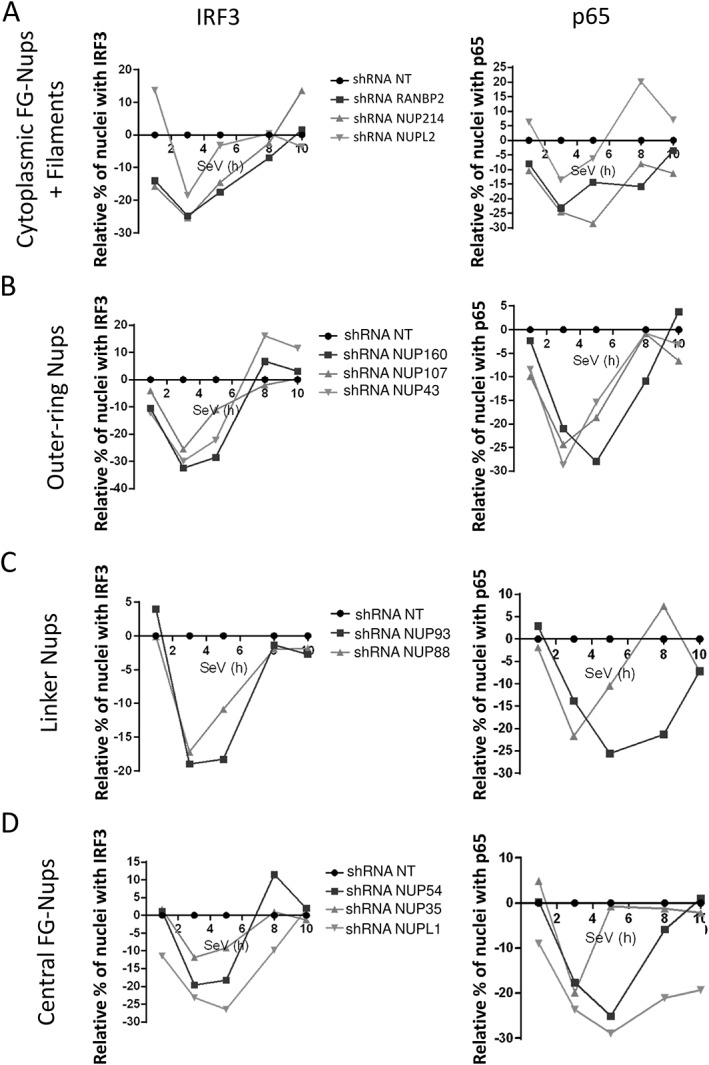
Effect of silencing nucleoporins (Nups) on IFN regulatory factor 3 (IRF3) and NF‐κB p65 nuclear translocation. Cytoplasmic FG‐Nups and filaments (RANBP2, NUP214, NUPL2), outer‐ring Nups (NUP43, NUP107, NUP160), linker Nups (NUP93, NUP88) and central FG‐Nups (NUP54, NUP35, NUPL1) are silenced in Sendai virus (SeV)‐infected cells. Results are presented as the average of all short hairpin RNAs (shRNAs) in relative percentage of cells containing IRF3 and NF‐κB p65 in the nucleus after normalization of the control shRNA NT to 0 for all time points. Individual shRNA results on IRF3 and NF‐κB p65 nuclear translocation, IFNB1 promoter activity and cell proliferation and survival are described in Figures S9‐S12
In parallel to the microscopy‐based assay, the effect of silencing each protein was also determined on IFNB1 promoter activity following SeV infection. Our results showed that the majority of nuclear transport factors that hindered IRF3 and NF‐κB p65 nuclear translocation decreased IFNB1 promoter‐driven reporter activity at 6 hours post‐SeV infection, including EXP1 and IMPα3 knockdown that both increased IRF3 and NF‐κB p65 nuclear staining. Results of the IFNB1 reporter assay are presented in histograms alongside nuclear translocation curves in Figures S3‐S12 (complete data can be found in Table S4). The histograms also show the effect of each protein knockdown on cellular proliferation and survival, as determined by relative number of nuclei per independent shRNA and compared with the control shRNA NT within the same 96‐well plate. This measure allowed us to better discriminate between non‐specific effects of shRNA expression on cellular fitness versus an actual function in innate antiviral immunity. More importantly, our data demonstrate that nuclear transport factors interacting with HCV NS3/4A protein modulate IRF3 and NF‐κB p65 signaling of IFNB1 antiviral response.
2.5. HCV NS3/4A‐mediated cleavage of IMPβ1 inhibits nuclear transport of IRF3 and NF‐κB p65 to evade IFNB1 production
Because knockdown of the NS3/4A‐interacting nuclear transport factors all negatively affected IFNB1 reporter activity, we wanted to assess their independent effects on viral replication. For this, A549 knockdown cells for IMPβ1, TNPO1, EXP1, EXP2 and RAN were infected with SeV for 8 and 24 hours (Figure 6). Notably, IMPβ1 knockdown led to a drastic and rapid increase in SeV protein levels when compared with those of control cells transduced with shRNA NT. This is further accompanied by nearly a complete inhibition of the antiviral response at 8 hours as measured by IFIT1 (ISG56) protein induction. Similar data are observed with HEK293T (Figure S13). These results suggest that IMPβ1 is targeted by HCV NS3/4A protein to disrupt IFNB1 production, reminiscent to a similar mechanism employed by HCV to prevent the nuclear translocation of STAT1 and type I IFN signaling.1 Using 3 independent shRNAs specific to IMPβ1, we confirmed that its depletion significantly hindered IFNB1 induction of SeV‐infected cells correlating with the reduced nuclear translocation of IRF3 and NF‐κB p65 when compared with the shRNA NT (Figure 7A). Indeed, we showed that IMPβ1 knockdown led to a strong decrease in IRF3 nuclear translocation at 3 and 5 hours post‐infection, before returning to normal levels at 8 and 10 hours post‐infection. A similar pattern was observed for NF‐κB p65 nuclear translocation, although with a less drastic decrease at 3 and 5 hours post‐infection, and culminated with increased nuclear NF‐κB p65 staining at 8 and 10 hours post‐infection compared with that in presence of shRNA NT. In addition, we used caspase‐mediated poly [ADP‐ribose] polymerase 1 (PARP1) cleavage—that generates 89‐ and 24‐kDa fragments—to assess virus‐mediated apoptosis. Correspondingly, we observed that the rapid increase in SeV protein levels of IMPβ1‐depleted A549 cells was accompanied by an accelerated induction of apoptosis that started 1 hour post‐infection instead of 3 hours post‐infection in control shRNA NT expressing cells (Figure 7B).
Figure 6.
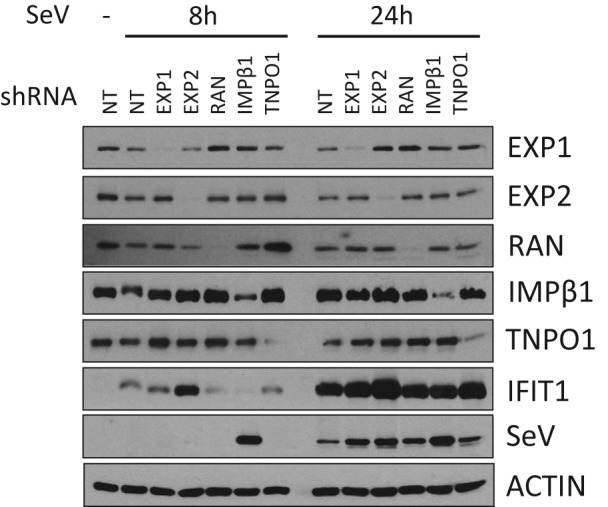
Effect of silencing NS3/4A‐interacting nuclear transport factors on Sendai virus (SeV) infection and ISG56 (IFIT1) induction. Immunoblot analysis of A549 cells infected with SeV for 8 or 24 hours following the silencing of EXP1/XPO1, EXP2/CSE1L, RAN, importin β1 (IMPβ1)/KPNB1 and TNPO1/IMPβ2 for 3 days. Short hairpin RNA (shRNA) NT is used as a control
Figure 7.
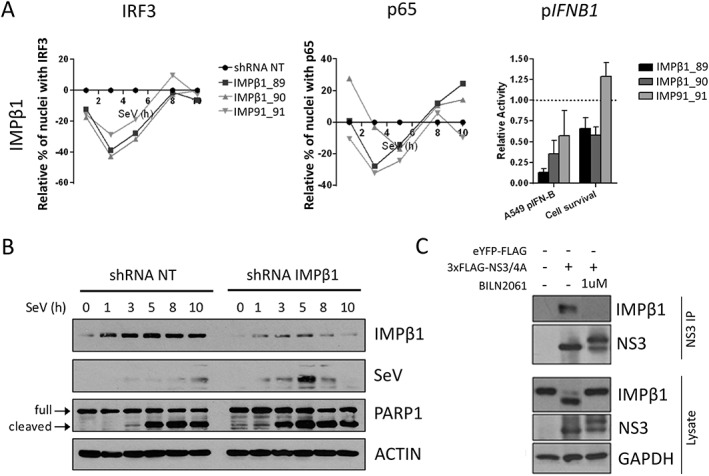
Importin β1 (IMPβ1) silencing impairs IFN regulatory factor 3 (IRF3) and NF‐κB p65 nuclear translocation, IFNB1 induction, and increases Sendai virus (SeV) protein expression and cell apoptosis. A, A total of 3 independent short hairpin RNA (shRNA) targeting IMPβ1 significantly affected nuclear translocation of both IRF3 (left panel) and NF‐κB p65 (middle panel) when compared with the shRNA NT. Relative percentage of cells containing IRF3 and p65 in the nucleus are illustrated after normalization of the control shRNA NT to 0 for all time points. The effect of shRNA‐mediated knockdown on SeV‐induced IFNB1 production is measured in A549 cells stably expressing the firefly luciferase under the control of the IFNB1 promoter (right panel). In addition, the effects of each shRNA on cell proliferation and survival are evaluated using images from the microscopy screen by dividing the total number of nuclei for a given shRNA and dividing it by the total number of nuclei for the shRNA NT control (right panel). B, Immunoblot analysis of A549 cells infected with SeV for 1, 3, 5, 8 or 10 hours following transduction with shRNA NT (control) or shRNA 89 targeting IMPβ1 for 3 days. PARP1 cleavage (arrows) is used as apoptosis readout. C, Human Embryonic Kidney (HEK)293T cells are transfected with 3×FLAG‐NS3/4A expression vector and treated with 1 μM of BILN 2061 PI. At 48 hours post‐transfection, cells are harvested and co‐immunoprecipitation using anti‐FLAG coated beads is performed on cell lysates. NS3 and IMPβ1 interaction is resolved using immunoblot. NS3, NS3/4A precursor, IMPβ1 and cleaved IMPβ1 are resolved using immunoblotting analysis of cell lysates
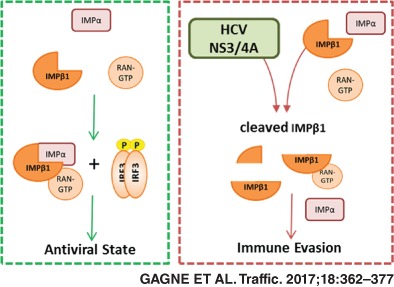
Because all proteins associated with nuclear transport interact with NS3/4A, we examined its interaction with the critically important IMPβ1 more carefully. Co‐immunoprecipitation experiments were run to validate the NS3/4A‐IMPβ1 interaction (Figure 7C). BILN 2061, a potent NS3/4A‐specific protease inhibitor (PI), was used as an additional control.48 Interestingly, aside from the expected interaction, western blot analysis revealed the recognition of an additional IMPβ1 fragment only with protease active NS3/4A and in the absence of BILN 2061 PI. An amino acid sequence within IMPβ1 C‐terminus was found to be concordant with the cleavage consensus of NS3/4A protease. The resulting sizes of predicted fragments agreed with the molecular weights of bands observed in western blot analysis: 97 kDa for full‐length IMPβ1 vs 89 kDa for cleaved IMPβ1 (Figure 7C). The cleavage at this site could rationalize the NS3/4A interaction‐mediated prevention of IRF3/NF‐κB p65 as well as STAT1 nuclear translocation.1, 49 To assess a role of NS3/4A‐mediated cleavage of IMPβ1 in subverting IRF3/NF‐κB p65 nuclear translocation, we investigated the IFNB1 promoter‐driven luciferase upon SeV infection in cells that expressed a NS3/4A protease cleavage‐resistant MAVS variant, mutated at Cys‐508 for an arginine (MAVSC508R),50 and MAVS wild‐type (WT) as control. We engineered MAVS KO cells using GeneArt gRNA, Platinum Cas9 nuclease and Lipofectamine CRISPRMAX Cas9 Transfection Reagent from Thermo Fisher Scientific51 to reduce competition between endogenous and ectopically expressed MAVS proteins. We first demonstrated that expression of NS3/4A completely blocks SeV‐mediated IFNB1 production of MAVS KO cells reconstituted with the WT protein, which is completely restored by BILN 2061 PI (Figure 8A). More importantly, NS3/4A is still able to inhibit IFNB1 of SeV‐infected cells that are reconstituted with the MAVSC508R variant, blocking up to 70% of the IFNB1‐driven luciferase induced by control cells in the absence of active NS3/4A protease. Furthermore, BILN2061 PI restores IFNB1 and IFIT1 induction, correlating with the disappearance of IMPβ1cleavage (Figure 8A,B). To confirm this, we constructed an IMPβ1 variant that is mutated at multiple residues within the cleavage consensus of NS3/4A protease (D812A, C817S and A818G), including Cys‐817 as the major determinant to produce a cleavage resistant IMPβ1 (IMPβ1CR). The expression of IMPβ1CR but not of IMPβ1 WT completely restores IFNB1 production of MAVSC508R‐reconstituted cells expressing NS3/4A protease upon infection, similar to the treatment with BILN 2061 PI (Figure 8C). The IMPβ1‐dependent nuclear transport of IRF3 was also investigated by immunofluorescence microscopy in MAVS KO cells reconstituted with the MAVSC508R variant and kinetic analysis of SeV infection (Figure 8D). NS3/4A protease expression greatly hindered IRF3 and IMPβ1 from being transported to the nucleus with a major reduction at 4 hour post‐infection. Remarkably, complete restoration of IRF3 nuclear positive cells are observed upon expression of IMPβ1CR, similar to the treatment with BILN 2061 PI (Figure 8E,F). Altogether, the data demonstrate that NS3/4A protease‐mediated cleavage of IMPβ1 inhibits innate immune response to viral infection by restricting nuclear translocation of IRF3 and NF‐κB.
Figure 8.
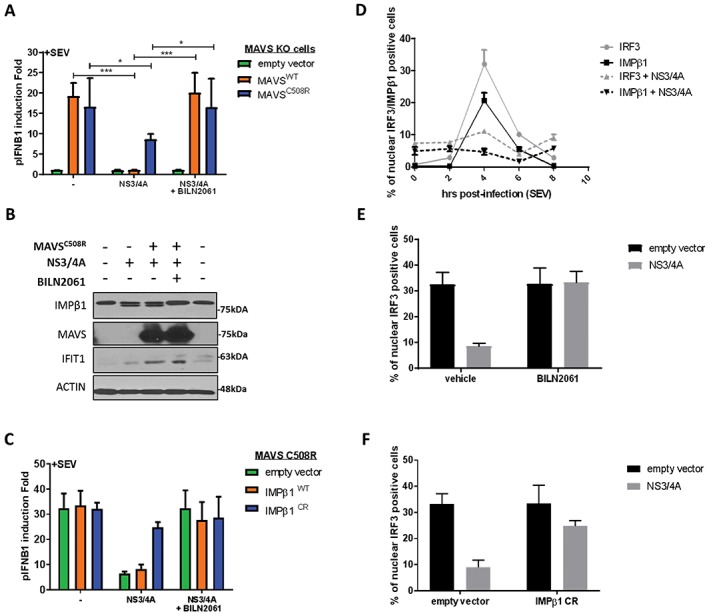
NS3/4A‐mediated cleavage of importin β1 (IMPβ1) and interferon‐β (IFNB1) inhibition are completely restored by expression of NS3/4A cleavage‐resistant IMPβ1 variant (IMPβ1CR) and treatment with BILN 2061 PI. A, Human Embryonic Kidney (HEK)293T MAVS knockout (KO) cells were transfected with an empty vector or an NS3/4A, MAVSWT, cleavage resistant MAVSC508R and pIFNB1‐LUC expression plasmids, as indicated, for a total of 48 hours. BILN2061 was used as a positive control to inhibit protease activity of NS3/4A protein. At 32 hours post‐transfection, cells were infected with Sendai virus (SeV) for 16 hours and luciferase signal was resolved. Average pIFNB1 induction folds are from 6 biological replicates. Data were analyzed using 1‐way ANOVA and significance using Bonferroni post hoc test. B, HEK293T MAVS KO cells were transfected with cleavage resistant MAVSC508R, an empty vector or NS3/4A, as indicated, for a total of 48 hours. BILN2061 was used as a positive control to inhibit protease activity of NS3/4A protein. At 32 hours post‐transfection, cells were infected with SeV for 16 hours and were harvested for western blot analysis. Immunoblots of IMPβ1, MAVS, IFIT1 and Actin are presented to complement luciferase results from (A). C, HEK293T MAVS KO cells reconstituted with cleavage resistant MAVSC508R were transfected with an empty vector or NS3/4A, IMPβ1WTor cleavage resistant IMPβ1CR and pIFNB1‐LUC expression plasmids, as indicated, for a total of 48 hours. BILN2061 PI was used to inhibit protease activity of NS3/4A protein. At 32 hours post‐transfection, cells were infected with SeV for 16 hours and luciferase signal was resolved. Average pIFNB1 induction folds are from 6 biological replicates. Data were analyzed using 1‐way ANOVA and significance using Bonferroni post hoc test. D, A549 cells were transfected with MAVSC508R, an empty vector or NS3/4A, for a total of 48 hours, as indicated. At 40 hours post‐transfection, cells were either uninfected (time 0) or infected with SeV for 2, 4, 6 and 8 hours. Cells were fixed, permeabilized and stained for IRF3 and IMPβ1, and nuclear positive cells were resolved using immunofluorescence. E, A549 cells were transfected with MAVSC508R, an empty vector or NS3/4A, for a total of 48 hours, as indicated. Concurrently, cells are treated with DMSO (vehicle) or BILN2061 PI. At 44 hours post‐transfection, cells were infected with SeV for 4 hours. Cells were fixed, permeabilized and stained for IRF3, and nuclear positive cells were resolved using immunofluorescence. F, A549 cells were transfected with MAVSC508R, an empty vector or cleavage resistant IMPβ1CR for a total of 48 hours, as indicated. At 44 hours post‐transfection, cells were infected with SeV for 4 hours. Cells were fixed, permeabilized and stained for IRF3, and nuclear positive cells were resolved using immunofluorescence.
3. DISCUSSION
The goal of the study was to elucidate novel proteins, families or processes that affected innate immune response from a subset of human proteins previously elucidated to be interacting with HCV proteins. We found that majority of host interactors did not affect HCV replication,1 although their knockdown was performed in the Huh7.5 cell line that is deficient for the RLR signaling pathway. Thus, we postulated that these host interactors may counteract viral replication by modulating antiviral response thereby providing a plausible explanation for their targeting by viral proteins. To test this hypothesis, we used a SeV model of infection and RIG‐I competent cells, and found that silencing expression of 53 of 132 interactors had a significant effect on IFNB1 production (Figure 1). Moreover, depletion of 12 of these 53 interactors was previously reported to reduce HCV replication in RLR‐deficient Huh7.5 cells (Figure S2), providing strong evidence that viruses through host interactions can hijack cellular processes involved in the modulation of innate immune response and additionally contributing to the virus replication life cycle giving a dual growth advantage. The GO term analysis of the 53 interactors revealed enrichment in nuclear protein import and export processes (Table 1). Interestingly, the interactors associated to the nucleocytoplasmic trafficking of proteins (IMPβ1, TNPO1, EXP1, EXP2 and RAN) exhibit 2 main characteristics—a potential to interact with NS3/4A (Figure S1), and a functional relevance to SeV‐induced IFNB1 promoter inhibition (Figure 1). Correspondingly, IMPβ1, TNPO1 and RAN decrease HCV replication upon their depletion in the Huh7.5 cell line,1 confirming the targeting of key players of the nuclear transport cell process to concurrently evade innate immune response and to promote virus replication. To gain mechanistic insight of the modulation of IFNB1 antiviral response by these interactors, we developed a microscopy‐based high‐content screening assay that directly evaluates the nuclear translocation of IRF3 and NF‐κB p65 over a 10‐hour viral infection time course. The assay was validated biochemically using nuclear/cytoplasmic fractionation (Figure 2D), and supported by the kinetics of phosphorylation of IRF3 and of the NF‐κB inhibitor NFKBIA upon virus‐mediated induction of antiviral response. The combined high‐content microscopy and medium throughput gene silencing screen approach was used to measure the dynamics and phenotype of IRF3 and NF‐κB p65 nuclear translocation as a valuable readout of the early antiviral response. We expanded the silencing screen to study genes involved in the NPC from the different sections of the pore (Figures 5, S9 to S12) as well as those involved in protein import, protein and mRNA export and RAN energy gradient (Figures 3, 4, S3 to S8). The screen provides a comprehensive understanding of the nuclear trafficking of IRF3 and NF‐κB p65 at different early time points of a viral infection. Moreover, the study has linked 33 nuclear transport factors that modulate the nuclear translocation of IRF3 and NF‐κB p65 as cargo proteins to the induction of an antiviral cellular phenotype.
Several NTRs were previously associated to the nuclear trafficking of NF‐κB p65 while there are virtually no reports for IRF3 during viral infection. In our study, the depletion of IMP‐α family members had varying effects on IRF3/NF‐κB p65 nuclear localization but IFNB1 production was significantly decreased when IMPα1, IMPα4 and IMPα6 are individually silenced (Figures 3 and S3), which could be attributed to these 3 genes decreasing both IRF3 and NF‐κB p65 nuclear translocation at 3 hours post‐infection. NF‐κB p65 was reported to be transported by IMPα3 and IMPα4 while a more recent study identified IMPα1 as the most critical adaptor for its nuclear translocation upon tumor necrosis factor‐α (TNF‐α) treatment.43, 44, 46 Our results largely support these studies with a predominant role of IMPα1 and IMPα4, except for the depletion of IMPα3 that may be over‐compensating by other adaptors causing the increase of NF‐κB p65 during viral infection. In addition, the need for fast activation upon viral infection must not require a process that is dependent on IMPα3 as its knockdown has no impact on IFNB1 production. Our data also demonstrate that IMPβ1 is one of the main import receptor for IRF3 and NF‐κB p65 import upon viral infection (Figure 7), as previously reported for NF‐κB p65.46 However, other carriers have been identified for NF‐κB p65 import including IPO8,46 which transports this factor in a NLS‐independent fashion after stimulation TNF‐α. In our study, knockdown of IPO8 resulted in a decrease IRF3 and NF‐κB p65 nuclear translocation during the entire time course of infection and reduction of IFNB1 production (Figures 4A and S4), suggesting that an NLS‐independent import process for IRF3 and NF‐κB p65 may take place during viral infection. We also identified the import carriers TNPO1 and IPO7 as their knockdown reduces nuclear translocation of both TFs (Figures 4A,B, S4, S5), which supports the finding of a PY‐NLS that is recognized by TNPO1.52 Finally, knockdown of IPO4, TNPO2 and IPO12 affect irregularly or at later time NF‐κB p65 and IRF3 nuclear translocation (Figures 4, S4 and S5), suggesting a weak if any contribution to these processes in a virus‐dependent manner. IMP‐β family NTRs involved in protein export have significant effects for IRF3 and NF‐κB p65 nuclear translocation and IFNB1 production, but also have pleiotropic effects on cell survival. Nevertheless, EXP1 was previously shown to bind IRF3 NES, and the use of EXP1 inhibitor leptomycin B further demonstrated an accumulation of IRF3 in the nucleus.45 Our results support EXP1 as the main carrier for IRF3 export causing nuclear accumulation of IRF3 during the early phase of the infection upon it knockdown (Figures 4 and S6). This is further supported by RANBP3 knockdown, an EXP1 cofactor for protein export,53, 54 which increases nuclear translocation of IRF3 at 8 hours of SeV infection but surprisingly without affecting IFNB1 production (Figure S6). Among all EXP family members, only EXP1 systematically exported NF‐κB p65 at all time confirming a previous study.46 Despite the increased nuclear levels of IRF3 and NF‐κB p65, EXP1 knockdown decreased IFNB1 promoter activity following SeV infection (Figure S6). This may be explained by an effect on cell survival and/or by the fact that residual NF‐κB p65 can re‐associate with IκBα to reduce it transcriptional activity when sequestered in the nucleus.55, 56 Interestingly, EXP2 knockdown causes a dramatic decrease of nuclear IRF3 and NF‐κB p65 during the entirety of the SeV infection time course leading to a significant reduction of IFNB1 and cell fitness (Figure S6). This is possibly due to its major role for the export of IMP‐α adaptors to the cytoplasm as a recycling mechanism of import complexes.57 We also identified NXF1 and NXT1 proteins that significantly reduced nuclear import of IRF3/NF‐κB p65 and IFNB1 production (Figures 4D and S7). These proteins are exploited by several viruses to promote viral mRNA export and inhibit host mRNA trafficking.20 Further studies will be required to demonstrate if the diminished amounts of IRF3 and NF‐κB p65 proteins translated and able to enter the nucleus are due to the reduced export of their mRNAs to prevent antiviral response. The silencing of RAN, NUTF2 and RCC1 equally affected IRF3 and NF‐κB p65 nuclear translocation and IFNB1 production, while only RAN silencing affected cells survival (Figures 4E and S8). As NUTF2 is responsible for recycling RANGDP back to the nucleus and RCC1 for exchanging the GDP to GTP, these data confirm that the lack of RANGDP or RANGTP in the nucleus affect nuclear transport with IRF3 being less affected than NF‐κB p65. Nevertheless, the silencing of RAN components NUTF2 and RCC1 decreasing IFNB1 production without affecting cell fitness (Figure S8) further corroborate that this process is critical for ensuring proper nucleocytoplasmic transport required for antiviral response. Finally, multiple Nups had a similar silencing phenotype with the reduced nuclear translocation of IRF3 and NF‐κB p65 at early time of SeV infection (Figure 5). The silencing of cytoplasmic FG‐Nups (RANBP2 and NUP214) and of outer‐ring Nups (NUP107‐160 complex) regulating the diameter of NPCs58 further correlated with a decrease of IFNB1 production (Figures 5A,B, S9 and S10). The linker Nups, which are extremely important for the proper assembly of the NPC and recruitment of NUP62 for transport competency, also contribute to IRF3/NF‐κB p65 nuclear transport (Figures 5C and S11). Indeed, NUP93 and NUP88 knockdown decrease the translocation of both TFs and IFNB1 production as previously reported.37, 59 At last, central FG‐Nups NUP54 and NUPL1 (encoding NUP58 and NUP45) also significantly reduce IFNB1 production, in contrast to the weak phenotype of NUP35 (Figures 5D and S12).
Very importantly, our data revealed a unique phenotype of IMPβ1 knockdown by the complete inhibition of IFIT1 induction at early time point post‐infection, correlating a rapid and drastic increased of SeV protein levels (Figures 6 and S13). Mechanistically, inhibition of the nuclear translocation of both TFs explains the strong reduction of antiviral response in IMPβ1‐depleted cells. Interestingly, their nuclear localization are inhibited at early time points but return to normal levels despite the silencing of IMPβ1 (Figure 7A), demonstrating that the transient reduction of IRF3 and NF‐κB p65 in the nucleus is sufficient to delay IFNB1 response to foster viral replication and cell apoptosis (Figure 7B). Remarkably, HCV NS3/4A protein interaction with IMPβ1 can counteract IFNB1 production by disrupting IRF3 and NF‐κB p65 nuclear transport upon induction of a cellular antiviral state. We previously reported that the silencing of IMPβ1 phenocopied HCV infection in preventing STAT1 from accumulating in the nucleus, thus providing strong evidence that the interaction between NS3/4A and IMPβ1 mediates the blocking of STAT1 nuclear accumulation to promote HCV replication.1 We now provide evidence that IMPβ1 targeting by NS3/4A can hinder nuclear translocation of IRF3 and NF‐κB p65. We demonstrated a cleavage of IMPβ1 in cells expressing NS3/4A protein and inhibition of this cleavage by treatment with BILN2061 PI. An amino acid sequence within IMPβ1 C‐terminus was found to be concordant with the cleavage consensus of NS3/4A protease, and the resulting sizes of predicted fragments agreed with the molecular weights of bands observed in western blot analysis (Figure 7D). More interestingly, the cleavage at this putative site (cysteine 817) occurs within HEAT repeat 18, which is required for interaction with adaptor proteins of the IMP‐α family through an IMP‐β binding (IBB) domain.31, 60 This could therefore rationalize the NS3/4A‐dependent prevention of IRF3/NF‐κB p65 as well as STAT1 nuclear translocation.1, 49 By using MAVS KO cells reconstituted with a MAVSC508R variant to prevent interference of NS3/4A with early MAVS signaling, we confirm the NS3/4A‐mediated cleavage of IMPβ1 as a novel HCV strategy to evade IFNB1 production (Figure 8). Indeed, expression of IMPβ1CR completely restores SeV‐mediated IFNB1 production, similar to treatment with BILN 2061 PI, correlating the nuclear translocation of IRF3 and the disappearance of IMPβ1 cleavage. Interestingly, the truncated IMPβ1 protein still interact with NS3/4A protein (Figure 7C), which may promote viral replication by its relocalization to the membranous webs. Future studies are required to validate the phenotype of IRF3/NF‐κB p65 localization seen in NS3/4A‐expressing cells in the context of HCV infection, and the contribution of the cleaved N‐terminal IMPβ1 fragment (aa1‐817) at Nups‐containing cytoplasmic compartments to promote viral RNA replication. Nevertheless, such viral strategy for evading IRF3/NF‐κB signaling of IFNB1 production while also disrupting STAT1‐mediated IFN signaling might be more common than previously believed as predicted for several viruses: SARS‐CoV ORF6 targets IMPβ1 to block STAT1 nuclear import25; EMCV Leader protein binds RAN and completely disrupts nucleocytoplasmic transport8; FMDV 3C protease induces IMPα5 degradation to block STAT1/2 nuclear import61; Nipah virus W protein interacts with IMPα3 and IMPα4 to inhibit the activation of the IRF3‐responsive promoter17; and Ebola virus VP24 protein interacts with IMPα6, blocking STAT1 nuclear import and inhibiting ISG production.18, 19 In this context, our work does not only allow insight into this complex nucleocytoplasmic transport machinery by elucidating components involved in the nuclear translocation of IRF3 and NF‐κB but also identifies host proteins targeted by multiple viruses to evade immune response as potential therapeutic targets to treat a broad range of viral infections.
In summary, this study led to the identification of cellular interaction partners of HCV that are hijacked to evade innate immune response and are associated to nucleocytoplasmic transport pathways. Using a microscopy‐based RNAi screen, we identified 33 proteins involved with the nuclear transport of IRF3 and NF‐κB p65 as cargo and induction of IFNB1 upon virus infection. More specifically, we showed that IMPβ1 and related TNPO1, EXP1, EXP2 and RAN, elucidated as HCV NS3/4A interactors, mechanistically control the nuclear translocation of IRF3 and NF‐κB. Furthermore, NS3/4A is able to cleave IMPβ1, restricting IRF3 and NF‐κB p65 from being transported to the nucleus, in a novel viral strategy to abolish IFNB1 production. Overall, the data support an innate evasion “hot spot” that underlines the importance and redundancy of nucleocytoplasmic trafficking proteins for optimal antiviral response. Thus, they are a valuable stepping stone in understanding the dynamics of the early antiviral response with the goal of validating therapeutic targets for a broad‐spectrum of viral infection.
4. MATERIAL AND METHODS
4.1. Cell culture
HEK293T cell lines were cultured in Dulbecco's Modified Eagle's Medium (DMEM, Wisent). A549 (human lung adenocarcinoma epithelial) cell lines were cultured in Ham's F‐12 medium (Invitrogen). Both media were supplemented with 10% fetal bovine serum, 100 U/mL penicillin, 100 µg/mL streptomycin and 2 mM glutamine (all from Wisent) and 1% nonessential amino acids (Invitrogen) at 37°C in an atmosphere of 5% CO2. Cell populations of HEK293T and A549 stably harboring the pIFNB1‐LUC and of HEK293T stably harboring the pEF1α‐LUC used in the screens were produced after selection with 200 µg/mL of hygromycin B (Wisent). Transfections were performed with linear 25 kDa polyethylenimine (PEI) (Polysciences, Inc) at 3 µg PEI to 1 µg DNA ratio.
4.2. Expression vectors
IMPβ1 (KPNB1) and MAVS C508R cDNAs were purchased from DNASU and Addgene, respectively. Following polymerase chain reaction (PCR)‐amplification, PCR product was cloned using Pfl23II/NotI enzymes into pcDNA3.1_FLAG‐MCS(MB) expression vector.38 3×FLAG‐NS3/4A, FLAG‐eYFP and pIFNB1‐LUC have been described before.1 IMPβ1 mutants were generated via site‐directed mutagenesis within the expression vectors using the Q5 kit using the Forward primer GGATCACACAaATGGAGTAGTAGCTaGTGgTGCTGGACTAATAGGGG and the Reverse primer CCCCTATTAGTCCAGCACcACtAGCTACTACTCCATt TGTGTGATCC (NEB). All constructs were verified using Sanger sequencing at the genomics platform at the Institute of Research in Immunology and Cancer (Montreal, Québec, Canada).
4.3. Lentiviral shRNA library production
From MISSION TRC lentiviral library (Sigma‐Aldrich), 132 MS hits were selected and shRNA were produced as follows: 5 different shRNA‐expressing lentiviruses per gene were produced individually in HEK293T cells (2×10⁴) that are plated 1 day prior to transfection. Transfections were performed using a Biomek FX (Beckman Coulter) enclosed in a class II cabinet according to MISSION Lentiviral Packaging Mix protocol (SHP001). Viruses were collected at 24 and 48 hours post‐transfection and were pooled prior to freezing. A non‐target sequence (NT) shRNA‐expressing control lentivirus and 4% of random samples of each plate were used to measure lentiviral titers for quality control purposes. Titers were determined by limiting dilution assays using HeLa cells. Briefly, samples were diluted in complete DMEM (1:400 or 1:10 000) and added to HeLa cells. Media was changed at day 3 and 5 with complete DMEM containing 1 µg/mL puromycin (Wisent). After 4 days of selection, cells were stained with 1.25% crystal violet and plaque‐forming units (PFU) were counted to determine viral titer.
4.4. Large‐scale shRNA production
The 293T cells were transfected with pRSV‐REV, pMDLg/pRRE, pMD2‐VSVg and various shRNA‐expressing pLKO.1‐puro constructs (Sigma‐Aldrich) using linear 25 kDa PEI (Polysciences, Inc.) at 3 µg PEI to 1 µg DNA ratio as previously described.37 After 48 hours of transfection, cell media was collected, filtered (0.45 µm filter), and aliquoted. MOI was determined using limiting dilution assays as described in previous section.
4.5. Firefly luminescence assay
For screening, cells were seeded in white 96‐well plates at a density of 5000 HEK293T pIFNB1_LUC, 5000 A549 pIFNB1_LUC and 1250 HEK293T pEF1α‐LUC in 100 μL of complete phenol‐red free DMEM containing 4 µg/mL polybrene. Infection with lentivirus encoding shRNA were carried out immediately after cell seeding at a MOI of 10 and incubated for 3 days at 37°C in an atmosphere of 5% CO2. Cells were infected with 100 HAU/mL of SeV (Cantell Strain, Charles River Labs) for 6 hours for A549 and 16 hours for HEK293T cells before cell lysis and firefly luminescence reading in a 100 mM Tris acetate, 20 mM Mg acetate, 2 mM EGTA, 3.6 mM ATP, 1% Brij 58, 0.7% β‐mercaptoethanol and 45 µg/mL luciferine pH 7.9 buffer. All the infections were performed in an enclosed class II cabinet.
4.6. Operetta microscopy
A549 cells were plated on clear 96‐well plates at a density of 1000 cells in 100 μL complete Ham's F‐12 medium containing 4 µg/mL polybrene. Infection with lentivirus encoding shRNA (5 individual shRNAs per gene) were carried out immediately after cell seeding at a MOI of 10 and incubated for 4 days at 37°C in an atmosphere of 5% CO2. As control the MISSION shRNA NT clone (Sigma SHC002) was included in each 96‐well plate. Cells were infected with 100 HAU/mL of SeV (Cantell Strain, Charles River Labs) for 0, 1, 3, 5, 8 or 10 hours before being fixed with 4% paraformaldehyde‐containing PBS for 20 minutes at room temperature and then permeabilized in 0.2% Triton X‐100/PBS for 15 minutes. Blocking was made in PBS with 10% normal goat serum, 5% bovine serum albumin (BSA) and 0.02% sodium azide for 45 minutes at room temperature. Following 3 rapid washes, cells were labeled with mouse anti‐IRF3 (SL‐12; Santa Cruz Biotechnology) or rabbit anti‐p65 (C‐20; Santa Cruz Biotechnology) primary antibodies diluted in 5% BSA/0.02% sodium azide/PBS for 2 hours. Wells were washed 3 times in PBS and then labeled with anti‐mouse AlexaFluor 488 or anti‐rabbit AlexaFluor 488 secondary antibodies (Invitrogen) diluted in 5% BSA/0.02% sodium azide/PBS for 1 hour. Cells were extensively washed and incubated with Hoechst dye (Invitrogen) at a final concentration of 1 µg/mL in PBS. Images of cells were captured in 9 predetermined fields for each well (Operetta High Content Screening Microscope; Perkin Elmer) and images were processed using Harmony (Perkin Elmer). Cut‐off for nuclear staining for IRF3 and p65 were between 230 to 300 and 515 to 735, respectively. Percentage of cells with IRF3 or p65 nuclear staining was calculated by dividing the number of nuclei where nuclear fluorescence was higher than the cut‐off for IRF3 or p65 staining by the total number of nuclei stained by Hoechst for the 9 fields. The effect of a shRNA on cell proliferation and survival was evaluated by dividing the total number of nuclei in the 9 fields of the 5 time points and dividing it by the total number of nuclei in the 9 fields of the 6 time points of the shRNA NT control wells included in every 96‐well plate.
4.7. Western blot analysis
Cells were washed twice with ice‐cold phosphate‐buffered saline (PBS; Wisent), harvested and lysed in 10 mM Tris‐HCl, 100 mM NaCl, 0.5% Triton X‐100, pH 7.6 with ethylenediaminetetraacetic acid (EDTA)‐free Protease Inhibitor Cocktail (Roche). Cell lysates were clarified by centrifugation at 13 000g for 15 minutes at 4°C and subjected to sodium dodecyl sulfate‐polyacrylamide gel (SDS‐PAGE). Western blot analysis was performed using the following antibodies: ACTIN was purchased from Chemicon International (Billerica, MAB1501R); FLAG was purchased from Sigma (St. Louis, F3165); EXP2/CSE1L, IRF3 P‐386, IMPβ1/KPNB1 and TNPO1 were purchased from Abcam (Toronto, ab96755, ab76493, ab2811 and ab10303); H1, p65, RAN and EXP1/XPO1 were purchased from Santa Cruz Biotechnology (sc‐8030, sc‐8008, sc‐58467 and sc‐74454); IRF3 was purchased from Phoenix Airmid Biomedical (18781); IFIT1/ISG56 was purchased from Novus Biologicals (NBP1‐32329); NFKBIA P‐32 was purchased from Cell Signaling Technology, Inc., (2859). The antibody for PARP1 and SeV was a kind gift from MJ. Hébert and M. Servant, respectively. Horseradish peroxidase (HRP)‐conjugated secondary antibodies were from Bio‐Rad. The chemiluminescence reaction was performed using the Western Lighting Chemiluminescence Reagent Plus (PerkinElmer).
4.8. Co‐immunoprecipitation
For co‐immunoprecipitation (co‐IP), FLAG‐tagged protein expressing cells were harvested and lysed as described above. Resulting cell extracts were adjusted to 1 mg/mL and subjected to IP as follows: pre‐clearing of the lysates was done by incubating lysates with 40 μL of 50:50 slurry of immunoglobulin G‐Sepharose (GE Healthcare) prepared in the lysis buffer with IgG beads for 1 hour. Pre‐cleared lysate were immunoprecipitated by adding 20 μL of M2 anti‐FLAG affinity gel (Sigma‐Aldrich) prepared in TBS buffer (50 mM Tris‐HCl, 150 mM NaCl, pH 7.4) overnight as described by the manufacturer. Immunoprecipitates were washed 5 times in lysis buffer. Elution was performed using 250 ng/μL purified FLAG peptide for 45 minutes at 4°C (Sigma‐Aldrich). Eluates were analyzed using western blotting.
4.9. Nuclear and cytoplasmic extraction
Nuclear and cytoplasmic extraction was performed on 4 000 000 A549 cells that were previously plated on 100 mm plates, infected with lentivirus encoding shRNA NT or IMPβ1 (TRCN0000123189) at a MOI of 10 for 3 days and infected with SeV for 0, 1, 3, 5, 8 and 10 hours prior to harvesting. Nuclear and cytoplasmic fractions were prepared with NE‐PER Nuclear and Cytoplasmic Extraction Reagents (Thermo Scientific) according to the manufacturer's protocol.
4.10. Functional enrichment analysis
DAVID database was used for functional annotation.62, 63 DAVID functional annotation chart tool was used to perform GO biological process and InterPro protein domain analysis. Terms with a P‐value lesser than 5 × 10⁻² were considered as significantly overrepresented.
Supporting information
Editorial Process
Figure S1. Host proteins specifically associated with HCV proteins. Heat map visualization of the 132 host protein quantities significantly enriched in 1 of the 6 immunoprecipitations with HCV proteins 3XFLAG‐Core, ‐NS2, ‐NS3/4A, ‐NS4B, ‐NS5A and ‐NS5B, modified from Germain et al1. Proportions of presence for each of the 6 experimental conditions are represented for host proteins hits (Σ six conditions = 1 for each host protein). The proteins are ordered from greatest to lowest proportion in their respective viral protein enrichment groups as determined by LC‐MS/MS. The darker color correlates with the absence of the host protein in the condition, and brighter green indicates a high prevalence of the host protein in the condition (log2 scale).
Figure S2. Venn diagram of HCV‐host interactors modulating viral replication and IFNB1 production. A, Venn diagram representation of the effect of silencing 53 host interactors on IFNB1 production in comparison to their effect on HCV replication. Only 12 of the 53 interactors met the stringent criteria of Germain et al1 for having a significant inhibitory effect on HCV replication, while the remainder interactors only affected the IFNB1 production upon SeV infection of HEK 293 or A549 cells.
Figure S3. Effect of silencing IMP‐α adaptors on IRF3 and p65 nuclear translocation. The effects of IMP‐α silencing are determined with the relative percentage of cells containing IRF3 and p65 in the nucleus after normalization of the control shRNA NT to 0 for all time points. Results are presented as individual shRNA for the 6 different IMP‐α: IMPα1/KPNA2, IMPα3/KPNA4, IMPα4/KPNA3, IMPα5/KPNA1, IMPα6/ KPNA5, IMPα7/KPNA6. The effects of each shRNA‐mediated knockdown on SeV‐induced IFNB1 production are measured in A549 cells stably expressing the firefly luciferase under the control of the IFNB1 promoter, while the effects on cell proliferation and survival are evaluated using images from the microscopy screen by dividing the total number of nuclei for a given shRNA and dividing it by the total number of nuclei for the shRNA NT control.
Figure S4. Effect of silencing importins on IRF3 and p65 nuclear translocation, pIFNB1 induction and cellular fitness. The effects of IPO4, IPO7 and IPO8 silencing are determined with the relative percentage of nuclei with IRF3 and p65 staining, IFNB1 promoter activity and cellular fitness, as described in Figure S3.
Figure S5. Effect of silencing transportins on IRF3 and p65 nuclear translocation, pIFNB1 induction and cellular fitness. The effects of TNPO1, TNPO2 and TNPO3/IPO12 silencing are determined with the relative percentage of nuclei with IRF3 and p65 staining, IFNB1 promoter activity and cellular fitness, as described in Figure S3.
Figure S6. Effect of silencing proteins involved in protein export on IRF3 and p65 nuclear translocation, pIFNB1 induction and cellular fitness. The effects of EXP/XPO1, EXP2/CSE1L and RANBP3 silencing are determined with the relative percentage of nuclei with IRF3 and p65 staining, IFNB1 promoter activity and cellular fitness, as described in Figure S3.
Figure S7. Effect of silencing proteins involved in mRNA export on IRF3 and p65 nuclear translocation, pIFNB1 induction and cellular fitness. The effects of NXT1, NXT2, NXF1 and NXF2 silencing are determined with the relative percentage of nuclei with IRF3 and p65 staining, IFNB1 promoter activity and cellular fitness, as described in Figure S3.
Figure S8. Effect of silencing proteins of the RAN system on IRF3 and p65 nuclear translocation, pIFNB1 induction and cellular fitness. The effects of RAN, NUTF2 and RCC1 silencing are determined with the relative percentage of nuclei with IRF3 and p65 staining, IFNB1 promoter activity and cellular fitness, as described in Figure S3.
Figure S9. Effect of silencing cytoplasmic FG‐Nups and filaments on IRF3 and p65 nuclear translocation, pIFNB1 induction and cellular fitness. The effects of RANBP2, NUP214 and NUPL2 silencing are determined with the relative percentage of nuclei with IRF3 and p65 staining, IFNB1 promoter activity and cellular fitness, as described in Figure S3.
Figure S10. Effect of silencing outer‐ring Nups on IRF3 and p65 nuclear translocation, pIFNB1 induction and cellular fitness. The effects of NUP43, NUP107 and NUP160 silencing are determined with the relative percentage of nuclei with IRF3 and p65 staining, IFNB1 promoter activity and cellular fitness, as described in Figure S3.
Figure S11. Effect of silencing linker Nups on IRF3 and p65 nuclear translocation, pIFNB1 induction and cellular fitness. The effects of NUP93 and NUP88 silencing are determined with the relative percentage of nuclei with IRF3 and p65 staining, IFNB1 promoter activity and cellular fitness, as described in Figure S3.
Figure S12. Effect of silencing central FG‐Nups on IRF3 and p65 nuclear translocation, pIFNB1 induction and cellular fitness. The effects of NUP54, NUP35 and NUPL1 silencing are determined with the relative percentage of nuclei with IRF3 and p65 staining, IFNB1 promoter activity and cellular fitness, as described in Figure S3.
Figure S13. Effect of silencing expression of NS3/4A‐interacting nuclear transport factors on SeV infection and IFIT1 induction. Immunoblot analysis of HEK 293T cells infected with SeV for 8 or 24 hours and transduced with lentivirus‐encoding shRNA for 3 days to silence expression of EXP1/XPO1, EXP2/CSE1L, RAN, IMPβ1/KPNB1 and TNPO1/IMPβ2. shRNA NT is used as a control.
Table S1. Absolute and relative quantities of host protein interactions with each of the 6 HCV proteins. This table contains the results of the LC‐MS/MS analysis with the absolute quantities, as well as the relative quantities of host proteins determined for the 6 viral protein conditions that are visually represented in Figure S1. This data is modified from Germain et al1.
Table S2. Effect of HCV‐host interactors silencing on IFNB1 induction. This table contains the results of the gene silencing screen for 132 host interactors of HCV on SeV‐mediated IFNB1 production. The average of 2 separate experiments is shown for HEK 293T and A549 cells. The non‐immune EF1α promoter‐driven luciferase activities are used to prioritize genes selectively modulating IFNB1 production and to identify shRNAs affecting basal transcription as well as for a measurement of cellular fitness.
Table S3. Effect of silencing nuclear transport factors on IRF3 and p65 nuclear translocation. This table contains the results of the gene silencing screen for 60 Nucleoporins, nucleocytoplasmic transporters or components of the RAN system on the nuclear translocation of IRF3 and NF‐κB p65 during a 10‐hour SeV infection time course. Non‐target (NT) values are in absolute percentages, while all other values are presented in relative percentage.
Table S4. Effect of silencing nuclear transport factors on IFNB1 production and cellular fitness. This table contains the results of the gene silencing screen for 60 Nucleoporins, nucleocytoplasmic transporters or components of the RAN system on the IFNB1 promoter‐driven luciferase activity and cellular fitness. Results are represented in percentage of promoter inhibition from 2 separate experiments. Cellular fitness results are represented in percentage of cell survival for each time point of SeV infection.
ACKNOWLEDGEMENTS
We thank K. Audette and J. Duchaine of the IRIC's screening facility. This work was supported by grants from the Canadian Institutes for Health Research (CIHR‐MOP‐115010 and CIHR‐CI6‐103135), the Novartis/Canadian Liver Foundation Hepatology Research Chair to D.L. and FRQ‐S PhD scholarship to N.T.
AUTHORS CONTRIBUTIONS
B.G., M.B. and D.L. were involved in conceptualization. B.G. was involved in methodology. Investigation was done by B.G., A.Y.P. MB and N.T. Writing—Original Draft was carried out by B.G., M.B., N.T. and D.L. Writing—Review & Editing was carried out by N.T. and D.L.; B.G. and N.T. were involved in Visualization. Supervision, administration and funding by D.L.
The Editorial Process File is available in the online version of this article.
Gagné B, Tremblay N, Park AY, Baril M and Lamarre D. Importin β1 targeting by hepatitis C virus NS3/4A protein restricts IRF3 and NF‐κB signaling of IFNB1 antiviral response. Traffic. 2017;18:362–377. 10.1111/tra.12480
Funding information Canadian Institutes for Health Research, Grant/Award number: CIHR‐MOP‐115010 and CIHR‐CI6‐103135; Novartis/Canadian Liver Foundation Hepatology Research Chair; FRQ‐S PhD scholarship.
REFERENCES
- 1. Germain MA, Chatel‐Chaix L, Gagné B et al. Elucidating novel hepatitis C virus‐host interactions using combined mass spectrometry and functional genomics approaches. Mol Cell Proteomics. 2014;13:184‐203. [DOI] [PMC free article] [PubMed] [Google Scholar]
- 2. Brass AL, Dykxhoorn DM, Benita Y, et al. Identification of host proteins required for HIV infection through a functional genomic screen. Science. 2008;319:921‐926. [DOI] [PubMed] [Google Scholar]
- 3. Karlas A, Machuy N, Shin Y, et al. Genome‐wide RNAi screen identifies human host factors crucial for influenza virus replication. Nature. 2010;463:818‐822. [DOI] [PubMed] [Google Scholar]
- 4. Konig R, Zhou Y, Elleder D, et al. Global analysis of host‐pathogen interactions that regulate early‐stage HIV‐1 replication. Cell. 2008;135:49‐60. [DOI] [PMC free article] [PubMed] [Google Scholar]
- 5. Mehle A, Doudna JA. A host of factors regulating influenza virus replication. Viruses. 2010;2:566‐573. [DOI] [PMC free article] [PubMed] [Google Scholar]
- 6. Levin A, Neufeldt CJ, Pang D, et al. Functional characterization of nuclear localization and export signals in hepatitis C virus proteins and their role in the membranous web. PLoS One. 2014;9:e114629. [DOI] [PMC free article] [PubMed] [Google Scholar]
- 7. Neufeldt CJ, Joyce MA, Levin A, et al. Hepatitis C virus‐induced cytoplasmic organelles use the nuclear transport machinery to establish an environment conducive to virus replication. PLoS Pathog. 2013;9:e1003744. [DOI] [PMC free article] [PubMed] [Google Scholar]
- 8. Porter FW, Bochkov YA, Albee AJ, Wiese C, Palmenberg AC. A picornavirus protein interacts with Ran‐GTPase and disrupts nucleocytoplasmic transport. Proc Natl Acad Sci USA. 2006;103:12417‐12422. [DOI] [PMC free article] [PubMed] [Google Scholar]
- 9. Di Nunzio F, Danckaert A, Fricke T, et al. Human nucleoporins promote HIV‐1 docking at the nuclear pore, nuclear import and integration. PLoS One. 2012;7:e46037. [DOI] [PMC free article] [PubMed] [Google Scholar]
- 10. Levin A, Hayouka Z, Friedler A, Loyter A. Transportin 3 and importin alpha are required for effective nuclear import of HIV‐1 integrase in virus‐infected cells. Nucleus. 2010;1:422‐431. [DOI] [PMC free article] [PubMed] [Google Scholar]
- 11. Cerutti A, Maillard P, Minisini R, et al. Identification of a functional, CRM‐1‐dependent nuclear export signal in hepatitis C virus core protein. PLoS One. 2011;6:e25854. [DOI] [PMC free article] [PubMed] [Google Scholar]
- 12. Suzuki R, Sakamoto S, Tsutsumi T, et al. Molecular determinants for subcellular localization of hepatitis C virus core protein. J Virol. 2005;79:1271‐1281. [DOI] [PMC free article] [PubMed] [Google Scholar]
- 13. Neufeldt CJ, Joyce MA, Van Buuren N, et al. The hepatitis C virus‐induced membranous web and associated nuclear transport machinery limit access of pattern recognition receptors to viral replication sites. PLoS Pathog. 2016;12:e1005428. [DOI] [PMC free article] [PubMed] [Google Scholar]
- 14. Audsley MD, Jans DA, Moseley GW. Roles of nuclear trafficking in infection by cytoplasmic negative‐strand RNA viruses: paramyxoviruses and beyond. J Gen Virol. 2016;97:2463‐2481. [DOI] [PubMed] [Google Scholar]
- 15. Satterly N, Tsai PL, van Deursen J, et al. Influenza virus targets the mRNA export machinery and the nuclear pore complex. Proc Natl Acad Sci USA. 2007;104:1853‐1858. [DOI] [PMC free article] [PubMed] [Google Scholar]
- 16. Chutiwitoonchai N, Aida Y. NXT1, a novel influenza A NP binding protein, promotes the nuclear export of NP via a CRM1‐dependent pathway. Viruses. 2016;8(8). [DOI] [PMC free article] [PubMed] [Google Scholar]
- 17. Shaw ML, Cardenas WB, Zamarin D, Palese P, Basler CF. Nuclear localization of the Nipah virus W protein allows for inhibition of both virus‐ and toll‐like receptor 3‐triggered signaling pathways. J Virol. 2005;79:6078‐6088. [DOI] [PMC free article] [PubMed] [Google Scholar]
- 18. Reid SP, Valmas C, Martinez O, Sanchez FM, Basler CF. Ebola virus VP24 proteins inhibit the interaction of NPI‐1 subfamily karyopherin alpha proteins with activated STAT1. J Virol. 2007;81:13469‐13477. [DOI] [PMC free article] [PubMed] [Google Scholar]
- 19. Xu W, Edwards MR, Borek DM, et al. Ebola virus VP24 targets a unique NLS binding site on karyopherin alpha 5 to selectively compete with nuclear import of phosphorylated STAT1. Cell Host Microbe. 2014;16:187‐200. [DOI] [PMC free article] [PubMed] [Google Scholar]
- 20. Yarbrough ML, Mata MA, Sakthivel R, Fontoura BM. Viral subversion of nucleocytoplasmic trafficking. Traffic. 2014;15:127‐140. [DOI] [PMC free article] [PubMed] [Google Scholar]
- 21. Park N, Skern T, Gustin KE. Specific cleavage of the nuclear pore complex protein Nup62 by a viral protease. J Biol Chem. 2010;285:28796‐28805. [DOI] [PMC free article] [PubMed] [Google Scholar]
- 22. Park N, Katikaneni P, Skern T, Gustin KE. Differential targeting of nuclear pore complex proteins in poliovirus‐infected cells. J Virol. 2008;82:1647‐1655. [DOI] [PMC free article] [PubMed] [Google Scholar]
- 23. Castello A, Izquierdo JM, Welnowska E, Carrasco L. RNA nuclear export is blocked by poliovirus 2A protease and is concomitant with nucleoporin cleavage. J Cell Sci. 2009;122:3799‐3809. [DOI] [PubMed] [Google Scholar]
- 24. Wang R, Nan Y, Yu Y, Zhang YJ. Porcine reproductive and respiratory syndrome virus Nsp1beta inhibits interferon‐activated JAK/STAT signal transduction by inducing karyopherin‐alpha1 degradation. J Virol. 2013;87:5219‐5228. [DOI] [PMC free article] [PubMed] [Google Scholar]
- 25. Frieman M, Yount B, Heise M, Kopecky‐Bromberg SA, Palese P, Baric RS. Severe acute respiratory syndrome coronavirus ORF6 antagonizes STAT1 function by sequestering nuclear import factors on the rough endoplasmic reticulum/Golgi membrane. J Virol. 2007;81:9812‐9824. [DOI] [PMC free article] [PubMed] [Google Scholar]
- 26. Li C, Goryaynov A, Yang W. The selective permeability barrier in the nuclear pore complex. Nucleus. 2016;7:430‐446. [DOI] [PMC free article] [PubMed] [Google Scholar]
- 27. Cautain B, Hill R, de Pedro N, Link W. Components and regulation of nuclear transport processes. FEBS J. 2015;282:445‐462. [DOI] [PMC free article] [PubMed] [Google Scholar]
- 28. Grossman E, Medalia O, Zwerger M. Functional architecture of the nuclear pore complex. Annu Rev Biophys. 2012;41:557‐584. [DOI] [PubMed] [Google Scholar]
- 29. Hoelz A, Debler EW, Blobel G. The structure of the nuclear pore complex. Annu Rev Biochem. 2011;80:613‐643. [DOI] [PubMed] [Google Scholar]
- 30. Kimura M, Imamoto N. Biological significance of the importin‐beta family‐dependent nucleocytoplasmic transport pathways. Traffic. 2014;15:727‐748. [DOI] [PubMed] [Google Scholar]
- 31. Cingolani G, Petosa C, Weis K, Muller CW. Structure of importin‐beta bound to the IBB domain of importin‐alpha. Nature. 1999;399:221‐229. [DOI] [PubMed] [Google Scholar]
- 32. Chook YM, Blobel G. Structure of the nuclear transport complex karyopherin‐beta2‐Ran x GppNHp. Nature. 1999;399:230‐237. [DOI] [PubMed] [Google Scholar]
- 33. Vetter IR, Nowak C, Nishimoto T, Kuhlmann J, Wittinghofer A. Structure of a Ran‐binding domain complexed with Ran bound to a GTP analogue: implications for nuclear transport. Nature. 1999;398:39‐46. [DOI] [PubMed] [Google Scholar]
- 34. Bayliss R, Littlewood T, Stewart M. Structural basis for the interaction between FxFG nucleoporin repeats and importin‐beta in nuclear trafficking. Cell. 2000;102:99‐108. [DOI] [PubMed] [Google Scholar]
- 35. Otsuka S, Iwasaka S, Yoneda Y, Takeyasu K, Yoshimura SH. Individual binding pockets of importin‐beta for FG‐nucleoporins have different binding properties and different sensitivities to RanGTP. Proc Natl Acad Sci USA. 2008;105:16101‐16106. [DOI] [PMC free article] [PubMed] [Google Scholar]
- 36. Rexach M, Blobel G. Protein import into nuclei: association and dissociation reactions involving transport substrate, transport factors, and nucleoporins. Cell. 1995;83:683‐692. [DOI] [PubMed] [Google Scholar]
- 37. Baril M, Es‐Saad S, Chatel‐Chaix L, et al. Genome‐wide RNAi screen reveals a new role of a WNT/CTNNB1 signaling pathway as negative regulator of virus‐induced innate immune responses. PLoS Pathog. 2013;9:e1003416. [DOI] [PMC free article] [PubMed] [Google Scholar]
- 38. Baril M, Racine ME, Penin F, Lamarre D. MAVS dimer is a crucial signaling component of innate immunity and the target of hepatitis C virus NS3/4A protease. J Virol. 2009;83:1299‐1311. [DOI] [PMC free article] [PubMed] [Google Scholar]
- 39. Li K, Foy E, Ferreon JC, et al. Immune evasion by hepatitis C virus NS3/4A protease‐mediated cleavage of the Toll‐like receptor 3 adaptor protein TRIF. Proc Natl Acad Sci USA. 2005;102:2992‐2997. [DOI] [PMC free article] [PubMed] [Google Scholar]
- 40. Meylan E, Curran J, Hofmann K, et al. Cardif is an adaptor protein in the RIG‐I antiviral pathway and is targeted by hepatitis C virus. Nature. 2005;437:1167‐1172. [DOI] [PubMed] [Google Scholar]
- 41. Lin R, Heylbroeck C, Pitha PM, Hiscott J. Virus‐dependent phosphorylation of the IRF‐3 transcription factor regulates nuclear translocation, transactivation potential, and proteasome‐mediated degradation. Mol Cell Biol. 1998;18:2986‐2996. [DOI] [PMC free article] [PubMed] [Google Scholar]
- 42. Terry LJ, Shows EB, Wente SR. Crossing the nuclear envelope: hierarchical regulation of nucleocytoplasmic transport. Science. 2007;318:1412‐1416. [DOI] [PubMed] [Google Scholar]
- 43. Fagerlund R, Kinnunen L, Kohler M, Julkunen I, Melen K. NF‐{kappa}B is transported into the nucleus by importin {alpha}3 and importin {alpha}4. J Biol Chem. 2005;280:15942‐15951. [DOI] [PubMed] [Google Scholar]
- 44. Fagerlund R, Melen K, Cao X, Julkunen I. NF‐kappaB p52, RelB and c‐Rel are transported into the nucleus via a subset of importin alpha molecules. Cell Signal. 2008;20:1442‐1451. [DOI] [PubMed] [Google Scholar]
- 45. Kumar KP, McBride KM, Weaver BK, Dingwall C, Reich NC. Regulated nuclear‐cytoplasmic localization of interferon regulatory factor 3, a subunit of double‐stranded RNA‐activated factor 1. Mol Cell Biol. 2000;20:4159‐4168. [DOI] [PMC free article] [PubMed] [Google Scholar]
- 46. Liang P, Zhang H, Wang G, et al. KPNB1, XPO7 and IPO8 mediate the translocation ofNF‐kappaB/p65 into the nucleus. Traffic. 2013;14:1132‐1143. [DOI] [PubMed] [Google Scholar]
- 47. Waldmann I, Spillner C, Kehlenbach RH. The nucleoporin‐like protein NLP1 (hCG1) promotes CRM1‐dependent nuclear protein export. J Cell Sci. 2012;125:144‐154. [DOI] [PubMed] [Google Scholar]
- 48. Lamarre D, Anderson PC, Bailey M, et al. An NS3 protease inhibitor with antiviral effects in humans infected with hepatitis C virus. Nature. 2003;426:186‐189. [DOI] [PubMed] [Google Scholar]
- 49. Sekimoto T, Imamoto N, Nakajima K, Hirano T, Yoneda Y. Extracellular signal‐dependent nuclear import of Stat1 is mediated by nuclear pore‐targeting complex formation with NPI‐1, but not Rch1. EMBO J. 1997;16:7067‐7077. [DOI] [PMC free article] [PubMed] [Google Scholar]
- 50. Li XD, Sun L, Seth RB, Pineda G, Chen ZJ. Hepatitis C virus protease NS3/4A cleaves mitochondrial antiviral signaling protein off the mitochondria to evade innate immunity. Proc Natl Acad Sci USA. 2005;102:17717‐17722. [DOI] [PMC free article] [PubMed] [Google Scholar]
- 51. Liang X, Potter J, Kumar S, et al. Rapid and highly efficient mammalian cell engineering via Cas9 protein transfection. J Biotechnol. 2015;208:44‐53. [DOI] [PubMed] [Google Scholar]
- 52. Lee BJ, Cansizoglu AE, Suel KE, Louis TH, Zhang Z, Chook YM. Rules for nuclear localization sequence recognition by karyopherin beta 2. Cell. 2006;126:543‐558. [DOI] [PMC free article] [PubMed] [Google Scholar]
- 53. Englmeier L, Fornerod M, Bischoff FR, Petosa C, Mattaj IW, Kutay U. RanBP3 influences interactions between CRM1 and its nuclear protein export substrates. EMBO Rep. 2001;2:926‐932. [DOI] [PMC free article] [PubMed] [Google Scholar]
- 54. Lindsay ME, Holaska JM, Welch K, Paschal BM, Macara IG. Ran‐binding protein 3 is a cofactor for Crm1‐mediated nuclear protein export. J Cell Biol. 2001;153:1391‐1402. [DOI] [PMC free article] [PubMed] [Google Scholar]
- 55. Birbach A, Gold P, Binder BR, Hofer E, de Martin R, Schmid JA. Signaling molecules of the NF‐kappa B pathway shuttle constitutively between cytoplasm and nucleus. J Biol Chem. 2002;277:10842‐10851. [DOI] [PubMed] [Google Scholar]
- 56. Tam WF, Lee LH, Davis L, Sen R. Cytoplasmic sequestration of rel proteins by IkappaBalpha requires CRM1‐dependent nuclear export. Mol Cell Biol. 2000;20:2269‐2284. [DOI] [PMC free article] [PubMed] [Google Scholar]
- 57. Cook A, Bono F, Jinek M, Conti E. Structural biology of nucleocytoplasmic transport. Annu Rev Biochem. 2007;76:647‐671. [DOI] [PubMed] [Google Scholar]
- 58. Bui KH, von Appen A, DiGuilio AL, et al. Integrated structural analysis of the human nuclear pore complex scaffold. Cell. 2013;155:1233‐1243. [DOI] [PubMed] [Google Scholar]
- 59. Takahashi N, van Kilsdonk JW, Ostendorf B, et al. Tumor marker nucleoporin 88 kDa regulates nucleocytoplasmic transport of NF‐kappaB. Biochem Biophys Res Commun. 2008;374:424‐430. [DOI] [PubMed] [Google Scholar]
- 60. Kutay U, Bischoff FR, Kostka S, Kraft R, Gorlich D. Export of importin alpha from the nucleus is mediated by a specific nuclear transport factor. Cell. 1997;90:1061‐1071. [DOI] [PubMed] [Google Scholar]
- 61. Du Y, Bi J, Liu J, et al. 3Cpro of foot‐and‐mouth disease virus antagonizes the interferon signaling pathway by blocking STAT1/STAT2 nuclear translocation. J Virol. 2014;88:4908‐4920. [DOI] [PMC free article] [PubMed] [Google Scholar]
- 62. Huang da W, Sherman BT, Lempicki RA. Systematic and integrative analysis of large gene lists using DAVID bioinformatics resources. Nat Protoc. 2009;4:44‐57. [DOI] [PubMed] [Google Scholar]
- 63. Huang da W, Sherman BT, Lempicki RA. Bioinformatics enrichment tools: paths toward the comprehensive functional analysis of large gene lists. Nucleic Acids Res. 2009;37:1‐13. [DOI] [PMC free article] [PubMed] [Google Scholar]
Associated Data
This section collects any data citations, data availability statements, or supplementary materials included in this article.
Supplementary Materials
Editorial Process
Figure S1. Host proteins specifically associated with HCV proteins. Heat map visualization of the 132 host protein quantities significantly enriched in 1 of the 6 immunoprecipitations with HCV proteins 3XFLAG‐Core, ‐NS2, ‐NS3/4A, ‐NS4B, ‐NS5A and ‐NS5B, modified from Germain et al1. Proportions of presence for each of the 6 experimental conditions are represented for host proteins hits (Σ six conditions = 1 for each host protein). The proteins are ordered from greatest to lowest proportion in their respective viral protein enrichment groups as determined by LC‐MS/MS. The darker color correlates with the absence of the host protein in the condition, and brighter green indicates a high prevalence of the host protein in the condition (log2 scale).
Figure S2. Venn diagram of HCV‐host interactors modulating viral replication and IFNB1 production. A, Venn diagram representation of the effect of silencing 53 host interactors on IFNB1 production in comparison to their effect on HCV replication. Only 12 of the 53 interactors met the stringent criteria of Germain et al1 for having a significant inhibitory effect on HCV replication, while the remainder interactors only affected the IFNB1 production upon SeV infection of HEK 293 or A549 cells.
Figure S3. Effect of silencing IMP‐α adaptors on IRF3 and p65 nuclear translocation. The effects of IMP‐α silencing are determined with the relative percentage of cells containing IRF3 and p65 in the nucleus after normalization of the control shRNA NT to 0 for all time points. Results are presented as individual shRNA for the 6 different IMP‐α: IMPα1/KPNA2, IMPα3/KPNA4, IMPα4/KPNA3, IMPα5/KPNA1, IMPα6/ KPNA5, IMPα7/KPNA6. The effects of each shRNA‐mediated knockdown on SeV‐induced IFNB1 production are measured in A549 cells stably expressing the firefly luciferase under the control of the IFNB1 promoter, while the effects on cell proliferation and survival are evaluated using images from the microscopy screen by dividing the total number of nuclei for a given shRNA and dividing it by the total number of nuclei for the shRNA NT control.
Figure S4. Effect of silencing importins on IRF3 and p65 nuclear translocation, pIFNB1 induction and cellular fitness. The effects of IPO4, IPO7 and IPO8 silencing are determined with the relative percentage of nuclei with IRF3 and p65 staining, IFNB1 promoter activity and cellular fitness, as described in Figure S3.
Figure S5. Effect of silencing transportins on IRF3 and p65 nuclear translocation, pIFNB1 induction and cellular fitness. The effects of TNPO1, TNPO2 and TNPO3/IPO12 silencing are determined with the relative percentage of nuclei with IRF3 and p65 staining, IFNB1 promoter activity and cellular fitness, as described in Figure S3.
Figure S6. Effect of silencing proteins involved in protein export on IRF3 and p65 nuclear translocation, pIFNB1 induction and cellular fitness. The effects of EXP/XPO1, EXP2/CSE1L and RANBP3 silencing are determined with the relative percentage of nuclei with IRF3 and p65 staining, IFNB1 promoter activity and cellular fitness, as described in Figure S3.
Figure S7. Effect of silencing proteins involved in mRNA export on IRF3 and p65 nuclear translocation, pIFNB1 induction and cellular fitness. The effects of NXT1, NXT2, NXF1 and NXF2 silencing are determined with the relative percentage of nuclei with IRF3 and p65 staining, IFNB1 promoter activity and cellular fitness, as described in Figure S3.
Figure S8. Effect of silencing proteins of the RAN system on IRF3 and p65 nuclear translocation, pIFNB1 induction and cellular fitness. The effects of RAN, NUTF2 and RCC1 silencing are determined with the relative percentage of nuclei with IRF3 and p65 staining, IFNB1 promoter activity and cellular fitness, as described in Figure S3.
Figure S9. Effect of silencing cytoplasmic FG‐Nups and filaments on IRF3 and p65 nuclear translocation, pIFNB1 induction and cellular fitness. The effects of RANBP2, NUP214 and NUPL2 silencing are determined with the relative percentage of nuclei with IRF3 and p65 staining, IFNB1 promoter activity and cellular fitness, as described in Figure S3.
Figure S10. Effect of silencing outer‐ring Nups on IRF3 and p65 nuclear translocation, pIFNB1 induction and cellular fitness. The effects of NUP43, NUP107 and NUP160 silencing are determined with the relative percentage of nuclei with IRF3 and p65 staining, IFNB1 promoter activity and cellular fitness, as described in Figure S3.
Figure S11. Effect of silencing linker Nups on IRF3 and p65 nuclear translocation, pIFNB1 induction and cellular fitness. The effects of NUP93 and NUP88 silencing are determined with the relative percentage of nuclei with IRF3 and p65 staining, IFNB1 promoter activity and cellular fitness, as described in Figure S3.
Figure S12. Effect of silencing central FG‐Nups on IRF3 and p65 nuclear translocation, pIFNB1 induction and cellular fitness. The effects of NUP54, NUP35 and NUPL1 silencing are determined with the relative percentage of nuclei with IRF3 and p65 staining, IFNB1 promoter activity and cellular fitness, as described in Figure S3.
Figure S13. Effect of silencing expression of NS3/4A‐interacting nuclear transport factors on SeV infection and IFIT1 induction. Immunoblot analysis of HEK 293T cells infected with SeV for 8 or 24 hours and transduced with lentivirus‐encoding shRNA for 3 days to silence expression of EXP1/XPO1, EXP2/CSE1L, RAN, IMPβ1/KPNB1 and TNPO1/IMPβ2. shRNA NT is used as a control.
Table S1. Absolute and relative quantities of host protein interactions with each of the 6 HCV proteins. This table contains the results of the LC‐MS/MS analysis with the absolute quantities, as well as the relative quantities of host proteins determined for the 6 viral protein conditions that are visually represented in Figure S1. This data is modified from Germain et al1.
Table S2. Effect of HCV‐host interactors silencing on IFNB1 induction. This table contains the results of the gene silencing screen for 132 host interactors of HCV on SeV‐mediated IFNB1 production. The average of 2 separate experiments is shown for HEK 293T and A549 cells. The non‐immune EF1α promoter‐driven luciferase activities are used to prioritize genes selectively modulating IFNB1 production and to identify shRNAs affecting basal transcription as well as for a measurement of cellular fitness.
Table S3. Effect of silencing nuclear transport factors on IRF3 and p65 nuclear translocation. This table contains the results of the gene silencing screen for 60 Nucleoporins, nucleocytoplasmic transporters or components of the RAN system on the nuclear translocation of IRF3 and NF‐κB p65 during a 10‐hour SeV infection time course. Non‐target (NT) values are in absolute percentages, while all other values are presented in relative percentage.
Table S4. Effect of silencing nuclear transport factors on IFNB1 production and cellular fitness. This table contains the results of the gene silencing screen for 60 Nucleoporins, nucleocytoplasmic transporters or components of the RAN system on the IFNB1 promoter‐driven luciferase activity and cellular fitness. Results are represented in percentage of promoter inhibition from 2 separate experiments. Cellular fitness results are represented in percentage of cell survival for each time point of SeV infection.