

Plenary
Plenary Oral Abstract Session
P1‐MN1‐6
No Effect of Blood Donor Sex and Pregnancy History on the Survival of Transfused Patients: A Joint Analysis of Three Retrospective Cohorts
Gustaf Edgren1,2, Edward Murphy3,4, Donald Brambilla5, Henrik Ullum6, Catherine Lee7, Matt Westlake5, Steve Kleinman8, Darrell Triulzi9, Ritchard G. Cable10, Elizabeth St. Lezin4,11, Roberta Bruhn3, Henrik Hjalgrim6,12, Simone Glynn13 and Nareg Roubinian*3,4,7
1Karolinska Institutet, 2Södersjukhuset, 3Blood Systems Research Institute, 4University of California, 5RTI International, 6Rigshospitalet, 7Kaiser Permanente Division of Research, 8University of British Columbia, 9The Institute for Transfusion Medicine, 10American Red Cross, 11San Francisco Veterans Affairs HCS, 12Statens Serum Institut, 13National Heart, Lung and Blood Institute
Background/Case Studies: A recent publication reported that red cell transfusions from previously pregnant female donors markedly increased the mortality of transfused male patients. The findings would—if true—have far‐reaching clinical and administrative implications in the management of the blood supply. However, these results may have been influenced by biases introduced in the statistical analysis.
Study Design/Method: We separately analyzed data from three linked blood donor and recipient cohorts including data from the US and Scandinavia, over long time periods. Patients were followed from the time of first red cell transfusion for the occurrence of both in‐hospital and long‐term mortality. We used separate Cox regression models to estimate the associations between number of red cell transfusions from a female donor, a previously pregnant donor, and a donor sex‐discordant with the recipient—all treated as time‐dependent—and risk of death while controlling for total number of red cell transfusions received using a stratified Cox model. Analyses were performed for overall effect and stratified by recipient sex and age.
Results/Finding: We included a total of 53,890 patients (5,654 deaths), 93,724 patients (8,519 deaths) and 918,996 patients (198,537 deaths with longer follow up) in cohorts I, II and III, respectively. There was no association between any of the donor characteristics and in‐hospital mortality in any of the three cohorts (Table). Hazard ratios per transfused unit from a parous female donor were all non‐significant, ranging from 0.99 to 1.02. Results were similar for the effect of donor sex and sex‐discordance on in‐hospital mortality (Table), as well as with long‐term mortality in two of the cohorts (data not shown). Effect estimates did not differ with recipient sex, and/or age. Categorical analyses did not show negative effects in heavily exposed patients.
Conclusion: In this joint analysis of data from three large cohorts of transfused patients, we found no evidence of an association between donor sex, or parity and either in‐hospital or long‐term patient survival. These null findings using a similar statistical approach across more than a million patients from heterogeneous clinical settings in different countries indicate that prior findings seem unlikely to reflect true biological effects.
(P1‐MN1‐6) Risk of in‐hospital death, in relation to transfusion exposures, for the three cohorts.
| Hazard ratio per unit (95% CI) | |||
|---|---|---|---|
| Cohort I | Cohort II | Cohort III | |
| Number of transfusions from female donors | 0.99 (0.96‐1.03) | 1.00 (0.99‐1.01) | 1.00 (0.99‐1.00) |
| Number of transfusions from parous female donors | 1.00 (0.96‐1.05) | 1.01 (1.00‐1.02) | 1.00 (1.00‐1.01) |
| Number of sex‐discordant transfusions | 1.02 (0.99‐1.05) | 0.99 (0.98‐1.00) | 1.00 (1.00‐1.00) |
P2‐MN1‐6
Cryopreserved Platelets for Surgical Bleeding: Protocol for the CLIP‐II Trial Based on CLIP‐I Pilot Data
Michael Reade*1,2, Denese C. Marks3, Zoe K. McQuilten4, Lacey Johnson3 and Erica M. Wood4
1Joint Health Command, Australian Defence Force, 2Faculty of Medicine, University of Queensland, 3Research and Development, Australian Red Cross Blood Service, 4Department of Epidemiology and Preventive Medicine, Monash University
Background/Case Studies: Platelets are essential for optimal haemostasis and to preserve the endothelial glycocalyx in resuscitation from shock. However, the 5‐7 day shelf‐life of conventional room‐temperature stored platelets means they are usually not available outside large hospitals. Cryopreservation at ‐80C in dimethylsuphoxide extends shelf‐life to 2‐4 years, with reconstitution in plasma requiring minimal time, specialised equipment or training. However, despite encouraging preclinical and phase I data, only one phase II trial, in which only 24 patients received cryopreserved platelets, has been published. The CLIP trial program is seeking to provide sufficient phase III trial data for regulatory approval.
Study Design/Method: Between July 2015 and December 2017 in 4 hospitals, we enrolled cardiac surgical patients at particularly high risk of perioperative bleeding (identified using the TRUST criteria (Alghamdi et al., Transfusion, 2006)) in the CLIP‐I pilot trial (ACTRN12612001261808). Patients were randomised 1:1 to receive either cryopreserved or liquid‐stored platelets if their treating clinicians decided a platelet transfusion was indicated. Cryopreserved platelets were prepared by the Australian Red Cross Blood Service using a method based on that of the Netherlands Military Blood Bank, a modification of the original protocol described by the US Navy.
Results/Finding: In total, 121 patients were randomised, of whom 42 (35%) received a platelet transfusion. Study groups were well‐matched at baseline. There were no significant differences in any effectiveness outcome, but there was a trend for the cryopreserved group to require fewer red blood cell units transfused (median [IQR] 2.5 [1‐5] vs. 4 [3‐5] units, p=0.18). There was a trend towards the cryopreserved group having less blood in their chest drains at 24hr (median [IQR] 712 [540‐825] vs. 805 [591‐1080]ml, p=0.27). For the composite outcome defined by the Bleeding Academic Research Consortium (BARC), there was a trend to superiority in the cryopreserved platelet group (27.3% vs. 55.6%, p=0.07). There were no clinically important differences in any measured adverse events.
Conclusion: In this pilot trial, cryopreserved platelets were associated with no evidence of harm and small non‐significant trends to reduced requirement for red cell transfusion and reduced postoperative blood loss. In the light of this data and the clear logistic advantages of cryopreservation, a definitive study with a non‐inferiority design testing volume of postoperative bleeding as the primary outcome is warranted. Improved identification of patients at high risk for a platelet transfusion using a platelet‐specific transfusion risk prediction score will increase the efficiency of the phase III trial.
P3‐MN1‐6
Infectious Disease (ID) Rates Among Donors Reinstated After Changes to the Men Who Have Sex with Other Men (MSM) Deferral Policy
Yvette M. Miller1, Kathleen M. Grima1, Artan Apostoli1, Julie Hall1, Ed P. Notari1, Roger Y. Dodd2 and Susan L. Stramer*1
1American Red Cross, 2American Red Cross Holland Laboratory
Background/Case Studies: Changes to the deferral policy for MSM were FDA approved in Dec 2015. These allowed previously deferred donors having reported MSM “ever” to donate if no activity was reported in the prior 12 months and all other eligibility criteria were met. New donor eligibility policies were implemented in phases by the American Red Cross beginning in Dec 2016. We reviewed the infectious disease (ID) history and number of donors with a prior MSM history who now qualified and donated; these were compared to the general donor population.
Study Design/Method: Queries were developed to identify indefinitely deferred MSM donors otherwise eligible for blood donation. Once identified as eligible, the computer‐generated MSM deferral was removed. The queries covered deferrals from Jan 2010‐Jan 2018; all reinstatements occurred from Dec 2016‐Jan 2018. An additional query was developed to track any subsequent donations/deferrals for any reinstated donor. Eligibility was communicated, assuming all criteria remained acceptable including absence of MSM in the prior year, following telephone calls to a toll‐free number; reinstated donors were also recruited for donation based on current eligibility. All reinstated donors were required to meet the same donor requirements as any other donor. Rates of ID markers in reinstated donors were compared by chi‐square testing to the general donor population, both donating during 2017.
Results/Finding: 520/22,482 (2.3%) donors returned to donate after their indefinite MSM deferral was removed; 7 donors had ID deferrals following reinstatement (2 confirmed syphilis, 5 anti‐HBc‐reactive on 2 occasions of which 3 had a 1x history prior to reinstatement and 2 had both anti‐HBc reactives post reinstatement; of note, 1 anti‐HBc reactive donor was also an incident HIV NAT converter). An additional 72 donors returned to donate after a subsequent 12‐month MSM deferral of which 2/72 had ID deferrals following reinstatement; both had confirmed syphilis and one donor was also HIV (antibody+NAT) positive with acknowledged ongoing MSM. The overall rate for all ID markers for routine donors in 2017 was 0.4% (21,676/4,829,679) as compared to 1.3% (7/520) in reinstated indefinitely deferred MSM donors (p<0.01; Odds Ratio, OR 3.0; 95% Confidence Interval, CI 1.44‐6.38), or 2.8% (2/72) in reinstated 12‐mo deferred MSM donors (p<0.05; OR 6.3; 95% CI 1.55‐25.84).
Conclusion: Federally funded programs investigating variation in HBV, HCV and HIV prevalence and incidence have not yet detected significant changes, indicating comparable safety pre‐ and post‐MSM policy change. However, review of MSM reinstated donors for all ID‐markers versus general donors shows trends that require careful monitoring.
P4‐MN1‐6
Incidence of Red Blood Cell Alloimmunization and the Impact of Prophylactic Antigen Matching in Patients with Warm Autoantibodies
Meghan Delaney*1, Torunn Oveland Apelseth2, Carolina Bonet Bub3, Claudia S. Cohn4, Nancy M. Dunbar5, Jose M. Kutner6, Michael Murphy7, Kathleen Selleng8, Julie Staves9, Silvano Wendel10 and Alyssa Ziman11
1Children's National Health System, 2Department of Immunology and Transfusion Medicine, Haukeland University Hospital, 3Hospital Israelita Albert Einstein, 4University of Minnesota, 5Dartmouth‐Hitchcock Medical Center, 6Einstein Medical Center, 7John Radcliffe Hospital, 8Institute for Immunology and Transfusion Medicine, University Medicine Greifswald, 9Oxford University Hospitals NHS Foundation Trust, 10Hospital Sirio Libanes Blood Bank, 11Division of Transfusion Medicine, Department of Pathology and Laboratory Medicine, David Geffen School of Medicine at UCLA
Background/Case Studies: Warm autoantibodies (WAA) are panreactive autoantibodies that complicate compatibility testing and can cause clinical hemolysis. The rate of patients with WAA developing red blood cell (RBC) alloimmunization is not well understood; single center studies cite rates of 8 – 39% of patients. Substantial laboratory resources are used for evaluation and RBC selection; however, there is no evidence‐based or uniform approach for these activities. The goal of this study is to understand the prevalence of WAA and risk of RBC alloimmunization in this population, and whether RBC selection practice had an impact on alloimmunization.
Study Design/Method: Records of patients (>1 year of age) with an antibody detection test (IAT) and evidence of WAA were included. To determine the incidence of RBC alloimmunization in patients with WAA, patients that received RBC transfusion and had an IAT ≥30 days later were reviewed. To determine the impact of RBC product selection approach, patients were subdivided into those that received prophylactically antigen matched (PAM) RBCs for transfusion and those that did not.
Results/Finding: Eight centers from 5 countries collectively reviewed 1,122,245 patients who had an IAT. In the patients tested at transfusion services laboratories (TSL), 1,218 had a WAA (0.17%, range 0.01‐0.36%). One center combined TSL and immunohematology reference laboratory (IRL) had 3990 patients with WAA (1.03%). The range of prevalence of WAA detection at TSL centers was 0.01 to 0.36%. Of TSL patients with WAA, 410 (33.7%) had evidence of RBC alloimmunization either prior to or at the time of WAA identification, while 808 patients (66.3%) had only WAA detected. 843 (69.2%) patients with WAA were transfused and 431 (35.4%) did not receive a RBC transfusion after detection of WAA. Of patients with WAA who were transfused, 539/843 (63.9%) patients received PAM RBCs (Rhesus, Kell antigens minimum; median 6 RBCs); 36.1% received no‐PAM RBC units (median 8 RBCs). Of patients that received PAM RBCs, 258 had a subsequent antibody detection test ≥30 days post transfusion and 179 of the no‐PAM patients. The number of patients that developed RBC alloantibodies was not different in the two groups; 31 (12.0%) in the PAM group and 25 (14.0%) patients in the no‐PAM group (p = 0.5631).
Conclusion: This is the largest known assimilation of laboratory results from patients with WAA. The overall prevalence of WAA is quite low, and slightly higher when enriched with IRL results. Our data provide evidence that approximately one third of patients with WAA have alloantibodies concomitantly, and nearly 70% of patients with WAA require RBC transfusion. When there is pre‐existing WAA, subsequent development of alloimmunization is 12.0 – 14.0%. The use of PAM does not appear to be protective for subsequent RBC alloimmunization; however we did not study the number and type of serological evaluations that may have been impacted by using the PAM approach.
P5‐MN1‐6
Perioperative Red Cell Transfusions Are Associated with Post‐ Operative Venous Thromboembolism in Children and Neonates: Evidence from a Large North American Multicenter Prospective Registry
Ruchika Goel*1, Aaron Tobian2, Ravi M. Patel3, Melissa M. Cushing4, Ljiljana V. Vasovic4, Steven M. Frank5, Marianne E. Nellis4, Oliver Karam6 and Cassandra D. Josephson3
1Department of Pediatrics, New York Presbyterian Hospital, Weill Cornell Medicine, 2Johns Hopkins University School of Medicine, 3Emory University School of Medicine, 4Weill Cornell Medicine, 5Johns Hopkins Medical Institutions, 6University of Geneva Faculty of Medicine
Background/Case Studies: In hospitalized children, the incidence of venous thromboembolism (VTE) is reportedly rising. RBC transfusion is commonly performed in the peri‐operative period in children; however, the relationship with post‐operative thrombotic events remains unclear. We have recently proposed this relationship in adults (Goel, Tobian et al, JAMA surgery, in press). This study examined the relationship between perioperative RBC transfusions and post‐operative VTE within 30 days of a surgery in children (<18 years).
Study Design/Method: Using the pediatric database of the American College of Surgeons National Surgical Quality Improvement Program (PEDS ACS‐NSQIP) (2012‐2014), risk‐adjusted outcomes for VTE (deep venous thrombosis (DVT(/pulmonary embolism(PE)) of pediatric patients (<18 years) undergoing elective/urgent/emergent surgeries were compared. Univariate followed by multivariable logistic regression was performed.
Results/Finding: N=183,233 children [39,211 infants (<1 year); 7,857 neonates (<28 days)] were evaluated. Of these 73.18% underwent elective, 10.03% urgent and 16.80% emergent procedures. Commonest surgery types were: general surgery 38.62%, orthopedic 19.68%, urologic 11.51%, otolaryngological 11.02% and neurosurgical 8.66%.
About 1.1% (n=1956) children [n=1129 (2.9%) infants; n=507 (6.45%) neonates] received pre‐operative transfusions (within 48 hours of surgery). Six percent (n=11,003) children [n=3,462 (8.83%) infants; n=1,101, (14.01%) neonates] received RBC transfusions intraoperatively (start of surgery until 72 hrs post‐op). Transfusions were in response to intra/post‐operative bleeding. 197 children (0.11%) [(n=74 (0.2%) infants; n=28 (0.36%) neonates)] had post‐operative VTE (including 10 (0.11%) cases of PE).
Intra/post‐operative RBC transfusions were associated with 1.8‐fold higher risk of VTE (adjusted odds ratio [adjOR]=1.81;95%CI=1.25‐2.61), p<0.001] after accounting for various putative risk factors (Table 1). The association was stronger in infants [adjOR = 3.2; 95%CI = (1.88‐5.43), p<0.001] and neonates [adjOR = 5.66; 95%CI = (2.30‐13.93), p<0.001].
(P5‐MN1‐6)
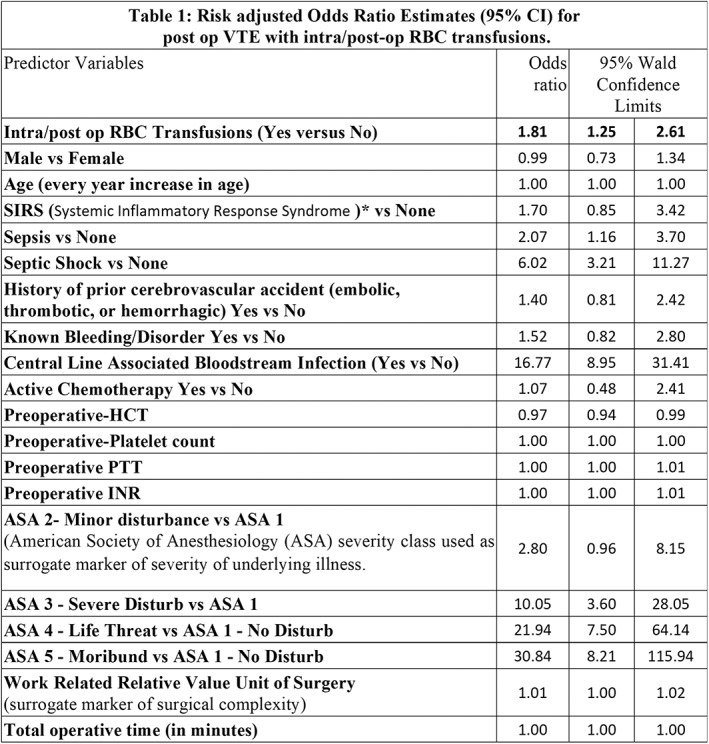
Pre‐operative RBC transfusions were independently associated with post‐operative VTE in all children [adjOR] = 2.30; 95%CI=1.43‐3.67), p<0.01], infants [adjOR = 2.55; 95%CI = (1.34‐5.43), p<0.01] and neonates [adjOR = 3.63; 95%CI = (1.36‐9.67), p<0.05].
Conclusion: In this prospective registry study of >180,000 children undergoing surgeries, peri‐operative RBC transfusions were associated with higher risk adjusted odds of post‐operative VTE. The relationship is also seen in subgroup analysis in infants and neonates.
Should these findings be validated in a prospective setting, peri‐operative pediatric patient blood management strategies need to be explored in these patients to optimize peri‐operative transfusions in children.
P6‐MN1‐6
Safety Analysis of a New Generation Freeze‐Dried Plasma Product: Report of a Dose‐Escalation, Phase 1 Clinical Trial
Jose Cancelas*1, Neeta Rugg1, Shawnagay Nestheide1, Melissa King2, Michele Snyder2, Joan C. Pehta3, Victor Macdonald4, Manoj Valiyaveettil4 and Andrew Atkinson4
1Hoxworth Blood Center, 2Westat Inc, 3Consultant to Vascular Solutions LLC, a subsidiary of Teleflex, Inc., 4USAMMDA
Background/Case Studies: Recent assessments of massive transfusion protocol outcomes have identified early transfusion of plasma results in improved hemostasis, shorter ventilator times and increased survival. Infusion using a ∼1:1 of plasma to red blood cells has also demonstrated a significant decrease in morbidity and mortality. Freeze‐dried plasma (FDP) products have been successfully used as an alternative to fresh‐frozen plasma (FFP), however, current FDP products prepared in glass bottles have limited widespread adoption of FDP in environments such as the battlefield. A new FDP product (RePlas®) that is contained and reconstituted in a plastic blood bag, using ∼ 250 mL USP sterile water for injection within less than two minutes, has been recently developed.
Study Design/Method: This was a prospective, paired, open label, single‐center, dose‐escalation phase 1 study to determine the safety of autologous infusions of whole blood (CPD) derived FDP or plasmapheresis (ACD) derived FDP into normal healthy subjects. Each FDP product was manufactured from a minimum volume of 270 mL of FFP. Three cohorts of 8 subjects per cohort were included (n=24), resulting in infusions of 270 mL (Cohort 1, n=4 for each CPD or n=4 for ACD FDP infusions), 540 mL (Cohort 2, n=4 for each CPD or n=4 for ACD FDP infusions) and 810 mL (Cohort 3, n=8 for ACD FDP and ACD FFP infusions). Cohort 3 was a randomized, double‐blind, crossover study that compared the clinical and laboratory levels of thrombogenesis biomarkers after FDP vs FFP infusions. Clinical and laboratory follow‐up was performed after 30 minutes, 4 hours, 24 hours, 7 and 28 days post‐infusion. in vitro biochemical and coagulation parameters including pH, osmolality, aPTT, NaPTT, INR, Factors V, VIII, VIIa, protein S, antithrombin III, and total protein levels were also analyzed. A data safety monitoring board reviewed the subjects’ data after the completion of infusions in each cohort.
Results/Finding: To date, a total of 41 subjects have been screened and 28 subjects have been enrolled and assigned to treatment. For cohorts 1 and 2, all 16 subjects have been infused with FDP products. All FDP units were reconstituted in less than two minutes. For all subjects, no serious adverse events (SAEs) related to product infusion and no occurrence of predetermined, treatment emergent adverse events (TEAEs) including thromboembolic events, infections, evidence of unusual bleeding/bruising or elevated D‐dimer levels have been observed. Physical examinations showed no significant changes in vital signs or Wells’ scores. Four AEs not related to the FDP product infusion were observed in cohort 1 (rhinitis, transient weakly positive DAT, hyperglycaemia and transient mild increase of liver transaminases). No AEs were identified in cohort 2. No signs of either local or systemic allergic reactions were observed after infusions. Cohort 3 infusions are ongoing and the results of this cohort will be presented.
Conclusion: Preliminary data suggest that RePlas® FDP is well tolerated in normal healthy volunteers with no SAEs or safety concerns.
Oral
Oral Abstract Session: Immune and Non‐Immune Factors Affecting Red Cell Survival
CBIB6‐MN3‐21
Peripheral Tolerance of Recent Thymic Emigrants Is Required to Prevent RBC‐Specific Autoimmunity
David R. Gruber, Amanda L. Richards, Andrea S.L. Wong, Heather L. Howie and Krystalyn E. Hudson*
BloodworksNW Research Institute
Background/Case Studies: Autoantibodies to RBCs may lead to autoimmune hemolytic anemia, a severe and sometimes fatal disease. While RBC‐specific B cells escape central tolerance and retain the ability to secrete autoantibodies, stringent T cell tolerance prevents autoimmunity; however, the tolerance mechanisms are unknown. Recent thymic emigrants (RTEs) are highly susceptible to tolerization. Herein, we tested the hypothesis that RTEs are involved in tolerance to RBC autoantigens.
Study Design/Method: HOD mice express an RBC‐specific transgene consisting of hen egg lysozyme, ovalbumin (OVA), and human Duffy. HOD mice were bred with OTII mice, whereby >90% of CD4 T cells are specific for OVA (within HOD). HODxOTII F1s were immunized with 100ug of OVA/CFA. Thymi from 8‐12 weeks (wks) old HODxOTII F1s were stained to identify OTIIs and regulatory T cells (Tregs). HOD mice were bred with OTII.Rag2p‐GFP (a.k.a. HODxRTE), where GFP is detectable in RTEs for 3 wks post thymic egress. GFP + OTII RTEs were evaluated for anergic surface markers, transcription factors, and kinases. To assess function, B6 mice received 3x10⁵ sorted GFP + OTII RTEs from HODxRTE F1s followed by 100uL HOD RBCs. RTE proliferation was assessed at 3 days by Ki67 staining.
Results/Finding: OVA/CFA immunization failed to induce an immune response in HOD+OTII + mice (indicating robust tolerance); a strong antibody response was observed in HOD‐OTII + controls. In thymi, neither total CD4 OTII T cell number or frequency of FoxP3+CD25 + Tregs had a significant difference between HOD+OTII + and HOD‐OTII + controls, thereby indicating central tolerance mechanisms in not affecting RBC‐specific autoreactive T cells. RTEs from HODxRTE F1s were divided into GFPhi (<1 wks), GFPint (2‐3 wks), and GFPneg (mature) for analysis. GFPhi RTEs from HOD+RTE + mice had significantly higher expression of anergy‐associated transcription factors Egr2, NFAT2, and Helios and phosphorylation of mTOR and AKT, compared to HOD‐RTE + (p<0.05, 3/3 experiments). Anergic surface markers PD1, CD73, GITR, and FR4 increased expression as HOD+RTEs matured. RTEs from HOD‐RTE + mice displayed a naïve phenotype throughout maturation whereas autoreactive RTEs became CD44+CD62L‐ effector T cells. Following GFP + OTII adoptive transfer and HOD RBC transfusion, RTEs from HOD‐RTE + mice proliferated (>95% Ki67+) whereas decreased capacity to proliferate in maturing RTEs was observed in RTEs from HOD+RTE + mice (3/3 experiments, Ki67% RTEs: GFPhi 65, GFPint 35, GFPneg 15).
Conclusion: Data herein show that RBC‐specific autoreactive CD4 T cells are not subject to central tolerance mechanisms, which is a novel finding for an RBC autoantigen. Instead, an anergy program is initiated in RTEs during their maturation. These data provide key insights into RBC‐specific T cell tolerance mechanisms, identify a window of tolerization, and demonstrate that disruptions of RTE maturation and tolerance may lead to RBC autoimmunity.
CBIB5‐MN3‐21
Levels of STEAP3 Expression Are a Genetic Determinant of RBC Storage Quality in Mice
Heather L. Howie1, Ariel M. Hay1, Karen de Wolski2, Hayley Waterman1, Jenna Lebedev1, Xiaoyun Fu1, Yi Wang1, Angelo D'Alessandro3, Rachel Culp‐Hill4, Peter Thomson5, James D. Gorham6 and James C. Zimring*1
1BloodworksNW Research Institute, 2Bloodworks Northwest, 3University of Colorado Denver, 4University of Colorado, 5University of Sydney, 6University of Virginia School of Medicine
Background/Case Studies: There is substantial donor‐to‐donor variability in how well stored human RBCs circulate post‐transfusion. However, the basis of such variability is poorly understood. It has been reported, that like humans, RBCs from genetically distinct strains of mice store differently. The genetic element responsible for differences in storage between B6 mice (store well) and FVB mice (store poorly) was mapped.
Study Design/Method: 156 individual mice in the F2 generation of a B6 × FVB cross were analyzed with regards to: 1) 24‐hour post‐transfusion RBC recoveries (PTR), 2) high resolution metabolomics, and 3) SNP based genotyping. A phenotype driven backcross was also carried out; poorly storing progeny were crossed to B6 mice for 8 generations (B6.FVB congenic strain). New transgenic mice were engineered that overexpress Steap3 on their RBCs. Known human variants of human Steap3 were cloned and expressed in CHO cells and activity measured.
Results/Finding: Quantitative trait locus (QTL) analysis of F2 mice identified a 149 Mb region on Chr 1 associated with PTR (p=2.09x10‐31). B6.FVB narrowed this to 2.8 Mb containing 20 coding genes. mRNA levels were quantified for all 20 genes by RT‐PCR in erythroid precursors. Only one gene, Steap3, showed significantly different expression in FVB and B6.FVB mice compared to B6 (p<.005 by 2‐way ANOVA, Bonferroni correction). Steap3 has two mRNA transcript variants in mice. Comparing FVB and B6.FVB mice to wild type B6, transcript var1 was 8‐10 fold higher while transcript var2 was 3 fold lower (p<.0001 and p<.05 respectively by 2‐way ANOVA, Bonferroni correction). RBCs from both FVB and B6.FVB mice had twice the Steap3 activity and 7 fold higher protein levels than B6 RBCs. Overexpressing Steap3 in B6 transgenic mice resulted in a significant decrease in PTR of stored RBCs compared to wild‐type B6 (p<0.001). Lipid oxidation correlated with poor PTR in the F2 cohort and refined clusters of oxylipins carried over into the B6.FVB strain and into Steap3 transgenic mice. Known natural variants of human Steap3 had a wide variety of activities.
Conclusion: Multiple lines of evidence using different approaches identified Steap3 as a genetic element regulating PTR. Steap3 is a ferrireductase converting Fe3 + to Fe2 + suggesting a mechanism of promoting a Fenton reaction with ensuing oxidation of lipids. Humans and mice share a Steap3 orthologue that is 84.97% identical at the amino acid level. Both null mice and deficient humans have a similar anemia. To our knowledge, this report is the first indication of a role of Steap3 in the biology of mature RBCs. Human Steap3 variants differ in activity but have not been tested for RBC storage. Testing this hypothesis in humans would require studies of PTR of RBCs from donors with genetic variation of Steap3, or other genes involved in Steap3 based pathways.
CBIB4‐MN3‐21
Red Blood Cell Alloimmunization Responses to Transfused Blood Do Not Require Splenic Marginal Zone Macrophages
Abhinav Arneja*1, Juan Salazar1, Manjula Santhanakrishnan2, Jeanne Hendrickson2 and Chance J. Luckey3
1University of Virginia, 2Yale University, 3University of Virginia Medical Center
Background/Case Studies: Alloimmunization to non‐ABO red blood cell (RBC) antigens remains a significant clinical problem in transfusion medicine. Presence of RBC alloantibodies can lead to delayed transfusion reactions resulting in significant morbidity and occasional mortality. Transfused RBCs represent a unique immune stimulus as they lack traditional pathogenic signals that stimulate innate immune responses. The molecular and cellular mechanisms involved in the stimulation of immune responses to transfused RBCs remain unclear. Recent work in mouse models has shown that storage of RBCs prior to transfusion leads to a significant enhancement of alloimmunization. Further studies have independently implicated macrophages and the spleen as being critical for immune response to stored RBCs. Splenic marginal zone macrophages (MZMs) have been reported to not only stimulate innate immunity but also to promote adaptive immune responses to certain blood‐borne pathogens. Additionally, Splenic MZMs specifically phagocytose intravenously injected apoptotic cells resulting in immune suppression towards apoptotic cell antigens. Uptake of apoptotic cells by MZMs critically depends on the exposure of phosphatidylserine (PS) on their cell surface. Exposure of PS on the surface of RBCs increases with RBC age but is significantly enhanced by storage. We hypothesized that splenic MZMs phagocytose transfused stored RBCs and, unlike apoptotic cells, stimulate innate and adaptive immune responses to RBC antigens.
Study Design/Method: To investigate the role of MZMs in RBC alloantibody generation, we utilized the HOD mouse model to compare alloimmunization in Wild‐Type (WT) and Liver X Receptor α (LXRα) knock‐out (KO) mice. LXRα is a transcription factor essential for the generation of splenic MZMs. LXRα KO mice show a complete lack of splenic MZMs, and have abnormal responses to blood‐borne pathogens. WT and LXRα KO mice were transfused with fresh or stored HOD RBCs and resulting serum anti‐HOD IgG alloantibody titers were compared.
Results/Finding: Surprisingly, the lack of MZMs did not affect the generation of anti‐HOD IgG alloantibodies in response to either fresh or stored HOD RBCs. All WT and LXRα KO mice generated alloantibodies in response to transfused fresh or stored HOD RBCs (in 2/2 experiments with 5‐8 mice/group). Serum levels of anti‐HOD IgG titers were equivalent in WT and LXRα mice in response to transfusion with fresh (p = 0.18, 2/2 experiments with 5‐8 mice/group) or stored HOD RBCs (p = 0.51, 2/2 experiments with 5‐8 mice/group). Mann‐Whitney U test was used to calculate p‐values, and values lower than 0.05 were considered statistically significant.
Conclusion: Splenic MZMs are not required for the primary alloantibody response to transfused fresh or stored HOD RBCs. Our results suggest that splenic immune responses to transfused RBCs utilize mechanisms that are distinct from those regulating immune responses to apoptotic cells and blood‐borne pathogens. This study further highlights the unique nature of RBCs as an immune stimulus, and stresses the need for continued investigation of molecular and cellular mechanisms regulating RBC alloimmunization.
CBIB3‐MN3‐21
IgG2c Alloantibodies Enhance RBC Alloimmunization by Modulating Antigen Presenting Cell Erythrophagocytosis
David R. Gruber, Kathryn Sheldon, Amanda L. Richards, Paurvi Shinde, Heather L. Howie, Jenna Lebedev, James C. Zimring and Krystalyn E. Hudson*
BloodworksNW Research Institute
Background/Case Studies: Prophylactic administration of polyclonal anti‐RhD in women prevents maternal alloimmunization. However, under certain conditions, some preparations of anti‐RhD have a paradoxical enhancement of alloimmunization. The underlying mechanisms behind modulation of humoral alloimmunization by anti‐RhD are unknown. However, recently it has become appreciated that different IgG subtypes of antibodies may differentially regulate alloimmunity. Herein, we take a reductionist approach and passively immunize mice with monoclonal alloantibodies, whereby the antibodies have the same specificity but are different IgG subtypes, to test how IgG subtype regulates RBC alloimmunization.
Study Design/Method: A new monoclonal anti‐Duffy was isolated, sequenced, and class‐switched into different mouse IgG subtypes (IgG1, IgG2a, IgG2b, IgG2c, IgG3). Individual subtypes were passively infused into C57BL/6 (B6) mice followed by a transfusion of 100uL of packed, leukoreduced RBCs consisting of 50uL HOD and 50uL B6, each labeled with lipophilic dyes to allow tracking. HOD RBCs express an RBC‐specific triple fusion protein consisting of hen egg lysozyme, ovalbumin (OVA), and human Duffy. Some recipients received an adoptive transfer of 105 OTII CD4 T cells, which recognize OVA contained within HOD, presented by recipient MHCII. Alloantibodies were assessed over 21 days and measured by flow crossmatch against HOD and control B6 RBC targets.
Results/Finding: Passive immunization with 1ug of IgG2a or IgG2c enhanced anti‐HOD alloantibody production (3/3 experiments, p<0.01), IgG2b led to a 3‐fold increase, but neither IgG1 nor IgG3 modulated alloimmunization, compared to controls. Additional mechanistic studies focused on IgG2c. Passive immunization with IgG2c accelerated HOD RBC clearance from circulation at every time point analyzed, compared to syngeneic B6 RBCs. Additionally, IgG2c treatment led to a significant increase of HOD RBC consumption (p<0.05, 3/3 experiments), with increases observed in CD8 + dendritic cells (DCs), CD8‐ DCs, red pulp macrophages, and to a lesser extent plasmacytoid DCs and neutrophils. The cumulative effect of altered RBC consumption patterns in IgG2c‐treated mice resulted in a significant increase in OTII proliferation (p<0.0001, 2/2 experiments).
Conclusion: The current findings indicate that pre‐existing anti‐RBC alloantibodies can modulate future RBC alloantibody production. In particular, IgG2c enhances alloantibody production through accelerated RBC clearance and shifting the pattern of consumption to individual immunostimulatory antigen presenting cell subsets. The cumulative effect of these changes is enhanced CD4 T cell activation and proliferation which leads to increased RBC alloantibodies. As polyclonal anti‐RhD contains multiple antibody subtypes at varying ratios, these finding may provide insight into why some preparations of RhD, under certain conditions, enhanced alloimmunization.
CBIB2‐MN3‐21
Enhancement of RBC Alloimmunization by IgG2a Requires Fcγri in a Murine Model
Paurvi Shinde1, Krystalyn E. Hudson1, Ariel M. Hay1, Jenna Lebedev1, Heather L. Howie1, Ellen Van Der Schoot2, Gestur Vidarsson3, Xiaohong Wang1 and James C. Zimring*1
1BloodworksNW Research Institute, 2Sanquin Blood Supply Research, 3Sanquin Research
Background/Case Studies: In addition to the better known effector function(s), antibodies are also known to regulate primary immune responses; e.g. administration of polyclonal anti‐RhD to prevent maternal alloimmunization. Attempts to generate monoclonal anti‐RhD have been complicated; ironically, some preparations enhanced rather than suppressed in human trials. Likewise, administration of plasma derived anti‐RhD has caused enhancement in some settings. The underlying factors and/or mechanisms that regulate enhancement or suppression are poorly understood. To investigate these processes, we used a tractable mouse model that expresses the K1 variant of Kell on RBCs, and allows transfusion of RBCs into antigen‐negative recipients as an allotransfusion.
Study Design/Method: A monoclonal anti‐K1 was isolated and sequenced. Recombinant DNA technology was used to express the same anti‐K1 variable domain as each of the different mouse IgG subtypes (IgG1, IgG2a, IgG2b, IgG2c, IgG3). Isolated subtypes were infused into C57BL/6 (B6) mice followed by transfusion of one unit of K1 RBCs (50 microliters). Alloimmunization was measured by testing serum for anti‐K1 IgM (at day 6) and IgG (at day 21) via flow crossmatch with K1 RBCs. Recipient mice included targeted deletions of the common gamma chain of FcgRs, FcgRI or FcgRIII. Both traditional and cellular surface plasmon resonance (SPR) assays were performed to assess affinity for IgG2a with the different FcgRs.
Results/Finding: IgG2a, IgG2b and IgG2c (but not IgG1 or IgG3) significantly enhanced alloimmunization. For example, in combined data from 3 experiments, IgG2a treated vs. control mice had IgM (1693 vs 357, p = 0.02) and IgG (5926 vs. 6.9, p = 0.002). No enhancement was observed using antibodies against a third‐party antigen. Likewise, no signal was detected in mice that received anti‐K1 antibody but no transfusion. Additional mechanistic studies focused on the IgG2a subtype. Enhancement by IgG2a was lost in mice with a deletion of the common Fc gamma chain (FcgR‐/‐), suggesting that FcgRI, FcgRIII or FcgRIV (or some combination) was required for enhancement. Enhancement by IgG2a was eliminated in FcgRI‐/‐ mice but was unaltered in FcgRIII‐/‐ mice. Additionally, SPR analysis revealed affinity of IgG2a was highest for FcgRI (1x9x10‐8). These findings demonstrate that FcgRI, but not FcgRIII is required for IgG2a mediated enhancement of alloantibody response to K1 RBCs.
Conclusion: The current findings indicate anti‐RBC antibodies can influence humoral alloimmunity and this process is dependent upon IgG subtype. IgG2a, IgG2b and IgG2c each enhanced alloimmunity. Mechanistically, IgG2a enhancement requires FcgRI. Because enhancement is lost in FcgRI null mice, then none of the other FcgRs is sufficient for enhancement; but we cannot rule out that they may be involved.
CBIB1‐MN3‐21
Mechanistic Analysis of Oxidant Stress Mediated Hemolysis in G6PD Deficient RBCs in a Novel Murine Model
Heather L. Howie1, Ariel M. Hay1, Jenna Lebedev1, Xiaoyun Fu1, Yi Wang1, Angelo D'Alessandro2, Mathew Wither3, Connie Zheng4, Matthew S. Karafin5, Steven L. Spitalnik6, Eldad A. Hod6, Richard O. Francis6, Tiffany A. Thomas6 and James C. Zimring*1,7
1BloodworksNW Research Institute, 2University of Colorado Denver, 3University of Washington, 4University of Colorado, 5BloodCenter of Wisconsin, 6Columbia University Medical Center, 7University of Washington School of Medicine
Background/Case Studies: Glucose‐6‐phosphate dehydrogenase deficiency (G6PD‐def) is found in approximately 400 million humans, likely because it provides resistance to malaria. G6PD‐def is caused by missense mutation(s) that destabilize the enzyme, resulting in decreasing G6PD activity as RBCs age. Although typically healthy, G6PD‐def individuals can experience profound hemolysis upon exposure to oxidant stress through diet, drugs, or disease. However, many cellular and biological particulars of G6PD‐def remain poorly understood, partly due to the lack of an animal model with the same enzymatic instability seen in human G6PD‐def.
Study Design/Method: The coding region for a severe human G6PD‐def variant (Med‐) was knocked into the mouse G6PD locus on a C57BL/6 (B6) background. The G6PD‐def mouse RBCs were assessed for in vivo life span as well as for 24‐hour post‐transfusion recovery (PTR) after storage. Oxidant stress was induced in vivo with phenylhydrazine (PHZ); alternatively, RBCs were exposed to diamide in vitro. High resolution metabolomics analyses were performed on RBCs during challenge with PHZ or diamide, including in vitro incubation with stable isotopically labelled 13C1,2,3‐glucose to compare glycolysis vs. Pentose Phosphate Pathway (PPP).
Results/Finding: RBCs from G6PD‐def mice had 1.4% of wild‐type G6PD activity (p<0.0001) and metabolic 13C1,2,3‐glucose tracing confirmed decreased PPP flux, especially in diamide treated RBCs. At baseline, there was no observable difference in the in vivo RBC lifespan as compared to wild‐type mice. However, PHZ challenge caused marked hemoglobinuria and significantly increased RBC clearance in G6PD‐def compared to wild‐type mice over a 7‐day time course (p<0.01). G6PD‐def mice treated with PHZ had low steady state levels of 6‐phosphogluconate, sedoheptulose phosphate, and gluconolactone 6‐phosphate, in parallel with increased AMP/ATP ratios, decreased ATP, and increased polyamines, bilirubin, and nicotinamide. Recent human studies have shown a small but significant decrease in PTRs of stored RBCs from G6PD deficient donors compared to non‐deficient donors (81% + /‐ 7.2% vs. 86.8% + /‐ 2/8% ‐ p=0.001); no difference was observed in PTR of G6PD‐def vs. wild‐type mice.
Conclusion: Like many humans with G6PD‐def, these G6PD‐def mice are hematologically normal under healthy conditions and in the absence of oxidative stress. However, when exposed to environmental oxidative stress, RBCs undergo increased damage and rapid destruction. Metabolomics analysis provides unique insights into the insult that G6PD‐def RBCs suffer when exposed to oxidative stress. In addition to providing novel mechanistic insights into oxidative hemolysis of G6PD‐def RBCs, this model presents a new and tractable platform to investigate multiple hypotheses regarding oxidant stress in health and disease.
Oral Abstract Session: Transfusion Reactions/TACO and Septic Reactions
TS2‐MN3‐22
Transfusion Speed vs. Volume – Investigating Risk Factors of TACO
Robert Klanderman*1,2, Marije Wijnberge1,3, Joachim Bosboom3, Adrie Maas2, Margreeth Vroom1, Nicole Juffermans1,2, Markus Hollmann2,3, Bart Geerts3 and Alexander Vlaar1,2
1Department of Intensive Care Medicine, Academic Medical Center, 2Laboratory for Experimental Intensive Care and Anesthesiology, Academic Medical Center, 3Department of Anesthesiology, Academic Medical Center
Background/Case Studies: Transfusion‐associated circulatory overload (TACO) is one of the leading causes of transfusion‐related major morbidity and mortality. Hydrostatic pulmonary edema is key and major risk factors include speed and volume of transfusion. To date no preclinical studies have investigated infusion speed and volume on pulmonary capillary pressure. Our aim of this study was to develop a rat model for TACO and investigate the influence of these risk factors.
Study Design/Method: A ‘two‐hit’ rat model was developed using Lewis rats. Blood harvested from donor rats was used to make red blood cell units (RBC) following national blood banking practices. Under general anesthesia, a cardiac left‐ventricular pressure transducer was placed. Isovolemic anemia was induced by replacing 25% of circulating volume with colloid solution. A large myocardial infarction was induced through ligation of the left‐anterior descending coronary artery (first‐hit). Animals were randomized (n=3 per group) to receive 1, 2 or 4 units of RBCs in 30 or 60 minutes (second‐hit). Animals were followed‐up to 1‐hour post‐transfusion. Primary outcome was difference in left‐ventricular end‐diastolic pressure (dLVEDP) – gold standard for measuring increased pulmonary pressure (hallmark of TACO). Secondary outcomes include lung wet‐dry ratio (WDR) and hemodynamic parameters.
Results/Finding: Pre‐transfusion LVEDP was 9.64 mmHg (IQR: 8.1 – 11.1); following transfusion a significant increase in dLVEDP was seen between 1 vs. 2 and 1 vs. 4 units (resp.: p = 0.013, p = 0.013). While higher transfusion speeds trend towards higher pressures, this was not significantly different. Elevation of LVEDP above baseline persisted up to 1 hour after transfusion in the 2 and 4 unit group (ns.). WDR showed no differences between units or transfusion speed.
TABLE 1 (TS2‐MN3‐22) Difference in pulmonary capillary pressure – Speed vs. Volume
| Transfused: | dLVEDP:*(median) | Slow: (60 min) | Fast:* (30 min) |
|---|---|---|---|
| 1 Unit | −2.05 (−3.66 – −0.61)‡† | − 2.76 (−3.96 – −1.57) | −1.33 (−4.81 – −0.46)† |
| 2 Units | 0.50 (0.16 – 2.45) | 0.42 (−0.07 – 3.05) | 0.58 (−0.18 – 1.83) |
| 4 Units | 5.91 (4.13 – 6.37) | 5.80 (−1.29 – 6.15) | 6.02 (3.57 – 7.73) |
Data: median mmHg (IQR). *: dLVEDP significantly different within group. ‡dLVEDP significantly different compared to 2 units. †dLVEDP significantly different compared to 4 units.
Conclusion: This is the first animal transfusion model investigating the effect transfusion speed on pulmonary hydrostatic pressure, the key feature of TACO. A strong dose‐dependent effect of transfusion volume on pulmonary hydrostatic pressure was found. While higher transfusion speed showed a trend towards higher pressures, it was not significant in this model. Future experiments in this model will allow testing of interventions and therapeutic strategies to prevent TACO.
TS3‐MN3‐22
Improving the Sensitivity of Blood Product Culture to Detect Septic Transfusion Reactions in Adult Patients
Nancy M. Dunbar*1, Claudia S. Cohn2, Magali J. Fontaine3, Isabella Martin1, Andrew W.Y. Shih4, Meghan Delaney5 and Biomedical Excellence for Safer Transfusion (BEST) Collaborative1
1Dartmouth‐Hitchcock Medical Center, 2University of Minnesota, 3University of Maryland School of Medicine, 4University of British Columbia, 5Children's National Health System
Background/Case Studies: Culture of residual components can detect septic transfusion reactions (STR). According to AABB criteria, signs/symptoms suggestive of STR include 1) fever (>/=38C with a rise >/ = to 1C) PLUS any of the following: rigors, hypotension, shock, tachycardia, dyspnea and/or nausea/vomiting –OR‐ 2) isolated hypotension. Limitations of these criteria include that hypotension and tachycardia are undefined, fever may occur in the absence of other signs/symptoms, and fever may not occur in patients pre‐medicated with antipyretics. The goal of this project was to develop improved criteria for detection of STR by culture of residual product in adult patients.
Study Design/Method: We collected retrospective data for all transfusion reactions in adults ( > 15 years) that resulted in culture of the residual product during calendar year 2016. We also collected the same data for any reactions with positive residual product culture results from 2012‐2015, to enrich the dataset for positive results. We modified AABB criteria to define hypotension as systolic blood pressure </ = 90 mmHg and/or diastolic blood pressure </ = 60 mmHg –AND‐ decrease of 15% from baseline; and tachycardia as > / = 100bpm –AND‐ 15% increase from baseline. We also modified recommendations to culture when the fever was >/=39C in the absence of any other signs/symptoms or in the absence of fever when the patient was pre‐medicated with an anti‐pyretic and other signs/symptoms were present. We retrospectively determined the sensitivity and specificity of these modified criteria for the detection of positive cultures of residual components based on culture results.
Results/Finding: 22 institutions submitted complete reaction data for 807 cultured residual components, 64 of which had positive culture results. Six were considered definite STR (patient cultures grew the same organism); 58 were considered possible STR (patient culture was negative, discordant, or the patient was not cultured). Performance of modified criteria compared to AABB criteria is shown in the table. Modified criteria identified all definite STR, while AABB criteria would have missed one. More cultured reactions were consistent with the modified criteria than with the AABB criteria.
Conclusion: Modified criteria for culturing residual components for suspected STR in adult patients offer better sensitivity for detection of a positive culture result but are less specific.
(TS3‐MN3‐22)
| AABB | MODIFIED | |
|---|---|---|
| Meets Criteria for Culture | 296 (37% of reactions) | 413 (51% of reactions) |
| Positive Culture (N=64) | 27 (42% of positives) | 44 (69% of positives) |
| Definite STR (N=6) | 5 (83%) | 6 (100%) |
| Possible STR (N=58) | 22 (38%) | 38 (66%) |
| Sensitivity | 42% (95% CI: 30‐55%) | 69% (95% CI: 56‐79%) |
| Specificity | 64% (95% CI: 60‐67%) | 50% (95% CI: 47‐54%) |
TS19‐MN3‐22
Low Rate of Patient Culturing in Possible Septic Transfusion Reactions
Isabella Martin*1, Claudia S. Cohn2, Meghan Delaney3, Nancy M. Dunbar1, Magali J. Fontaine4, Andrew W.Y. Shih5,6 and Biomedical Excellence for Safer Transfusion (BEST) Collaborative1
1Dartmouth‐Hitchcock Medical Center, 2University of Minnesota, 3Children's National Health System, 4University of Maryland School of Medicine, 5Vancouver Coastal Health Authority, 6University of British Columbia
Background/Case Studies: When a septic transfusion reaction (STR) is suspected, AABB Bulletin 14‐04 recommends testing the returned product for bacterial contamination as well as drawing blood samples from the patient for culturing. Growing the same bacterial species from these two sources supports a diagnosis of STR. However, patient blood cultures can be negative in the setting of a true STR if the patient is on antibiotic therapy at the time of transfusion. This multicenter, retrospective, international study describes 1) the rate of patient culturing in the setting of product culturing and 2) organisms detected from these cultures.
Study Design/Method: We collected data for all transfusion reactions with residual product culture during the calendar year 2016, including recipient demographic data, type of product implicated, and patient and/or product culture results. The data set was additionally enriched with all cases from 2012‐2015 where product culture was positive. Imputability of the clinical significance of a positive product culture was defined as “definite STR” if the patient culture grew the same organism and “possible STR” if patient was not cultured or if the culture 1) was negative or 2) grew a different organism from the product.
Results/Finding: Out of 1,174 transfusion reactions with product culture at 22 institutions, only 449 (38%) patients were concurrently cultured. Eighty‐eight (7%) product cultures grew a bacterial organism. Of those positive product cultures, 13/88 (15%) had concordant patient cultures (“definite” imputability). The organisms implicated were either members of the skin microbiota (8/13) such as Staphylococcus spp. or of the gastrointestinal tract (5/13) such as Escherichia coli. In 6/88 (7%) cases, patient blood culture grew a non‐concordant organism (Table) and in 46/88 (52%) cases patient cultures were negative (“possible” imputability). In the remaining 23/88 (26%) cases, the patient was not cultured (unable to assess imputability).
Conclusion: A minority of patients had concurrent blood cultures obtained when a residual product was cultured during the workup for STR. Imputability therefore could not be assigned in 26% of positive product cultures. Isolation of the same bacterial species from the patient and the product allowed for assignment of “definite” imputability in 15% of cases with positive product culture. If transfusion reaction signs and symptoms warrant culture of the residual product, a patient blood culture should be collected concurrently to aid in interpreting product culture results.
(TS19‐MN3‐22)
| Product Culture | Patient Culture | |
|---|---|---|
| 1 | Proprionibacterium spp. | Group G Streptococcus |
| 2 | Coagulase‐negative Staphylococcus (CNS) | E. coli |
| 3 | CNS | Enterococcus faecalis |
| 4 | Corynebacterium spp. | CNS |
| 5 | CNS | E. coli |
| 6 | CNS | E. coli |
TS22‐MN3‐22
Marked Variation in Culturing for Septic Transfusion Reactions: Opportunity for Practice Standardization
Andrew W.Y. Shih*1,2, Meghan Delaney3, Nancy M. Dunbar4, Magali J. Fontaine5, Isabella Martin4 and Claudia S. Cohn6
1University of British Columbia, 2Vancouver Coastal Health Authority, 3Children's National Health System, 4Dartmouth‐Hitchcock Medical Center, 5University of Maryland School of Medicine, 6University of Minnesota
Background/Case Studies: Transfusion of blood components contaminated with bacteria may result in septic transfusion reactions (STRs), which can result in morbidity and/or mortality for the transfusion recipient. Culturing the residual component after a suspected STR is important as it may guide management of patients and co‐components. Although guidelines exist for when to culture residual component in setting of suspected STR, current practices are unknown. The aim of this project was to measure reaction reporting and residual component culturing rates and assess institutional policies for detection of STR by culture of residual components.
Study Design/Method: We retrospectively collected data for the total number of transfusions, transfusion reactions reported, and cultured residual components for all transfusion reactions in calendar year 2016; stratified by implicated component type: red blood cells (RBCs), plasma, and platelets (PLTs). To contextualize this data, a survey was distributed to all study participants to assess institutional policies for investigating STRs.
Results/Finding: Data and survey responses were received from 20 centers encompassing 730,006 transfusions, 3,151 reported reactions, and 1,005 cultured reactions. There was marked variation in reaction reporting (0.1‐1.3%) and culturing rates (0.0‐100.0%) across centers. Although reaction reporting rates were lower for plasma when compared to PLTs and RBCs (p<0.0001), no difference in reaction culture rates by component type were observed (Table).
Survey results demonstrated marked variation in institutional culturing policies. The majority (13/20; 65%) of centers do not use published criteria for culturing STRs. Some centers allow culturing of residual units without medical director approval (7/20; 35%) and have no formal review process to trigger STR investigation (5/20; 25%). Centers that reported a historically clinically relevant STR had overall higher reaction culture rates (55.1% vs 18.3%; p<0.0001), suggesting recall bias may be a driver for increased culturing.
Conclusion: There is marked variation in institutional practices surrounding culturing residual components to detect STRs. Historically reported clinically relevant STR appears to result in higher culture rates. There is opportunity for practice standardization.
(TS22‐MN3‐22)
| Transfusion Reaction Reporting Rate | Transfusion Reaction Culturing Rate | |||
|---|---|---|---|---|
| Implicated Product | % Mean (Range, SD) | p value (relative to PLTs) | % Mean (Range, SD) | p value (relative to PLTs) |
| RBCs | 0.5 (0.1‐1.5, 0.4) | 0.14 | 30.7 (0.0‐100.0, 31.7) | 0.83 |
| PLTs | 0.7% (0.1‐2.0, 0.5) | Reference | 32.8 (0.0‐100.0, 30.9) | Reference |
| Plasma | 0.2% (0.0‐0.5, 0.1) | < 0.0001 | 19.6 (0.0‐100.0, 27.3) | 0.15 |
TS23‐MN3‐22
Transfusion‐Associated Circulatory Overload – Understanding the Pathogenesis
Robert Klanderman*1,2, Joachim Bosboom3, Marije Wijnberge1,3, Adrie Maas2, Margreeth Vroom1, Nicole Juffermans1,2, Markus Hollmann2,3, Bart Geerts3 and Alexander Vlaar1,2
1Department of Intensive Care Medicine, Academic Medical Center, 2Laboratory for Experimental Intensive Care and Anesthesiology, Academic Medical Center, 3Department of Anesthesiology, Academic Medical Center
Background/Case Studies: Transfusion‐associated circulatory overload (TACO) is one of the leading causes of transfusion‐related morbidity and mortality. By definition, TACO is caused by hydrostatic pulmonary edema due to circulatory overload. The exact pathophysiology however is unclear, as up to 50% of cases occur after only 1 transfused unit. To date no animal models have been able to induce TACO, since healthy hearts are able to deal with large infused volumes. We hypothesized underlying volume incompliance, e.g. cardiac dysfunction, and subsequent transfusion causes TACO. Our aim was to induce TACO in an animal model and investigate the pathophysiology.
Study Design/Method: A ‘two‐hit’ TACO model was developed using Lewis rats. Under general anesthesia, the left‐ventricle was catheterized. Using colloids, 25% of circulating volume was replaced to induce isovolemic anemia. A large myocardial infarction was induced through ligation of the left‐anterior descending coronary artery (‘first‐hit’). Rats were randomized (n=3 per group) to receive 2 or 4 units of RBCs prepared from donor rats or similar volume of lactated ringers (LR) over 30 minutes (‘second‐hit’). Animals were followed for 1‐hour post‐transfusion. Primary outcome was left‐ventricular end‐diastolic pressure (LVEDP) – gold standard for measuring increased pulmonary capillary pressure (hallmark of TACO). Secondary outcome was lung water‐content.
Results/Finding: Baseline hemodynamics were similar between groups and LVEDP was 9.2 mmHg (IQR: 8.0 – 12.2). A large increase in LVEDP (Table 1.) was seen directly after infusion of 4 RBCs but not with LR (p<0.05). Post‐transfusion LVEDP dissipated more rapidly in the fluid infusion group at 30 and 60 minutes (p<0.05) but was not significant anymore after 1‐hour. Lung water‐content did not differ between groups.
TABLE 1 (TS23‐MN3‐22) Difference in LVEDP between RBCs and LR.
| Units (n=): | Change in LVEDP (mmHg): | ||
|---|---|---|---|
| LR | RBC | ||
| Pre‐ vs. post‐trx | 2 | −0.73 (−2.63 – 1.64) | 0.58 (0.20 – 1.83) |
| 4 | 1.17 (0.00 – 1.41) | 6.02 (4.80 – 7.70)* | |
| Pre‐ trx vs. 30 min post−trx | 2 | −3.93 (−4.02 – −1.96) | −0.76 (−1.01 – −0.51) |
| 4 | −4.27 (−4.84 – −2.74) | 2.69 (1.85 – 3.35)* | |
| Pre−trx vs. 1−hour post−trx | 2 | −5.14 (−5.65 – −2.64) | −0.77 (−1.53 – −0.77) |
| 4 | −5.30 (−5.73 – −2.63) | 0.01 (−0.36 – 2.22) | |
Data: median (IQR). *: p<0.05 compared to LR group. trx: Transfusion
Conclusion: In this ‘two‐hit’ model of anemic rats with underlying cardiac dysfunction, blood but not fluid infusion increased pulmonary capillary pressure. This TACO model is the first to compare fluids to blood products and measure both direct pulmonary capillary pressure and pulmonary edema. Blood transfusion has a profoundly different effect on capillary pressure in the lungs, the study is currently underpowered to detect differences in pulmonary edema however inclusion is ongoing. This data suggests TACO pathophysiology is more than solely fluid overload.
TS24‐MN3‐22
Classification Tree Algorithms to Identify Patients at Risk for Transfusion‐Associated Circulatory Overload
Nareg Roubinian*1, Dhuly Chowdhury2, Darrell Triulzi3, Jeanne Hendrickson4, Jerome Gottschall5, Mars Stone1, Daryl J. Kor6, Mark R. Looney7, Michael Matthay8, Donald Brambilla2, Steve Kleinman9 and Edward Murphy10
1Blood Systems Research Institute, 2RTI International, 3The Institute for Transfusion Medicine, 4Yale University, 5BloodCenter of Wisconsin, 6Mayo Clinic, 7UCSF, 8University of California at San Francisco, 9AABB, 10Blood Centers of the Pacific‐Irwin Center
Background/Case Studies: Transfusion‐associated circulatory overload (TACO) is a common and often severe adverse reaction of blood transfusion associated with increased morbidity and mortality. We sought to develop a predictive algorithm which would use pre‐transfusion patient characteristics to identify patients at high risk for developing TACO before they are transfused.
Study Design/Method: A case control study at four academic hospitals utilized active surveillance to enroll cases of TACO as well as matched transfused controls without pulmonary edema. A measure of cardiac stress, N‐terminal pro‐brain natriuretic peptide (NT‐proBNP), was measured in cases of TACO and controls prior to and following transfusion. Case detection algorithms to identify patients at the highest risk of TACO were developed using classification and regression tree (CART) analyses. We evaluated approximately 50 pre‐transfusion risk factors and produced a ranking of 7 most important predictors in order of their relative importance for predicting TACO. Algorithm performance was evaluated using 10‐fold cross‐validation with misclassification error rates, average square error (ASE), sensitivity and specificity. Receiver operating characteristics curve analyses were used to determine the accuracy of pre‐transfusion clinical predictors in differentiating TACO from controls.
Results/Finding: The most informative determinants for cases of TACO (n=200) versus control status (n=405) were: pre‐transfusion SpO2/FiO2 (SF) ratio, NT‐proBNP level, hospital setting, history of hypertension, elevated systolic blood pressure, respiratory rate, and pre‐transfusion hemoglobin level > than 7 g/dL. Patients with pre‐transfusion SF ratios less than 450, NT‐proBNP levels greater than 1060, and OR/PACU, emergency department, or procedural suite settings had the highest probability of developing TACO (86%). Patients with pre‐transfusion SF ratio greater than 450 and respiratory rate less than 16 had the lowest probability of developing TACO (5%). Algorithm performance had excellent discrimination for TACO (n=200) vs. control (n=405) with the area under the curve = 0.83. CART analysis achieved a misclassification rate of 21%, an ASE of 15%, a sensitivity of 63%, and a specificity of 85%.
Conclusion: A CART‐based screening algorithm differentiated cases of TACO from transfused controls using only pre‐transfusion clinical data in a case‐control setting. Classification tree algorithms may improve identification of patients at risk for developing TACO. Prospective studies are needed to assess the utility of real‐time predictive algorithms plus clinical interventions in preventing TACO in a large‐scale hospitalized patient cohort.
Oral Abstract Session: Transfusion Testing & Hemovigilance
TS9‐MN3‐23
Acute Hemolytic Transfusion Reactions in Massachusetts, 2015‐2017
Melissa Cumming*1, Christina Brandeburg1, Alexandra DeJesus1, Michele Herman2, Lynne O'Hearn3, Lynne Uhl2, Chester Andrzejewski4 and Karen Quillen5
1Massachusetts Department of Public Health, 2Beth Israel Deaconess Medical Center, 3Baystate Medical Center, 4Baystate Health / Baystate Medical Center, 5Boston Medical Center
Background/Case Studies: Mandatory reporting of adverse reactions and monthly transfusion activity to the National Healthcare Safety Network (NHSN) has been in place in Massachusetts since June, 2014. Here we report incidence and mechanism of acute hemolytic transfusion reactions (AHTR) over a three‐year period.
Study Design/Method: AHTRs reported from 2015‐2017, that met NHSN case definition and imputability criteria of definite, possible, or probable were included from 70 facilities. We analyzed and categorized reaction mechanism, immune versus non‐immune, severity, implicated blood component, recipient characteristics, and transfused component ABO/Rh type using SAS 9.3. Rates were calculated per 10,000 units transfused.
Results/Finding: 35 AHTRs were reported with a mean of 11.7/year. The rate was 0.32 per 10,000 units transfused (all product types) or approximately 1 in 31,000. The majority of AHTRs, 91% (32/35) were reported by larger facilities ( ≥ 300 beds) where the rate was 0.40 per 10,000 units transfused compared to 0.10 per 10,000 units transfused for facilities with < 300 beds. Immune mechanisms accounted for 83% (29/35) of AHTRs. ABO antibodies were responsible for 41% (12/29) of immune AHTRs; 9 of which involved group O apheresis platelets (without platelet additive solution) transfused to group A (or AB) recipients. The incidence of AHTR in platelet transfusions was 0.63 per 10,000 platelet units or approximately 1 in 15,000. The other 3 ABO AHTR cases involved red blood cell (RBC) transfusions to an ABO‐incompatible stem cell transplant recipient, an A2 subgroup patient, and one case of erroneous ABO‐incompatible RBC unit (group AB) transfusion to a surgery patient (group A). Autoantibodies accounted for 28% (8/29) of immune AHTRs; 7/8 of these cases involved warm autoantibodies. Alloantibodies (2 cases each of anti‐C and anti‐Fy(a), 1 case each of anti‐Le(a), anti‐e, anti‐E, anti‐D, and anti‐K) accounted for the remainder of immune AHTRs. The incidence of AHTR in RBC transfusion was 0.35 per 10,000 RBCs or approximately 1 in 28,000. Although 26% (9/35) of reactions were categorized as severe, only one reaction was noted to have major long‐term sequelae. That case involved a patient who required massive transfusion with 6 pre‐existing alloantibodies (anti‐E, c, K, Fy3, s, and N).
Conclusion: Group O apheresis platelets transfused to group A (or AB) recipients represented the largest category of immune AHTRs over the three‐year period, followed by autoantibodies implicated in red blood cell transfusions. Hemovigilance reporting using NHSN allows for standardized, reaction‐specific analysis over time, and can identify opportunities for improvement. These findings are reassuring that AHTRs are rare in Massachusetts.
TS13‐MN3‐23
Transfusion‐Associated Circulatory Overload in Massachusetts, 2015‐2017
Melissa Cumming*1, Christina Brandeburg1, Alexandra DeJesus1, Michele Herman2, Lynne O'Hearn3, Lynne Uhl2, Karen Quillen4 and Chester Andrzejewski5
1Massachusetts Department of Public Health, 2Beth Israel Deaconess Medical Center, 3Baystate Medical Center, 4Boston Medical Center, 5Baystate Health / Baystate Medical Center
Background/Case Studies: Massachusetts blood banks have been required by the Massachusetts Department of Public Health (MDPH) to submit monthly transfusion activity and adverse reaction data to the National Healthcare Safety Network (NHSN) Hemovigilance Module since June, 2014. Such standardized statewide data collection allows for more comprehensive analyses, including the potential to generate local benchmarks. Transfusion‐Associated Circulatory Overload (TACO) is currently of interest due to international discussions of proposed modifications to the current surveillance case definition. As a result of perceived local increase in TACO incidence, we examined data submitted involving TACO and report the findings here.
Study Design/Method: TACO reactions (2015‐2017) meeting the NHSN case definition and imputability criteria of possible, probable, or definite from 70 facilities, were included. We analyzed by age, gender, product received, transfusion indication, hospital bed size, and selected clinical criteria using SAS 9.3. Rates were calculated per 10,000 units transfused.
Results/Finding: 205 TACO reactions were reported with a mean of 68.3/year. Of these, 107(52%) were in females, 45(22%) were aged 50‐59, and 51(25%) were aged 70‐79 years. Notably, two were aged ≤ 18. Facilities with ≥ 300 beds reported 160(78%) TACO reactions, 23(11%) occurred in those with 100‐299 beds, and 22(11%) in those with < 100 beds. The rate of TACO per 10,000 units transfused was 5.14 in facilities with < 100 beds, 0.88 in those with 100‐299 beds and 2.01 in those with ≥ 300 beds. Indication for transfusion was documented for 124/205(60%), with “medical” 44% (n=54) being most frequent followed by malignancy 17% (n=21), internal bleeding 13% (n=16), hematologic disorder 10% (n=12), and surgery 8% (n=10). Seasonal variation was observed with the lowest incidence of TACO occurring in June and July. The rate of TACO increased from 1.64 to 2.08/10,000 units transfused over the study period. The three‐year TACO rates per 10,000 units transfused by product type were 1.09 for plasma, 1.54 for platelets and the highest was 2.00 for RBCs.
Conclusion: A modest increase in TACO was observed over the three‐year period, as well as a bi‐modal age distribution among cases. The seasonal variation and higher rate among smaller facilities provides guidance to target awareness and potential interventions. Limitations include a lack of external data validation and the possibility of inconsistent case definition interpretation and application. This study demonstrates the utility of NHSN for trend identification and selected reaction analysis and targeting of transfusion safety efforts.
TS15‐MN3‐23
Transfusion of Incorrect Blood Components (IBCT) Reported to the Norwegian Hemovigilance System
Aurora Espinosa*, Øystein Flesland and Christine Torsvik Steinsvåg
The Norwegian Directorate of Health
Background/Case Studies: The Norwegian hemovigilance system was implemented in 2004 as a voluntary reporting system, becoming mandatory for serious adverse events in 2007. In the Norwegian hemovigilance system, IBCT has been reported as a transfusion complication, even when the patient did not experience any symptoms.
Study Design/Method: IBCT is defined as the transfusion of a blood component intended for another patient or the transfusion of a blood component which does not comply with the specified requirements. Clinical reactions and severity, as well as the cause of the errors were registered, including errors in ordering of the blood component, selection and issuing, labeling, testing and bedside patient identification.
Results/Finding: In the period 2004–15 the Norwegian hemovigilance system received 240 cases of IBCT, including 104 cases of blood component transfused to the wrong patient and 132 cases of blood component not meeting the specified requirements. In four additional cases, the blood component both failed to meet the expected requirements and was transfused to the wrong patient. Examples of non‐conformities regarding lack of specified requirements of the blood component are lack of irradiation when required and transfusion of incompatible red cells in the presence of previously identified red cell antibodies. Thirty‐five of the reported IBCT occurred in patients under the age of twenty. In 28 of these cases the transfused blood component did not meet specified requirements. In more than 50 % of the total number of cases there were multiple errors. There were 26 reports on hemolytic transfusion reactions caused by IBCT, twenty of them ABO incompatibility cases and six cases caused by incompatibility in other blood group systems than ABO, even if the antibody was known prior to the transfusion. Nine of the ABO‐incompatible blood transfusions were less severe reactions, ten were serious or life‐threatening and three were fatal. Two patients with known anti‐IgA had an anaphylactic reaction after the transfusion of a red blood cell concentrate. Most of the patients receiving an incorrect blood component had no adverse reaction. Errors were most frequently related to ordering of blood components by the clinical departments, selection and issuing of blood components by the blood bank and to inadequate bedside patient identification prior to the transfusion. One can assume that in all cases where the patient received a blood component intended for another patient, the bedside patient identity control was not performed according to the local guidelines.
Conclusion: Errors occur in all areas of the transfusion chain and in a high number of cases multiple errors are made. Most cases of blood components transfused to the wrong patient could have been prevented if adequate bedside patient identification had been performed. The main cause leading to IBCT are errors regarding ordering of blood products and inadequate bedside patient identification. In patients under the age of twenty the main cause for IBCT is transfusion of a blood component not meeting the specified requirements especially irradiation. The Norwegian hemovigilance system has strongly recommended the use of electronic patient identification before transfusion to reduce the number of transfusions of a blood component intended for another patient, but only a few hospitals in Norway have implemented such a system.
TS20‐MN3‐23
Weak D Testing and Rh Immune Globulin Management in Mothers and Newborns: A Blinded Specimen‐Testing Survey of 81 Transfusion Services
Glenn Ramsey*1, Yara A. Park2, Meghan Delaney3,4, Lamont Thomas5, Rhona Souers5 and CAP Transfusion Medicine Resource Committee5
1Northwestern University, 2University of North Carolina, 3Children's National Health System, 4George Washington University, 5College of American Pathologists
Background/Case Studies: An interdisciplinary task force recommended that obstetric (OB) patients with RhD agglutination results graded as ≤2 + should be managed as RhD‐negative (neg) unless weak D (WKD) genotyping confirms they are WKD type 1, 2 or 3 in which case they can be managed as RhD + (Transfusion 55:680, 2015). We devised an educational survey with WKD RBC samples to benchmark current practices for WKD testing and RhIG management.
Study Design/Method: Participating laboratories received two unknown (blinded) 5% RBC suspensions with two case histories: 1) a mother‐to‐be and then mother of an RhD + baby (“mother”); 2) a newborn baby from an RhD‐neg mother (“baby”). Both samples were created from the same WKD blood donor. Participating laboratories were instructed to use their routine RhD tube typing methods for both samples. Participants provided their serological reactions; RhD type interpretations; RhIG recommendations; fetomaternal hemorrhage (FMH) screening methods; and facility RHD genotyping experience in WKD mothers. Comparisons between centers’ responses utilized Fisher's two‐tailed exact test
Results/Finding: Results from 81 mainly US labs with OB services were analyzed. For the “mother”: 1) 84% of labs would have given RhIG (Table); 2) labs with immediate‐spin‐positive (IS+) anti‐D reactivity were less likely to give RhIG than labs with negative IS (68% v 89%, p=0.04); and 3) labs which performed antiglobulin testing (AGT) after IS‐neg results were less likely to give RhIG (69% vs 98%, p<0.01). The 4 anti‐D reagents yielded different IS + rates (p=0.02). For the “baby” 34/74 labs (46%) would do fetal rosette testing (FRT) for excess FMH in their mothers, including 25/53 (47%) for babies typed as IS‐neg AGT+. Labs used diverse verbiage for Rh reports: D neg, WKD, RhD indeterminate, Du or D+. In 44/73 (60%) of responding labs, RHD genotyping was done in selected or all WKD + OB cases.
Conclusion: Participants obtained a broad range of RhD typing reactions for WKD RBCs, influenced by anti‐D reagents, which affected the use of RhIG. FRT can miss excess FMH from WKD babies, but 46% of labs would have used it. A confusing array of terminology was used for reporting WKD types.
(TS20‐MN3‐23)
| RhD Serology and RhIG Therapy (Rx) | Reagent Serology and RhIG | ||||||||
|---|---|---|---|---|---|---|---|---|---|
| Results | Mother RhIG Rx/all | Baby Mom RhIG Rx/all | Vendor | Mother IS pos/all | Mother RhIG Rx/all | ||||
| IS neg, no AGT | 40/41 | 98% | 3/3 | 100% | Alba | 2/6 | 33% | 3/6 | 50% |
| IS neg, AGT neg | 0 | 0/3 | 0% | Bio‐Rad | 5/16 | 31% | 16/16 | 100% | |
| IS neg, AGT+ | 11/16 | 69% | 53/54 | 98% | Immucor | 15/37 | 41% | 27/36 | 75% |
| All IS negative | 51/57 | 89% | 56/60 | 93% | Ortho | 1/21 | 5% | 19/20 | 95% |
| IS wk‐2+, AGT+ | 9/11 | 82% | 12/12 | 100% | Other | 0/1 | 0% | 1/1 | 100% |
| IS wk‐2+, no AGT | 6/9 | 67% | 6/7 | 86% | Total | 23/81 | 28% | 66/79 | 84% |
| IS ≥ 3+, no AGT | 0/2 | 0% | 0 | ||||||
| All IS positive | 15/22 | 68% | 18/19 | 95% | |||||
| Total | 66/79 | 84% | 74/79 | 94% | |||||
TS21‐MN3‐23
It's Complicated: Multiplicity and Uncertainty in Respiratory Transfusion Reaction Conclusions
Christine Cserti‐Gazdewich*1, Reda Siddiqui1, Alioska Escorcia1, Farzana Tasmin1, Lani Lieberman1, Jacob Pendergrast1, Yulia Lin2 and Jeannie Callum2
1University Health Network, 2Sunnybrook Health Sciences Centre
Background/Case Studies: Each transfusion entails the risk of an acute disturbance, be it febrile (F), allergic (A), and/or cardiorespiratory (C) at presentation. Although the overall odds of transfusion reactions (TR) are low and most are minor, respiratory transfusion reactions (RTRs) are likelier to be severe, and are the leading cause of transfusion‐related morbidity and mortality. RTRs may be cardiogenic (transfusion‐associated circulatory overload [TACO]) and/or non‐cardiogenic. The latter range from direct insults (transfusion‐related acute lung injury [TRALI], or allergic bronchopulmonary transfusion reaction [ABTR]), to indirect manifestations of other injuries (bacterial contamination, or acute hemolytic incompatibility). If criteria are not met for these harms, and underlying disease progression is not playing a role, then the diagnosis of exclusion is transfusion associated dyspnea (TAD). TRs, and RTRs in particular, can be challenging to investigate in patients with complex comorbidities, and in the working environment with its information gaps. The extent to which TR patients present with multiple disturbances, and the extent to which reviewers can reach conclusions more certain than merely “possible,” is of interest to measure in TR investigations, and especially in RTRs.
Study Design/Method: In the hemovigilance database of an academic adult healthcare institution (comprising 3 sites transfusing 55,000‐65,000 components/year), consecutive TR were retrospectively analyzed for mode of presentation (F/A/C), with multiple modes of presentation counted as a measure of complexity. Final conclusion(s) and respective conclusion‐specific certainty/imputability underwent review to gauge diagnostic confidence. RTRs were also analyzed for the number of conclusions reached per case, and for the frequency of TACO, TRALI, ABTR, and TAD as a conclusion (and their respective certainties).
Results/Finding: Over 5 years (01/01/2013 ‐ 31/12/2017), 1691 TR were investigated by the transfusion laboratory team. Fever occurred in 764 cases, while RTR was noted in 346 (20.5%). Referrals with more than one disturbance (eg. F+C) occurred in 265 cases (15.7% of referrals). The provisional diagnosis in the TR referrals was ultimately no more certain than “possible” in 188 cases (11.1%). In RTRs, there were 451 conclusions reached, a value 30% greater than the number of referrals. When conclusions were stratified between those of low confidence [possible/cannot rule out] versus high confidence [probable or definite], the weight was low confidence‐skewed in most RTR categories (95/80 in TACO, 24/0 in TRALI, and 113/22 in TAD, versus 52/65 in ABTR, respectively). Overall, the ratio of low confidence to high confidence RTR conclusions was 1.7:1. TAD was coded 135 times, and was the commonest conclusion after TACO.
Conclusion: Overall, TRs present with more than one disturbance in >15% of referrals, while > 10% of TRs reach conclusions no better than “possible” for the likeliest (provisional) diagnosis. RTRs are comparatively more problematic, with more conclusions reached than there are cases, and the majority (>60%) of these conclusions being uncertain. Improved diagnostic approaches are needed in RTRs if the contemporary practice environment of an academic center is this limited in its capacity to generate more confident classifications in its hemovigilance effort.
TS26‐MN3‐23
Collecting Pretransfusion Samples Using Electronic Patient Identification Reduces Wrong Blood in Tube Errors
Richard M. Kaufman*1, Mark H. Yazer2, Anh Dinh3, Peter Flanagan4, Elisabetta Raspollini5, Claudia S. Cohn6, Nancy M. Dunbar7, Kathleen Selleng8, Alyssa Ziman9, Mark K. Fung10, Jed B. Gorlin11, Julie Staves12, Michael Murphy13 and Stacy Melanson14 on behalf of the BEST Collaborative7
1Department of Pathology, Brigham and Women's Hospital, 2Department of Pathology, University of Pittsburgh, 3Beth Israel Deaconess Medical Center, 4New Zealand Blood Service, 5Ospedale Maggiore Policlinico, 6University of Minnesota, 7Dartmouth‐Hitchcock Medical Center, 8Institute for Immunology and Transfusion Medicine, University Medicine Greifswald, 9Division of Transfusion Medicine, Department of Pathology and Laboratory Medicine, David Geffen School of Medicine at UCLA, 10University of Vermont Medical Center, 11Memorial Blood Centers, 12Oxford University Hospitals NHS Foundation Trust, 13John Radcliffe Hospital, 14Brigham and Women's Hospital
Background/Case Studies: Wrong Blood in Tube (WBIT) errors during pretransfusion sample collection can lead to ABO‐mismatched transfusions. Previously, WBIT errors have been reported in approximately 1 in 2000 blood bank samples. Electronic patient identification (ID) systems, e.g. bar code scanning patient wristbands before sample collection, have been developed to reduce phlebotomy errors. How electronic ID systems impact WBIT errors has not been systematically evaluated.
Study Design/Method: Blood bank sample numbers and WBIT errors were collected retrospectively at 14 hospitals in 5 countries from the years 2012‐17. WBIT errors were defined as cases in which the ABO type of a current sample failed to match the historic ABO type. WBIT rates were compared between sites using manual patient ID only (n = 11) versus sites using electronic patient ID (n = 3). WBIT rates were adjusted for the proportion of repeat samples at each site, and for “silent” WBIT errors by adjusting for ABO group distribution. Descriptive data was collected on individual WBIT cases.
Results/Finding: Among sites using manual patient ID for blood bank sample collection (sites 1‐11), 133 WBIT errors were identified among 1,392,734 samples, for an overall unadjusted WBIT rate of 1:10,471 (Table). Among sites using electronic ID (sites 12‐14), there were 10 WBIT errors out of 426,581 samples, for a significantly lower unadjusted WBIT rate of 1:42,658 (p < 0.0001). The overall adjusted WBIT rates for sites using manual patient ID versus electronic patient ID were 1:4330 and 1:17,116, respectively. Among sites using manual ID, most WBIT errors were caused by patient misidentification (54%) or failing to label the sample at the bedside (29%). Among sites using electronic ID, phlebotomy on patients not wearing wristbands was the most common cause of WBIT error.
Conclusion: Electronic patient ID systems reduce, but do not eliminate, blood bank sample WBIT errors. In this study, sites using electronic patient ID at the time of phlebotomy had an approximately four‐fold lower WBIT rate compared with sites using manual patient ID.
TABLE (TS26‐MN3‐23) WBIT error rates: manual versus electronic patient ID.
| Site | Country | Hospital type | Patient ID method | Samples (n) | WBIT errors (n) | Unadjusted WBIT rate | Adjusted WBIT rate |
|---|---|---|---|---|---|---|---|
| 1 | NZL | Community | Manual | 247,249 | 21 | 1:11,773 | 1:4752 |
| 2 | USA | Academic | Manual | 223,886 | 20 | 1:11,194 | 1:4116 |
| 3 | NZL | Community | Manual | 110,932 | 12 | 1:9244 | 1:3616 |
| 4 | USA | Academic | Manual | 26,067 | 9 | 1:2896 | 1:1287 |
| 5 | NZL | Community | Manual | 50,242 | 2 | 1:25,121 | 1:9673 |
| 6 | NZL | Community | Manual | 43,646 | 2 | 1:21,823 | 1:8945 |
| 7 | USA | Academic | Manual | 306,461 | 33 | 1:9286 | 1:4236 |
| 8 | ITA | Academic | Manual | 84,785 | 5 | 1:16,957 | 1:8315 |
| 9 | NZL | Community | Manual | 137,967 | 6 | 1:22,994 | 1:9568 |
| 10 | NZL | Community | Manual | 112,249 | 18 | 1:6236 | 1:2555 |
| 11 | GER | Academic | Manual | 49,250 | 5 | 1:9850 | 1:3677 |
| Manual Patient ID TOTAL: | 1,392,734 | 133 | 1:10,471 | 1:4330 | |||
| 12 | USA | Academic | Electronic | 84,507 | 1 | 1:84,507 | 1:34,330 |
| 13 | USA | Academic | Electronic | 198,198 | 4 | 1:49:549 | 1:20,591 |
| 14 | GBR | Academic | Electronic | 143,876 | 5 | 1:28,775 | 1:11,510 |
| Electronic Patient ID TOTAL: | 426,581 | 10 | 1:42,658 | 1:17,116 | |||
Oral Abstract Session: Transfusion Transmitted Infections
BBC9‐MN3‐24
Risk Assessment of Zika Virus Minipool Nucleic Acid Testing in Outbreak Scenarios
Hong Yang, Anne Eder*, Osman Yogurtcu, Caren Chancey and Richard Forshee
FDA/CBER
Background/Case Studies: Zika virus (ZIKV), a mosquito‐borne flavivirus, causes asymptomatic infections in blood donors and can be transmitted by transfusion. Blood centers in the U.S. and its territories have screened blood donations with universal individual donation nucleic acid test (ID NAT), starting in Puerto Rico in April 2016. The number of cases in U.S. states and territories peaked in 2016 with over 5,000 and 36,500 cases, respectively, but since has decreased dramatically. A mathematical model was used to evaluate a minipool nucleic acid test (MP NAT) screening strategy compared to ID NAT in detecting ZIKV infections during an outbreak comparable in size to the one in Puerto Rico in 2016.
Study Design/Method: We developed a computational model to simulate the outbreak in Puerto Rico in 2016, to determine number of the ZIKV‐reactive donations that would be detected by MP NAT compared to ID NAT. The model inputs include monthly reported number of ID NAT‐positive (IgM/IgG negative) units in Puerto Rico in 2016, the reported doubling time of ZIKV RNA in the blood of infected macaques, the lower detection limit of the ID NAT used during the Puerto Rico outbreak, and the estimated differential sensitivity of MP NAT based on reported sensitivity and dilution factor of ZIKV RNA in mini‐pools of 6 (MP6) or 16 (MP16) donations.
Results/Finding: The probability to detect the first ID NAT‐reactive unit in an outbreak is 92% (2.5‐95 percentile, 73%‐99%) by MP6; 87% (2.5‐95 percentile, 68%‐99%) by MP16. When one donation is detected by MP NAT, the model predicted that the probability of missing one or more ID NAT‐reactive donations is 5‐7%. The probability of missing a unit by MP NAT is constant over the course of the outbreak, at 8% for MP6 and 13% for MP16 (Table).
Conclusion: The model predicts that the probability that a candidate MP NAT will detect the first ID NAT‐reactive unit in an outbreak is about 90% and remains constant over the course of an outbreak.
(BBC9‐MN3‐24A) Simulation of Donations (%) Missed by MP NAT (2.5th – 97.5th percentile)
| Donation Date | ID NAT‐reactive donations (n) | MP6 | MP16 |
|---|---|---|---|
| April 2016 | 7 | 8.4 (0, 28.6) | 13.3 (0, 42.9) |
| May 2016 | 15 | 8.4 (0, 26.7) | 13.1 (0, 33.3) |
| June 2016 | 40 | 8.4 (0, 17.5) | 12.9 (2.5, 25) |
| July 2016 | 21 | 8.5 (0, 23.8) | 13.0 (0, 28.6) |
| August 2016 | 32 | 8.5 (0, 18.8) | 13.1 (3.1, 25) |
| Sep & Oct 2016 | 12 | 8.6 (0, 25) | 13.1 (0, 33.3) |
| Mean | 8.5 (0, 26.7) | 13.1 (0, 32.5) |
BBC8‐MN3‐24
Prevalence of Babesia DNA/RNA Positive Donors in US Endemic Areas
Laura Tonnetti*1, Melanie C. Proctor1, Vanessa Bres2, Jeffrey M. Linnen2 and Susan L. Stramer1
1American Red Cross, 2Grifols Diagnostic Solutions Inc.
Background/Case Studies: Babesia microti is an intraerythrocytic parasite endemic in the Northeast and upper Midwest US. The risk of transfusion‐transmitted babesiosis (TTB) is well established, with >200 cases reported. Recently, the FDA has approved two screening assays: an arrayed fluorescence immunoassay for antibody detection, and PCR for DNA detection. To mitigate the risk of TTB, blood screening has occurred in endemic areas under investigational testing protocols since 2012. Although most donations were also tested for antibody, here we summarize the results of blood screening by two investigational babesia nucleic acid tests (NAT) and present frequencies by state.
Study Design/Method: Blood donations obtained from CT, MA, MN and WI from June 2012 to December 2017 were screened by PCR for detection of B. microti DNA (Imugen). Donations collected from other New England and Mid‐Atlantic areas from June to November 2017, were screened using the Procleix Babesia assay, a qualitative in vitro NAT that detects ribosomal RNA from multiple babesia species using transcription‐mediated amplification (TMA). PCR/TMA reactivity was confirmed by antibody or repeat reactivity on the primary or alternate NAT assay at index or follow‐up. TTB cases were compared in screened vs unscreened blood to determine efficacy.
Results/Finding: Of 440,550 donation samples screened by PCR, 200 (0.05%) were positive, with 142 detected in CT, 46 in MA, and 6 each in MN and WI. TMA was performed on 61,503 samples, and 23 (0.04%) were detected. Donors with TMA‐positive results donated in ME, NH, NJ, NY and PA. Of the 200 PCR‐positive samples, 25 were antibody negative while all the 23 samples reactive by TMA were antibody positive. Data collected in CT and MA demonstrated a decline in reported TTB cases with screened vs unscreened blood (0/334,841 vs 23/1,086,747; respectively; OR 14.3; p=0.008).
TABLE (BBC8‐MN3‐24) Babesia nucleic acid prevalence
| NH* | ME* | NY* | PA* | NJ* | VT* | DE* | MD* | DC* | VA* | CT** | MA** | MN/WI** | |
|---|---|---|---|---|---|---|---|---|---|---|---|---|---|
| Tested | 6170 | 2885 | 13869 | 13461 | 9233 | 3550 | 167 | 8905 | 1036 | 2227 | 248164 | 86677 | 96341 |
| Positive | 2 | 3 | 4 | 6 | 8 | 0 | 0 | 0 | 0 | 0 | 142 | 46 | 12 |
| % Prevalence | 0.03 | 0.01 | 0.03 | 0.04 | 0.09 | 0 | 0 | 0 | 0 | 0 | 0.06 | 0.05 | 0.01 |
* Tested by TMA
** Tested by PCR
Conclusion: Babesia NAT demonstrated high prevalence rates in multiple states with previous reports of TTB. Blood donation screening in CT and MA has been associated with a significant reduction in TTB. Screening should be considered for all areas demonstrating on‐going risk due to positive donors or TTB cases.
BBC19‐MN3‐24
Detection of Babesia in US Blood Donors
June Sunga1, Patrick Albrecht2, John Duncan1, Sonia Bakkour3, Julie L. Cruz4, Yasuko Erickson5, Jerome Gottschall6, Todd Straus7, Jennifer Thebo8 and Lisa L. Pate*1
1Roche Molecular Systems, Inc., 2Roche Diagnostics International AG, 3Blood Systems Research Institute, 4Versiti, 5Mississippi Valley Regional Blood Center, 6BloodCenter of Wisconsin, 7Community Blood Center, Inc, 8Central Pennsylvania Alliance Laboratory
Background/Case Studies: Babesia, a protozoan parasite that infects red blood cells, is a leading infectious cause of mortality in transfusion recipients, as reported to FDA. Babesia is usually transmitted via ticks but may be transfusion transmitted (TTB) or from mother to child during pregnancy or delivery. Prospective testing of blood donations in endemic areas of the US revealed 0.32% of donors were positive for Babesia DNA or antibodies. The US FDA does not currently require donor screening for Babesia but plans to issue draft guidance in 2018 with recommendations to reduce TTB risk, including requirements for screening blood donations.
Study Design/Method: cobas ® Babesia for use on the cobas ® 6800/8800 Systems, is a highly‐sensitive qualitative polymerase chain reaction nucleic acid amplification test (PCR‐NAT), developed to detect in whole blood (WB) donor samples the 4 Babesia species that cause human disease: B. microti, B. duncani, B. divergens, and B. venatorum. The FDA approved use of the test under an Investigational New Drug Application. Testing began in October 2017. WB was collected into a proprietary medium that lysed the red blood cells and stabilized Babesia RNA and DNA. A minimum of 50,000 donations collected in states high, low, and non‐endemic for Babesia were screened as individual blood donor (IDT) samples. Reactive index donations were retested in simulated minipools of 6 (MP6), plus 3 additional IDT with cobas ® Babesia. Reactive index donations were also tested with 2 validated, alternate Babesia NAT and for Babesia IgM and IgG antibodies. Donors with reactive results were invited to enroll in a follow‐up study to test for additional evidence of infection.
Results/Finding: To date, 74,733 valid donations have been screened with cobas ® Babesia, and 5 (0.007%) were reactive. 4 were confirmed (Table 1). cobas ® Babesia shows overall specificity of 99.999% (74,728/74,729; 95% Exact CI: 99.993%‐100%).
TABLE 1 (BBC19‐MN3‐24) Summary of Results: Donations Initially Reactive on cobas® Babesia*
| Sample ID | Date Tested | cobas® Babesia | Alternative NAT | Serology | Follow‐up | ||||
|---|---|---|---|---|---|---|---|---|---|
| IDT | Simulated MP6 | Retest × 3 | BSRI | RMS | IgM | IgG | |||
| 1 | 11/20/17 | R | R | R‐R‐R | Positive | R | R | R | NAT R IgM R IgG R |
| 2 | 12/21/17 | R | R | R‐R‐R | Positive | R | NR | R | NAT R IgM NR IgG R |
| 3 | 1/11/18 | R | R | R‐R‐R | Positive | R | NR | R | NAT R IgM NR IgG R |
| 4 | 1/11/18 | R | NR | NR × 3 | Negative | NR | NR | NR | NAT NR IgM NR IgG NR |
| 5 | 3/8/18 | R | R | R‐R‐R | Positive | R | NR | R | N/A |
R, Reactive; NR, Non‐Reactive; N/A, Not applicable; NAT, nucleic acid amplification test; BSRI, Blood Systems Research Institute, San Francisco, CA; RMS, Roche Molecular Systems, Pleasanton, CA
* Results available to date
Conclusion: The cobas ® Babesia test successfully identified Babesia‐positive donations in late fall and winter of 2017‐2018, including 1 in a state where Babesia is not endemic. Screening with cobas ® Babesia continues in several laboratories. cobas ® Babesia is not FDA licensed or available commercially.
BBC2‐MN3‐24
Recently Acquired Hepatitis C Infections in US Blood Donors: Genotype and Geographic Distribution of NAT Yield Blood Donations across the Continental US
Roberta Bruhn*1, Eda Altan1, Claire Quiner1, Eric Delwart1, Sonia Bakkour1, Whitney Steele2, Ed P. Notari2, Rahima Fayed2, Valerie Winkelman3, Mars Stone1, Rita A. Reik4, Debra A. Kessler5, Phillip C. Williamson3, Steven Anderson6, Susan L. Stramer2, Michael P. Busch1 and Brian Custer1 for the Transfusion Transmissible Infections Monitoring System6
1Blood Systems Research Institute, 2American Red Cross, 3Creative Testing Solutions, 4OneBlood, Inc., 5New York Blood Center, 6US FDA, Center for Biologics Evaluation and Research
Background/Case Studies: Donors who are confirmed as having recently‐acquired hepatitis infections [HCV RNA‐positive but serology negative (NAT yields)] are of concern because recent risk exposures may not have been disclosed at the time of donation. NAT yield infections are also the most direct indication of the infections currently being acquired by donors. Recently, the Centers for Disease Control (CDC) have reported that acute HCV infection rates have risen dramatically since 2014. The objectives of this study are to determine the subgenotype distribution of recently acquired HCV infection, link these findings to available demo‐ and geographic data, and determine if rates of recent HCV infection are rising in blood donors as well.
Study Design/Method: Four large blood collection organizations provided plasma samples from index whole blood donations that had tested confirmed positive for HCV NAT but seronegative based on routine screening from the period 9/1/2015 – 7/31/2017. Nested PCR (± RT) was used for amplification of HCV RNA followed by bar‐code labelling and pooling of amplicons, next‐generation sequencing (NGS) and deconstruction of donor specific HCV sequences from the NGS reads. Viral sequences were analyzed to determine the phylogenetic clade/subtype using the Los Alamos National Laboratory Sequence Database. Associations between demographic and other donation characteristics, including geographic location based on Department of Health and Human Services (HHS) Region, were assessed comparing infection groups. Standard statistical tests were used to compare groups and p‐values < 0.05 were considered evidence of statistical significance.
Results/Finding: The HCV NAT yield rate in this large sample of blood donors representing 60% of the US supply was 0.63 per 100,000 (0.50,0.77 95% CI) donations. Of the 84 HCV NAT yields, 72 (86%) samples were available for sequence analysis during the study period. Of the 64 (89%) successfully sequenced samples, the frequency of HCV subgenotype was 1a>3a>2b>1b>4a. No demographic or donation factors were associated with HCV NAT yield subgenotype.
Conclusion: Our findings support the trends of stable 1a, decreasing 1b, and increasing 3a HCV prevalence rates in US blood donors, similar to blood donor data reported by Delwart et al (J Infect Dis. 2012 Mar 15;205(6):875‐85) and general population patient data reported by Xie et al (Lab Med. 2016 May;47(2):112‐8). Subtype 3a is particularly prevalent in individuals who inject drugs across Europe and the US.
(BBC2‐MN3‐24) HCV Subgenotype in NAT Yield Donations (9/1/15 – 7/31/2017)
| 1a n (%) | 1b n (%) | 2b n (%) | 3a n (%) | 4a n (%) | Total | |
|---|---|---|---|---|---|---|
| First‐time | 19 (49) | 2 (5) | 6 (15) | 12 (31) | ‐ | 39 |
| Repeat | 16 (64) | ‐ | 1 (4) | 6 (24) | 2 (8) | 25 |
BBC26‐MN3‐24
The Cost‐Effectiveness of Implementing Minipool Nucleic Acid Testing for Zika Virus
W Alton Russell*1, Susan L. Stramer2, Michael P. Busch3 and Brian Custer3
1Stanford University, 2American Red Cross, 3Blood Systems Research Institute
Background/Case Studies: The US implemented universal individual donation nucleic acid testing (ID‐NAT) for Zika virus (ZIKV) in 2016 and is moving to minipool testing (MP‐NAT) with triggers for ID‐NAT during outbreaks by late 2018. The cost‐effectiveness of these policies has not been studied.
Study Design/Method: A microsimulation model was developed to estimate the lifetime health consequences and societal costs that accrue for each year of screening under ID‐NAT, MP‐NAT, and with no screening in the context of the fifty United States and District of Columbia. Individual recipients’ blood component exposures were sampled from data. Zika‐related adverse health events experienced by transfusion recipients, sexual partners, and infants born to recipients or sexual partners were captured. The model was run while varying the ZIKV rate from 1 confirmed‐positive unit for every 1,000 blood units collected to 1 every 10 million. Estimate uncertainty was calculated using probabilistic sensitivity analysis. We assumed a willingness‐to‐pay threshold of $1 million per quality‐adjusted life year gained (QALY).
Results/Finding: We estimate that MP‐NAT is only cost‐effective in donor populations for which the ZIKV rate exceeds 1.3 positive units per thousand. Trigger strategies to ID‐NAT are cost‐effective in populations for which the ZIKV rate exceeds 7.7 per thousand. At a ZIKV rate of 1 per million, we estimate that transfusion‐transmission of ZIKV would result in one case of mild febrile illness every 5.8 months (95% CI 3.9 – 9.8 months), one case of Guillain‐Barre every 336 years (95% CI 250 – 476 years), and one case of congenital Zika syndrome every 694 years (95% CI 395 – 4642 years) with no screening. Estimates of these outcomes at various ZIKV rates are reported (Table).
Conclusion: At the peak of the Zika epidemic in the Americas, the ZIKV rate among donors in the fifty United States did not approach the threshold at which universal MP‐NAT or ID‐NAT would be considered cost‐effective at a threshold of $50K or even $1 million per QALY. Exclusively screening donor groups with higher expected ZIKV rates, such as donors with recent travel to or residence in an area experiencing autochthonous Zika transmission, may be cost‐effective. Evidence from this analysis should be considered alongside other risks and benefits.
(BBC26‐MN3‐24)
| ZIKV infection rate in donors | Mild febrile illness cases per year, no intervention (95% CI) | Guillain‐Barre cases per year, no intervention (95% CI) | Congenital Zika Syndrome cases per year, no intervention (95% CI) | MP‐NAT Cost‐Effectiveness $/QALY (95% CI) | ID‐NAT Incremental Cost‐Effectiveness $/QALY (95% CI) |
|---|---|---|---|---|---|
| 1 per 1,000 | 2055 (1245 – 3087) | 3.0 (2.1 – 4.0) | 1.4 (0.2 – 2.5) | $1,290,000 (380,000 – 4,480,000) | $8,180,000 (820,000 – 4,480,000) |
| 1 per 10,000 | 206 (123 – 306) | 0.3 (0.2 – 0.4) | 0.14 (0.02 – 0.26) | $13,460,000 (3,830,000 – 44,140,000) | $82,400,000 (8,060,000 – 406,440,000) |
| 1 per 100,000 | 21 (12 – 31) | 0.03 (0.02 – 0.04) | 0.014 (0.002 – 0.026) | $135,670,000 (39,320,000– 467,770,000) | $827,240,000 (87,810,000 ‐ 4,218,610,000) |
| 1 per 1,000,000 | 2.1 (1.2 – 3.1) | 0.003 (0.002 – 0.004) | 0.00144 (0.0002 – 0.0025) | $1,354,810,000 (385,680,000 – 4,324,700,000) | $8,257,820,000 (947,450,000 – 38,950,400,000) |
| 1 per 10,000,000 | 0.21 (0.12 – 0.31) | 0.0003 (0.0002 – 0.0004) | 0.00014 (0.00002 – 0.00026) | $13,581,840,000 (3,919,510,000 – 44,521,620,000) | $82,781,250,000 (9,721,090,000 – 401,072,780,000) |
BBC13‐MN3‐24
Genetic Variability of Zika Virus Isolated from U.S. Blood Donors, 2016
Andriyan Grinev*, Felipe Assis, Evgeniya Volkova, Emilia Sippert, Rafaelle Fares‐Gusmao, Suzan Ok, Bruno Rocha, Caren Chancey and Maria Rios
FDA/CBER
Background/Case Studies: Zika virus (ZIKV) is a Flavivirus related to Spondweni and Dengue viruses, spread by Aedes mosquitoes that can also be transmitted from human to human by sexual contact, from mother to fetus during pregnancy, and by blood transfusion. Most ZIKV infections are asymptomatic, but serious disease manifestations including neurological disorders and birth defects such as microcephaly, may occur. Zika disease became a threat to public health in the U.S. in 2016 when, in addition to travel‐related cases, local transmission was reported in the continental U.S. The U.S. blood supply has been screened for ZIKV RNA since 2016 using investigational and later, FDA‐licensed, nucleic acid tests (NAT). Mutations in the viral genome may potentially negatively affect ZIKV blood screening by causing mismatches between the viral sequence and primers/probes in detection by NAT. Therefore, this study aimed to analyze the genetic diversity of human ZIKV isolates from the U.S. in 2016 and Panama 2015.
Study Design/Method: Anonymized plasma samples were obtained from various blood collection facilities, and isolates were expanded by culture in Vero cells. Viral RNAs were purified from cell supernatants and sequenced using Sanger method. The complete ZIKV genome of 10 isolates collected during the 2016 epidemic in Puerto Rico and Florida were sequenced. In addition, we analyzed 3 clinical isolates from Panama, 2015. ZIKV sequences were aligned using Mega 7 software. The ZIKV genomes were also subjected to Bayesian and Maximum Likelihood phylogenetic analysis.
Results/Finding: Viral isolates from 10 blood donors collected in 2016 showed an average of 2.07% nucleotide divergence when compared with the ancestor Micronesia strain, 2007 (GenBank# EU545988). As usual among all flaviviruses, most nucleotide changes (>86%) were silent transitions (T↔C, A↔G). The number of nucleotide mutations ranged from 193 to 209 and resulted in 19 to 29 amino acid substitutions. Isolates from the same geographic location were genetically similar. Phylogenetically, ZIKV isolates from Florida clustered together with isolates from Honduras and Nicaragua, 2016. Isolates from Puerto Rico and Panama clustered with the Caribbean clade together with other isolates from Puerto Rico, Panama and Colombia, 2015‐2016.
Conclusion: The level of ZIKV genetic diversity observed in our study warrants further monitoring of ZIKV among the human population both to ensure suitability of the current licensed and investigational blood donor screening assays, and to determine whether ZIKV diversity may be associated with functional changes in the viral genes.
Oral Abstract Session: Immunomodulation Affecting Transfusion Outcomes
CTI7‐MN4‐32
Reinfusion Treatment of Baicalin‐Induced CD4+CXCR5+Foxp3+ Follicular Regulatory T Cells Could Relieve Lupus Nephritis in Mouse Model
Jie Yang*1, Ji Yang2 and Xue Yang3
1Shanghai Blood Center, 2Department of Dermatology, Zhongshan Hospital, 3Division of Rheumatology, Huashan Hospital
Background/Case Studies: CD4+CXCR5+Foxp3+ follicular regulatory T (Tfr) cells have been recently identified as a specialized subset of Foxp3+ regulatory T (Treg) cells, which locate in the germinal center (GC) and suppress follicular helper T (Tfh) cells, B cells and antibodies production. And Tfr cells play an important regulatory role in the pathogenesis of autoimmunity diseases like SLE. Additionally, Baicalin, which is a natural compound isolated from Chinese herb, has been reported to promote Foxp3 expression during the differentiation of Treg cells and ameliorate kidney inflammation in lupus‐prone MRL/lpr mice. Thus, it is speculated that Tfr cells plus Baicalin might be a promising cellular therapeutic approach for the treatment of antibody‐mediated autoimmune diseases. In this study, it was determined that Baicalin could effectively induced CXCR5+Tfr cells from Foxp3+Treg cells, and these Baicalin‐induced Tfr cells also could relieve lupus nephritis in mouse model.
Study Design/Method: In vitro, naive CD4+T cells were first purified from spleen of B6 mice, and stimulated by TGF‐β and Baicalin plus anti‐CD3/28 Abs and IL‐2, termed Baicalin‐induced Tfr cells. And the phenotype, proliferation, serious cytokines productions and suppression of Tfr cells were assessed. Meanwhile, 1 × 10⁶ Baicalin‐induced Tfr cells or vehicle‐induced Tfr cells were transferred i.v. into the MRl/lpr mice (12‐week) once a week, which were lasting 4 weeks, and control mice were treated with PBS. The 24‐hour urine protein were measured every week, and histopathologic test of kidney, anti‐ds‐DNA antibody titers and cytokines in serum and CD4+Th subsets in spleen were analyzed after mice were treated with Tfr cells for 4 weeks.
Results/Finding: After Baicalin induction 5 days in vitro, the percent of CXCR5+Foxp3+Tfr cells in CD4+T cells increased significantly from 0.74 ± 0.14% to 14.08 ± 0.54%, and up to 48.57 ± 2.93% of Treg cells showed CXCR5 positive and expressed high level of Bcl6, the key marker of Tfr cells. Baicalin could promote Tfr cell differentiation accompanied by inducing TGF‐β and IL‐10 production. Further, Baicalin‐induced Tfr cells could effectively inhibit Tfh cell proliferation, suppress IL‐21 secretion and induce Tfh cell apoptosis in vitro. To determine the suppressive function of Baicalin‐induced Tfr cells in vivo, the SLE mouse model were used. After 4‐week treatment, a more remarkable anti‐inflammatory activity, improved clinical renal scores and histological end‐points in kidney were found in the Baicalin‐induced‐Tfr‐treated group than those in the Tfr‐treated group. The treatment of Baicalin‐induced Tfr cells could significantly decrease anti‐ds‐DNA antibody titers in serum and reduce 24‐hour urine protein than Tfr cells treatment. Moreover, the transfusion of Baicalin‐induced Tfr cells resulted in a more obvious decrease in the percentage of CD4+CXCR5+PD‐1+Tfh cells and the lower level of IL‐21.
Conclusion: These results indicated that Tfr cells induced by Baicalin showed more effective suppression in vitro, and reduced more markedly the severity and progression of lupus nephritis than Tfr cells in SLE mouse model, which was associated with modulation of Tfh/Thr polarization and IL‐21 secretion in vivo. This study highlights that Baicalin might be an assistant stimulator for Tfr cells expansion, and Baicalin‐induced Tfr cells showed the potential therapeutic utility for lupus.
CTI6‐MN4‐32
Human Mesenchymal Stromal Cell Interactions with Innate Lymphoid Cells
Barbara A. Christy*1, Carolina Cantu1, Bijaya Parida2, Maryanne C. Herzig1, James A. Bynum1 and Andrew P. Cap1
1U.S. Army Institute of Surgical Research, 2RESTOR™ Program
Background/Case Studies: Mesenchymal stromal cells (MSCs) show promise for the treatment of trauma. Although their mechanism of action is not fully understood, MSCs possess properties which may limit post‐injury damage and promote healing (such as anti‐inflammatory/immune modulatory activity). MSCs can interact with and affect function of several immune cell types. In this study, we investigate interactions between MSCs and innate lymphoid cells (ILCs). ILCs are important rapid responders in infection and are likely to also be important in the response to trauma. Beyond the previously identified cytotoxic natural killer (NK) cells, several non‐cytotoxic subtypes have been described (ILC1, ILC2, ILC3). Different inflammatory/anti‐inflammatory functions are proposed for the subtypes; thus the subtype ratio is important and may change with injury and treatment. In light of interactions between MSCs and other immune cells, we propose that they interact with ILCs, and that interactions will alter the function of both cell types.
Study Design/Method: MSCs from commercial sources were used at early passage. Human peripheral blood mononuclear cells (PBMCs) were isolated from de‐identified human whole blood collected by the ISR Research Blood Bank under an approved standard operating procedure. ILC subtype identification was performed by flow cytometry. ILCs were enriched from whole blood using EasySep Human Pan‐ILC magnetic enrichment kit (StemCell Technologies). Co‐culture was performed in RPMI medium supplemented with 10% FBS for 2‐4 days. Non‐adherent cells were subjected to flow cytometry for identification of ILC subtypes.
Results/Finding: ILC subtype characterization in whole blood was performed on 8 individual donors. A high degree of variation between donors was observed. Magnetic enrichment of PBMCs increased the number of ILCs (11% of total events compared to 0.01% in unenriched PBMCs), allowing for more accurate ILC subtype characterization. When human PBMCs were cultured in the presence and absence of human adipose‐derived MSCs, differences in subtype distribution were observed at 4 days (25.5% ILC1, 42% ILC2 and 32.5% ILC3 for PBMCs alone compared with 53.5% ILC1, 23.8% ILC2 and 22.8% ILC3 for PBMCs co‐cultured with MSCs).
Conclusion: Based on the current study, we conclude that ILC1, ILC2 and ILC3 can be identified in whole human blood or PBMCs by flow cytometry. There is variability in the subset distribution between different donors. Enrichment of ILCs by magnetic separation allows greater accuracy for subtype identification by flow cytometry. MSCs influence ILC subtype distribution in co‐culture. Since different ILC subsets have different functions, the interplay between these two cell types could have meaningful effects on immunomodulation.
CBIB9‐MN4‐32
Molecular Characterizations of Anti‐ABO Blood Group Antibodies
Khoa Nguyen*1, Tho Pham1 and Scott Boyd2
1Stanford University School of Medicine, Department of Pathology, 2Stanford University
Background/Case Studies: Antibody response against carbohydrate antigens, specifically against the ABO blood group system, is an important foundational aspect in transfusion and transplantation medicine. We seek to molecularly define antibodies involved in ABO carbohydrate blood group recognition. We investigated antibody somatic hypermutation levels, isotype makeup, and clonality of anti‐ABO antibodies in healthy humans. We also assessed for the presence of stereotyped (convergent) antibodies expressed by different individuals.
Study Design/Method: Using fluorescently labeled ABO antigens, we performed FACS to identify B‐cells from healthy human peripheral blood with surface immunoglobulins specific for each blood group antigen. Once bulk‐sorted, we performed high‐throughput DNA sequencing of the rearranged immunoglobulin heavy chain VDJ locus to characterize the ABO‐specific antibody sequences. The sequences were then parsed and analyzed for specific antibody characteristics such as IGHV usage, CDR3 sequence, and IGHV mutation rate.
Results/Finding: We discovered ABO‐specific B‐cells to comprise hundreds of clones, express all isotypes, and do not show evidence of IGHV gene restriction. The isotype make‐up for anti‐ABO antibodies comprise approximately 30% IgM, 30% IgD, 16% IgG, 14% IgA, and 10% IgE among the general population. The anti‐ABO antibody response also appears to be polyclonal within individuals; for example, there is an average of 6177 anti‐A antibody clones per group O person. Interestingly, as reported in prior literature, we have also found the existence of anti‐self ABO antibodies (e.g. anti‐A antibodies in group A individuals). We have found no evidence of IGHV gene restriction; there are no significant differences in IGHV usage among the ABO blood group antibodies and among different individuals. Furthermore, we have found that B‐cells reactive to blood group A exhibit higher mutation rates than unsorted B‐cells, for both IgM (2.1% vs 1.8% p < 2.22e‐12) and IgG2 (9.8% vs. 8.1%, p < 1.7e‐12) antibodies. Finally, we identified over a hundred convergent anti‐A antibody clusters that appear in multiple blood group O individuals, exhibiting significantly higher mutation rates (5.75%) when compared to convergent anti‐A antibodies found in individuals of blood group A (3.2%, p < 9.4e‐04) and blood group AB (1.8%, p < 4.4e‐06), but not in individuals of blood group B (4.4%, p < 0.21).
Conclusion: Our data provides new molecular insights into anti‐carbohydrate antibodies and may provide new avenues of studying these antibodies across diverse biomedical fields. These findings can potentially impact transfusion and transplantation medicine, and have direct relevance to clinically significant events such hemolytic disease of the newborn and organ transplantation rejection.
CBIB8‐MN4‐32
Cooperative Immunogenicity between MHC Alloantigens in a Murine Model
Krystalyn E. Hudson, Andrea S.L. Wong, Amanda L. Richards, Linda Kapp and James C. Zimring*
BloodworksNW Research Institute
Background/Case Studies: Humoral alloimmunization to HLA can lead to a refractory state in patients requiring platelet transfusion, problems for patients who subsequently require transplantation, and can also lead to TRALI caused by donated products containing anti‐HLA. While alloimmunization to HLA requires exposure to alloantigen, how overall degree of MHC mismatch affects immunogenicity of individual alloantigens is unclear.
Study Design/Method: C57BL/6 (B6) mice (H2b MHC haplotype) were exposed to the Kd alloantigen by infusion of leukocytes, but in different contexts: 1) Kd in isolation on cells from a novel mouse that expresses Kd as a single MHC alloantigen on a B6 background (B6‐Kd), and 2) in the context of multiple other mismatched alloantigens (e.g. the whole H2d haplotype) from BALB/c mice or congenic B6.H2d animals. Alloimmunization was assessed by incubating serum with B6‐Kd or BALB/c targets, followed by florescent anti‐mouse Igs and analysis by flow cytometry. Alloimmunization was calculated as mean florescent intensities (MFI). In some mice, the precursor frequency of CD4 +T cells specific for Kd alloantigen was modified through 1) adoptive transfer of CD4 +T cells from T cell receptor transgenic mice (TCR75) specific for the immunodominant Kd peptide presented by MHCII to CD4 +T cells or 2) immunization with the immunodominant peptide from Kd.
Results/Finding: Compared to control mice that had no detectable anti‐Kd alloantibodies (MFI = 0), a strong anti‐Kd response was observed after a single exposure to leukocytes from mice expressing the whole H2d haplotype (MFI = 6267, n=10 mice over 3 experiments, p<0.001). In contrast, no significant alloimmunization was observed in response to Kd as an isolated alloantigen, despite repeat exposure. Both adoptive transfer of naïve TCR75 T cells and pre‐immunization with Kd peptide resulted in strong alloimmunization in response to subsequent infusion with leukocytes expressing Kd as an isolated alloantigen, equivalent to leukocytes expressing the whole H2d locus (MFI 13012, p < 0.0001). This was not an artifact of induction of anti‐Kd by maneuvers to increase CD4 + T cell numbers, as neither TCR75 nor peptide immunization induced detectable anti‐Kd on their own.
Conclusion: These findings indicate that the immunogenicity of a single alloantigen is affected by the context in which it is encountered. In isolation, Kd induced no significant alloantibody response; however, a strong anti‐Kd response is observed when multiple mismatches are present. The mechanism of this effect involved the magnitude of CD4 + T cell help. This challenges the notion that MHCI alloantigen is intrinsically a strong immunogen on its own, indicating rather that there is a cooperative effect between different mismatched MHC alloantigens when encountered together.
CBIB11‐MN4‐32
Pregnancy Primes Alloimmunization to Platelet Transfusions in a Mouse Model
Jacqueline N. Poston*1, Linda Kapp2, Lindsay M. Hannan1 and James C. Zimring2
1University of Washington, 2BloodworksNW Research Institute
Background/Case Studies: Previously pregnant women have higher rates of alloimmunization to platelet (PLT) transfusions and refractoriness, as noted in secondary analyses of prospective trials. We utilized an animal model to isolate pregnancy as an independent variable and test how pregnancy impacts alloimmunization to PLT transfusions.
Study Design/Method: B6 female mice (H2b) were bred with BALB/c males (H2d) followed by 4 weekly transfusions of filter leukoreduced PLTs from a B6xBALB/c cross (F1 mice) representing the same haploidentical exposure to alloantigens as in utero. To control for nonspecific effects of pregnancy and transfusion, B6 females were bred with B6 males and transfused with B6 PLTs (negative control). After the 4th transfusion, alloantibodies in serum were measured by incubating with BALB/c splenocytes as targets, followed by florescent anti‐mouse globulin and analyzed by flow cytometry. Alloimmunization was defined as mean fluorescence intensity (MFI) > 2 times the standard deviation (SD) of negative controls. Refractoriness was measured as survival of transfused green florescent protein (GFP) + PLTs expressing H2d alloantigens (i.e. 2 SD < the mean 48 hour PLT recovery of controls). Results were analyzed in SAS® software via the chi‐square test and Fisher's t‐test.
Results/Finding: Following F1 transfusions, mice bred with BALB/c males had higher rates of alloimmunization than mice bred with B6 males (80% vs 0%, p < 0.0001) and significantly higher rates of PLT refractoriness compared to controls (73% vs 0%, p<0.0001). In contrast, mice bred with BALB/c sires and transfused with B6 PLTs had no significant PLT refractoriness (p=0.2), but did have significant rates of alloimmunization (p=0.002), albeit with MFIs 10 fold lower than the BALB/c sire group transfused with F1 PLTs (p=0.01). Pregnancy was not required for alloimmunization to fully mismatched donor PLTs (BALB/c). However, for the lower dose of alloantigen on F1 PLTs, no immunization occurred despite exposure to antigen unless priming first occurred in pregnancy.
| B6 PLT Group | F1 PLT Group | |||
|---|---|---|---|---|
| Males | Mean MFI | Mean PLT survival (%) | Mean MFI | Mean PLT survival (%) |
| B6 | 40.2 | 98.9 | 34.5 | 104.1 |
| BALB/c | 73.4 | 90.8 | 3195.0[Link] | 63.1[Link] |
* p≤0.01, compared to controls mated with B6 sires and received F1 PLTs
Conclusion: These findings indicate that exposure to alloantigens during pregnancy and/or delivery primes alloimmunization to subsequent PLT transfusions. Notably, alloimmunization did not occur in 20% of mice despite exposure during pregnancy and transfusion; thus, additional factors are likely involved. The tractable nature of a murine model will allow ongoing mechanistic studies.
CBIB10‐MN4‐32
Red Blood Cell Alloimmunization Is Associated with Lower CD64 Expression on Monocyte Subsets in Patients with Sickle Cell Disease
Raisa Balbuena‐Merle*1, Susanna Curtis1, Lesley Devine1, David Gibb1, Matthew S. Karafin2, Christopher A. Tormey3, Alexa J. Siddon4, John D. Roberts1 and Jeanne Hendrickson3
1Yale, 2BloodCenter of Wisconsin, 3Yale University, 4Yale‐New Haven Hospital
Background/Case Studies: Despite the prevalence and clinical significance of red blood cell (RBC) alloantibodies, there are no known laboratory tests to predict which patients may form antibodies after transfusion. CD64 (also known as Fc gamma R1) expression on monocytes is a marker of a type 1 interferon signature in some autoimmune diseases. Given that autoimmunity is associated with RBC alloimmunization and that type 1 interferon has been shown to play a role in RBC alloimmunization in an animal model, we hypothesized that CD64 expression on monocytes may correlate with RBC alloimmunization.
Study Design/Method: Forty‐two adults with sickle cell disease were recruited, and demographic information and red blood cell alloantibody history were extracted from the electronic medical record. Flow cytometry was completed on peripheral blood and CD14 high/CD16 low cells were classified as classical monocytes, CD14 high/CD16 high cells were classified as intermediate monocytes, and CD14 intermediate/CD16 high cells were classified as non‐classical or inflammatory monocytes. The mean fluorescence intensity (MFI) of CD64 for each monocyte subset was calculated.
Results/Finding: Of 22 non‐alloimmunized patients, 13 were documented to have received RBC transfusion(s) at the study institution and will be referred to as “non‐responders.” Forty‐six percent of these non‐responders were female, with a mean age of 31 years (range 19‐56 years). The non‐responders were compared to 20 alloimmunized “responder” patients; 65% of the alloimmunized patients were female with a mean age of 36 years (range 19‐81 years). These patients had a total of 44 antibodies identified, primarily against the E or K antigens. There were no statistically significant differences in the percentages of total, classical, intermediate, or non‐classical monocytes between non‐responders and responders. The non‐responders showed a trend of having higher CD64 expression on their total monocytes (MFI mean 3372, s.d. 1078) compared to responders (MFI mean 2497, s.d. 1578), p=0.067. Non‐responders had higher CD64 expression on their classical monocytes (MFI mean 3424, s.d. 1141) compared to responders (MFI mean 2285, s.d. 1501), p=0.029, as well as on their intermediate monocytes (MFI mean 3720, s.d. 1191) compared to responders (MFI mean 2497, s.d. 1640), p=0.033.
Conclusion: Contrary to our hypothesis, we observed lower CD64 expression on classical and intermediate monocytes of alloimmunized patients with sickle cell disease compared to non‐responders. It is possible that type 1 interferon signaling, which impacts alloimmunization in animal models, is in some way responsible for this altered CD64 expression. One potential mechanism, previously shown in vitro, may involve type 1 interferon mitigating the ability of interferon gamma to upregulate CD64.
Oral Abstract Session: Product Manufacturing, Contamination, and Pathogen Reduction
BBC6‐MN4‐33
Extension of Platelet Shelf‐Life and Delayed Testing for Bacterial Contamination: Increased Detection of Anaerobic Bacteria
Sandra Ramirez‐Arcos*, Stephanie Evans, Terri McIntyre, Tammy Whitteker, Caesar DiFranco and Mindy Goldman
Canadian Blood Services
Background/Case Studies: Screening of platelet concentrates (PCs) for bacterial contamination is performed using an automated culture system. Since August 2017, the PC shelf‐life was extended to 7 days with an improved bacterial testing algorithm: delayed testing at ≥ 36 hours post collection; inoculation of aerobic and anaerobic culture bottles; screening of double apheresis PCs with three aerobic bottles and one anaerobic bottle; and post‐sampling quarantine at ≥ 6 hours. Contaminated PCs with negative screen results can be found through Quality Control (QC) testing of outdated PCs or reporting of transfusion reactions.
Study Design/Method: From August 2017 to February 2018, 50,678 buffy coat (BC) pools and 9,434 apheresis units were screened during routine testing. In addition, 1210 outdated PCs were QC‐tested. Positive results were classified as: “confirmed positives” if the same bacterium was isolated in initial and confirmatory cultures (implicated or associated components); “false positive” if no bacteria were isolated from positive screen cultures; “unconfirmed positive” if initial positive culture results could not be confirmed. “False negatives” if units had negative screening results but were positive during QC testing or were involved in septic transfusion reactions. Since March 2018, co‐components associated to false positive results for BC pools have been released to inventory.
Results/Finding: Thirty‐three (0.07%) and three (0.03%) culture results were categorized as confirmed positives during routine screening of BC pools and apheresis units, respectively. Most bacteria (61%) isolated from BC pools were Propionibacterium acnes. Nine of the 33 confirmed positives (27%) involved an initial culture of a PC pool and confirmatory testing of associated RBCs, all contaminated with P. acnes. One of three confirmed positives for apheresis PCs was also identified as P. acnes. Other bacteria detected included Staphylococcus aureus, Streptococcus spp and Coagulase negative staphylococci. False positive results were 0.9% and 0.7% for BC and apheresis PCs, respectively. One false negative result was reported during an investigation of a non‐fatal transfusion reaction involving a 7‐day BC pool contaminated with Staphylococcus epidermidis.
Conclusion: Comparative results of confirmed positive cultures between 5‐day and 7‐day PCs show enhanced detection of contaminated PCs, mostly with P. acnes. Detection of contaminated PCs has increased 2.1‐fold and 2.4‐fold for aerobic bacteria in apheresis and BC PCs, respectively. When cultures of anaerobic organisms are included, detection of contaminated pools and apheresis units has increased 6.5‐fold and 3‐fold, respectively. A longer surveillance period is necessary to evaluate the value of anaerobic cultures and adequately analyze residual safety risk.
BBC23‐MN4‐33
Transfer of the Amustaline/Gsh Pathogen Reduction System to Two US Research Blood Centers
Sharon Graminske*1, Larry Dumont2, Waseem Q. Anani3, Anna Schmidt1, Crystal Stanley4, Hermelinda Evans5, Katharina Waldhaus5 and Anna Erickson5
1BloodCenter of Wisconsin, 2Blood Systems Research Institute, 3Department of Pathology, Medical College of Wisconsin, 4Blood Systems Inc., 5Cerus Corporation
Background/Case Studies: The pathogen reduction (PR) system using amustaline and glutathione (GSH) is being developed for the inactivation of pathogens and leukocytes in red blood cell (RBC) components. Amustaline forms adducts with nucleic acids and prevents the replication of contaminating pathogens and leukocytes. The objective of these studies was to qualify two research blood centers to prepare PR treated RBCs and to compare in vitro function to untreated RBCs.
Study Design/Method: Leukocyte reduced AS‐5 RBCs were prepared from CPD whole blood. On day (D) 0‐2, ABO matched pairs of AS‐5 RBC were pooled and sampled; the pool was divided to prepare 1 untreated Control (C) and 1 Test (T). Test RBCs were treated with 20 mM GSH/0.2 mM amustaline within 48 hours of collection which included an overnight hold at 20‐25°C, exchange and addition of SAG‐M. Control units were stored in AS‐5 at 1‐6°C. Post treatment (D2/3) and on D35, the paired units were sampled together for analysis of vitro parameters.
Results/Finding: Following PR treatment, hemoglobin recovery was 97 ± 1% and extracellular protein was 9‐fold lower than C. On D2, T had higher ATP and osmotic fragility compared to C; T had lower pH, K+, glucose, 2,3‐DPG, MCHC RBC deformability and morphology; and hemolysis was equivalent. On D35, T had higher ATP, glucose, and MCHC than C; T had lower hemolysis, pH, K+, RBC deformability and osmotic fragility; and equivalent morphology score. Although post treatment 2,3‐DPG was lower in T due to the overnight hold, after rejuvenation on D35, T had higher 2,3‐DPG and p50 (Table 1).
Conclusion: Amustaline/GSH PR for RBCs was successfully performed at two US research blood centers. All measured in vitro parameters of amustaline/GSH treated RBCs indicate suitability for transfusion.
TABLE 1 (BBC23‐MN4‐33) RBC in vitro Function Data (n=25; mean±SD)
| Day 2 | Day 35 | ||||
|---|---|---|---|---|---|
| Attribute | Test | Control | Test | Control | |
| Volume (mL) | 296 ± 13 | 308 ± 20 | [Link] | [Link] | |
| Hemolysis (%) | 0.0 ± 0.0 | 0.0 ± 0.1 | 0.1 ± 0.0a | 0.2 ± 0.1 | |
| pH (37°C) | 6.8 ± 0.0a | 7.0 ± 0.0 | 6.3 ± 0.0a | 6.5 ± 0.0 | |
| K+ (mM) | 1.6 ± 0.6a | 7.6 ± 2.0 | 49.2 ± 3.2a | 52.4 ± 4.0 | |
| ATP (μmol/g Hb) | 6.5 ± 0.6a | 4.1 ± 0.5 | 4.35 ± 0.6a | 3.5 ± 0.5 | |
| Extracellular Glucose (mM) | 25 ± 1a | 28 ± 1 | 14 ± 1a, b | 14 ± 2b | |
| O2 Disassociation (p50, mmHg) | [Link] | [Link] | 36.9 ± 0.9a, b, e | 36.3 ± 1.7b, e | |
| 2,3‐DPG (μmol/g Hb) | 3 ± 1a, b | 13 ± 2b | 28 ± 3a, b, e | 26 ± 3b, e | |
| MCHC (g/dL) | 33 ± 1a | 34 ± 1 | 32 ± 1a | 31 ± 1 | |
| RBC deformability (EKTA, DI max) | 0.48 ± 0.04a, b | 0.52 ± 0.04b | 0.47 ± 0.03a, b | 0.51 ± 0.03b | |
| Osmotic Fragility | (%)f | 18.9 ± 8.2a, b | 8.5 ± 5.1b | 22.1 ± 9.9a, b | 30.1 ± 15.3b |
| (mOsm)g | 150 ± 3a, c | 148 ± 3c | 154 ± 4a, d | 158 ± 5d | |
| RBC Morphology Score (0‐100) | 94 ± 2a, b | 97 ± 1b | 78 ± 7b | 77 ± 4b | |
* Not measured
p < 0.05 Student's paired t‐test (2 tailed).
n=13;
n=11;
n=12
Day 35 measurement following rejuvenation of RBCs
Hemolysis in 0.50% NaCl
Mean Corpuscular Fragility
This project has been funded in whole or in part with Federal funds from the DHHS; ASPR; BARDA; Contract No. HHSO100201600009C
The amustaline/GSH PR System for RBCs is not approved for commercial use.
BBC4‐MN4‐33
Simultaneous Inactivation of Co‐Circulating Arboviruses through Nucleic Acid Crosslinking
Felicia Santa Maria*, Andrew Laughhunn, Yvette Girard, Kyrzti Bongbong and Peter Bringmann
Microbiology Department, Cerus Corporation
Background/Case Studies: Chikungunya (CHIKV), Dengue (DENV), and Zika (ZIKV) are arboviruses transmitted by Aedes and Albopictus species mosquito vectors. As a result, their geographic distributions can overlap, resulting in areas where all three viruses are circulating at the same time. This co‐circulation can increase the likelihood of patients becoming co‐infected with 2‐3 of these co‐circulating viruses, as recently reported in several endemic countries. The large number of asymptomatic arbovirus infections raises the possibility of transfusion‐transmitted infections (TTIs). The risk of CHIKV, DENV, and ZIKV TTI, whether alone or in combination, can be reduced by use of the photochemical INTERCEPTâ Blood System pathogen reduction (PR) technology, which has previously been demonstrated to be effective against multiple arboviruses including CHIKV, DENV, and ZIKV. Here we report that treatment with amotosalen/UVA inactivates the combination of CHIKV, DENV, and ZIKV in platelet concentrates (PC) and plasma.
Study Design/Method: Plasma or PC in 35% plasma/65% platelet additive solution (PAS) units co‐contaminated with CHIKV, DENV‐2, and ZIKV were treated with amotosalen and UVA light. Infectious viral titers were determined by plaque assay. Inactivation was determined by comparing log titers before and after treatment.
Results/Finding: Following amotosalen/UVA treatment, all three viruses were simultaneously inactivated to the limit of detection in both PC and plasma (see Table below). This resulted in > 5.8 log (CHIKV), > 4.1 log (DENV‐2), and >4.1 log (ZIKV) inactivation in PC and >5.0 log (CHIKV), >4.2 log (DENV‐2), and >4.6 log (ZIKV) inactivation in plasma. These results are consistent with the inactivation achieved with each virus separately: > 6.4 log (CHIKV), > 5.4 log (DENV‐2), > 4.4 log (ZIKV) in PC and >7.6 log (CHIKV), > 5.6 log (DENV‐2) and >6.6 log (ZIKV) in plasma.
Conclusion: This study demonstrates robust simultaneous inactivation of three different viruses contaminating the same plasma or PC 35% plasma/65% PAS unit by amotosalen/UVA treatment. This system is efficient at concurrently inactivating multiple arboviruses that have demonstrated, or have the potential for, co‐circulation and co‐infection in blood donors.
(BBC4‐MN4‐33)
| Multi‐virus Inactivation in PC | |||||
|---|---|---|---|---|---|
| Virus | Log Titers (pfu/mL) | ||||
| Multiple Viruses | Individual Virus | ||||
| Pre‐UVA | Post‐UVA | Log Reductione | Log Reduction per mL | Log Reductione | |
| CHIKV | 5.1 | <‐0.7 | >5.8 | >5.1 | >6.4a |
| DENV | 3.4 | <‐0.7 | >4.1 | >3.4 | >5.4 |
| ZIKV | 3.4 | <‐0.7 | >4.1 | >3.4 | >4.4b |
| Multi‐virus Inactivation in Plasma | |||||
|---|---|---|---|---|---|
| Virus | Multiple Viruses | Individual Virus | |||
| Pre‐UVA | Post UVA | Log Reduction | Log Reduction per mL | Log Reduction | |
| CHIKV | 4.0 | <‐1.0 | >5.0 | >4.0 | >7.6a |
| DENV | 4.2 | <0.0 | >4.2 | >4.2 | >5.6c |
| ZIKV | 4.1 | <‐0.5 | >4.6 | >4.1 | >6.6d |
Tsetsarkin, et al. Am J Trop Med Hyg 2013
Santa Maria et al. Transfusion 2017
Musso et al. Transfusion 2014
Aubry et al. Transfusion 2015
Inactivated to limit of detection; higher inactivation due to higher titer stock viruses1
BBC15‐MN4‐33
Optimization of Pathogen Reduction Compatibility at 13 Blood Centers
Meredith Lummer*
Cerus Corporation, Deployment
Background/Case Studies: In advance of final FDA guidance on bacterial safety, blood centers (BC) are evaluating methods to balance safety of their platelet supply and maintenance of adequate inventory. BCs are assessing implementation of splitting & volume adjustment of apheresis collections for increased compatibility with the currently FDA approved Pathogen Reduction (PR) technology. Apheresis platelet collection settings that determine split rate (SR) and PR compatibility vary by BC and warrant evaluation.
Study Design/Method: 4,000 collections were retrospectively analyzed from 13 anonymized BCs with varying SRs. BCs were grouped into 4 cohorts based on their SR pre‐PR with 1,000 collections analyzed per group.
A=3 BCs with SR of 1.40‐1.69
B=4 BCs with SR of 1.70‐1.89
C=3 BCs with SR of 1.90‐2.09
D=3 BCs with SR of 2.10‐2.40
Collections data were analyzed at current volume, concentration, and yield settings to determine the conventional baseline SR (no PR) and assessed for PR eligibility at current production and device settings. When evaluating conventional production, minimum doses of 3.0 for single (S), 6.2 for double (D), and 9.3 for triple (T) donations were required. When evaluating PR production, minimum doses of 3.5 for S, 6.7 for D, and 9.8 for T were required. These minimum doses provide for high likelihood that each resulting dose will be ≥3.0 (all doses ×10 11). Using the actual (lab measured) and target (programed apheresis device settings) volume, concentration, and yield values for each collection in the dataset, an Actual ÷ Target (A/T) multiplier for volume and yield was established per collection. A/T values were subsequently applied as multipliers to target settings to optimize compatibility with PR when performing splitting and volume adjustment steps to determine the likely volume, concentration, and yield per collection at these settings. Finally, each donation was analyzed individually under optimized production (splitting & volume adjustment) and at optimized volume, concentration, & yield for PR eligibility. When evaluating PR eligibility, only products eligible for PR treatment without resulting in fewer doses than conventional processing were included, avoiding impact to SR.
Results/Finding:
| Cohort | Baseline PR Eligibility (%) | PR Eligibility – Optimized Production (%) | PR Eligibility ‐ Optimized Production & Collections (%) | SR at Baseline vs. SR with Optimization |
|---|---|---|---|---|
| A | 27 | 61 | 82 | 1.559 / 1.601 |
| B | 40 | 65 | 72 | 1.771 / 1.879 |
| C | 25 | 60 | 71 | 1.977 / 2.006 |
| D | 10 | 54 | 66 | 2.221 / 2.224 |
Conclusion: Implementing optimization techniques can increase PR eligibility from 10‐40% to 66‐82%. Adjusting apheresis target settings resulted in overall SR improvement. Continuous monitoring of results & further refinement of collection settings with assessment of apheresis donor bases can further increase eligibility and SR.
BBC3‐MN4‐33
Platelet Production in a Microfluidic Device Using Hematopoietic Stem Cells from Umbilical Cord Blood and Peripheral Blood
Katrijn R. Six*1,2, Geraldine Sicot3, Rosalie Devloo1, Dominique Baruch3,4 and Hendrik B. Feys1,2
1Belgian Red Cross‐Flanders, 2Ghent University, 3PlatOD, 4INSERM UMR_S1140
Background/Case Studies: In vitro production of human platelets offers a promising alternative for donor‐derived platelet concentrates in the field of transfusion. Multiple sources of hematopoietic stem cells (HSC) are currently used for culture and differentiation of megakaryocytes as precursors for platelets in vitro.
Study Design/Method: In this study, CD34+ HSC isolated either from umbilical cord blood (UCB), regular non‐mobilized peripheral blood (PB) or mobilized peripheral blood (mPB) were evaluated for expansion and differentiation towards megakaryocytes during a 12‐day culture. Platelet production was obtained by perfusion of the cultured cells over von Willebrand factor‐coated microfluidic flow chambers. Platelet production yield during perfusion in the flow chamber was compared. Surface receptor expression on the produced platelets was also investigated.
Results/Finding: The percentage of isolated HSC per total nucleated cells from PB was significantly lower (0.06%) compared to UCB (1.33%) (P<0.0001) and to mPB (1.36%). Proliferation of HSC from PB was significantly lower than from UCB shown by a 24‐fold increase in cell number on day 12 for PB versus 76‐fold for UCB (P<0.0001). Proliferation of HSC from mPB was 18‐fold on day 12. Differentiation of HSC to megakaryocytes was less efficient when starting from PB where only 44 ± 9% of the cultured cells were positive for platelet markers CD42b and CD41, compared to 76 ± 11% for UCB (P<0.0001). Despite this, platelet production in vitro under flow was more efficient for megakaryocytes cultured from PB with 7.4 platelet‐like particles per input cell, compared to 4.2 for UCB (P=0.02). The yield of platelet‐like particles per input cell was 6.6 starting from mPB. Platelet surface receptor expression was comparable on platelets produced from UCB and PB.
Conclusion: In vitro production of platelet‐like particles is possible starting from HSC isolated from UCB, PB and mPB. In absolute numbers, more of these platelets are obtained from UCB because of more efficient isolation and proliferation. In relative numbers, the efficiency of platelet production per cultured megakaryocyte is higher from (m)PB.
BBC24‐MN4‐33
Dual Apheresis Platelets Inventory for a Hospital‐Based Donor Center and Transfusion Service
Jennifer T. Nguyen*, Jowin Rioveros, Alyssa Ziman and Dawn C. Ward
Wing‐Kwai and Alice Lee‐Tsing Chung Transfusion Service, Department of Pathology and Laboratory Medicine, David Geffen School of Medicine at UCLA
Background/Case Studies: Apheresis platelet (AP) Pathogen Reduction (PR) technology is an FDA approved method to provide safe blood products to patients by reducing the risk of transfusion‐transmitted infections. Increase in product wastage may occur as donor centers implement PR technology due to the necessity to meet PR processing guard bands. Our center executed a dual manufacturing process creating an inventory of both conventional platelets (CP) and PR platelet products in an effort to maximize platelet collections, reduce unnecessary product discards, and maintain collection split rates. Here we report the impact of a dual inventory of CP and PR platelet products to our transfusion service between April 2017 and March 2018
Study Design/Method: AP units were collected in 100% plasma at our hospital‐based donor center, Monday through Saturday. Performance of preliminary platelet counts, unit yields, and visual inspection occurs upon receipt in the components processing laboratory (CPL). A determination to process by PR or CP preparation was performed using the established INTERCEPT™ Blood System (Cerus Corporation) guard bands. Products that did not meet the guard band criteria including triple collections and some double collections, which met criteria but would potentially affect the current split rate due to the known product loss after PR processing, were processed as CP.
Results/Finding: During the study period, CPL consistently processed approximately 56% of the monthly AP collections by the PR process and the remaining 44% as CP (Table 1.). We maintained 559 triple collections. 2,089 double collections of which 814 were processed as PR and 1,275 as CP, maintaining a split rate of 1.5 and a discard rate of <2%. Additionally, PR units were available for transfusion two days after their collection and CP units three days after their collection thus, providing a 7‐day platelet release to the blood bank inventory.
Conclusion: The dual inventory of PR and CP platelets allowed for preservation of multiple product collections without impacting split rates. In addition, implementation of PR platelets allowed for daily release of platelets to the blood bank improving inventory management.
TABLE 1
| Month/Year | # AP Collections | PR processed AP % (#) | CP processed AP % (#) |
|---|---|---|---|
| Apr‐17 | 463 | 54% (248) | 46% (215) |
| May‐17 | 589 | 57% (337) | 43% (252) |
| Jun‐17 | 597 | 55% (329) | 45% (268) |
| Jul‐17 | 550 | 57% (313) | 43% (237) |
| Aug‐17 | 558 | 59% (328) | 41% (230) |
| Sep‐17 | 472 | 54% (253) | 46% (219) |
| Oct‐17 | 517 | 53% (272) | 47% (245) |
| Nov‐17 | 571 | 54% (308) | 46% (263) |
| Dec‐17 | 631 | 54% (340) | 46% (291) |
| Jan‐18 | 566 | 62% (349) | 38% (217) |
| Feb‐18 | 511 | 62% (317) | 38% (194) |
| Mar‐18 | 548 | 53% (288) | 47% (260) |
Oral Abstract Session: Transfusion Practice & Apheresis
TA1‐MN4‐34
Long‐Term Success of Immunotherapy for Antibody Mediated Cardiac Transplant Rejection May Depend upon Suppressing Class II Donor Specific Antibodies
Jan C. Hofmann* and Dobri D. Kiprov
California Pacific Medical Center
Background/Case Studies: Antibody medicated rejection (AMR) in cardiac transplant patients (pts) is primarily mediated by donor specific antibodies (DSAs) and is associated with reduced long‐term graft survival. Whereas AMR in renal transplant pts, in general, carries an excellent prognosis, AMR in cardiac transplant pts denotes a poor prognosis and treatment options are less well understood and standardized.
Study Design/Method: We reviewed the records of 63 heart transplant pts who were referred for immunotherapy, from 1/08‐1/18, to treat AMR. The median age of pts (at time of rejection) was 55 years (19‐71 years old), and 65% (41/63) pts were male. Pts presented with symptoms of congestive heart failure, diastolic and/or systolic dysfunction, and decreased ejection fraction (EF). 87% (55/63) pts had endomyocardial biopsy results consistent with AMR, and 92% (58/63) pts had evidence of circulating DSAs at time of rejection (including A23, A32, B35, B44, Cw7, DQ2‐9, DR4‐8, and DR52‐53). 83% (52/63) pts had evidence of concurrent acute cellular rejection at time of AMR. All pts were DSA and T‐cell crossmatch negative at time of cardiac transplant. Median time from transplantation to AMR was bimodal: 2.2 yrs (0.4‐5.3 yrs) for 62% (39/63) pts, and 9.7 yrs (6.1‐15.9 yrs) for 38% (24/63) pts. All pts received the following immunotherapy (IT) protocol: plasma exchange (TPE) every other day (or 3X/week) for 4‐6 treatments (txs), followed by intravenous immune globulin (IVIG) (1 gram/kg/day X 2 days). 83% (52/63) pts received high dose CS. Serial DSA measurements were obtained after each pharmacologic intervention. For refractory or recurrent AMR, 46% (29/63) pts received weekly rituximab (2‐4 doses), and 27% (17/63) pts received twice‐weekly bortezomib (4 doses).
Results/Finding: 63 pts underwent 119 courses of TPE (1‐5 courses/pt), each followed by post‐TPE IVIG. 78% (49/63) pts had moderate improvement in allograft function, and 67% (42/63) pts showed substantial improvement in systolic and/or diastolic dysfunction and EF. 54% (34/63) pts had significant reduction or elimination of class I and II DSAs, and resolution of AMR with 1 course of IT tx. 46% (29/63) pts required a minimum of 2 course of IT tx for AMR, of which 27% (17/63) pts had refractory AMR requiring 3‐5 courses of IT tx. The most common DSAs present in refractory AMR included class II DQ2‐9, DR4‐8, and DR52‐53. Pts with refractory AMR received monthly IVIG, with intermittent courses of TPE and bortezomib. Over a mean follow‐up of 4.3 yrs (0.3‐7.4 yrs) from time of AMR, 25% (16/63) cardiac transplant AMR pts lost their allografts to rejection, whereas over a mean follow‐up of 5.9 yrs (0.4‐12.3 yrs), only 9% (6/68) renal transplant AMR pts lost their allografts (p<0.04); both groups were treated with relatively similar protocols for AMR.
Conclusion: Plasma exchange, IVIG, rituximab, and bortezomib are useful treatment modalities for cardiac transplant pts with AMR. Suppressing refractory class II DQ and DR DSAs may be critical to providing durable allograft rescue. The development of more effective protocols for treating refractory and recurrent AMR in cardiac transplant pts is needed.
TA2‐MN4‐34
External Validation of Formula Using Fraction of Platelets Remaining to Accurately Estimate Post‐Automated Red Cell Exchange Hemoglobin S
Briana Gibson*, John Lilly, Michael Greenberg, Yara A. Park and Jay S. Raval
University of North Carolina
Background/Case Studies: Automated red cell exchange (RCE) is a well‐established therapy in sickle cell disease (SCD) as a maintenance therapy and as an emergent intervention. Quantification of hemoglobin species is used to determine if goals of RCE have been achieved. However, a recent publication included a formula to estimate post‐RCE hemoglobin S (HbS) using pre‐ and post‐RCE platelet counts and a correction factor (Xm) to create a derived fraction of platelets remaining (dFPR) that closely approximates the fraction of cells remaining (FCR) (Keiser AM et al, 2018):
In certain situations, this could be used in lieu of traditional, laborious, and time‐consuming HbS determinations. We performed an external validation of this formula with our SCD patients to determine the generalizability of this formula.
Study Design/Method: In this IRB‐approved retrospective study, we queried our institutional apheresis database to identify all RCE procedures performed in SCD patients from 1/1/2017 to 1/1/2018 with a pre‐procedure HbS of ≥ 40%. Using pre‐RCE HbS and pre‐ and post‐RCE platelet counts, we applied the formula to our SCD population to derive an estimated post‐HbS for each procedure. Wilcoxon matched‐pairs signed rank test was performed to compare derived and actual post‐RCE HbS values, and statistical significance was defined as p<0.05.
Results/Finding: We applied the formula to 163 RCE procedures performed on 42 patients. For 145 procedures (89%), derived post‐RCE HbS was within 5% of actual post‐RCE HbS as measured by high performance liquid chromatography quantification of hemoglobin species. There was no statistical difference between dFPR and FCR (p=0.87 pre‐HbS=40‐70%, p=0.53 pre‐HbS>70%), or between derived post‐RCE HbS and actual post‐RCE HbS (p=0.73 pre‐HbS=40‐70%, p=0.53 pre‐HbS>70%). Some inter‐patient variation was noted, with 4 patients’ RCE procedures accounting for over half (10/18) of all derived post‐RCE HbS values with discrepancies >5% from actual post‐HbS values. RCE performed emergently versus electively for maintenance therapy had no bearing on formula accuracy.
Conclusion: The formula accurately approximated post‐RCE HbS using pre‐ and post‐RCE platelet counts for patients with pre‐RCE HbS of ≥ 40% in our SCD patient population. In instances where traditional post‐RCE HbS determinations may take considerable time, this formula may be used instead to expedite removal of temporary vascular access or time to discharge. Additional investigations are necessary to better characterize why this formula performs less well for a small proportion of SCD patients.
TS4‐MN4‐34
Five‐Fold Increase in the Frequency of MTP Activation at a Large Academic Medical Center: Lean Analysis, and Implementation of Mitigation Strategies
James D. Gorham*1, Gay Wehrli1, Thomas Brady2, Theresa A. Libby2, Eric P. Shields2, Joseph Schoeny2, Jahan Chowdhury2, Matthew P. Robertson2, Stephanie M. Corbett2, Kathy Butler2, Stuart Lowson1 and J.F. Calland1
1University of Virginia School of Medicine, 2University of Virginia Health System
Background/Case Studies: The MTP rapidly provides recurrently issued blood products in specific ratios to patients at risk of exsanguination. Following an initial rollout in mid‐2008 at our institution (large AMC with Level I Trauma Center designation), MTP usage patterns changed dramatically. The MTP Activation Frequency (MAF) rose steadily (1.3/mo 2008/9; 7.4/mo 2015), with no concomitant increase in frequency of trauma patients. Since the MTP demands significant effort, this large increase in MAF potentially indicates a serious misallocation of resources. We sought both to understand the reasons for the MAF increase, and to identify effective solutions.
Study Design/Method: In 2016, an extensive Lean A3 process was undertaken. A problem statement was developed, followed by process mapping, fishbone diagramming, and prioritization gridding. Solutions were proposed and discussed, then deployed toward end of 2017. To assess efficacy, data were collected pre‐ vs. post‐A3/deployment. 1 º outcome was MAF across equivalent (pre vs. post) time periods. 2 º outcomes included RBC U Transfused per Activation (RTA) as an indicator of bleeding severity, and MTP‐specific product wastage (USD).
Results/Finding: Between 2008/9 & 2015, MAF rose from 1.3/mo to 7.4/mo, and RTA fell (20.3 ± 17.8 vs. 4.8 ± 4.0 (mean ± SD); p < 0.0001; Stdnt's t‐test), indicating that the MTP was being increasingly activated for patients of lesser bleeding severity. A3‐generated storm clouds revealed probable causes for the dramatic changes in MAF / RTA: (1) no sustainable education component; (2) no decision support tool; (3) low clinician confidence in standard blood ordering; (4) no feedback on appropriateness of each MTP activation. Solutions were developed/deployed: (1) a comprehensive educational campaign using orthogonal approaches; (2) a literature‐backed decision support tool incorporating patient vital signs (ABC score); (3) creation of an EMR‐independent alternative pathway to rapidly issue small numbers of RBC+plasma; (4) a timely MTP review mechanism providing feedback. Comparing the 1st 110 days of 2015 and 2018, respectively, MAF dropped >50% (7.4/mo vs 3.3/mo), RTA trended upward (4.8 ± 4.0 vs 8.4 ± 12.9; p = 0.19), and MTP‐specific product wastage fell ($3285 to $864 USD).
Conclusion: A comprehensive A3 root cause analysis involving multiple stakeholders identified the underlying bases for the increasing misuse of the MTP. The A3 allowed us to develop and test solutions to address each likely cause for the change in MTP usage pattern. The result is an alteration in usage more aligned with the MTP's primary purpose: provide blood rapidly to exsanguinating patients.
TS6‐MN4‐34
Transfusion‐Associated HLA Sensitization in Patients Bridged to Heart Transplantation Using Ventricular Assist Device
Jae Elkind1, Juliana Sobczyk*1, Oscar Ostberg‐Braun2, Jorge Enciso2, Eric Adler2 and Gerald P. Morris1
1Department of Pathology, University of California, San Diego, 2Department of Medicine, University of California, San Diego
Background/Case Studies: Heart transplantation is a curative therapy for end‐stage heart failure. Limited organ availability often requires use of ventricular assist devices (VADs) to bridge patients to transplant. VADs allow recipients to benefit from otherwise unattainable transplants, but are associated with complications such as increased HLA sensitization rates. HLA sensitization is associated with negative clinical outcomes post‐transplantation, including increased rejection and increased mortality. VAD‐associated HLA sensitization is a consequence of blood product transfusion associated with thoracic surgery, though factors that determine the incidence and extent of alloantibody formation remain undefined. To examine this, we examined VAD‐associated transfusion effects on HLA‐sensitization and subsequent transplantation.
Study Design/Method: We performed a retrospective cohort study of 107 patients receiving VAD at an academic‐based hospital from January 2014 to September 2017. Medical record data including transfused blood products, anti‐HLA antibody testing, crossmatch testing, and time to transplant were evaluated. Categorical data were analyzed by Fisher's exact test and quantitative data were analyzed using Mann‐Whitney test. Multivariable analyses were performed using STATA software.
Results/Finding: Patients received an average of 13.8 (range 0 – 44) RBC and 1.9 (range 0 – 8) single donor platelet transfusions associated with VAD surgery. There was a 28.7% increase in the incidence of HLA antibodies after VAD surgery (p=0.001), approximately a 2‐fold higher rate than described in the literature among potential organ transplant recipients receiving transfusion. Multivariate analyses indicated development of new anti‐HLA antibodies did not directly correlate with volume or type of blood product exposure, but was related to a patient's pre‐VAD HLA sensitization status; the relative risk of new anti‐HLA antibodies in VAD recipients with pre‐VAD alloantibodies was 3.5‐fold higher than in patients without prior alloantibodies (p=0.008). Development of new anti‐HLA antibodies post‐VAD were associated with an increased time to transplant (169 d versus 330 d, p=0.013).
Conclusion: Our findings concur with the literature describing VADs as associated with increased rates of HLA sensitization. Uniquely, our study indicates that the presence of anti‐HLA antibodies pre‐VAD was the most significant risk factor for developing additional antibodies post‐VAD. This suggests that a subset of patients may be predisposed to alloantibody formation and at increased risk for development of anti‐HLA antibodies. Identification of at‐risk patients is important to develop strategies to minimize HLA sensitization and prevent a potentially avoidable barrier to subsequent transplantation.
TS18‐MN4‐34
Response to Random Apheresis Platelets, Pooled Platelets, and HLA Matched Platelets in HLA Sensitized Patients
Chakri Gavva*1,2, Terry Gernsheimer3, Paul Warner2 and Monica B. Pagano1
1Division of Transfusion Medicine, University of Washington, 2Bloodworks Northwest, 3University of Washington
Background/Case Studies: For patients with HLA antibodies and without available HLA‐matched apheresis platelets (MAPs), it is unknown how pooled platelets (PPs) compare to random apheresis platelets (RAPs). The aim of our study was to compare the response to RAPs, PPs, and MAPs in HLA sensitized patients.
Study Design/Method: This is a retrospective study comparing the response to platelet transfusion in patients with a class I calculated panel reactive antibody (cPRA) ≥ 60% from January 2014 to April 2017. Data was collected for all platelet transfusions in the 3 days prior and up to 31 days after the cPRA sample collection. Response to transfusion was determined by a corrected count increment (CCI) up to 4 hours after completion of transfusion. A CCI of ≥ 5 was considered successful. Chi‐squared tests and Kruskal‐Wallis Tests with Dunn's multiple comparisons post‐test were used where appropriate.
Results/Finding: CCIs were available for 94 patients (82 females) receiving 1080 platelet transfusions. The median age was 55 years (range 20 – 85 years), and the median cPRA was 90%. There were 101 RAPs, 502 PPs, and 477 MAPs transfused (Table 1). Mean CCIs ( ± 95% confidence interval [CI]) for RAPs, PPs, and MAPs were 3.1 ( ± 0.9), 4.5 ( ± 0.6), and 11.2 ( ± 0.7) respectively (p < 0.0001). Post‐test analysis revealed a statistically significant difference when comparing RAPs vs MAPs (p < 0.001), RAPs vs PPs (p < 0.05), and PPs vs MAPs (p < 0.001). CCIs ranged from 0‐20.3, 0‐46.6, and 0‐47.5 for RAPs, PPs, and MAPs respectively.
The transfusion success rates of RAPs, PPs, and MAPs were 26%, 31%, and 78% respectively. There was a significant association of success rate and type of platelet when comparing all 3 types together (p < 0.0001), comparing RAPs and MAPs (p < 0.0001), and comparing PPs and MAPs (p < 0.0001). There was no association of success rate and type of platelet when comparing RAPs and PPs (p = 0.380).
Forty‐eight, 83, and 62 patients received at least 1 RAP, PP, and MAP respectively. Mean CCI ( ± 95% CI) per patient when receiving RAPs, PPs, and MAPs was 3.0 ( ± 1.4), 4.6 ( ± 1.1), and 13.4 ( ± 1.9) (p < 0.0001). Mean CCI per patient was significantly different when receiving RAPs vs MAPs (p < 0.001), RAPs vs PPs (p < 0.05), and PPs vs MAPs (p < 0.001).
Conclusion: MAPs are superior to both RAPs and PPs for patients with an elevated cPRA. Whether PPs are clinically superior to RAPs is unclear. Additional studies are needed to determine optimal platelet support when MAPs are unavailable.
TABLE 1
| RAPs | PPs | MAPs | |
|---|---|---|---|
| Transfused platelets (n) | 101 | 502 | 477 |
| Patients receiving each type of platelet (n) | 48 | 83 | 62 |
| Mean CCI ± 95% CI | 3.1 ± 0.9 | 4.5 ± 0.6 | 11.2 ± 0.7 |
| Success Rate (%) | 26% | 31% | 78% |
| Mean CCI per Patient ± 95% CI | 3.0 ± 1.4 | 4.6 ± 1.1 | 13.4 ± 1.9 |
TS27‐MN4‐34
Whole Blood Transfusion at Level 1 Trauma Center: Implementation, Operation and Monitoring
Mei Lin*1, Rhonda Hobbs2, John B. Holcomb3, Bryan A. Cotton1, Joseph D. Love1, Miguel Escobar1, Brian Castillo1, Kimberly L. Klein1, Hlaing Tint1 and Yu Bai1
1University of Texas Health Science Center at Houston, 2Memorial Hermann Texas Medical Center, 3UT Health
Background/Case Studies: During the last few years, there has been a resurgence of interest in cold‐stored whole blood (WB) transfusion for the management of civilian trauma patients. It is believed that WB will provide several benefits over traditional component therapy, including less dilution of the blood components, fewer donor exposures and the opportunity to simplify the logistics of the resuscitation. This report details the initial experience with implementation, operation and monitoring of using WB in the setting at a Level 1 trauma center.
Study Design/Method: WB was initially implemented for resuscitation of massively bleeding patients with unknown blood type at the Emergency Department (ED) and in Life Flight (LF) at the Memorial Hermann‐Texas Medical Center. Non‐ leukocyte reduced type O Rh‐negative, low titer (<200) anti‐A and ‐B WB units were used. A maximum of 4 units was stocked at the ED and 2 units on each flight.
For patients who received WB transfusion, a hemolysis panel was tested on the day of transfusion (Time 0), Time 24 and Time 48 hours. The blood bank service evaluated all non‐O patients who had received WB and issued reports for physician notification. For cases with suspected and/or undetermined hemolysis status, further evaluation including DAT and extended laboratory follow‐up was performed.
Results/Finding: In the six months, WB transfusion was used in 96 patients with a total of 129 units of which 53 units were used in LF. Blood type was unknown in 9 patients mainly due to early mortality. None of the 41/87 patents given non‐type O had evidence of hemolysis. A majority of the cases had a single WB unit transfused before switching to type‐specific components and the maximum used was 4.
Instances of WB wastage were noticed in the first month of implementation likely due to the shorter 21‐day shelf life of the product and staff's unfamiliarity with WB availability in ED. Post‐transfusion hemolysis laboratory studies were occasionally overlooked. Given the frequent shift changes in the ED, additional education was conducted to cover all staff members. Blood bank evaluation within 24 hours of transfusion was able to capture the required laboratory findings for patient monitoring. An electronic WB order set has been scheduled to ensure follow‐up process. At the 3‐month follow‐up of 53 cases, wastage was 0 in the 2nd and 3rd months with only 1 incomplete post‐transfusion hemolysis marker in 40 cases.
Conclusion: With multi‐specialty efforts, WB program has been implemented in our facility successfully. By following the institutional guidelines, no hemolytic transfusion complication has been detected in the first 6 months. Continued staff education and process monitoring is essential for long‐term success.
Oral Abstract Session: New Innovations, Education, and Quality Improvement in Transfusion Medicine
ED1‐MN4‐35
Development of a “Gold Standard” Informed Consent Narrative for Blood Transfusion
Michelle P. Zeller*1,2, Shannon Lane3, Mark K. Fung4 and Richard Haspel5 on behalf of the Biomedical Excellence for Safer Transfusion (BEST) Collaborative6
1Canadian Blood Services, 2McMaster Centre for Transfusion Research, 3McMaster Centre for Transfusion Research; McMaster University, 4Univ of Vermont Colleges of Medicine, Nursing and Health Sciences, 5Beth Israel Deaconess Medical Center, 6Dartmouth‐Hitchcock Medical Center
Background/Case Studies: During their training, the majority of medical trainees will obtain informed consent for blood transfusion. Literature has demonstrated that informed consent for transfusion is at times incomplete, poorly understood, hurried and/or inaccurate in part due to lack of educational resources. A gold standard narrative would help ensure true patient informed consent and have utility in teaching trainees the risks and benefits of transfusion.
Study Design/Method: A modified Delphi approach was used to survey a purposively selected international group of Transfusion Medicine (TM) experts with experience consenting patients for transfusion and critical knowledge regarding the risks and benefits of transfusion. A case scenario (a woman with gastrointestinal bleeding) was presented and participants were asked to draft a narrative (or script) for obtaining informed consent from the patient. Using the techniques of qualitative descriptive content analysis, a smaller steering committee of TM experts analyzed the scripts for core themes and topics. Common themes or categories were identified, (e.g. risks of transfusion, benefits of transfusion, etc.) as were specific topics/items (e.g. possibility of allergic reactions, possibility of HIV infection, etc.). Affective and structural content was also captured (eg. manner of engagement). A second survey was developing based on the collated topics and themes from the first survey. It was redistributed to the 24 participants from the first survey and 2 pilot participants. Participants were asked to rate each topics on a 6 point scale (1=very low importance; 6 = very high importance/essential). Content validity index (CVI) for each item was calculated. A narrative was developed using topics that scored a CVI of 0.80 or higher.
Results/Finding: The survey was completed by 28 TM experts spanning 8 countries (4 as pilots and 24 participants). The majority of participants (>90%) have more than 5 years of experience practicing TM, of those, half have more than 15 years. Content analysis identified 10 high level themes and 97 specific topics from narratives that were included in the second round of the Delphi. The second survey was completed by 21/24 participants who completed the first survey, and 2 of the original pilot participants (88.5% response rate). Forty out of 97 topics with a CVI of 0.80 or greater were incorporated into a narrative that was developed to meet a Flesch Kincaid Grade level 8.7.
There were 4 topics with a CVI of 1.00: Ask if patient has questions, Ask directly, “do you consent to a blood transfusion”, Discuss that there are risks to transfusion and Discuss that the risk of transfusion transmitted disease is low.
Given the high incidence of transfusion associated circulatory overload (TACO) and high mortality associated with Transfusion Related Acute Lung Injury (TRALI), it was surprising to see the low CVI scores related to these topics: State possibility of “lung injury” (0.56), State possibility of fluid overload (0.64) and State general possibility of shortness of breath with transfusion (0.56).
Conclusion: Using a Delphi approach, a gold standard narrative for obtaining informed consent for blood transfusion was developed. Plans are to further validate the narrative with other healthcare providers and patients using both surveys and focus groups to elucidate feedback and further refine the narrative.
NIT1‐MN4‐35
Diagnosis of Variant Creutzfeldt‐Jakob Disease Using Protein Misfolding Cyclic Amplification (PMCA)
Maxime Belondrade1, Charly Mayran1, Lilian Bruyère‐Ostells1, Sylvain Lehmann2, Jean‐Philippe Brandel3, Stéphane Haïk3, Alison Green4, Robert Will5, Chantal Fournier‐Wirth1 and Daisy Bougard*1
1Pathogenesis and Control of Chronic Infections, Etablissement Français du Sang, Inserm, Université de Montpellier, 2CHRU de Montpellier and Université de Montpellier, IRMB, INSERM U1183, Laboratoire de Biochimie Protéomique Clinique, 3Inserm U 1127, CNRS UMR 7225, Sorbonne Universités, UPMC Université Paris 06 UMR S 1127, Institut du Cerveau et de la Moelle épinière, ICM, 4National Creutzfeldt‐Jakob Disease Research and Surveillance Unit, Western General Hospital, 5National CJD Research and Surveillance Unit, Centre for Clinical Brain Sciences
Background/Case Studies: Variant Creutzfeldt‐Jakob disease (vCJD) is a rare human prion disease caused by infection with a bovine prion. Although all clinical cases of vCJD evaluated for the prion protein gene, PRNP, have been methionine homozygotes at codon 129 for 20 years, the first definite heterozygous vCJD patient, with Methionine/ valine (MV) genotype, was recently described in the United Kingdom. This patient met the diagnostic criteria for probable sporadic CJD (sCJD) but neuropathology and molecular analysis of prion strain type at autopsy confirmed vCJD. This recent publication underlined previous concern about a possible second wave of vCJD cases attributed to alternative genotype at codon 129 and secondary transmission. Iatrogenic transmission of vCJD by blood transfusion has already been documented in three recipients of non‐leucodepleted red blood cell concentrates from donors in incubation of the disease. One additional probable case of vCJD transmission by blood transfusion was revealed at autopsy in a MV patient who died from a non‐neurological disorder when vCJD prion protein was detected in his spleen. A highly sensitive and specific pre‐mortem test to discriminate MV vCJD from sCJD is urgently needed to rapidly and accurately diagnose any future MV vCJD patients.
Study Design/Method: Protein Misfolding Cyclic Amplification (PMCA) has already demonstrated high performances in the detection of vCJD prions in the blood of clinical patients and allowed the detection of silent carriage of prions before the clinical onset in two blood donors who later developed vCJD. This ultrasensitive technology was adapted for the specific detection of vCJD in the cerebrospinal fluid (CSF‐PMCA) to identify vCJD infected individuals including the recent MV patient.
Results/Finding: Among the 98 CSF samples analysed blinded to the diagnosis, CSF‐PMCA identified specifically 40 of the 41 vCJD samples thus achieving a diagnostic sensitivity of 97.6% (95% confidence interval [CI], 87.1 – 99.9). Importantly, this assay allows the discrimination of the heterozygous MV vCJD case from the 12 MV neuropathologically confirmed sCJD patients tested. CSF‐PMCA also showed 100% analytical specificity (95% CI, 93.7 – 100), with none of the 57 potentially cross‐reacting CSF specimens from patients with sCJD, genetic CJD, Alzheimer's disease, and other non‐neurodegenerative diseases giving a positive result.
Conclusion: These results indicate that CSF‐PMCA may allow the identification of MV vCJD in life and, in combination with other tests such as CSF real‐time quaking‐induced conversion, accurate discrimination from sCJD. The presence of infectivity in the blood of the first definite MV vCJD patient involved in this study is uncertain and requires further investigation.
NIT2‐MN4‐35
Cryopreserved Platelets Possess the Classical Phenotypic Characteristics of “Procoagulant Platelets”
Lacey Johnson*1, Lauren Waters1, Ben Wood1 and Denese C. Marks1,2
1Research and Development, Australian Red Cross Blood Service, 2Sydney Medical School
Background/Case Studies: Platelets can be cryopreserved at −80°C with DMSO, which increases their shelf‐life from days to years. Cryopreservation of platelets results in a significant increase in exposed phosphatidylserine and the release of phosphatidylserine‐expressing microparticles, which mediate their procoagulant function. Understanding the procoagulant nature of platelets, and defining the discrete phenotype of this population is an area of continuing interest, and contention, in platelet biology, where procoagulant platelets have been referred to as being activated, coated, apoptotic and necrotic. Thus, the aim of this study was to determine whether the phenotypic attributes of cryopreserved platelets align with the current definition of what constitutes a procoagulant platelet.
Study Design/Method: Buffy coat‐derived platelets were frozen at ‐80°C with DMSO (5% final concentration). Cryopreserved platelets (n=8) were thawed at 37°C and reconstituted with a unit of thawed plasma. In vitro testing of paired units was carried out prior to freezing (fresh) and after thawing (post‐thaw), using flow cytometry and western blotting. Data were analysed using paired, two‐sided t‐tests, with p<0.05 considered statistically significant (*).
Results/Finding: Phosphatidylserine externalisation was significantly increased in cryopreserved platelets, as measured by lactadherin and annexin‐V binding. Mitochondrial damage was evident in the cryopreserved platelets, as evidenced by a reduction in tetramethylrhodamine (TMRE) sequestration. Cryopreserved platelets displayed higher intracellular calcium (Fluo‐3AM) and superoxide anion formation (dihydroethidium [DHE] staining) than fresh platelets. Using western blotting, members of the intrinsic (Bak, Bax, Bcl‐2 and Bcl‐xL) and extrinsic (FADD, Fas, DR5) apoptotic pathways were differentially altered by cryopreservation, but the changes were not clearly indicative of a pro‐apoptotic state. Activation of caspase‐9 (FITC‐LEHD‐FMK) and cleavage of caspase‐8 was greater in cryopreserved platelets. However, activation of the executioner molecule caspase‐3 (Red‐DEVD‐FMK) was similar in cryopreserved and fresh platelets. Interestingly, cleavage of calpain‐1, which is characteristic of procoagulant platelets, was observed in cryopreserved platelets.
Conclusion: Cryopreserved platelets acquire many of the classic features that are used to define the ‘procoagulant platelet’, many of which overlap with the apoptotic and necrotic pathways. Further work is required to fully dissect the molecular events occurring in cryopreserved platelets and understand how these changes may influence clinical utility.
| Parameter | Fresh | Post‐thaw |
|---|---|---|
| Annexin‐V (% positive) | 1 ± 0 | 67 ± 4* |
| TMRE (MFI) | 1293 ± 120 | 166 ± 34* |
| DHE (MFI) | 105 ± 8 | 227 ± 26* |
| FITC‐LEHD‐FMK (MFI) | 113 ± 52 | 177 ± 47* |
NIT3‐MN4‐35
Amustaline/Glutathione Pathogen‐Inactivated RBC in Thalassemia: A Randomized, Controlled, Phase III Study (SPARC)
Yesim Aydinok*1, Raffaella Origa2, Antonio Piga3, Nina Mufti4, Anna Erickson4, A. North4, Jin‐Sying Lin4, Christine Ernst4, L. Corash4 and Richard J. Benjamin4
1Ege University Hospital, Department of Paediatric Haematology, 2Ospedale Pediatrico Microcitemico “A.Cao”, 3University of Turin, 4Cerus Corporation
Background/Case Studies: The INTERCEPT Blood System for RBC (Cerus Corporation, CA) uses amustaline (S‐303) and glutathione (GSH) to inactivate a broad spectrum of viruses, bacteria, protozoa and T‐cells. Transfusion dependent thalassemia (TDT) patients require chronic RBC transfusion combined with iron chelation, but lifetime exposure increases the risk of transfusion‐transmitted infections.
Study Design/Method: Aims: A randomized, controlled, double‐blind, non‐inferiority study to evaluate leukocyte‐reduced (LR) S‐303/GSH RBC in comparison to Control LR‐RBC.
Methods: TDT patients ≥ 10‐years‐old were enrolled. Baseline exclusion criteria included natural antibodies against S‐303 RBC; DAT > 2+; hypersplenism; anticipated splenectomy; pregnancy and breast feeding. Each patient underwent 6 transfusion episodes with S‐303/GSH RBC and Control RBC in a two‐treatment period, crossover design, maintaining the same pretransfusion Hb threshold (hemoglobin (Hb) 9‐10 g/dL). The primary efficacy endpoint was RBC Hb consumption during transfusion episodes 3‐6 in each treatment period (total Hb mass transfused adjusted for body weight (kg) and duration of support (Hb g/kg /day)). Non inferiority was defined by a predetermined margin of 15% of the Control‐period mean Hb consumption. The primary safety endpoint was treatment‐emergent antibodies to S‐303/GSH RBC.
Results/Finding: 86 subjects enrolled and 81 were transfused at two sites in Italy (n=14) and one in Turkey (n=67). Mean age was 26.1 ± 8.1 years (range: 10‐44), 45.7% male, and 18.5% age ≤ 18 years. Eleven percent of patients had pre‐existing RBC alloantibodies. In the intention to treat (ITT) population, mean exposure was 12.5 S‐303/GSH RBC (range 3‐18) and 12.5 (range 6 ‐18) Control RBC, with a mean transfusion interval of 19.4 (Test) and 19.5 (Control) days. Total transfused Hb (on‐study + off‐study RBC) in the Test period was 687 ± 97 grams (g) versus 700 ± 116 g Hb (p = 0.127) in the Control period. Total mean Hb consumption in the efficacy evaluation period was 0.113 ± 0.04 g/kg/day for S‐303/GSH RBC, and 0.111 ± 0.04 g/kg/day for Control RBC. Non inferiority was robustly achieved with a treatment difference of 0.002 g/kg/day (non‐inferiority margin < 0.017g/kg/day). No treatment‐emergent RBC alloantibodies or S‐303/GSH RBC‐specific antibodies were detected. Adverse events were balanced between Test and Control periods. There were no deaths, grade 4 adverse events, or events certain or likely related to S‐303/GSH RBC transfusion.
Conclusion: S‐303/GSH‐RBC were non‐inferior to Control RBC in transfusion‐dependent patients with thalassemia, based on Hb consumption. The safety profile was not different from Control RBC and no antibodies were detected to S‐303/GSH RBC.
NIT4‐MN4‐35
Resuscitation from Hemorrhagic Shock with High Molecular Weight Polymerized Hemoglobin
Alexander T. Williams*1, Andre Palmer2 and Pedro Cabrales1
1University of California San Diego, 2The Ohio State University
Background/Case Studies: Hemoglobin (Hb) based oxygen carriers (HBOCs) have been proposed as an alternative to red blood cells (RBCs) for transfusion medicine for decades. Lack of mechanistic analysis of the side effects of early HBOC formulations lead to the clinical evaluation of low molecular weight (MW) products, which failed due to a myriad of Hb associated toxicities not seen in pre‐clinical trials. Increasing the MW of HBOCs can decrease these side effects by confining HBOCs to the vascular space and increasing nitric oxide (NO) generation via vascular mechanotransduction. HBOCs’ advantages over blood include their non‐immunogenic properties and potential to use non‐human Hb sources, among others. In this study we compare the efficacy of fresh blood or stored blood, with freshly synthesized polymerized bovine Hb (PolybHb) or PolybHb stored for 2 years in restoring cardiac function after hemorrhagic shock.
Study Design/Method: PolybHb was synthesized in the low oxygen affinity (T) state with a 35:1 ratio of glutaraldehyde to bovine Hb, and then subjected to 8‐9 cycles of diafiltration. This resulted in a PolybHb solution containing only polymerized Hb molecules < 0.2 uM and >500kDa. PolybHb was then frozen at ‐80°C and stored until used. Fresh red blood cells were prepared from the blood removed during hemorrhage by centrifugation at 1000g for 7 minutes, removal of the buffy coat, and removal of plasma until a hematocrit of 50%. Stored red blood cells were stored in AS‐3 for 3 weeks after leukodepletion. Rats (200‐250g) were hemorrhaged for 50% of their blood volume, held in hypovolemia for 30 minutes, and resuscitated to recover blood pressure to 90% pre‐hemorrhage with fresh autologous blood (fresh blood), 3‐week‐old blood, PolybHb generated within 3 months of the study (PolybHb 2017), or PolybHb generated two years prior to the study (PolybHb 2015).
Results/Finding: Shock resulted in impaired oxygen delivery and cardiac function. Resuscitation with fresh blood, stored blood, PolybHb 2017, and PolybHb 2015 restored cardiac function and systemic vascular resistance, but stored blood required significantly larger volumes to achieve this. Slightly higher volumes of PolybHb was infused compared to fresh blood before restoring 90% pre‐hemorrhage MAP. Fresh blood and PolybHb fresh or stored did not impair cardiac contractility nor cause excessive vasoconstriction, relative to stored blood.
Conclusion: Studies indicate that PolybHb is as efficacious as fresh blood in restoring cardiac function in rats after hemorrhagic shock. Additionally, PolybHb can be safely stored at ‐80°C for two years and retain efficacy, unlike red blood cells, which lose efficacy during storage.
QT1‐MN4‐35
Impact of Pre‐Printed Order Implementation for Prothrombin Complex Concentrates at an Academic Tertiary Care Hospital: A Quality Assurance Audit
Krista Marcon*1,2, Ko Ta K. Chen2,3, Xin‐Yue Zhang4, Andrew W.Y. Shih1,2, Kristine Roland1,2 and Tyler Smith1,2
1Vancouver Coastal Health, 2University of British Columbia, 3Centre for Blood Research, 4British Columbia Institute of Technology
Background/Case Studies: Since their approval by Health Canada in 2008, all orders for Prothrombin Complex Concentrates (PCCs) at an academic tertiary care hospital required approval by a hematopathologist (HP), except during intracranial hemorrhage (ICH) due to its high acuity. In March 2014, after 6 years of experience, a pre‐printed order (PPO) was implemented to streamline the HP approval process in other urgent warfarin reversal scenarios to simplify and expedite PCC administration. The goals of the PPO were to standardize PCC and vitamin K dosing, decrease turn‐around‐time (TAT), and reduce non‐value‐added calls to HPs. The purpose of this quality assurance study was to review PCC usage pre‐ and post‐PPO implementation to determine the impact of the PPO in achieving its goals.
Study Design/Method: A retrospective chart review of PCC usage was performed for two years pre‐ and post‐PPO implementation (March 2012‐2014 and March 2014‐2016, respectively). Relevant medical information, including PCC indication and dose, use of vitamin K, thrombosis events, and mortality were recorded. Appropriateness of PCC dosage was adjudicated using the Canadian National Advisory Committee (NAC) PCC guidelines. Appropriateness of PCC indication was adjudicated based on chart review. Bleeding episodes were verified by review of clinical notes, endoscopy reports, and imaging reports. Surgical start times were documented from the anesthetic record, with urgent surgery defined as less than 6 hours from PCC order.
Results/Finding: Baseline characteristics of patients receiving PCCs pre‐implementation (n=207) and post‐implementation (n=202) were similar, including sex, age, warfarin use, and INR levels. The proportion of patients receiving PCC doses within 500 IU of NAC guidelines was significantly higher in the post‐PPO period (67.2% vs. 79.0%, p=0.015). The administration of at least 5mg of intravenous vitamin K was more frequent following PPO introduction (70.5% vs. 75.2%, p=0.015). No significant differences were observed in TAT, additional doses of PCC, red cell transfusion, INR correction, thrombosis, or mortality.
After the introduction of the PPO, call volume to HPs for PCC approval was significantly lower (67.1% vs. 16.3%, p < 0.001). The PPO was used to release PCCs for inappropriate indications 23.2% of the time: 15 cases for patients on warfarin for “urgent surgery” when surgery was > 6 hours from the PCC order; and 27 cases for patients not on warfarin without a HP consultation.
Conclusion: Many of the goals of the PPO were achieved, with an increase in appropriate PCC dosing and vitamin K usage. The PCC ordering process was streamlined with a reduction in the call volume to HPs, preventing unnecessary delays in PCC administration. Although the PPO was used inappropriately in about one quarter of cases, these can guide refinements to the PPO to improve appropriate PCC utilization.
Oral Abstract Session: Novel Cell Therapy Products and Functional Insights
CTI5‐SN5‐34
Cellular Therapy Products Enhance Angiogenic Potential of Human Umbilical Vein Endothelial Cells
Larry E. Estlack*, Christopher P. Delavan, Maryanne C. Herzig, Barbara A. Christy, James A. Bynum and Andrew P. Cap
U.S. Army Institute of Surgical Research
Background/Case Studies: Mesenchymal stromal cells (MSCs) show tremendous promise for the treatment of military and civilian trauma, based on their ability to regulate inflammation and promote wound healing. In this study we implement an assay designed to compare the angiogenic potential of MSCs and other cellular therapy products and investigate the relationship to cellular metabolism.
Study Design/Method: Human umbilical vein endothelial cells (HUVECs) and human MSCs (BM‐MSCs, AD‐MSCs and UC‐MSCs) were obtained from commercial sources. mRNA isolated from early passage HUVECs from transwell co‐cultures was used to generate cDNA. HUVEC expression of genes related to angiogenesis (VEGF, FLT4), tissue factor (TF), signaling and metabolism (TSG‐6, OSGIN1, BBC3, JMJD8) were evaluated by qRT‐PCR. Tube formation assays were performed on HUVECS plated onto Geltrex LDEV at sub‐confluent densities in the presence of conditioned media or in co‐culture with MSCs plated in transwell inserts. Angiogenesis was determined by quantitation of tube formation using Image J. Expression of HUVEC cellular proteins from transwell co‐culture were visualized by Western blot and quantitation with an Odyssey scanner. Bioenergetic analysis via extracellular flux measurements were carried out on confluent cells in a Sea horse XFe 24 bio‐analyzer.
Results/Finding: HUVECs respond to MSCs with increased TF protein expression as well as increased expression of angiogenic mRNAs. Co‐culture with BM‐MSCs or AD‐MSCs for 24 hr. altered the bio‐energetic profile, increasing both the oxygen consumption ratio (OCR) and the spare respiratory capacity of the HUVEC cells. Co‐culture with either BM‐MSCs or AD‐MSCs increased tube formation by HUVECs (22% and 40% increase, respectively). Conditioned medium from umbilical cord‐derived MSCs was less potent in this assay.
Conclusion: We have used the tube formation assay, qRT‐PCR, Western blot and bioenergetics analysis to evaluate the angiogenic potential of MSCs and other cell therapy products. Preliminary results suggest that potency differences exist between MSCs derived from different tissue sources. Direct contact between HUVECs and MSCs is not required for stimulation of angiogenesis by MSCs, suggesting that a paracrine mechanism is primarily responsible. Evaluation of the bio‐energetic profile in the co‐cultured samples allows investigation of the relationships between angiogenesis and cellular metabolism. Increased angiogenic activity is accompanied by increased TF expression, potentially increasing thrombotic risk of MSC therapy. Further study is warranted to explore the inter‐relationship of metabolic activity with pro‐coagulant and pro‐angiogenic gene expression.
CTI4‐SN5‐34
Storage Lesion after Collection Affects Post‐Thaw Recovery of T‐Cells but Not CD34 + Cells or Time to Engraftment in Sickle Cell Trait Donor Grafts
Thejaswi Bikkani*1, Nasha Elavia1, Matthew Hsieh1, Courtney Fitzhugh1, John Tisdale2, David F. Stroncek1 and Sandhya R. Panch1
1National Institutes of Health, 2NHLBI
Background/Case Studies: Allogeneic transplant is the only curative treatment for patients with sickle cell disease (SCD). However, related donors for SCD patients have at least a 50% probability of having sickle cell trait (SCT). Mobilized peripheral blood mononuclear cell (PBMNC) SCT donor grafts are often cryopreserved after collection. To ensure successful post‐transplant outcomes, thawed PBMNCs must contain an adequate quantity of hematopoietic progenitor cells (HPCs).
Study Design/Method: Data on 102 mobilized PBMNC grafts, thawed for transplantation of SCD patients, were reviewed. Grafts from donors with SCT (SCTD) (n=78) were compared with normal healthy donor (NHD) grafts (n=24). Data was further stratified by products immediately cryopreserved (IC) post apheresis or those held overnight at 4°C for delayed cryopreservation (DC) (3 vs. 20 hours; p=1.4x10‐42).
Results/Finding: Mean post‐thaw (PT) total nucleated cell (TNC) viability (79% vs. 83%; p=0.06), TNC viable recovery (VR) (73% vs. 81%; p=0.01) and PT CD3 + (T‐cell) VR (73% vs. 84%; p=0.09) showed trends towards being lower in SCTD compared to NHD. However, no difference was noted in PT CFU‐GM (60 vs. 75; p=0.2) and PT CD34 VR (86% vs. 88%; p=0.7). Stratified data (Table) showed significantly lower PT TNC viability and T‐cell VR with DC compared to IC in SCTDs. PT CD34 VR and PT CFU‐GM were similar in the 2 groups. In NHD, only PT T‐cell VR was lower with DC. Post–transplant, no differences were seen between SCTD and NHD grafts or between IC and DC grafts based on time to platelet and neutrophil engraftment. The duration of cryopreservation did not impact PT CD34 VR in either the SCTD or the NHD grafts (r2 = 0.03).
Conclusion: PT TNC viability and PT T‐cell VR of SCTD grafts were lower than NHD grafts, especially for grafts which underwent DC. PT HPC recovery, in‐vitro colony forming capability and post‐transplant platelet and neutrophil engraftment were unaffected. This is likely due to the inherent durability of HPCs compared to T‐cells. To ease logistics, DC of SCTD grafts may be feasible. However, caution must be exercised regarding product holdovers, given the definite decrease in overall viability. Further if donor lymphocyte infusions are planned from cryopreserved‐thawed PBMNCs, dosing by PT viable CD3 + counts may be useful.
TABLE (CTI4‐SN5‐34) Graft Characteristics from SCTD vs. NHD of SCD Patients
| SCTD | NHD | |||||
|---|---|---|---|---|---|---|
| Mean ± SD | IC n=45 | DC n=18 | p | IC n=21 | DC n=2 | p |
| PT TNC Viability (%) | 81 ± 7 | 74 ± 12 | 0.002 | 84 ± 6 | 79 ± 0 | 0.3 |
| PT TNC VR (%) | 72 ± 14 | 73 ± 13 | 0.8 | 82 ± 11 | 72 ± 10 | 0.3 |
| PT CD34 VR (%) | 87 ± 23 | 82 ± 17 | 0.3 | 90 ± 25 | 70 ± 13 | 0.3 |
| PT CD3 + cell VR (%) | 83 ± 25 | 52 + 15 | <0.001 | 88 ± 18 | 55 ± 0.8 | 0.02 |
| PT CFU‐GM (counts/1X105 cells plated) | 57 ± 28 | 64 ± 43 | 0.6 | 75 ± 53 | N/A | __ |
| Neutrophil engraftment (days) | 25 ± 13 | 25 ± 10 | 0.9 | 26 ± 7 | 20 ± 3 | 0.3 |
| Platelet engraftment (days) | 19 ± 9 | 20 ± 8 | 0.8 | 22 ± 13 | 15 ± 0.7 | 0.4 |
CTI3‐SN5‐34
Generation of iPSCs from Umbilical Cord Tissue Using Multiple Integration Free Reprogramming Methods
Christopher Hunter1, Barry McCarthy1, Travis Kroeker1, Katie Reggio1, Monica Zhou1, Premlatha Jagadeesan1, Kate S. Brown*2, Bruce Sun1, Dorota Moroziewicz1, Vignesh Nadar1, Hector Martinez1, Jordan Goldberg1, Reid Otto1, Greg Lallos1, Katie Brenner1, Matthew L. Skiles2, Scott Noggle1, Heather L. Brown2 and Daniel Paull1
1The New York Stem Cell Foundation Research Institute, 2Cbr Systems, Inc.
Background/Case Studies: Umbilical cord (UC) blood can be cryopreserved for long term storage and functional hematopoietic progenitor cells, recovered after more than 20 years, are suitable for use as source material for induced pluripotent stem cell (iPSC) generation (Broxmeyer et al, 2011). Advances in iPSC technology include development of a variety of cGMP compatible, transgene‐free approaches for reprogramming that can be used to generate iPSCs from small amounts of peripheral or UC blood (Zhou et al, 2015) and translated to automated platforms (Paull et al, 2015). The UC tissue is rich in MSCs which are easily expanded ex vivo without compromising attributes considered important for future clinical applications. We explored the utility of UC tissue, cryopreserved as a composite material in a newborn stem cell bank, for iPSC reprogramming using integration‐free reprogramming methods with translation to a semi‐automated platform for iPSC colony isolation and subsequent culture.
Study Design/Method: UC tissue was collected from consenting mothers and cryopreserved as a composite material. MSCs were isolated from thawed tissue by explant outgrowth as described (Skiles et al, 2018). Cell lines were expanded and reprogrammed into iPSCs using the NYSCF Global Stem Cell Array™ (Paull et al, 2015) with footprint free modified mRNA encoding transcription factors and nuclear GFP (nGFP). Reprogramming was also performed in parallel using CytoTune‐iPS 2.0 Sendai reprogramming kit. iPSCs were expanded under automation and quality controlled for sterility, mycoplasma, pluripotency, karyotype, identity, and differentiation potential.
Results/Finding: UC cell lines were expanded on an automated platform and passed quality control tests in preparation for reprogramming. Two methods of iPSC reprogramming, mRNA and Sendai Virus, were validated leading to the generation of successfully reprogrammed iPSCs. UC cells displayed a strong ability to be transfected with mRNA encoding nGFP however the success of mRNA reprogramming was limited and high toxicity observed. Tra‐1‐60 expression confirmed the presence of colonies prior to enrichment and cells displayed normal markers of pluripotency, differentiation capacity, and karyotype as expected.
Conclusion: UC cells, isolated from thawed UC tissue, can be utilized to generate iPSCs and are amenable to semi or fully automated reprogramming methods. Donor variability and method dependent reprogramming efficiency highlight the importance of method optimization that may be cell population specific. Such efforts will be important in consideration of greater utilization of automated, high‐throughput technologies for reprogramming and iPSC line propagation as well as increasing interest in alternative, non‐invasive starting material from neonatal tissues.
CTI2‐SN5‐34
Effect of Starting Material Composition on Chimeric Antigen Receptor (CAR) T‐Cell Expansion and Characteristics
Nasha Elavia*1, Sandhya R. Panch1, Andrew McManus1, Thejaswi Bikkani1, James Kochenderfer2, James Szymanski1 and David F. Stroncek1
1National Institutes of Health, 2National Cancer Institute
Background/Case Studies: Despite the general clinical success of CAR T‐cell (CART) therapy, not all patients are able to achieve a clinical response. Concerning CART manufacture, intermediate processing steps may impact final cell fold expansion (FE) and phenotypic characteristics. Specifically, we studied T‐cell enrichment of peripheral blood mononuclear cells (PBMNC), using ficoll cell density gradient separation (DGS), and its impact on the final CART product.
Study Design/Method: Data from two clinical trials (anti‐BCMA and anti‐CD19) was retrospectively analyzed for the composition of cells in the leukapheresis and post‐DGS samples, and in the final CART products. Effect of DGS was evaluated by the change (%) in the cell composition of post‐DGS sample compared to the leukapheresis sample. Further, the effect of each cell type on final CART product characteristics and FE was studied.
Results/Finding: From 2014 to 2017, 54 CART products were studied on 2 clinical protocols (Anti‐BCMA: n=26, Anti‐CD19: n=28). Mean CART dose was 4.7x10⁶ (±3.4) cells/kg. DGS resulted in significant depletion of RBC (75.3%, p<0.001), platelets (85.4%, p<0.001) and neutrophils (59.8%, p=0.002) and a significant enrichment of monocytes (55.8%, p<0.001) relative to lymphocytes (27.3%, p=0.48) prior to CART culture initiation. Results were similar in both protocols. In univariate analyses, neutrophil depletion efficiency following DGS, was positively correlated with the final CART transduction efficiency (TE) (r=0.6, p=0.002). The lymphocyte fraction (%) in the post‐DGS sample was correlated with higher CD8% (r=0.6, p<0.001). Conversely, a greater monocyte proportion (%) in the post‐DGS sample correlated with a higher CD4:CD8 ratio (r=0.7, p<0.001). In a Box‐Cox transformed mixed effects model comprising of post‐DGS RBC, platelet, and neutrophil, monocyte and lymphocyte counts, RBC counts and platelet counts were strong negative and positive predictors of TE in the final product, respectively (pseudo‐r2=0.5; p<0.001). Neutrophils and monocytes had a minimal negative impact on TE. The cell composition post‐DGS did not affect CD3 + cell FE.
Conclusion: DGS depletes RBC, platelets and neutrophils, while enriching monocytes significantly more than lymphocytes in the starting material for CART culture. TE is significantly improved with neutrophil depletion efficiency. Interestingly, a higher RBC count in post‐DGS samples worsened TE, whereas platelets had the opposite effect. In this regard, RBC depletion methods may be studied further. Monocytes increased the CD4:CD8 ratio with possible impact on final CART product characteristics. Further analysis of the overall combined effect of DGS on final CART critical characteristics is underway.
CTI1‐SN5‐34
Evaluation of Post‐Thaw CFU‐GM: Clinical Utility and Role in Quality Assessment of Umbilical Cord Blood in Patients Receiving Single Unit Transplant
Eiman Hussein*, Todd DeFor, Muhanad Hreh, John Wagner, Claudio G. Brunstein and David H. McKenna
University of Minnesota
Background/Case Studies: Given the relatively low number of hematopoietic progenitor cells (HPCs) in umbilical cord blood (UCB), proper selection of the unit to be used in the setting of single unit transplant becomes of paramount importance. UCB units are typically selected based on the HLA match and nucleated cell dose. Additional testing is performed upon thaw prior to infusion and includes: total nucleated cell (TNC) count, viability, CD34 + cell enumeration, sterility, and CFU assay. While the CFU assay is the only in vitro assay that assesses the biological function of HPCs, few studies have documented the influence of the post‐thaw CFU dose on engraftment after UCB transplantation.
Study Design/Method: In an attempt to investigate the potential impact of post‐thaw CFU‐GM counts on the quality and efficacy of UCB, we retrospectively studied the transplant outcome in 269 patients with malignant and non‐malignant disease, receiving single UCB transplant. To evaluate the independent effect of cell counts, we used Fine and Gray regression to model the endpoints of platelet and neutrophil engraftment. We also correlated the post‐thaw CFU‐GM counts of 1912 units with the pre‐freeze and post‐thaw graft characteristics, hoping to optimize selection criteria of UCB. Data analysis included: total nucleated cells, viability, CD34 + cell content, nucleated red blood cells, post‐thaw hematocrit, frozen storage time, and UCB bank.
Results/Finding: Infused CFU‐GM dose was high at 6 x10⁴/ kg. The cumulative incidence of neutrophil and platelet engraftment for the patients undergoing single UCB unit transplant was 96.2% and 89.3%, respectively. We demonstrated an association between post‐thaw CFU‐GM dose and the speed of neutrophil and platelet engraftment in both myeloablative malignant and non‐malignant patients. Post‐thaw CD34 + cell dose and CFU‐GM dose were highly correlated with each other (r=0.78). However, we observed an interaction in which CFU‐GM showed additional benefit on top of patients receiving the lowest quartile of CD34 + cell dose (2.4% increased risk of platelet engraftment for every one unit increase in CFU‐GM, P < 0.01 and a 2.0% increase risk of neutrophil engraftment for every one unit increase in CFU‐GM, P=0.01). CD34 + cell dose and CFU‐GM dose were included in models after controlling for HLA disparity, type of disease and conditioning intensity. HLA disparity did not adversely impact either platelet or neutrophil engraftment (P>0.45). Evaluation of 1912 UCB units showed that despite potential CD34 + standardization issues (i.e., pre‐freeze testing at bank, then post‐thaw testing at transplant center), post‐thaw CFU‐GM/million showed moderate correlation with CD34 + measured both pre‐freeze (r=0.35) and post‐thaw (r=0.46). Other parameters showed weak correlation with the post thaw CFU‐GM/million. Post‐ thaw CFU‐GM was not influenced by storage time (r=‐0.04) but was impacted by the UCB bank (P<0.01).
Conclusion: CFU‐GM measured at our facility at the time of unit thaw seems to provide an effective measure of the quality and efficacy of UCB when the CD34 + cell counts are low. Our analysis suggests that both pre‐freeze and post‐thaw CD 34 + cell enumeration are reflective of unit potency. Thus, CD34 + cell enumeration provided by banks could be considered as an additional selection criterion, particularly when HLA match and nucleated cell dose are equivalent among available options.
CBIB7‐SN5‐34
BCL2L2 as a Novel Target for Megakaryocyte Expansion and in Vitro Platelet Production
Seema Bhatlekar*1, Indranil Basak1, Leonard C. Edelstein2, Robert A. Campbell1,3, Joseph E. Italiano Jr.4, Andrew S. Weyrich1, Jesse W. Rowley1, Matthew T. Rondina1,3, Martha Sola‐Visner5 and Paul F. Bray1,6
1Program in Molecular Medicine, 2Cardeza Foundation for Hematologic Research, 3Division of General Medicine, Department of Internal Medicine, 4Brigham and Women's Hospital, 5Boston Children's Hospital, 6Division of Hematology and Hematologic Malignancies, Department of Internal Medicine
Background/Case Studies: Thrombocytopenia or qualitative platelet disorder require life‐saving platelet transfusions. However, platelet transfusions are limited by alloimmunization, donor‐dependent supply, and cost. Increasing efforts focusing on stem cell derived in vitro platelet production have failed to generate platelets in scales required for platelet transfusion. Hence, our aim was to understand the basic molecular aspects of megakaryopoiesis and thrombopoiesis that will enable greater yields of megakaryocytes (MKs) and platelets in vitro.
Study Design/Method: CD34 + hematopoietic stem cells were isolated from human umbilical cord blood and grown in serum free stem cell media supplemented with stem cell factor and thrombopoietin for 13 days that favors MK growth. Sub‐populations of these cultures were studied for MK markers, apoptosis, signaling and proplatelet formation. RNA sequencing analysis of cultured MKs identified BCL2L2 (encoding Bcl‐w) as a candidate apoptosis regulator, and BCL2L2 was significantly correlated with platelet count in 154 healthy individuals (R=0.27, FDR‐adjusted P=0.04). Over‐expression of BCL2L2 in cultured MKs was achieved by lentiviral transduction and in vitro platelet production was studied.
Results/Finding: During MK cultures, three distinct cell populations, namely P1, P2 and P3, were observed by flow cytometry, defined by forward and side scatter. On day 13, only P1 cells showed increased CD41a/CD42b MK markers (P=6.54E‐07 for P1 vs. P2; P=5.17E‐05 for P1 vs. P3; n=6), αIIbβ3 activation in response to platelet agonists (P=0.03 for PAR4‐AP; P=0.04 for thrombin; P=0.03 for collagen related peptide; n=4), and morphologic characteristics similar to mature MKs. P2 cells showed features of apoptosis (P=0.002 for Annexin V+; n=4) and P3 cells showed similarities to normal human platelets. Over‐expression of anti‐apoptotic BCL2L2 in cultured MKs increased functional P1 MKs by 22.8% (P=0.049; n=5). Most importantly, MK proplatelet formation was increased by 58% (P=0.006; n=5), ultimately resulting in an increased CD41 + platelets (P=0.017; n=6). These in vitro platelets were functional, as demonstrated by thrombin‐induced αIIbβ3 activation (P=0.028; n=5) and α‐granule release (P=0.05; n=5). Overall, results showed that BCL2L2 restrains apoptosis in cultured MKs, promotes proplatelet formation and cultured platelet activation, and is associated with human platelet number.
Conclusion: BCL2L2 is a novel target for improving MK and platelet yields in culture systems and enforced expression of BCL2L2 may facilitate in vitro MK and platelet production.
Oral Abstract Session: Pediatric Transfusion Medicine
TS1‐SN5‐35
Blood Product Utilization in Very Low Birth Weight Infants
Ravi M. Patel*1, Neeta Shenvi2, Stephanie Meier1, Michael Hinkes3, John D. Roback1, Kirk A. Easley2 and Cassandra D. Josephson1
1Emory University School of Medicine, 2Rollins School of Public Health, 3Northside Hospital
Background/Case Studies: Very low birth weight (VLBW) infants are a highly transfused population. Estimated transfusion rates remain poorly characterized in this population. Rates of blood product utilization may inform the design of transfusion studies and provide data for individualized discussions with parents on the probability of their VLBW infant receiving a blood transfusion.
Study Design/Method: Secondary analysis of a prospective, multicenter observational cohort study from 2010‐2014. Infants with a birth weight ≤1500 g who were not transfused before admission were included and followed until 90 days, discharge, or death. All blood products transfused, including timing, were prospectively recorded. Blood product utilization rates, along with 95% confidence intervals, were estimated for transfusions of red blood cells (RBC), fresh frozen plasma (FFP), platelets (PLT) and cryoprecipitate (CRYO) per 100 hospital days. Birth weight and GA specific estimates were calculated and relative transfusion rates compared using incidence rate ratios.
Results/Finding: Among a study cohort of 598 VLBW infants, 2223 blood product transfusions were recorded during 37,369 infant days of follow‐up. Any blood transfusion occurred in 58% of infants, with RBC in 55% (rate: 4.4; 95% CI 4.2‐4.6), PLT in 18% (rate 1.1; 1.0‐1.2), FFP in 9% (0.4; 0.3‐0.5), and CRYO in 1% (0.02; 0.01‐0.04). Among birth weight strata, any blood transfusion occurred in 98% of infants < 750 g (rate 13.5; 12.7‐14.3), 73% between 750 to < 1000 g (rate 5.9; 5.5‐6.3) and 34% for infants 1000‐1500 g (rate 1.8; 1.6‐2.1). RBC transfusion rates decreased with increasing GA (Table). Rates at 23 wk GA were 13 fold higher (95% CI 9.1‐19) than for infants at >30 wk GA. We observed similar trends for PLT, but not FFP or CRYO.
Conclusion: Among VLBW infants, blood product utilization of RBC and PLT, but not FFP and CRYO, decrease with increasing GA. GA‐specific transfusion rates may inform discussions with families and guide the need for early and proactive consent. These data may also help inform the design of future studies examining blood product transfusion in VLBW infants.
(TS1‐SN5‐35)
| GA | Any transfusion | RBC | PLT | FFP | CRYO |
|---|---|---|---|---|---|
| 23 wk | 13/13 (100%) | 13.3 [11.2, 15.7] | 3.76 [2.74, 5.17] | 0.40 [0.15, 1.06] | 0.00 [0.00, 1.00] |
| 24 wk | 51/51 (100%) | 11.2 [10.2, 12.2] | 2.77 [2.29, 3.33] | 0.93 [0.67, 1.28] | 0.03 [0.00, 0.18] |
| 25 wk | 59/61 (97%) | 7.26 [6.53, 8.07] | 0.95 [0.71, 1.27] | 0.53 [0.36, 0.78] | 0.04 [0.01, 0.17] |
| 26 wk | 53/66 (80%) | 5.60 [4.99, 6.30] | 1.74 [1.41, 2.14] | 0.44 [0.29, 0.67] | 0.00 [0.00, 1.00] |
| 27 wk | 57/84 (68%) | 3.34 [2.91, 3.83] | 0.81 [0.61, 1.07] | 0.08 [0.03, 0.20] | 0.00 [0.00, 1.00] |
| 28 wk | 34/70 (49%) | 2.23 [1.82, 2.72] | 0.26 [0.14, 0.47] | 0.19 [0.09, 0.37] | 0.00 [0.00, 1.00] |
| 29 wk | 35/98 (36%) | 1.47 [1.19, 1.82] | 0.56 [0.40, 0.79] | 0.33 [0.21, 0.52] | 0.05 [0.02, 0.16] |
| 30 wk | 23/63 (37%) | 1.17 [0.85, 1.61] | 0.44 [0.26, 0.75] | 0.57 [0.36, 0.90] | 0.03 [0.00, 0.22] |
| >30 wk | 19/92 (21%) | 1.00 [0.72, 1.40] | 0.74 [0.50, 1.09] | 0.29 [0.16, 0.55] | 0.03 [0.00, 0.21] |
| All | 344/598 (58%) | 4.43 [4.22, 4.65] | 1.10 [1.00, 1.21] | 0.40 [0.34, 0.47] | 0.02 [0.01, 0.04] |
TS5‐SN5‐35
Improving the Sensitivity of Blood Product Culture to Detect Septic Transfusion Reactions in Neonatal and Pediatric Patients
Meghan Delaney*1,2,3, Claudia S. Cohn4, Nancy M. Dunbar5, Isabella Martin5, Andrew W.Y. Shih6 and Magali J. Fontaine7
1Children's National Health System, 2The George Washington University Health Sciences, 3Seattle Children's Hospital, 4University of Minnesota, 5Dartmouth‐Hitchcock Medical Center, 6University of British Columbia, 7University of Maryland School of Medicine
Background/Case Studies: Septic transfusion reactions (STR) are a significant risk of blood product transfusions. Pediatric patients are heavily transfused and suffer a higher rate of acute transfusion reactions (ATR) compared to adult patients (6.2 versus 2.1 per 1000 transfusions, respectively). There is not a uniform approach to detect contaminated blood products using product culture following an ATR in pediatric and neonatal patients. The goal of this project was to develop improved criteria for detection of STR by culture of residual product in neonatal and pediatric patients.
Study Design/Method: We collected retrospective data for all transfusion reactions that occurred in neonatal and pediatric patients (</ = 15 years of age) which resulted in culture of the residual product during calendar year 2016. We also collected the same data for any reactions with positive residual product culture results from 2012‐2015, to enrich the dataset for positive results. Using current AABB criteria for culturing a blood component following an ATR as a reference point, clinical parameters and culture results were compared to determine if modified criteria, including the use of age‐specific objective definitions for hypotension and tachycardia, would increase sensitivity for detection of positive residual product cultures (Table).
Results/Finding: 15 institutions submitted complete reaction data for 201 cultured residual components in pediatric and neonatal patients. Of these, 13 had positive culture results (7 platelet and 6 RBC products). Two were considered definite STR (patient cultures grew the same organism); 11 were considered possible STR (patient culture was negative, discordant, or the patient was not cultured).The sensitivity of the AABB criteria to detect any positive culture (definite + possible) was 23% (95% CI 6 – 54%); specificity was 66% (95% CI 59 – 73%). When modified criteria were applied the sensitivity improved to 77% (95% CI 46 – 94%) and the specificity decreased to 52% (95% CI 44 – 59%).
Conclusion: Modified criteria for culturing residual components for suspected STR in neonatal and pediatric patients offer better sensitivity for detection of a positive culture result but are less specific.
(TS5‐SN5‐35)
| AABB Criteria | Modified Criteria |
|---|---|
|
|
* Using age specific criteria and a 15% change from baseline
TS10‐SN5‐35
Comparison between Pediatric and Adult Adverse Transfusion Reactions Reported to the Quebec Hemovigilance System from 2005 to 2015
Nancy Robitaille*1,2, Karl Itaj Nawej3, Benoît Laliberté3, Pierre Robillard1 and Gilles Lambert3
1Hema‐Quebec, 2CHU Sainte‐Justine, 3Institut National de Santé Publique
Background/Case Studies: Non‐infectious adverse events to transfusion are well reported in adult recipients. However, the literature is scarce for pediatric recipients. The primary objective was to compare the rates of various adverse transfusion reactions (ATRs) reported to the Quebec Hemovigilance System (QHS) among < 18 and ≥ 18 years age recipients (children versus adults).
Study Design/Method: ATRs were investigated and reported by transfusion safety officers located in designated hospitals in Quebec. Standard definitions for ATRs were used. Data were validated by the hospital blood bank hematologist, a provincial TSO, a medical epidemiologist and a consultant hematologist. Rate comparisons were made using data from four pediatric hospitals that reported 91% of ATRs among children. Actual number of units transfused by hospitals was used for rate calculations.
Results/Finding: From 2005 to 2015, 3 629 868 blood components were transfused in all Quebec hospitals including 4.7% transfused to children. A total of 18 912 ATRs deemed possibly, probably or definitely associated with transfusion were reported. Of those, 1580 (8.4%) occurred among children. ATRs in infants < 1 year old represented 11% of all ATRs among children. Rates of ATRs for all labile product units transfused are described in table 1. Pediatric recipients were more likely to have experienced febrile, allergic and acute hemolytic reactions whereas adult recipients were more likely to have presented circulatory overload. Incidence of fatal ATRS was similar in both groups (0.1 and 0.2%). Rates of ATRs in children were higher with apheresis platelets (1:86) followed by red blood cells (1:109).
TABLE 1 (TS10‐SN5‐35) Rates of ATRs reported to the QHS by age group from 2005 to 2015.
| < 18 Years | ≥18 Years | |||
|---|---|---|---|---|
| ATRs | Rate | 95% CI | Rate | 95% CI |
| Febrile reactionsa | 1:244 | 1:224 to 1:268 | 1:494 | 1:482 to 1:505 |
| Minor allergica | 1:156 | 1:145 to 1:167 | 1:630 | 1:614 to 1:647 |
| Major allergica | 1:2 934 | 1:2 247 to 1:4 228 | 1:12 723 | 1:11 376 to 1:14 432 |
| Acute hemolytica | 1:8 020 | 1:5 325 to 1:16 236 | 1:30 851 | 1:26 048 to 1:37 825 |
| Delayed hemolytic | 1:8 020 | 1:5 325 to 1:16 236 | 1:17 173 | 1:15 096 to 1:19 912 |
| ABO incompatibility | 0 | 1:193 675 | 1:132 475 to 1:359 974 | |
| TRALI | 1:40 099 | 1:18 812 to 1:120 297 | 1:108 942 | 1:80 909 to 1:166 701 |
| Possible TRALI | 1:120 297 | 1:40 641 to 1:120 297 | 1:108 942 | 1:80 909 to 1:166 701 |
| Circulatory overloada | 1:5 728 | 1:4 012 to 1:10 009 | 1:3 228 | 1:3 046 to 1:3 433 |
| TOTALa | 1:84 | 1:80 to 1:89 | 1:201 | 1:198 to 1:204 |
* Statistically significant difference in rate
Conclusion: ATRs rates were twice as common in children compared to adults, mostly due to the higher occurrence of allergic and febrile reactions. Whether this is due to physiologic differences or better reporting remains to be determined.
TS17‐SN535
The Incidence of Transfusion‐Associated Microchimerism in Pediatric Patients
Rena Hirani*1, Bryony Ross2, Kathleen Irish2, Janis Chamberlain2 and David O. Irving1
1Australian Red Cross Blood Service, 2Hunter New England Local Health District
Background/Case Studies: Despite the introduction of leukodepleted blood components, it has been shown that donor leukocyte engraftment (microchimerism) remains a long‐term consequence of red blood cell (RBC) transfusion in some patient groups. The incidence of transfusion‐associated microchimerism (TAM) may be affected by international differences in blood processing methods, transfusion practices or patient types. In Australia, it was found that there was a 10% incidence of transfusion‐associated microchimerism (TAM) in trauma patients. However, the incidence of TAM has not been extensively studied outside of the trauma setting. This study was conducted to determine the incidence of TAM in Australian pediatric recipients of RBC units.
Study Design/Method: Pediatric patients in this study were defined as patients up to 16 years of age at the time of admission. Patients (n = 232) transfused with at least one red blood cell (RBC) unit between 2001 and 2012, were approached for participation in this study. The incidence of TAM was determined using PCR analysis with a panel of insertion/deletion (InDel) biallelic polymorphisms.
Results/Finding: Samples were returned from 32 of the potential participants. These were mostly hematology/oncology patients diagnosed with bone marrow failure usually as a result of acute lymphoblastic leukemia (ALL). Seventeen were female and fifteen male with an median age at the time of transfusion of 6 years old. The median number of RBC units transfused per patient was 8.5 and platelet units (whether apheresis or pooled) was 2. The mean storage age of RBC units transfused was 8.5 ± 6.4 days. Preliminary analysis indicates that 15.6% (n = 5) have InDel patterns consistent with the presence of TAM. Of these, 2 patients may have had exposure to non‐leukodepleted and non‐irradiated blood. However, the other 3 patients did not have any exposure to non‐irradiated or non‐leukodepleted blood components All of the potential microchimerism patients were diagnosed with bone marrow failure (ALL).
Conclusion: Preliminary results from this study shows the potential for transfusion‐associated microchimerism in chronically transfused pediatric patient populations. If confirmed, this would be the first reported finding of this transfusion associated consequence within this patient population. This would also indicate that leukodepletion/irradiation of RBC units does not eliminate the risk of this transfusion‐related outcome.
Australian governments fund the Australian Red Cross Blood Service to provide blood, blood products and services to the Australian community.
TS25‐SN5‐35
Transfusion of Pathogen Reduced (PR) vs. Conventional (CONV) Platelets in Pediatric Patients: An Assessment of Platelet Usage and Incidence of Transfusion Reactions
Wade L. Schulz*1, Amit Gokhale1, Jacob McPadden1, Bryan Spencer1,2, Burak Bahar1 and Edward L. Snyder3
1Yale University, 2American Red Cross, 3YNHH/Yale Medical School
Background/Case Studies: Platelet transfusions are used in thrombocytopenic pediatric patients to prevent or treat bleeding. To mitigate the risk of transfusing pathogen‐contaminated platelets, we began to migrate our institution's platelet inventory from CONV platelets to FDA‐licensed psoralen‐treated PR platelet products for all patients, including pediatric patients, in November 2016, as PR‐SDPs were FDA approved with no age restrictions. Due to inventory limitations from our blood supplier during the conversion period, a dual inventory of CONV and PR platelets was, of necessity, maintained. This offered an opportunity to analyze, over a 14‐month period, PR versus CONV platelets regarding platelet usage patterns and the incidence of transfusion reactions in patients 0‐18 years.
Study Design/Method: From December 2016 to January 2018, a dual platelet inventory was maintained. CONV platelets, analyzed with a bacterial detection assay as a safety measure, and PR platelets were both used as the standard of care. When platelets were requested, either product was issued per blood bank inventory management policy. We reviewed transfusions from this period to assess platelet usage patterns and transfusion reactions to CONV or PR platelet products in our pediatric patient population. Transfusions reactions were ascribed to the appropriate platelet product based on proximity to the transfusion and categorized per National Hemovigilance Network Guidelines. Statistics were mean±1 SD, significance was p<0.05.
Results/Finding: Patients from 0‐18 years received a total of 1,334 transfusions over this time period. There were 725 CONV platelet and 609 PR platelet transfusions administered to 180 unique patients. There were 99 patients who received only one type of platelet (CONV or PR). The other 81 patients received both types of platelets and were only included in the analysis of transfusion reactions. Of patients who received only CONV products, 86 transfusions were administered to 58 patients (1.5 ± 0.9 transfusions/patient). For patients who received only PR products, 82 transfusions were given to 41 patients (2.0 ± 1.6 transfusions/patient) (p=0.072). A total of 8 transfusion reactions were reported for this same time, with 5 reactions associated with CONV platelets (0.69% of transfusions) and 3 associated with PR platelets (0.49% of transfusions). No cases of TRALI, septic reactions, or other transfusion transmitted infections were reported in either group. For patients under 4 months who received ultraviolet blue light phototherapy and PR platelets, no reactions attributable to the PR transfusions were reported.
Conclusion: PR products are similar to CONV platelets in regard to platelet utilization patterns and the number of transfusion episodes per patient. The use of PR platelets in our pediatric patients also appears to be safe, with similar numbers of transfusion reactions compared to CONV platelets.
TABLE 1 (TS25‐SN5‐35)
| Type of reaction | CONV platelets (n = 725 units) | PR platelets (n = 609 units) | Total | P value (Significance = P<0.05) |
|---|---|---|---|---|
| Acute Hemolytic | 0 | 0 | 0 | NA |
| Allergic | 3 (0.4%) | 1 (0.16%) | 4 | 0.63 |
| FNHTR1 | 2 (0.2%) | 2 (0.33%) | 4 | 1.00 |
| Septic | 0 | 0 | 0 | NA |
| TACO2 | 0 | 0 | 0 | NA |
| TRALI3 | 0 | 0 | 0 | NA |
| TAD4 | 0 | 0 | 0 | NA |
| Hypotensive | 0 | 0 | 0 | NA |
| Total | 5 (0.69%) | 3 (0.49%) | 8 | 0.73 |
1 = Febrile Non‐Hemolytic Transfusion Reaction; 2 = Transfusion Associated Circulatory Overload; 3 = Transfusion Related Acute Lung Injury; 4 = Transfusion Associated Dyspnea
Oral Abstract Session: Product Storage Effects
BBC10‐SN5‐36
Reformulating the Red Cell Storage Solution: The Effects of Bicarbonate and Guanosine
Pieter F. van der Meer*1, Herbert G. Korsten1, Johan W. Lagerberg1 and Dirk de Korte1,2
1Department of Product and Process Development, Sanquin Blood Bank, 2Sanquin Research and Landsteiner Laboratory
Background/Case Studies: Red cells (RBCs) show a decline in ATP and 2,3‐diphosphoglycerate (2,3‐DPG) when stored under blood bank conditions. As a result, RBCs have a higher oxygen affinity, resulting in poorer oxygen delivery to the tissues. While this defect is corrected within 24 hours after transfusion, for immediate oxygen delivery and overall RBC quality, ATP and 2,3‐DPG levels should be close to values found in fresh whole blood.
Experimental RBC additive solution (RAS) Sol‐X (phosphate, adenine, bicarbonate, glucose and mannitol; absence of sodium chloride; pH=8.5) has optimized the quality of RBCs during storage. The key is maintaining the internal pH>7.2, so that the enzyme phosphoglycerate mutase remains able to synthesize 2,3‐DPG without decreasing ATP. This can be achieved by a high external pH, and also by the absence of chloride in the RAS. Addition of the RAS leads to chloride moving out of the RBC, and to maintain the electrolytic balance, hydrogen enters the cell, thus increasing the internal pH ("chloride shift"). Extra bicarbonate in the RAS can serve as additional buffer, preventing the drop in internal pH. Further, guanosine is known to shift RBC metabolism towards the pentose phosphate pathway, resulting in synthesis of NADHP, which can be used to synthesize 2,3‐DPG and ATP. The aim was to study the effect of addition of extra bicarbonate and guanosine to Sol‐X RAS on the in vitro quality of stored RBC concentrates.
Study Design/Method: One leukoreduced packed RBC concentrate was split in 4 equal parts. To each part, 24 mL of Sol‐X was added: part A, standard composition (with 26 mM bicarbonate); part B, extra 26 mM bicarbonate (52 mM total), part C, with 1.4 mM guanosine, and part D, with extra 26 mM bicarbonate (52 mM total) and 1.4 mM guanosine. The concentrates were stored for 56 days with weekly sampling to determine various in vitro quality parameters (n=3 replicate experiments).
Results/Finding: The results are shown in the Table. The addition of bicarbonate led to an increased external and internal pH, due to the chloride shift. However, this did not have an effect on 2,3‐DPG levels, and had a minor effect on ATP content. The presence of guanosine in addition to adenine led to a significant increase in ATP and 2,3‐DPG during storage, to which the addition of bicarbonate had no beneficial, and even a slightly deleterious, effect.
(BBC10‐SN5‐36)
| A | B | C | D | |
|---|---|---|---|---|
| Bicarbonate, mM | 26 mM | 52 mM | 26 mM | 52 mM |
| Adenine/Guanosine, mM | 2.0/0 | 2.0/0 | 0/1.4 | 0/1.4 |
| pHexternal | ||||
| Day 1 | 6.89 ± 0.03 | 7.01 ± 0.01* | 6.99 ± 0.02* | 7.00 ± 0.01* |
| Day 35 | 6.47 ± 0.04 | 6.57 ± 0.02* | 6.40 ± 0.03* | 6.44 ± 0.06 |
| Day 56 | 6.27 ± 0.04 | 6.36 ± 0.03* | 6.16 ± 0.03* | 6.19 ± 0.04* |
| pHinternal | ||||
| Day 1 | 7.03 ± 0.03 | 7.11 ± 0.01* | 7.03 ± 0.02 | 7.07 ± 0.01 |
| Day 35 | 6.52 ± 0.05 | 6.63 ± 0.04* | 6.36 ± 0.03* | 6.41 ± 0.04* |
| Day 56 | 6.26 ± 0.05 | 6.34 ± 0.03* | 6.12 ± 0.03* | 6.15 ± 0.04* |
| Chloride shift, mM, Day 1 | 3.0 ± 1.7 | 9.7 ± 0.6* | 8.0 ± 2.6* | 7.3 ± 1.2* |
| ATP, mmol/g Hb# | ||||
| Day 1 | 5.0 ± 0.9 | 5.4 ± 0.9* | 5.3 ± 0.7* | 5.2 ± 0.7* |
| Day 35 | 4.3 ± 0.6 | 5.0 ± 0.6* | 6.1 ± 1.1* | 5.4 ± 1.5* |
| Day 56 | 3.4 ± 0.6 | 3.9 ± 0.7* | 4.7 ± 1.0* | 4.1 ± 0.9* |
| 2,3‐DPG, mmol/g Hb | ||||
| Day 1 | 10.2 ± 0.6 | 10.6 ± 0.5* | 11.9 ± 0.3* | 11.9 ± 0.4* |
| Day 35 | 1.0 ± 0.5 | 1.5 ± 0.7* | 20.1 ± 8.6* | 18.7 ± 8.8* |
| Day 56 | 0.8 ± 0.4 | 1.2 ± 0.4 | 7.2 ± 4.0 | 6.8 ± 4.1 |
* p<0.05 versus group A; this is standard composition of SOL‐X;
# Hemoglobin
Conclusion: Extra bicarbonate in this RAS increased pH, but ultimately had no effect on ATP or 2,3‐DPG content during storage. The addition of guanosine increased ATP and 2,3‐DPG to levels that even on Day 56 conformed to acceptance criteria for stored RBC concentrates.
BBC7‐SN5‐36
Platelet Storage Properties Are Associated with Donor Age
Ido J. Bontekoe1, Davina Sijbrands1, Pieter F. van der Meer1, Johan W. Lagerberg1, Arthur J. Verhoeven2 and Dirk de Korte*3
1Department of Product and Process Development, Sanquin Blood Bank, 2Academic Medical Center, Tytgat Institute, 3Sanquin Research and Landsteiner Laboratory
Background/Case Studies: Previously it was shown that donors could be classified as having platelets (PLT) with good, average or poor storage properties. In a recent study we demonstrated that PLT storage performance was consistent by donor. A main difference between ‘good’ and ‘poor’ storage properties involved metabolic activity, resulting in a faster decline of pH during storage of ‘poor’ PLT concentrates (PC). This might be caused by mitochondrial defects which have been associated with age and age‐related diseases like metabolic syndrome and Type 2 diabetes. We aimed to test the hypothesis that PLTs obtained from young whole blood (WB) donors have better storage properties than PLTs from aged donors.
Study Design/Method: Fifteen WB donors < 30 and 11 donors > 45 year, were selected, and after overnight hold of the collected WB, a single‐donor PC (sPC) was prepared from the buffy coat and 60 mL plasma. The sPCs were stored for 8 days at 22 ± 2°C under suboptimal conditions in a 600 mL PVC‐DEHP container on a flatbed shaker with sampling on Day 1, 4 or 5 and 8 to determine the in vitro quality. The diabetic marker HbA1c was determined from red cells, and cholesterol and triglyceride levels from plasma. Storage data were analysed using an unpaired one‐sided t‐test.
Results/Finding: Young donors were 24 ± 3 years of age and aged donors were 60 ± 7 years. The aged donors had higher blood pressure before donation (148 ± 17/84 ± 8 vs 128 ± 13/75 ± 7 mmHg, p<0.01), higher HbA1c (38.6 ± 4.9 vs 34.1 ± 3.3 mmol/mol), total cholesterol (4.2 ± 0.7 vs 3.4 ± 0.6 mmol/L) and LDL‐cholesterol (2.3 ± 0.6 vs 1.8 ± 0.5 mmol/L) than young donors. All young donors had HbA1c within the normal range of 20‐42 mmol/mol but 2/11 aged donors had HbA1c>42 mmol/mol, indicative for Type 2 diabetes. The sPCs of both groups had the same volume (71 ± 3 vs 72 ± 2 mL) and PLT content (73 ± 8 vs 74 ± 11x109). On Day 8, sPCs from young donors showed lower lactate production (0.15 ± 0.04 vs 0.26 ± 0.13 mmol/day/1011 PLT, p<0.01) and higher pH37°C (6.84 ± 0.15 vs 6.40 ± 0.48, p<0.01). The young group had only one outlier (pH=6.37), whereas the aged group contained 5 sPCs with a pH <6.3, not being outliers and including the two donors with high HbA1c. Also other in vitro variables reflected better in vitro quality of the young group than the aged group. However, no differences in mitochondrial membrane potential, as measured with JC‐1, were detected.
Conclusion: PCs prepared from buffy coat, obtained from young WB donors showed better storage performance than those from aged donors. This may have an impact on donor selection for platelet production, especially for single‐donor apheresis products. The higher glycolysis rate in PLTs from aged donors indicates partial mitochondrial dysfunction due to aging and/or (pre)diabetes, however, it is not reflected in a reduction of the membrane potential.
BBC17‐SN5‐36
Dose‐Response Effects of Ibuprofen on Platelet Aggregation during Storage
Ido J. Bontekoe1, Stéphanie Groot1, Davina Sijbrands1, Pieter F. van der Meer1, Johan W. Lagerberg1 and Dirk de Korte*2
1Department of Product and Process Development, Sanquin Blood Bank, 2Sanquin Research and Landsteiner Laboratory
Background/Case Studies: Buffy coats (BC) from donors who used pain medication like aspirin, diclofenac, ibuprofen and naproxen up to 4 days prior to the donation are discarded in our centre, because a known side effect of these non‐steroidal anti‐inflammatory drugs is inhibition of platelet aggregation. These drugs inhibit the enzyme cyclooxygenase‐1 in a reversible or irreversible manner, thereby blocking synthesis of thromboxane A2 from arachidonic acid (AA). Previously, little or no deviations were observed in single platelet concentrates (PC), prepared from BC and plasma obtained from donors who used ibuprofen, including aggregation properties with ADP or collagen. This was explained by the known fast (<24 hour) disappearance of ibuprofen from the blood circulation and the reversible binding to platelets. Levels of ibuprofen in PC were <10 mg/L. It was our aim to investigate the effects of different ibuprofen doses on in vitro quality of PC in PAS‐E during storage, in particular on aggregation properties.
Study Design/Method: On Day 1, leukoreduced PC (n=3) were prepared from 5 BC and 300 mL PAS‐E and aliquoted into 4 units of 70 mL. To 3 of these units 1 mL of ibuprofen (Sandoz, granular) solution was added, adjusted to reach final concentrations of 5, 10 or 20 mg/L. To 1 control unit 1 mL of NaCl 0.9% was added. The PC were stored on a flatbed shaker at 22 ± 2°C in a 600 mL container and sampled on Day 2, 5 and 8 for in vitro quality. Light transmission aggregometry was performed by stimulation with AA, also on Day 1 15, 60 and 240 minutes after addition of ibuprofen. A repeated measures ANOVA with Dunnetts post‐test was applied for statistical analysis.
Results/Finding: During storage, no differences in pH, lactate production, CD62P expression, Annexin A5 binding, swirling effect or MPV between the groups were observed (data not shown). Aggregation with AA was reversibly inhibited by lower concentrations of ibuprofen: with 5 mg/L aggregation was fully recovered after 60 minutes, with 10 mg/L aggregation was almost fully recovered after 24 hours (>80%, p<0.05). In PC with 20 mg/L, no recovery of aggregation was observed throughout storage (<5%).
Conclusion: Storage properties of PC in PAS‐E with added ibuprofen were comparable with controls, confirming former results. Aggregation with AA showed clear dose‐response effects ranging from almost immediate and full recovery with 5 mg/L ibuprofen to full impairment until Day 8 with 20 mg/L. Because expected levels in BC from donors who used ibuprofen are <10 mg/L, use of BCs obtained from a donor who used ibuprofen is considered still feasible for pooled BC, due to dilution with PAS‐E. In vitro quality of PC in PAS‐E will be further investigated in a ‘best case’ scenario with 1/5 BC obtained from such a donor.
BBC29‐SN5‐36
Storage Additives Impact Stored Red Blood Cell Metabolism As Much As Storage Time
Angelo D'Alessandro*1, Rachel Culp‐Hill1, Julie A. Reisz1, Travis Nemkov1, Connie Zheng1, Sarah Gehrke1, Mikayla Anderson2, Xiaoyun Fu2, Tamir Kanias3, Mars Stone4, Grier Page5, Mark T. Gladwin3, Steve Kleinman6, Michael P. Busch4 and James C. Zimring2
1University of Colorado Denver, 2BloodworksNW Research Institute, 3Vascular Medicine Institute, University of Pittsburgh, 4Blood Systems Research Institute, 5RTI International, 6University of British Columbia
Background/Case Studies: Biological and manufacturing variability have been recognized as key factors impacting red blood cell storage and, potentially, transfusion outcomes. Metabolomics approaches can be used to assess the impact of these factors on the phenotypes of stored packed red blood cells (pRBC).
Study Design/Method: The multi center RBC‐Omics Study enrolled 13,603 whole blood donors from four different US blood centers. Based on 3 end‐of‐storage (42 day) RBC hemolysis measures (spontaneous, osmotic stress, oxidative stress), selected donors at each end of the hemolysis spectrum for each measure were recalled to donate a second unit of leukocyte‐filtered pRBCs. Study samples drawn from the pRBC units at 10, 23 and 42 days were snap frozen and later processed for Ultra‐High Pressure Liquid Chromatography coupled to Mass Spectrometry (Vanquish – Q Exactive, Thermo Fisher). Feature to compound assignments were performed via Compound Discoverer 2.1 (Thermo Fisher) on the basis of high‐resolution accurate intact mass, isotopic patterns, retention times against an in house standard library of >1,000 pure chemical compounds, stable isotope‐labeled internal standards (including previously established markers of the metabolic age of pRBC) and MS/MS validation of transition fingerprints.
Results/Finding: Untargeted metabolomics analyses included 599 samples from 250 donors. There were strong impacts of pRBC storage duration (14.2% of variance) and blood center of collection (12.2% of variance) on metabolic phenotypes. The latter difference was attributable to the additive solutions (AS) used at the different sites (AS‐1 vs AS‐3; area under the Receiver Operating Characteristic Curve = 1.0). Of note, minimum variance was observed across the 3 blood centers using AS‐3, suggesting an overall consistency in standardization of blood processing protocols. The metabolic phenotypes of samples stored in different AS differed beyond the components of the additive formulations; e.g., samples stored in mannitol‐free/citrate loaded AS‐3 were characterized by higher levels of high‐energy compounds, increased glycolytic rates (higher ATP and DPG) and total glutathione levels – all factors significantly correlating with RBC propensity to hemolyze when challenged with pro‐oxidant agents such as 2,2‐azobis‐2‐methyl‐propanimidamide dihydrochloride. Increased methionine metabolism and activation of the trans‐sulfuration pathway was noted in samples processed at the site that used AS‐1.
Conclusion: This study highlights the impact of storage additives on the metabolic heterogeneity and hemolytic phenotypes of samples processed in the largest multi‐center RBC metabolomics study conducted to date, an observation that may contribute to explaining the difference in results between small‐scale single‐center laboratory studies and clinical trials on the age of blood.
INV1‐SN5‐36
Metrics Associated with Expansion of 7‐Day Platelets from a Pediatric Transfusion Service to a Hospital System
Alex Ryder* and Dawn Moreau
Le Bonheur Children's Hospital
Background/Case Studies: Due to their short 5‐day shelf‐life and required bacterial culture release testing, platelets present a significant inventory management challenge. With the recent FDA clearance of a rapid testing platform for bacterial contamination as a “safety measure,” hospital transfusion services now may extend platelet shelf‐life to 7‐days under many circumstances. Our Pediatric Transfusion Service recently implemented this testing platform, and soon thereafter extended our testing to include day‐6 and day‐7 platelet units from two Adult Hospital Transfusion Services within our hospital network. Here, we describe metrics associated with these implementations.
Study Design/Method: Pre‐implementation data was gathered over a 9‐month period, for platelets received into inventory at our Pediatric Transfusion Service, as well as two affiliated Adult Transfusion Services, from January 1, 2017 through September 30, 2017. Descriptive statistics regarding platelet transfusions and expiration were compared to the 6‐month post‐implementation period, from October 1, 2017 through March 31, 2018 for our Pediatric Transfusion Service, and a 3‐month post‐implementation period of January 1, 2018 through March 31, 2018 for our affiliated Adult Transfusion Services. Platelets products consist entirely of single‐donor apheresis units. Units are considered expired if they reach outdate prior to being transfused or used for aliquot preparation.
Results/Finding: During the 9‐month pre‐implementation period, our Pediatric Transfusion Service received 344 apheresis platelet units, of which 101 expired prior to use (29.4%). During the 9‐month pre‐implementation period, the two combined Adult Transfusion Services received 4358 apheresis platelet units, of which 285 expired prior to use (6.5%).
During the 6‐month post‐implementation period, our Pediatric Transfusion Service received 258 apheresis platelet units, of which 23 units expired prior to use (8.9%). During the post‐implementation period, 51 platelet units were PGD tested; 21 units tested once, and 30 units tested twice, for a total of 81 tests. We estimate having spent $2430 on testing ($30/test). Of the 51 tested units, 30 were used for transfusion, representing approximately $15,000 in savings ($500/unit). Additionally, the 21 outdated PGD‐tested units provided an additional 41 days of platelet stock. We estimate that this amounts to an additional $7590 in cost avoidance, as replacement units were not purchased.
During the 3‐month period during which testing was extended to platelets for the affiliated Adult Transfusion Services, 1162 units were transfused. Of these, 81 were day‐6 or day‐7. The total number of expired units was 47 (3.9%), which represents a significant decrease from the pre‐implementation period. Savings from transfusion of day‐6 and day‐7 extended platelets during this short period of time is estimated to be $40,500 ($500/unit).
Conclusion: We describe the recent implementation of an FDA‐cleared rapid bacterial test for platelets as a “safety measure” to achieve a 7‐day outdate at a Pediatric Transfusion Service, and the subsequent extension of this practice to positively impact inventory management at two associated Adult Transfusion Services. As we continue to improve the logistics of the process, we believe this testing will continue to decrease platelet wastage, while increasing platelet availability and patient safety.
BBC11‐SN5‐36
Storage of Platelets in PAS‐5 with 10% Plasma as a Function of Apheresis Instrument and Storage Container
Stephen Wagner*1, Cheryl Hapip1, Annette Turgeon1, Lenora A. Abel1 and Nadine Kaelber2
1American Red Cross Holland Laboratory, 2FDA
Background/Case Studies: The storage properties of apheresis platelets suspended in the experimental additive solution, PAS‐5, and 10% plasma may be affected by collection instrument or storage container. This study evaluated the impact of Amicus (A) or Trima (T) collection platforms on platelets collected from the same donors that were stored in either of the two manufacturer's containers.
Study Design/Method: The same consenting 12 donors provided A or T platelets with concurrent plasma with a targeted yield of 4 × 10¹¹ platelets on 4 occasions in 100% plasma. Following collection, platelets were rested 1‐4 hours and then centrifuged at 22˚C and 3800 rpm (5.5 × 10⁷ ACE), plasma expressed, and resuspended in PAS‐5 to yield units with 10% plasma. Following 1‐2 hours rest, platelets were placed on the agitator and either maintained in the original storage container or transferred to the other manufacturer's storage container and placed on the agitator. On days 1, 5 and 7, units were assayed for in vitro testing including platelet count, pH, blood gases, mitochondrial membrane potential, reactive oxygen species, extent of shape change (ESC), hypotonic shock response, aggregation to ADP + collagen, glucose, lactate, bicarbonate, morphology, CD42b, CD62P, and annexin V binding. Data were analyzed by repeated measures ANOVA and Bonferroni post‐test; a ANOVA p value of 0.001 was considered significant due to repeated measures.
Results/Finding: Average unit volume, yield and percent plasma was 291 ± 11 mL, 3.7 ± 0.4 × 10¹¹, and 10.3 ± 0.7%, respectively, and were comparable between collections with either apheresis instrument and stored with either manufacturer's container. Day 1 platelet activation was 40 ± 22% and was similar in either collection instrument or container. Except for pH (days 1, 5), CO2 (days 1, 5, 7) and ESC (day 5), every other in‐vitro parameter was similar between apheresis platforms or manufacturer's container. Day 5 values for pH, CO2 and ESC are given in the table below. pH values of all units on all days of storage were ≥6.8 except 1 unit that was collected on T and stored in an A container, which had a pH of 5.7 on Day 7 and a pH of 6.8 on Day 5.
Conclusion: Based on in vitro measures, storage of platelets suspended in PAS‐5 with 10% plasma is feasible in the original manufacturer's container for 7 days. Based on CO2 levels, T containers have greater gas exchange than A containers.
| Assay | A/A bag | A/T bag | T/T bag | T/A/bag |
|---|---|---|---|---|
| pH[Link] | 7.34 ± 0.11 | 7.50 ± 0.06 | 7.49 ± 0.10 | 7.27 ± 0.17 |
| CO2 (mm Hg)[Link] | 22.7 ± 3.4 | 16.4 ± 2.0 | 18.1 ± 2.8 | 24.1 ± 5.5 |
| ESC (%)[Link] | 19.8 ± 8.4 | 21.9 ± 7.7 | 21.4 ± 6.1 | 13.5 ± 6.3 |
ANOVA, p<0.001
Oral Abstract Session: Patient Blood Management
PBM1‐ST4‐22
Utilizing Thromboelastography (TEG) as a Bleeding Risk Assessment Tool Prior to Interventional Radiology Procedures
Christine Cahill*1, Ashwani Sharma1, Neil Blumberg1, Amy E. Schmidt1 and Majed A. Refaai2
1University of Rochester, 2Transfusion Medicine, University of Rochester
Background/Case Studies: The international normalized ratio (INR) is commonly used as a bleeding risk assessment prior to invasive procedures. This practice may be sub optimal as INR was developed to monitor warfarin therapy and is primarily affected by factor VII activity. Several society guidelines recommend correcting INR to ≤1.5 prior to procedures to mitigate bleeding risks,which is not evidence based. Plasma transfusion or prothrombin complex concentrates (PCC) with and without vitamin K administration are usually used for this purpose. TEG is a whole blood assay which measures the full spectrum of primary and secondary hemostasis and may be a superior tool for risk assessment.
Study Design/Method: Records of 14 patients undergoing interventional radiology procedures were collected over a 5‐month period and retrospectively reviewed. All patients had TEG in addition to the traditional laboratory screening assays run prior to their procedures. Patient characteristics, medical conditions, laboratory results, and adverse events were collected and analyzed (Table).
Results/Finding: Average age of our cohort was 70 ± 12.2 years with the most common diagnosis being pulmonary disorders (7/14), coronary artery disease (5/14), and/or renal failure (5/14). The interventional radiology procedures performed were biopsies (5/14), central line and catheter placement (5/14), thoracentesis (3/14) and drain placement (1/14). Pre‐procedure renal and liver chemistry profiles showed 4/14 had mild to moderate liver abnormalities and 3/14 had renal failure. Nine patients were on warfarin, 1 patient was on a direct oral anticoagulant (apixiban), and 2 patients were on aspirin. Although the pre‐procedure INRs were > 1.5, with an average of 2.3 ± 0.9, TEG results were largely normal suggesting a low risk of bleeding (Table). No bleeding complications, blood product transfusions, or vitamin K administration were given.
Conclusion: In this pilot study TEG appears to be a superior assay to assess bleeding risks in patients undergoing invasive interventional radiology procedures, particularly for patients receiving oral anti‐coagulation. Although the INRs were higher than suggested guidelines no patients had significant bleeding or complications. Further studies using a larger cohort are warranted to evaluate for consistent trends.
TABLE Thromboelastography and INR results performed prior to the interventional radiology procedure. Data are shown in mean ± standard deviation, median, and (range)
| Thromboelastography (TEG) | ||
|---|---|---|
| N=14 | Reference Range | Value |
| R Time (min) | 4.0‐10.0 | 6.9 ± 2.6 6.9 (3.4‐10.6) |
| K Time (min) | 1.0‐3.0 | 1.5 ± 0.6 1.5 (0.8‐2.7) |
| a angle (degree) | 53.0‐73.0 | 69 ± 9 69 (56‐79) |
| MA (mm) | 50.0‐72.0 | 69 ± 9 69 (54‐79) |
| LY 30 (%) | 0‐7.5 | 1.3 ± 1.3 1 (0‐3.9) |
| CI | ‐3.0‐3.0 | 0.8 ± 2.7 1.2 (‐4.9‐4.6) |
| Coagulation Tests | ||
| INR | 0.9‐1.1 | 2.3 ± 0.9 2.2 (1.2‐4.9) |
| PT (sec) | 10.0‐12.9 | 27.4 ± 10.3 25.4 (16.6‐57.7) |
| Hemoglobin (mg/dL) | 11‐14 | 8.8 ± 1.8 8.5(6.4‐13.1) |
| Platelet (×109/L) | 150‐330 | 205 ± 98 177(59‐380) |
PBM2‐ST4‐22
Utility of Single Versus Double Platelet Transfusions for Adult Oncology Outpatients
Eric Gehrie*1, Steven M. Frank1, Mary Kate Grabowski1, Aaron Tobian2, Valerie Strockbine3, Sandra K. Thoman3, Kayla Erculiani1, Vincent M. Demario1, Kristin Uglik1, Joan S. Boyd3, Paul M. Ness1, Amy Dezern1 and Evan M. Bloch2
1Johns Hopkins Medical Institutions, 2Johns Hopkins University School of Medicine, 3The Johns Hopkins Hospital
Background/Case Studies: Very few data exist to guide the dosing platelets PLTs for oncology outpatients. At our center, specialized coordinators assign PLTs to oncology patients, and recommend either one or two single donor apheresis PLTs for transfusion based on each pts medical and transfusion history (e.g., ABO type, HLA antibody status, splenomegaly, body mass, response to previous transfusions), as well as PLT attributes (ABO type, PLT yield, volume). In this study, we sought to determine whether the transfusion of one versus two units of apheresis PLTs t had an effect on post‐transfusion PLT count, time to next transfusion, or the PLT count prior to the next PLT transfusion.
Study Design/Method: After obtaining IRB approval, we retrospectively studied all adult oncology pts who received an outpatient transfusion from 7/1/2016 through 11/7/2017. We collected the date and time of transfusion, unit number, and date and time of pre‐ and post‐transfusion PLT counts.
Results/Finding: A total of 605 pts received 8,491 PLT transfusions cumulatively during the study period. The majority of pts (n=363, 60%) were variably transfused with 1 or 2 PLTs per outpatient visit while a minority were transfused exclusively with a 1 PLT‐only (17.2%) or 2 PLT‐only (22.6%) strategy throughout the study period. The vast majority (n=7809, 92%) of PLTs were given to patients who received a mixture of 1‐PLT and 2‐PLT transfusions during the study period. As summarized in Table 1, the pre‐ and post‐ transfusion PLT counts and interval between outpatient visits were medically similar (although statistically different) regardless of transfusion strategy. Additionally, pts who received 2 PLTs returned for their next clinic visit with the same PLT count as patients who received 1 PLT.
Conclusion: In this study of adult oncology pts, a 1 vs. 2 PLT transfusion strategy did not appear to have a clinically significant impact on the post‐transfusion platelet count or the time between clinic visits. With this retrospective dataset, it is not clear whether this represents the limited utility of a 2 PLT transfusion strategy, or the influence of our transfusion coordinators who select units for pts based on patient‐specific and product‐specific factors. Further work, ideally a randomized clinical trial, is needed to determine the optimal platelet dose for adult oncology pts.
(PBM2‐ST4‐22)
| Parameter | 1 PLT Strategy | 2 PLT Strategy | P‐Value |
|---|---|---|---|
| Pre‐Transfusion PLT Count (K/mcL) | 11 (8 – 19) | 10 (7 – 17) | <0.0001 |
| Post‐Transfusion PLT Count (K/mcL) | 37 (25 – 52) | 43 (28 – 61) | <0.0001 |
| Time to Next Clinic Visit (days) | 3 (2 – 4) | 3 (2 – 4) | – |
| PLT Count at Next Clinic Visit (K/mcL) | 11 (8 – 18) | 11 (7 – 18) | – |
* Data are reported as median (IQR) and P‐values were calculated via Mann Whitney U tests.
PBM3‐ST4‐22
Patient Blood Management Program Implementation in Hematopoietic Stem Cell Transplantation
Nilesh Jambhekar*, Salwa Saadeh, Justin D. Kreuter, Andrew Higgins, Nageswar Madde, Eapen K. Jacob, Alberto Marquez, William Hogan, Jennifer Burt, Daryl J. Kor and Matthew A. Warner
Mayo Clinic
Background/Case Studies: Hematopoietic stem cell transplantation (HSCT) patients are among the highest utilizers of allogeneic red blood cell (RBC) and platelet (PLT) products, yet the impact of Patient Blood Management (PBM) efforts on healthcare delivery and patient‐centered outcomes in these patients remains incompletely defined.
Study Design/Method: This before‐after observational study was conducted with IRB approval. A multidisciplinary PBM program was initiated in 2014 including education with dissemination of AABB best practice guidelines and electronic clinical decision support for transfusion orders. The pre‐PBM cohort included patients receiving HSCT from 1/1/2013 ‐ 9/31/2013 with a post‐PBM cohort of 1/1/2015 ‐ 9/31/2015. All outcomes were assessed from HSCT to post‐transplant day 90. Healthcare delivery outcomes included frequency and proportion of RBC and PLT transfusions, total transfusion quantities, transfusions occurring outside of guidelines, and activity‐based costs of transfusions. RBCs administered for hemoglobin values greater than 7 g/dL and PLT transfusions for PLT counts greater than 10 × 109/L were considered outside of guidelines, though sensitivity analyses were performed to account for acceptable discordance (e.g. coronary disease, neutropenic fever). Patient‐centered outcomes included mortality, hospital and ICU admission rates, transfusion reactions, cerebrovascular and coronary ischemic events, and infections.
Results/Finding: 365 patients received HSCT in 2013 and 367 in 2015; both cohorts shared similar demographic and comorbidity profiles. 291 patients (80.0%) were transfused with RBCs in 2013 compared to 232 (63.7%) in 2015 (p<0.0001). Transfusion volumes were lower in 2015 [median (IQR) 3 (2, 4) vs. 2 (1, 4) units for 2013 and 2015, respectively, p=0.004] with RBC transfusion totals of 1179 units in 2013 and 842 units in 2015. In 2013, 287 (99.3%) of RBC transfusions occurred outside of guidelines compared to 117 (50.2%) in 2015 (p<0.0001). Regarding PLT transfusions, 342 patients (93.7%) were transfused in 2013 versus 343 (93.5%) in 2015 (p=0.428); the median transfusion quantity was 3 (2, 5) units in 2013 compared to 2 (1, 4) units in 2015 (p=0.0006) with higher transfusion totals in 2013 (1716 vs. 1456 units). 285 (83.3%) PLT transfusions occurred outside of guidelines in 2013 versus 178 (51.9%) in 2015 (p<0.0001). Activity‐based transfusion costs were $3,336,192 and $2,710,352 in 2013 and 2015, respectively. There were no significant differences in patient‐centered outcomes.
Conclusion: PBM program implementation in the setting of HSCT was associated with reductions in total transfusions and transfusions occurring outside of guidelines. Cost savings exceeded $625,000 over a 9‐month period with no changes in patient‐centered outcomes.
PBM4‐ST4‐22
Pre‐Operative Anemia Management Program Reduces Blood Transfusion in Elective Cardiac Surgical Patients
Christine Cahill*1, Neil Blumberg1, Amber Melvin1, Peter Knight1, Marjorie Gloff1, Renee Robinson1, Frank Akwaa1 and Majed A. Refaai2
1University of Rochester, 2Transfusion Medicine, University of Rochester
Background/Case Studies: Anemia is prevalent in up to 50% of hospitalized patients. It's an independent risk factor for hospitalization, readmission, prolonged length of stay, diminished quality of life, and increased risk of morbidity and mortality. To mitigate these risks, a multidisciplinary program was implemented to manage anemia pre‐operatively as a patient blood management (PBM) initiative.
Study Design/Method: From 2/2016‐9/2017, patients (N=240) presenting for elective cardiac surgery were screened for anemia (Hgb<12g/dL). 58(24%) patients were found to be anemic and referred for anemia workup to determine cause and appropriate management. 33(57%) patients were found to have iron deficiency anemia and 25(43%) were deemed anemic due to other reasons. A historical cohort of patients undergoing elective cardiac surgery with Hgb<12g/dL from 3/2015‐7/2015 (N=92) served as control group. Comparisons were controlled for age, sex, and procedures. Primary outcome was perioperatively blood transfusion. Secondary outcomes were date‐of‐surgery Hgb, red blood cell (RBC) transfused/patient, and cost analysis.
Results/Finding: The two most common treatments were intravenous iron +/‐ folate (N=27; 47%) and folate + /‐B12 (N=17; 29%) 7(12%) patients received no treatment and 2 were diagnosed with hematologic malignancies. None of the patients receiving IV Iron (Fereheme) had any complications or reactions. Study patients had significantly lower rates of RBC transfusion compared to the historical cohort (24% vs 60%, p<0.0001) and had higher day‐of‐surgery Hgb (11.01 vs. 10.16 g/dL, p<0.001) (Table). Study patients also had a decrease in blood utilization from 2.07 to 0.4 RBC units/patient (p<0.0001). Analysis of RBC acquisition cost and transfusion cost also showed significant saving ($367 and $1,837/patient, respectively).
Conclusion: Our pilot anemia program, which only started in one group of surgical patients, showed significant reduction in RBC transfusion rates and costs. Although it was not measured in this study, patient outcome, safety, and hospital/ICU length of stay would be important aspects for consideration in any future studies.
(PBM4‐ST4‐22)
| Historical Data (N=92) | After Anemia Management (N=58) | ||||
|---|---|---|---|---|---|
| ± SD | Range | ± SD | Range | P valuea | |
| Hgb at Anemia Diagnosis (g/dL) | ‐ | ‐ | ± 1.46 | 8‐13.8 | ‐ |
| Hgb at Day of Surgery (g/dL) | ± 1.45 | 6.8‐12 | ± 1.27 | 8.2‐13.8 | <0.001 |
| RBC Transfusion During Surgery (Unit) | ± 1.37 | 0‐6 | ± 0.5 | 0‐2 | <0.001 |
| RBC Transfusion Post‐Surgery (Unit) | ± 2.17 | 0‐9 | ± 0.56 | 0‐3 | <0.0001 |
| Total RBC Transfusion (Unit) | ± 2.6 | 0‐10 | ± 0.9 | 0‐5 | <0.0001 |
* Student‐t test
TS8‐ST4‐22
Benchmarking Preventable Patient Harm Due to Inappropriate Transfusion Orders
Sara Bakhtary*, Jennifer S. Woo, Russell Thorsen, Morvarid Moayeri and Elena Nedelcu
UCSF Health
Background/Case Studies: Appropriate transfusion of blood products is of paramount importance for patient safety. However, there is broad variation in physician ordering practice and overutilization of blood products is common despite evidence‐based transfusion guidelines. Although medical errors and associated patient harm due to transfusion are monitored by transfusion medicine services, there is currently no benchmark for preventable patient harm due to inappropriate transfusion orders. Here we report preventable patient harm caused by transfusion reactions due to inappropriate blood product orders.
Study Design/Method: This is a retrospective study of transfusion reactions occurring from January 1, 2018 to March 30, 2018 at hospitals affiliated with our academic institution. Transfusion reactions classified per the National Healthcare Safety Network Hemovigilance Module were reviewed. Each case was interpreted as appropriately ordered, with questionable indication, or inappropriately ordered when compared against our institution's transfusion guidelines. Patient harm was recorded based on our institution scale. Relative and absolute rates of transfusion reactions due to inappropriate orders were calculated.
Results/Finding: A total of 91 transfusion reactions were reported during the study period. Transfusion reactions were associated with transfusion of red blood cells (RBC) (62%), platelets (35%), and fresh frozen plasma (3%). No reactions were reported for cryoprecipitate transfusion. Review of blood product orders for transfusions resulting in reactions revealed that approximately 60% were indicated, 26% had questionable transfusion indication and 14% were not indicated. Most transfusion reactions (96.7%) had mild patient impact, however three reactions (3.3%) were severe at the time of assessment. These include one possible transfusion‐associated circulatory overload (TACO) requiring intubation from an RBC product ordered for a non‐bleeding non‐cardiac patient with a hemoglobin of 8.3 g/dL (not indicated), one probable TACO from an RBC product ordered for a patient with hemoglobin of 7.2 g/dL (questionable indication), and one contaminated platelet transfusion in a patient with a platelet count of 5 x10E9/L (indicated). The latter required care escalation and eventually resulted in death months after transfusion. The absolute rate of patient harm caused by transfusion reactions with inappropriate orders was 0.94 per 1000 transfusions (0.87 and 0.07 per 1000 transfusions for mild and severe patient harm respectively). No fatalities were related to inappropriate blood orders.
Conclusion: Relative and absolute rates of preventable patient harm due to inappropriate blood orders are reported. These may potentially represent quality indicators of transfusion practice.
TS14‐ST4‐22
Perioperative Blood Transfusions Do Not Impact Disease‐Free and Overall Survival after Surgery for Epithelial Ovarian Cancer: A Propensity Score Analysis and Systematic Review
Oliver Hunsicker*1, Sara Gericke1, Alexander Krannich2, Oliver Meyer3, Ioana Braicu4, Claudia Spies1, Axel Pruß3, Jalid Sehouli4 and Aarne Feldheiser1
1Department of Anesthesiology and Operative Intensive Care Medicine (CCM, CVK), Charité ‐ Universitätsmedizin Berlin, 2Experimental and Clinical Research Center, Charité ‐ Universitätsmedizin Berlin and Max Delbrueck Center for Molecular Medicine in the Helmholtz Association, 3Institute of Transfusion Medicine, Charité ‐ Universitätsmedizin Berlin, 4Department of Gynecology, European Competence Center for Ovarian Cancer, Charité ‐ Universitätsmedizin Berlin, Campus Virchow‐Klinikum
Background/Case Studies: Safety of allogeneic red blood cell transfusion (RBCT) has been challenged in oncological patients as RBCT has been linked to deleterious immunomodulatory effects promoting cancer recurrence and decreasing survival of patients after curative surgery. Therefore, the objective of this study was to assess the relation of perioperative RBCT with cancer recurrence in patients undergoing surgical tumor debulking due to primary ovarian cancer.
Study Design/Method: Patients were identified from the prospectively maintained Tumor Bank Ovarian Cancer database. Patients were eligible if they underwent surgical tumor debulking due to primary ovarian cancer between 2006 and 2014 and if they had complete cytoreduction after surgery. The primary endpoint was disease‐free survival (DFS). Propensity score matching (PSM) was used to remove the effect of confounders on outcome. An ethical approval was obtained from the ethical committee (Charité ‐ Universitätsmedizin Berlin, No. EA4/128/17). A systematic review and meta‐analysis were also conducted including cohort studies published from January 2000 to February 2018 and incorporating the findings of this study. The systematic review was registered prospectively with the PROSPERO database (CRD42016050009).
Results/Finding: A total of 529 patients with a median follow‐up of 51.4 months (95% confidence interval [CI], 46.1‐56.5) were eligible for analysis. Of those, 408 patients (77.1%) received perioperative RBCT. Patients’ characteristics were highly biased regarding RBCT. In unadjusted analysis, RBCT was associated with increased risk of cancer recurrence or death (hazard ratio (HR) of DFS 2.71 [95% CI, 1.94–3.77], P < 0.001). In PSM adjusted analysis, confounders were well balanced and RBCT did no longer increase risk of cancer recurrence or death. Findings of the meta‐analysis of 3 trials, including data from this study, confirmed that perioperative RBCT did not affect disease‐free survival after ovarian cancer surgery.
Conclusion: Worse oncological outcomes in patients without macroscopic tumor residuals after surgery for ovarian cancer who received perioperative RBCT are caused by the clinical circumstances requiring transfusions, not due to the blood transfusions themselves. Concerns about oncological outcomes should not be an issue in the decision‐making process for perioperative RBCT.
Oral Abstract Session: Basic and Clinical Aspects in Immunohematology
IGT1‐ST4‐23
Low Cost High‐Throughput Next Generation Sequencing Based Blood Group Typing Using Molecular Inversion Probes
William J. Lane*1,2, Ozkan Aydemir3, Changxin Shen4, Sunitha Vege5, Nicholas Hathaway3, Yong Zhao6, Connie M. Westhoff5 and Jeffrey A. Bailey3,6
1Department of Pathology, Brigham and Women's Hospital, 2Harvard Medical School, 3Program for Bioinformatics and Integrative Biology, University of Massachusetts Medical School, 4Genetic Diagnosis Centre and Blood Transfusion Department, Zhongnan Hospital of Wuhan University, 5Immunohematology and Genomics Laboratory, New York Blood Center, 6Division of Transfusion Medicine, University of Massachusetts Medical School
Background/Case Studies: SNP based typing is becoming common place to facilitate extended antigen typing of donors and patients for transfusion therapy. However, the cost of comprehensive SNP arrays precludes universal extended typing of all donors and recipients. In addition, SNP arrays test for predefined nucleotide changes and they do not allow for ad hoc expansion. Next generation sequencing (NGS) costs continue to drop precipitously and can enable determination of all blood group antigens of interest in a single assay. We developed a molecular inversion probe (MIP) capture for targeted NGS based blood group typing.
Study Design/Method: MIPs are a low‐cost high‐throughput sequence capture method whereby numerous long oligonucleotides target hundreds to thousands of 200‐300 base regions in a single tube‐‐capturing the targeted sequences within single stranded circles formed through polymerase extension and ligation. A set of barcoded primers incorporating Illumina sequencing adapters universally amplify the captured sequence allowing for the creation of sequencing libraries combining thousands of samples in a single sequencing run.
We tested an initial design of 260 MIP probes for 90 blood group antigens across 19 blood group genes (ABO, GYPA, GYPB, GYPE, RHD, RHCE, KEL, DARC, SLC14A1, SLC4A1, ACHE, ERMAP, ART4, AQP1, ICAM4, CD55, CR1, CD44, BSG). After capture, samples were sequenced using an Illumina NextSeq. Ninety five samples from blood donors previously test by licensed SNP assay were used for comparison testing and selected to represent a diverse set of antigen phenotypes.
We used bloodTyper, an automated blood group typing software platform for interpretation of NGS data (Lane WJ, et al, Lancet Haematology, 2018 ‐ In Press). bloodTyper was enhanced to analyze the MIP based NGS data. The MIP based NGS results were compared to serologic and SNP typing for 36 antigens (A, B, M, N, S, s, U, D, C, c, E, e, V, VS, K, k, Kp(a), Kp(b), Js(a), Js(b), Fy(a), Fy(b), Jk(a), Jk(b), Di(a), Di(b), Co(a), Co(b), Do(a), Do(b), Hy, Jo(a), LW(a), LW(b), Sc1, Sc2).
Results/Finding: MIP based NGS red blood cell antigen typing was 99% concordant with serologic and SNP based typing. The discordances were restricted to just a few antigens (C, V, VS, S, Uvar) and analysis of the raw data indicated that the discordances should all be fixable with minor optimization of the MIP probe sets.
Conclusion: MIP based NGS testing is a feasible blood group typing strategy, that could allow for inexpensive large scale donor testing. MIP based NGS blood group typing was performed at an estimated reagent and supply cost of $10 per sample. bloodTyper was developed to type for all molecularly understood blood group antigens from whole genomes and, expansion of this overall MIP approach to newly discovered antigenic polymorphisms would only require the incorporation of new capture probes.
IGT2‐ST4‐23
Prediction of Red Blood Cell Phenotype from Exome Next Generation Sequencing Data
Celina Montemayor*1, Bhaveshkumar Delvadia2, Oscar A. Montemayor1, Nasha Elavia1, Spencer E. Grissom1, Katie L. Lewis3, Debrean Loy1, Rizaldy Cacanindin1, Steven McLaughlin1, Marina Bueno4, Sharon Adams1, John D. Roback5, Harold Smith6, Leslie Biesecker4 and Harvey G. Klein4
1NIH CC DTM, 2Emory University Hospital, 3NIH NHGRI, 4National Institutes of Health, 5Emory University School of Medicine, 6NIH NIDDK
Background/Case Studies: Next Generation Sequencing (NGS) has emerged as an alternative genotyping strategy for red blood cell (RBC) antigens. In addition to the established clinical value of RBC genotyping in many clinical scenarios, NGS has the potential to query every known blood group variant and to identify novel variants in patients and donors. Processing and interpretation of NGS output files requires considerable computational resources and informatics expertise. To facilitate application of this technology by the transfusion research community, we present an open‐source software designed to predict an extended RBC phenotype from NGS, illustrate its function through the analysis of exome sequencing (ES) data from 1018 participants of the ClinSeq® sequencing cohort, and validate its predictions by serology.
Study Design/Method: RyLAN (Red Cell and Lymphocyte Antigen prediction from NGS) is as an open‐source Python application that takes an NGS sorted binary alignment matrix (.bam) file and index as input. The software interacts with a non‐relational database that encodes genomic coordinates and phenotype interpretation rules and yields a predicted RBC phenotype with associated quality parameters. Multiple hard filters can be modified per individual coordinate. The output is provided as a MongoDB document to facilitate complex bulk queries and statistical analysis. We employed RyLAN to analyze 1018 ES NGS files from the ClinSeq® cohort using a database of 368 known blood group variants and validated phenotype predictions with CLIA‐certified serologic assays.
Results/Finding: Fifty‐five percent of participants were male, and 88% self‐described as white race, non‐Hispanic. Three percent of the cohort identified as Hispanic/Latino, 6% as Asian, 1% as African, and 2% as mixed or unknown race. The average read depth for positions of interest was 86.3, and the average QUAL value was 1,164. The highest variant nucleotide frequency was observed at the Fya/Fyb (56%) and Jka/Jkb (45%) loci, and most predicted blood phenotype frequencies were as expected for ethnicity. A total of 204 individuals were reported as heterozygous or homozygous for weak Kidd alleles. Certain regions of BCAM, KLF1, KEL, FUT1, FUT7, ERMAP and CR1 failed quality filters repeatedly; careful review revealed that they were not captured in the ES library. Serologic validation for K, Fya, Fyb, Jka, and Jkb was performed on RBC samples from 103 participants and resulted in 3 discrepancies: 1 due to clerical error, and 2 attributed to failure of the antibody to detect expression of a weak Kidd allele. Ten novel frameshift or nonsense variants were identified in the A4GALT, BCAM, SLC14A1, SLC4A1, ICAM4, CR1, GCNT2, and ABCB6 genes and predicted to be deleterious for enzymatic function or antigen expression.
Conclusion: We describe an open‐source informatics tool to translate NGS data into a predicted extended RBC phenotype and demonstrate its application through the analysis of 1018 ClinSeq® ES files. Our results corroborate the relative high frequency of weak Kidd alleles in the Caucasian population. CLIA‐certified serology of 5 antigens in 103 samples correlated with NGS predictions, but the latter was more precise for detection of weak Kidd expression. One percent of participants carried novel blood group variants predicted to be deleterious through a nonsense or frameshift mechanism, which are currently under investigation.
IGT7‐ST4‐23
Genetic Elucidation of Xg, the Last Unresolved Blood Group System
Mattias Möller1, Yan Quan Lee1, Karina Vidovic1, Marion Darlison1, Linda Björkman2, Sven Kjellström3,4, Jill R. Storry*1,2 and Martin L. Olsson1,2
1Dept. of Laboratory Medicine, Lund University, 2Clinical Immunology and Transfusion Medicine, Division of Laboratory Medicine, Office of Medical Services, 3Center of Excellence in Biological and Medical Mass Spectrometry (CEBMMS), Lund University, 4Dept. of Clinical Sciences (Lund), Lund University
Background/Case Studies: Unravelling the genetic bases of blood groups has facilitated implementation of novel diagnostic tools in transfusion medicine and related fields. By now, all systems except one have been resolved to allow genotypic antigen prediction. The Xga antigen was reported in 1962 and PBDX (now XG) was identified as the underlying gene in 1994. However, the reason why 33% of men and 10% of women lack Xga has remained undefined. A hypothetical regulatory locus, XGR, was proposed already in 1987 to govern expression of both antigens in the XG system, Xga (encoded by XG) and high‐frequency antigen CD99 (encoded by neighbour gene MIC2/CD99). XG is located in the pseudo‐autosomal region 1 on both sex chromosomes but is disrupted on Y and only produces a protein (of unknown function!) from X. We hypothesized that Xga/CD99 expression is transcriptionally controlled by a single‐nucleotide polymorphism (SNP) within the XG region.
Study Design/Method: Calculated Xg a allele frequencies in different populations were compiled from the literature. Comparisons were made with multiple XG variants in the 1000 Genomes Project. Expression quantitative trait loci (eQTLs) in the same region were analyzed at https://gtexportal.org. Transcription factor binding was analyzed at http://jaspar.genereg.net. Blood samples from 158 blood donors anonymized other than for gender were phenotyped for Xga and genotyped. Flow cytometric typing of Xga and CD99 was performed on a subset of donors and mRNA levels were quantified by RT‐qPCR. Electrophoretic mobility shift assay (EMSA) and a luciferase reporter assay assessed the functional importance of the identified SNP.
Results/Finding: Among > 2,600 investigated XG variants, rs311103 showed the best fit to Xg a frequencies in historical datasets. Strikingly, the same SNP, located 3.7 kb upstream of the XG transcription start site, was also the eQTL with the most significant impact on XG‐mRNA levels in whole blood (p=2.0 × 10‐22). Also, rs311103C abolishes a GATA1‐binding site, which was corroborated by clear ChIP seq peaks in datasets from erythropoietic cells. Genotyping showed that all 120 Xg(a+) donors, regardless of gender, carried at least one rs311103G allele. One female sample was positive by flow cytometry only. All 13 Xg(a−) women and 13 Xg(a−) men were homozygous for rs311103C. In 11 Xg(a−) men, C was accompanied by a G, presumably Y‐derived. As opposed to Xg(a+) donors, Xg(a−) showed low‐to‐undetectable XG‐mRNA levels. GATA1 binding to oligonucleotide probes with rs311103G but not C was shown by EMSA and confirmed by mass spectrometry following protein‐oligonucleotide pulldown experiments. The intact GATA1 motif enhanced transcription in the luciferase reporter assay. Finally, CD99 expression on RBCs also correlated to rs311103 status (GG>GC>CC).
Conclusion: The Xg(a+) phenotype depends on an intact GATA1‐binding site upstream of XG. Xg(a−) is due to impaired transcription, which follows from disruption of the GATA1 motif by rs311103C. Our data open up for genotyping to predict Xga status and CD99 levels on RBC.
IGT14‐ST4‐23
Robust Allo‐Anti‐D with Subsequent Anti‐K Production after Transfusion of D‐Positive RBCs to a Patient with Weak D Type 1
Jennifer S. Woo*1, Anastasia Gikas1, Morvarid Moayeri1, Sara Bakhtary1, Karen Rodberg2, Sunitha Vege3, Christine Lomas‐Francis4, Andrew Rossin3, Ashok Nambiar1 and Connie M. Westhoff3
1UCSF Health, 2American Red Cross, Southern California Region, 3Immunohematology and Genomics Laboratory, New York Blood Center, 4New York Blood Center
Background/Case Studies: A 45‐year‐old Caucasian woman with metastatic ovarian carcinoma, and no history of pregnancy or transfusion, typed as serologic weak D (weakly positive by gel and non‐reactive by tube), so her sample was reflexed for RHD genotyping which revealed the patient was RHD*weak D type 1. Thereafter, she was managed as D + as recommended by AABB/CAP workgroup guidelines, as individuals with weak D type 1 are not considered at risk for production of clinically significant anti‐D. She received 7 D + RBCs over 21 days for chemotherapy induced anemia and unexplained hemolysis while undergoing carboplatin and paclitaxel therapy. Four weeks after her last D + transfusion, she presented with worsening anemia and anti‐D in her plasma.
Study Design/Method: The plasma anti‐D was investigated to determine if allo‐ or auto‐anti‐D. Serologic testing was by standard methods. RHAG, RHD, and RHCE – cDNA amplification and sequencing were performed to determine if mutations in other Rh proteins part of the Rh membrane complex, in combination with the c.809T>G (p. Val270Gly) associated with weak D type 1, could potentially explain alloimmunization.
Results/Finding: The pre‐transfusion RBC phenotype was C+c+E−e+; antibody screen and DAT were negative. Four weeks after transfusion of D + units, she presented with worsening anemia (Hgb=6.8 g/dL), slight increase in bilirubin and clinical concern for hemolysis. The DAT was negative but anti‐D was present in plasma (2 + to 3 + by PEG IAT) and in an eluate. No antibodies to carboplatin or paclitaxel were detected. Reference laboratory testing suggested allo‐anti‐D: plasma adsorbed with rr RBCs contained anti‐D. Anti‐LW was ruled out. The anti‐D reacted with D variant RBCs (DIII, DIV, DV, DVI, DVII, ), but did not react with weak D type 1 RBCs (n=3). Testing of the patient's RBCs with the ALBA Advanced Partial D Typing Kit gave a pattern of reactivity consistent with a weak D type 1 sample tested in parallel. Sequencing of RHD, RHCE, and RHAG found no additional changes. Samples obtained 2 and 8 months later showed anti‐D and anti‐D + anti‐K, respectively. Lookback indicated at least 2 of 7 D + units were also K+. Samples tested 9.5 months after the last transfusion of D + units continued to show anti‐D, although reacting weaker than prior (1 + in contrast to 2 + to 3+). The reactivity was equivalent, as shown by titration, in her plasma adsorbed with autologous RBCs.
Conclusion: We report robust production of allo‐anti‐D in a patient with weak D type 1. Weak D type 1 individuals are not considered to be at risk for allo‐anti‐D based on observational studies primarily from Europe. There are rare exceptions known, but to date these anti‐D have not been associated with clinically significant RBC destruction. This patient's anti‐D may have contributed to exacerbation of her anemia, however confounding clinical history and abnormal pre‐transfusion lab values makes a definitive assessment challenging. Transfusion of at least 2 D+K + units and sensitization to both antigens suggests they may have acted synergistically to complement alloimmunization.
IGT18‐ST4‐23
Differences in Monocyte/Macrophage Phagocytic Activity Due to Different Fc Regions of Human IgG3 Isoallotypes
Selena Cen1, Heather L. Howie2, Jenna Lebedev2, Gregory A. Denomme3, James C. Zimring2,4 and Donald R. Branch*1,5
1Canadian Blood Services, 2BloodworksNW Research Institute, 3Immunohematology Reference Laboratory, Versiti/BloodCenter of Wisconsin, 4University of Washington School of Medicine, 5University of Toronto
Background/Case Studies: Human immunoglobulin G (hIgG) includes IgG1, IgG2, IgG3, and IgG4. Each IgG subtype contains different isoallotypes due to genetic variation, with IgG3 containing the most isoallotypes (N=15) described. It was previously shown that an FDA‐approved monoclonal anti‐IgG failed to recognize 2 of 15 hIgG3 anti‐Kell (K) isoallotypes (hIgG3‐03 and hIgG3‐13) by indirect antiglobulin test (IAT). The failure to detect these two anti‐K antibodies was due to amino acid changes in the isotype heavy chain. Anti‐K is the second most common cause of hemolytic disease of the fetus and newborn, and the observation raised concerns of the potential clinical impact of these two isoallotypes. We wanted to examine whether any of these hIgG3 isoallotypes had a differential effect on human monocyte/macrophage Fcγ receptor‐mediated phagocytosis. We compared the phagocytic activity of 15 purified recombinant hIgG3 anti‐K isoallotypes using an opsonized‐erythrocyte monocyte monolayer assay (MMA).
Study Design/Method: A novel monoclonal recombinant anti‐K antibody was isolated and used to create a panel of the 15 hIgG3 isoallotypes. Thus, all monoclonal antibodies had the identical variable region genes and recognized the same K antigen epitope, differing only in their Fcγ heavy chain region. The hIgG3 anti‐K antibodies were pre‐incubated with K‐positive (KK, Kk) red blood cells (RBCs). Opsonized RBCs were examined using IAT (tube and gel), flow cytometry (using anti‐lambda chain antibody to avoid any variations in Fc heavy chain region), and MMA.
Results/Finding: A dosage effect was seen for many of the hIgG3 isoallotypes where the Kk IAT result (2 + to 3+) was lower than KK (3 + to 4+), particularly for hIgG3‐03 and hIgG3‐13. Opsonisation of KK RBCs was optimal at 2.5 μg/mL hIgG3, as determined by flow cytometry analysis. There was a differential effect of the 15 hIgG3 isoallotypes on the induction of phagocytosis. Compared to hIgG3‐01 (Phagocytic index, PI=16), hIgG3‐03, hIgG3‐08, and hIgG3‐13 showed a reduced capacity to induce phagocytosis with PI of 9.5, 8.0, and 8.5 respectively. However, hIgG3‐17 (PI=27), hIgG3‐18 (PI=31), and hIgG3‐19 (PI=34) showed significantly enhanced ability to induce phagocytosis (p≤0.1). Both hIgG3‐18 and hIgG3‐19 induced clinically significant phagocytosis at 500ng/mL, while hIgG3‐03, 08, and 13 required a 10‐fold increase in concentration to achieve a PI suggesting clinical significance.
Conclusion: Certain amino acid variations in the Fc region of hIgG3 antibodies may lead to an enhanced or reduced capacity for their ability to induce phagocytosis. Results indicate that all anti‐K hIgG3 isoallotypes can be clinically significant as measured by MMA. Thus, antiglobulin reagents that fail to detect hIgG3‐03 or hIgG3‐13 could present a problem.
Oral Abstract Session: Blood Groups ‐ New Antigens, New Alleles
IGT8‐ST4‐24
Characterization of a Novel High‐Prevalence Antigen in the Lutheran Blood Group System
Cédric Vrignaud1,2,3, Stéphanie Ramelet3, Denise Amiranoff4, Laure Bourguignat4, Guy Mpoy5, Sylvie Poupel3, Joelle Nataf3 and Thierry Peyrard*1,2,3
1Laboratoire d'Excellence GR‐Ex, 2INSERM UMR_S1134, 3Institut National de la Transfusion Sanguine, 4EFS Ile de France, 5Hôpital Simone Veil
Background/Case Studies: The Lutheran blood group system consists of 24 antigens located on the basal‐cell adhesion glycoprotein called B‐CAM, with 19 high‐prevalence, 4 equilibrated and one low‐prevalence antigen reported to date. This protein is strongly involved in the interaction of the red blood cells (RBCs) with the extracellular matrix.
The aim of the present work was to describe a novel high‐prevalence antigen of the Lutheran system, through the investigation of two sisters who both produced the corresponding anti‐LU antibody.
Study Design/Method: Blood samples of a pregnant woman were firstly referred to our laboratory for investigation of a pan‐agglutinating antibody. Antibody identification (gel‐test IAT, Bio‐Rad) was performed on native, papain‐treated (Diagast) and trypsin‐treated (Sigma) RBCs. Genomic DNA was extracted from peripheral blood cells by a fully automated method and amplified by LU exon‐specific primers and sequenced.
Results/Finding: The proband was a group A, R2r, K‐, 47 yo female patient, of Turkish origin. During her first pregnancy, in 2003, her serum was reactive on all native RBCs but nonreactive on trypsin‐treated RBCs and LUnull samples. Autologous controls were negative and her LU phenotype was unambiguously LU:‐1,2. Underlying alloantibodies of common specificities were ruled out. The antibody was finally concluded as a so‐called “para‐LU antibody”, i.e. an antibody to a probable high‐prevalence LU antigen of unknown specificity. The proband had another child two years later without any complication despite a stronger reactivity of the antibody. In 2003, blood samples from siblings were required for compatibility testing and RBC antibody screening; her elder sister turned out to be compatible. However, no further investigation was performed at that time. In 2008, a “para‐LU antibody” was also detected in the proband's elder sister during pregnancy. Genomic DNA sequencing revealed the presence, in both sisters, of two nucleotide changes at homozygous state in the LU‐BCAM gene, on a LU*02 allele basis. The first one is a synonymous change in exon 3, c.324G>A (p.Gly108Gly, rs3745159) known to be present in about 3‐4% of the general population. The second one was found in exon 9, c.1184G>A (rs200421757), and is responsible for the amino acid change p.Arg395His. This mutation has been reported with a frequency of less than 0,03% in the Exome Aggregation Consortium (ExAC) database.
Conclusion: Serological and molecular studies allowed us to provide evidence for a novel high‐prevalence antigen in the Lutheran blood group system, and most importantly, to identify the specificity of a patient's antibody and recommend optimal transfusion policy. We suggest to provisionally assign the names LU27 and LUYA (after the proband's name) for this antigen. According to the structural model of Parsons et al (Blood, 1997), the LUYA expression is predicted to be on the fourth IgSF domain of BCAM, as is the LU7 antigen.
IGT9‐ST4‐24
Sumi: A Novel Low Incidence Antigen of Mns Blood Group Antigen
Shoichi Ito1, Sayaka Kaito2, Toru Miyazaki3, Naoko Watanabe‐Okochi*2, Yumi Suzuki2, Hatsue Tsuneyama2, Ryuichi Yabe2, Kazumi Isa4, Kenichi Ogasawara4, Makoto Uchikawa2, Nelson‐Hirokazu Tsuno2 and Kazunori Nakajima2
1Tohoku Block Blood Center, Japanese Red Cross, 2Kanto Koshinetsu Block Blood Center, Japanese Red Cross, 3Hokkaido Block Blood Center, Japanese Red Cross, 4Central Blood Institute, Japanese Red Cross
Background/Case Studies: In 1990, a case of positive reaction in a major crossmatch was consulted to our blood center. Antibody screening of the patient plasma was negative. We applied various antibodies to the crossmatch‐positive relevant blood product but could not identify the antigen. It was named “SUMI”, after the first proband whose RBCs carried the antigen, SUMI antigen was recognized as an unidentified low‐incidence antigen. Here, we report that the SUMI antigen is present on the Glycophorin A (GPA).
Study Design/Method: Serological tests were performed by the standard tube method or with automated blood grouping machine (PK7300). Standard methods were also applied for the RBC treatment with proteolytic enzymes. Anti‐SUMI monoclonal antibody‐producing cell line (HIRO‐305) was obtained from lymphocytes of anti‐SUMI positive individuals by the hybridoma method. Immune‐complex capture fluorescence analysis (ICFA) using Luminex was used to analyze the SUMI antigen. Genomic DNAs were extracted from peripheral white blood cells of SUMI‐positive individuals and the nucleotide sequence of GYPA was examined by direct sequencing and TA cloning.
Results/Finding: Nine SUMI positives were found by screening 324,000 Japanese blood donors with human monoclonal IgM antibody (HIRO‐305). SUMI is sensitive to red cell treatment with trypsin, ficin, pronase, or sialidase, but not α‐chymotrypsin or DTT. Anti‐SUMI (1 + or higher) was found 1,351 among 10,392 normal sera by saline tube method at room temperature. The strongest antibody titer was 1:64. On the other hand, 100 cases of umbilical cord blood plasma showed negative reactions with the SUMI‐positive RBCs. ICFA assay with murine monoclonal antibodies to intracellular potion of GPA (CBC‐450) showed that SUMI antigen is located on the GPA. GYPA gene analysis showed a mutation of c.91 A > C (p. Thr 31 Pro). The same mutation was recognized in all SUMI+. All of SUMI + showed that M antigen are positive.
Conclusion: The SUMI antigen is a novel low frequency antigen of the MNS blood group system that represent Thr31Pro substitution in GPA. The frequency of SUMI antigen was 0.0028% among the Japanese donors. From family analysis, it was confirmed that SUMI antigen is dominantly inherited. Anti‐SUMI was detected in 13.0% of healthy donors, and it was considered to be a naturally occurring antibodies of IgM class.
IGT10‐ST4‐24
Reflexed Serology and Molecular Testing Lead to Identification of Six Discrepancies and Three New RHCE Alleles
Sunitha Vege*1, Judith Aeschlimann1, Julie Kirkegaard2, Aaron Gottschalk3, Randall W. Velliquette1, Christine Lomas‐Francis4 and Connie M. Westhoff1
1Immunohematology and Genomics Laboratory, New York Blood Center, 2Immunohematology Reference Laboratory, Community Blood Center of Kansas City, 3National Center For Blood Group Genomics, 4New York Blood Center
Background/Case Studies: Algorithms for donor antigen typing and DNA analysis and in‐house policies for serologic confirmation when only DNA testing is ordered lead to the discovery of multiple RHCE discordances. We investigated six samples with conflicting results: E in 3 donors; C in 2 donors and 1 OB patient.
Study Design/Method: Automated PK7300 and manual tube methods were used for RBC typing. Genomic DNA was isolated from WBCs and RNA from RBCs. HEA PreciseType, RHCE BeadChip, RHCE gene sequencing, and in‐house assays were done. RhCE‐specific cDNA analysis was performed for two samples.
Results/Finding: Three Caucasian donors typed E− by PK7300 (clones P3x25513G8+MS24) but reflexed HEA testing for extended RBC profiling predicted the RBCs were E+. By tube testing, the RBCs were 1+w ‐ 3 + with Immucor and 3 + ‐ 4 + with Bio‐Rad anti‐E. RHCE BeadChip indicated E + phenotype but review of the genotype results showed the samples were heterozygous for c.697C>G (p.Gln233Glu). Gene sequencing with SNP‐specific primers confirmed the presence of c.697G on RHCE*cE. A Caucasian and a Hispanic donor were C + by PK7300 (clone 906) but predicted C− by HEA. By tube testing, the samples were 3+s with Immucor Gamma‐Clone, Ortho BioClone, and Bio‐Rad Seraclone anti‐C. By multiplex PCR and RHCE BeadChip, the samples lacked the 109bp insert in intron 2 characteristic of RH*C. RHCE exon 2 sequencing however was consistent with RH*C. Rh‐cDNA analysis found a conventional RhCe transcript, indicating this is a novel allele encoding a C + phenotype that lacks the 109bp insert. A Hispanic OB patient with anti‐e and the paternal sample were referred for RHCE genotyping to evaluate risk for HDFN. The paternal sample was genotyped as C+E−c+e + (consistent with serology) and all children predicted to be e+. The patient's RBCs were predicted C−E+c+e− by HEA. Serology confirmed E+c+e−, but her RBCs were C+w with Immucor Gamma‐Clone, Ortho BioClone and 2 single donor source anti‐C, and 2 + to 3 + with ALBAclone, Bio‐Rad Seraclone, and 1 single donor source anti‐C. RHCE BeadChip indicated C− phenotype, but the genotype indicated heterozygosity for c.48G/C and c.307C/T. Rh‐cDNA analysis showed the changes were on RHCE*cE, indicating expression of C antigen from a novel allele, RHCE*cE48C, 307T.
Conclusion: We report three new RHCE alleles; RHCE*cE697G associated with variable E antigen typing (n=3), RHCE*Ce lacking the classic intron insertion associated with C antigen (n=2), and RHCE*cE48C 307T encoding variable C antigen expression (n=1). The c.697G has been reported on two RHCE alleles but with additional changes (RHCE*cE697G, 712G; RHCE*cE697G, 712G, 733G, 744C); both with variable E expression. Interestingly, the RHCE*cE697G was found in three Midwest Caucasian donors. Continuous discovery of RH variants, knowledge of the serology, prevalence of the alleles and their potential clinical impact are important for designing future genotyping assays.
IGT13‐ST4‐24
Investigation of U/GPB Antibodies in Two Patients Uncovers Three Novel GYPB Alleles
Judith Aeschlimann*1, Christine Lomas‐Francis2, Fernando Lerma3, Chunying Li3, Anna Burgos1, Amanda Smith1, Sunitha Vege1 and Connie M. Westhoff1
1Immunohematology and Genomics Laboratory, New York Blood Center, 2New York Blood Center, 3Carter Bloodcare
Background/Case Studies: While it is accepted that people with S–s–U– or S–s–U + (Uvar) RBCs can make anti‐U, production of anti‐U‐like/GPB has also been observed with S–s + phenotypes. Genetic mechanisms causing phenotypes at risk for anti‐U/‐GPB include deletion of GYPB exons 2‐6, changes in exon 5 and/or intron 5 and inheritance of GYP hybrids. We performed serologic and GYPB investigation in two women of African ancestry; P1 was previously transfused presenting with anti‐U, and P2 at parturition (G1P1) had anti‐E, apparent anti‐S and additional unexplained reactivity.
Study Design/Method: Standard methods were used for antigen typing and antibody testing with licensed and in‐house reagents. DNA was isolated from WBCs and GYPB exons 1‐6 amplified and sequenced for both samples. ID CORE (Grifols) was performed for P1, HEA PreciseType (Immucor) and GYPB long range sequencing of exons 2‐6 for P2.
Results/Finding: The RBCs of P1 were weakly DAT + (IgG), typed S–s+, and only reacted with anti‐U detecting U variants. Plasma reactivity by LISS 37C was consistent with anti‐S and –K. By LISS IAT and IgG gel the plasma reacted with all K− cells except S−s−U− or U+, 2 of 3 S−s+U− Dantu + and the auto control, consistent with anti‐U; the strongest reactions were with S+s− RBCs; papain treated cells did not react. An eluate from her RBCs reacted 1 + by gel with all cells except S–s–. ID CORE did not detect any GYPB variants and predicted S–s+U+. GYPB sequencing revealed a homozygous c.260G>A change in exon 5 (p.Arg87Gln). Based on the anti‐U/‐GPB present, the change encodes an altered GPB. RBCs of P2 typed as S–s–, reacted only with anti‐U detecting U variants, and 3 + with Glycine soja. Anti‐U, detected in her plasma, reacted at LISS and PEG IAT, in gel and with papain treated RBCs but was nonreactive with S−s−U− or U + RBCs and the auto control. HEA PreciseType predicted S–s+U + phenotype. GYPB exon‐specific sequencing found a heterozygous change c.227G>A in exon 5 (p.Gly76Glu). GYPB long range PCR confirmed c.227G/A and revealed a novel GYP(B1‐2‐EΨ3‐Ψ4‐B5‐6) presumably in trans, as evidenced by the anti‐U in her plasma. Adsorption/elution with anti‐s confirmed the lack of s antigen on the patient's RBCs.
Conclusion: We report three novel GYPB alleles in two patients with anti‐U/‐GPB. In both, anti‐S was suspected, probably because S + RBCs express more GPB than S−. The c.260G>A found in P1 is rare with an allele frequency of 0.009832 in Africans (rs112711627, ExAC). P2 turned out to be a compound heterozygote with a GYPB*s227A in trans to a GYP(B1‐2‐EΨ3‐Ψ4‐B5‐6) hybrid similar to one previously reported (Willemetz et al 2015, Vox Sang 108). The c.227G>A may cause alternative exon splicing, as known for the c.230C>T change that is associated with S−s−U+var. The 3 + reaction of P2 RBCs with G. soja is consistent with reduced glycosylation as would be observed with altered or reduced levels of GP.
IGT15‐ST4‐24
A Novel RHCE Allele Expressing RHD Epitopes Responsible for a False‐Positive D Typing and Post‐Transfusion Anti‐D Alloimmunization in a Patient of Western European Descent
Cédric Vrignaud1,2,3, Stéphanie Ramelet3, Dominique Gien3, Ines Molinier3, Séverine Creppy4 and Thierry Peyrard*1,2,3
1Laboratoire d'Excellence GR‐Ex, 2INSERM UMR_S1134, 3Institut National de la Transfusion Sanguine, 4EFS Rhône Alpes
Background/Case Studies: Rh currently comprises 55 antigens encoded by two highly homologous genes, RHD and RHCE. The RhD protein expresses the D antigen whereas the RhCE protein carries the C/c and E/e antigens. However, some RHD variants may paradoxically code for a RhCE reactivity, such as RHD*DIIIa‐CE(4‐7)‐D and RHD*DIVa‐2 responsible for a C reactivity with the MS‐24 clone. Conversely, some RHCE alleles, such as RHCE*ceHAR, RHCE*ceCF, RHCE*ceRT and RHCE*ceSL, may express RhD epitopes more or less detectable by anti‐D reagents depending on the clone being used. We describe here the serological and molecular investigation of a D‐positive patient of Western European descent with anti‐D alloimmunization.
Study Design/Method: RhD typing was carried out by standard hemagglutination techniques with polyclonal and monoclonal antibodies. Adsorption‐elution testing was performed with a polyclonal anti‐D and acid elution method. Genomic DNA was amplified by RHD and RHCE‐specific primers and sequenced. RHD gene was also investigated with the wRHD DNA‐beadchip device (Immucor/BioArray).
Results/Finding: Blood samples from a group A, D+wC‐E‐c+e+, K‐, 76 yo male patient of Spanish origin were referred in March 2012 to our reference laboratory to explore an anti‐D with negative DAT and autocontrols. The patient was concluded to carry a weak D phenotype by the referring laboratory and likely considered D + as he was of European ancestry. Anti‐D was observed 5 months after the first transfusion of D + RBC units in June 2010. The patient was then regularly transfused with D + platelets and D– RBC units for about 2 years.
A weak or no D expression was found by our routine techniques: 3 + with Ortho BioVue System/D7B8 clone, no reactivity with Bio‐Rad ID‐System/polyclonal. The use of a panel of monoclonal anti‐D showed positive reactions with 4 clones, MS‐26 (4+), HM10 (4+), ESD1 (3+), HM16 (2+) and SAL1A6 (<1+), but no reactivity with 9 other clones. RHD analysis showed no exon amplification. New blood samples were sent after another transfusion episode in 2014. As no RHD gene was found in the patient, we speculated that the D reactivity could originate from a RHCE variant allele. This was confirmed by the presence of a heterozygous c.508A>G non‐templated mutation in exon 4 (p.Arg170Gly). Besides, an adsorption‐elution study with a polyclonal anti‐D was found to be negative.
Conclusion: We described a novel RHCE allele, RHCE*ce508G (Genbank number KX236061), that expresses D epitopes detectable by several commonly used monoclonal anti‐D reagents. This may cause a false‐positive D typing, especially with D7B8, MS‐26, HM10 and ESD1 clones (3 to 4 + reactivity), and a risk of anti‐D alloimmunization in a seemingly D + patient. This is especially a matter of concern for D typing in women of childbearing age. According to the Rh protein structural model from Flegel WA (Curr Opin Hematol, 2006), p.Arg170Gly is located in the extracellular domain of the RhCE protein, within the so‐called “Rh protein vestibule”. Our data for this new allele seem to confirm the importance of this vestibule area in terms of RhD epitope expression. We propose to call this new variant RHCE*ceRG (RG for Arg to Gly), similarly to the naming procedure followed for RHCE*ceSL and RHCE*ceRT.
IGT16‐ST4‐24
Serological and Molecular Characterization of Three New RHD Alleles
Judith Aeschlimann*1, Sunitha Vege1, Christine Lomas‐Francis2, Amanda Kinsinger‐Stickel3, Jay P. Hudgins4, Ira Shulman5 and Connie M. Westhoff1
1Immunohematology and Genomics Laboratory, New York Blood Center, 2New York Blood Center, 3University of Virginia Health System, 4Keck School of Medicine at USC, 5LAC/USC Medical Center
Background/Case Studies: The serological and molecular diversity of the RhD antigen is without question and the list of RHD variant alleles continues to grow. We investigated samples from 3 females referred for weaker than expected D typing and RH genotyping.
Study Design/Method: Genomic DNA was isolated from WBCs. RHD BeadChip assay and RHD sequencing was performed. RhD‐specific cDNA analysis was done for two samples. Serologic testing was by standard methods with multiple anti‐D and by ALBAclone Advanced Partial RhD typing kit for two samples.
Results/Finding: Sample 1 was from a pregnant woman, ethnicity unknown, whose RBCS typed +w at IS. Her RBCs also reacted 1+s to 2 + at immediate spin (IS) and 2 + to 3 + at IAT with anti‐D Ortho BioClone, Immucor Gamma‐clone and Series 4 and Series 5, Quotient anti‐D blend, alpha and delta. RBCs also typed C−E−c+e+, V/VS + and G−/G + with monoclonal/polyclonal anti‐G. Three clones of the ALBA Partial D kit (LHM174/102, LHM70/45, LHM57/17) were non‐reactive with her RBCs but the pattern did not match any indicated partial D. RHD BeadChip showed low signal for exon 2 markers, suggesting a hybrid allele. RHD exon 2 sequencing and RhD‐cDNA analysis confirmed a hemizygous RHD‐ce(2)‐D hybrid with c.254C>G and c.307C>T (associated with C antigen) and a c.744C>T silent change in exon 5. RHCE BeadChip detected RHCE*ce/ce733G. Sample 2 RBCs from a woman of unknown ethnicity sent for RHD genotyping, reacted 1 + to 3 + IS and 3 + IAT with Bio‐Rad Seraclone, Immucor Gamma‐clone and Ortho‐BioClone. RHD BeadChip did not detect any changes, but exon 2 sequencing identified a heterozygous change c.329T>C, associated with partial RHD*DVII. RHD‐cDNA analysis confirmed RHD*DVII and identified a RHD‐CE(3‐9)‐D hybrid with an additional change c.733C>G in exon 5. Sample 3 was from an African‐American pregnant woman referred for variable D typing. Her RBCs reacted 1 + to 3 + at IS and 3 + to 4 + at IAT with Ortho BioClone, Immucor Gamma‐clone and Series 4 and Series 5, Bio‐Rad Seraclone and Seraclone blend and typed Go(a+). Her RBCs typed C−E−c+e + and reacted with five clones of the ALBA Partial D kit with a DIV pattern. RHD BeadChip detected c.712G>A and c.1048G>C; RHD gene sequencing confirmed a new allele.
Conclusion: We report 3 new RHD alleles, two with variable D typing with evidence to encode partial D phenotypes and one silent RH hybrid in trans to DVII. Sample 1 was found to be a new RHD‐ce(2)‐D hybrid with c.254C>G and c.307C>T in exon 2. These changes are characteristic for RHCE*ceAG.05, suggesting this allele arose by a gene conversion event. The RHD‐CE(3‐9)‐D hybrid has been reported without the c.733C>G change found here in sample 2. Lastly we describe a new allele RHD*712A, 1048C, with RBC reactivity pattern of DIV by ALBA partial D kit and Go(a+).
Oral Abstract Session: Components
PBM5‐ST4‐25
Lack of Alloimmunization to the D Antigen in D Negative Orthotopic Liver Transplant Recipients Receiving D Positive RBCs Perioperatively
Lindsey Wlosinski*, Jaber El‐Bashir and Zaher K. Otrock
Henry Ford Hospital
Background/Case Studies: D negative (D‐) patients (pts) are routinely transfused with D‐ RBCs due to the increased immunogenicity of the D antigen. The rate of alloimmunization to the D antigen following transfusion can be as high as 80%; however, immunosuppressed pts may be less likely to become alloimmunized. Some D‐ pts undergoing liver transplant may require a large number of RBC units which can risk the inventory of D‐ RBCs which are considered relatively rare (10‐15% of donor units) as compared to D positive (D+) RBCs. So the blood bank may be forced to supply such pts with D + RBCs due to inventory constraints. Though the process of providing D + RBCs to D‐ transplant recipients is accepted in blood bank practice, the incidence of alloimmunization to the D‐antigen in D‐ liver transplant pts has not been well defined. With a very active liver transplant program at our institution, studying the prevalence of anti‐D formation in D‐ liver transplant pts receiving D + RBCs perioperatively will assist in successful patient blood management.
Study Design/Method: This was a retrospective study performed at a single large academic medical center. The study was approved by our Institutional Review Board. Electronic medical records and blood bank files for all 505 pts who underwent orthotopic liver transplantation at Henry Ford Hospital in Detroit, Michigan, from August 2012 through December 2017 were reviewed.
Results/Finding: Twelve D‐ pts received D + blood perioperatively. Table 1 summarizes the characteristics of these pts. The median age was 60 years (range 48‐67 years); 8 (66.7%) were male. Median number of D + RBC units transfused was 13.5 units (range 3‐72 units). There was no evidence of D alloimmunization in any patient after a median follow up of 30.9 months (range 20.2‐59.6 months). Only one patient died after surgery. We had 8 D‐ pts (8/76 = 10.5% of all D‐ liver transplant recipients) who presented with D alloimmunization before transplant; none of these pts was transfused with D + blood at our institution.
TABLE 1 (PBM5‐ST4‐25)
| Patient | Age (years) | Gender | Diagnosis | Number of D + RBC units transfused | Interval between transfusion of D + RBCs and last follow up (months) |
|---|---|---|---|---|---|
| 1 | 65 | M | NASH cirrhosis | 72 | 1 day |
| 2 | 54 | M | AC | 39 | 20.2 |
| 3 | 59 | M | AC | 31 | 50.7 |
| 4 | 67 | M | AC | 26 | 59.6 |
| 5 | 58 | F | Polycystic liver disease | 21 | 33.5 |
| 6 | 63 | M | Polycystic liver disease | 17 | 30.9 |
| 7 | 53 | F | NASH cirrhosis | 10 | 31.4 |
| 8 | 52 | M | NASH cirrhosis | 7 | 28.7 |
| 9 | 63 | M | HCV cirrhosis with HCC | 5 | 25.8 |
| 10 | 67 | F | Polycystic liver disease | 5 | 28.5 |
| 11 | 61 | F | HCV cirrhosis with HCC | 4 | 49 |
| 12 | 48 | M | AC | 3 | 25.4 |
Abbreviations: M, male; F, female; NASH, nonalcoholic steatohepatitis; AC, alcoholic cirrhosis; HCV, hepatitis C virus; HCC, hepatocellular carcinoma
Conclusion: Our study showed that there was no risk of alloimmunization to the D antigen in D‐ orthotopic liver transplant recipients receiving D + RBCs perioperatively.
TA3‐ST4‐25
Complement Stability in Thawed Plasma: Inventory and Plasmapheresis Implications
Laura Stephens*, LinaCel G. Cadden and Samuel Pepkowitz
Cedars‐Sinai Medical Center
Background/Case Studies: Donor plasma is selected over albumin for therapeutic plasmapheresis replacement fluid when non‐oncotic functional components such as clotting factors and ADAMTS‐13 need repletion. Because plasma also contains complement proteins C3 and C4, which have beneficial functions in immunity and inflammation but may have disease‐accentuating roles in conditions such as transplant rejection and complement‐mediated glomerular disease, post‐procedure complement levels should be of concern for select patients. While coagulation proteins, fibrinogen, and ADAMTS‐13 are known to be preserved in Thawed Plasma (TP), the stability of C3 and C4 has not been reported, and multiple reference laboratory stability comments suggest serum complement levels drop after three days of storage. Accordingly, this study assayed C3 and C4 in refrigerated TP and patient serum during 5 days of storage.
Study Design/Method: C3 and C4 were measured by an FDA‐approved nephelometric method on four units of FP24 donor plasma at the time of thaw and on each of 5 days of storage at 1 to 6°C C3 and C4 were also measured on three random patient samples stored under the same conditions.
Results/Finding: Donor TP unit C3 and C4 levels had an average change in value of ‐0.3% (range: ‐13.0% to + 5.9%) over 5 days after thaw (Table 1). Patient serum samples had initial C3 levels of 69.2, 108.0, and 141.0 mg/dL (reference range: 79‐152 mg/dL) and C4 levels of 29.5, 26.6, and 30.4 mg/dL (reference range: 16‐38 mg/dL). Serum C3 and C4 levels changed by an average of +3.0% and ‐0.1%, respectively, over 5 days of refrigeration.
TABLE 1 (TA3‐ST4‐25) Complement levels in thawed plasma over time (units: mg/dL)
| Plasma Unit | Complement | Day: 0 | 1 | 2 | 3 | 4 | 5 | Change Over Baseline |
|---|---|---|---|---|---|---|---|---|
| 1 | C3 | 83.4 | 85.5 | 80.8 | 85.6 | 85.1 | 84.7 | +1.6% |
| C4 | 21.6 | 18.9 | 18.8 | 21.5 | 18.5 | 18.8 | −13.0% | |
| 2 | C3 | 58.6 | 59.9 | 59.5 | 60.0 | 60.9 | 60.2 | +2.7% |
| C4 | 17.0 | 17.7 | 17.8 | 17.6 | 17.6 | 18.0 | +5.9% | |
| 3 | C3 | 64.0 | 64.2 | 62.7 | 63.5 | 64.3 | 64.2 | +0.3% |
| C4 | 14.4 | 14.8 | 15.2 | 14.2 | 14.8 | 15.0 | +0.3% | |
| 4 | C3 | 61.1 | 61.5 | 59.5 | 60.9 | 61.8 | 61.6 | +0.8% |
| C4 | 15.1 | 14.8 | 14.3 | 14.4 | 14.5 | 14.9 | −1.3% |
Conclusion: C3 and C4 levels are maintained for the shelf‐life of TP. For plasmapheresis cases in which maintenance of complement levels post‐procedure is indicated, there would be no advantage to use immediately thawed plasma preparations over stored TP. For patients for whom a lowered complement concentration is desired, albumin replacement is preferred when clinically acceptable, and stored TP would provide no benefit over immediately thawed plasma preparations. Serum C3 and C4 levels also appear stable when refrigerated for up to 5 days. This investigation has allowed our tertiary care/trauma center to confidently maintain a rolling inventory of TP, supporting immediate availability for emergency/massive transfusion needs. Additionally, routine use of TP for plasmapheresis fluid replacement has curtailed expiration of our TP product inventory.
TS7‐ST4‐25
Influence of Blood Storage Age on Immune and Coagulation Parameters in Critically Ill or Cardiac Surgery Patients Receiving Transfusion
Philip J. Norris*1, Ken Schechtman2, Roman Sniecinski3, Felicia Trachtenberg4, Gayatri Ranganathan4, Avril Adelman2, Sheila Keating1, Mitchell Cohen5, Fania Szlam3, Jerrold Levy6, Susan Assmann4, Marie E. Steiner7, Jacques Lacroix8 and Philip C. Spinella2
1Blood Systems Research Institute, 2Washington University School of Medicine, 3Department of Anesthesiology, Emory University School of Medicine, 4New England Research Institute, 5University of California, San Francisco, 6Duke University Medical Center, 7University of Minnesota, 8Ste. Justine Hospital
Background/Case Studies: Two large, randomized controlled trials of RBC storage age were conducted in North America and Europe, the RECESS and ABLE studies. These studies did not show a significant difference in outcome between recipients of RBC units stored for short vs. long periods. Our group collected longitudinal blood samples from the trial participants to determine if there were changes in a wide array of coagulation and immunological parameters.
Study Design/Method: Samples were collected pre‐surgery or transfusion and at days 2, 6, 28, and 180 thereafter. Whole blood samples were shipped to a central lab overnight for PBMC processing, and plasma was separated at clinical sites and stored frozen for batch shipping. 90 subjects from the RECESS trial and 100 subjects from the ABLE trial were enrolled and studied. Levels of 16 coagulation parameters, regulatory and functional T cells, 25 cytokines, and 16 markers of extracellular vesicles (EVs) were determined using commercial assays for coagulation and cytokine testing and flow cytometry for T cell and EV characterization.
Results/Finding: In the RECESS ancillary study 35 subjects received fresh, 28 aged RBCs, and 27 were not transfused. Of the parameters tested, only 4 showed a significant difference early post‐transfusion between study arms: the ability of CD8 + T cells to secrete IFN‐γ and plasma IL‐6 were higher and plasma endothelial growth factor levels and the concentration of extracellular vesicles (EVs) bearing the B cell marker CD19 were lower in recipients of fresh vs. aged RBCs. Multiple parameters showed significant modulation post‐surgery and transfusion. Most analytes that changed after surgery did not differ based on transfusion status. Several EV markers, including two associated with platelets (CD41a and CD62P), decreased in transfused subjects but not in those who underwent surgery without transfusion.
For the ABLE ancillary study 49 subjects received fresh and 51 aged RBCs. Changes from baseline in levels of protein C, factor V, and EVs expressing phosphatidyl serine and CTLA‐4 differed between recipients of fresh and aged RBC units, with the vast majority of coagulation and EV markers and all cytokines tested showing no difference between study arms. Although most analytes showed no difference between subjects in the fresh and aged arms of the study, 6 coagulation parameters, 15 cytokines, and 7 EV parameters changed significantly in the period post‐transfusion.
Conclusion: Transfusion of fresh vs. aged RBCs does not result in substantial changes in hemostasis or immune parameters in recipients. It is possible that transfusion modulates the level of platelet‐derived EVs, which will require further studies in patients randomized to receipt of transfusion.
TS11‐ST4‐25
Hemostatic Characteristics of Thawed Pooled Cryoprecipitate Stored for 35 Days at Refrigerated and Room Temperatures
Joshua L. Fenderson*1, Michael A. Meledeo2, Matthew J. Rendo1, Grantham C. Peltier2, Colby S. McIntosh2, Jacquelyn Messenger2, Ron Bryant2, Kenneth Davis2, Jason Corley2 and Andrew P. Cap2
1San Antonio Military Medical Center, 2U.S. Army Institute of Surgical Research
Background/Case Studies: Fibrinogen (Fg) replacement is an essential component of critical bleeding management. Studies suggest early delivery of Fg improves critical bleeding outcomes. Cryoprecipitate (cryo) is the main source of Fg replacement utilized in the U.S. Cryo was first used in bleeding disorders (e.g. hemophilia A), but today is primarily used to replace Fg in trauma and acquired coagulopathy. Cryo guidelines require use within 6 hrs of thawing, but may be overly restrictive when cryo is used for Fg replacement. We assessed the hemostatic quality of thawed pooled cryo stored at refrigerated (4C) and room temperatures (RT) for 35 days.
Study Design/Method: Cryo (6‐donor pools, Type O or A, n=4 each) was thawed and distributed into 6 ml aliquots for storage at cold (4˚C) or RT (21‐24˚C). Cryo was diluted 1:10 with PBS and analyzed for Fg and FVIII in a hematology analyzer. vWF activity was quantified by ristocetin cofactor assay. Coagulation of cryo diluted in cryo‐poor plasma (CPP) at original ratios (1:10) was measured by ROTEM. Thrombin generation of the cryo‐CPP mixture was quantified by thrombogram. Packed red cells, platelet concentrates, frozen plasma, and cryo were combined (1:1:1:1) to simulate massive transfusion and analyzed by ROTEM. vWF function was also measured by shear‐induced adhesion of platelets to a collagen‐coated surface flow.
Results/Finding: No significant difference in hemostatic properties were observed between group A and O pools, combined results are summarized in Table 1. Additionally, no significant changes were observed on ROTEM in massive transfusion simulation. Precipitation was observed in 4C samples, these aggregates were easily resuspended upon warming in a 37 °C water bath.
TABLE 1 (TS11‐ST4‐25) Hemostatic properties of cryoprecipitate stored at refrigerated and room temperature
| Test | t0 | 4h | 1d | 3d | 7d | 14d | 21d | 28d | 35d | |
|---|---|---|---|---|---|---|---|---|---|---|
| Fg (mg/dL) | RT | 1004 | 1260 | 1401 | 1260 | 1186 | 1245 | 760 | 644 | 731 |
| 4C | 1004 | 1338 | 1398 | 1170 | 1259 | 1224 | 786 | 728 | 884 | |
| FVIII (%) | RT | 890 | 660 | 659 | 430** | 401** | 416** | 254** | 220** | 155** |
| 4C | 890 | 790 | 678 | 498** | 409** | 406** | 291** | 236** | 200** | |
| vWF (%) | RT | 891 | 715 | 881* | 871 | 740 | 580[Link], [Link] | 334[Link], [Link] | 344[Link], [Link] | 311[Link], [Link] |
| 4C | 891 | 857 | 1041* | 988 | 779 | 746* | 676[Link], [Link] | 563[Link], [Link] | 501[Link], [Link] | |
| ETP (nM‐min) | RT | 1199 | 991 | 992 | 789[Link], [Link] | 748** | 670[Link], [Link] | 498[Link], [Link] | 464** | 682[Link], [Link] |
| 4C | 1199 | 923 | 1210 | 1396* | 978 | 922* | 798[Link], [Link] | 686** | 955* | |
| Peak (nM) | RT | 94.8 | 60.9 | 78.5* | 48.0[Link], [Link] | 46.8** | 38.8** | 28.7** | 24.1** | 37.9** |
| 4C | 94.8 | 58.7 | 129.7* | 136.9[Link], [Link] | 68.1 | 59.7 | 51.2** | 42.1** | 57.6 | |
| ttPeak (min) | RT | 14.7 | 15.6 | 13.9 | 15.8* | 15.7 | 16.9* | 17.4* | 18.1[Link], [Link] | 18.6[Link], [Link] |
| 4C | 14.7 | 15.3 | 11.7 | 10.4[Link], [Link] | 13.7 | 14.2* | 14.3* | 14.5* | 15.5* | |
| CT (s) | RT | 46.4 | 59.5[Link], [Link] | 51.1 | 44.6 | 51.4 | 50.6 | 49.1 | 49.3 | 48.0 |
| 4C | 46.4 | 47.9 | 47.3 | 42.3 | 48.1 | 51.6 | 51.6 | 52.5 | 55.6 | |
| Alpha angle (°) | RT | 81.5 | 80.3 | 80.8 | 81.1 | 81.6 | 81.9 | 81.8 | 82.6 | 80.6 |
| 4C | 81.5 | 81.1 | 82.6 | 81.1 | 80.6 | 81.5 | 81.3 | 80.6 | 80.6 | |
| MCF (mm) | RT | 26.6 | 25.4 | 26.0 | 25.5 | 26.3 | 26.4 | 29.6 | 30.9 | 26.4 |
| 4C | 26.6 | 26.5 | 30.5 | 26.5 | 27.3 | 27.9 | 28.4 | 26.4 | 25.9 |
* p<0.05 for difference between RT and 4C
** p<0.05 for change from t0
Conclusion: The Fg concentration of cryo is not significantly decreased at 35d after thawing. The shelf life of cryo used for Fg replacement could be extended up to 35 days if sterility could be maintained. Refrigeration minimizes risk for bacterial contamination, and the Fg concentration and hemostatic function of 4C cryo is not inferior to RT cryo. vWF and thrombin generation were significantly better preserved at 4C. It would be reasonable to consider revision of guidelines to extend the shelf life of thawed, refrigerated cryo used for Fg replacement; which may improve product utilization/management and decrease waste.
TS12‐ST4‐25
Red Blood Cells Donated by Smokers: A Pilot Study
Robert A. DeSimone*1, Joshua A. Hayden1, Chase A. Mazur1, Ljiljana V. Vasovic1, Bruce S. Sachais2, Ruchika Goel3, Yen‐Michael S. Hsu1 and Melissa M. Cushing1
1Weill Cornell Medicine, 2New York Blood Center, 3Department of Pediatrics, New York Presbyterian Hospital, Weill Cornell Medicine
Background/Case Studies: Current regulations do not require blood collection facilities to ask donors about cigarette use, and the prevalence of nicotine metabolites in blood products is unknown. Although smokers have higher hemoglobin (Hb) levels, smoking may affect the quality of donated RBCs. For example, smokers have higher carboxyhemoglobin (COHb) levels and RBC membrane abnormalities leading to premature hemolysis. Herein, we test RBC units for cotinine, a metabolite of nicotine, and COHb, and investigate transfusion outcomes in recipients of cotinine positive units.
Study Design/Method: RBC segments from 100 unique donors were tested for cotinine using a mass spectrometry assay and COHb with the GEM Premier 4000 Analyzer. Outcomes were evaluated retrospectively in adult non‐bleeding patients receiving only 1 RBC unit each. For patients receiving cotinine‐positive RBC units (n=13) and a randomly‐selected control group receiving cotinine‐negative RBC units (n=13), Hb, Hct, vital signs and WBC count within 12 hours before and after transfusion were recorded. Non‐parametric statistical tests (Mann‐Whitney U and Wilcoxon signed‐rank) were performed.
Results/Finding: Thirteen of 100 RBC donor segments (13%) were positive for cotinine at levels consistent with active smoking, >10 ng/mL. The smoker RBC units showed significantly greater COHb levels compared to a control group of non‐smoker units (median 3.0% [IQR 1.6‐6.3%] vs. median 0.8% [IQR 0‐1.5%], p=0.007). Patients transfused smoker RBC units showed a reduced hematocrit increment (median + 1.2%, IQR ‐0.2‐3.8%) compared to patients receiving non‐smoker RBC units (median + 3.6%, IQR 2.8‐4.6%) (p=0.024). This trend was also observed for hemoglobin increments, but did not reach statistical significance (median + 0.4g/dL [IQR 0‐1.3g/dL] for smoker units vs. median + 1.3g/dL [IQR 0.8‐1.9g/dL] for non‐smoker units, p=0.056). No transfusion reactions were observed, and both groups showed no difference in mL/kg dosing (p=0.60). For patients transfused smoker RBC units, there was no significant change in their vital signs, oxygen saturation and WBC count following transfusion.
Conclusion: Thirteen percent of RBC units tested positive for cotinine at levels consistent with active smoking, accordant with the estimated CDC national smoking rate of 15.1%. Our preliminary data show that smoker RBC units had greater COHb content and reduced hematocrit increments following transfusion. However, these results must be validated in a larger sample size of smoker RBC units with careful attention to potential confounding variables, including age, gender and underlying disease of recipients. The influence of smoking on other blood components and in components transfused to pediatric patients, along with COHb increments in recipients of smoker RBCs, should also be considered.
TS16‐ST4‐25
Activation Status of Pathogen Reduced Platelet Components in Plasma in Comparison with Conventional Plasma Platelet Components
Inga V. Gurevich*1, Brant Keener2 and Joel Kniep1
1University of Colorado, 2University of Colorado Hospital
Background/Case Studies: Circulating blood microparticles (MPs) play complex and dynamic physiological roles as mediators of inflammation and hypercoagulation. Seventy to ninety percent of MPs in blood are released from platelets or megakaryocytes. Some studies suggest that high MP content in platelet components, indicating a high level of platelet activation, may limit the effectiveness of platelet transfusions. Activated platelets may be beneficial to stop active bleeding suggested by work on cryopreserved and cold‐stored platelets. Conversely, platelet components with a low MP content (non‐activated) may be beneficial for prophylactic platelet transfusion in bone marrow transplant patient population. This study investigated whether pathogen reduction changes the activation status of single donor platelets.
Study Design/Method: We received conventional (non‐PRT) and PRT (pathogen reduction technology) INTERCEPT™ apheresis platelets in plasma from the regional blood donor center. Each platelet component was tested in our institution using ThromboLUX System (LightIntegra Technology Inc., Vancouver, Canada) in order to establish the MP profile of PRT platelets in plasma. ThromboLUX is a non‐invasive, in vitro optical test utilizing dynamic light scattering to characterize a platelet components by quantitation of platelet MP present in the sample. Data were analyzed with Minitab® 17.3.1 Statistical Software.
Results/Finding: We tested a total of 139 platelet components including 95 (68.4 %) PRT and 44 (31.7 %) conventional platelets. A 15% threshold for MPs to separate non‐activated from activated platelets was established for both conventional and PRT platelet components in plasma. 34.7 % of PRT (33 out of 95) and 34.1% of conventional (15 out of 44) platelet components revealed activated platelet status based on MP content (MP %). Statistical analysis for MP content (MP %) in PRT and conventional platelet components showed no significant difference using a 3‐parameter Weibull distribution. Mean MP content in PRT and conventional platelets were the same: 0.12 ± 0.12 (alpha=0.01, P=0.8). Alpha=0.05 level of significance P values greater than 0.05 were considered significant.
Conclusion: In our study PRT and conventional platelet components in plasma showed similar platelet activation distribution based on MP content (MP %). About 35% of our PRT and conventional platelet inventory tested as activated. Pre‐screening platelet components for low (non‐activated) and high (activated) MP content (MP %) may be helpful to manage the platelet inventory for targeted use for prophylactic or therapeutic applications.
Oral Abstract Session: Donor Selection ‐ Iron, MSM and Education
BBC1‐TU2‐11
Impact of Progressive Reduction in the Deferral Period for MSM on Donor Compliance and HIV Rates
Sheila O'Brien*, Lori Osmond, Qi‐Long Yi, Wenli Fan and Mindy Goldman
Canadian Blood Services
Background/Case Studies: In Canada deferral for men who have sex with men (MSM) was decreased from “even one time since 1977” to a 5‐year deferral in 2013, and a 1‐year deferral in 2016. We monitored donor compliance and HIV rates.
Study Design/Method: Each month from October ‐ February 2012/2013 (pre‐implementation), 2014/2015 (post‐5‐year) and 2017/2018 (post‐1‐year) randomly selected males donating whole blood in the past month were invited to participate in an anonymous on‐line survey (19,459 pre‐implementation, 18,934 post‐5‐year and 18,378 post‐1‐year). Donors were asked about their MSM history. HIV rates of all donations were monitored from January 2010 to March 2018.
Results/Finding: 9,691 donors (49.8%) pre‐implementation, 6,881 (36.3%) post‐5‐year and 6,672 (36.3%) post‐1‐year completed the survey. There were 0.8% pre‐implementation, 1.1% post‐5‐year and 1.5% post‐1‐year with MSM history. The percentage of donors with MSM history in the last 1 year or 6 months did not change (p>0.05). The projected number of eligible MSM donating increased from 275 to 1,384 to 2,531 with criteria changes (Table 1). Post‐ 1 year 0.10% of male donors had MSM history in the last 3 months. The number of HIV positive donations per year ranged from 2 to 5 from 2010 to July 21, 2013 (0.2 to 0.51 per 100,000 donations). There were 10 HIV positive donations in the 37 month period post‐5‐year (0.37 per 100,000 donations,) and 4 in 19 months post‐1‐year (0.29 per 100,000 donations, p=0.68). There was 1 HIV NAT‐yield donation (female, no risk factors). Risk factor interviews identified no HIV positive donors motivated to donate by the criteria change.
TABLE 1 (BBC1‐TU2‐11) Estimated annual numbers of male blood donors with MSM history
| Pre‐Implementation | Post‐Implementation of 5 Year Deferral | Post‐Implementation of 1 Year Deferral | |||||||
|---|---|---|---|---|---|---|---|---|---|
| Percentage of Male Donors | Projected Number of Male Donors | 95% CI | Percentage of Male Donors | Projected Number of Male Donors | 95% CI | Percentage of Male Donors | Projected Number of Male Donors | 95% CI | |
| Last had sex with another man: | |||||||||
| In the last 6 months | 0.10 | 203 | 74‐332 | 0.13 | 263 | 89‐438 | 0.12 | 246 | 74‐417 |
| In the last year but not in the last 6 months | 0.11 | 222 | 88‐357 | 0.06 | 131 | 8‐254 | 0.14 | 288 | 102‐473 |
| In the last 5 years but not in the last year | 0.16 | 335 | 169‐500 | 0.24 | 500 | 259‐740 | 0.32 | 667 | 385‐950 |
| Since 1977 but not in the last 5 years | 0.29 | 604 | 382‐826 | 0.49 | 1,024 | 680‐1,368 | 0.67 | 1,406 | 996‐1,815 |
| Before 1977 | 0.13 | 275 | 125‐426 | 0.17 | 360 | 156‐564 | 0.22 | 458 | 224‐692 |
Conclusion: Non‐compliance is rare. Progressive reduction in the deferral period had no impact on non‐compliance for MSM in the last 12 or 6 months but there was a small increase in eligible MSM donating. About half of the currently non‐compliant donors have very recent MSM history (in the last 3 months). HIV rates are very low and unchanged with progressively shorter deferral periods.
BBC16‐TU2‐11
Attitudes and Perceptions Among Men Having Sex with Men (MSM) Toward a New Non‐Deferral Blood Donations Policy in Israel
Eilat Shinar*1, Itzchak Levy2, Liraz Olmer3, Yuval Livnat3, Ran Shalhavi4 and Ohad Hizki4
1Magen David Adom National Blood Services, 2HIV Service, Infectious Disease Unit, Sheba Medical Center, 3Israel AIDS Task Force, 4The Israeli National LGBT Task Force
Background/Case Studies: In June 2017 the ban on blood donations from Men who had Sex with Men (MSM) since 1977 was lifted in Israel, and donations are accepted if 12 months had passed since the last sexual contact. However, as this change in policy was met with dissatisfaction by members of the local LGBT community, a novel approach was suggested by the National Blood Services, following a minority opinion of a member of a public committee (YL), appointed in 2015 by the Minister of Health to review Israel's blood donation policy. The new policy includes acceptance of MSM without deferral (once eligible by all other criteria), keeping solely the plasma frozen in quarantine and releasing it for transfusion only if a future donation, 4 months later, is found negative for Transfusion‐Transmitted agents. Before approval of the suggested Frozen Plasma Quarantine Policy (FPQP) we examined the attitudes of MSM, since donors will need to identify themselves as MSM in the Donor Health Questionnaire (DHQ), knowing that only the plasma component will be used for transfusion.
Study Design/Method: Anonymous survey was published in gay‐oriented websites, collecting demographic data, history of blood donation and attitudes toward the new FPQP.
Results/Finding: Responses from 1233 eligible MSM were analyzed. 61% were 25‐44 years old. 13.4% declared they donated blood at least once, in the recent year (therefore not complying with the current 12 months deferral policy). Only 8.5% self‐deferred themselves through the DHQ. Of those who did not donate blood in the last year, 202 (19%) declared they plan to do so under the current 12 months deferral policy, although they had sexual intercourse with another man in the last year, raising the rate of blood donors among the MSM population that participated in the study from 13% to 22%.
About 64.5% of the respondents are supportive/ very supportive of the suggested new FPQP, and if introduced, 64% would consider donating blood, which will raise the rate of blood donors among the respondents from 13% to 65%. In addition, 85% of MSM who donated blood in the last year stated they will agree to reveal their sexual orientation in the DHQ, in order to be included in the program, compared to 8.5% under the current 12 months deferral policy.
Conclusion: Introduction of new approaches is needed, to increase compliance of the LGBT community, enabling them to take part in life saving by blood donations, without compromising the blood recipients' safety. The suggested Plasma Quarantine Policy will bring probably more MSM to donate blood, who will truly state their sexual practice. This and the retesting the donors in the future donation will significantly increase blood safety, when compared to the current practice. If accepted, the suggested change in policy should be accompanied by an adequate educational campaign for both blood donors and recipients.
BBC21‐TU2‐11
Impact of a Post‐Donation SMS on Retention of New Whole Blood Donors
Carley N. Gemelli1, Sarah P. Kruse2, Nina Van Dyke2, Barbara Masser2,3, Tanya E. Davison2 and David O. Irving*2
1Research and Development, Australian Red Cross Blood Service, 2Australian Red Cross Blood Service, 3University of Queensland
Background/Case Studies: The retention of whole blood donors is an ongoing challenge for blood services, with a large proportion of first‐time donors failing to donate again. Unfortunately, there are few interventions with demonstrated effectiveness in improving retention of new donors. In 2016, the Australian Red Cross Blood Service implemented a new strategy whereby whole blood donors received an SMS after their donation, detailing to which hospital or geographic area their blood had been dispatched. The aim of this study was to test the effectiveness of the post‐donation SMS with new whole blood donors, by analysing their subsequent donation behaviour.
Study Design/Method: New whole blood donors who commenced blood donation in July‐September 2016 were followed up for 12 months. Statistical analyses compared those who received a SMS with those who had not on the following measures: return rates at twelve months and time taken to return. These results were further broken down by donors who had rebooked at the time of their last donation and those with no forward booking.
Results/Finding: Overall, 19,430 new donors donated whole blood during July‐September 2016. This cohort had a mean age of 33.2 years and a slightly larger proportion of females (52%). During their first donation, 54% rebooked for their next donation and 25% did not receive a post‐donation SMS.
Among donors who had not rebooked in the donor center, 51% of those who received an SMS returned within 12 months, compared to 35% who did not receive an SMS (p<0.0001). Of the donors who rebooked in the donor center, 73% of those who received an SMS returned within 12 months, compared with 60% of those who did not receive an SMS (p<0.0001). Independent of forward booking, donors who received the post‐donation SMS returned to donate sooner (Mean: 141.1 days) than donors who did not receive an SMS (Mean: 179.6 days; p<0.05).
Conclusion: A post‐donation SMS improved return rates at 12 months, even for new whole blood donors who had made a forward appointment before leaving the donor center. This research suggests that a cost‐effective post‐donation SMS informing donors of where their blood was sent is a valuable strategy to bring back new whole blood donors in non‐remunerated setting.
BBC28‐TU2‐11
Ferritin Testing of Young Blood Donors: Year‐1 Findings
Hany Kamel*, Marjorie D. Bravo, Mary J. Townsend and Ralph R. Vassallo
Blood Systems, Inc.
Background/Case Studies: To mitigate iron deficiency in young donors, we began measuring ferritin in 16‐18 y/o donors in December 2016. Donors with low ferritin values (females (F) < 20 ng/mL; males (M) < 30 ng/mL) were notified, advised to take iron and deferred from subsequent red blood cell donations (F: 12 months; M: 6 months).
Study Design/Method: We analyzed 12 months’ data PRE and POST implementation. During these 2 periods, we summarized the frequency of allogeneic donor presentations, hemoglobin (Hb) and low ferritin deferral by gender (F/M) and by donor experience [First time (FT)/Repeat (RD)]. The percentage of donor presentations by young donors and hemoglobin deferral PRE and POST ferritin testing were calculated as well as summary statistics for hemoglobin measurements.
Results/Finding:
There were 889,762 and 883,583 presentations in the 12‐month period PRE and POST ferritin test implementation. Of those, 116,934 presentations (by 89,061 donors) and 104,358 presentations (by 86,378 donors) were made by young donors. Average presentations/donor decreased from 1.3 in PRE to 1.2 in POST periods.
There was a decrement of 1.3% in the proportion of presentations made by young donors: 13.1% in PRE to 11.8% in POST period (p < 0.0001), mainly due to a 20% decrease in young RDs.
Of 78,785 young donors tested, the overall rate of low ferritin was 27.2%: specifically 29.1%, 8.0%, 46.4% and 27.8% in FT‐F, FT‐M, RD‐F and RD‐M, respectively.
Hb deferral decreased from 9.2% in the PRE to 7.5% in the POST period, an 18% decrease (p < 0.0001), mainly due to a 24% decrease in RDs.
Young donors’ mean Hb increased from 14.32 g/dL (SD 1.63) from the PRE to 14.45 g/dL (SD 1.62) tothe POST period (p < 0.0001, 2‐sample t‐test).
Conclusion:
We successfully implemented ferritin testing in at‐risk young donors with apparent positive impact on operations and donor health. Data from Year 1 show a significant decrease in Hb deferral and significant increase in mean donor Hb post implementation.
Donation loss was modest.
There is an appreciable level of low ferritin in FT donors.
Continuous monitoring is warranted to assess sustainability of findings in Year 2 and beyond.
BBC5‐TU2‐11
Ferritin Testing to Mitigate Risk for Iron Depletion in High School Blood Donors
Bryan R. Spencer*, James M. Haynes, Michele L. Rambaud, Meng Xu, Gregory A. Foster and Susan L. Stramer
American Red Cross
Background/Case Studies: Recent research confirms a high prevalence of iron depletion (ID) in high school‐age blood donors with higher risks for ID compared to adults at any donation frequency. An AABB industry bulletin recommends limiting collections in 16‐ to 18‐year‐old (yo) donors to one unit/year unless other measures are taken to protect iron status. In early 2018, our US blood center implemented ferritin testing on all red cell donors 16 to 18 (yo) with 6‐ to 12‐month deferrals recorded for male and female donors, respectively, with low ferritin values.
Study Design/Method: Donors 16‐18 yo were tested for ferritin after a successful whole blood or red cell apheresis procedure. The prevalence of Absent Iron Stores (AIS, ferritin < 12 ng/ml) and Low Ferritin (LF, ferritin < 20 ng/ml in females and <30 ng/ml in males) was estimated for 16, 17, 18 yo donors. Operational databases provided demographic and donation activity in the prior 24 months. Modified Poisson regression assessed AIS and LF risk by demographic and donation factors.
Results/Finding: >117,000 donations from 16‐18 yo donors were tested for ferritin between 1/29 and 3/29/18. The prevalence of LF was 34% overall, 22% in males and 45% in females vs AIS of 13% overall, 3.2% in males and 22% in females. LF was less prevalent in 16 vs 18 yo in unadjusted analysis, but the difference disappeared after adjustment in regression analysis. Risk for LF showed the expected gradient in risk for increasing donation frequency (not shown), a higher risk for females (Risk Ratio, RR=2.0), but only modest differences over time since last donation (see Table). In AIS regression models, stratified by sex, differences emerged compared to the models for LF: in males, but not females, both 16‐ and 17‐yo had risk for AIS statistically distinguishable from 18 yo donors (RR = 1.36 and 1.15, respectively). Also, the impact of interval since last donation was an important predictor, with AIS risk duration to 39 weeks following donation controlling for other covariates.
Conclusion: The prevalence of LF and AIS in 16‐18 yo donors varies by age, sex, and donation frequency, as in adult donors. This analysis indicates, for the first time, a higher AIS risk in 16 yo male donors compared to 18 yo. The importance of interval since donation as a strong predictor for AIS but not LF suggests that AIS may be a more relevant indicator of physiological response to the stress of donation. Analysis of on‐going longitudinal data will be useful to assess the impact of ferritin testing, optimal cutoffs for donor management, and appropriate deferral lengths.
(BBC5‐TU2‐11) Selected risk factors for Low Ferritin (<20 ng/mL for females, < 30 for males) & AIS (ferritin < 12 ng/mL)
| Risk Ratio for Low Ferritin (95% CI) | Risk Ratio for AIS, Females (95% CI) | Risk Ratio for AIS, Males (95% CI) | |
|---|---|---|---|
| Females vs Males | 1.97 (1.91, 2.03) | NA | NA |
| Age | |||
| 16 vs 18 yo | 0.99 (0.96, 1.03) | 0.95 (0.91, 0.99) | 1.36 (1.16, 1.59) |
| 17 vs 18 yo | 1.00 (0.98, 1.02) | 1.01 (0.98, 1.05) | 1.15 (1.04, 1.27) |
| Donation interval (time since last red cell donation) | |||
| 8‐12 vs 52 + weeks | 0.83 (0.79, 0.88) | 1.83 (1.69, 1.99) | 4.65 (3.23, 6.70) |
| 12‐16 vs 52 + weeks | 0.98 (0.88, 1.09) | 1.55 (1.42, 1.69) | 3.22 (2.21, 4.69) |
| 16‐26 vs 52 + weeks | 1.02 (0.92, 1.13) | 1.32 (1.22, 1.43) | 2.52 (1.75, 3.62) |
| 26‐39 vs 52 + weeks | 0.88 (0.80, 0.98) | 1.22 (1.10, 1.36) | 1.80 (1.16, 2.79) |
| 39‐52 vs 52 + weeks | 0.93 (0.86, 1.01) | 1.01 (0.90, 1.12) | 1.17 (0.71, 1.93) |
Results from modified Poisson regression models also controlling for donation count, race and weight.
BBC18‐TU2‐11
Blood Donor Educational Materials: A Pilot Study at Three Sites
Gay Wehrli*1, Susan Rossmann2, Louis M. Katz3 and Dan A. Waxman4
1University of Virginia School of Medicine, 2Gulf Coast Regional Blood Center, 3Americas Blood Centers, 4Indiana Blood Center
Background/Case Studies: Donors need education and time to make an informed decision to proceed or decline whole blood donation. The goal of this pilot study was to evaluate acquired knowledge from recently developed (new) standardized, donor education materials (NEM) compliant with prior recommendations from AABB and the FDA Blood Products Advisory Committee versus current educational materials (CEM), Donor History Questionnaire Blood Donor EM version 2.0. Using comparable formatting, the NEM is 2 pages at a grade 6.7 comprehension level and the CEM is 1 page at a grade 7.1 comprehension level. NEM include current education topics such as iron replacement, not found in CEM. This study was IRB approved as an exempt protocol.
Study Design/Method: A two month, multicenter, randomized, controlled pilot study comparing donor EM among two cohorts: new donors (ND) who had not donated during ≥ 2 years and returning donors (RD) who had given during < 2 years. At three donor sites, fifteen volunteer donors were assigned to each of four groups (sixty donors per site): Group 1, ND with NEM; Group 2, ND with CEM, Group 3 RD with NEM, and Group 4 RD with CEM. Participants completed a previously validated pre‐ and post‐quiz about blood donation. Each quiz had the same ten multiple‐choice questions using single best answers including the answer option, “I don't know.” For example, “You need photo identification to donate blood.” Answer options: True, False or I don't know.
Results/Finding: Demographics and quiz results are shown in table 1. Groups 1 and 3 showed greater knowledge acquisition using the NEM versus Groups 2 and 4 using the CEM. Groups 1 and 3 also showed a greater reduction in, “I don't know,” responses and in incorrect responses.
Conclusion: Donor EM must quickly inform donors of key information at an appropriate comprehension level. Testing donor EM is an essential step in the development process to ensure the intended knowledge is acquired by the end user population. Next steps are to expand the data analysis and pilot of the new donor EM.
TABLE 1 (BBC18‐TU2‐11) Demographics and Quiz Scores
| Group 1 | Group 2 | Group 3 | Group 4 | |
|---|---|---|---|---|
| Donor Education Materials | New | Current | New | Current |
| Donor (D) status (N=New, R=Returning) | ND | ND | RD | RD |
| Total Number: Male/Female | 45: 19/26 | 45: 19/26 | 45: 21/24 | 45: 20/24 (1 blank) |
| Mean years of age (Range) | 36 (18‐66) | 34 (18‐68) | 46 (18‐83) | 42 (18‐73) |
| Pre‐Quiz Average Score for 10 Questions | ||||
| Correct responses | 6.4 | 6.4 | 7.9 | 8.0 |
| I Don't Know responses | 2.2 | 2.3 | 0.8 | 0.8 |
| Incorrect responses | 1.5 | 1.3 | 1.2 | 1.2 |
| Post‐Quiz Average Score for 10 Questions | ||||
| Correct responses | 8.9 | 7.6 | 9.4 | 8.3 |
| I Don't Know responses | 0.3 | 1.2 | 0.1 | 0.6 |
| Incorrect responses | 0.7 | 1.2 | 0.6 | 1.2 |
| Percent Score Change from Pre to Post | ||||
| Correct responses | 39.6% | 17.6% | 18.3% | 3.9% |
| I Don't Know responses | ‐84.5% | ‐47.1% | ‐89.5% | ‐55.4% |
| Incorrect responses | ‐49.2% | ‐3.5% | ‐55.4% | ‐7.1% |
Oral Abstract Session: Progress in Red Cell and Platelet Serology
IGT3‐TU2‐12
Identification of Human Alloantibodies Using Non‐Human Gene Modified RBCs as a “Blank Canvas”
James C. Zimring*1, Lay See Er2, Linda Kapp1, Thandar Aye2, Rosalind Armour2, David Smith3, Yi Lasanajak3, James AuBuchon2 and YanYun Wu2
1BloodworksNW Research Institute, 2BloodworksNW, 3Emory Comprehensive Glycomics Core
Background/Case Studies: The identification of individual antibody specificities in multiply alloimmunized patients can be complex. Because each RBC donor expresses multiple alloantigens, panels of extensively phenotyped RBC donors must be used for antibody identification. The ideal substrate would be RBCs that express one, and only one, human alloantigen. We hypothesized that, unlike modified human RBCs with multiple background human gene products, mouse RBCs would serve as a “blank canvas” without human RBC alloantigens, that could be engineered to express individual human alloantigens.
Study Design/Method: Transgenic mice in which RBCs express either K, k, or Jkb alloantigens were subjected to an extended phenotype with antibodies against common human RBC alloantigens. Transgenic or wild‐type mouse RBCs were also tested with plasma from two human patients with known identified alloantibodies. Human plasma was incubated with wild‐type mouse RBCs, and bound antibodies were eluted and tested for carbohydrate binding with a glycan array containing 600 different carbohydrates of known chemistry.
Results/Finding: Mouse RBCs typed negative for RhD, RhC, Rhc, RhE, Rhe, Fya, Fyb, K, k, S, s, or Jkb antigens but were reactive with anti‐Jka. “Naturally occurring” alloantibodies to mouse RBCs, both IgM and IgG, were detected in multiple samples of human plasma. Eluates from mouse wild‐type RBCs incubated with human plasma were observed to have a strong IgG signal against only a single carbohydrate of the structure GalNAca1‐3(Fuca1‐2)Galb1‐4GlcNAcb1‐3Galb1‐4GlcNAcb1‐3Galb1‐4GlcNAcb‐; no reactivity was seen with other carbohydrates of a similar structure (e.g. other poly‐N‐acetyl‐lactosamines). Human anti‐mouse antibodies were easily absorbed using wild‐type RBCs, resulting in plasma free of activity against wild‐type RBCs. Testing absorbed plasma on transgenic mouse RBCs (wild‐type, K, k or Jkb) correctly identified an anti‐k and anti‐Jkb in two separate patient specimens, by flow cytometry and wet‐tube testing in the immunohematology lab.
Conclusion: These studies report a novel approach to isolate individual human blood group antigens, one at a time, on mouse RBCs. The use of RBCs of a non‐human origin provides several advantages, including: 1) a “blank canvas” without most human alloantigens, 2) RBCs that can be used in existing immunohematology platforms, and 3) a stable source of RBCs from well‐characterized animals. Problems include assessing the basis for reactivity of anti‐Jka with mouse RBCs and eliminating human anti‐mouse RBC antibodies. Although absorption works well, identifying the target and eliminating it would be preferable, by genetic modification and/or enzymatic treatment. Ongoing work includes expanding the panel of transgenic lines and understanding background reactivity.
IGT4‐TU2‐12
Fine Epitope Mapping of Monoclonal Anti‐Human Globulins Useful for Characterization of Alloantibodies Underlying High Titer Low Affinity Alloantibodies
Heather L. Howie, Linda Kapp, Xiaohong Wang, Jenna Lebedev and James C. Zimring*
BloodworksNW Research Institute
Background/Case Studies: Anti‐Human Globulin (AHG) is a central component to immunohematology. However, antibodies to common antigens (e.g. high titer low affinity (HTLA)) can complicate characterization of other alloantibodies. Humans encode 4 different subtypes of IgG (IgG1‐IgG4); HTLAs tend to be isolated IgG4. An FDA licensed monoclonal AHG (clone 16H8) is reactive with IgG1‐IgG3, but not IgG4, allowing elimination of HTLA signal and characterization of underlying alloantibodies. However, it was recently reported that 16H8 also fails to recognize two natural IgG3 variants found in ethnic groups of Eastern Africa and the Middle East (IgG3‐03 and IgG3‐13). This raises the concern that 16H8 may miss clinically significant alloantibodies in patients whose genome encodes the IgG3‐03 and/or IgG3‐13 variants.
Study Design/Method: Sequence analysis of 29 known human variants of IgG subtypes was carried out. A monoclonal anti‐K1 antibody was expressed recombinantly, as each of the different 29 variants, and this panel was used as targets to assess the ability of 16H8 to bind. K+/k + targets were incubated with each expressed anti‐K1 variant, followed by 16H8, and then analyzed by flow cytometry. In addition, mice were immunized with human IgG, splenocytes were fused with myeloma partners, and novel monoclonal anti‐AHG antibodies were cloned and characterized using the same assay.
Results/Finding: 7 amino acid residues were identified within the variants analyzed, which were common to canonical IgG1‐IgG3 but missing in variants of IgG4. Of these, only a single amino acid (E) at position 419 was also found in the IgG3 variants that 16H8 does not recognize (IgG3‐03 and IgG3‐13) but was Q for all other expressed IgG1‐IgG3 variants. Mutation of the natural E at position 419 to Q in IgG4‐01 caused a gain of 16H8 reactivity. Moreover, Q instead of E at position 419 is the only amino acid difference between IgG3‐03 (16H8 nonreactive) and IgG3‐06 (16H8 reactive). In addition, a new monoclonal antibody was isolated that recognized all expressed variants of IgG1‐IgG3, but not variants of IgG4. This new monoclonal AHG mapped to position 355, which is R in all expressed non‐IgG4 variants but is a Q in IgG4 variants analyzed.
Conclusion: The reported findings identify that the epitope recognized by 16H8 contains amino acid 419, and that the E419Q polymorphism is responsible for unintended lack of recognition of IgG3‐03 and IgG3‐13 as well as the useful non‐reactivity with IgG4. We report a new monoclonal that maintains the virtues of 16H8 but remedies its defects. Combination of the new monoclonal with 16H8 would generate an AHG mixture non‐reactive with IgG4, but unlikely to lose reactivity with IgG1‐IgG3 due to as of yet undescribed polymorphism.
IGT5‐TU2‐12
Monoclonal Anti‐CD38 and Anti‐CD47 Therapy Interference with Platelet Antibody Screen Test Methods
Randall W. Velliquette*1, Julie Kirkegaard2, Daniel S. Jones2, Kelly Winkhart2, Christine Lomas‐Francis3 and Connie M. Westhoff1
1Immunohematology and Genomics Laboratory, New York Blood Center, 2Immunohematology Reference Laboratory, Community Blood Center of Kansas City, 3New York Blood Center
Background/Case Studies: Daratumumab (DARA) is a FDA‐approved monoclonal IgG1κ anti‐CD38 widely used to treat multiple myeloma. Hu5F9‐G4 is a monoclonal IgG4 anti‐CD47 in clinical trials to treat various hematological or solid malignancies. In blood bank testing the main focus has been expression of CD38 and CD47 on test RBCs and the interference of anti‐CD38 and anti‐CD47 in pre‐transfusion RBC antibody screening. CD38 and CD47 are also expressed on platelets, but to date no studies have been reported on anti‐CD38 or anti‐CD47 interference in platelet antibody screening or crossmatch testing. The purpose of this study was to evaluate the possible interference of anti‐CD38 or anti‐CD47 therapy in platelet antibody detection testing.
Study Design/Method: Serum samples were from eight patients (DARA anti‐CD38 n=6, Hu5F9‐G4 anti‐CD47 n=2). Pre‐therapy samples were not available for parallel testing, therefore; 7 of 8 samples studied were selected from males to reduce confounding results due to possibility they might have existing HLA antibody; 1 of 2 anti‐CD47 patients was female. None had a history of platelet transfusions. Sera were tested using two solid phase red cell adherence tests (Immucor Capture P and Capture P Ready‐Screen) and a qualitative solid phase enzyme linked immunosorbent assay (Immucor PakPlus) according to manufacture instructions. Anti‐CD38 or anti‐CD47 serum IAT reactivity against RBCs was established prior to platelet testing; anti‐CD38 1 + reactive, anti‐CD47 4 + reactive using Ortho anti‐IgG.
Results/Finding: Test results are shown in the table.
| Sample | mAb Therapy | Capture P | Capture P Ready‐Screen | PakPlus |
|---|---|---|---|---|
| 1 | DARA | Neg 8/8 | Pos 3/13 | Neg all wells |
| 2 | DARA | Pos 6/8 | Pos 1/13 | Pos GP Ib/IX, IV, HLA wells Neg GP IIb/IIIa, Ia/IIa wells |
| 3,4 | DARA (n=2) | Pos 8/8 | Pos 4/13 | Neg all wells |
| 5 | DARA | Pos 8/8 | Neg 13/13 | Pos GP IIb/IIIa wells Neg GP Ia/IIa, Ib/IX,IV,HLA wells |
| 6 | DARA | Pos 8/8 | Pos 3/13 | Neg all wells |
| 7,8 | Hu5F9‐G4 (n=2) | Pos 8/8 | Pos 13/13 | Neg all wells |
Conclusion: Similar to DARA or Hu5F9‐G4 therapy interfering in RBC antibody detection, serum containing anti‐CD38 or anti‐CD47 may complicate the detection of antibodies to HLA Class I, platelet specific antibodies and presumably platelet crossmatch testing. 5 of 6 samples containing DARA had positive screens by Capture P or Capture P Ready‐Screen and 2 of 6 reacted variably by PakPlus assay. Sera from both patients on Hu5F9‐G4 had positive screens by both Capture P methods, but were negative by PakPlus assay. This study demonstrates that circulating DARA or Hu5F9‐G4 in patient serum may react with CD38 and CD47 expressed on intact platelets or platelet membranes causing false positive platelet antibody screens or crossmatches depending on the test method. The vast majority of Capture P and Capture P Ready‐Screen tests gave positive results. In contrast, PakPlus which consists of monoclonal captured or affinity purified glycoprotein (GP) molecules rather than intact platelets avoids anti‐CD47 interference. If platelet antibody screening or crossmatch testing is needed in patients receiving anti‐CD38 or anti‐CD47 therapy, positive platelet antibody detection tests in these patients should be interpreted with caution.
IGT6‐TU2‐12
Induced Pluripotent Stem Cell‐Derived Red Cells for Use as Reagents to Resolve Rh Specificities
Hyun H. An*1, Judith Aeschlimann2, David Posocco1, Jean Ann Maguire1, Paul Gadue1, Deborah L. French1, Connie M. Westhoff2 and Stella T. Chou1
1The Children's Hospital of Philadelphia, 2Immunohematology and Genomics Laboratory, New York Blood Center
Background/Case Studies: Rh antibodies are common despite serologic Rh‐matched transfusions for patients with sickle cell disease. Rh specificities can be complex and result from absence of high prevalence Rh antigens or altered Rh epitopes due to RH gene variation. Antibody identification can be complicated by lack of reagent red cells expressing uncommon Rh phenotypes. We hypothesized that human induced pluripotent stem cells could be reprogrammed from rare donors or genetically engineered to produce red cells (iRBCs) in culture as reagents to aid complex antibody identification. We aimed to generate iRBCs for use in blood bank assays.
Study Design/Method: We generated customized iPSCs that included 1) Rh null cells, 2) cells lacking the high prevalence Rh antigen hrS, or 3) hrB. For the Rh null line, we used CRISPR/Cas9 genetic engineering in a WT iPSC line to disrupt the RH alleles by a large deletion and/or via frameshift mutations resulting in an early stop codon. For lines lacking high prevalence Rh antigens, we reprogrammed group O donor cells whose RH genotypes confirmed the absence of hrS or hrB antigens, respectively. Two independent clones from each customized line were characterized for pluripotency and a normal karyotype confirmed.
Results/Finding: We differentiated customized iPSCs by an embryoid body protocol with combinations of hematopoietic cytokines. We harvested hematopoietic progenitors on day 8 and cultured these cells with erythroid specific cytokines. We demonstrate progressive maturation to Band 3 high, alpha integrin low iRBCs that became smaller in size and had condensed nuclei. Rh expression by flow cytometry was comparable for D + iRBCs compared to donor‐derived D + red cells, while Rh null iRBCs showed complete absence of cell surface Rh. We assessed RBC agglutination by gel card assay of cultured untargeted and Rh null iRBCs using standard Rh typing reagents. The untargeted iRBCs agglutinated as expected with anti‐Rh reagents while the Rh‐null iRBCs showed no agglutination with all 5 common Rh antibodies (DCcEe). In testing with patient serum containing anti‐e, untargeted cultured e + iRBCs agglutinated and Rh null iRBCs showed no agglutination. Similarly, in testing with patient serum containing anti‐hrS, hrS + iRBCs agglutinated and hrS‐ iRBCs showed no agglutination.
Conclusion: Customized iPSCs can be reprogrammed from rare donors or genetically engineered to express rare blood group antigen phenotypes or antigen combinations that are difficult or impossible to find from donors. iRBCs produced from customized iPSCs can be used as blood bank reagents and potentially standardize antibody identification in patients with complex specificities. When scale‐up technology is available, Rh null iRBCs could be used as universal donor cells for therapeutic application.
IGT11‐TU2‐12
Anti‐Gpv Autoantibodies Are a Frequent Finding in Patients with Immune Thrombocytopenia and Lead to Efficient Platelet Removal in a Murine Model
Richard Vollenberg1, Rabi Jouni2, Monika Burg‐Roderfeld3, Gregor Bein1, Tamam Bakchoul2 and Ulrich J. Sachs*1
1Justus Liebig University, 2Eberhard Karls University, 3Fresenius University of Applied Sciences
Background/Case Studies: Immune thrombocytopenia (ITP) results from autoimmunization against platelet antigens. Resulting autoantibodies (aabs) are considered to represent a major mechanism of thrombocytopenia in ITP by inducing platelet clearance from the circulation. Several lines of evidence demonstrate that aabs against glycoproteins (GP) IIb/IIIa and Ib/IX are predominant in ITP patients, and both disease severity and treatment response rates to specific therapeutics have been associated with aabs patterns. GP V is a well characterized immune target in Varicella‐associated and drug‐induced thrombocytopenia, but has never been studied systematically in ITP.
Study Design/Method: Patients with a suspected diagnosis of primary ITP were included once they met pre‐defined clinical inclusion criteria. The presence of GP IIb/IIIa‐, GP Ib/IX, and GP V‐specific aabs was investigated by monoclonal antibody immobilization of platelet antigens (MAIPA) assay, both on patients’ autologous platelets (direct MAIPA) and in serum (indirect MAIPA). Serum IgG fractions were tested by surface plasmon resonance (SPR) technology for the presence of anti‐GP V aabs. Clearance of human platelets from the circulation in the presence of anti‐GP V aabs was studied in a NOD/SCID mouse model.
Results/Finding: In 1,140 qualified patients, all three GP specificities could be tested. Platelet‐bound aabs were detected in 343/1,140 patients (30.1%). Of these, 222 (64.7%) had platelet‐bound anti‐GP V aabs, either alone (10/222), or together with other specificities (211/222). Free anti‐GP V aabs were detected in 30/222 patients by indirect MAIPA, but in 88/222 by SPR. The avidity of aabs detected by both methods (n=29; R700/R350 = 0.73 ± 0.14) was significantly higher than the avidity for aabs detected by SPR only (n=59; R700/R350 = 0.32 ± 0.13, p < 0.001). In the NOD/SCID mouse model, IgG prepared from both types of anti‐GP V aabs eliminated human platelets with no detectable difference between the groups (mean platelet survival at t=300 min: 40% [range 27‐55] versus 35% [range, 16‐46]). A comparable, dose‐dependent platelet clearance was also obtained with monoclonal antibody SW16 against GP V.
Conclusion: Anti‐GP V is often detected on platelets from ITP patients. Our study has important implications for both, further development of laboratory testing, and guidance for clinical decision making. Comparison between MAIPA and SPR reveals that free aabs may be more frequent than reported, since aabs appear to escape detection by standard laboratory methods because of low affinity. Anti‐GP V by itself induces platelet clearance. Predicting disease severity and/or tailoring ITP therapy should not be restricted to the previously postulated difference between anti‐GP IIb/IIIa and anti‐GP Ib/IX, and further prospective studies are required to understand the impact of different platelet aabs on the clinical course of ITP.
IGT17‐TU2‐12
Reactivity of Immune Antibodies with Donor RBCs Labeled as Antigen‐Negative but Positive for Altered/Partial Antigen Expression
Julie Kirkegaard*1, Randall W. Velliquette2, Zong Hu3, Aaron Gottschalk4, Jack Wilson1, Christine Lomas‐Francis5, Sunitha Vege2 and Connie M. Westhoff2
1Immunohematology Reference Laboratory, Community Blood Center of Kansas City, 2Immunohematology and Genomics Laboratory, New York Blood Center, 3Immunohematology and Genomics Laboratory, 4National Center For Blood Group Genomics, 5New York Blood Center
Background/Case Studies: Variant RHCE alleles encoding weak or partial antigen expression can result in false negative typing by licensed serologic testing. We investigated 16 donor RBC samples with variant C, E or e antigen expression that were found as discrepancies between PK7300 (Beckman Coulter) and HEA PreciseType, and were then fully RH genotyped. Our aim was to see if these variant/partial antigens would be detected in the crossmatch when tested with immune plasmas containing the corresponding antibody specificity.
Study Design/Method: Compatibility testing was done by LISS, PEG IAT and Gel with appropriate controls. Immune anti‐E (n=5), anti‐C (n=3) and anti‐e (n=2) were tested against RBCs with altered Rh antigen expression: altered C, encoded by RHCE*CeVA (n=2), *CeRN (n=5), altered E encoded by RHCE*cEEW (n=1), *cEIV (n=3), *cE697G (n=3), altered e encoded by RHCE*ceMO (n=2). For all samples, the in trans antigen was negative or also a variant.
Results/Finding: Altered C from RHCE*CeVA was detected by PEG IAT (1 + to 2+), Gel (2+), but only 0 with LISS. The partial C from RHCE*CeRN, with immune anti‐C gave variable reactions by PEG and gel (0 to 2+); with LISS the results were negative. For samples with altered E expression, the RHCE*cEEW encoded E gave 1 to 2 + reactions by PEG, 0 to 4 + by gel and 0 to + W by LISS. The RHCE*cEIV encoded E gave 0 to 2 + reactions by PEG, gel and LISS. The RHCE*cE697G variant encoded E gave 0 to 4 + reactions by PEG, 0 to 3 + reactions by gel and LISS. Immune anti‐e tested by PEG and LISS did not detect, and gel gave 0 to 1 + reactions, with the e encoded by RHCE*ceMO. Controls with “normal” single dose expression of the antigens being investigated reacted with all test plasmas, giving reactions that were equivalent or stronger than the test samples.
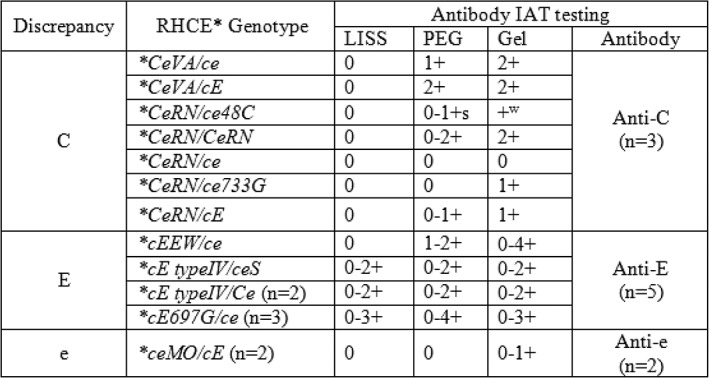
Conclusion: While the PK7300 is FDA licensed for labeling of donor units, some RHCE variants (RHCE*CeVA, *cEEW, *cE type IV, *ceMO, *CeRN and *cE697G) are not detected as antigen positive and donor units are labeled as antigen negative. An IAT crossmatch must be performed for patients with atypical antibodies, however, IAT crossmatch testing of these variant RHCE genotype RBCs with a battery of immune anti‐C, ‐E or ‐e gave variable results. Most were missed when using LISS enhancement. PEG was consistently more likely to detect the reduced antigen expression. The clinical significance of transfusing weak partial Rh antigen positive RBCs to a patient with the corresponding antibody has not been reported, but should be considered if compromised survival of transfused RBCs is noted.
Oral Abstract Session: Donor Studies ‐ Adverse Events and Testing for Anti‐A/B
BBC27‐TU3‐22
Impact of Frequent Apheresis Blood Donation on Bone: A Prospective, Longitudinal RCT
Walter Bialkowski*1,2, Robert D. Blank3, Cheng Zheng4, Jerome Gottschall5 and Paula E. Papanek1
1Marquette University, 2Blood Center of Wisconsin, Inc, 3Medical College of Wisconsin, 4University of Wisconsin Milwaukee, 5BloodCenter of Wisconsin
Background/Case Studies: Exposure to citrate anticoagulant during apheresis blood donation induces significant decreases in serum ionized calcium with subsequent perturbations to parathyroid hormone, vitamin D, and markers of bone remodeling. Cross‐sectional studies of bone mineral density (BMD) among apheresis donors exhibit conflicting results. Resolving the potential impact of the highest apheresis donation frequency, with the associated upper limit of citrate burden, represents a significant knowledge gap in ensuring adequate protections for volunteer apheresis blood donors.
Study Design/Method: ALTRUYST (NCT02655055) was a randomized, longitudinal, controlled clinical trial designed to determine if repeated exposure to citrate through apheresis donation reduces BMD. Male donors, 18‐65 years of age with no more than five previous apheresis donations and no diseases of bone or mineral metabolism, agreed to make ≥20 apheresis donations in the subsequent one year period. Dual‐energy x‐ray absorptiometry was performed at baseline, before randomization into a high frequency apheresis or no apheresis arm, and again after one year of participation. Paired t‐test was used to assess change in mean BMD.
Results/Finding: Donors in the apheresis arm (n=26) made a median of 20 apheresis donations (range 4–22 donations) during the one‐year study period with a mean donation interval of 17.8 days. Controls (n=15) made zero apheresis donations and a median of two whole blood donations (range 0‐6). Mean lumbar spine BMD at the end of the study period did not differ from that at the beginning among donors in the control arm (mean change=‐0.002 g/cm2, 95% CI [‐0.020, 0.016], p=0.78), nor did it change among donors in the apheresis arm (mean change=0.007 g/cm2, CI [‐0.005, 0.018], p=0.24). Change in mean BMD at the total hip was not statistically significant for control donors (mean change=0.002 g/cm2, CI [‐0.006, 0.009], p=0.63) or apheresis donors (‐0.004 g/cm2, CI [‐0.10, 0.002], p=0.16). Tests for differences in proportions of donors with change in BMD exceeding the least significant change (LSC) at the lumbar spine (0.00743 ± 0.02058g/cm2) between the apheresis and control arms in either a positive [apheresis 13 (50%), control 5 (33%), p=0.84] or negative direction [apheresis 8 (31%), control 6 (40%)] were statistically non‐significant (p=0.87). Proportional increases [apheresis 6 (23%), control 6 (40%), p=0.25] and decreases [apheresis 11 (42%), control 3 (20%)] were also not significantly different (p=0.15) at the total hip (LSC=0.00671 ± 0.01859g/cm2).
Conclusion: We present a prospective, longitudinal, randomized controlled trial evaluating the role of high frequency apheresis blood donation on change in BMD and report no significant alterations to BMD at the lumbar spine or total hip.
BBC14‐TU3‐22
The Effect of Age on Anti‐A/B IgM Antibody Prevalence in O Rh(D) Positive Male Donors
Samantha Ngamsuntikul*1, Rachel Beddard1, Lorena Aranda2 and Tiffany Wafford2
1BioBridge Global, 2QualTex Laboratories
Background/Case Studies: Anti‐A and anti‐B antibodies pose a risk of acute hemolytic transfusion reactions in recipients with the corresponding antigen. Debate continues on the titer of anti‐A and B and which antibody class, IgM or IgG, to test to ensure optimal safety. The US military uses a single titer cutoff of <1:256 of IgM anti‐A and B as safe in non‐group O recipients. With the resurgence of whole blood use in civilian traumas, it is important to determine the prevalence of these antibodies in the current donor population.
Study Design/Method: O Rh(D) positive male fixed site donors with a history of 2 or more donations were selected for testing study. This mitigated for transfusion related acute lung injury while allowing for a robust, committed donor pool. IgM Anti‐A and Anti‐B (IgM anti‐A/B) antibodies were determined using a single titer of 1:256. Plasma from ethylenediaminetetraacetic acid (EDTA) samples was tested using saline (0.9%) diluent. Diluted plasma (50uL) was mixed with 50uL of commercially available A1 and B cells, incubated at room temperature for 5 minutes, centrifuged for 15 seconds at 3600 rpm, and read for agglutination. Reactivity for either anti‐A or anti‐B at 1:256 constituted a positive. Donor age was retrieved from the blood establishment computer system.
Results/Finding: Of 1,052 male O Rh(D) positive donors tested, 192 (18.25%) tested positive for either anti‐A or B while 860 (81.75%) tested negative. Donor age ranged from 16 to 84 years. The table below shows the data stratified by donor age. Using Fisher Exact, the prevalence of IgM anti‐A/B antibodies was statistically lower in males aged 50 and over.
| Donor Age | Number of Donors | Number positive for anti‐A, B or both (%) |
|---|---|---|
| 16‐29 | 139 | 42 (30.2) |
| 30‐39 | 165 | 36 (21.8) |
| 40‐49 | 212 | 51 (24.1) |
| 50 and above | 536 | 63 (11.8)* |
* p < 0.05
Conclusion: In this population of male O Rh(D) positive donors, 18.25% had anti‐A and/or anti‐B IgM titer levels of 1:256 or greater. The prevalence of antibody declined with age, reaching statistical significance in males over 50. This data can be used in planning for collections of whole blood units to maximize the likelihood of collecting units low in IgM anti‐A/B antibodies.
BBC20‐TU3‐22
Determination of Anti‐A and Anti‐B Titers in Group O Whole Blood Donors Using an Automated Instrument
Tzadok Moshe1, Liora Muncher1, Galit Rushkin1, Ronit Goldman‐Levi1, Mark H. Yazer2, Vered Yahalom1,3 and Eilat Shinar*1
1Magen David Adom National Blood Services, 2Department of Pathology, University of Pittsburgh, 3Blood Services & Apheresis, Rabin Medical Center
Background/Case Studies: There are biological and practical justifications for treating massively bleeding patients with low titer group O whole‐blood (LTOWB). This study was conducted to establish and validate a new protocol for titering anti‐A and B in group O donors using automated blood group typing equipment to create a LTOWB donors database.
Study Design/Method: The critical titer of anti‐A and B for LTOWB units was chosen as the equivalent of 1:50 determined by manual saline tube method with 5 minute room temperature incubation (reference method).
To find this titer on the automated PK7300 instrument (Beckman‐Coulter, USA) the equipment was programmed to dilute and test plasma from 660 donors: 20 samples for each 1:32, 1:25 and 1:20 and 300 samples for each 1:18 and 1:16 dilutions. Using the PK7300 titration protocol each plasma sample was automatically diluted and incubated at 25 ºC for 1 hour with in‐house produced reagent of A1B donors' red blood cells (RBC) and assayed for agglutination. Samples showing negative results on the PK7300 were diluted 1:50, tested with the same A1B RBC with 5 minute room temperature incubation, then manually inspected for agglutination. The results were used to determine which dilution, when performed on the PK7300, most closely correlated with the agglutination produced by the reference manual 1:50 dilution. Agglutination with A1B RBC of additional 200 samples diluted 1:18 was compared to commercial A1 and B cells (Immucor, USA). One hundred of these samples were also tested with a blend of commercial A1 and B cells and compared to the reference method.
Results/Finding: A plasma dilution of 1:18 on the PK7300 was found to be the most comparable to a dilution of 1:50 when performed by the reference saline tube method.
About 15% of 500 O samples diluted 1:18 and tested both on the PK7300 and the reference saline tube method at a 1:50 dilution did not demonstrate agglutination with the A1B RBC. These were therefore considered LTOWB donors.
All plasma samples from the low titer donors tested with A1B RBC did not agglutinate when incubated with a commercial mix of A1 and B cells. Moreover, 7% of these low titer samples gave false negative results when tested by the reference method.
Conclusion: Plasma dilution of 1:18 from group O donors tested on the PK7300 at 25 ºC with 1h incubation, can be used effectively and safely to identify LTOWB donors. A1B in‐house produced RBC seems to be more sensitive than commercial mix of A1 and B cells, permitting its use in situations when commercial reagent may not be available. Using automated blood typing methods enables medium and large size blood establishments to perform the titration as part of their routine blood typing and to establish a LTOWB donor data base. This can help maintain a consistent inventory and supply of LTOWB units for use in military or civilian pre‐hospital as well as in‐hospital settings.
BBC25‐TU3‐22
The Impact of Frequent Phlebotomy in a Testosterone Therapy Donor Population
Tracy Rauch*1, Jay Thomas2, Sallie Clark3, Hollis O'Neal3 and Danielle Tatum2
1Pathology Group of Louisiana, 2Our Lady of the Lake Regional Medical Center, 3LSU Health ‐ Baton Rouge
Background/Case Studies: Polycythemia, an increase in red blood cell mass, is a common side effect of testosterone replacement therapy (TRT) and is typically treated via frequent blood donation. In 2014, the FDA granted a hospital‐based blood bank variances which allow collection and distribution of RBCs from TRT donors without special labeling and donation by TRT recipients more frequently than every eight weeks. However, there are no established safety guidelines for when/how often therapeutic phlebotomy should occur. The present study aimed to describe a male donor population as a first step in examining the safety of frequent phlebotomy in men receiving hormone replacement therapy.
Study Design/Method: Adult males (≥18 years) who donated blood between 07/01/2014 ‐ 12/31/2015 were identified in the blood bank database and classified as TRT or non‐TRT donors. Polycythemia was defined as hemoglobin > 16.5 g/dL. Chi Square, Fisher's Exact test, and Mann Whitney U test were used to compare subgroups.
Results/Finding: During the study period, 17675 donation attempts were made, 1716 (9.7%) from TRT donors. TRT donors yielded 306 units of RBC in 2014 and 1385 in 2015. The majority (53%) of TRT donors received therapy via injection, while the remainder used unspecified methods. Most (77%) last received TRT less than 6 weeks prior to donation, which resulted in significantly higher HR, HGB, and donation frequency (P < 0.001 for all) compared to TRT donors who last received therapy greater than 6 weeks prior to donation.
Conclusion: Therapeutic phlebotomy of TRT donors has become a significant source of transfusable red blood cells while also offering potential benefit to the donor. Future studies are necessary to examine iron stores of TRT donors as well as dosing and routes of administration in order to better understand the risk‐benefit ratio of frequent blood donation in the context of testosterone therapy.
TABLE 1 (BBC25‐TU3‐22) Comparison of donor subgroups by characteristics and rates of deferral
| Donor characteristic | Non‐TRT (n = 15959) | TRT (n = 1716) | P value |
|---|---|---|---|
| Age at donation (years) | 38 (24 – 53) | 50.5 (43 – 59) | < 0.001 |
| Systolic blood pressure (SBP) (mmHg) | 133 (124 – 143) | 137 (128 – 147) | < 0.001 |
| Diastolic blood pressure (DBP) (mmHg) | 81 (75 – 88) | 83 (77 – 89) | < 0.001 |
| Hemoglobin (HGB) (g/dL) | 15 (14 – 15) | 16.7 (15 – 18) | < 0.001 |
| Heart rate (HR)(bpm) | 74 (66 – 83) | 78 (69 – 88) | < 0.001 |
| Donations per year | 1 (1 – 1) | 2 (1 – 4) | < 0.001 |
| Polycythemia, n (%) | 1401 (9) | 753 (44) | < 0.001 |
| Reason for Deferral | |||
| SBP | 0.5 (87) | 0.2 (3) | 0.116 |
| DBP | 1.3 (214) | 0.5 (9) | 0.015 |
| HR | 1.5 (238) | 0.6 (1) | 0.008 |
| HGB | 2.4 (384) | 0.2 (3) | < 0.001 |
| Total deferrals | 6.0 (961) | 1.5 (26) | < 0.001 |
* All Donor Characteristic variables are reported as median (IQR) unless otherwise denoted. All Reason for Deferral variables are reported as %, n.
BBC12‐TU3‐22
The Effect of Variable Collection Volume Blood Shakers on Vasovagal Reaction Rates
Samantha Ngamsuntikul*1, Randal Birkelbach1, Jack Campbell2 and Rachel Beddard1
1BioBridge Global, 2South Texas Blood and Tissue Center
Background/Case Studies: This blood center previously used a standard blood shaker for all whole blood collections. Towards the end of 2017, our center switched to a whole blood shaker that allows variable collection volumes based on the Nadler's formula (height, weight and gender) at all fixed site locations. This change was implemented in an effort to decrease vasovagal reactions.
Study Design/Method: Whole blood donor vasovagal reaction data was obtained from the blood establishment computer system. To eliminate seasonal variation in donor reactions, data from December, 2016 through April, 2017 was collected for the standard blood shaker and data from December, 2017 through April, 2018 was collected for the new blood shaker. Vasovagal donor reactions were stratified into mild (no loss of consciousness), moderate (loss of consciousness less than 1 minute) and severe (loss of consciousness for a minute or longer), with or without injury. Data on hematomas or infiltrations is not included in this study. Two sample, two tailed t‐test was used to statistically compare the groups.
Results/Finding: During December 2016‐April 2017 at fixed sites, there were 123 vasovagal reactions comprising 1.05% of 11739 whole blood collections using the standard blood shaker. During December 2017‐ April 2018 at fixed sites, there were 41 vasovagal reactions comprising 0.4% of 10248 whole blood collections using the variable collection volume blood shaker. The table below stratifies this data by donor weight and mild, moderate and severe categories of vasovagal reactions. The data show a trend towards lowering of all categories of vasovagal reactions in all donor weight groups with the decrease reaching statistical significance in the mild category for all weight groups.
(BBC12‐TU3‐22)
| Donor Weight (pounds) | Vasovagal Reaction Number and (% of Whole Blood Collections) | |||||
|---|---|---|---|---|---|---|
| Mild | Moderate | Severe | ||||
| Standard Shaker | Variable Collection Shaker | Standard Shaker | Variable Collection Shaker | Standard Shaker | Variable Collection Shaker | |
| 120‐150 | 34 (0.29) | 12 (0.12)* | 10 (0.09) | 6 (0.06) | 7 (0.06) | 5 (0.05) |
| 151‐200 | 35 (0.30) | 8 (0.09)* | 6 (0.05) | 1 (0.01) | 4 (0.03) | 2 (0.02) |
| >200 | 22 (0.19) | 1 (0.01)* | 2 (0.02) | 1 (0.01) | 3 (0.03) | 1 (0.01) |
* p < 0.05
Conclusion: Implementation of a blood shaker that uses Nadler's formula to collect variable blood volumes decreased mild, moderate and severe reactions at our blood center's fixed site locations. This decrease reached statistical significance in the mild category across all donor weight groups. This enhanced blood shaker will be implemented on mobile blood drives to further decrease vasovagal reactions.
BBC22‐TU3‐22
Armed Services Blood Program (ASBP) Screening for Low Titer O Whole Blood at the Point of Injury. Variation in Isohemagglutinin Titers in a Military Population
James Burke*, Melanie Sloan, Jason Corley and Audra Taylor
U.S. Army
Background/Case Studies: The use of Fresh Whole Blood (FWB) for resuscitation has been shown to decrease mortality and morbidity in the combat wounded. A blood type O donor with low isohemagglutinin titer levels is considered a universal whole blood donor due to the decreased likelihood of hemolytic reactions in transfused patients. The screening of potential donors before deployment to austere conditions assists in mitigating risk in identification of blood type, transfusion transmitted disease (TTD) as well as evaluation of the Anti‐A and Anti‐B isohemagglutinin titer. Because the U.S. Army's Special Operations Forces (SOF) have recurrent rotations into austere environments, SOF personnel may be screened several times over several years. The isohemagglutinin titers of repeat candidates for LTOWB donation were evaluated from 2015 to 2018.
Study Design/Method: Known group O donor IgM titer levels were determined by saline tube method, using two‐fold serial dilutions of donor plasma tested against A1 and B reagent cells. The ASBP designates a “low titer” group O donor as having an isohemagglutinin titer of <256 for both anti‐A and anti‐B. SOF Team Donors are entered into the DoD Operational Blood System of record. The results from one SOF operational unit, 10th Special Forces Group, was evaluated for repeat screenings of their group O donors. If a repeat screening was identified, any changes of Anti‐A or Anti‐B isohemagglutinin titer from low (<256) or high (≥256) was assessed.
Results/Finding: The 10th Special Forces Group, Fort Carson, Co; had 419 Soldiers screened from 1 May 2016 to 21 August 2017. Of the 419 Soldiers screened, 206 were O Positive (POS) and 39 were O Negative (NEG). Repeat assessments of 32 group O Soldiers was documented. Of these 32 group O Soldiers, 6 Soldiers were observed with a change in Anti‐A from high to low titer, and 1 Soldier's Anti‐A titer changed from low to high titer. Titer changes ranged from 4 fold to 8 fold dilutions. No change in Anti‐B was observed in this sampling.
Conclusion: The Screening of Group O Walking Blood Bank (WBB) donors informs the SOF medical teams in decisions regarding donor eligibility for providing LTOWB in far‐forward and austere environments. The limited data presented indicates a low frequency in titer changes when donors are screened on two separate occasions. For those donors with titer changes, the changes more often result in the donor status switching to low titer and being eligible for LTOWB donation. Further research is indicated to determine the significance and reproducibility of these results and conclusions.
Oral Abstract Session: Public Health & Policy, IT & Management
IT1‐TU3‐23
Creation of a Platelet Transfusion Refractoriness Web App for Use at the Point‐of‐Care
William J. Gordon*1,2,3, Samuel Aronson4, Maria Aguad1, Heather Appello1, Jane Baronas1, Indira Guleria1,3, Edgar Milford1,3, Melissa Yeung1,3, Richard M. Kaufman3,5 and William J. Lane3,5
1Brigham and Women's Hospital, 2Massachusetts General Hospital, 3Harvard Medical School, 4Partners HealthCare, 5Department of Pathology, Brigham and Women's Hospital
Background/Case Studies: Platelet transfusions are a cornerstone of therapy for patients who develop thrombocytopenia while undergoing hematopoietic stem cell transplantation (HSCT). Many of these patients demonstrate anti‐HLA alloantibody mediated platelet transfusion refractoriness (PTR) and require HLA‐matched platelets. The calculated panel reactive antibody (cPRA) is a useful tool for identifying patients at risk for PTR, but it requires manual intervention to calculate and so it is only calculated when requested. However, routine use of cPRA before every HSCT, using the existing pre‐HSCT alloantibody results, could identify PTR earlier and more efficiently manage its complex transfusion needs for improved patient care. To accomplish this goal, we created an electronic medical record (EMR) web app for use by clinicians, blood bank/donor center, and tissue typing lab to better identify and manage PTR patients.
Study Design/Method: An online cPRA web‐service was created to electronically receive alloantibody data and return cPRA values for several different ethnicities. Additionally, to increase flexibility, the cPRA web‐service calculation can be customized with user defined antigen frequencies and epitopes. To utilize the cPRA web‐service, a PTR web app was created with connections to several clinical data sources including: Tissue Typing Lab, Blood Bank, Donor Center, and EMR. The PTR web app was embedded into the EMR so that it could be easily viewed while caring for patients undergoing HSCT. Platelet utilization and transfusion effectiveness were compared before and after implementation.
Results/Finding: The cPRA web‐service allows for automated computer generated cPRAs, making it feasible to calculate up‐to‐date cPRAs for every HSCT patient. The web app displays platelet counts along with platelet transfusion events, platelet units in inventory, and has a section for the clinical care teams and lab staff to communicate. We plan on making the cPRA web‐service publicly available for others to use and customize.
Conclusion: We built a customizable cPRA web‐service and platelet transfusion visualization web app to provide better point‐of‐care access to real time cPRA values to enable PTR risk stratification of HSCT patients. The web app also summarizes all of the key clinical data to efficiently manage PRT and improve platelet usage.
MGT3‐TU3‐23
Platelet Availability and Economic Impact of Bacterial Risk Reduction Strategies at US Hospitals
Elan Weiner*, Meredith Lummer and Vera Chrebtow
Cerus Corporation, Deployment
Background/Case Studies: FDA has proposed methods for mitigating bacterial contamination risk in platelets (PC). The impact these methods will have on PC availability and cost must be evaluated. Herein we assessed the financial impact at hospitals associated with the purchase of PCs that have undergone either 8mL Bacterial Detection by culture (BD) with Point of Issue (POI) testing, 16mL delayed large volume culture per split unit (DLVC), 3.8% BD with and without secondary culture, or Pathogen Reduction (PR).
Study Design/Method: A model was built to assess production and economic impact of bacterial safety methods at a hospital, incorporating revenue assumptions for Medicare outpatients and private insurers. Blood Center selling price of BD ($460) or PR ($595) PC, and DLVC ($45) or 3.8% ($30) BD were added under applicable scenarios to determine cost. Additional upcharge for CMV‐ ($35), irradiation ($40) or both were applied based on hospital ordering practices. Secondary BD or POI testing costs were added for a proportion of PC reaching triggering day(s) of shelf life. Costs not considered in the model but discussed include transfusion associated sepsis and ongoing training. PC shelf‐life for each method was assessed.
Results/Finding: See table.
(MGT3‐TU3‐23)
| Method and shelf‐life | 8mL Culture & POI test on days 4‐7 | DLVC to day 7 | 3.8% to day 5 | 3.8% to day 5 & Secondary Culture day 3 to extend product to day 7 | Pathogen Reduction to day 5 |
|---|---|---|---|---|---|
| Doses/yr | 5,000 (3,800 conventional, 700 irradiated, 213 CMV‐tested, 288 irradiated & CMV‐tested) | ||||
| Acquisition Cost | $2,348,688 | $2,573,688 | $2,498,688 | $2,498,688 | $2,975,000 |
| 2nd Bacterial Culture cost | $115,713 | ||||
| POI Test cost | $245,969 | ||||
| Shelf‐life (days) | 7 | 7 | 5 | 7 | 5 |
| % Expire | 3 | 3 | 13 | 3 | 7 |
| Patients with Private Insurance | 37.8% Sensitivity Analysis (SA) + /‐20% | ||||
| Private Insurance Revenue | $1,350,350 | $1,479,711 | $1,436,590 | $1,436,590 | $1,710,441 |
| SA Range | $636,000 to $2,064,820 | $696,795 to $2,262,626 | $676,490 to $2,196,691 | $676,490 to $2,196,691 | $805,446 to $2,615,436 |
| Outpatient PC Transfusion to Medicare patients | 16% | ||||
| Medicare Revenue | $425,100 | $407,556 | $407,556 | $407,556 | $499,688 |
| Product expiry cost | $70,461 | $77,211 | $324,829 | $74,961 | $208,250 |
| Net | $(890,819) | $(763,631) | $(979,370) | $(845,214) | $(973,121) |
| SA Range | $(1,605,290) to $(176,348) | $(1,546,547) to $19,285 | $(1,739,471) to $(219,269) | $(1,605,315) to $(85,114) | $(1,878,116) to $(68,126) |
| Gain/Loss per dose (Total Revenue÷ PC purchased) | $(178) | $(153) | $(196) | $(169) | $(195) |
Conclusion: Modeling predicts a net cost delta of $43.00 per dose comparing least and most expensive methods (DLVC to day 7 and 3.8% BD to day 5). Hospital would recover ∼60 to 70% (30‐40% and 90‐100% at SA range) of PC acquisition costs via insurance reimbursement. Costs associated with sepsis must be further extrapolated, as well as savings due to additional safety provided by PR such as the mitigation of transfusion‐transmitted viruses, parasites and TA‐GVHD.
PHP1‐TU3‐23
Financial Impact of Secondary Bacterial Culture as a Risk Control Strategy for Platelet Transfusions
Seema Kacker*1, Evan M. Bloch2, Paul M. Ness3, Eric Gehrie3, Christi E. Marshall4, Parvez M. Lokhandwala2 and Aaron Tobian2
1Johns Hopkins University, 2Johns Hopkins University School of Medicine, 3Johns Hopkins Medical Institutions, 4The Johns Hopkins Hospital
Background/Case Studies: Bacterial contamination of platelets remains the leading infectious risk from blood transfusion. Secondary bacterial culture(SBC) has been proposed as a potentially low‐cost approach that could be implemented by blood centers or transfusion services. However, to date, there has not been a comprehensive economic evaluation comparing SBC to alternative risk reduction methods.
Study Design/Method: A Markov‐based decision‐tree was constructed to compare the costs of three bacterial risk control strategies: pathogen reduction(PR), point‐of‐release testing(PORt), and SBC. Monte Carlo simulations assessed the direct medical costs for platelet acquisition, testing, transfusion, and possible complications. Input parameters, including the sensitivity and specificity of each approach, were drawn from existing literature; costs were expressed in 2018 US$. The model assumed that leukoreduced apheresis platelets were provided to the hospital on day 3 following collection, and, in the base case analysis, expiration would occur at the end of day 5(PR and SBC) or day 7(PORt). The PR and PORt strategies were modeled on available FDA‐licensed technologies. Sensitivity analyses were conducted to evaluate the impact of variation in input parameters on projected estimates.
Results/Finding: The projected total costs to implement PR, PORt, and SBC are $819.98, $664.95 and $650.38 per unit, respectively. When compared to PR, SBC is associated with no significant difference in bacterially contaminated units transfused or in units disposed due to expiration, but would lead to a significant increase in units disposed due to positive test results. Compared to PORt, SBC is associated with an increase in units disposed due to expiration, but a decrease in contaminated units transfused. Probabilistic sensitivity analyses varying input parameters simultaneously yielded no substantial differences in these estimates.
Conclusion: SBC presents a potentially cost‐saving approach to mitigate risk of bacterially contaminated platelet transfusions, as compared to currently available alternatives. SBC is expected to result in fewer contaminated units being transfused than PORt, leading to reduced costs associated with complications. Approval of SBC for 7 day storage would further increase cost savings.
(PHP1‐TU3‐23)
| PR | PORt | SBC | Cost Savings from SBC (vs PR) | P‐value | Cost Savings from SBC (vs PORt) | P‐value | |
|---|---|---|---|---|---|---|---|
| Total Cost ($) | |||||||
| Mean | 819.98 | 664.95 | 650.38 | 169.60 | <.001 | 14.57 | <.001 |
| SD | 35.87 | 79.93 | 34.66 | ||||
| Cost from Acquisition ($) | |||||||
| Mean | 742.48 | 556.69 | 556.70 | 185.78 | <.001 | ‐0.01 | 0.74 |
| SD | 23.30 | 20.95 | 20.94 | ||||
| Cost from Testing ($) | |||||||
| Mean | 0.00 | 25.55 | 16.43 | ‐16.43 | <.001 | 9.12 | <.001 |
| SD | 0.00 | 21.99 | 1.73 | ||||
| Cost from Transfusion ($) | |||||||
| Mean | 77.51 | 82.49 | 77.26 | 0.25 | <.001 | 5.24 | <.001 |
| SD | 27.25 | 19.47 | 27.56 | ||||
| Cost from Complications ($) | |||||||
| Mean | 0.00 | 0.25 | 0.00 | 0.00 | 0.99 | 0.25 | 0.002 |
| SD | 0.00 | 80.07 | 0.00 | ||||
PHP2‐TU3‐23
Characteristics of HIV Infections, Including Genotypes and Drug Resistance Mutations, in Blood Donors in the US
Brian Custer*1, Eda Altan1, Roberta Bruhn1, Claire Quiner1, Eric Delwart1, Dylan Hampton1, Sonia Bakkour1, Mars Stone1, Rita A. Reik2, Whitney Steele3, Debra A. Kessler4, Phillip C. Williamson5, Steven Anderson6, Susan L. Stramer3 and Michael P. Busch1 for the Transfusion Transmissible Infections Monitoring System6
1Blood Systems Research Institute, 2OneBlood, Inc., 3American Red Cross, 4New York Blood Center, 5Creative Testing Solutions, 6US FDA, Center for Biologics Evaluation and Research
Background/Case Studies: The objectives of this study are to report the genotype and drug resistance patterns according to stage of HIV infection at the time of donation, and to assess if HIV subtype or drug resistance mutations (DRM) are associated with characteristics of donors.
Study Design/Method: Four large blood collection organizations provided plasma samples from confirmed HIV‐positive whole blood donations based on routine nucleic acid test (NAT) and serology screening between 9/1/2015 – 7/31/2017. HIV RNA and serology concordant‐positive samples were tested using the Sedia Biosciences LAg Avidity assay to differentiate between recent and long‐standing infection. Viral loads were quantitated using the Hologic HIV‐1 Aptima assay. Nested PCR was used to amplify a segment of HIV RNA pol gene including the protease (PR) and reverse transcriptase (RT) regions followed by bar‐code labelling and pooling of amplicons, next‐generation sequencing (NGS) and deconstruction of donor‐specific HIV sequences from the NGS reads. Sequences were analyzed to determine a) phylogenetic clade/subtype using the Los Alamos National Laboratory Sequence Database and b) DRM using the Stanford HIV Drug Resistance Database. Standard statistical tests were used to compare groups and p‐values < 0.05 were considered evidence of statistical significance.
Results/Finding: Of 123 samples 108 (88%) were amplified and genotyped, all were HIV group M; 4 were HIV NAT Yields (seronegative) and 119 were HIV concordant positive. Of all concordant samples, 29 (35%) were classified as recently‐acquired infection. The most common subtype was B (Table), a single subtype C and two circulating recombinant forms (CRFs) were identified. Non‐amplified samples had low viral loads. Twenty of 108 (19%) had evidence of DRM: 5 were PR mutations, and 15 were RT mutations. Of the RT mutations, 4 were nucleoside RT inhibitors and 13 were non‐nucleoside RT inhibitors, 12 (80%) were the common K103N mutation. Three donor infections had ≥2 RT mutations. Younger age was associated with recent infection. No demographic or donation factors were associated with genotype or DRM.
(PHP2‐TU3‐23)
| HIV Infection Classification | HIV Subtype | Total | Medial Viral Load in copies/mL (IQR*) | |||
|---|---|---|---|---|---|---|
| B n (%) | C n (%) | CRF20_BG n (%) | CRF1_cpx n (%) | |||
| NAT Yield | 4 (100) | 4 | 897,948 (75,146 – 10,000,000) | |||
| Recent (NAT and serology concordant) | 31 (100) | 31 | 20,019 (2,476 – 63,912) | |||
| Long‐Standing (NAT and serology concordant) | 70 (95.9) | 1 (1.4) | 1 (1.4) | 1 (1.4) | 73 | 23,015 (5,996 – 58,827) |
| Total Sequenced | 105 (97.2) | 1 (1) | 1 (1) | 1 (1) | 108 | |
* IQR – Interquartile Range
Conclusion: While donors are a selected subset of the general population, when compared to other published data (not shown), the HIV infections in donors who were not deferred before donation appear to be representative of all HIV infections in the US.
PHP3‐TU3‐23
Screening for Familial Hypercholesterolemia. Extending a Role for Blood Programs in Promoting Public Health
Merlyn H. Sayers*1, Stephen Eason1 and Amit Khera2
1Carter BloodCare, 2UT Southwestern Medical Center
Background/Case Studies: A number of blood programs have recognized the opportunity that blood donation provides to identify ostensibly healthy individuals who might be unaware of risks to their health. These programs have included, along with mandated serological testing, such assays as non‐fasting total cholesterol (TC) and hemoglobin A1c. They have also taken steps to notify individuals whose results suggest risk for cardiovascular disease or diabetes. Since our program has a long history of providing donors information about their TC, we decided to find out if some individuals with elevated TC met the criteria for familial hypercholesterolemia (FH). FH, which has a prevalence of 1 in 300 to 1 in 500 in the general population is a common, but frequently underdiagnosed, genetic disease. The disease is marked by severe elevation in cholesterol, evidence of coronary arterial disease at an early age and, when untreated, early death due to myocardial infarction. Screening is recommended by the National Lipid Association Expert Panel on FH.
Study Design/Method: We reviewed unlinked total non‐fasting cholesterol results from volunteers donating between 2015 and 2017. Cholesterols were measured on a chemistry analyzer system (Beckman Coulter AU680) on residual blood after routine testing for infectious disease markers. For volunteers donating more than once, we included only their highest TC recording. TC was classified by American Heart Association (AHA) 2020 Goal Metrics as elevated, if ≥200 mgm/dL (5.2 mmol/L) in donors ≥ 20 years of age and ≥170 (4.4 mmol/L) in donors < 20 years of age. We applied the United States Center for Disease Control Cooperative MEDPED diagnostic criteria for FH. Using these criteria, FH is diagnosed when TC exceeds 270 mgm/dL (7.0 mmol/L) in individuals less than 20, 290 mgm/dL (7.5 mmol/L) in individuals 20 to 29, 340 mgg/dL (8.8 mmol/L) in individuals 30 to 39, and 360 mgm/dL (9.3 mmol/L) in individuals 40 years of age and older.
Results/Finding: There were 327,824 unique donors during the study period. Both the overall prevalence of elevated cholesterol, 39.5% and the prevalence of FH 0.24%, (equivalent to 1:426) are similar to published data for the general population. As shown in the table, the prevalence of FH was highest in 20 to 29 year olds and decreased in older donors, while the prevalence of elevated TC increased with age.
TABLE (PHP3‐TU3‐23) Donors, by Age Group, Meeting Elevated and FH Cholesterol Criteria
| Age Groups (Years) | ||||
|---|---|---|---|---|
| <20 | 20‐29 | 30‐39 | ≥40 | |
| Total Numbers | 90,128 | 53,469 | 48,100 | 136,127 |
| Number (%) with elevated TC * | 29,930 (33.2) | 11,909 (22.3) | 18,235 (37.9) | 69,559 (51.1) |
| Number (%) with FH ** | 283 (0.31) | 205 (0.38) | 72 (0.15) | 209 (0.15) |
* Total cholesterol regarded as elevated by AHA 2020 Goal Metrics
** FH identified by MEDPED criteria
Conclusion: There is a subset of donors, at all ages, with elevated total cholesterol who can be identified as satisfying familial hypercholesterolemia criteria. This subset might benefit, along with their close family members, from history, examination and additional testing.
Poster
Abstract Authors' Poster Presentations
CBIB12
Effects of Extended Cold‐Storage on Platelet Function, Apoptosis and in vivo Characteristics in Healthy Human Subjects
Moritz Stolla*1,2, Lynda Fitzpatrick3, Shawn Bailey3, Esther Pellham3, Irena Gettinger3 and Todd Christoffel3
1BloodworksNW Research Institute, 2University of Washington School of Medicine, Department of Medicine, Division of Hematology, 3Bloodworks NW
Background/Case Studies: Cold‐stored platelets are currently under investigation for transfusion in actively bleeding patients. The three day storage limit of the FDA variance severely limits cold‐stored platelet availability for clinical applications, and far forward military scenarios. The effects of cold‐storage on platelet apoptosis have not been investigated thus far. We sought to test if apoptotic parameters and in vitro function correlate with in vivo recovery and circulatory lifespan.
Study Design/Method: Seventeen healthy human subjects underwent an apheresis platelet collection. The cold‐stored platelet (CSP) “test” unit was stored for either 5, 10, or 15 days in plasma at 4 ºC. Platelet samples for in vitro platelet tests were extracted on the day of donation and after the designated storage period. After storage, all units were radiolabeled and transfused into their respective donors. All donors came back after a week to provide a fresh sample for radiolabeling and reinfusion.
Results/Finding: Over storage time, platelet recoveries declined significantly compared with fresh (all p<0.006) and from 5 to 10 days (p=0.02) and 5 to 15 days (p=0.002). Platelet survivals decreased significantly from fresh to 5 days, 10 days, and 15 days (all p<0.0001). Intrinsic apoptotic events, measured by mitochondrial membrane integrity, decreased only non‐significantly over storage time. Similarly, apoptosis measured by activation of the effector caspases 3,7 increased non‐significantly from fresh to 15 days. Phosphatidyl serine exposure (measured by Annexin V binding) increased significantly from 5 to 10 days (p=0.03) and from 5 to 15 days (p=0.002). All other markers of platelet activation, specifically microparticles and P‐selectin increased significantly from 5 to 15 days (p=0.001, p=0.002 respectively). Of note, platelet response to collagen stimulation revealed functional inside‐out signaling with integrin activation comparable to (and non‐significantly different to) fresh platelets up to 15 days of storage. The best predictor for 10 day platelet recovery and survival was collagen‐stimulated integrin activation (r=0.88, p=0.048 and r=0.89, p=0.043 respectively).
Conclusion: We performed the first studies with extended storage cold (4 ºC)‐plasma‐stored apheresis platelets up to 15 days and a fresh comparator. We show that there is continuous loss of recovery up to 15 days of storage. Overall, continuous platelet activation is a hallmark of cold‐stored platelets, while markers for caspase activation and mitochondrial membrane integrity show a delay of apoptosis during cold‐storage. Platelet function tests show preserved integrin activation comparable to fresh up to 15 days of storage. The best predictor for 10 day platelet recovery and survival was collagen‐stimulated integrin activation. Taken together, storage up to 15 days in the cold appears to yield acceptable in vitro and in vivo results.
CBIB13
Pathogen Reduction of Platelet Rich Plasma Abrogates T Cell Alloresponse in Mice
Johnson Q. Tran* and Rachael P. Jackman
Blood Systems Research Institute
Background/Case Studies: Alloimmunization following platelet transfusion can lead to rejection of subsequent transfusions and transplants. Recipient T cells are key mediators of the alloimmune response, and can recognize allogeneic MHC via either direct binding on donor cells or indirectly when donor antigens are presented by recipient antigen presenting cells. Prior work has shown pathogen reduction with riboflavin and UV light (UV+R) of allogeneic platelet rich plasma (PRP) prevents alloimmunization in mice, and provide partial antigen‐specific tolerance to subsequent transfusions. in vitro work demonstrated the mechanism of UV+R treatment in preventing alloimmunization is associated with down‐regulation of donor cell surface adhesion molecules that prevents direct recognition by allogeneic T cells. However, the role of T cells may be more complex in vivo involving either indirect recognition, or weak direct signals. To better understand how UV+R treatment regulates alloimunization, this study provides a comprehensive evaluation of the T cell response to allogeneic PRP transfusion in mice.
Study Design/Method: White blood cell (WBC)‐rich PRP was isolated from donor BALB/c or C57Bl/6 mice, left untreated, or treated with UV+R and transfused into C57Bl/6 mice. To evaluate the impact on secondary exposure, some were given a second transfusion of untreated WBC‐rich PRP two weeks later. CD4 + and CD8 + T cell responses were measured in the spleen and blood of recipient mice over time by flow cytometry. T cell activation, deletion and anergy were examined.
Results/Finding: As expected, there was a significant upregulation of activation markers on T cells in the blood and spleen following transfusion with untreated allogeneic PRP. This included CD28, ICOS, and CD44, and peaked on day 7 (p < 0.0001). In contrast, mice that received a single UV+R transfusion showed no T cell response in blood or spleen although a small but significant enrichment of CD8 + CD28 + ICOS + T cells was observed in the blood on the seventh day after challenge (p < 0.002). Mice given UV+R PRP followed by untreated PRP displayed an early, but weaker and more transient response peaking around day 2 or 4 (p < 0.01). No evidence of deletion or anergy was observed in the CD4 + and CD8 + T cell compartment.
Conclusion: Allogeneic CD4 + and CD8 + T cell responses were significantly diminished after pathogen reduction with UV+R treatment. However, T cell allorecognition in vivo was not completely absent as a small but significant induction of activated CD8 + T cells was observed in the blood. The failure of a T cell alloresponse after UV+R treatment is not likely due to T cell deletion or anergy but possibly associated with active T cell tolerance or immune avoidance.
CBIB14
IL‐4 and STAT6 Drive RBC Alloimmunization
Anupam Prakash*1, Jelena Medved1, Juan Salazar1, Andria Li1 and Chance J. Luckey2
1University of Virginia, 2University of Virginia Medical Center
Background/Case Studies: Antibodies generated against non‐ABO red blood cell (RBC) antigens in response to transfusion are a major cause of morbidity and mortality in chronically transfused patients. Despite their clinical significance, the molecular mechanisms regulating the immune response to transfused RBCs remain poorly understood. Previous work in our lab (Arneja et al., 2016) demonstrated IL‐6 deficient mice mount a significantly lower antibody response to RBC antigens. However, alloantibody production still occurred in the absence of IL‐6, suggesting alternative pathways are capable of driving RBC alloimmunization. Since we observed an increase in Th2 skewing cytokines in response to transfusion in IL‐6 deficient mice, we hypothesized that the key Th2 cytokine IL‐4 and its downstream transcription factor STAT6 also drive RBC alloimmunization.
Study Design/Method: We used a previously established RBC alloimmunization mouse model containing a fusion protein of hen egg lysozyme (HEL), Ovalbumin and the human Duffy antigen (HOD) on all RBCs as a model for RBC alloimmunization. Wild type, IL‐4 deficient and STAT6 deficient mice were transfused with 12‐day stored HOD blood. Sera were collected from these mice at various time points (2, 3, 5 and 7 weeks post transfusion) and total anti‐HEL IgG titers were measured using ELISA.
Results/Finding: While wild type mice elicited a robust IgG response against HEL, the response of IL‐4 deficient mice was 5‐fold lower (p=0.0015) at 2 weeks post transfusion. Similarly, antibody responses in STAT6 deficient mice were 10‐fold lower (p=0.002) at 2 weeks post transfusion. Interestingly, at 7 weeks post transfusion IgG titers of STAT6 deficient mice was 40‐fold lower (P = 0.025) compared to that of the wild type, demonstrating it also plays a role in antibody evanescence. All statistics were done using Student's t test using Holm‐Sidak correction
Conclusion: Ours is the first data to suggest a role of IL‐4 and STAT6 in RBC alloimmunization. Ongoing studies in the lab are focused on uncovering the specific cell types on which IL‐4 and STAT6 are active in response to transfused RBCs, and further how these pathways interact with the IL‐6R pathway in controlling RBC alloimmunization.
CBIB15
Omega‐3 Fatty Acids Affect Red Blood Cell Deformability, Lifespan, and Recovery
Tiffany A. Thomas*1, Angelo D'Alessandro2, Xiaoyun Fu3, Richard O. Francis1, James C. Zimring3, Steven L. Spitalnik1, Camille Roussel4, Pierre Buffet4, Pascal Amireault5 and Eldad A. Hod1
1Columbia University Medical Center, 2University of Colorado Denver, 3BloodworksNW Research Institute, 4INSERM UMR‐S 1134, Institut National de la Transfusion Sanguine, 5INSERM U1163, Institut Imagine and Institut National de la Transfusion Sanguine
Background/Case Studies: The omega‐3 polyunsaturated fatty acids (PUFAs), eicosapentaenoic acid (EPA) and docosahexaenoic acid (DHA), are important for membrane fluidity and cellular signaling. Dietary supplementation with EPA and DHA is associated with improved red blood cell (RBC) deformability, hydration, and membrane fluidity, along with reduced irreversible sickling and pain episodes in patients with sickle cell disease. However, PUFAs are not completely benign. They are highly susceptible to peroxidation in oxidative environments, potentially damaging RBC structure during aging or cold storage. Therefore, it is important to evaluate whether diets enriched in PUFAs affect RBC lifespan and post‐transfusion recovery (PTR).
Study Design/Method: Mice from strains known to have good (C57BL/6) and poor (FVB) refrigerated RBC storage were fed a diet enriched in safflower or fish oil (n=15 mice/group) for 8 weeks. RBCs were biotinylated in vivo and lifespan measured by tracking biotinylated RBCs for 14 days. Leukoreduced blood was also prepared, and RBC deformability (LORCA and microsphiltration) and PTR were evaluated before and after 8 days of refrigerator storage. Metabolomics studies on fresh and stored blood were performed.
Results/Finding: The RBC lifespan in C57BL/6 and FVB mice on a safflower diet was significantly greater than in the same strain on a fish oil diet (C57BL/6: 48.7d to 34.1d; FVB: 39.2d to 25.6d; both P<0.001). On the safflower oil diet, baseline RBC deformability was significantly higher in C57BL/6 as compared to FVB mice. Furthermore, RBC deformability was significantly decreased for both strains on the fish oil diet. When RBCs were transfused after 8‐days of storage, PTR was significantly lower in the fish oil group for both strains (C57BL/6: 119% to 76%; FVB: 60% to 46%; P<0.0001 and P<0.05, respectively). There was also a strong correlation between PTR and deformability by LORCA (R2=0.9979) and microsphiltration (R2=0.9637). Metabolomics studies of plasma and RBCs revealed markedly lower levels of free and esterified carnitine in the fish oil group both before and after storage.
Conclusion: These data suggest that diets containing very high levels of DHA and EPA from fish oil (30% kcal) are associated with decreased membrane deformability, in vivo lifespan, and PTR after cold storage. Carnitine modulates RBC fluidity due to its role in phospholipid repair, stabilization of spectrin‐actin complexes, and sodium/potassium ATPase activity. The strong correlation between decreased carnitine levels, deformability, RBC lifespan, and PTR suggests potential mechanisms underlying these effects and identifies possible interventions for improving RBC quality.
CBIB16
Optimized Generation of Megakaryocytes from CD34 + Cells Promoting Platelet Production
Christian G. Peters*, Eleanor J. Agosta, Amy S. Ko, Dora E. Kohnke, Jorge Valdez, Lehmann Marcus, Lea M. Beaulieu and Jonathan N. Thon
Platelet Biogenesis
Background/Case Studies: Understanding megakaryocyte (MK) biology is critical to understanding and treating diseases that affect platelet production and function. However, procuring adequate numbers of this rare myeloid population remains rate‐limiting. Most in vitro studies rely on MKs differentiated from hematopoietic stem cells (HSCs), but there remains a lack of consensus on the optimal methods. Here, we present an optimized protocol for generating mature MKs from peripheral blood (PB) CD34 + cells with increased platelet production.
Study Design/Method: We assessed the features and function of our MKs differentiated through our two‐phase culture system using a set of “gold standard” metrics including morphology/ultrastructure (bright field and electron microscopy [EM]); cell surface marker expression, ploidy, and cell size (flow cytometry); cytoskeletal organization and granule content (confocal microscopy); and protein content (Luminex assay). We also quantified their release in static culture and bioreactor settings and characterized the resulting platelets at rest and upon activation.
Results/Finding: Consistent with megakaryopoiesis, CD34‐expression decreased and CD41/CD61‐expressing cells increased over the course of differentiation. Size (14.2 ± 3.4 μm) and ploidy (58.5 ± 23% ≤ 4N) of differentiated cells were consistent with values for MKs from cord blood‐derived MKs. MKs contained F‐actin and β1‐tubulin cytoskeletal elements characteristic of mature MKs, as well as markers of alpha‐granules (VWF, PF4) and dense granules (thrombospondin, serotonin). Differentiated cells expressed growth factors (including EGF, VEGF, and PDGF) at levels similar to those found in human platelet lysate. Additionally, differentiated MKs produced proplatelets and functional platelets by day 7 in static culture, with a 3.5‐fold increase in adult‐like platelets produced using a novel bioreactor.
Conclusion: Our differentiation protocol rapidly and consistently generates mature MKs from PB CD34 + HSCs. Despite resembling cord blood MKs in size and ploidy, these cells produce larger numbers of proplatelets than have been previously reported by as early as day 7 of differentiation. Additionally, differentiated MKs are suitable for seeding in a novel bioreactor to generate a large number of platelets for basic or translational studies.
CBIB17
Hemin Impairs Resolution of Inflammation Via MicroRNA‐144‐3p‐Dependent Downregulation of Formyl Peptide Receptor 2
Guixiang Sun*, Yao Lu, Wenjun Xia, Han Zhang, Linfeng Wang, Linjing Zhang and Aiqing Wen
Department of Blood Transfusion, Research Institute of Surgery, Daping Hospital, Third Military Medical University
Background/Case Studies: The pathomechanisms of complications due to blood transfusion are not fully understood. Elevated levels of heme derived from stored RBCs are thought to be associated with transfusion reactions, especially inflammatory responses. Recently, the proinflammatory effect of heme has been widely studied. However, it is still unknown whether heme can influence the resolution of inflammation, a key step of inflammatory response, resulting in aggravation of inflammation.
Study Design/Method: A murine model of self‐limited peritonitis initiated by zymosan A was used. The effect of hemin on resolution was assessed by resolution indices. Western blot, qRT‐PCR, flow cytometry, chemotaxis assay, enzyme‐linked immunosorbent assay, luciferase reporter assay, and lentivirus infections were used to investigate possible mediating mechanisms in neutrophils and differentiated HL‐60 cells.
Results/Finding: The administration of hemin significantly increased the leukocyte infiltration at the entire time course (4 ‐ 48 h), enhanced the expression of TNF‐α and IL‐6 in peritoneal lavages and murine serum, and prolonged the resolution interval by ∼ 7 h in mouse peritonitis. In vitro, hemin significantly downregulated formyl peptide receptor 2 (FPR2) protein levels (P < 0.05), a key resolution receptor, leading to the suppression of proresolution responses triggered by the proresolution ligand resolvin D1. Subsequently, four predicted miRNAs (miR‐543, miR‐144‐3p, miR‐181b‐3p, and miR‐410‐3p), most likely binding to FPR2 3'‐UTR, were identified by two prediction databases. Among these, miR‐144‐3p was significantly upregulated by hemin (P < 0.05). The inhibition of miR‐144‐3p attenuated the inhibitory effect of hemin on FPR2 protein expression (P < 0.05). Luciferase reporter assay confirmed that miR‐144‐3p directly bound FPR2 3'‐UTR. MiR‐144‐3p overexpression significantly downregulated FPR2 protein levels, whereas miR‐144‐3p inhibition led to a significant increase in FPR2 (P < 0.05).
Conclusion: Our results suggest that hemin prolongs resolution in self‐limited inflammation, and this action is associated with downregulation of FPR2 mediated by hemin‐induced miR‐144‐3p. These findings demonstrate a novel mechanism of hemin derived from stored RBCs for inflammatory response.
CBIB18
Cold Storage of Platelets in T‐PAS+ for 18 Days Is Safe and Functionally Comparable to Current Standards of Care
Kristin Reddoch‐Cardenas*1, Umang Sharma1, Christi Salgado1, Robbie K. Montgomery2, Carolina Cantu1, Heather Pidcoke3 and Andrew P. Cap1
1U.S. Army Institute of Surgical Research, 2Texas A&M College of Medicine, 3Cellphire
Background/Case Studies: Minimizing the amount of fibrinogen present during long‐term cold storage (1°‐6°C; 4C) of platelets [PLTs] through use of a PLT additive solution (PAS) has been shown to decrease activation and presumably increase PLT shelf life. One such PAS, T‐PAS + (Terumo BCT; Lakewood, CO), has not yet been evaluated by the U.S. FDA. As a result, we conducted a randomized, paired study to assess the in vitro quality of PLTs stored in the cold in 65% T‐PAS+/35% plasma without agitation for up to 18 days evaluated against the current standards of care for bleeding patients (i.e. PLTs stored in 100% plasma at either room temperature (RT; 20°‐24°C) for 5 days or in the cold for 3 days).
Study Design/Method: Single unit apheresis platelets [AP] were collected from donors (n=10) and diluted to 65% T‐PAS+/35% plasma prior to cold storage. Double‐dose AP were also collected from the same donors and split into 2 bags to serve as controls [CTLs]—one bag RT‐CTL, one bag 4C‐CTL. All bags were sampled on the day of collection (Day 0). 4C‐CTL and RT‐CTL bags were sampled on Day 3 and 5, respectively. T‐PAS + samples were assessed on Days 3, 5, 14, 16, and 18. Assays included: (a) PLT metabolism; (b) PLT count; (c) aggregation response; (d) clot strength (ROTEM); (e) extent of shape change & hypotonic shock response; and (f) activation (PLTs and microparticles). Data were reported as means±SEM and analyzed using repeated measures ANOVA with post‐hoc Tukey test and student's t‐tests for pairwise comparisons.
Results/Finding: After 18 days of storage in T‐PAS+: (a) pH was 6.71±.04, a significant drop in glucose levels and concomitant rise in lactate was observed; (b) PLT count was comparable to that of Day 3 4C‐CTL (T‐PAS + Day 18: 958 ± 56 platelets/μL; Day 3 4C‐CTL: 792 ± 137 platelets/μL); (c) aggregation response was comparable to Day 5 RT‐CTL; (d) clot strength was significantly lower than both Day 5 RT‐CTL and Day 3 4C‐CTL, but fibrinolysis was not observed in contrast to Day 5 RT‐CTL; (e) extent of shape change and hypotonic shock response was significantly lower in cold‐stored samples (T‐PAS + and Day 3 4C‐CTL) compared to Day 5 RT‐CTL; (f) activation significantly increased, glycoprotein expression was preserved, some mitochondrial depolarization was exhibited, and microparticle expression was similar to that of Day 5 RT‐CTL.
Conclusion: Refrigerated PLTs stored in T‐PAS + for 18 days met the pH requirement for FDA approval, suggesting safety of this method of storage. Functional and activation metrics also demonstrate viability of T‐PAS + stored PLTs. Future work is needed to validate these findings in vivo. Extending the shelf life of PLTs, 2‐3 times that of the current standards of care, would be an invaluable asset to improving trauma care on the battlefield.
CBIB19
Sodium Citrate Contributes to the Platelet Storage Lesion
Todd Getz*, Annette Turgeon and Stephen Wagner
American Red Cross Holland Laboratory
Background/Case Studies: Sodium Citrate has become the preferred anticoagulant used with apheresis collection platforms and has been included in platelet additive solutions since PAS‐II. It was suggested that sodium citrate be included in PAS to prevent spontaneous aggregation. Research in cancer cell lines has demonstrate that concentrations of sodium citrate present in current PAS formulations (10mM) causes apoptosis. In light of these data we evaluated whether the removal of sodium citrate from PAS‐III could have a positive impact on platelet storage.
Study Design/Method: Hyper concentrated apheresis platelet units ∼4.0 × 10¹¹ were collected on the Amicus from a normal, consenting donor. PAS‐III without sodium citrate was added to ∼100 mL of hyper concentrated platelets to achieve a 35% platelet/plasma to 65% PAS ratio and rested for 1hr. The unit was then split into 4 polyolefin bags which were sealed in half. 60mL was added to each bag and increasing concentrations of sodium citrate were added to obtain a final concentration of 0, 2, 5, and 10mM. Platelet quality and function were assessed on Days 1, 5, and 7. Platelet count, pH, glucose, lactate, and blood gases were measured and quantitated. Surface markers were evaluated by flow cytometry which included CD62P, CD42b, Annexin V binding, and reactive oxygen species were measured using CM‐H2DCFDA (n=4). Platelet function was assessed with aggregometry to collagen and TRAP6.
Results/Finding: Platelet count and pH were acceptable and comparable throughout 7 days of storage regardless of PAS‐III condition. Platelets stored for 5 days in PAS‐III without sodium citrate(Cit) had significantly increased glucose levels (0mM Cit 2.75 ± 0.38 mM, 10mM Cit 0.48 ± 0.33 mM), and significantly decreased lactate levels (0mM Cit 9 ± 0.8 mM, 10mM Cit 12.35 ± 1.4 mM), ROS levels (0mM Cit 29 ± 5 mM, 10mM Cit 127 ± 53 mM), Annexin V positivity (0mM Cit 8.8 ± 2%, 10mM Cit 20 ± 4%), and P‐selectin expression (0mM Cit 50 ± 4%, 10mM Cit 66 ± 3%) compared to those stored in 10mM citrate (p≤0.05) (n=4). There was a trend toward better preservation of GPIb on the surface of platelets stored without sodium citrate. Platelets stored without citrate also showed a trend towards a greater extent of aggregation compared to those containing 10mM citrate (Collagen % aggregation 0mM Cit 89 ± 2, 10mM Cit 54 ± 18; TRAP % aggregation 0mM Cit 90 ± 8, 10mM Cit 64 ± 18).
Conclusion: Removal of sodium citrate from PAS‐III did not result in spontaneous platelet aggregation or clotting which could lead to decreased platelet counts during 7 days of storage. The absence of sodium citrate improved nearly all measured parameters. We demonstrate that sodium citrate has a contribution to the platelet storage lesion and its removal results in improved cell quality and function.
CBIB20
The Role of Major and Minor Antigens in the Alloresponse to Pathogen Reduced Platelet Rich Plasma
Rachael P. Jackman*1,2, Johnson Q. Tran1, Marcus O. Muench1 and John W. Heitman1
1Blood Systems Research Institute, 2University of California
Background/Case Studies: Alloimmunization is common following transfusion with platelet rich plasma (PRP) and can cause complications such as platelet refractoriness or transplant rejection. It has previously been shown that pathogen reduction of PRP with riboflavin and UV light (UV+R) can protect against alloimmunization in mice and induce partial tolerance to subsequent transfusions. This study evaluated the relative contributions of major histocompatibility antigens (MHC) and minor antigens to both the alloresponse to PRP transfusion and the tolerance induced by UV+R treatment.
Study Design/Method: C57Bl/6 mice were transfused with PRP from C57Bl/6 (syngeneic), BALB/c (allogeneic MHC and minor antigens), B6 H2d (allogeneic MHC only), UV+R B6 H2d, or UV+R B6 H2d followed by untreated B6 H2d 2 weeks later. BALB/c mice were transfused with PRP from C57Bl/6 (allogeneic MHC and minor antigens), B6 H2d (allogeneic minor antigens only), UV+R B6 H2d, or UV+R B6 H2d followed by untreated B6 H2d 2 weeks later. Two weeks after final transfusion, blood was screened for antibodies against the different donor type cells, and splenocytes were challenged ex vivo with the different donor type cells, and culture cytokines were measured to evaluate priming in vivo. Groups were compared using ANOVA with Tukey's post‐test.
Results/Finding: Both total and MHC specific antibody responses were highest when both MHC and minor antigens were mismatched, with lower antibody responses observed with MHC mismatch alone (p<0.05). There was a weak, but significant (p<0.01) alloantibody response to minor antigens only. UV+R treatment protected against both major and minor antigen alloimmunization. Both allogeneic MHC and minor antigens primed an enhanced cytokine response ex vivo, though this was weaker with minor antigens, and responses were blocked with UV+R treatment. Reduced cytokine responses were observed in the C57Bl/6 mice given UV+R treated B6 H2d PRP followed by untreated B6 H2d PRP (allogeneic MHC only), but not in the BALB/c mice given UV+R treated B6 H2d PRP followed by untreated B6 H2d PRP (allogeneic minor antigens only).
Conclusion: Allogeneic MHC is sufficient to drive alloantibody production in our model and is responsible for the bulk of the alloantibody response. Minor alloantigens induce a small antibody response against themselves, and also enhance the anti‐MHC response. While minor alloantigens can induce a weak cytokine response, allogeneic MHC is necessary and sufficient to induce tolerance using pathogen reduction technology.
CBIB21
Transfused Mice Efficiently Generate Germinal Centers, but Produce Poor Plasma Cells
Jelena Medved*1 and Chance J. Luckey2
1University of Virginia, 2University of Virginia Medical Center
Background/Case Studies: A well‐described complication of transfusion is non‐ABO red blood cell (RBC) alloimmunization. Despite the universal pre‐screening for alloantibodies in patients, transfusion complications are still a relatively common occurrence with delayed hemolytic transfusion reactions remaining the third leading cause of all transfusion‐related fatalities in the USA. A major cause of morbidity and mortality is the remarkably high rate of evanescence in patients, with over 50% of all alloantibodies dropping below the level of detection within a year of their initial production. Molecular and cellular controllers of the high rate of anti‐RBC evanescence are completely unknown. Herein we study anti‐RBC alloantibody evanescence in an experimentally tractable mouse model of alloimmunization, contrasting the antibody response to transfused RBCs with those generated in response to standard vaccination.
Study Design/Method: Wild type mice were transfused with 14‐day stored mouse RBCs expressing the HOD (hen egg lysozyme, ovalbumin, and human Duffyb) antigen or vaccinated with NP‐OVA precipitated with aluminum hydroxide. Antigen‐specific total IgG was measured on sera collected 2, 7, and 13 weeks post‐immunization by ELISA. The presence of antigen‐specific short‐ and long‐lived plasma cells (SLPCs and LLPCs) was examined by ELISPOT 10 days and 13 weeks after immunization. Germinal center (GC) differentiation, assessed by the percentage of CD19+CD4‐CD8‐IgDloPNAhiGL7hi GC B and CD4+CD8‐CD19‐CD44hiCxcr5hiPD1hi T follicular helper (Tfh) cells, was examined by flow cytometry 10 days after immunization.
Results/Finding: Antigen‐specific antibodies were more evanescent in transfused mice compared to those that were vaccinated. Anti‐RBC alloantibodies decreased by 64% at week 13 after transfusion, while anti‐NP antibodies decreased by 37% (p < 0.0001). Both vaccinated and transfused mice generated similar GC B (5.11% and 3.82%, respectively, p > 0.5) and Tfh cells (5.73% and 6.24%, p > 0.5). While vaccinated mice efficiently produced SLPCs (5142 splenic SLPCs per 20 million seeded), SLPC production in transfused mice (38 SLPCs, p < 0.001) was comparable to unimmunized controls (15 SLPCs, p > 0.5). A significant difference was also found in the number of LLPC in bone marrows of vaccinated and transfused mice 13 weeks after immunization (725 and 185 LLPCs, respectively, p < 0.001).
Conclusion: This study indicates that the HOD mouse model of blood transfusion recapitulates the high rates of alloantibody evanescence seen in patients. Furthermore, higher rate of anti‐RBC evanescence is likely due to decreased generation of both SLPCs and LLPCs relative to vaccination. Given that transfusion and vaccination generate similar early GC production, transfusion may induce a selective defect in extra‐follicular plasma cell production.
CBIB22
Human Mesenchymal Stromal Cells Have a Therapeutic Window for Immunosuppression in the Mixed Lymphocyte Reaction Assay
Maryanne C. Herzig*, Barbara A. Christy, Carolina Cantu, James A. Bynum and Andrew P. Cap
U.S. Army Institute of Surgical Research
Background/Case Studies: Mesenchymal stromal cells (MSCs) show promise as a cellular therapeutic for the treatment of trauma, ARDS, and in regenerative medicine. Anti‐inflammatory and immune modulatory effects are likely to be important, and MSCs are typically tested for immunomodulation in a mixed lymphocyte response (MLR) assay. MSCs are known to block the ability of peripheral blood mononuclear cells (PBMCs) to respond to a proliferation stimulus. Using CFSE‐labeled PBMCS, the proliferation assay typically is 96 h duration. This study asks whether MSCs can interrupt the PBMC proliferation when added at any time within the 96h assay.
Study Design/Method: Human peripheral blood mononuclear cells (PBMCs) were isolated from de‐identified human whole blood collected by the ISR Research Blood Bank from 8‐10 donors under an approved standard operating procedure, pooled and frozen for later use. PBMCs were labeled with carboxyfluorescein by standard methods and used in a 96 well plate assay at 150,000 per well. Human bone marrow MSCs were obtained from a commercial source and used at early passage and were used at 20,000 and 60,000 cells per well. Phytohaemagglutin A was used as a proliferation stimulus at 5 µg/ml. Co‐culture of PBMCs with PHA and MSCs were initiated immediately, or at 4, 24, 48 and 72h after initial PHA stimulus. Populations of CFSE‐PBMCs were analyzed by flow cytometry of the CD3(+), live PBMC population. Data is average of duplicate experiments ± range.
Results/Finding: Preliminary results examined two separate BM‐MSC preparations from different donors. One hBM‐MSC showed complete suppression of PBMC proliferation when added at 96 hr (at a high dose of 2.5:1 of CFSE‐PBMCs to hBM‐MSCs). Addition at 4h and 24h after PBMC stimulation resulted in 73% ± 8.0% and 35% ± 1.2% suppression, respectively. By 48h, no suppression was seen. At a mid‐dose range (7.5:1), 43% ± 11.8% suppression was seen when added at 4 h, no suppression was seen when added at 24 h or later. A second hBM‐MSC preparation retained 17% suppression when added 48h or midway through the proliferation assay; no suppression was seen at 72 h addition.
Conclusion: This study suggests that both dosing and timing of MSC administration are critical for immunomodulatory activity. Addition of MSCs 24h after the PBMC proliferative program was initiated was approximately 50% as effective in suppressing proliferation as immediate or early (within 4 h) administration. This result is similar to the clinical experience in aGVHD patients wherein MSCS must be given early to be effective, before GVHD symptoms are too established. This data also suggests that different MSC preparations might be distinguishable by their time course of effectiveness for immune modulation.
CBIB23
Separating Therapeutic Activity from Adverse Events – Monoclonal Anti‐RBC Antibodies in a Murine Model of Immune Thrombocytopenia
Ramsha Khan*1,2 and Alan Lazarus3
1Department of Laboratory Medicine and Pathobiology, University of Toronto, 2Keenan Research Centre, St. Michael's Hospital, 3The Canadian Blood Services Centre for Innovation
Background/Case Studies: Immune thrombocytopenia (ITP) is an autoimmune disorder characterized by low platelet counts and an increased risk of bleeding. In most patients the formation of pathogenic antiplatelet antibodies likely causes accelerated platelet destruction and decreased platelet production. Anti‐D (RhIg) is an effective first‐line treatment for ITP but as a pooled donor‐derived product, it comes with certain limitations. In addition, anti‐D also carries an FDA‐issued Black Box warning of serious complications that may occur in patients with ITP. To address if some of the potential side effects of anti‐RBC antibodies can be separated from therapeutic activity, a murine model of passive ITP was utilized with two different anti‐RBC antibodies. Two major adverse events were evaluated: 1) Anemia, as defined by a significant decrease in the RBC counts in the mice and 2) Inflammatory activity, as defined by a significant change in core body temperature.
Study Design/Method: The monoclonal antibodies TER‐119 and M1/69 recognizing different murine erythrocyte antigens were evaluated for their ability to ameliorate ITP in two well characterized inbred mouse strains (C57BL/6 and BALB/c) and the outbred CD‐1 strain of mice. Erythrocyte numbers were evaluated over 8 days and compared to baseline counts from day 0. The body temperatures of the mice were measured rectally for 30 minutes post anti‐RBC antibody injection.
Results/Finding: Both TER‐119 and M1/69 were able to ameliorate ITP in C57BL/6, BALB/c and CD‐1 mice. TER‐119 caused significant anemia (with a nadir at day 4) in all three mouse strains while M1/69 caused anemia only in C57BL/6 and BALB/c mice. Dramatic reductions in the core body temperature were seen post TER‐119 and M1/69 injections in CD‐1 and BALB/c mice but no significant change in temperature was observed for C57BL/6 mice with either antibody.
Conclusion: Both TER‐119 and M1/69 were able to ameliorate ITP in all three strains of mice but anemia was only observed in C57Bl/6 and BALB/c mice. We therefore conclude that anemia is not strictly required for ITP amelioration by anti‐RBC antibodies in murine passive ITP. In addition, a change in body temperature (a major adverse event in mice) was observed for CD‐1 and BALB/c mice but not C57BL/6 mice. We therefore also conclude that this inflammatory activity as assessed by body temperature is not required for ITP amelioration in murine passive ITP. Based on these conclusions, it may be possible to develop a monoclonal anti‐RBC antibody that ameliorates ITP without causing these severe adverse events.
CBIB24
Plasmin‐Mediated Proteolysis of Human Factor IXa in the Presence of Calcium and Phospholipid: Conversion of Procoagulant Factor IXa to a Fibrinolytic Enhancer
Amy E. Schmidt*1, Kanagasabai Vadivel2 and S. Paul Bajaj2
1University of Rochester, 2UCLA
Background/Case Studies: During coagulation, factor (F) IX is activated by FXIa/Ca2+ and FVIIa/Ca2+/phospholipid (PL)‐associated tissue factor. The resultant two‐chain FIXab converts FX to FXa in the coagulation cascade. We sought to explore the underlying coagulation biochemistry in trauma patients presenting with increased fibrinolysis as measured on thromboelastography (TEG).
Study Design/Method: We performed a series of in vitro biochemical experiments using recombinant coagulation proteins.
Results/Finding: Plasmin in the presence of Ca2+/PL specifically cleaved Lys316↓Gly317 peptide bond (c148↓c149 in chymotrypsin numbering) in the protease domain autolysis loop of FIXab to yield FIXag. FIXag migrated indistinguishably from FIXab in a nondenaturing gel system indicating that C‐terminal residues 317‐415 of the heavy chain remain noncovalently associated with FIXag. However, as compared to FIXab, FIXag was ∼10‐fold impaired in synthetic substrate CBS 31.39 (CH3‐SO2‐D‐Leu‐Gly‐Arg‐pNA) hydrolysis. FIXag was ∼30‐fold (∼5‐fold higher K m, ∼6‐fold lower k cat) less effective in activating FX in a system containing only Ca2+/PL. Importantly, in the presence of FVIIIa, FIXag was ∼650‐fold less effective in activating FX. Consistent with these data, FIXag bound FVIIIa with ∼60‐fold reduced affinity as compared to FIXab. Moreover, Diisopropylfluorophosphate‐inhibited plasmin (DIP‐plasmin) bound FIXag (Kd ∼1.3 mM) but not FIXab and this interaction was prevented by e‐aminocaproic acid. Treatment of FIXag with carboxypeptidase B also abrogated this interaction, indicating that DIP‐plasmin binds to FIXag through its newly generated C‐terminal Lys316 (c148). Further, FIXag enhanced tissue plasminogen activator‐mediated activation of plasminogen ∼30‐fold.
Conclusion: Plasmin cleavage of FIXab at Lys316↓Gly317 peptide bond (c148↓c149) appears to play a role in inactivating FIXa and enhancing fibrinolysis similar to that described for FXa. The conversion of procoagulant enzymes to fibrinolytic cofactors such as we describe here for FIXa, likely provide the underlying biochemical etiology of increased fibrinolysis seen in trauma patients as evidenced by increased Lys30 percentages in TEG tracings.
CBIB25
Hemostatic Functional Preservation of Refrigerated Whole Blood over 35 Days
Michael A. Meledeo*, Grantham C. Peltier, Colby S. McIntosh, James A. Bynum and Andrew P. Cap
U.S. Army Institute of Surgical Research
Background/Case Studies: The transition from fresh whole blood (WB) to component therapy in transfusion practice developed from efforts to ease the burden of maintaining fresh WB availability while improving safety. Components can be stored under different conditions, improving individual component quality and transfusion logistics. However, studies have shown that treating traumatic hemorrhage with blood components leads to delivery of a more dilute and less functional product than transfusion of WB. For both WB and blood components, waste remains a challenge. This study examined the hemostatic function of refrigerated WB stored in anticoagulants CPDA‐1 and CPD to 35 days.
Study Design/Method: Single WB units were collected in CPDA‐1 (n=10) and CPD (n=7) from healthy donors, stored at 4°C, and sampled on test days. WB hemostatic function was measured by ROTEM in EXTEM (tissue factor [TF] pathway), INTEM (contact pathway), and FIBTEM (fibrinogen function) tests. Thrombin (FIIa) generation was measured using thrombogram with 4 µM phospholipid and 1 pM TF in derivative plasma and 1 pM TF alone in derivative platelet‐rich plasma (PRP). Platelet function was measured by impedance aggregometry with multiple agonists (ASPI, ADP, collagen, ristocetin, and TRAP). Platelet adhesion to collagen was observed in a BioFlux 1000 microfluidics device under arterial (920 s‐1) and pathological (4000 s‐1) shear conditions by fluorescently labeling platelets (calcein AM) and quantifying intensity/coverage area.
Results/Finding: Few significant differences were observed between CPD and CPDA‐1. Hemoglobin/hematocrit remained constant over 35 days, but platelet count declined sharply over the first 3 days (53% drop, p < .0001) and remained constant for the remainder of storage. Peak FIIa generation climbed throughout (3‐fold increase). Platelet aggregation declined similarly to prior observations of cold‐stored apheresis units. WB clot strength decreases were observed as early as Day 21 of storage (28% drop, p < .05) but exceeded published values for combined red cells and plasma without platelets. Adhesion to collagen under flow was preserved, but the formation of fibrinogen‐platelet aggregates created a transiently‐adherent population at later time points. Mean results shown in table.
(CBIB25)
| Platelets/nl | ADP Aggregation (AU) | pH | PRP Peak FIIa (nM) | EXTEM MCF | ||||||
|---|---|---|---|---|---|---|---|---|---|---|
| Day | CPDA | CPD | CPDA | CPD | CPDA | CPD | CPDA | CPD | CPDA | CPD |
| 0 | 139.8 | 148.0 | 86.0 | 90.5 | 7.2 | 7.2 | 102.0 | 91.5 | 59.3 | 55.5 |
| 3 | 112.5 | 93.3 | 48.6 | 79.2 | 7.2 | 7.1 | 120.7 | 93.2 | 46.5 | 49.0 |
| 7 | 80.5 | 68.5 | 58.8 | 114.7 | 7.1 | 6.9 | 136.5 | 120.0 | 48.2 | 46.0 |
| 14 | 72.9 | 71.8 | 41.8 | 112.9 | 6.9 | 6.8 | 181.4 | 131.4 | 44.3 | 43.9 |
| 21 | 74.3 | 73.5 | 24.6 | 29.7 | 6.7 | 6.7 | 169.3 | 188.3 | 41.2 | 39.8 |
| 28 | 83.6 | 84.1 | 33.3 | 49.9 | 6.7 | 6.7 | 214.9 | 211.3 | 34.4 | 33.2 |
| 35 | 82.1 | 76.5 | 48.9 | 35.4 | 6.7 | 6.7 | 215.2 | 195.6 | 38.1 | 29.9 |
Conclusion: WB experiences a functional decline over time, but it maintains a significant degree of hemostatic potential throughout 35 days. While counts drop, platelets continue to aggregate and adhere to collagen surfaces, and patients likely to receive WB transfusion (currently members of armed services in theater of conflict) would often not receive any platelets otherwise. in vivo studies of cold‐stored WB, particularly near the end of shelf life, are warranted to determine efficacy of the product for treatment of hemorrhage or as part of a massive transfusion protocol, and effects of pretransfusion filtration on macroaggregates will be examined in vitro.
CBIB26
Cold‐Stored Platelets Are Not Pro‐Inflammatory in an In Vitro Mixed Lymphocyte Reaction
Maryanne C. Herzig*, Kristin Reddoch‐Cardenas, Umang Sharma, Carolina Cantu, James A. Bynum and Andrew P. Cap
U.S. Army Institute of Surgical Research
Background/Case Studies: Platelets (PLTs) are typically stored at room temperature (RT, 20°‐24°C) with agitation for 5‐7 days. During that time, pro‐inflammatory mediators such thromboxane B2, soluble CD40 ligand and microparticles are released. Cold stored PLTs (CSP, 1°‐6°C) release lower levels of such mediators and better preserve aggregation response, but cause increased levels of PLT activation. PLT additive solutions (PASs) can mitigate CSP activation through dilution of plasma fibrinogen. The effects of storage temperature and PAS on PLT inflammatory response are unknown. Therefore, in this study we examined the effects of storage temperature and PAS on apheresis platelets in an in vitro model of immunomodulation, the mixed lymphocyte reaction (MLR).
Study Design/Method: Apheresis platelets were collected in 100% plasma (n=4) or 65% T‐PAS + (TerumoBCT, Lakewood, CO)/35% plasma (n=2). Following collection, the test articles were separated into 15‐mL mini bags (BCSI, Seattle, WA) for storage at either RT or in the cold. The bags were sampled at Day 5 and 10 of storage and then assayed by MLR. For the MLR reaction, peripheral blood mononuclear cells (PBMCs, pooled from 8‐10 human donors) were labeled with carboxyfluoresceinsuccinimidylester (CFSE‐PBMCs) and incubated with diluted PLTs ranging from 0‐10% final volume in RPMI media containing 2U/ml heparin. Autologous PPP was generated from the PLT samples to achieve the correct PLT dilution. PBMC proliferation was stimulated with 5 µg/ml phytohaemagglutinin A. After 96 h, PBMC proliferation was determined by flow cytometry of the CD3(+), live, CFSE‐labeled PBMCs.
Results/Finding: PPP controls from 100% plasma samples (RT and CSP) were immunosuppressive decreasing stimulation of overall PBMC proliferation in RPMI by 30% at 5 days; only a 10% immunosuppression was seen with PPP control from T‐PAS + samples. There was no significant difference observed between RT or CSP (in 100% plasma or T‐PAS+). After 10 days, the PPP of CSP in T‐PAS + caused 30% PBMC proliferation, similar to Day 5 RT storage. At 10% PLT concentration, suppression of the maximally stimulated PBMC proliferation was 87% in plasma and 92% in T‐PAS + (p=0.64); at Day 10, T‐PAS + PLTs were 100% immunosuppressive of the maximal PBMC stimulation.
Conclusion: Transfusion related immunomodulation (TRIM) is a known response to transfusion of blood products, particularly PLTs. Addition of stored PLTs, or PPP, inhibited PBMC proliferation over media controls, suggestive of a TRIM event. T‐PAS + decreased the control immunosuppression, likely due to the reduction of plasma. Both storage temperatures were equally immunosuppressive of maximal PBMC proliferation; immunosuppression depended on storage solution and storage time, but not storage temperature in this in vitro assay.
CBIB27
The Shifted Expression of lncRNAs in Human Apheresis Platelets during Storage
Yaming Wei*
Guangzhou First People`s Hospital
Background/Case Studies: LncRNAs can regulate the gene expression at four levels, epigenetic, transcription, translation and protein modification, and have roles in differentiation, proliferation, apoptosis and other biological processes. LncRNAs have been found to exist in platelets; however, the alteration and the function of lncRNAs involved in platelet storage is not clear.
Study Design/Method: Platelet samples were collected from 13 healthy men with O blood group. lncRNAs levels were quantified in human platelets stored for 2, 5, and 8 days at 22°C in shaking tank using Affymetrix Human lncRNA Array. Eight lncRNAs (lnc‐MARCH2‐2:1, lnc‐SLC2A2‐1:1, lnc‐WBSCR16‐3:6, lnc‐WEE1‐2:1, lnc‐ENTPD6‐2:1, lnc‐NKD2‐1:1, lnc‐FOXS1‐2:1 and lnc‐MAPK13‐3:1) and four mRNAs (BCL2L1, CAPN2, MAPK14 and VAMP8) were chosen for validation by RT‐PCR. Bioinformatics method was applied to construct lncRNA and mRNA co‐expression profile. GO and KEGG pathway analyses predicted lncRNA's function, and cis‐regulation analysis revealed the potential molecular mechanism of lncRNA on target gene expression.
Results/Finding: There were 162 lncRNAs expression levels shifted on the 5th storage day compared to 2nd day, in which 4 were up‐regulated and 158 were down‐regulated, and 691 lncRNAs expression levels shifted, on the 8th storage day compared to 2nd day, in which 20 were up and 671 were down, respectively. While 246 lncRNAs were differentially expressed, 2 increased and 244 decreased between the 8th and 5th day. In addition, the number of lncRNAs had increased expression level was much greater than that had increased expression level. The result of RT‐PCR was consistent with the microarray: lnc‐MARCH2‐2:1, lnc‐WEE1‐2:1 and lnc‐NKD2‐1:1 expression level increased; while lnc‐WBSCR16‐3:6, lnc‐SLC2A2‐1:1, lnc‐ENTPD6‐2:1, lnc‐FOXS1‐2:1 and lnc‐MAPK13‐3:1 reduced. Four targeted mRNAs BCL2L1, CAPN2, MAPK14, and VAMP8 were down‐regulated during platelet storage. GO and KEGG pathway analyses revealed that many lncRNAs and co‐expressed mRNAs were related to platelet aggregation, platelet activation, and endocytosis. Additionally, lncRNAs might have cis‐regulate the expression of genes implicated in platelet physiological function.
Conclusion: This is the first study that analyze the stability of LncRNAs in banked platelet. Many lncRNAs altered their expression level during the storage. Moreover, those shifted lncRNAs likely have a role in regulating platelet physiological function.
CBIB28
Do We Store Blood Units in the Optimal Temperature?
Dan Arbell1, Moshe Gertzulin2, Orly Zelig3, Tanja Rasmusen2, Saul Yedgar*2 and Gregory Barshtein2
1Department of Pediatric Surgery, Hadassah‐Hebrew University Hospital, 2The Faculty of Medicine, The Hebrew University of Jerusalem, 3Blood Bank, Hadassah‐Hebrew University Hospital
Background/Case Studies: Blood units are stored as packed red blood cells (PRBC) at 2‐6°C, presumably to minimize the storage‐induced cell lesion. However, at 4°C water is at its' most compact packing, and undergoes abnormal structural processes, among them the breakage of hydrogen bonds which affects the water interactions with neighboring molecules. This implies that during the routine cold‐storage PRBC are subjected to repeated temperature fluctuations below and above the 4°C critical temperature, and the respective volume/density variations. These anomalies are expected to induce acceleration of PRBC lesion. The study presented here was aimed at testing this hypothesis.
Study Design/Method: Six PRBC units, leukofiltrated and stored in SAGM, were employed. Samples of PRBC were collected from each unit, stored in small storage bags and divided into two groups. Units from group A (gA) was stored in a routine blood bank refrigerator where the temperature fluctuated between 2.5‐5.5°C, and units from group B (gB) was stored at 5‐6°C, assuring that the temperature did not go below 5°C.
The PRBC lesion was monitored by the change in cells deformability, determined immediately after processing the PRBC on Day 1 (D1) and after 35 days of storage (D35), using the cell flow properties analyzer (CFA). The cell shape‐change is expressed by the change in the cell elongation ratio (ER), calculated for each cell as ER = a/b, where a and b are the major and minor cell axes, respectively. The CFA image analysis provides the ER distribution in large RBC population, from which the fraction of the low deformable cell (%LDFC, ER≤1.5) in PRBC population was derived.
Results/Finding: In accordance with previously obtained results, the deformability of PRBC from gA decreased considerably from D1 to D35, while the deformability of PRBC from gB remained unchanged through the entire storage period (Table 1). In particular, Table 1 shows that on D35, the portion of the relatively rigid RBC (%LDFC) in gA PRBC was considerably higher (∼51%) than that in gB (∼39%).
Conclusion: The present study shows that storing PRBC under conditions that expose them to the temperature fluctuation around 4°C (gA), induces a considerable elevation in the RBC rigidity, whereas when the exposure to these conditions is avoided (gB), the RBC deformability is unchanged during storage. Although of limited scope, this study demonstrates that the PRBC “quality”, as expressed by the cell deformability, is maintained better when PRBC are not exposed to repeated temperature fluctuations below/above the 4°C critical temperature, where the cells are subjected to the water anomalies.
TABLE 1 Changes in RBC Deformability from D1 to D35 of storage, for gA vs. gB PRBC.
| Parameter | D1 | D35 | P value | |||
|---|---|---|---|---|---|---|
| D1 vs D35 | gA vs gB | |||||
| gA | gB | gA | gB | D35 | ||
| %LDFC | 36.6 ± 10.1 | 50.8 ± 5.27 | 39.3 ± 4.73 | 0.005 | 0.28 | 0.0035 |
CBIB29
The Incidence of Transfusion‐Associated Microchimerism in Burns Patients
Rena Hirani*1, Susan Taggart2, Peter Maitz2 and David O. Irving1
1Australian Red Cross Blood Service, 2Concord Repatriation General Hospital
Background/Case Studies: Despite the almost universal use of leukodepleted blood components, it has been shown that donor leukocyte engraftment (microchimerism) remains a long‐term consequence of red blood cell (RBC) transfusion in some patient groups. The clinical consequences of having these remaining cells and the mechanism by which they survive following blood transfusion is unclear. Furthermore, the incidence of transfusion‐associated microchimerism (TAM) may be affected by international differences in blood processing methods or transfusion practices. In Australia, 10% of trauma patients were found to have TAM despite the introduction of universal leukodepletion of RBC units since October 2008. The incidence of TAM has not been extensively studied outside of the trauma setting. This study aimed to analyze the incidence of TAM in patients with a major thermal injury following RBC transfusion.
Study Design/Method: Australian burns patients with total body surface area (TBSA) burns ≥ 15% and who had been transfused with at least one RBC unit between 1st January 2000 and 31st December 2011 were recruited into the study. The incidence of TAM was determined using PCR analysis with a panel of insertion/deletion biallelic polymorphisms.
Results/Finding: For this patient cohort (n = 8), the median TBSA burn was 34% [range 15‐70%]. The patients were transfused with a median of 9.5 RBC units [range 1‐31] and had median hospital length of stay of 29 days [range 21‐51]. Half of the patients had been transfused with universally leukodepleted RBCs. One patient who had been transfused with leukodepleted RBC units showed an insertion/deletion pattern indicating the presence of microchimerism.
Conclusion: While the number of patients in this study is still small, in this cohort of thermal injured patients there was an incidence of TAM of 12.5%. This rate is similar to studies conducted in transfused trauma patients. Furthermore, this finding supports the hypothesis that leukodepletion of RBC units does not eliminate the risk of this transfusion‐related outcome.
Australian governments fund the Australian Red Cross Blood Service to provide blood, blood products and services to the Australian community.
CBIB30
Selection of Patient‐Specific Blood Unit for Personalized Transfusion by the Red Blood Cell Hemodynamic Functionality
Saul Yedgar*1, Dan Arbell2, Orly Zelig3 and Gregory Barshtein1
1The Faculty of Medicine, The Hebrew University of Jerusalem, 2Department of Pediatric Surgery, Hadassah‐Hebrew University Hospital, 3Blood Bank, Hadassah‐Hebrew University Hospital
Background/Case Studies: There is a growing concern about the risks in the transfusion of packed red blood cells (PRBC), following numerous studies reporting negative transfusion outcomes, including reduced blood perfusion. RBC have unique flow‐affecting properties, particularly deformability and adherence to vascular endothelial cells, defining RBC hemodynamic functionality (HF), namely their capacity to affect blood flow. In the search for the mechanism behind the negative transfusion outcome, we explored the effect of PRBC HF on transfusion outcome in β‐Thalassemia‐Major (TM) patients (routinely treated with frequent, life‐long transfusions) and elder blood recipients with non‐hemolytic anemia.
Study Design/Method: The effect of PRBC HF was examined by the transfusion‐induced change in recipients’ skin blood flow (ΔSBF), hematocrit (ΔHct), and the time‐interval between transfusions (TIBT). SBF was determined using a laser‐Doppler‐imager. PRBC deformability and adherence was determined using the/ a cell flow‐properties analyzer (CFA).
Results/Finding: In both groups of patients, ΔSBF and ΔHct increased with increasing HF of the transfused PRBC, with a highly significant correlation. ΔSBF was inversely proportional to the recipients’ SBF before transfusion. The transfusion outcome also depended on the HF of the recipients' RBC (TR‐RBC); when the PRBC HF was higher than that of the TR‐RBC, the recipients' SBF increased (ΔSBF>0), and inversely, when the PRBC HF was lower than that of the TR‐ RBC, the SBF decreased (ΔSBF<0). In the TM patients, the time interval between consecutive transfusions increased with increasing PRBC HF, exhibiting highly significant dependence.
Conclusion: This study provides, for the first time in humans, direct evidence that the HF of transfused PRBC is a potent effector of transfusion outcome. Determination of the PRBC HF vs. that of the recipient's RBC and conditions before transfusion can be used for selecting patient‐specific blood units. Currently, PRBC are tested exclusively for immunological compatibility, and supplied primarily by the first‐in‐first‐out (FIFO) criteria, while their functionality, the HF in particular, is completely ignored. The additional testing of RBC HF (of the transfused and the recipients RBC) introduces a new paradigm and technology into blood‐banking, which would contribute substantially to improving transfusion therapy and enable personalized transfusion medicine.
CBIB31
Potential Protective Role of Wnt Signaling in Platelets during Storage by (down‐) Regulating Protein Synthesis
Peter Schubert*1,2, Brankica Culibrk1, Zhongming Chen1 and Dana Devine1
1Canadian Blood Services, 2Pathology&Laboratory Medicine
Background/Case Studies: Wnt signaling plays crucial roles in mammalian cells regulating aspects of cell fate, migration and polarity. Platelets posses many proteins of this signaling pathway; however, its role in platelet function is poorly understood. One study has shown that wnt3A inhibits platelet adhesion, shape change and aggregation. In this study, we investigated the role of wnt3A signaling in protein synthesis using its agonist sFRP‐1 (soluble frizzled‐releated protein) on washed and stored platelets.
Study Design/Method: Levels of wnt3A and sFRP‐1 were determined by immunoblot analyses of the respective proteins in plasma. Platelets (PLTs) prepared from whole blood collected in citrate as anticoagulant were washed with citrate‐glucose‐saline buffer and incubated with 50nM wnt3A, 300nM sFRP‐1, wnt3A + sFRP‐1 or kept untreated as control in the presence of 550 μM puromycin (Pm) followed by activation with 10 μM ADP for 15min. For storage experiments, aliquots of apheresis PCs were stored in small in‐house prepared bags which mimic the storage features of common PLT bags. Two sets of aliquots were spiked with 550 μM Pm and 0, 150, 300 and 450nM sFRP‐1 and stored for 4 and 8 days, respectively. PLT in vitro quality was assessed using platelet activation by CD62P binding, responsiveness in the presences of ADP in the CD62P assay, phosphatidyl‐serine exposure by annexin‐V binding and metabolic activity. Protein synthesis was monitored in lysates prepared in a Triton X‐100‐containing buffer by immunoblot analyses against Pm and determination of the band intensities using the Odyssey software on a Lycor imagining system.
Results/Finding: The washed and activated PLTs showed a strong band pattern of synthesized proteins which was not affected by the presence of sFRP‐1 or the combination of wnt3A and sFRP‐1, but 2.4‐fold reduced in the presence of wnt3A alone. For the storage study, we confirmed abundant amounts of wnt3A in plasma; however, the levels of sFR‐1 were too low to be detected. Both on day 4 and day 8 of storage, sFRP‐1 showed a concentration dependent 2‐, 2.5‐ and 2.6‐fold increase of Pm incorporation, respectively, compared to the untreated control. This trend was mirrored in increased glucose consumption and lactate production as well as platelet activation of 10.2 ± 1.3%, 14.7 ± 1.1% and 15.3 ± 1.7%, respectively, compared to the untreated control. Subsequently, the response to ADP on degranulation was reduced in the similar fashion. Lastly, no noticeable impact was detected on apoptosis development.
Conclusion: Wnt signaling seems to down‐regulate protein synthesis in activated and stored platelets. As these features are paralleled to platelet function, we hypothesize that wnt signaling might have a protective role in platelets during storage.
CBIB32
Alteration of Red Blood Cell Deformability by Preparation of Packed Red Blood Cells Units in the Blood Bank
Gregory Barshtein*1, Dan Arbell2 and Saul Yedgar1
1The Faculty of Medicine, The Hebrew University of Jerusalem, 2Department of Pediatric Surgery, Hadassah‐Hebrew University Hospital
Background/Case Studies: Donated blood is processed in the blood bank for storage as packed red blood cells (PRBC). In the process of packed cell preparation (PCP), the blood is often subjected to removal of white cells by leukofiltration, to reduce the risk of adverse reactions. During this procedure, the RBC are exposed to high level of shear stress, which can induce alteration of the cell deformability.
In the present study, we examined the effect of packed cell preparation process on the RBC deformability.
Study Design/Method: Blood samples were collected from 25 healthy volunteer donors, and from the corresponding units following their processing as PRBC (PCP), which included leukofiltration. RBC deformability was determined using a cell flow‐properties analyzer (CFA). The cell shape‐change is directly visualized in a narrow‐gap flow‐chamber under controllable flow‐induced shear stress. The cell deformability is expressed by the change in the cell elongation ratio (ER), calculated for each cell as ER = a/b, where a and b are the major and minor cell axes, respectively. The CFA image analysis provides the ER distribution in large RBC population, from which several deformability parameters are derived, including and the fraction of the rigid, undeformable cells in the RBC population (%UDFC, ER ≤ 1.1). The portion of undeformable cells was derived for each RBC sample, before and after PCP (%UDFCB and %UDFCA, respectively), and its change was calculated as Δ%UDFC = %UDFCA ‐ UDFCB.
Results/Finding: The effect of PCP on the level of the undefromable cells depended on its initial level in the freshly‐collected blood. In the samples with %UDFCB higher than 6‐7%, the PCP reduced this fraction of the rigid cells. In contrast, when the initial fraction of the rigid cells was lower than 6‐7%, the PCP increased the %UDFCB. Δ%UDFC for all the samples exhibited a clear linear correlation with UDFCB (r = 0.577 with significance of p = 0.004).
Conclusion: As noted above, in the procedure of packed cells preparation the RBC are subjected to high shear stress. That probably provokes the opposite phenomena; (a) removal/destruction of the rigid cells, thereby reducing their level, on one side, and (b) mechanical damage to the cell membrane and subsequent reduction of the cell deformability, thereby increasing the level of %UDFC. The results of this study support the existence of this phenomenon.
CBIB33
Unequal Acceptor Substrate Specificities of Blood Group A and B Transferases, Forssman Glycolipid Synthase, and Other α1,3‐Gal(NAc) Transferases by Amino Acid Substitutions at Nucleotide‐Sugar Interacting Codons
Emili Cid1, Miyako Yamamoto1 and Fumiichiro Yamamoto*1,2
1Josep Carreras Leukaemia Research Institute (IJC), 2Program of Predictive and Personalized Medicine of Cancer (PMPPC), Institut d'Investigació Germans Trias i Pujol (IGTP)
Background/Case Studies: Blood group A and B antigens of the ABO system and FORS1 antigen of the Forssman system (FORS), as well as structurally related glycans, isoglobotriaosylceramide (iGb3) and α1,3‐galactosyl‐epitope (α1,3‐Gal‐epitope), are synthesized by the actions of evolutionarily related α1,3‐Gal(NAc) transferases with distinct glycosyltransferase activities and substrate specificities: Blood group A and B transferases (AT and BT), Forssman glycolipid synthase (FS), globotriaosylceramide synthase (iGb3S), and α1,3‐galactosyltransferase (GT), respectively. Previously, it was shown that the amino acids at codons 266 and 268 of human AT/BT are crucial to define their distinct sugar specificities, elucidating the molecular genetic basis of the ABO glycosylation polymorphism of clinical importance in transfusion and transplantation medicine.
Study Design/Method: To better understand the structural basis of α1,3‐Gal(NAc) transferase diversification, we prepared eukaryotic expression constructs of those enzymes possessing AT‐specific AlaGlyGly or LeuGlyGly, BT‐specific MetGlyAla, FS‐specific GlyGlyAla, or iGb3S and GT‐specific HisAlaAla tripeptide at the codons corresponding to 266‐268 of human AT/BT. We then performed DNA transfection using appropriate recipient cells, existing and newly created, and immunologically examined the appearance of cell surface oligosaccharide antigens.
Results/Finding: The immunocytochemistry results using monoclonal anti‐glycan antibodies after DNA transfection of expression constructs have revealed that several tripeptides other than the originals also bestowed transferase activity. Surprisingly, however, the repertoire of functional amino acids varied among those transferases. Quantification by FACS immunocytometry confirmed the differential effects on substrate specificities of α1,3‐Gal(NAc) transferases. Interestingly, we have also observed transferase activity not corresponding to the enzyme, namely FS activity of human ATs with AlaGlyGly or GlyGlyAla.
Conclusion: The tripeptides at codons corresponding to 266‐268 of human AT/BT also affect acceptor substrate specificities, in addition to the known function in determining donor nucleotide‐sugar specificities, which may have contributed to the generation of a diverse family of α1,3‐Gal(NAc) transferases. Excluding primates, where LeuGlyGly is predominant, the AlaGlyGly tripeptide is frequently present in ATs from many vertebrate species. Therefore, it is possible that those ATs may also exhibit FS activity under certain conditions where appropriate acceptor substrates are present. If this is the case, two genetic loci, GBGT1 and ABO, rather than GBGT1 alone, may specify FORS1 expression in those species.
CBIB34
Assessment of Safety in Neonatal Rats for Transfusion of Red Blood Cells Prepared with the Amustaline‐Gsh Pathogen Reduction Treatment
M. von Goetz, A. North, Nina Mufti and L. Corash*
Cerus Corporation
Background/Case Studies: The pathogen reduction (PR) system using amustaline (S‐303) and glutathione (GSH) is being developed for the inactivation of pathogens and leukocytes in red blood cell (RBC) components for transfusion. Clinical trials are ongoing or planned to evaluate PR RBC in adolescent and adult patients. The objective of this study was to evaluate potential adverse effects on postnatal growth and development to support transfusion of PR RBC to pediatric and neonatal patients.
Study Design/Method: Test articles (Table 1) included heterologous RBC treated with the current clinical process and increased concentrations of S‐303 with reduced GSH levels. 24 rats per group (12 males and 12 females) were given PR RBC or Control RBC intraperitoneally three times a week from Postnatal Day4 (PND 4) for 2 weeks and then intravenously by bolus injection three times a week from PND 18 for 7 weeks through maturation (PND 64). The following parameters and endpoints were evaluated: viability, clinical signs, body weight (wt.) gain, food consumption, ophthalmology, sexual maturation, Morris water maze evaluation, clinical pathology (hematology, coagulation, clinical chemistry, and urinalysis), plasma sample analysis, gross necropsy findings, femur measurements, organ weights, and histopathologic tissue examinations.
Results/Finding: No deaths or clinical observations were considered as related to PR RBC. Body wt. gain and food consumption values were generally comparable among the three dose groups. Organ wt. changes in recipients of S‐303 RBC (Groups 2 and 3) included decreases in the wt. of the pituitary gland but only the wt. relative to body wt.was statistically significantly different (‐16.1%, p≤0.05 or ‐20.4%, p≤0.01) in Group 2 and 3 females and statistically significant reductions in ovary wt. relative to body wt. (‐20.3%, p≤0.05 or ‐17.9%, p≤0.01) in Groups 2 and 3. Histologic examination of these tissues and organs demonstrated no evidence of pathologic abnormalities, and physiologic functions of these organs for growth and development were conserved. There were no S‐303 RBC‐related effects in the male and female rats for sexual maturation, performance in the Morris water maze, ophthalmic examination, hematology, coagulation, clinical chemistry, urinalysis, necropsy observations, femur lengths, and histopathology.
Conclusion: PR RBC transfused to neonatal rats at 10‐fold expected clinical exposure showed conservation of normal growth, development, and sexual maturation. No pathologic abnormalities were observed in any organ systems based on gross and microscopic histopathologic observations. These studies demonstrated safety of PR RBC supporting their use in neonatal patients.
TABLE 1 Experimental Design
| Group No. | Treatment | Dose Volume (mL/kg) |
|---|---|---|
| 1 | Control RBC | 10 |
| 2 | 0.2 mM S‐303 + 20 mM GSH RBCa | 10 |
| 3 | 1 mM S‐303 + 10 mM GSHc RBCb | 10 |
Prepared with treatment solution exchange step (i.e., after incubation with S‐303, RBC were centrifuged, the supernatant was expressed, and AS‐5 was added to achieve the final volume).
Prepared without treatment solution exchange step.
Reduced level of GSH quencher results in exposure to higher levels of S‐303.
The INTERCEPT Blood System for Red Blood Cells is not approved for commercial use.
CBIB35
Acoustophoretic Separation: A Sensitive Alternative to Centrifugation to Purify Cultured Platelets for a Clinical Application
Catherine Strassel*1, Jérémie Gachelin2, Nicolas Bertin2, Valentin Do Sacramento1, Lea Mallo1, François Lanza1 and Christian Gachet1
1Université de Strasbourg, INSERM, EFS Grand Est, BPPS UMR‐S 1225, FMTS, 2Aenitis Technologies S.A.S.
Background/Case Studies: The in vitro production of blood platelets is an important goal for transfusion in the present context of a sustained demand for controlled products free of infectious, immune and inflammatory risks. It is currently possible to produce platelets in vitro. However, for cultured platelets to be considered as a real alternative to transfusion, it is of paramount importance to demonstrate that these platelets are free of contaminants, such as nucleated cells or non‐platelet cellular fragments.
Study Design/Method: The aim of our study is to evaluate the effectiveness of an acoustic‐based fractionation device to separate newly released platelets from residual megakaryocytes (MK) and cytoplasmic debris (CD).
Platelets are produced in vitro from peripheral blood‐derived CD34 progenitors following the protocol described in Strassel et al., Blood 2016. Platelets are released from the cell suspension following successive pipetting. Platelet recovery and purity are compared following standard centrifugation and fractionation using an acoustophoresis‐based device that allows the separation of two objects with different acoustic properties.
Results/Finding: Fractionation using a combination of two acoustic devices led to a significant reduction in the number of residual MK and CD compared to standard centrifugation. More than 80% and 55 % of residual MK and CD are removed, respectively, whereas centrifugation does not allow the separation of CD.
Conclusion: The acoustic‐based method is a promising alternative to isolate cultured platelets with a high level of purity and to provide a blood product compatible with transfusion requirements.
CBIB36
Vesiculation in Packed Red Blood Cells Units during Cold‐Storage Reflects the Decline in the Cells Deformability
Mark McVey1, Wolfgang Kuebler2, Ariel Orbach3, Gregory Barshtein*3 and Saul Yedgar3
1The Hospital for Sick Children, 2Charité ‐ Universitätsmedizin Berlin, 3The Faculty of Medicine, The Hebrew University of Jerusalem
Background/Case Studies: During cold‐storage, packed red blood cells (PRBC) undergo slow detrimental changes that are collectively termed storage lesions. A significant expression of this is the release of microvesicles (MVs) from cell membranes. This process is associated with a decrease in the ratio of the cell surface area to its volume, which can lead to impairment of RBC deformability.
In the presented study we examined the correlation between the level of PRBCs’ deformability and the release of MVs from RBCs to the supernatant.
Study Design/Method: RBC samples were obtained from seven PRBC units (unleukofiltrated) stored in CPDA‐1 for 35 days. MVs were obtained from cell‐and debris‐depleted PRBC supernatants by differential centrifugation and counted by high‐sensitivity flow cytometry. Concomitantly, RBC deformability was determined using a cell flow‐properties analyzer in which RBC shape‐change is directly visualized in an arrow‐gap flow‐chamber and monitored as a function of shear stress. The cell deformability is expressed by the cell elongation ratio (ER), ER = a/b, where a and b = long and short axes of the cell, respectively. This calculation applies to each cell and provides the ER distribution in a large RBC population, enabling the derivation of several deformability measures such as the median ER (MER) and the percent of low deformable cells in the population (%, LDFC).
Results/Finding: As shown in Table 1, the MV level in the PRBC supernatant was inversely correlated with the RBC deformability (MER), and positively correlated with the fraction of the relatively rigid cells (%LDFC), both measures showing highly significant logarithmic dependence with MV levels.
TABLE: Logarithmic correlation* between MV concentration [MV] in PRBC supernatant and PRBC deformability
| Parameter | R | Significance |
|---|---|---|
| MER | ‐0.772 | 0.008917 |
| %LDFC | 0.782 | 0.007517 |
* Y = a·log [MV] + b; Where,
Y is MER or %LDFC and [MV] is the microvesicle concentration in the PRBC supernatant
Conclusion: Formation of MVs is known to lead to a decrease in the content of the RBC membrane proteins (e.g., stomatin, flotillin 1, flotillin 2.). In accordance with that, we have previously reported that RBCs become progressively more rigid as stomatin is depleted from the cell membrane. Together with the present study, showing a clear association of MV formation with the decline in RBC deformability in stored PRBC units, it is proposed that MV formation is a significant factor accounting for increased RBC rigidity occurring during storage of blood units.
CBIB37
Comparison of Differences in Infusion Effects of Leukocyte‐Depleted Fresh Platelets and Leukocyte‐Depleted Frozen Platelets
Yanhua Jin*, Xin Tong, Ying Yu, Zhao Liu and Huili Chai
The First Hospital of Harbin
Background/Case Studies: The leukocyte‐depleted fresh platelets have been widely used clinically to treat patients with thrombocytopenia and platelet dysfunction. The infusion of exogenous platelets as a treatment for hemorrhagic diseases caused by thrombocytopenia or dysfunction plays an irreplaceable role compared with the drugs. With the increasing awareness of blood component transfusion, the demand for platelets from medical institutions has increased year by year. Due to shelf life limitations, fresh platelets often cannot meet clinical needs. In order to save lives in a more timely manner, the method of transfusion of frozen platelets is used in emergency situations to meet the needs. The purpose of this study was to compare the therapeutic effect of infusion of leukocyte‐ depleted frozen platelets and leukocyte‐depleted fresh platelets.
Study Design/Method: 110 patients with thrombocytopenia were selected, including 45 males and 65 females, aged 23‐66 years, all of whom were given the first blood transfusions. Exclude immune factors that affect platelet transfusion efficacy due to multiple transfusions. They were randomly divided into two groups, of which 53 patients were infused with leukocyte‐ depleted frozen platelets and 57 patients were infused with leukocyte‐depleted fresh platelets. The infusion of platelet was completed within 30 minutes at a rate that the patient could tolerate. The patients were tested for bleeding time before infusion, 1 hour after infusion, and elevation of platelet count in peripheral blood 24 hours after infusion. The data were statistically processed, the measurement data was checked by t test, and the enumeration data was analyzed with chi‐square test.
Results/Finding: There was no significant difference in the general data between the two groups (P>0.05). There was no statistically significant difference in bleeding time (5.2 ± 1.6 min VS 5.2 ± 1.5 min) between infusion of leukocyte‐depleted fresh platelets and leukocyte‐depleted frozen platelets (P>0.05). The platelet count (48.56 ± 8.95 x10⁹/L VS 31.45 ± 7.12 x10⁹/L) after transfusion of leukocyte‐depleted fresh platelets and leukocyte‐depleted frozen platelets was statistically significant (P<0.01).
Conclusion: There was no statistically significant difference in the bleeding time between infusion of the equivalent amount of leukocyte‐depleted frozen platelets and leukocyte‐depleted fresh platelets, suggesting that the hemostatic function of the two exogenous platelets to patients are close. The difference in platelet counts was statistically significant, and the platelet counts increased significantly in patients who had received leukocyte‐depleted fresh platelets. The binding capacity of the cryopreserved platelet membrane surface adhesion receptor was significantly enhanced and the procoagulant activity was significantly increased. Therefore, infusion of leukocyte‐depleted frozen platelets in an emergency can achieve effective and rapid hemostasis.
CTI8
Influence of Heparin on Gene Expression of Stromal Cells Derived from Different Tissues
Sandra Laner‐Plamberger1, Michaela Oeller1, Ravi Kalathur2, Rodolphe Poupardin2, Sarah Hochmann2, Gabriele Brachtl2, Karin Pachler3, Christina Kreutzer4, Dirk Strunk2, Eva Rohde5 and Katharina Schallmoser*5
1Paracelsus Medical University of Salzburg, Department of Transfusion Medicine, 2Paracelsus Medical University of Salzburg, Experimental and Clinical Cell Therapy Institute, Spinal Cord Injury and Tissue Regeneration Center Salzburg, 3Paracelsus Medical University of Salzburg, GMP‐Unit, Nanovesicular Therapies Research Program, Spinal Cord Injury and Tissue Regeneration Center Salzburg, 4Paracelsus Medical University of Salzburg, Institute for Experimental Neuroregeneration, 5Paracelsus Medical University of Salzburg, Department of Transfusion Medicine, Spinal Cord Injury and Tissue Regeneration Center Salzburg
Background/Case Studies: Human platelet lysate (HPL) contains abundant growth factors and cytokines boosting in vitro cell proliferation. A growing number of institutions use HPL as alternative to animal sera for manufacturing of cell‐based medicinal products. Addition of porcine heparin is default to prevent HPL‐supplemented media from clotting. To achieve an animal component‐free culture system, a protocol for mechanical depletion of fibrinogen and coagulation factors has recently been introduced.
Study Design/Method: In this study, we investigated the so far unclear influence of heparin on gene expression of stromal cells derived from umbilical cord (UC), white adipose tissue (WAT) or bone marrow (BM; each n=3). Stromal cells were isolated and propagated using HPL plus heparin vs. fibrinogen‐depleted HPL plus/minus heparin. Whole genome microarrays were analyzed using R/Bioconductor followed by confirmative qRT‐PCR. Immunophenotype, in vitro differentiation, proliferation, clonogenicity and immunomodulatory potency were investigated. Cell uptake of heparin was analyzed by fluorescence microscopy and flow cytometry.
Results/Finding: Depending on stromal cell origin, transcriptome profiling revealed a differential regulation of distinct gene sets by heparin, with UC showing the highest number of altered genes. Signaling cascades involved in proliferation (e.g. WNT, TGFbeta, PDGF, FGF and EGF pathways), cell adhesion (integrins, cadherins), cell fate decision, inflammation and angiogenesis were differentially affected. Further analyses of phosphorylated proteins in signaling pathways are in progress. We also observed a cell‐source dependent internalization of heparin. UC stromal cells showed the highest heparin uptake compared to other cell sources. Independent of heparin, flow cytometric analysis revealed a characteristic stromal phenotype profile and comparable in vitro trilineage differentiation. The proliferative capacity of UC and BM stromal cells was increased in the presence of heparin using fibrinogen‐depleted HPL in early passages. In contrast, heparin did not influence the clonogenicity or in vitro immunomodulatory potential.
Conclusion: Depending on the source of stromal cells, heparin regulated distinct sets of genes and signaling pathways. Although heparin exerted a mitogenic stimulus on UC and BM, human stromal cells were efficiently expanded with HPL in the absence of heparin, thus providing completely xeno‐free conditions for the generation of stromal cell therapeutics.
CTI9
Center Method Contributes More to MSC Variability Than Does Source Material: A Report by the Cellular Therapy Team of the Biomedical Excellence for Safer Transfusion (BEST) Collaborative
Jo‐Anna Reems*1, David F. Stroncek2, Minoko Takanashi3, Magali J. Fontaine4, Shibani Pati5 and David H. McKenna6
1University of Utah, 2National Institutes of Health, 3The Japanese Red Cross Blood Service Headquarters, 4University of Maryland School of Medicine, 5University of California San Francisco, 6University of Minnesota
Background/Case Studies: Mesenchymal stromal cells (MSCs) demonstrate variable characteristics when cultured with different strategies and from different source materials. The purpose of this study was to investigate how much of this variability is attributable to culture strategy and how much is due to source material.
Study Design/Method: Five independent laboratories used their own culture strategy to produce MSCs from marrow aspirates from the same 3 donors. Two labs enriched marrow for leukocytes by density gradient sedimentation and 3 did not. Four labs cultured MSCs in media supplemented with FBS and 1 lab used platelet lysate. Cell seeding densities for the initial outgrowth (i.e. P0) ranged from 19.7x10³/cm2‐286/cm2 and for the second seeding (i.e. P1) from 50‐10,179 cells/cm2. The total number of passages performed ranged from 1‐3. MSCs were harvested, frozen, thawed and assayed for viability, immunophenotype, tri‐lineage differentiation potential, colony forming unit‐fibroblast activity, gene expression, and immunosuppressive capability.
Results/Finding: The transit time for BM aliquots from the collection to delivery site for 4 of 5 labs located within the U.S. ranged from 16.0‐30.0 hrs and 41.5‐71.5 hrs for a 5th lab located in Asia. Pre‐culture viable total nucleated cell concentrations for BM#1, BM#2, and BM#3, were 25.5 ×10⁶/mL, 21.8 x10⁶/mL, and 28.7×10⁶/mL with coefficient of variances of 25.7%, 21.5%, & 24.6%, respectively. Post‐thaw viabilities ranged from 74‐92%, 61‐96%, and 23‐90% for BM#1, BM#2, and BM#3, respectively. The average numbers of CFU‐F per 200 MSCs plated were 45.1 ± 21.4, 49.3 ± 26.8 & 14.9 ± 13.3 from BM#1, BM#2, and BM#3, respectively. No substantial differences in immunophenotype, tri‐lineage potential and immunosuppressive activities were noted. Global gene expression analyses of MSCs indicated that differences in MSC transcriptomes were affected by both the manufacturing site and donor, but the center effect was greater.
Conclusion: Despite the utilization of the same source material, functional differences were observed among MSCs produced at different centers. Variations in MSCs was more attributable to the methods used by the 5 centers than to the source of marrow. Together, these results support an effort to standardize the manufacturing process to decrease MSC variability.
CTI10
Effect of Hematocrit Method on Red Blood Cell Volume Determination and Potential Need for Red Blood Cell Reduction in Hematopoietic Stem Cell Products Collected by Apheresis or Bone Marrow Harvest
Suzanne Thibodeaux*1 and Diane Sempek2
1Washington University School of Medicine, 2Barnes‐Jewish Hospital
Background/Case Studies: Accurate and precise red blood cells (RBC) quantification in hematopoietic stem cell transplant (SCT) products is important for processing and clinical aspects of stem cell transplantation. ABO or antigen/antibody mismatched RBCs can cause deleterious effects in SCT recipients, and products with >20 mLs may be subject to RBC reduction to an acceptable level for infusion. RBC quantification in the context of varying total product volumes and RBC amounts is performed regularly, but little is reported about the specific performance characteristics of RBC quantification in HSCT products from different sources, of different quantities and of varying RBC amounts and the potential effect on SCT processing.
Study Design/Method: SCT product samples at a hospital‐based cellular therapy laboratory undergo parallel determination of RBC content based on hematocrit (Hct) measurement by manual and automated methods. Manual hematocrit (mHct) was performed by centrifugation and direct observation, and automated hematocrit (aHct) was performed on a Sysmex automated hematology analyzer after 1:10 dilution. RBC volume was determined by multiplying Hct by product volume (mL). Samples were grouped by SCT source of apheresis (HPC‐A) or bone marrow harvest (HPC‐M). HPC‐A products were further subgrouped by apheresis instruments used: Spectra Optia (Terumo BCT) or Amicus (Fresenius Kabi). Retrospective analysis of mHct and aHct was performed to determine if statistically significant differences between measurements exist by paired two‐tailed student's t test, and if that resulted in crossing the threshold of 20 mLs RBC volume.
Results/Finding: 154 SCT products were analyzed, 121 HPC‐A products from 1/1/2018 – 4/17/2018, and 33 HPC‐M products from 1/1/2017 – 4/18/2018. 106 and 15 HPC‐A samples were collected on the Spectra Optia and Amicus apheresis instruments, respectively. 5 HPC‐A products crossed the threshold of 20 mLs RBC volume: 4 HPC‐A SCT products with >20 mLs RBCs with mHct fell below threshold with aHct, and 1 HPC‐A SCT product < 20 mLs RBCs with mHct crossed the threshold with aHct. 4 of 5 of the affected products were collected on the Amicus. All HPC‐M SCT products were >20mLs RBCs by either method.
(CTI10)
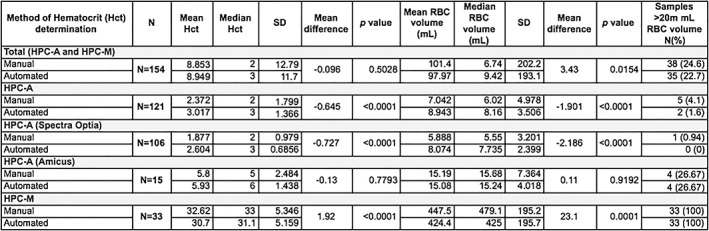
SD = standard deviation.
Conclusion: Hct measurement method can result in HPC‐A SCT product RBC volume differences, which could potentially change the need for further processing in cases of mismatched SCT products that cross the 20 mL RBC volume threshold for RBC reduction. No changes in the need for additional processing of HPC‐M SCT products were noted. Additional samples are needed to further analyze Hct differences in HPC‐A products collected on the Amicus, and additional studies are warranted to determine impact on cellular therapy laboratory workflow and patient outcomes.
CTI11
Uniformity and Functionality of Exosomes Isolated from Different Preparations
Tiffani Chance*1,2, Christopher R. Rathbone2, Barbara A. Christy1, Larry E. Estlack1, Christopher P. Delavan1, Andrew P. Cap1 and James A. Bynum1
1U.S. Army Institute of Surgical Research, 2The University of Texas at San Antonio
Background/Case Studies: Exosomes are internally derived microvesicles (30‐200 nm) that have gained considerable interest as disease biomarkers and therapeutic agents. Optimal exosome isolation and characterization methods remain undefined. Here, we analyze the uniformity and functionality of spheroid and monolayer human bone marrow mesenchymal stromal cell‐derived exosomes (ShMSC‐exo and MhMSC‐exo, respectively) isolated by two different methods using: NanoSight, endothelial tube formation assays, and bioenergetic profiling.
Study Design/Method: hMSCs were grown in hMSC high performance basal media (Rooster Bio; USA). MhMSC and ShMSC (pluronic coated 48‐well non‐tissue culture plates; 50,000 cells per well) were switched to serum free media (SFM) for 48 hours. Exosomes were isolated from SFM by: 1) ShMSC or 2) MhMSC ultracentrifugation, or, 3) MhMSC Qiagen Exo Easy Maxi Kit (Qiagen; USA). Size distributions were analyzed by NanoSight (LM14C, Malvern; UK), then normalized by protein content (10 µg), and human umbilical vein endothelial cell (HUVEC) angiogenesis tube formation assays (n = 3) were performed in ibidi slides (ibidi; USA) or 24‐well tissue culture plates. Tube formation numbers were quantified using ImageJ. Sample bioenergetic profiles were analyzed using Seahorse (Agilent; USA; n = 10), with Seahorse XF media (Agilent) as duplicate controls. Statistical analyses were performed using one‐way ANOVA tests.
Results/Finding: S‐ and MhMSC‐exo isolated from ultracentrifugation fell within the appropriate exosome size range, while commercial kit exosomes fell within 10‐400 nm, indicating a less pure sample. MhMSC‐exo significantly increased HUVEC tube formation per well (44.67 + /‐ 6.66, p < 0.05). M‐ and ShMSC‐exo significantly increased basal (150.837 + /‐ 4.087, p < 0.0001; and 146.885 + /‐ 3.887, p < 0.0001; respectively) and spare respiratory (267.355 + /‐ 19.440, p < 0.001; 223.910 + /‐ 15.282, p < 0.05; respectively) capacity oxygen consumption rate (OCR) levels compared to controls. MhMSC‐exo bioenergetic health index (BHI) was significantly changed compared to controls (1.490 + /‐ 0.092, p < 0.001), while ShMSC‐exo BHI was only significant for one parameter (1.375 + /‐ 0.072, p < 0.05).
Conclusion: Exosome isolation using ultracentrifugation resulted in a more uniform sample. MhMSC‐exo were better able to support HUVEC tube formation and mitochondrial capacity than ShMSC‐exo. Future studies will analyze additional functional activities, such as pro‐coagulant activity, using MhMSC‐exo isolated from 48‐well tissue culture plates.
CTI12
First High Resolution Typing Analysis of Human Leukocyte Antigen in a Colombian Sample and Its Implication in Cord Blood Hematopoietic Progenitor Cell Transplantation
Iván Aurelio Páez‐Gutiérrez*, Diana M. Vanegas, Bernardo A. Camacho and Ana‐Maria Perdomo‐Arciniegas
Instituto Distrital de Ciencia, Biotecnología e Innovación en Salud
Background/Case Studies: HLA match between donor and patient play a crucial role in allogeneic hematopoietic stem/progenitor cells (HSPC) transplant outcome. HLA typing may be performed in intermediate or high resolution. In Colombia, candidate patients for umbilical cord blood (UCB) transplant are typed in intermediate resolution for HLA‐A and ‐B and in high resolution for HLA–DRB1 and the units are requested mainly to Spain and USA. It is presumed that Colombian population may be genetically different but the currently available HLA studies are in intermediate resolution. We hypothesize that our HLA genetic pool differs from Spain and USA and knowing our allele and haplotype higher frequencies (HF) may increase the probability of finding suitable donors in a national UCB bank.
Study Design/Method: Analyses were performed in 1350 typed UCB units available for transplant in a public bank. All units were collected from healthy mothers, with signed informed consent in public hospitals in Bogotá. High resolution HLA typing was performed for HLA‐A, ‐B, ‐C, ‐DRB1 and –DQB1 by a certified laboratory. Six digits‐reported alleles were reduced to four digits in g groups, which may include null alleles. Serologic and allelic variant frequencies were obtained by counting and haplotype frequencies were calculated using Hapl‐O‐Mat software via EM algorithm. The initialization haplotype frequency was set as “perturbation”, the stopping algorithm threshold was ∊=1e‐07 and the haplotype frequencies cut was 1e‐07. Hardy Weinberg equilibrium and ligation disequilibrium were performed with Genepop software.
Results/Finding: Fifty alleles were found for HLA‐A (HF 02:01g and 24:02g), 95 for HLA‐B (HF 35:43g and 40:02g), 34 for HLA‐C (HF 01:02g and 04:01g), 51 for HLA‐DRB1 (HF 04:07g and 07:01g) and 17 for HLA‐DQB1 (HF 03:01g and 03:02g). The 50 most frequent haplotypes represent a cumulative frequency of 27.82% from 1349 estimated haplotypes. Compared to spanish and hispanic USA Population, one out of the two more frequent alleles for HLA‐A, ‐C and ‐DRB1 of our sample were not equally represented, while HLA‐B exhibited the highest differences between the compared populations (HLA‐B*35:43; Colombia 8.83%, Spain 0.2% and USA 0.8% and HLA‐B*40:02; Colombia 8.27%, Spain 1.58% and USA 4.85%).
Conclusion: Comparison of serological and allelic variant frequencies from a Colombian population sample exhibited the importance of high resolution typing to define the HLA allelic variant and probably increase matching between patient and donor. This is also the first HLA high resolution typing in our country, pointing the need for a deeper analysis of our population genetics regarding the high polymorphic HLA gene system. Our data demonstrated that the HLA Colombian genetic pool is not entirely comparable to USA and Spain mainly in HLA‐B, although most of the transplanted UCB units are imported from these countries. We also want to set the attention on the urgent need of a national donor registry in Colombia.
CTI13
Plasma Rotational Thrombelastometry for Evaluation of Hemocompatibility of Human Umbilical Cord Derived Stromal Cells
Michaela Oeller*1, Sandra Laner‐Plamberger1, Gabriele Brachtl2, Eva Rohde3, Dirk Strunk2 and Katharina Schallmoser3
1Paracelsus Medical University of Salzburg, Department of Transfusion Medicine, 2Paracelsus Medical University of Salzburg, Experimental and Clinical Cell Therapy Institute, Spinal Cord Injury and Tissue Regeneration Center Salzburg, 3Paracelsus Medical University of Salzburg, Department of Transfusion Medicine, Spinal Cord Injury and Tissue Regeneration Center Salzburg
Background/Case Studies: Stromal cells are promising candidates for regenerative medicine, but optimal cell source and expansion protocols using fetal bovine serum (FBS) or different preparations of human platelet lysate (HPL) are still under debate. At transplantation of hepatocytes or pancreatic islet cells an instant blood‐mediated inflammatory reaction (IBMIR) has been observed, rapidly activating complement and coagulation system. IBMIR due to stromal cell infusion can result in severe side effects as pulmonary embolism, in addition to rapid depletion of therapeutic cells and lack of engraftment. Recently, differential activation of in vivo coagulation and IBMIR has been associated with tissue factor (TF) expression depending on stromal cell origin. Aim of this study was to investigate the influence of different medium supplements on TF expression and in vitro hemocompatibility of umbilical cord derived stromal cells (UCSC) after culture (fresh) or cryobanking (frozen) by rotational thrombelastometry (ROTEM).
Study Design/Method: UCSC were cultured with standard HPL, fibrinogen‐depleted HPL or FBS. Proliferation, clonogenicity, immunophenotype, trilineage differentiation and immunomodulation of fresh UCSC were analyzed. TF expression of fresh and frozen UCSC was tested by flow cytometry. To estimate in vitro procoagulant activity, ROTEM was performed with fresh and frozen UCSC in AB plasma. Clotting time (CT), clot formation time (CFT) and maximum clot firmness (MCF) were analyzed.
Results/Finding: UCSC proliferation was significantly increased in all modified HPL‐ compared to FBS‐media while trilineage potential was maintained. Flow cytometry revealed a CD14‐/19‐/34‐/45‐/MHCII‐ and CD73+/90+/105+ phenotype. Immunomodulatory capacity was comparable in all UCSC samples. TF expression was significantly higher for fresh UCSC cultured in all HPL‐ compared to FBS‐media (ΔMFI ratio 9.9 ± 3.3 vs. 4.1 ± 0.3; p<0.05). Compared to fresh cells all frozen UCSC showed significantly reduced TF expression (ΔMFI ratio HPL 2.7 ± 1.7; p<0.05; FBS 1.9 ± 0.4; p<0.01). In contrast, the high procoagulant activity of fresh UCSC in HPL was not affected by cryobanking (CT [sec] frozen 66 ± 8 and fresh 63 ± 7; p=0.4), whereas in FBS frozen UCSC showed a significantly shortened CT (frozen 67 ± 5 vs. fresh 103 ± 11; p<0.001). All samples showed significantly reduced CT compared to plasma only (CT 1294 ± 195; p<0.001). In vitro pro‐coagulant activity of UCSC was significantly increasing with higher cell doses (p<0.05).
Conclusion: UCSC proliferated more efficiently in HPL‐supplemented media, but also showed higher pro‐coagulant activity than in FBS in vitro. Although TF expression declined after cryopreservation, high procoagulant activity compared to bone marrow stromal cells was still observed, indicating additional complement‐dependent mechanisms. Concerning the risk for IBMIR, analysis of hemocompatibility by ROTEM is highly recommended prior to intravenous application.
CTI14
CRISPR‐Driven Modeling of Clinically Relevant Genetic Variants in Hematopoietic Stem and Progenitor‐Derived Erythroid Cells
Yelena Boccacci1, Nellie Dumont1, Mathieu Drouin1, Yannick Doyon2 and Josee Laganiere*1
1Hema‐Quebec, 2Université Laval/CHU de Quebec
Background/Case Studies: Genome editing with engineered nucleases, such as RNA‐guided nucleases (CRISPR‐Cas9), allows targeted genetic manipulations and holds great promise for the treatment of inherited and acquired disorders. However, the efficiency of genome editing is a limiting factor when large enough quantities of correctly edited cells are required.
We recently devised a robust co‐selection strategy by generating dominant cellular resistance to ouabain, a highly potent plant‐derived inhibitor of the ubiquitous and essential sodium/potassium pump (encoded by the ATP1A1 gene). Using CRISPR technologies, we can generate ouabain‐resistant alleles in ATP1A1 to coselect for corrective editing events at a second locus of interest.
Faithful in vitro modeling of erythropoiesis to study specific genetic variants would be a useful tool for investigating gene function and help guide the management of complex clinical cases in the field of transfusion medicine.
Study Design/Method: In this work, we have exploited CRISPR‐based gene editing and ouabain co‐selection strategies combined with a HSC‐erythroid differentiation protocol to develop a cellular model showcasing desired genetic variants. We used a three‐step culture method to efficiently produce cultured red blood cells (cRBC) from hematopoietic stem and progenitor cells (HSPC).
Results/Finding: This erythroid‐differentiation procedure yielded an average of 20, 000‐fold expansion and ∼90% enucleation by day 18 when using mobilized peripheral blood HSPCs as a cell source.
For gene‐modification strategies, purified HSPCs were incubated in erythroid expansion medium for 24 h upon thawing, and then electroporated with ribonucleoprotein (RNP) complexes containing beta‐globin (HBB) and ATP1A1‐directed guide RNAs, along with ssODNs aimed at inserting the sickle cell anemia‐causing mutation (HbS) and ATP1A1's ouabain‐resistance allele. Three days following transfection, ouabain treatment was added, and the differentiation protocol was continued up to day 18. On day 11 of culture, over 60% precise gene modification was obtained at the HBB locus.
Conclusion: In summary, the virus‐free CRISPR‐based editing strategy presented here reached high efficiencies for the desired gene modification in HPSC‐derived cultured RBCs. This proof‐of‐concept paves the way for the modeling of other genetic variants of clinical significance and may help decipher their specific role in physiology and disease.
CTI15
Influence of the Time between Collection and Cryopreservation in the Cellular Viability of UCB Units
Luciana Luppi*, Isa Theodoro, Aline Souza, Dayse Meirelles, Gabrielle Mendes, Telma Campos and Roberto Waddington
Cordvida
Background/Case Studies: Umbilical cord blood (UCB) is a proven source of hematopoietic stem cells for bone marrow transplantation. Several studies have previously shown there is an ideal time interval between the collection and cryopreservation of UCB units.
In Brazil, as a consequence of its vast territory, time required to transport samples from the collection sites (hospitals) to cord blood banks (CBB), can be long. Brazilian legislation allows UCB samples to be cryopreserved up to 48 hours of collection. Objectives: Assess the impact the time interval between collection and cryopreservation has on cell viability of UCB units stored in a CBB.
Study Design/Method: Analysis of 6,194 UCB units collected by 1,233 different healthcare professionals, in 328 hospitals, located in 115 cities, in distances of up to 3,875 km (2,408 miles) from the laboratory, during a five‐year period from 01/01/2012 to 12/31/2016 and cryopreserved at a CBB in S‹o Paulo, Brazil.
All samples were transported under appropriate temperature conditions (4 ‐ 24¡C) and tested negative for microbial contamination (post‐processing). CD34 + cell count and 7‐aminoactinomycin (7‐AAD) cell viability, were performed using flow cytometry.
Cell viability results were analyzed in hourly intervals according to the time elapsed between collection and end of processing, using the Pearson Correlation Factor.
Results/Finding: The longer the time interval between collection and cryopreservation, the lower the cell viability of the UCB units (correlation factor P = ‐0.88).
As the interval increases, the percentage of viable cells shows a progressive reduction: 96.7% from 1:00 to 10:00 hours, 96.4% from 10:00 to 20:00 hours, 95.7% from 20:00 to 30:00 hours, 94.2% from 30:00 to 40:00 hours and 92.7% above 40:00 hours.
Conclusion: Cell viability is increasingly compromised as the time interval between collection and cryopreservation of UCB units is higher, especially after 20 hours of collection.
These results emphasize that, despite the logistical difficulties of transporting a biological material such as UCB in countries with vast territories such as Brazil, units should ideally be processed within 20 hours of collection in order to ensure as many viable cells as possible.
CTI16
Effect of Freezing Bag Fill Volume on the Freezing Curves of Clinical Cell Therapy Products Undergoing Controlled‐Rate Freezing
Cindy R. Stanaway*1, Darin Sumstad1, Diane Kadidlo2 and David H. McKenna1
1M Health, University of Minnesota Medical Center, Fairview, 2University of Minnesota Cancer Center
Background/Case Studies: Hematopoietic progenitor cells are typically cryopreserved using controlled rate freezers (CRF). Recently our lab observed an 8‐9% increase in unacceptable freezing curves i.e., not meeting expected freezing curve parameters. Cryopreservation bag manufacturer (OriGen) recommends a maximum fill volume range but does not suggest an optimal minimum volume. It was theorized that lower than optimal freezing volumes could produce unacceptable freezing curves, and by determining the minimum volume one could lessen the rate of unsatisfactory freezing curves.
Study Design/Method: A retrospective document review was performed on all clinical cell therapy product freezing curves from 12/1/15‐3/24/17. In that timeframe, 240 freezing curves were generated and of those 20 were suboptimal. Nearly all unacceptable curves demonstrated an additional temperature spike prior to the heat of fusion. Many variables were examined for potential cause, including cell type, cell concentration, CRF calibration date, preventative maintenance performed and product volume. All products with unacceptable freezing curves were sampled for viability (acridine orange/propidium iodide) using a frozen tubing segment.
To explore impact of product volume, canisters were measured with a caliper to obtain their depth. Various volumes of water were added to the 250mL and 500mL OriGen CryoStore™ Freezing Bags, 250mL bags were each filled with 50, 60, 70 and 80mL of water; 500mL bags were filled with 90, 110, 130, and 150mL of water. Bags were placed in a press and depths were measured and recorded and the various fill volumes were compared to the depth of the canister.
Results/Finding: The most common factor of the unacceptable freezing curves was a low product volume, as compared to the recommended maximum fill volume. The viabilities on all of the thawed segments were found to be acceptable at >70%.
Conclusion: Fill volume plays a critical role in the ability of the sample probe to make continuous contact with the product bag. If the fill volume is low the bag may not contain sufficient weight to ensure continuous contact with the sample probe, undergoing or appearing to undergo a premature temperature spike during the initial cooling phase of the CRF. By comparing the fill volumes to the depth of the canister it was determined that the minimum depth for the 250mL CryoStore™ bag was 7.8mm (75mL of water) and the minimum depth for the 500mL bag was 8.9‐9.5mm (130‐150mL of water). Based on the data, we established a minimum volume of 70mL for the 250mL CryoStore™ bag and ≥ 135mL for 500mL bags. Since instituting minimum fill volumes, the frequency of suboptimal freezing curves has decreased to <1%.
CTI17
Effect of Higher Nucleated Cell Concentration on Post‐Thaw Viability and Hematopoietic Recovery in Autologous Transplantation
Cherie Nickerson*, Desmond Saisitthidej, Julia York, Andrea Bradford, David Lin, A. Andrea, Devon Steinbacher, Adam Skrzekut, Denise Kirby, Aisa Sasai, Christina Krieg and Rebecca Haley
Bloodworks
Background/Case Studies: The optimal cell concentration of cryopreserved autologous HPC, apheresis products published in the literature is less than 3 × 10^8 nucleated cells (NC) per ml. However, products with higher cell concentrations are more pragmatic for cell processing facilities, and may potentially reduce patient complications related to the total volume of product reinfused.
Study Design/Method: We performed a retrospective analysis of post‐thaw viability, neutrophil recovery, and platelet recovery to compare product and clinical outcomes between patients who received only lower concentration (<3 × 10^8 NC per mL), or only higher concentration (≥3 × 10^8 NC per mL) products. Autologous HPC, apheresis products were collected from 113 consecutive mobilized patients, processed to a fixed final product volume with variable cell concentrations, cryopreserved in 7.5% v/v dimethyl sulfoxide (DMSO) using a controlled rate freezer, and held in vapor phase over liquid nitrogen in monitored storage below ‐150°C.
Results/Finding: All 221 cryopreserved HPC, apheresis products from 66 multiple myeloma patients and 47 lymphoma patients were included in the product outcomes analysis (see Table 1). The median cell concentration was 2.72 × 10^8 NC per mL in the lower concentration group compared to 4.10 × 10^8 NC per mL in the higher concentration group. There were no between‐group differences in the median post‐thaw viability (79% vs. 78%, P=0.49).
All 92 patients included in the clinical outcomes analysis received at least a total of 3 × 10^6 CD34 + cells per kilogram (see Table 1 for exclusions), and there were no between‐group differences in the total CD34 + cells per kilogram reinfused (6.31 vs. 6.12, P=1.00). Using CIBMTR definitions of recovery, the median days to neutrophil recovery (13 vs. 14, P=0.06) and platelet recovery (15 vs. 16, P=0.06) were not different.
Conclusion: The post‐thaw viability, neutrophil recovery, and platelet recovery were not different between patients who received only lower concentration (<3 × 10^8 NC per mL), or only higher concentration (≥3 × 10^8 NC per mL) products. In addition to greater simplicity in cell processing steps, higher cell concentrations in cryopreserved products offer potential benefits (smaller total volume reinfused, and lower total DMSO dose) to patients undergoing autologous transplantation
TABLE 1 (CTI17) Product and clinical outcomes stratified by patients who received only lower cell concentration, or only higher cell concentration autologous HPC, apheresis products
| Outcomes, median (IQR) | Lower Concentration Group (<3 × 10^8 NC per mL) | Higher Concentration Group (≥3 × 10^8 NC per mL) | P‐Value |
|---|---|---|---|
| Product Outcomes | N=44 | N=177 | |
| Cell Concentration (×10^8/ml) | 2.72 (2.17‐2.91) | 4.10 (3.63‐4.61) | <0.001 |
| Post‐thaw viability (%) | 79 (75‐83) | 78 (72‐84) | 0.49 |
| Clinical Outcomes † | N=12 | N=80 | |
| CD34 + cells reinfused (×10^6/kg) | 6.31 (5.30‐7.49) | 6.12 (5.33‐8.54) | 1.00 |
| Neutrophil recovery (days) | 13 (11‐14) | 14 (12‐16) | 0.06 |
| Platelet recovery (days) | 15 (13‐16) | 16 (15‐18) | 0.06 |
† Twenty‐one patients were excluded from the clinical outcomes analysis (6 patients had post‐transplant complications that raised their platelet transfusion threshold above 50 × 10^9 platelets per liter, and 15 patients received a mix of lower and higher cell concentration products).
CTI18
A Safe and Effective Way of Transporting Full Liquid Nitrogen Freezers
Eric Gilles*, David Majewski, Sarah Wittwer, Sainu Owusu‐Afriyie, Matthew Barthel, Dennis A. Gastineau and Eapen K. Jacob
Mayo Clinic
Background/Case Studies: Long term storage of cellular therapy products requires vapor phase liquid nitrogen storage tanks. Due to the indefinite retention of cryopreserved products, the footprint of a large liquid nitrogen (LN2) freezer, and adequate connections to an LN2 supply, space requirements are challenging. To meet the storage demands, an off‐site storage facility was commissioned. The large‐scale transport of cellular therapy products has not been previously described.
Study Design/Method: Case Study
Results/Finding: The primary risks involved with transporting products is damage to frozen products and tanks themselves. The transport of small numbers of products increases the likelihood of warming events as well as the need to handle each product. Overall time for the relocation would be prohibitively increased. Therefore, moving of filled tanks was selected. A trial move of a freezer was performed to assess the effectiveness of all measures taken. A run was mapped out that had smooth roads (absence of potholes, railroad tracks, etc). A custom pallet with air dampened cushions and a hard rubberized surface was made that would offer shock absorption and support the weight of a full LN2 tank. Precision jacks and lifts were used to raise and lower the tank with full control. Masonite sheeting was laid on the tiled hallways for smoother transport. A moving truck with an air suspension system was used for the transport. A fully validated and functioning LN2 tank was filled with 61 frozen products (either mock or deceased patient products). The tank was slowly placed onto the pallet using jacks. It was secured with straps and put into the back of the moving truck. The pallet was secured into place in the truck to ensure it didn't move. The tank was also strapped to the sides of the truck for extra assurance that it wouldn't tip. The move occurred off‐hours (early AM) with a police escort and transport at 5‐8 mph was used to move the tank to the off‐site location.
After the tank relocation, all products were thawed and evaluated for any signs of breakage during the transport. All 61 products remained intact.
Subsequently, 5 tanks have been moved with patient products without incident. Prior to the move of actual products, empty validated backup tanks were prepositioned in the offsite location as a precaution. Representative samples of products were examined from each tank to ensure integrity.
Conclusion: The precautions taken in the plan proved to be a safe and effective way to transport full LN2 tanks with cryopreserved products. The successful transfer of full tanks to an off‐site storage facility will allow for the laboratory to continue to meet patient needs by storing products indefinitely.
CTI19
Mobilization of Hematopoietic Progenitor Cell with G‐CSF Alone or Associated with Chemotherapy Influences Product Cell Content and Transplant Clinical Outcome
Aline C. Garcia‐Silva1, Giuliana M. Dotoli1, Benedito de Pina Almeida Prado Jr.1, Luciana C. Oliveira1, Dimas T. Covas1 and Gil C. De Santis*2
1Center for Cell‐Based Therapy of Ribeirão Preto, University of São Paulo, Brazil, 2Regional Blood Center of Ribeirão Preto, University of São Paulo, Brazil
Background/Case Studies: Autologous hematopoietic progenitor cell (HPC) transplantation requires mobilization of HPC to peripheral blood. Mobilization is performed with the administration of G‐CSF alone (G) or associated with chemotherapy (G/CT). HPC products obtained by these two methods present difference in cell content, which could result in different clinical outcomes, such as hematologic recovery and adverse reactions (AR) to product infusion. This retrospective study aimed to evaluate rates of AR to product infusion according to type of cell mobilization, G‐CSF alone or associated with chemotherapy.
Study Design/Method: A total of 611 patients with lymphoma or multiple myeloma (MM) underwent mobilization and harvesting of HPC for autologous transplantation over the last 15 years, 267 with G and 344 with G/CT (285 of whom underwent transplantation at our institution). The apheresis procedure results in 2 bags (100 mL each), which are cryopreserved with DMSO at 10% and kept in liquid nitrogen container until thawed and infused. The evaluated AR were nausea/vomiting, diarrhea, arrhythmia, dyspnea and neurologic abnormalities (cephalea and encephalopathy) (5 possibilities of AR for each patient) during cell infusion or just after its completion.
Results/Finding: Median (range) age were 54 (46‐60) and 41 (29‐55) years for groups G and G/CT, respectively (p < 0.0001). Peak of CD34 + cells/µL were 16.6 (8.88 – 29.18) and 31.1 (16.15– 71.9) for G and G/CT groups, respectively (p < 0.0001). G products contained a higher number of granulocytes (x 103/µL): 155.2 (113.2–205.1) vs 114.3 (68.31–178.1) (p < 0.0001) and platelets (x 103/µL): 1590 (1010‐2190) vs 392 (209.5‐790) (p < 0.001). G group received a higher dose of DMSO (g/kg): 0.21 (0.14‐0.57) vs 0.17 (0.11‐0.71) (p = 0.012), and an inferior dose of CD34 cells (x 106/kg): 3.28 (2.46‐3.99) vs 3.72 (2.58‐5.48) (p < 0.0001). Hematologic recovery (neutrophil ≥ 500/µL) occurred on day 12 (11‐14) and 11 (10‐12) for G and G/CT groups, respectively (p < 0.0001). AR occurred in 58.27% and 50.94% of patients in groups G and G/CT, respectively (p = 0.234), however, the number of reactions were 132 (in 635 possibilities) and 126 (in 795 possibilities) in G and G/CT groups, respectively (p = 0.016). In patients who received ≥ 2 bags of HPC (similar dose of DMSO) we observed a higher number of AR in G group (122 vs 75, p = 0.02). Female gender was associated with a higher rate of nausea/vomiting (23.84% vs 46.49%. p = 0.0001).
Conclusion: Mobilization of HPC with G‐CSF alone has many advantages, although it results in higher number of unwanted cells such as granulocytes and platelets (and less CD34 cells) in final product, which can explain. at least in part, the higher rate of adverse reactions during cell infusion that was observed. Finally, mobilization with G‐CSF alone results in fewer CD34 cells transplanted and a protracted hematologic recovery.
CTI20
Addition of Plerixafor in Poorly Mobilized Allogeneic Hematopoietic Stem Cell Donors
Lefan Zhuang*, Pudpong Boriboonnangkul, Shirong Wang and Shan Yuan
City of Hope National Medical Center
Background/Case Studies: Peripheral blood stem cells (PBSCs) have become the predominant graft source for adult allogeneic hematopoietic stem cell transplantation (HSCT) in recent years. Granulocyte colony stimulating factor (G‐CSF) is the standard agent for PBSC mobilization. In poorly mobilized autologous donors, plerixafor is often added to improve collection outcomes. Up to 5% of allogeneic donors mobilize poorly with G‐CSF only. In this study we reviewed our experiences with using plerixafor as a rescue agent in poorly mobilized allogeneic donors.
Study Design/Method: We retrospectively examined all allogeneic PBSC collections from January 2013 to March 2018 at our center. Donors received G‐CSF 10 mcg/kg daily for four days before undergoing apheresis collection on Day 5. Collections were performed with the MNC protocol on the COBE Spectra, Optia or Amicus apheresis instruments, and 18‐20 liters of blood were processed over 6 hours. The goal of collection was 4.0x10⁶ CD34 + cells/kg recipient weight. Plerixafor was added based on poor CD34 + cell collection yield after the first or second collection day.
Results/Finding: Of the 851 allogeneic donors, 10 (1.2%) received one dose of plerixafor in addition to G‐CSF on the first (8) or the second (2) day of collection due to poor collection yield. Plerixafor was well tolerated in all donors without significant adverse reactions. The CD34 + cell yield before plerixafor ranged from 0.79 and 2.75 (median of 2.0) ×106 CD34 + cells/kg recipient weight. After plerixafor there was a 129% to 713% (median of 333%) increase in CD34 + yield from the previous day. The collection total ranged from 3.72 to 10.69 (median of 6.88) ×106 CD34 + cells/kg recipient weight, and a median of 72.9% (range: 56.2% ‐ 87.7%) of total CD34 + cells collected were due to plerixafor.
Conclusion: In poorly mobilized allogeneic donors, plerixafor can be added as an effective rescue agent to achieve the collection goal and may decrease the number of donation days.
(CTI20)
| CD34 + cell yield ×106/ kg recipient weight | ||||||||||
|---|---|---|---|---|---|---|---|---|---|---|
| Donor | Donor Age | Donor Gender | Donor Health Issues | Donor weight (kg) | Recipient weight (kg) | Pre Plerixafor | Post Plerixafor | Total yield | x fold increase after plerixafor | Percentage of total CD34 + cell yield collected with plerixafor |
| 1 | 28 | M | Sickle cell trait | 57.7 | 95.3 | 0.79 | 2.93 | 3.72 | 3.71 | 78.8% |
| 2 | 36 | F | None | 56.0 | 64.5 | 1.67* | 3.94 | 5.61 | 2.36 | 70.2% |
| 3 | 72 | M | Prostate cancer, psoriasis, subarachnoid hemorrhage, hypertension, embolic stroke | 83.2 | 75.4 | 2.62* | 4.36 | 6.98 | 1.66 | 62.5% |
| 4 | 59 | F | None | 57.4 | 67.6 | 2.19 | 4.71 | 6.90 | 2.15 | 68.3% |
| 5 | 71 | M | Coronary artery disease, hypertension, diabetes mellitus type 2 | 72.1 | 82.3 | 2.75 | 7.94 | 10.69 | 2.89 | 74.3% |
| 6 | 59 | M | Hypertension, diabetes mellitus type 2 | 93.5 | 71.0 | 1.95 | 4.90 | 6.85 | 2.51 | 71.5% |
| 7 | 50 | F | None | 69.1 | 75.0 | 2.03 | 5.97 | 8.00 | 2.94 | 74.6% |
| 8 | 23 | M | None | 59.1 | 99.3 | 1.97 | 7.85 | 9.82 | 3.98 | 79.9% |
| 9 | 59 | F | None | 63.0 | 71.1 | 2.07 | 2.66 | 4.73 | 1.29 | 56.2% |
| 10 | 49 | F | None | 51.0 | 57.8 | 0.82 | 5.85 | 6.67 | 7.13 | 87.7% |
* collected over 2 days
CTI21
Engraftment Outcome with Autologous Hematopoietic Stem Cell Collection When Peripheral CD34 Count Is Too Low to Report
Wen Lu*, Carol Dumont, Sheila Serafino, Debbi Katanik and Priscilla I. Figueroa
Cleveland Clinic
Background/Case Studies: A minimum dose of 2 × 10^6/kg CD34 + cells is desired for autologous hematopoietic stem cell (HPC) transplantation to treat hematopoietic malignancies. The yield of CD34 + cells obtained by apheresis collection is largely predicted by peripheral blood CD34 + concentration (PCD34). Therefore, a common standard for proceeding with apheresis is a PCD34 of ≥ 20/uL as determined by flow cytometry (flow). By this criteria, some autologous HPC transplant candidates may be disqualified on the basis of poor anticipated collection yields. The goal of this study is to determine if alternative treatment options are not available and PCD34 is too low to report, should these patients still proceed to apheresis collection and transplant. Namely, can the minimum dose of CD34 + cells be obtained? If so, how many collections are required? Additionally, does the numerous number of collections have a negative impact on engraftment?
Study Design/Method: Patients (n=54) with PCD34 too low to accurately report by flow (initial cutoff < 0.02%, changed to < 0.04%) using the International Society of Hematotherapy and Graft Engineering protocol were included in the study. Retrospective review of apheresis, laboratory, and electronic medical records was performed to collect data including diagnosis, number of patients who proceeded to transplant, mobilization regimen, number of collection attempts, number of apheresis procedures, apheresis method, CD34 dose collected and infused, neutrophil and platelet engraftment.
Results/Finding: Patient diagnosis included non‐Hodgkin's lymphoma (37%), diffuse large B‐cell lymphoma (13%), multiple myeloma (13%), Hodgkin's lymphoma (11%), amyloidosis (9%), mantle cell lymphoma (7%), plasma cell leukemia (2%), Burkitt's lymphoma (2%), peripheral T‐cell lymphoma (2%), primitive neuroectodermal tumor (2%), and germ cell tumor (2%). Almost all patients (n=51, 94%) were mobilized with neupogen and plerixafor (N/P). The Spectra Optia® was used to collect and process 3 blood volumes in 49 (91%) patients. Of the 8 (15%) patients who did not proceed to transplant, 6/8 (75%) were not transplanted because the minimum dose of 2 × 10^6/kg CD34 + cells could not be collected. All 6 patients were mobilized with N/P, and 2 attempts to collect after rest were made in 5/6 cases. These 6 patients underwent a mean of 4 apheresis procedures (range 3‐6) and collected a mean of 0.91 × 10^6/kg CD34 + cells (range 0‐1.90 × 10^6/kg). Of the 46 (85%) patients who did proceed to transplant, 11 (24%) required > 1 collection attempts. A mean of 4 apheresis procedures (range 1‐9) were required to collect ≥2 × 10^6/kg CD34 + cells. The mean CD34 dose collected was 3.79 × 10^6/kg (range 2.05‐7.04×10^6/kg) and the mean CD34 dose infused was 3.65 × 10^6/kg (range 2.01‐7.04×10^6/kg). There were no incidents of delayed neutrophil engraftment (≤15 days). One (2%) patient demonstrated delayed platelet engraftment (≥30 days) and one (2%) patient failed to engraft platelets.
Conclusion: Despite a PCD34 too low to report by flow, 85% of patients were able to collect ≥2 × 10^6/kg CD34 + cells after a mean of 4 apheresis collections and proceed to transplant. There were no cases of delayed neutrophil engraftment, and only infrequent cases of delayed or failed platelet engraftment. Therefore, disqualifying patients with no other treatment options from HPC transplant based on low PCD34 alone may deny patients of life prolonging or lifesaving therapy.
CTI22
Validation of a Simple Prediction Algorithm and an MNC‐Guided Collection Flow Rate for Hematopoietic Progenitor Cell Collection in Allogeneic Donors
Elizabeth A. Godbey*, Stephanie Dormesy, Bruce S. Sachais and Patricia Shi
New York Blood Center
Background/Case Studies: Many transplant centers still process a fixed number of liters or total blood volumes for hematopoietic progenitor cell collection. Prediction algorithms to achieve target CD34 dose have been validated, primarily in autologous donors, but not widely adopted, perhaps due to ease of use. We thus validated in allogeneic donors a simple prediction algorithm, based on our center‐specific 25th percentile CD34 collection efficiency (CE), to directly calculate the number of liters to achieve CD34 target. Because CD34 CE is reported lower in allogeneic versus autologous donors, we also tested whether using the Cobe Spectra CFR tool, based on pre‐apheresis MNC count, results in higher CD34 CEs compared to historical controls collected at a standard 1‐1.5 ml/min.
Study Design/Method: This retrospective, single‐center analysis analyzed 96 allogeneic donors (93 NMDP, 3 related) collected with the Cobe Spectra MNC (n=55) or the Spectra Optia CMNC (n=41) procedures from Jan 2017 to Feb 2018. Peripheral blood CD34 counts drawn 0‐1 hr pre‐apheresis were used to calculate rounded‐up liters to process as follows: (total target product CD34 (× 106)) / (pre‐CD34 per ul × 0.4). Because the actual/predicted liters to process varied (median 1.0, mean 1.2 ± 0.51), the actual CD34 dose collected was adjusted as follows: (actual total product CD34 × 106)/ (actual volume processed/predicted volume to process). CD34 CE using the MNC‐guided Cobe CFR tool was compared to NMDP historical controls (n=57) collected with the Cobe Spectra MNC procedure with a fixed CFR of 1‐1.5 ml/min.
Results/Finding: The adjusted CD34 dose achieved the target goal in 92% (88 of 96) of patients processing a median 2.5 donor TBV (range 1.1‐6.2). The adjusted CD34 dose was a median 1.30 (range 0.85‐2.19) and mean 1.37 (SD 0.28) times the predicted CD34 dose. The correlation between adjusted and target total CD34 was 0.79, due to variation in CD34 CE, evident by the 0.97 correlation between CD34 CE and adjusted/target CD34 ratio. The table shows CFR‐relevant data. Weak correlations between CFR and 1) product granulocyte % (r=0.30) and 2) platelet CE1 (r=0.45) were seen, but their means were similar to those previously reported in allogeneic donors with a mean 1.5 TBV processed (Cancelas JA, Transfusion 2016).
Conclusion: Our easy to use prediction algorithm using a conservative CE for volume to process may achieve a higher percent of collections reaching target CD34 dose compared to prediction algorithms based on regression analysis (Leberfinger, Transfusion 2017). Using an MNC‐guided rather than fixed CFR may increase CD34 CE.
(CTI22)
| Study population | Correlation of pre‐MNC and CD34 CE | Median CFR | CD34 CE (%) by PB MNC quartile | Median product Hct (%) | Mean product % granulocyte | Mean platelet CE1 | |||||
|---|---|---|---|---|---|---|---|---|---|---|---|
| Q1 | Q2 | Q3 | Q4 | Cobe | Optia | Cobe | Optia | ||||
| Adjusted CFR (current cohort) | 0.1 | 1.7 | 50 | 49 | 52 | 51 | 8.1 | 25.7 ± 12.7 | 16.6 ± 8.7 | 32.9 ± 5.6 | 26.0 ± 8.4 |
| Fixed CFR (historical cohort) | ‐0.41 | 1.3 | 61 | 60 | 52 | 48 | 9.3 | NA | NA | ||
CTI23
Pediatric CMNC Protocol for Peripheral Blood Stem Cell Collections
Jenna Wade*1, Alisa Moore2, Marie Beckley2, Margo Rollins2, Cassandra D. Josephson1 and Ross M. Fasano1
1Emory University School of Medicine, 2Children's Healthcare of Atlanta
Background/Case Studies: Continuous mononuclear cell collection (CNMC) is an FDA‐approved method of peripheral blood stem cell (PBSC) collection using the Spectra Optia (Terumo BCT) that has been shown to result in comparable to slightly improved collection efficiency (CE) and smaller product volumes compared to the MNC collection method on the Optia in adult populations. However the CMNC method has not been well studied in smaller pediatric patients. This study aimed to review our institution's PBSC collection experience in pediatric patients using the CMNC method.
Study Design/Method: A retrospective review of data from autologous collection procedures performed on patients ≤ 40kg at a pediatric hospital from April 2017 to March 2018 using a CMNC protocol were examined. Patient demographic data, mobilization characteristics, pre‐and post‐procedure laboratory values, procedure details, PBSC product characteristics, and procedure‐related adverse reactions (hypocalcemia, access complications, hypotension/hypertension, and transfusion reactions), were included in the review.
Results/Finding: Twenty‐four autologous collections were performed in 20 patients (mean weight: 15.9kg, range 7.7‐34.9 kg) with neuroblastoma (NBL) or central nervous system (CNS) neoplasms (19 NBL, 5 CNS). All patients were mobilized with daily 10 mcg/kg GSCF following chemotherapy. Plerixafor was administered 12‐16 hours prior to 3 collection procedures. Pre‐ and post‐procedure lab values were: mean pre‐hematocrit (Hct) 29.2% (range 22.3‐37.1), post‐Hct 27.9% (range 21.9‐35.6); mean pre‐platelet count 87.4K/μL (range 37‐228), post‐platelet count 47.2K/μL (range 21‐71); mean pre‐WBC 17.1K/μL (range 2.48‐59.1), post‐WBC 13.5 (range 2.7‐37.6). Eighteen (90%) patients received red blood cell primes. The mean AC infusion rate for collections was 1.7 mL/min/TBV (range 1.0‐2.0) with a mean inlet rate of 23.4 mL/min (range 14.0‐45), whole blood (WB) to AC ratio of 12:1, and mean collection flow rate of 1.0 mL/min (range 0.6‐1.3). The mean procedure length was 202 min (range 90‐459), with 4.0 blood volumes processed (range 1.3‐9.3), Four of 20 patients (3 NBL, 1 CNS) required 2 collection days. Mean CE1 and CE2 were 66.2% (range 28.9 to > 100%) and 57.1% (range 17.5 to > 100%) respectively. Three of the 4 procedures with CE2 < 30% had collection flow rates <0.9 mL/min; 1 procedure was associated with a missed GCSF dose the day prior to collection. The mean final product CD34 count was 46.9x10^6/kg (range 5.0‐118.2) with Hct 3.5% (range 2.5‐5.0) in a volume of 196 mL (range 80‐453). The target dose was achieved in 90% of patients. The procedures were tolerated with only 3 (12.5%) reports of asymptomatic hypocalcemia, which resolved with titration of IV calcium, and 1 (4.2%) CVL access complication.
Conclusion: The CMNC method is an efficient and safe method of PBSC collection in the pediatric population under 40 kg.
CTI24
A New Flow Cytometry Approach to Assess Cord Blood Unit Potency
Carl Simard*1, Diane Fournier2 and Sonia Néron1
1Héma‐Québec, Medical Affairs and Innovation, 2Héma‐Québec Cord Blood Bank
Background/Case Studies: Regenerative potential of cord blood units (CBU) must be determined on a representative sample of the cryopreserved product before release to the transplant center. Most of the cord blood banks measure potency by using a colony‐forming unit culture method (CFU), which delays the release of CBU by 7 to 14 days. To accelerate the distribution process of CBU, we developed a rapid method, based on the measurement of the response of CD34 + cells to interleukin‐3 (IL‐3). This IL‐3 test is based on flow cytometry measurement of STAT5 phosphorylation on tyrosine‐694 within CD34 + cells. Our IL‐3 test was compared to the CFU method, currently considered as the gold standard, as well as the aldehyde dehydrogenase (ALDH) enzyme‐based assay.
Study Design/Method: Ten cryopreserved CBU, aliquoted in tubes, were thawed following standard operating procedures (SOP) and analyzed for their content in CD34 + and CD45 + viable cells using the ISHAGE protocol. The ECLONE, a ratio of CBU numbers on pre‐freezing CD34 cell numbers, and the proportions of ALDHBright cells and IL‐3 ‐ responsive CD34 + cells (IL‐3 test), were determined for each CBU. We used samples stored for 24 hours at room temperature (RT) post‐thawing to simulate an extreme warming case scenario, as well as a milder warming event by storing samples for 2‐5 days at ‐80°C before thawing. We also compared the potency in segments, tubes and bags from five CBU using the CFU and IL‐3 tests.
Results/Finding: The IL‐3 test was accurate when analyzing samples handled following SOP or subjected to 24h RT warming events (Table 1). Based on these results, we established an acceptability threshold of 55% of IL‐3 ‐ responsive CD34 + cells. The IL‐3 test was the most sensitive to identify CBU subjected to warming events, identifying seven out of ten samples stored at ‐80°C, and all samples subjected to RT storage. Intra‐assay performance was reproducible, with a CV of 8.0%. Segments and tubes showed mean differences of 7.0% and ‐1.5%, respectively, with their respective bags. These differences were not deemed significant, being inferior to intra‐assay precision.
TABLE 1 Number of correctly identified samples (n = 10 for each condition)
| Samples | CD45 + Cell Viability | ALDH | ECLONE | IL‐3 |
|---|---|---|---|---|
| SOP‐processed | 10 | 9 | 10 | 10 |
| 24h RT storage | 4 | 7 | 10 | 10 |
| ‐80°C storage | 0 | 4 | 5 | 7 |
Conclusion: Our new method for determining CBU potency is rapid, unbiased, and robust. The IL‐3 and CLONE tests performed better than ALDH and viability tests at identifying samples subjected to warming events. The IL‐3 test is sensitive and accurate. Moreover, the ease of gating CD34 + cells responsive to IL‐3 is an asset for routine qualification of CBU. The IL‐3 test described herein fulfills the requirements for a validation, and we intend to implement this method in our cord blood bank facility.
CTI25
An Interactive Web‐Based Application for Distributing Cord Blood Units for Research
Dan Zamfir*, Michal Tarnawski, Tracy Zhu, Kristy Andrade, Ludy Dobrila, Maria S. Albano, Pablo Rubinstein and Andromachi Scaradavou
National Cord Blood Program, New York Blood Center
Background/Case Studies: Cord Blood Units (CBUs) that do not meet criteria for clinical use are valuable for a large number of basic and pre‐clinical research applications.
Study Design/Method: Our public Cord Blood Bank (CBB) clinical inventory has currently more than 60,000 CBUs, and has distributed over 5,800 clinical grafts for transplantation worldwide. In addition, the CBB has provided over 40,000 research CBUs to academic institutions, research laboratories and the industry. In all cases, research CBUs are provided without identifiers, and with mother's IRB‐approved consent. The exchange of scientific, technical and logistical information between investigators and the CBB was managed predominantly via email, however, this approach is time‐consuming for all parties, and may be associated with unnecessary delays. To improve communications and expedite the acquisition of CBUs with the specific characteristics required for the various laboratory studies, the CBB has established an efficient web‐based application (WebResearch) to support the distribution of research CBUs.
Results/Finding: The CBB WebResearch facilitates transactions such as: ordering research CBUs, providing automatic real time email confirmations/notifications, uploading shipping documents, checking order status, tracking shipping information, allowing users to search for previous orders using various fields and print/upload reports of orders, etc., with bidirectional flow of communication. The CBUs provided for research can be: a) fresh, unprocessed, non‐clinical grade units within 48 hours from collection, with limited information and no infectious disease testing, or b) frozen CBUs that have undergone volume‐reduction, cryopreservation and storage in liquid Nitrogen, but do not meet criteria for clinical use. For those, an array of data may be available such as blood counts, flow cytometry data, bacteriology results, hemoglobin phenotypes, HLA typing, maternal infectious disease markers and blood group types.
Since its implementation in August 2017, 30 new research accounts have been opened for a current total of 156 participating laboratory affiliations worldwide (academic and commercial) and 530 transactions were recorded, which have resulted in the distribution of 1,601 CBUs (fresh and frozen). These units were opportunely received for use in basic research and development projects, pre‐clinical trials, stem cell expansion studies or for validation procedures and GMP monitoring. The system is interactive and user‐friendly, and can be expanded to include additional functions, at users’ request.
Conclusion: Our CBB WebResearch enables investigators to request the most suitable CBUs for their specific laboratory studies and offers an efficient, easy‐to‐use interface to streamline ordering and distribution of research CBUs.
CTI26
Variations in Novel Cellular Therapy Products Manufacturing
Magali J. Fontaine*1, Eileen Selogie2, David F. Stroncek3, David H. McKenna4, Zbigniew M. Szczepiorkowski5 and Jo‐Anna Reems6
1University of Maryland School of Medicine, 2ENet Answers Consulting, 3National Institutes of Health, 4University of Minnesota, 5Dartmouth‐Hitchcock Medical Center, 6University of Utah
Background/Case Studies: At the frontier of transfusion medicine and transplantation, the field of Cellular Therapy (CT) is emerging. Most novel CT products are produced under investigation with no clear standardization across Cell Processing Centers. Across institutions the manufacturing protocols may vary depending on the type of CT product. The purpose of this study was to uncover any variations in manufacturing practices for similar CT products across different Cellular Processing Laboratories in institutions worldwide.
Study Design/Method: An Exploratory survey to identify variations in manufacturing practices in novel CT products was designed and sent to Cellular Processing Laboratory Directors worldwide. The questionnaire focused first, on the processing methods used with regards to the type of CT being processed and also on five stages of the processing event: 1. collection, 2. purification, 3. in vitro expansion, 4. freezing and storage, and 5. thawing and washing. Secondly, the questionnaire focused on the level of environmental monitoring (EM) used for each CT product.
Results/Finding: Out of 67 respondents to the survey, 56 had a Cellular Processing Laboratory. Thirty‐one processed products under an investigational label, for either Phase I/II (n=27) or Phase III (n=17) clinical trials. HPC products, from peripheral blood (PB), bone marrow (BM), or cord blood (CB) were the most commonly processed by 75 % of the respondents. Lymphocytes (L) were the most commonly non‐HPC products and handled under all five processing stages (i.e. 18 facilities). Similarly, facilities handling dendritic cells (DCs) (n=9), natural killer (NK) cells (n=8), and/or mesenchymal stromal cells (MSCs) (n=13) processed these products under all five processing stages. A minority of centers (<5) processed pancreatic islet cells (n=4), neural cells (n=3) and iPSCs (n=2). Purification methods varied for each type of product and by institutions (n) (Table 1). The EM, used for each CT product, is shown in Table 2.
TABLE 1 (CTI26)
| Purification Method | L n=10 | DCs n=3 | NK n=7 | BM n=6 | HPC PB n=12 | CB n=4 | MSCs n=4 |
|---|---|---|---|---|---|---|---|
| Elutriation | 0 | 1 (33%) | 2 (28%) | 0 | 1 (8%) | 0 | 0 |
| Ficoll | 4 (40%) | 1 (33%) | 2 (28%) | 2 (33%) | 0 | 1 (25%) | 1 (25%) |
| Magnetic bead | 5 (50%) | 0 | 3 (43%) | 3 (50%) | 10 (83%) | 2 (50%) | 0 |
| Other | 1 (10%) | 1 (33%) | 0 | 1 (17%) | 1 (8%) | 1 (25%) | 3 (75%) |
TABLE 2 (CTI26)
| EM | L n=3 | DC s n=6 | NK n=4 | HPC BM n=14 | HPC PB n=15 | HPC CB n=15 | MSCs n=9 |
|---|---|---|---|---|---|---|---|
| Class 100 | 3 (20%) | 0 | 1 (25%) | 10% | 1 (7%) | 1 (7%) | 1 (11%) |
| Class 1000 | 3 (20%) | 3 (50%) | 0 | 10% | 2 (13%) | 2 (13%) | 2 (22%) |
| Class 10,000 | 7 (47%) | 33% | 2 (50%) | 20% | 4 (27%) | 5 (33%) | 4 (44%) |
| BSC[Link] | 0 | 17% | 1 (25%) | 20% | 3 (20%) | 1 (7%) | 1 (11%) |
| BSC | 2 (13%) | 0 | 0 | 40% | 5 (33%) | 6 (40%) | 11% |
BSC: Biosafety Cabinet; *in space monitored with particle count:
Conclusion: This exploratory survey shows a wide variation in CT manufacturing practices across different Cellular Processing Laboratories. A better understanding of the effect of these variations on the quality of these CT products will be important for further novel CT development.
CTI27
Effect of Temperature and Time on Hematopoietic Stem Cell Post‐Thaw Viability
Elizabeth A. Godbey*1, Shawn Desince2, Nita Patel2, Shanlong Jiang2 and Yvette C. Tanhehco1
1Columbia University Irving Medical Center, 2New York‐Presbyterian Hospital
Background/Case Studies: To determine the effects of temperature and time on total cell viability of hematopoietic stem cell (HSC) products cryopreserved in 7.5% DMSO after thawing.
Study Design/Method: HSC product quality control (QC) vials from 9 deceased autologous donors whose HSC products were cryopreserved in 7.5% DMSO between 2007 and 2017 were obtained and thawed. Demographic information including age at donation, gender, diagnosis, pre‐freeze viability, and length of cryopreservation were collected. One vial from each donor was stored at 4°C and room temperature (RT, ∼18‐25°C) for up to 96 hours after thawing at 37°C. Total cell viability was measured using trypan blue dye exclusion assay at 0, 1, 2, 3, 4, 5, 6, 7, 8, 24, 48, 72, and 96 hours after thaw. A repeated measures ANOVA and Bonferroni posttests were performed using Graphpad Prism v5.0 to determine the effect of temperature and time on post‐thaw viability of HSCs.
Results/Finding: The mean age at HSC collection was 56 years, 67% of donors were female, and the mean product cryopreservation duration was 5 years. Eighteen vials from 9 donors (2 vials/donor) were thawed for paired viability measurements at 4°C and RT 0‐96 hours post‐thaw. The interaction between temperature and time was statistically significant (p=0.0088) indicating that time does not have the same effect on total cell viability at both temperatures. Time (p<0.0001) but not temperature (p=0.19) was found to significantly affect total cell viability post‐thaw. Mean post‐thaw viabilities for cells stored at 4°C and RT declined over time (Table 1). The matching effectiveness was statistically significant (p<0.0001). No statistically significant differences were found in the mean viabilities for cells at each time point. The mean immediate (0 hour) post‐thaw cell viability at 4°C and RT (70% vs 69%, p>0.05) met our acceptability criteria for post‐thaw viability of ³60%. Cells stored at 4°C for up to 1 hour retained a viability (62%) greater than our acceptability criteria but cells stored at RT for up to 1 hour did not (viability of 57%).
Conclusion: Total cell viability of HSC products decreases over time after thawing when stored at both 4°C and RT with a more rapid decline at RT. Storage at 4°C up to one hour post‐thaw is recommended if patient infusion is delayed.
TABLE 1 Mean Total Cell Viabilities of HSC Products Post‐Thaw
| Time (hours) | 4°C | RT | P value |
|---|---|---|---|
| 0 | 70.00 | 68.67 | p>0.05 |
| 1 | 62.44 | 57.00 | p>0.05 |
| 2 | 58.89 | 47.11 | p>0.05 |
| 3 | 59.67 | 49.89 | p>0.05 |
| 4 | 54.89 | 42.89 | p>0.05 |
| 5 | 55.22 | 46.33 | p>0.05 |
| 6 | 57.78 | 41.67 | p>0.05 |
| 7 | 54.22 | 45.22 | p>0.05 |
| 8 | 50.22 | 45.33 | p>0.05 |
| 24 | 42.44 | 42.33 | p>0.05 |
| 48 | 42.44 | 39.67 | p>0.05 |
| 72 | 37.00 | 36.00 | p>0.05 |
| 96 | 23.56 | 25.33 | p>0.05 |
CTI28
Evolving Mobilization Regimens in Hematopoietic Progenitor Stem Cell Transplant Patients: An Impact / Cost Analysis
Erin T. Pins*1, Nicole Roggeman2, Amanda King2 and Robin Larson2
1ACL Laboratories / Advocate Healthcare, 2Advocate Lutheran General Hospital
Background/Case Studies: One of the major challenges in Laboratory Medicine is addressing the evolving needs of the patient's that we serve. These needs are increasingly met with limited resources. In the Hematopoietic Progenitor Stem cell Transplant Patient (HPSCT) population, mobilization regimens (drugs that increase the availability of stem cells for apheresis) have evolved. We subjectively felt that the use of new mobilization regimens resulted in increases in the required numbers of collections per patient resulting in increased technologist effort, increased usage of flow cytometry (specifically, donor pre‐apheresis and apheresis product CD34 quantification), and increasing processing and reagent requirements. The purpose of this study was to provide objective data regarding the impact of evolving mobilization regimens on Blood Transfusion Service resources.
Study Design/Method: We reviewed patient's medical records and Blood Transfusion Service records, including apheresis, processing and flow cytometry records. We documented mobilization regimens, required numbers of collections, total cells per collection, (total cells per kilogram body weight), and concentration (cells per microliter) of CD34 positive cells. Data on all patient's were collected for three years: 2015 (n = 21), 2016 (n = 22) and 2017 (n = 44). Cost analysis was performed by simply extrapolating cost of technologist time, processing / supply costs and flow cytometry costs. The cost analysis did not include intangibles such as potential technologist overtime, potential greater requirement for storage space, etc
Results/Finding: The mobilization regimens varied from G‐CSF/Mozobil (34 patients), Neupogen alone (20 patients), Neupogen/Mozobil (15 patients), Zarixo/Mozobil (4 patients), G‐CSF alone (3 patients), unknown (3 patients), RICE/G‐CSF/Mozobil (2 patients), RICE alone (2 patient's), Mozobil alone (1 patient), Granix alone (1 patient) ICE/G‐CSF (1 patient) and Zarixo alone (1 patient). Use of Neupogen alone or in combination steadily increased from 2015 (19%), 2016 (27%) to 2017 (57%). Average numbers of collections (clinically determined by total cells collected and CD34 positive cells collected) per patient gradually increased from 1.29 (2015) to 1.36 (2016) to 1.61 (2017). A cost analysis comparing 2015 to 2017 suggests the following increased costs: Personnel cost (n = 44 patients), $519.58 per HPSCT patient; flow cytometry cost, $116.59 per HPSCT patient; and processing / reagent cost, $318.57 per HPSCT patient for a total average increase of $954.74 per HPSCT patient.
Conclusion: Evolving mobilization regimens are just one of many examples of how changes in standard of care impact upon increasingly limited laboratory resources. In our HPSCT patients, increased numbers of collections per patient parallel the increasing use of Neupogen in isolation or in combination. Every additional collection requires additional technologist time, flow cytometry usage, and processing / supply resources. This objective, conservative (does not include intagible costs) estimate of increased cost (total, average $954.74 per HPSCT patient) related to evolving mobilization regimens can be useful data to justify increased hospital administrative support.
CTI29
Comparison of Two Apheresis Systems for Hematopoietic Progenitor Cell (HPC) Collection for Multiple Myeloma at Our Center
Edwin A. Burgstaler* and Jeffrey L. Winters
Mayo Clinic
Background/Case Studies: To address the assumption that one device reached collection targets more quickly, we performed a comparison of hematopoietic (HPC) collections on the Optia (O) and Amicus (A) with similar multiple myeloma patients.
Study Design/Method: The number of collections to reach target (3, 6, or 9 x10⁶/Kg); CD34 + and lymphocyte (LYM) yields; LYM collection efficiency 2; WBC, granulocyte (Gran), RBC, and PLT content; and citrate toxicity were compared. Mobilization consisted of both G‐CSF (G) or G‐CSF + plerixafor (G+Pl) mobilization. Consecutive procedures were examined. Pre CD34 + counts were not available. The CMNC technique was used on the O. For all collections, the endpoint was 5 hours and a heparin/ACD‐A anticoagulant was used (when possible). Starting inlet flow rates were 65, 85, or 90 mL/min. The Mann‐Whitney and Chi Square tests were used for statistical comparison, p < 0.05 considered significant.
Results/Finding: There were 53 collections (42 patients) for the O and 53 collections (52 patients) for the A. O had 21 first collections and A had 52. Collection targets were: (O/A): 6/4 three, 18/26 six, and 29/23 nine. Significant differences were: mean inlet rates (O/A) 77/67 mL/min, whole blood processed (23/19 L) and anticoagulant used (1015/787 mL). Significant differences in pre counts (O/A) were: Lym 3.2/4.3, PLT 151/195 x109/L, and HCT 35/38%. See table for collections/target. Considering median yields/collection, there was not a significant difference in CD34+, LYM, or WBC yield: (O/A) 426/472x106, 26/27x109,75/65x109, respectively. There was a significant difference in LYM CE2, Gran, PLT, RBC content, and calcium doses: (O/A) 51/42%, 10/14x109, 4.4/1.7x1011, 6/10 mL, 36/14 doses, respectively.
Conclusion: Of the 53 collections, O achieved target in one collection 16 times vs A 15; 1 or 2 collections 33 times vs A 43 times. CD34+, LYM, and WBC yields were equivalent. O had better LYM CE2, RBC, and Gran content, but significantly higher PLT loss and citrate toxicity. Optia was not superior to Amicus in HPC collections for multiple myeloma patients in our center.
TABLE 1 Number of Collections/Target
| Inst. /Target (Mobilization) | 1 (% of Total) | 2 (% of Total) | 3 (% of Total) | ≥4 (% of Total) |
|---|---|---|---|---|
| O/3 (T/P) | 50/67 | 17/33 | 33/0 | 0/0 |
| A/3 (T/P) | 100/100 | 0/0 | 0/0 | 0/0 |
| O/6 (T/P) | 44/38 | 28/31 | 11/8 | 17/23 |
| A/6 (T/P) | 38/41 | 46/41 | 4/4 | 12/14 |
| O/9 (T/P) | 17/20 | 38/45 | 14/10 | 31/25 |
| A/9 (T/P) | 4/8 | 70/77 | 13/8 | 13/7 |
Target = ×106/Kg, T = all mobilizations, P = only G‐CSF + plerixafor
CTI30
Mobilization and Harvesting of Hematopoietic Progenitor Cells in Autoimmune Diseases
Gil C. De Santis*1, Benedito de Pina Almeida Prado Jr.2, Giuliana M. Dotoli2, Juliana Bernardes Elias Dias3, Belinda Pinto Simões3, Maria Carolina de Oliveira Rodrigues4 and Dimas T. Covas5
1Regional Blood Center of Ribeirão Preto, University of São Paulo, Brazil, 2Center for Cell‐Based Therapy of Ribeirão Preto, University of São Paulo, Brazil, 3Bone Marrow Transplantation Unit, Hospital das Clínicas, School of Medicine, University of São Paulo, Ribeirão Preto, Brazil, 4Department of Internal Medicine, School of Medicine, University of São Paulo, Ribeirão Preto, Brazil, 5Department of Internal Medicine, School of Medicine, University of São Paulo, Ribeirão Preto, Brazil
Background/Case Studies: Autologous hematopoietic progenitor cell (HPC) transplantation is indicated for patients with severe autoimmune diseases (AID) unresponsive to conventional therapy. This treatment aims to ablate auto‐reactive clones of T and B cells, allowing the regeneration of a new and tolerant immune system. Mobilization and harvesting of HPC from the peripheral blood is an essential part of this therapy. HPC mobilization includes administration of granulocyte colony‐stimulating factor (G‐CSF), alone or in combination with chemotherapy, aiming to harvest at least 2.0 × 10⁶ CD34+ cells/Kg. This retrospective study had the purpose to analyze the mobilization characteristics according to each specific AID.
Study Design/Method: A total of 193 patients were enrolled: Multiple sclerosis (MS) 101; Systemic sclerosis (SSc) 83; and Systemic lupus erythematosus (SLE) 9. CD34+ cells were mobilized with cyclophosphamide (Cy 2 g/m2) associated with a median (range) G‐CSF dose of 9.4 (4.9‐12.5) µg/Kg/day, initiated on the day following Cy administration and continued daily until cell harvesting. Autoimmune disease groups were not different for G‐CSF dose. Harvesting was initiated when peripheral blood CD34+ cell counts reached a minimum of 10/mL. One patient with SLE failed to mobilize. Aphereses were performed using the cell separator COBE Spectra (Caridian BCTÔ, Lakewood, CO, USA). Collected HPC products were cryopreserved in a solution with dimethyl sulphoxide at 10%. Cell bags were placed into metallic racks and inserted into a ‐80 ºC freezer, where they were kept until thawed and infused, one to three months later.
Results/Finding: Results were given as median (range). At harvesting, peripheral blood CD34 + cells/µL were: 73.61 (12.6‐344.3), 62.01 (4.5‐299.0), and 34.1 (21.34‐79.40), for MS, SSc, and SLE, respectively (p = 0.0176; MS vs SLE*). Total amount of CD34 + cells collected were: 8.02 (1.64‐36.23) × 106/kg, 7.17 (2.74‐64.38) × 106/kg, and 3.77 (3.04‐12.61) × 106/kg for MS, SSc, and SLE, respectively (p = 0.0137, MS vs SLE*). Neutrophil recovery took place on day 9 (7‐19), 10 (9‐15), and 11.5 (9‐13) for MS, SSc, and SLE, respectively (p < 0.001, MS vs SSc***, MS vs SLE**). HPC were harvested on day 8 (7‐11), 8 (7.5‐12), and 9 (8‐11) of mobilization for MS, SSc, and SLE, respectively (p = 0.011, MS vs SLE**, SSc vs SLE*). Blood volumes processed were not different between AID groups. Most patients underwent a single session of apheresis, however 4 (50%) SLE, 1 (1%) MS and 5 (6%) SSc patients required 2 days (MS vs SLE: p < 0.001; SSc vs SLE: p = 0.0015).
Conclusion: Patients with AID are efficient HPC mobilizers under the G‐CSF plus 2g/m2 cyclophosphamide regimen. Patients with SLE yield a lower number of mobilized HPC, and thus a lower number of collected CD34+ cells, than those with MS and SSc, despite higher days of apheresis.
CTI31
Evaluation of the Impact of Retrieval of Cord Blood Units for Clinical Application on Adjacent Units Remaining in Cryopreservation
Aleisha K. Chamberlain, Kate S. Brown*, Jennifer L. Wheeler Buenger and Heather L. Brown
Cbr Systems, Inc.
Background/Case Studies: Exposure to potential transient warming events during cryogenic storage of cord blood units (CBU) should be minimized so as to avoid adversely impacting post‐thaw unit quality. Retrieval of a CBU from a manual liquid nitrogen dewar for shipment to a cell therapy center can involve exposure of the neighboring units in the rack to ambient air temperatures. We sought to investigate the impact of removing a CBU from storage on neighboring units by evaluating the post‐thaw unit viability (PTUV) of CBUs released from the same dewar and same rack after different lengths of storage.
Study Design/Method: A retrospective analysis was conducted using data for CBU releases from a private cord blood bank. To control for the variety of methods to determine viability, only CBUs with available PTUV data obtained by trypan blue were included. CBUs were classified as either the first or subsequent release from the same dewar and rack (Group 1 and 2 respectively). Randomly selected CBUs released from the same dewar as Groups 1 & 2 but a different rack and CBUs selected at random from different dewars served as controls (Group 3 and 4 respectively). Wilcoxon rank sum tests were used to examine differences with p‐values < 0.5 considered significant. Data analyses were performed using STATA software (STATA Corp LP).
Results/Finding: 292 of 440 units released had PTUV based on trypan blue staining. 36 CBUs (n=9 in each group) were included in the final analysis with 18 units, representing 9 pairs, released from the same dewar and rack. There were no significant differences in pre‐cryopreservation unit viability between Group 1 and Groups 2, 3 and 4, respectively. There was no significant difference in PTUV between primary and secondary CBU releases from the same dewar and rack and PTUV of Group 1 and Groups 3 and 4 were similarly comparable.
Conclusion: While this study is based on an actual use scenario, it is limited by the small sample size of paired units released from the same dewar and rack. However, our results are consistent with previous studies suggesting that removal of a cord blood unit from a conventional dewar under controlled and validated procedures does not affect the post‐thaw viability of neighboring units. Conventional dewars and procedures for manual retrieval are consistent with regulatory guidelines and standards established to prevent loss of product quality during the normal lifecycle of a cryopreserved product.
TABLE 1 (CTI31) CBU viability (Median % Viability; IQR)
| Group 1 n=9 | Group 2 n=9 | Group 3 n=9 | Group 4 n=9 | |
|---|---|---|---|---|
| Pre‐cryopreservation unit viability | 100%; 0% | 100%; 0% | 100%; 0% | 100%; 4% |
| p‐value when compared to group 1 | >0.05 | >0.05 | >0.05 | |
| Post‐thaw viability | 99%; 2% | 98%; 1% | 97%; 2% | 98%; 2% |
| p‐value when compared to group 1 | >0.05 | >0.05 | >0.05 |
CTI32
Validation of the BMP Platform on Spectra Optia® in a Pediatric Institution
Theresa Bilodeau*1, Kent Soik1, Karen Sommer1, Deborah Holman1, Ralph Quinones1,2 and Amy Keating1,2
1Children's Hospital Colorado, 2University of Colorado School of Medicine
Background/Case Studies: ABO incompatible bone marrow products often require manipulation to reduce red blood cell volume at infusion. Additionally, in the pediatric population, it is often necessary to reduce the overall product volume for patients with a low body weight. The Spectra Optia BMP platform provides a reliable method of bone marrow processing that yields a safe infusion product.
Study Design/Method: A 2‐phase concurrent validation was performed on 7 products infused to patients undergoing allogeneic bone marrow transplantation from ABO incompatible donors. Products were processed on the Spectra Optia per manufacturers recommendations and evaluated for TNC, MNC, and CD34 + recovery and residual red cell volume. The second phase of the validation was performed with the goal of improving MNC recovery. Institution specific acceptable parameters are: MNC and CD34 + recovery of ≥ 70%, TNC recovery of ≥ 25% and incompatible RBC volume of ≤ 0.3 ml/kg recipient body weight.
Results/Finding: Validation results are summarized in the Table. In Phase I, 1 of 4 products had MNC recovery ≥70%. In Phase II, MNC recovery exceeded the desired parameter of ≥70%. All samples had acceptable CD34 + and TNC recovery. In all products, red cell reduction was above 95% and overall volume reduction was approximately 91%. The final incompatible RBC volume infused in all products was within our institution specific guidelines. 3 patients exhibited adverse events at infusion. 2 patients had reported hypertension and 1 exhibited fever within 24 hours of infusion.
(CTI32)
| Donor sex/weight | Male/80.4 kg | Male/20.8 kg | Female/27.1 kg | Male/79.2 kg | Male/80 kg | Male/87.2 kg | Female/57.5 kg |
|---|---|---|---|---|---|---|---|
| Recipient sex/weight | Male/42.8 kg | Male/6.9 kg | Male/16.7 kg | Male/32.7 kg | Male/10.4 kg | Male/44.3 kg | Female/7.6 kg |
| Product volume processed (ml) | 507 | 340 | 614 | 1335 | 475 | 2024 | 616 |
| Pre‐RBC volume (ml) | 316 | 150 | 184 | 403 | 166 | 631 | 188 |
| # of BM cycles at default | 4 | 6 | 5.4 | 4 | 6 | 4 | 5 |
| Measured final product volume (ml) | 46 | 31 | 71 | 88 | 48 | 168 | 59 |
| Infused product volume (ml) | 46 | 18 | 71 | 88 | 28 | 168 | 20 |
| Infused RBC volume (ml) | 3.3 | 1 | 3 | 3 | 1 | 5 | 1 |
| % total volume reduction | 91% | 91% | 88% | 93% | 90% | 92% | 90% |
| %RBC removal ≥ 95%? | Yes (99%) | Yes (99%) | Yes (98%) | Yes (99%) | Yes (99%) | Yes (99%) | Yes (98%) |
| MNC recovery ≥ 70% at default? | No (57%) | No (67%) | No (65%) | No (64%) | Yes (91%) | Yes (80%) | Yes (71%) |
| Additional cycles processed? | Yes | No | Yes | No | No | For Phase II of validation, one additional BM cycle processed from initiation of procedure | |
| MNC recovery ≥ 70%? | Yes (72%) | NA | No (66%) | NA | NA | ||
| CD34 recovery ≥ 70%? | Yes (79%) | Yes (80%) | Yes (117%) | Yes (94%) | Yes (108%) | Yes (130%) | Yes (79%) |
| TNC recovery ≥ 25%? | Yes (48%) | Yes (47%) | Yes (74%) | Yes (90%) | Yes (40%) | Yes (95%) | Yes (42%) |
| AE at/post infusion? | None | Yes | None | Yes | None | None | Yes |
| List AEs encountered: | NA | Hypertension | NA | Fever | NA | NA | Hypertension |
Conclusion: The Spectra Optia BMP platform provides a safe, effective and consistent method for processing ABO incompatible bone marrow products. The Automated Interface Management (AIM) system allows for less operator variability while ensuring optimal cell recovery. In the pediatric population, this method has resulted in products with more manageable volumes at infusion, incompatible RBC volumes well below what is allowable, and excellent cell recovery. Patients tolerated infusions with few adverse events, and smaller infusion volumes are more easily managed by nursing staff.
CTI33
Safety of Early Autologous Cord Blood Cell Transfusion for Preterms: A Descriptive Study
Jie Yang*1, Lijuan Lu1 and Zhipeng Liu2
1Guang Dong Women and Children Hospital, 2Guang Dong Cord Blood and Stem Cell Bank
Background/Case Studies: Preterm birth complications are one of the leading causes of death among children under 5 years of age. Despite advances in medical care, many survivors face a lifetime of disability, including mental and physical retardation, and chronic lung disease. More recently, both allogenic and autogenic cord blood cells have been applied in the treatment of neonatal conditions such as hypoxic‐ischemic encephalopathy (HIE) and bronchopulmonary dysplasia (BPD).This study was to assess the safety of autologous volume‐ and red blood cell (RBC)‐reduced non‐cryopreserved umbilical cord blood (UCB) cell infusion to preterm infants.
Study Design/Method: This study was a phase I, open‐label, single‐arm, single center trial to evaluate the safety of autologous, volume‐ and RBC‐reduced non‐cyropreserved UCB cell (5 × 10⁷cells/kg) infusion for preterm infants <37 weeks gestational age. UCB cell characteristics, and pre‐ and post‐ infusion vital signs were recorded. Clinical data including mortality rates and preterm complications were recorded.
Results/Finding: After processing, (22.67 ± 4.05) ml cells in volume, (2.67 ± 2.00)×108 cells in number, with (22.67 ± 4.05)×106 CD34+, and (3.72 ± 3.25)×105colony forming cells (CFU‐GM), ( 99.7 ± 0.17%) vitality were infused to 15 preterm infants within 8 hours after birth. No adverse effects were noticed during treatment. All fifteen patients who received UCB infusion survived. The duration of hospitalization ranged from 4 to 65 (30 ± 23.6) days. Regarding preterm complications, no BPD, HIE, retinopathy of prematurity (ROP) were observed. There were 1/15 (7%) infant with intraventricular hemorrhage (IVH), and 2/15 (13.3%) infants with ventilation‐associated pneumonia.
Conclusion: Collection, preparation and infusion of fresh autologous UCB cells to preterm infants is feasible and safe. Adequately powered randomized controlled studies are needed.
CTI34
Accuracy of Reporting ABO Typing Following Major ABO Incompatible Hematopoietic Stem Cell Transplantation
Jennifer J. O'Brien*1, Leeann M. Shimer2, Christine A. Tremblay2, Philip Oladele2, Erika M. Reese2, Janice M. Hunt2, Heather L. McGann2 and Magali J. Fontaine1
1University of Maryland School of Medicine, 2University of Maryland Medical Center
Background/Case Studies: Patients undergoing hematopoietic stem cell transplantation (HSCT) with major ABO incompatibility have an increased risk for delayed red blood cell (RBC) engraftment and prolonged RBC transfusion dependence. In these patients, the evaluation and reporting of the serologic ABO discrepancy between the forward typing (FT) and the reverse typing (RT) may clarify the status of RBC engraftment. The goal of this study was to compare the ABO FT and RT discrepancies in patients with major ABO incompatible HSCT, using two different serologic techniques and to correlate these with transfusion rate.
Study Design/Method: We reviewed and compared FT and RT ABO serologic typing results and RBC transfusion needs, on 32 blood samples drawn from patients (n=7) with major ABO incompatible HSCT at either <100 days or ≥ 100 days post‐transplant, using either automated gel (GT) versus manual tube (MT) methods. RT was performed using MT at immediate spin (n=32) or with an additional 15 min room temperature incubation (n=12). Data evaluated included: HSCT donor ABO FT and RT strength of reaction (graded w + to 4+) and number of RBC units transfused within 2 weeks prior to ABO typing. Differences in FT and RT grading was determined by GT grade minus MT grade. Groups were compared using student t‐test.
Results/Finding: The samples (n=32) were drawn at 63 ± 20 days (<100 days, n=16) and at 149 ± 55 days (≥100 days, n=16) post transplantation. At < 100 days and ≥100 post‐transplant, no significant difference was observed in the reactivity of HSCT donor ABO FT for when using Gel compared to MT methods. Differences were observed in the reactivity of the RT for either anti A or anti B against HSCT donor in 5/32 samples (16%) with a stronger reaction using the MT method (‐1.2 ± 0.45) (p>0.05). Furthermore, there was a significant increase in the detection (either w+, 1+, or 2 + ) of anti HSCT donor ABO in the samples [8/12 (83%)] tested with the MT method with a 15 minute incubation, compared to no reactivity detected by the gel method (p=0.001). At < 100 days, the transfusion rate was at 81% with a mean of 1.6 ± 1.0 RBC units versus 69% at ≥ 100 days (1.9 ± 1.0 RBC units). Importantly, in 75% of the cases with anti‐ HSCT donor antibodies detected only by manual tube testing with 15 minute incubation, the transfusion rate was ≥ 2 RBC units.
Conclusion: ABO FT results of patients, following major ABO incompatible HSCT, were similar when using either gel or MT methods. Whereas, RT performed by MT with 15 min incubation was a more sensitive method in detecting HSCT donor ABO antibodies, which correlated with a higher RBC transfusion requirement, indicating possible delayed RBC engraftment.
CTI35
Volunteer Registry Donor Experience in Partnering to Pursue New Life‐Saving Cellular Therapy Treatments
Linda Beutel*, Fran McDermott and Abby McDonald
Be The Match BioTherapies
Background/Case Studies: Cellular therapies, such as CAR‐T, iPSCs and TCRs, are becoming a more commonly utilized treatment option for patients for whom more traditional therapies may not be an option. While many cellular therapies are developed from the patient's own cells, allogeneic cellular therapies may also be an option for patients. Allogeneic cellular therapies require that a healthy donor be willing and able to provide the starting material in order to produce the final cellular therapy, and consistency in donor experience and collections is critical for both cellular therapy manufacturers and the donors themselves. Utilizing extensive experience in cell sourcing, donor management, and cell collection, donors from a volunteer registry have been contacted and consented to provide starting material for research, clinical and/or commercial use, with strong emphasis on providing a positive donation experience for volunteer donors.
Study Design/Method: Since 2016, volunteer donors have been contacted and consented to donate a mononuclear cell product collected by apheresis (MNC(A)) for therapies other than allogeneic hematopoietic stem cell transplant. This effort has resulted in over 100 MNC(A) collections thus far. In order to donate this MNC(A) product, consented donors were asked to complete multiple phone calls as well as in‐person appointments prior to collection in order to assess for medical fitness to donate, as well as to determine eligibility status. For these purposes, it was mandatory that donors meet the eligibility requirements of both the domestic regulatory agency and certain international regulatory agencies. For those donors that proceeded to collection, in the weeks following their donation, donors were sent an electronic satisfaction survey for completion. Donors were asked to rate their satisfaction with the donation process in thirteen key metric areas ranging from flexible scheduling to education materials, and explanation of risks to feeling appreciated and cared for.
Results/Finding: Nearly 71% of the donors who donated MNC(A) from October through December 2017 completed the post‐donation survey. Of these responses, the “Performance to Goal” was “Met or Exceeded” 100% of the time in all areas. On a 5‐point scale, the average overall donor satisfaction experience was rated 4.73.
Conclusion: On the whole, donors reported that their donation experience was positive, suggesting that a rich history of processes that support donors through stem cell donation translates to favorable donor experiences when donating other types of starting material for the cellular therapies market.
CTI36
Simulated Bacterial Infection Enhances Anti‐Erythrocyte Antibodies Production in a Mouse Model of Red Blood Cell Transfusions
Xueyu Jiang*
Shanghai Blood Center
Background/Case Studies: In clinical, blood recipients are often accompanied by inflammation mainly caused by infection such as sepsis. Immune status of recipients may influence the effect of blood transfusion, and guidelines to blood transfusion in this condition have been discussed a lot. In fact, Clinicians in China do not give blood transfusion to patients with body temperature above 38°C mainly caused by inflammation except in urgent situation. Researchers have demonstrated viral mimic polyinosinic polycytidylic acid [poly (I:C)], a synthetic double‐stranded RNA molecule induce robust antibody production in a mouse model of blood transfusion and it has been reported viral disorders demonstrated a trend towards increased risks in RBC alloimmunization in a human study. Here we investigated if transfusion to mice with simulated bacterial infection could boost stronger immune response and its underlying mechanism.
Study Design/Method: We injected mice with both Gram‐positive bacteria mimic lipoteichoic acid (LTA) and Gram‐negative bacteria mimic lipopolysaccharide( LPS) and then transfused mice with human red blood cells to induce antibodies, as an simulated experimental system to study the effect of infection on RBC immunization. Mice were divided into a normal control group, a human RBC transfused positive control group receiving human RBC intravenously, an experimental group receiving LPS (3mg/kg) four hours before human RBC transfusion, an experimental group receiving LTA (5mg/kg) four hours before human RBC transfusion. Assessment of RBC immunization was performed by measuring serum immunoglobulin G (IgG) and immunoglobulin M (IgM) against human RBC weekly for two weeks. And the lymphocyte changes in spleen are also monitored by flow cytometry.
Results/Finding: We found that bacterial mimic including both LPS and LTA increased serum IgG in second week and IgM in first week significantly by flow cytometry, and similar results were observed when traditional methods such as the tube test and gel test were utilized. In LPS treated group, it is with a concomitant reduction in CD4 regulatory T cells in both spleen and mesenteric lymph nodes.
Conclusion: Our results demonstrated that bacterial mimic including both LPS and LTA could increase RBC immunization in mice, indicating both gram‐positive and gram‐negative infection could enhance RBC immunization. And this conclusion needs to be evaluated in human study further.
CTI37
A Retrospective Analysis of the Association between HLA‐DPB1 Matching and Transplantation Effect in Unrelated Hematopoietic Stem Cell Transplantation
Yanmin He1,2, Ji He1,2, Faming Zhu1,2, Wei Hu1,2, Xiaofan Zheng1, Feng Chen1 and Huaping Zhou*1,2
1Blood Center of Zhejiang Province, 2Zhejiang Provincial Key Laboratory of Blood Safety Research
Background/Case Studies: The success of hematopoietic stem cell transplantation is related to HLA matching in unrelated donor‐recipient transplantation. At present, the HLA‐DPB1 genotyping has not been included in the routine test for donor selection. Studies have shown that HLA‐DPB1 mismatch can increase the risk of GVHD, and HLA‐DPB1 match can reduce the overall risk of hematopoietic stem cell transplantation. This study will retrospectively analyze the association between HLA‐DPB1 matching and short tandem repeats(STR) results in unrelated hematopoietic stem cell transplantation.
Study Design/Method: 106 individuals(53 pairs of unrelated donor‐recipient) who underwent unrelated allogeneic HSCT with a 10/10 HLA allele matched donor in Zhejiang province were collected in this retrospective analysis. The genotyping of HLA‐DPB1 for all the samples was performed by PCR‐SBT method according to the previous report. The correlation between the HLA‐DPB1 matching and short tandem repeats(STR) results for 106 samples (53 pairs of unrelated donor‐recipient) after transplantation was analyzed. 13 STR loci and 1 sexual locus were detected for every donor and recipient by GeneScan method with the commercial PowerPlex Fusion system. All the results of STR were collected more than three times including one month,three months and six months after transplantation.
Results/Finding: Of 53 donor‐recipient pairs in our study, the STR results of 46 recipients showed successful hematopoietic stem cell implantation without relapse, the remaining 7 recipients showed a chimeric status. To study the association between HLA‐DPB1 matching and STR results, implemented group and chimeric group were divided into three subgroups according to the result of HLA‐DPB1 genotyping, shown in Table 1. The HLA‐DPB1 matching has no effect on the status of hematopoietic stem cell implantation according to the results of Chi‐square test (P>0.05).
TABLE 1 Analysis of the association between the HLA‐DPB1 matching and STR results
| HLA‐DPB1 Matching* | STR | P‐value | |
|---|---|---|---|
| Implantation | Chimerism | ||
| 1) 0/2 | 18 | 2 | 1.000 |
| 1/2 | 23 | 3 | |
| 2) 0/2 | 18 | 2 | 0.2692 |
| 2/2 | 5 | 2 | |
| 3) 1/2 | 23 | 3 | 0.2819 |
| 2/2 | 5 | 2 | |
* The HLA‐DPB1 matching included complete match(2/2), partial match(1/2) and complete mismatch(2/2).
Conclusion: HLA‐DPB1 matching is not related to the result of short tandem repeats(STR) in unrelated hematopoietic stem cell transplantation.
CTI38
Citrate Phosphate Dextrose – Too Much of a Good Thing?
Matthew Wilgo*, Angela Dexter, Brad Blaney, Cassandra Kirwan, Jawad Husein, Troy Wang, Rebecca Gagnon, Damaris Nazario and Grace Centola
New England Cord Blood Bank, Inc.
Background/Case Studies: One threat to the viability of any cord blood product is clotting (or coagulation), a normal physiological process in the body to prevent blood loss and initiate vascular repair. Anticoagulant is routinely used during the collection of cord blood to prevent clotting, with citrate phosphate dextrose (CPD) being the most common. Few studies have directly looked at the ratio of CPD to CB volume and its effect on viability. As cord blood collection volumes vary greatly, this study aims to address the effect of this ratio.
Study Design/Method: Umbilical cord blood units (N=3) were obtained with consent and IRB approval. Each CB unit was mixed and aliquoted into 50ml conical tubes containing fixed amount of CPD. The final volume for all conditions was 30ml.
| Ratio (CPD:CB) | CPD Vol (mL) | CB Vol (mL) | % CPD |
|---|---|---|---|
| Undiluted | 0 | 30 | 0 |
| 1:2 | 10 | 20 | 33 |
| 1:1 | 15 | 15 | 50 |
| 2:1 | 20 | 10 | 67 |
Viability and total nucleated cell counts (TNC) were determined at time 0, 24 hours, 48 hours, and 72 hours. Units were kept with gentle agitation at room temperature. Viability was determined by flow cytometry utilizing 7AAD run on a Beckman Coulter FC500 with an ISHAGE analysis protocol. TNC was obtained on an automated cell counter using acridine orange. The percent loss of viability over time was calculated by obtaining the difference of the original viability (Day 0) and the viability at each subsequent day (Day 1, Day 2, Day 3). Statistical analyses (ANOVA, T‐tests) were carried out in Graphpad Prism and Excel.
Results/Finding: Loss of viability over time was directly affected by the concentration of CPD (p ≤ 0.01). Larger ratios of CPD to CB showed increased losses in viability compared to lower dilutions (p ≤ 0.01). In regard to loss of TNC there was no statistically significant difference between the dilution groups (p ≥ 0.05), but there was a significant difference between time points within each group (p ≤ 0.05). Table 2 shows the progressive loss of viability over time.
TABLE 2 % Viability Loss
| 24H | 48H | 72H | |
|---|---|---|---|
| Undiluted | 11.0 ± 0.5 | 18.5 ± 4.6 | 21.9 ± 0.7 |
| CPD‐33% | 14.9 ± 1.5 | 21.8 ± 4.8 | 38.8 ± 10.7 |
| CPD‐50% | 18.0 ± 1.2 | 28.5 ± 2.8 | 53.2 ± 3.2 |
| CDP‐67% | 22.8 ± 1.6 | 34.4 ± 1.7 | 58.7 ± 2.3 |
Conclusion: Previous data review investigations suggested low CB volume loses viability faster. The data suggests that CPD may play a significant role in loss of viability over time in regard to high volumes of CPD in relation to small volumes of cord blood. A higher volume of CB to CPD does not appear to show indication of abnormal viability loss.
In conclusion every cord blood bank should continue to strive to maximize the volume of cord blood collection and process it within a short a time frame as possible to ensure the highest quality cell product possible for its institution and/or clients.
CTI39
Evaluation of Hematopoietic Stem Cell Collection Parameters: Does Increased Yield Improve Quality?
Okechukwu Nwogbo*1, Justin Yeh2, Roni Bollag1, Anand Jillella3, Sheila Tinsley1 and Scott Allen1
1Medical College of Georgia Department of Pathology at Augusta University, 2Medical College of Georgia at Augusta University, 3Medical College of Georgia Division of Hematology/Oncology at Augusta University
Background/Case Studies: Hematopoietic stem cell transplantation is a complex procedure which requires optimal coordination between the clinical transplant service and the apheresis and processing teams. Infusion of the cryopreserved product necessitates optimal quality control to ensure stable engraftment of the cryopreserved CD34 + stem cells. Mobilization varies considerably among patients, especially patients with underlying hematological disease with extensive prior therapy. The current paradigm posits that 5 × 10*6 CD34 + cells per kilogram of recipient weight ensures engraftment of the ablated marrow. While this represents a calculated surplus of pluripotent stem cells homing to the marrow, there are many variables which may impact collection and quality of the final product. Our empirical observations postulated that there was an inverse correlation between the yield of CD34 + cells and subsequent post‐thaw viability of the cells in the cryopreserved product.
Study Design/Method: In order to evaluate the possible inverse correlation, data was gathered from autologous stem cell collections from 2014‐2015, and parameters for each collection were tabulated. Data was parsed to ensure a standard apheresis protocol with respect to technique and collection parameters. We then evaluated the relationship between post‐thaw viability and the CD 34 + cell yield of the collection procedures by linear regression trendline analysis.
Results/Finding: Data from 51 sequential HPC collections incorporating yields from 24 autologous stem cell transplant candidates was tabulated. The CD 34 + cell yields ranged from 0.17 to 15.52 × 10*6 CD34 + cells per patient kg weight. The statistical mean CD 34 + cell yield of all the collections was 3.64 × 10*6 CD34 + cells per patient kg weight. The post‐thaw viability of all the collections ranged from 47% to 89%. The statistical mean of post‐thaw viability was 77%. This was comprised of between one and four apheresis collections per patient. All 24 patients received product infusions and there was 100% engraftment. While graphical scatter plot analysis demonstrated marked variability with respect to CD34 + cell yield vs post‐thaw viability, regression trendline analysis of the relationship between CD 34 + cell yield as a function of post‐thaw viability demonstrated a consistently negative slope.
Conclusion: Based on this preliminary analysis, the post‐thaw viability of autologous stem cell collection products shows an apparent inverse relationship with the procedural yield of CD34 + cells. However, many other variables deserve focused analysis to further improve the quality of mobilized peripheral hematopoietic stem cell yield.
CTI40
Contamination Rate of Hematopoietic Progenitor Products …..a Single Tertiary Care Center Experience
Hind Alhumaidan*, Amal AlSeraihy, Yiskah Simons, Sahar Alalem, Muhammad Badawi and Manal Yaghmour
King Faisal Specialist Hospital & Research Center
Background/Case Studies: This study was done retrospectively on all HPC Products processed in stem cell cord blood bank at our center to calculate the microbial contamination Rate & to compare with other centers contamination rates.
As quality indicator blood cultures that were taken for 876 &857 stem cell products were investigated for the percentage of positive blood cultures for the preprocessing, post processing & pre thawing for the years 2016 & 2017.
1.48 & 1.4 % respectively was the contamination rate. With Gram positive bacilli Propionibacterium species as predominant isolate(surface contaminant)
The rate of contamination was relatively low when comparing with other centers rates 2.73%
Study Design/Method: 876 for the year 2016 & 857 for the year 2017 products were investigated for the percentage of positive blood cultures for the preprocessing, post processing & pre thawing for cryopreserved & Fresh products respectively
And the positive culture rates was calculated:
Positive Cultures Rate for Cryopreserved Products per year.
Positive Cultures Rate for Fresh Products per year
Positive Cultures Rate for Total HPC Products per year
Results/Finding: See table.
TABLE 1 (CTI40) Stem Cell Transplant Yearly Microbial Contamination Rate Tracker
| Year | Total Number of Product (HPC‐A,HPC‐M) Received | Total Number of Stem Cell Products (bags) per year. (including MUD) | Total # of Cryopreserved Products (bags) per year. | #Positive Cultures for Cryopreserved Products per year. | Total # of Cryopreserved Products With Positive Cultures (bags) per year. | Positive Cultures Rate for Cryopreserved Products per year. | Total # of Fresh Products (bag) per year. | Total # of Fresh Products With Positive Cultures (bags) per year. | Total # of Fresh Products With Positive Cultures (bags) per year. | Positive Cultures Rate for Fresh Products per year. | Total # of Positive Cultures per year (cryo + fresh). | Positive Cultures Rate for ALL HPC Products per year (cryo+fresh). | ||
|---|---|---|---|---|---|---|---|---|---|---|---|---|---|---|
| Pre‐thawing (POST DMSO) | Post‐thawing | Pre‐processing | Post‐processing | |||||||||||
| 2016 | 349 | 876 | 685 | 7 | 1 | 8 | 1.16% | 191 | 4 | 1 | 5 | 2.60% | 13 | 1.48% |
| 2017 | 363 | 857 | 641 | 2 | 3 | 5 | 0.78% | 216 | 4 | 3 | 7 | 3.24% | 12 | 1.40% |
| 2016 Species | Number of Occurances Per Species in 2016 | 2017 Species | Number of Occurances Per Species in 2017 |
|---|---|---|---|
| Propionibacterium Species | 8 | Propionibacterium Acnes 6 bags (4 fresh + 2 cryopreserved) | 6 |
| Staphylococcus Epidermis | 2 | Ochrobactrum Anthropi 3 bags (3 cryopreserved) | 3 |
| Coagulase Negative Staph | 1 | Staphylococcus Caprae 2 bags (2 fresh) | 2 |
| Non Fermenting Gram Negative Rods | 1 | Staphylococcus Aureas 1 bag(1 cryopreserved) | 1 |
| Streptococcus Metis | 1 |
Conclusion: Our calculation method of the yearly contamination rate showed low percentage for the year 2016& 2017 with 1.48&1.4 % respectively in comparison with other center's experience but we still aim to minimize our rate through our new PI project plan with Propionibacterium as the predominant isolates which is a surface contaminant.
HC1
Application of Serine Protease Inhibitor (Serp‐1) in a Preclinical Model of Acute Traumatic Coagulopathy
Xiaowu Wu*, Daniel N. Darlington, Jeffrey D. Keesee, Bin Liu and Andrew P. Cap
U.S. Army Institute of Surgical Research
Background/Case Studies: Acute traumatic coagulopathy (ATC) leads to high morbidity and mortality after trauma, which is manifested by prolongation of prothrombin time (PT), decreased platelet function and clot firmness, and increased fibrinolytic activity. The myxoma virus protein Serp‐1 is a member of serine protease inhibitor superfamily. Serp‐1 has been shown to inhibit fibrinolytic serum proteases including plasmin, tissue/or urokinase plasminogen activator (tPA, uPA), as well as exert anti‐inflammatory activity in various animal models. In this study, Serp‐1 was administered in a preclinical ATC‐model using a rat with polytrauma and hemorrhagic shock. We hypothesize that Serp‐1 can improve the outcome of ATC.
Study Design/Method: Isoflurane anesthetized Sprague‐Dawley rats underwent polytrauma within 20 minutes followed by 40% hemorrhage. All rats were resuscitated (50% of shed volume) with fresh whole blood (FWB) from anesthetized donor rats at 60min after trauma. Serp‐1 (1mg/kg, n=9) or vehicle (n=5) was given intravenously prior to trauma. PT was measured at baseline, 0, 45 and 120min after trauma. Lung wet/dry weight was measured at the end of experiment. Additionally, the whole blood from healthy human donors (n=9) was treated with Serp‐1 (0.01mg/ml) to determine the direct effect of Serp‐1 on hemostasis by rotational thromboelastogram; and on platelet function by impedance aggregometer (using adenosine diphosphate, protease‐activated receptor‐1, collagen, and U46619).
Results/Finding: Serp‐1 prior to trauma, modestly delayed the rise of PT immediately after trauma (0min), but not at 45 and 120min after trauma as compared to vehicle (percent change of PT to baseline at 0, 45 and 120min after trauma, Serp‐1: ‐2.6 ± 1.0, 4.5 ± 1.1, 6.2 ± 1.5%, and Vehicle: 2.7 ± 1.0, 7.1 ± 1.4, 8.7 ± 1.3%). Limited resuscitation of FWB led to a significant rise in the wet/dry weight ratio of the lung, which was significantly attenuated by Serp‐1 treatment (Serp‐1: 5.27 ± 0.07 vs. Vehicle: 5.59 ± 0.07, p<0.05). In‐vitro, Serp‐1 significantly decreased clotting time (Serp‐1: 45.2 ± 2.1 vs. vehicle: 50.3 ± 2.5, p<0.05) and increased maximum clot firmness (Serp‐1: 55.8 ± 1.6 vs. vehicle: 52.2 ± 1.6, p<0.05), but had no effect on platelet aggregation stimulated by any agonists.
Conclusion: Serp‐1 can directly potentiate the clot formation as measured by in‐vitro assessment. Administration of Serp‐1 in rats with ATC delays development of ATC by temporarily attenuation of PT elevation immediately after trauma. Serp‐1 may also reduce acute lung injury in trauma through anti‐inflammatory activity and attenuation of vascular permeability in addition to attenuation of trauma induced coagulopathy. This preliminary study suggests a potential benefit of using Serp‐1 in severe trauma, and further investigation for optimal dosing and timing strategy is indicated.
HC2
Survey on Impact of Thromboelastometry on a Hospital Blood Bank
Elizabeth P. Crowe*1, Robert A. DeSimone1, Ruchika Goel2, Thorsten Haas3 and Melissa M. Cushing1
1Weill Cornell Medicine, 2Department of Pediatrics, New York Presbyterian Hospital, Weill Cornell Medicine, 3Zurich University Children's Hospital
Background/Case Studies: Viscoelastic testing by rotational thromboelastometry (VT) was implemented in our hospital blood bank to guide transfusion management of bleeding patients. To obtain ordering privileges for VT, clinical providers must complete an initial training course and pass an initial competency assessment. The aims of this study were 1) determine if users perceive VT results as practice changing, and 2) assess ongoing user knowledge and competency of VT.
Study Design/Method: A brief online questionnaire including an annual competency assessment with 7 mandatory multiple‐choice questions (5 scored/2 educational) was administered over 2 weeks. Competency questions were basic level and validated by 5 VT experts. All providers were required to complete the survey and pass the competency assessment (score ≥ 60%) to maintain VT ordering privileges. Additional education was offered to failing providers. Incomplete surveys were not analyzed. Results were compared to clinical/laboratory data collected in the blood bank's VT Quality Information Database (QIDB).
Results/Finding: The response rate was 77% (88/114). Respondent demographics and ordering practice are reported in Table 1. The most common user‐reported indications for VT orders included trauma, cardiovascular (CV) and gastrointestinal (GI) hemorrhage. However, the most common indications in the QIDB were CV, GI, and postpartum hemorrhage. Half (36/72) of respondents who ordered or interpreted VT reported ordering at least once to investigate the possibility of hyperfibrinolysis. A minority of respondents (8/72;11%) reported ordering VT in a non‐bleeding patient, most commonly for a pre‐procedure baseline in coagulopathic patients. When deciding to treat a bleeding patient for whom VT was ordered, 38% of respondents wait for results of VT, 57% treat based on most recent standard labs available and use VT to confirm decisions, and the remainder base treatment decisions on clinical stability and severity of bleeding. In the QIDB, 18% (18/102) of VT were repeated to ensure that the defect improved after intervention; whereas, 33% (24/72) of respondents reported that they almost always order repeat VT. The mean score±SD for the competency assessment was 3.9 ± 1.2 out of 5 questions (78.4%). Respondents performed best on the low fibrinogen and hyperfibrinolysis case scenarios. Providers that repeatedly order VT in clinical practice were more likely to pass the competency assessment (p=0.001).
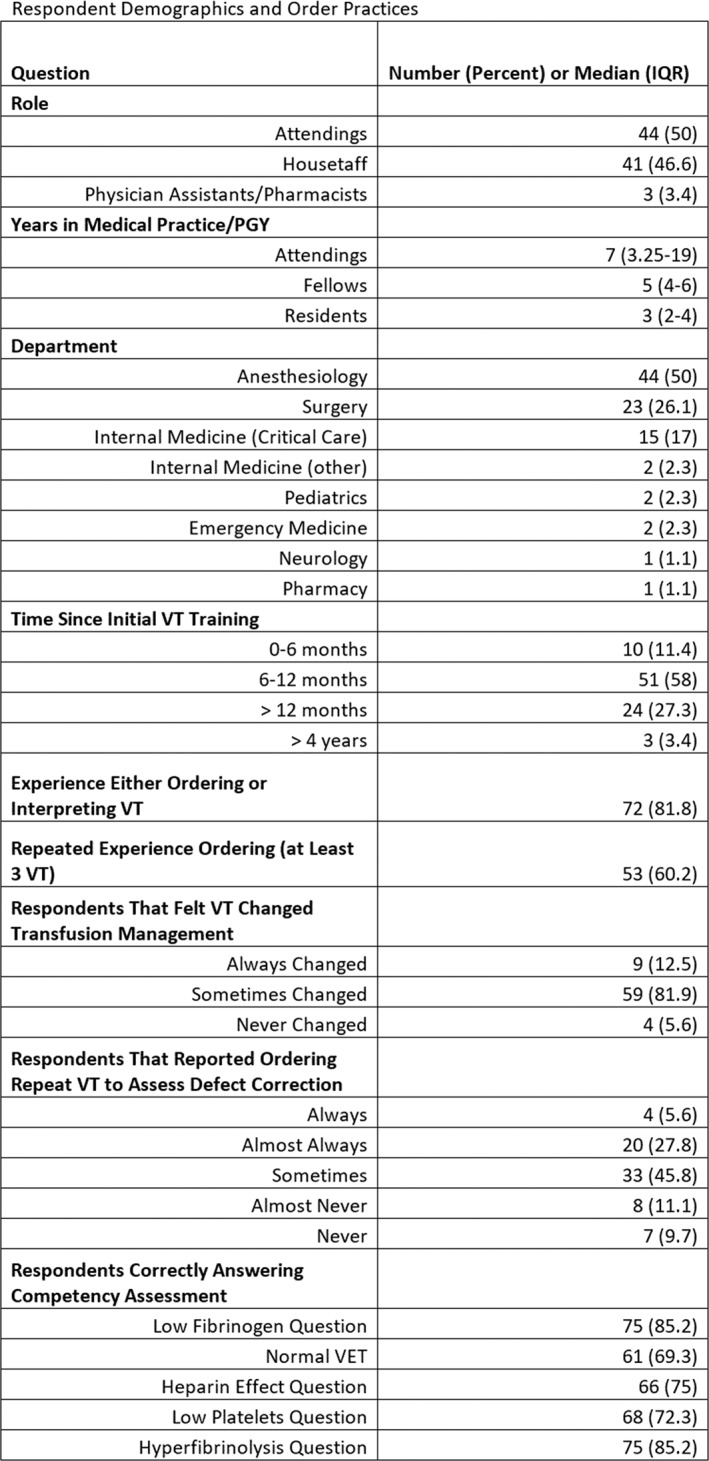
Conclusion: VT is perceived as clinically useful in the management of bleeding patients and often changes transfusion practice or confirms clinical decision making. Ongoing education and clinical experience with VT is critical to maintain user proficiency.
HC3
The Fibres Study: A Pragmatic, Randomised, Active‐Control, Non‐Inferiority, Phase 3 Trial Comparing a New Fibrinogen Concentrate vs. Cryoprecipitate for the Treatment of Acquired Hypofibrinogenaemia in Bleeding Cardiac Surgical Patients
Keyvan Karkouti1,2, Jeannie Callum*2,3, Jo Carroll1, Deep Grewal1 and Chantal Armali3
1University Health Network, 2University of Toronto, 3Sunnybrook Health Sciences Centre
Background/Case Studies: Coagulopathic bleeding is a serious complication of cardiac surgery. A key contributor is acquired hypofibrinogenaemia (plasma fibrinogen < 1.5–2.0 g/L), the standard treatment for which is cryoprecipitate. Purified fibrinogen concentrate is also used, but few comparative data exist and randomised trials are needed. The primary objective of the FIBrinogen REplenishment in Surgery (FIBRES) study is to demonstrate that a new fibrinogen concentrate (Octafibrin/Fibryga, Octapharma) is non‐inferior to cryoprecipitate.
Study Design/Method: This is a pragmatic, multi‐centre, active‐control, randomised (1:1), single‐blinded, non‐inferiority, phase 3 trial in adult cardiac surgical patients with clinically significant bleeding due to acquired hypofibrinogenaemia. Patients undergoing cardiopulmonary bypass (CPB) for whom fibrinogen supplementation is ordered within 24 hours will be randomised to receive 4 g fibrinogen concentrate or 10 units cryoprecipitate (dose equivalent). Research personnel obtaining outcome assessments will be blinded to treatment allocation. All randomised patients will receive fibrinogen supplementation according to clinical need. Patient consent at randomisation is waived, with written informed consent obtained as soon as possible therafter. Primary outcome is combined red cell, platelet and plasma transfusions within 24 hours of CPB. Secondary outcomes include blood products used within 7 days, major bleeding within 24 hours, fibrinogen levels and adverse events. Enrolment of 1,200 patients will provide > 90% power to demonstrate non‐inferiority, based on a 20% non‐inferiority margin, ≥ 550 patients/group and ∼10% drop‐out rate. Safety reviews by the DSMB will be performed every 100 patients. An interim analysis will be performed at 600 patients with pre‐specified stopping rules for futility and overwhelming efficacy. The pragmatic design and treatment algorithm align with standard practice, aiding adherence and generalizability.
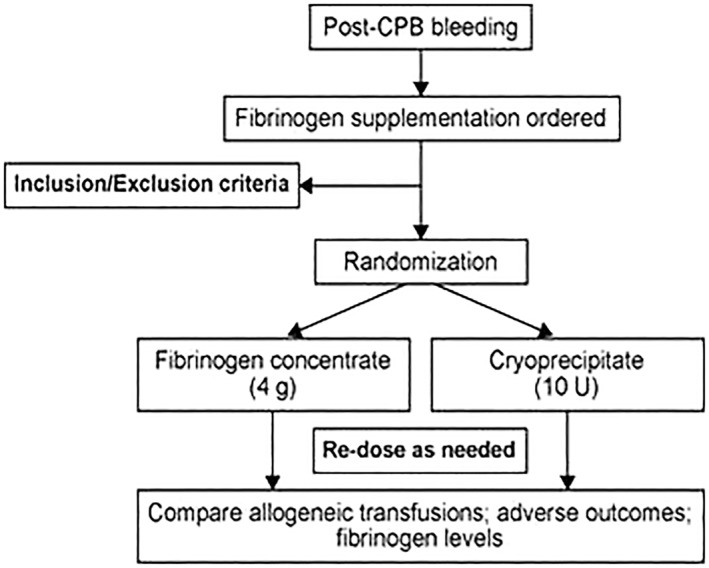
Results/Finding: This is the largest randomised study of fibrinogen concentrate versus cryoprecipitate in adult cardiac surgical patients conducted at 11 Canadian centers. Expected completion is late 2018, with results available in early 2019. Four‐hundred of 1200 patients have been randomized as of April 2018 with no safety issue so far as assessed by the DSMB. Conclusion: Non‐inferiority of the new fibrinogen concentrate compared to cryoprecipitate would support its use in cardiac surgical patients experiencing significant bleeding due to hypofibrinogenaemia, an under‐studied yet high‐risk bleeding population.
HC4
The Impact of Recipient Factors on Hemoglobin Increment in Transfused Outpatients with Hematologic Disease
Matthew S. Karafin*1, Roberta Bruhn2, Dhuly Chowdhury3, Lirong Qu4, Edward L. Snyder5, Edward Murphy6, Nareg Roubinian2, Donald Brambilla3, Ritchard G. Cable7 and Elizabeth St. Lezin8
1Blood Research Institute, BloodCenter of Wisconsin, 2Blood Systems Research Institute, 3RTI International, 4BSI, 5YNHH/Yale Medical School, 6Blood Centers of the Pacific‐Irwin Center, 7American Red Cross, 8San Francisco Veterans Affairs HCS
Background/Case Studies: Many individuals with cancer or chronic hematologic disorders receive red cell (RBC) transfusions (Tx) as outpatients. Each RBC unit is thought to increase recipient hemoglobin (Hgb) by 1 g/dl, but smaller increments may occur in this setting. A better understanding of recipient factors affecting Hgb increments could help providers better manage these patients.
Study Design/Method: Data were collected as a part of the Red Cells in Outpatients Transfusion Outcomes (RETRO) study which is a prospective observational study of outpatient RBC Tx. Inclusion criteria were age ≥ 50, ambulatory, and at least 1 prior RBC Tx within 6 months. Subjects who reported active bleeding at the time of Tx were excluded. Hgb was measured pre‐Tx, 30 minutes after Tx, and at 1‐week post‐Tx. Multivariable linear regressions of change in hemoglobin at 30 minutes and at 1 week were performed using backwards elimination to identify significant clinical variables.
Results/Finding: A total of 208 subjects completed the study and were included in the analysis. Mean age was 66 (SD ± 9.3) years. Patients received 1 (73%) or 2 (27%) RBC units during the transfusion episode. Between baseline and one‐week Hgb measurements, 38 of 208 subjects (18%) received 1‐3 additional RBC units as part of patient care, and these subjects were included in the 1 week increment assessment. Mean change in Hgb was 0.6 g/dl/unit (SD ± 0.5) at 30 minutes and 0.9 g/dl/unit (SD ± 0.8) at one week. Hgb increment at 30 minutes decreased with larger patient blood volume (Nadler) and higher patient baseline Hgb, but increased with the RBC component volume transfused. Hgb change at one week increased with change in Hgb at 30 minutes, decreased with subject blood volume (Nadler), and was lower in patients hospitalized between Hgb measurements. Subject age, gender, non‐RBC volume transfused, total RBC dose (1 week analysis only), and chemotherapy use (± 4 weeks from the study transfusion) were eliminated during backward elimination.
Conclusion: In this cohort, most patients had a Hgb increment of less than1 g/dl/unit after Tx. Two recipient‐specific factors influenced the Hgb increment at 30 minutes, and patient disease status was associated with the Hgb response after one week. While other donor‐ or unit‐specific factors not captured in this study may also impact Hgb increment, our data suggest that pre‐Tx recipient factors can help predict Hgb‐response post‐Tx. Providers should account for recipient circulating blood volume and pre‐transfusion Hgb in addition to the expected increment per RBC unit to achieve Tx goals.
HC5
Can Kunicki Morphology Scoring Be a Cost‐Effective Alternative to Flow Cytometry for Platelet Activation Quantification?
Umang Sharma*, Kristin Reddoch‐Cardenas, Christi Salgado, Carolina Cantu and Andrew P. Cap
U.S. Army Institute of Surgical Research
Background/Case Studies: Platelet morphology and activation is believed to be important to the success of prophylactic platelet transfusion in thrombocytopenic patients. Developed in 1974, the Kunicki Morphology Score (KMS) evaluates the quality of platelets as they undergo morphological transformation due to conditions such as storage temperature and aging. A higher percentage of non‐discoid platelets is believed to predict poor platelet recovery and survival after transfusion. In recent years, flow cytometry has emerged as the preferred tool for the quantification of platelet activation and surface marker‐protein expression. P‐selectin (CD62P) is a putative platelet activation marker. In this study, we have attempted to find the correlation between KMS and P‐selectin expression in stored platelets and explore the possibility of using KMS as a cost‐effective alternative to flow cytometry for platelet activation quantification.
Study Design/Method: Apheresis platelets (AP) were collected (n=3 donors) in BCSI® 15 ml mini platelet storage bags at either 22˚C with agitation (RT) or 4˚C without agitation (4C). Samples were assessed on Day 0, 1, and 3 of storage for KMS using phase contrast microscopy. One hundred free floating, non‐adherent platelets were assigned arbitrary grades based on their morphology KMS was calculated as the sum of all grades, with superior morphology (100% discs) equal to 400. To assess surface P‐selectin expression (%), AP were stained with anti‐CD62P antibody and analyzed on a FACS Canto I. Data were reported as means±SEM. KMS and P‐selectin expression data were analyzed for Pearson's correlation coefficient (r) using two‐way ANOVA and with significance set at P<0.05.
Results/Finding: High KMS was observed for Day 0 platelets (332 ± 9). Platelet morphology was highly preserved under RT storage conditions and similar KMSs on subsequent days (Day 1: 265 ± 29 and Day 3: 276 ± 23). Platelets stored at 4C had increased amoeboid morphology and decreased KMSs (Day 1: 138 ± 13 and Day 3: 126 ± 5). RT samples showed a marginal increase in P‐selection expression (Day 0: 12 ± 2%, Day 1: 15 ± 3%, and Day 3: 22 ± 3%) whereas a significant increase was observed in 4C samples (Day 1: 47 ± 1% and Day 3: 61 ± 4%). KMS and P‐selectin expression had a strong negative correlation (r = ‐0.878, P < 0.001). As expected, the percentage of non‐discoid morphology displayed a strong positive correlation with P‐selectin expression (r = 0.877, P < 0.001).
Conclusion: The results from this study suggest that KMS is comparable to P‐selection expression measured via flow cytometry, and a good indicator of platelet activation phenotype in stored samples. Therefore, Kunicki Morphology Score can be a quick and economic alternative to flow cytometry for platelet assessment.
HC6
The Use of 4F‐PCC to Correct Direct Oral Anticoagulant (DOAC)‐Induced Coagulopathy
Yan Zheng*1 and Christopher A. Tormey2
1St. Jude Children's Research Hospital, 2Yale University
Background/Case Studies: With the approval of four‐factor prothrombin complex concentrate (4F‐PCC, Kcentra) for the reversal of vitamin K antagonist‐associated bleeding in the US, it has become a relatively common practice for 4F‐PCC to be used in an ‘off‐label’ fashion to correct coagulopathy caused by direct oral anticoagulants (DOACs) such as anti‐Xa inhibitors. However, the efficacy and safety of 4F‐PCC have not been well‐studied in this scenario.
Study Design/Method: We performed a retrospective observational study on the off‐label use of 4F‐PCC for reversing DOAC‐associated bleeding in a level one trauma center between November 2014 and February 2017. The following data were collected: patient age, gender, weight, indications and dosage of 4F‐PCC, INR and hemoglobin (Hgb) prior to and post 4F‐PCC administration, clinical outcomes, acute and chronic thromboembolic events within 24 hours and 45 days of 4F‐PCC administration respectively. In addition, the thromboembolic events (if documented by primary teams) post 4F‐PCC infusions were subsequently evaluated by both authors to determine the potential contributions of 4F‐PCC.
Results/Finding: We identified 25 patients on DOACs who received 4F‐PCC in our center during the study time frame. The most common indications for receiving 4F‐PCC were intracranial hemorrhage (ICH; n=13), and gastrointestinal (GI) bleeding (n=8). The dosage of 4F‐PCC ranged from 25 to 50 U/Kg. Patients on DOACs did not show a significant decrease of INR after having 4F‐PCC (average pre‐INR=1.13 ± 0.21, average post‐INR = 1.03 ± 0.05, P=0.06). However, clinically 4F‐PCC appeared effective in stopping DOAC‐associated hemorrhage. Most patients (20/25 patients) showed improved hemorrhage as demonstrated by stabilized intracranial hemorrhage sizes and/or by steady Hgb concentrations (average Hb difference between pre‐ and post‐4F‐PCC administration = 0.13 ± 1.94 mg/dL). Notably, five patients died within one week of their bleeds/4F‐PCC administration, four due to irreversible brain damage associated with the initial intracranial bleeding, and one due to inoperable GI bleeding. We did not find any thromboembolic events within 24 hours of 4F‐PCC administration. However, four patients (4/25 = 16%) had thromboembolic events 2‐45 days after receiving 4F‐PCC including stroke, myocardial infarct, atrial thrombi and non‐occlusive IJ tube thrombi.
Conclusion: Our data showed that 4F‐PCC was relatively efficient in aiding the ‘reversal’ of DOACs for patients with severe hemorrhage. We did notice that 16% of patients experienced some form of thromboembolic events in the days‐to‐weeks after 4F‐PCC administration, although the imputability of 4F‐PCC in these processes (versus their underlying disease) is difficult to parse out. Additional, prospective studies would be warranted to further evaluate the safety of 4F‐PCC for this off‐label indication.
HC7
Warfarin Reversal: Educational Efforts Aimed to Influence Appropriate Use of Plasma
Jenny Petkova*1, Brenda Rabeno2, Michael Healy1, Scott Hall1 and Michael Lankiewicz1
1Christiana Care Health Services, 2Christiana Care
Background/Case Studies: Supratherapeutic INR and major bleeding secondary to warfarin therapy occurs in approximately 4 % of the patients on chronic anticoagulation for atrial fibrilation. Available treatment options for reversal of anticoagulation include withholding warfarin, administering oral or intravenous vitamin K, fresh frozen plasma (FFP), and prothrombin complex concentrate (PCC). The use of PCC is now recommended for severe bleeds by several organizations and their respective consensus guidelines, including the ACCP. The Transfusion Service Laboratory at 1000 + bed health system recently recognized “warfarin reversal” as the transfusion indication for 20.1% of all plasma transfusions occurring in 2015. Furthermore, 85% of all plasma orders were for 1 or 2 units while the recommended dosing of plasma is 10‐15ml/kg (3 to 5 units for most adults). A retrospective analysis of all plasma transfusions indicated only 49% of the orders were deemed “appropriate” and warfarin reversal accounted for 37% of all “inappropriate” orders. As such, a multidisciplinary team was assembled to address inappropriate use of plasma within this health system.
Study Design/Method: The team evaluated current practice, examined available literature, reviewed and standardized transfusion guidelines, indications and related policies as well as provided education to key stakeholder groups. Internal anticoagulation reversal guidelines were updated to recommend use of PPCs for any emergent reversal of warfarin; while recommending use of vitamin K for all other patients. “Warfarin reversal” was removed as a transfusion indication for ordering plasma. In addition, weight‐based clinical decision tools were created and incorporated into the electronic medical records which calculate a recommended quantity of plasma based on a predefined algorithm. During a six month period following all interventions, individual providers received timely feedback regarding inappropriate use of plasma.
Results/Finding: In the six months immediately following the educational efforts, the percentage of plasma orders deemed “not appropriate” due to warfarin reversal decreased by 57% (from 37% to 16%). The number of 1 and 2 unit plasma orders decreased by 45%. The review also indicated many providers had modified the number of plasma units recommended by the clinical decision support tool; suggesting need for further intervention.
Conclusion: Internal review of plasma utilization of a 1000 + bed health system identified concerns with ordering indication as well as dosing. Provider education and timely feedback appear to have positively impacted appropriate use of plasma transfusion. Further provider education will likely be needed to reinforce the message and further influence plasma dosing practice.
HC8
Fibrinolysis in Patients with Chemotherapy Induced Thrombocytopenia and the Effects of Platelet Transfusions
Floor Moenen1, Yvonne Henskens1, Patty Nelemans2, Paul Verhezen1, Rick Wetzels1, Harry Schouten1 and Erik Beckers*1
1MUMC+, 2University of Maastricht
Background/Case Studies: Prophylactic platelet transfusions are widely used in chemotherapy induced thrombocytopenia (CIT). However, platelet count alone is a poor predictor of bleeding.For adequate hemostasis the formation and sustainability of a stable clot are essential. Bleeding events in CIT patients with similar platelet counts might be influenced by changes in clot lysis potential in these patients. We hypothesized that bleeding risks in CIT with similar platelet counts might be influenced by changes in clot lysis potential. We investigated clot strength and susceptibility to tPA induced clot lysis as measured by tPA‐ROTEM, an in‐house designed whole blood rotational thromboelastometry assay, designed to assess clot firmness and stability.
Study Design/Method: tPA‐ROTEM results in CIT were compared with results in healthy individuals. tPA‐ROTEM parameters wereclotting time (CT), clot formation time (CFT), α‐angle (α), maximum clot firmness (MCF), LOT, LT and delta LS. Multivariable linear regression was used to identify independent determinants of the tPA‐ROTEM outcome variables, including fibrinogen, FII, FVII, FXIII, plasminogen, a2‐AP, tPA, PAI‐1, TAFI, hemoglobin, platelet and leucocyte count. Also, tPA‐ROTEM results in CIT before, 1 hour and 24 hours post‐platelet transfusion were compared.
Results/Finding: 72 consecutive CIT patients and 40 healthy individuals were included; 57 patients with 1 hour posttransfusion, and 45 with 24 hours posttransfusion results. CIT patients had low PAI‐1 and TAFI levels, but expressed high FVIII, fibrinogen, D‐dimer, VWF activity. Compared to healthy individuals, CT and CFT were significantly longer and MCF was significantly lower in CIT. LOT and LT were shorter in CIT patients. The delta LS in %/min was not significantly different. Combined LOT/LT results showed hyperfibrinolysis before platelet transfusion in 39% of patients had. Delta lysis speed was normal in most patients (94%). In multivariate analysis a higher plasminogen level was significantly associated with a shorter LOT/LT; higher leukocytes, PAI‐1, a2AP, FXIII and FII were significantly associated with a prolonged LOT/LT. Higher fibrinogen was associated with decreased lysis speed. 62 patients received 65 platelet transfusions.1 hour post‐transfusion, CFT was significantly shorter and MCF significantly higher, as compared to pre‐transfusion values. Although a significant increase of CFT and decrease of MCF was noticed post‐24 hours, both outcomes were still improved as compared to pre‐transfusion. LOT/LT significantly prolonged 1 hour and 24 hours posttransfusion. LOT/LT results post‐platelet transfusion indicated a 50% reduction of the number of patients with hyperfibrinolysis.
Conclusion: tPA‐ROTEM outcomes and determinants were in agreement with the expected changes associated with hyperfibrinolysis. CIT patients had slower clot formation and formed weaker clots, which were less resistant to fibrinolysis. A significant proportion of CIT patients had hyperfibrinolysis according to LOT/LT values. Platelet transfusions significantly improved resistance to fibrinolysis, especially 1 hour post‐platelet transfusion. In most patients tPA ROTEM changed from a hyperfibrinolytic profile to a less hyperfibrinolytic or normal profile after platelet transfusion.
HC9
Parameters of Thromboelastography in 105 Newborn Cord Blood Samples in China
Qiushi Wang*, Zhun Xing, Xinxin Hao, Guanghui Tong, Haixia Bai and Qiaoni Yang
Shengjing Hospital of China Medical University
Background/Case Studies: Neonatal coagulation is different from that of adults in the first several days of life due to incomplete liver development, which results in clotting factor levels less than adults. The application of adult coagulation standards may affect abnormal clotting assessment in neonatal patients. The premise for managing clotting in newborns is to understand the normal clotting intervals of newborns. Accurate determination of coagulation anomalies will be conducive to more efficient treatments.Compared with adults, TEG has been reported less frequently in pediatrics, especially in neonatology, and even less in pathologic neonates. The establishment of TEG parameter intervals for healthy people at different ages is conducive to an expansion of TEG applications.
Study Design/Method: To test the range of normal neonatal thromboelastography (TEG) values in the Chinese population and evaluate the coagulation status of newborns from pathologic pregnancies. A total of 105 neonates were enrolled in this study, as follows: 40 healthy neonates; 15 neonates from gravidas with gestational hypertension; 15 neonates from anemic gravidas; 15 neonates from diabetic gravidas; and 20 preterm newborns. Testing and comparative analyses were based on cord blood TEG, blood coagulation, and blood function testing.
Results/Finding: Normal neonatal TEG participation differed from adults. The clot reaction time (R) value was 4.24 ± 1.22 min, which is lower than adults. The clot kinetics (K) value was 2.25 ± 1.05 min, which was the same as adults. The angle value was 61.89 ± 9.18°, which was similar to adults. The maximum amplitude (MA) value was 50.48 ± 4.75 mm, which was equivalent to the lower limit of adults. The coagulation index (CI) value was −0.52 ± 2.15, which was comparable to adults. Neonatal TEG parameters in pregnancy‐induced hypertension and pregnancy‐induced anemia were not significantly different from normal neonates. There were statistical TEG differences in the R, K, and angle values between newborns of diabetic gravidas and newborn of healthy gravidas. There were statistical TEG differences in the R and angle values in premature neonates.
Conclusion: The neonatal TEG parameters have different intervals than adults, and the analysis results are also different from those of traditional coagulation tests, which need to be re‐investigated.
HC10
Burn Patients Have Abnormal Whole Blood Aggregation Regardless of Total Body Surface Area Percentage Burn
Amy E. Schmidt*1, Hannah McRae1, Sarah Magri1, Majed A. Refaai2 and Derek Bell1
1University of Rochester, 2Transfusion Medicine, University of Rochester
Background/Case Studies: The coagulopathy of trauma has been extensively studied over the last few decades. The value of viscoelastometry in guiding management of these patients have been well documented. Notably, studies about coagulopathy in burn patients are scarce. Several studies have shown that burn patients are hypercoaguable. However, most of these studies were done using samples collected after patient resuscitations or upon admission to the ICU. Additionally, although burn patients typically have normal to slightly elevated platelets, the platelet function has been questioned in several studies.
Study Design/Method: We conducted a prospective observational study of burn patients (≥18 years) presenting to our level 1 trauma center. TEGs were ordered by the burn team on various patients and were not done as part of the study. Citrated samples were collected at patient presentation. Whole blood aggregation studies were performed immediately. The remaining samples were processed immediately and the plasma was kept frozen at ‐80oC until testing. Additional samples were collected at days 3, 7, 10, 14, 21, and 28. Samples will be studied for microparticle number and identity, microRNA, cytokine/chemokine concentration, and coagulation factor (FVIII, FIX, FX, FV, FVII, PS, PC, von Willebrand factor antigen and activity) values.
Results/Finding: To date, 41 patients have been enrolled in this study, which is still ongoing. The majority of patients had thermal burns caused by flame exposure. The mean ( ± SD) age of patients was 47 ± 16 (range 20‐87 years) and 70.6% were male. The mean total body surface area burn (TBSA) was 9.7 ± 9.5 % (range 0.3‐38.3%). The mean number of RBCs transfused was 0.6 (range 0‐20 units). No patients received plasma or platelet transfusions and none died. Most TEG tracings were normal or had shortened R times. The mean platelet counts were within our reference range at all time points (Figure 1). Most patients had abnormal whole blood aggregation in response to ADP, collagen, and arachidonic acid. This was very obvious even in patients with as little as 1% TBSA burn. No patients with abnormal platelet activity were on any platelet inhibitor therapy.
Conclusion: The reason for this decreased platelet activity is unclear and further studies are ongoing. One theory is that the platelets may degranulate as a response to the acute phase reaction. This may produce higher percentage of platelet microparticles, which contribute to the hypercoaguable state that has been observed by others and by our TEG studies.
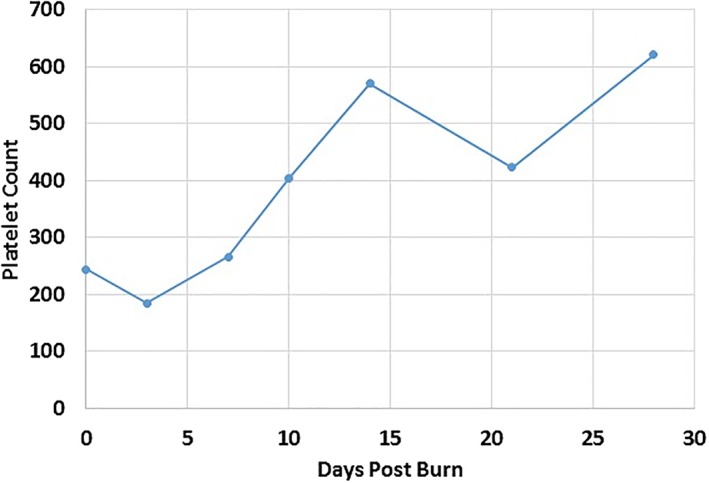
HC11
The Effect of Pathogen Reduction on Microparticle Prothrombinase Activity in Cryoprecipitate
Brooke A. Evans*1, Reed W. Kamyszek1, Andrea K. Ansari1, Mark G. Piegore2, Micah J. Mooberry2 and Ian J. Welsby3
1Duke University School of Medicine, 2Department of Medicine, University of North Carolina Medical Center, 3Department of Anesthesiology, Duke University Medical Center
Background/Case Studies: Rigorous donor screening and blood product testing has reduced transmission rates of infectious organisms during blood transfusion, but the risk for transmission of emerging pathogens persists. Pathogen reduction is a method of sterilizing blood products resulting in decreased pathogen load. Previous studies have demonstrated alterations to coagulation factor levels in pathogen reduced cryoprecipitate (PR‐cryo), but assessments of procoagulant microparticle (MP) activity after pathogen reduction are scarce in cryoprecipitate. The purpose of this study was to compare MP prothrombinase activity in samples of whole‐blood (WB) and apheresis‐derived (APH) cryoprecipitate with and without pathogen reduction.
Study Design/Method: In this IRB‐exempt study, donor plasma from group A donors was pooled and split to produce six identical APH and six identical WB cryoprecipitate units. PR treatment was performed on three APH and three WB units according to manufacturer recommendations with amotosalen and UVA light. The remaining three APH and three WB units served as non‐PR‐cryo controls. Procoagulant MP activity was assessed using a functional prothrombinase assay according to manufacturer instructions. Levels of thrombin were reported as phosphatidylserine (PS) equivalents. Comparisons between PR and non‐PR‐cryo groups were performed using independent samples t‐test with significant results declared at p<0.05.
Results/Finding: A significant decrease in prothrombinase activity was noted in WB PR‐cryo compared to WB non‐PR‐cryo, but no significant difference was measured between APH PR and non‐PR‐cryo (Table 1).
Conclusion: Findings in this small study suggest that pathogen reduction may decrease prothrombinase activity in cryoprecipitate. This could potentially be explained by the sequestration of MPs by the amotosalen adsorption device during pathogen reduction. Further quantitative thrombin generation assays and functional assessments with thromboelastometry to evaluate the hemostatic equivalence of PR‐cryo are warranted.
TABLE 1 Prothrombinase Activity in Cryoprecipitate with and without Pathogen Reduction
| PR (+) n=3 | PR (‐) n=3 | P‐value | |
|---|---|---|---|
| Apheresis Derived | |||
| PS Equivalents (nM) | 9.5 (1.2) | 12.4 (1.5) | 0.104 |
| Whole Blood Derived | |||
| PS Equivalents (nM) | 48.3 (12.4) | 180.2 (40.2) | 0.011 |
Averages reported as mean (SD)
HC12
Transfusion Hemosiderosis Could Be the First Step in a Two‐Hit Model for Transfusion Associated Circulatory Overload (TACO)
Philippe Renaudier*1, Francoise Bertrand2, Anne Damais3, Nathalie de Rekeneire4, Anne Schuhmacher5, Styliani Bartziali5, Andrée Heinricy5, Nicolas Malvaux5, Thierry Peyrard6 and Jean‐Claude Faber7
1Centre de Transfusion Sanguine ‐ Croix Rouge Luxembourgeoise, 2Hôpital Universitaire de Strasbourg, 3Hôpital Jacques Monod, 4Direction de la Santé, 5CTS‐CRL, 6Institut National de la Transfusion Sanguine, 7Association Luxembourgeoise des Hémophiles
Background/Case Studies: TACO is a cardiogenic pulmonary edema triggered by a transfusion. Patients with chronic heart failure are at high risk of TACO. Systolic heart failure is a well‐established risk factor, but diastolic failure might be more important (Lieberman L et al. TMR 2013; 27 : 206‐12).
Study Design/Method: Herein we report two cases of TACO in which a diastolic heart failure related to a transfusion iron overload could be the first hit.
Results/Finding: Case 1 : A 45 year old S/β sickle cell patient died 10 hours after liver transplantation indicated for haemochromatosis hepatic cirrhosis (Child & Pugh = 2). Diabetes and cardiac involvement with major iron overload in T2* and no signs of ventricular hypertrophy at the EKG (59% systolic ejection fraction with a major relaxation disorder) were associated diseases. Deferroxamine and deferasirox were introduced several times but stopped for side effects. Deferriprone was well tolerated but introduced too late. The patient died from post‐surgery intractable hemorrhage and cardiogenic shock during vascular filling. She previously had a Grade 2 TACO at D‐41 and a Grade 1 at D‐28, which only risk factors were diastolic heart failure related to hemosiderosis.
Case 2 : A 88 years old chronically transfused myelodysplasia patient received 47 Packed Red Cells (PRC) during 6 years, was referred to hospital for impaired general condition with fever. Upon arrival, her Hb was 7.8 g/dL. A CT‐scan showed hepatosplenomegaly. Two PRC were transfused slowly. Seven hours after completion, she experienced dyspnea with arterial desaturation, hypertension (180/70), bilateral crackles and increased BNP (2,747 pg/mL). IV furosemide and Isosorbide dinitrate were immediately administered, but the patient died of congestive heart and multiple organ failure. Because of the discrepancy between the severity of heart failure and any known cardiac history, a serum ferritin assay was retrospectively performed that showed a level >5,000 ng/mL.
Conclusion: Cardiac hemochromatosis is characterized by diastolic dysfunction, arrhythmia and at the late stage by dilated cardiomyopathy. In a retrospective study among 98 consecutive TACO cases, 13 (29.5%) had an ejection fraction < 50% whereas 24 (54.5%) showed evidence of diastolic dysfunction (Lieberman L et al). By analogy with Transfusion Related Acute Lung Injury, we propose a two‐hit model in which the red blood cells transfusion could be responsible for the first step by causing heart iron overload and consequently a diastolic dysfunction, and the second step by transfusing a fluid volume that remains intravascular. This hypothesis could result in considering iron chelation as a preventive measure to prevent TACO in chronically transfused patients.
HC13
Comparison of Two Point of Care Whole Blood Coagulation Analysis Devices and Conventional Coagulation Tests as a Predicting Tool of Perioperative Bleeding in Adult Cardiac Surgery ‐ a Pilot Prospective Observational Study in Japan
Rui Terada*1, Toshiyuki Ikeda1, Yoshiteru Mori2, Sho Yamazaki1, Kosuke Kashiwabara3, Haruo Yamauchi4, Minoru Ono4, Yoshitsugu Yamada2 and Hitoshi Okazaki1
1Department of Blood Transfusion, The University of Tokyo Hospital, 2Department of Anesthesiology and Pain Relief Center, The University of Tokyo Hospital, 3Department of Biostatistics, The University of Tokyo, 4Department of Cardiac Surgery, The University of Tokyo Hospital
Background/Case Studies: It is widely accepted that point of care whole blood coagulation test devices are useful to detect coagulopathies with real time manner in massively bleeding situation such as major cardiac surgery. However, its implementation is still limited in Japan because of their costs and lack of public insurance supports.
Study Design/Method: Fifty consecutive cases of elective cardiac surgeries with cardiopulmonary bypass were analyzed in this study. Blood samples were collected at three points, i.e. before surgery, just after termination of cardiopulmonary bypass and protamine administration, and after surgery, respectively. Laboratory data were measured by two point of care devices, TEG6s and Sonoclot, and routine coagulation /blood count tests, in all 150 collected blood samples from 50 cases. The data obtained by point of care devices were not provided to the clinicians, and consequently not to be used to determine transfusion indication on each case. First, we evaluated linear correlation of each laboratory examination's data by Pearson's test. Next, theoretical total blood loss was calculated by hemoglobin contents. Total amount of perioperative RBC transfusion was also recorded, and thorough clinical data were collected on each patient from the electronic records. We finally tried to establish a multi‐variate linear regression model to predict perioperative bleeding and RBC transfusion amounts by measured laboratory data and collected clinical parameters.
Results/Finding: In 50 cases included in this study, 40 cases received any type of transfusion, i.e., 39 cases of RBC transfusion (39%), 37 cases of plasma transfusion (37%), and 21 cases of platelet transfusion (42%), respectively. Average amount of RBC transfusion was 7.3 Japanese units (approximately 3.3 US units). Measured parameters of TEG6s/Sonoclot, routine laboratory platelet counts, and fibrinogen value were strongly correlated each other. On the contrary, ACT value of routine coagulation test was not correlated with TEG6s and Sonoclot parameters. In multi‐variate regression analysis, we failed to establish a rational and comprehensive linear regression model. Although operation time and ACT value at termination of cardiopulmonary bypass were strongly associated with perioperative bleeding and amount of RBC transfusion, extracted explanatory variables of Sonoclot/TEG6s paradoxically exhibited inverse correlation to bleeding tendency on platelet/coagulation functions, suggesting hidden confounding factors in this study population and the limitation of the study design. As only significant point of care test explanatory variable, Sonoclot PF value at termination of cardiopulmonary bypass was correlated to platelet transfusion volume as well as operation time and preoperative platelet count.
Conclusion: ACT value at termination of cardiopulmonary bypass can be a useful predictor of perioperative bleeding of major cardiac surgery. Although Sonoclot/TEG6s measurement parameters may be used as independent parameters to conventional ACT test, further intervention studies will be required to determine its usefulness in major cardiac surgery on the Japanese population.
PBM6
Elimination of “Other” as a Transfusion Indication Statistically Reduced the Number of Patients Who Were Transfused
Jessica L. Jacobson*1 and Lilly M. Sorkin2
1Bellevue Hospital‐NYULMC, 2The Brearley School
Background/Case Studies: Historically 25% of our RBCs orders were placed using “other” as the transfusion indication. The blood bank performs prospective auditing of all orders which contain a lab value as part of the indication. Although in many instances the patient satisfied a specifically approved transfusion indication, the ordering provider selected “other” to bypass the prospective auditing process. During 4Q15, “other” was removed as an indication from the CPOE system. Now if a physician needed to place an order outside of approved criteria, he/she would need to call the blood bank and explain why the RBC transfusion was required and document the reason in the patient's EMR. Removal of the “other” indication made the process of ordering potentially medically unnecessary RBCs harder. We sought determine the impact of this change on the total number of blood products and patients being transfused.
Study Design/Method: Quarterly transfusion statistics including the number of RBCs, SDPs, plasmas, and patients transfused from 1Q2014 to 4Q15 (pre‐elimination of “other”) were compared to those from 1Q16 to 4Q17 (post). The data was tested for statistical significance using the 2‐tailed Student's T‐test. The hospital's CMI data was evaluated to determine if there had been a change which might contribute to a decrease or increase in the need for transfusions.
Results/Finding: The fiscal year CMI increased during the study period from 1.156 in 2014 to 1.134 in 2015 to 1.186 in 2016 to 1.248 in 2017. From 1Q14‐4Q15, the quarterly average number of RBCs transfused was 1538.6 and 678.5 patients were transfused. Following removal of “other”, the quarterly average number of RBCs transfused was 1402.1 and 550.5 patients were transfused. Platelet transfusion rates remained stable, 314.5 pre and 306.9 post. The plasma transfusion rates varied widely (range: 180‐689 pre and 211‐683 post) largely based on the number of patients undergoing TPE. Although there was a decrease in the number of RBCs transfused, it was not statistically significant (p‐value=0.07). The decrease in the number of patients transfused per quarter, however, was statistically significant (p‐value<0.018).
TABLE 1 (PBM6) Number of Transfusions Pre‐ and Post‐Elimination of “Other” Indication
| Number RBCs Transfused | Number SDPs Transfused | Number Plasmas Transfused | Number of Patients Transfused Any Blood Product | Mean Number RBCs Transfused per Quarter | Mean Number Patients Transfused per Quarter | ||
|---|---|---|---|---|---|---|---|
| Pre‐Elimination of “Other” | 1Q14 | 1392 | 279 | 556 | 687 | 1538.6 | 678.5 |
| 2Q14 | 1492 | 388 | 556 | 708 | |||
| 3Q14 | 1604 | 340 | 256 | 673 | |||
| 4Q14 | 1583 | 301 | 326 | 625 | |||
| 1Q15 | 1636 | 358 | 479 | 557 | |||
| 2Q15 | 1384 | 266 | 180 | 692 | |||
| 3Q15 | 1652 | 290 | 339 | 762 | |||
| 4Q15 | 1566 | 294 | 689 | 724 | |||
| Post‐Elimination of “Other” | 1Q16 | 1473 | 281 | 683 | 730 | 1402.1 | 550.5 |
| 2Q16 | 1464 | 324 | 308 | 709 | |||
| 3Q16 | 1259 | 337 | 338 | 536 | |||
| 4Q16 | 1557 | 307 | 211 | 475 | |||
| 1Q17 | 1368 | 280 | 246 | 502 | |||
| 2Q17 | 1458 | 343 | 416 | 504 | |||
| 3Q17 | 1300 | 279 | 345 | 455 | |||
| 4Q17 | 1338 | 304 | 377 | 493 | |||
| p‐value | 0.07 | <0.018 | |||||
Conclusion: Eliminating the option of selecting “other” as a transfusion indication resulted in fewer total RBC units being transfused and fewer patient being transfused despite the increase in CMI. At the current RBC acquisition cost of approximately $200 per unit, elimination of medically unnecessary RBCs saves roughly $25,600 per quarter or $102,400 annually.
PBM7
Focused Evaluation of Single‐Unit Plasma Transfusions in a Tertiary Care Academic Medical Center
Thomas Fay*, Daniela Hermelin and Douglas Blackall
Department of Pathology, St. Louis University School of Medicine
Background/Case Studies: In comprehensive patient blood management (PBM) programs, common metrics to promote desirable transfusion practice include single‐unit RBC and platelet transfusions. In the course of a concurrent blood utilization audit, as part of an institutional PBM program, a surprising number of single‐unit plasma transfusions were identified. These transfusion events are the basis for the current study.
Study Design/Method: Data for 2017 plasma transfusions, at an academic, tertiary care hospital, were obtained by interrogating the electronic health record system. Single‐unit plasma transfusions were identified. A proximate pre‐transfusion INR value served as the basis for dividing the study population into two groups: patients with INR values ≤1.5 and patients with INR values >1.5. The subgroup of patients with INR values of ≤1.5 was the primary focus of this study. Additional study data for this group included the transfusing clinical service, a post‐transfusion INR value obtained within 24 hours of transfusion (if available), and the probable indication for transfusion. Only adult patients were included in this study. Patients transfused in either the operating room or the post‐anesthesia care unit were excluded. No distinction was made between the type of plasma product transfused (i.e. FFP versus PF24).
Results/Finding: A total of 2,887 units of plasma were transfused, of which 395 (∼14%) were single units. Of these, 328 met the inclusion criteria for review and had the following pre‐transfusion INR values: range of 1.0 to 9.3, mean of 2.3, and median of 2.0. Of these 328 single‐unit transfusions, 273 were associated with INR values exceeding 1.5 and 55 were associated with INR values of 1.5 or less. This latter group, with a high probability of inappropriate transfusion, underwent further study. Of this group, the mean and median pre‐transfusion INRs were 1.35 and 1.4, respectively. The majority of the units transfused (42/55), were attributed to surgical subspecialties and emergency medicine. A post‐transfusion INR was available for most transfusion events and demonstrated no significant change from the pre‐transfusion baseline. Finally, the most common indications for transfusion that could be discerned included hypovolemia and bleeding (i.e. plasma transfused with red blood cells).
Conclusion: A daily audit of plasma transfusions revealed that single‐unit transfusion events are relatively common and include transfusions to patients with normal coagulation values. Surgical subspecialties and emergency medicine accounted for the majority of these transfusions. These likely represent inappropriate transfusions and opportunities to improve practice institutionally. Though single‐unit red cell and platelet transfusions represent desirable practices, single‐unit plasma transfusions are an undesirable quality improvement metric.
PBM8
Occurrence of Transfusion Associated Hyperkalemia in Pediatric Population in Two Facilities
Chisa Yamada*1, Meghan Delaney2, Angela C. Lee2 and Maureen Edelson3
1University of Michigan, 2Children's National Health System, 3Nemours/A.I. duPont Hospital for Children
Background/Case Studies: Hyperkalemia is a rare life‐threatening complication of RBC transfusion. Stored RBCs leak intracellular potassium (K) due to an inhibition of the membrane ATP pump and gamma irradiation potentiates the K leak further. RBC transfusions administered slowly have been shown to have little effect on serum K concentrations, however, massive and rapid transfusions may cause temporal hyperkalemia, especially when the patient's total blood volume is small and the serum K in the transfused product is high. While there are many case reports, the occurrence of transfusion associated hyperkalemia (TAH) and characteristics of patients and implicated blood products have not been studied systematically. A multi‐institutional study of TAH was conducted through the AABB Pediatric Subcommittee, and the data from two facilities is reported here.
Study Design/Method: For the study period of 9/1/2015‐8/31/2016, medical records of patients aged <18 years old who had K levels above reference range within 12 hours after or during a RBC transfusion were reviewed for patient demographics, medical history and co‐morbidities, symptoms and treatment for hyperkalemia, as well as the age, volume, and modifications of transfused RBC units.
Results/Finding: Total 2,085 patients received total 11,586 RBC transfusions. Hyperkalemia within 12 hours after or during the RBC transfusion was found in 14 patients (0.67%) who received 41 RBC transfusions (42% irradiated). Median K increase from previous K level before the hyperkalemia was 1.6 mmol/L. Patient's median age and weight at the time of transfusion was 0.2 years old and 4.9 Kg respectively. All patients had serious co‐morbidities including prematurity in 5 patients, cardiac dysfunction in 8, renal disease in 4, sepsis in 3 and brain lesions in 2 patients. High volume of RBCs was used for extracorporeal membrane oxygenation (ECMO) in 4 patients, which was not associated with mortality. Mortality occurred in 4 patients within 3 days of hyperkalemia occurrence. Among them, 3 patients had decreased follow‐up K after hyperkalemia occurrence (2 were treated for hyperkalemia), and 1 patient (0.05%) died soon after hyperkalemia was noted during the transfusion. This patient was transfused 55% of patient's estimated total blood volume with irradiated RBCs within 3 hours before the hyperkalemia occurrence. Overall, 14 patients received median 77% of estimated total blood volume within 12 hours before hyperkalemia occurrence and median age of RBC units transfused was 13.0 days old.
Conclusion: Fourteen patients (0.67%) experienced hyperkalemia within 12 hours after or during RBC transfusions and 1 patient had hyperkalemia at the time of death possibly attributable to RBC transfusion. Patient's median age and weight at the time of hyperkalemia with transfusion were 0.2 years old and 4.9 Kg respectively. Cardiac dysfunction was the most common risk factor for possible TAH, and prematurity, renal dysfunction and ECMO associated massive RBC transfusion were also associated with higher risk of TAH. Additional data from other facilities is pending.
PBM9
Perioperative Tranexamic Acid Utilization Patterns in High‐Risk Non‐Cardiac Surgery: A Retrospective Cohort Study
Brett L. Houston1, Emily Krupka2, Thomas Mutter2, Dean A. Fergusson3, Jamie Falk2, Jo Ann Colas4, Malia Murphy4, Rodney Breau3, Alexis F. Turgeon5 and Ryan Zarychanski*1
1University of Manitoba / CancerCare Manitoba, 2University of Manitoba, 3The Ottawa Hospital Research Institute / University of Ottawa, 4The Ottawa Hospital Research Institute, 5Université Laval
Background/Case Studies: Tranexamic acid (TXA) is an inexpensive and widely available anti‐fibrinolytic agent known to reduce red blood cell (RBC) transfusion in cardiac surgery and selected orthopedic surgeries. While its use in cardiac surgery is routine, its use and effectiveness in non‐cardiac surgeries with comparable rates of bleeding and transfusion are uncertain. The objective of this study is to evaluate TXA utilization patterns in non‐cardiac surgeries at high risk for transfusion.
Study Design/Method: To accurately characterize TXA use in non‐cardiac surgeries at high risk of perioperative RBC transfusion, we completed a retrospective cohort study to evaluate all patients ( ≥ 18 years of age) undergoing non‐cardiac surgery at five hospitals in two cities between January 1, 2014 and December 31, 2016. We identified non‐cardiac procedures at high risk for transfusion using the standardized Canadian Classification of Health Interventions (CCI) procedure codes contained within the hospital Discharge Abstract Database (DAD). We linked the DAD with transfusion databases and laboratory databases to obtain supplementary transfusion and laboratory data. To evaluate contemporary TXA utilization patterns in the identified cohort of high‐risk procedures, we performed a chart review (n=2000 charts) and database query. We described the proportion of patients who received intraoperative TXA. We also described details of TXA dosing.
Results/Finding: In 5 cities, we identified 95 non‐cardiac open surgeries associated with a transfusion rate ≥5%. In this cohort, tranexamic acid was used in 13.3% of surgeries (range 0% to 83%). TXA usage was highest in orthopedic and spine surgeries, including total hip arthroplasty (75%), femur osteotomy (74%), pelvic osteoplasty/osteotomy (56%), vertebrectomy (48%) and vertebral fusion (45%). When we excluded orthopedic and spine surgeries, TXA use was limited to 2% of open surgeries. The mean time from the operation start time to TXA administration was 97 minutes (77 minutes). TXA was administered as a bolus in 91%, and as an infusion in 28%. The mean TXA dose was 940 mg ( ± 239 mg).
Conclusion: Tranexamic acid is routinely used in cardiac, orthopedic and spine surgery, yet utilization in other surgical domains at high risk for perioperative red blood cell transfusion remains low.
PBM10
Blood Utilization, Mortality, and Costs for Transfused Victims of Gun Violence
Eric Gehrie*, Vincent M. Demario, Rica Buchanan, Mara Serbanescu, Eric Wang, Mariuxi Manukyan, David Efron, Kathy Noll, Paul M. Ness, Steven M. Frank and Robert Sikorski
Johns Hopkins Medical Institutions
Background/Case Studies: Massive transfusion protocols are associated with decreased mortality and improved hemostasis in adult trauma patients. Each year, greater than 30,000 deaths and 65,000 injuries are attributed to firearms in the United States however transfusion requirements for these patients are not well understood. In this study, we sought to determine how blood utilization and mortality differs between victims of gun violence versus victims of non‐gun related trauma for patients requiring transfusion at a level‐1 trauma center in an urban setting. We also assessed the cost of transfusion in these patients.
Study Design/Method: The State Trauma Registry was reviewed for all trauma patients who presented to a tertiary care facility from January 2005 to June 2017. The study population was limited to patients who received any blood product during their hospital course. Patients were categorized based on mechanism of injury: 1) gunshot wound (GSW) or 2) all other trauma (non‐GSW), and the number and type of all blood products were assessed. The primary outcomes were mortality, blood utilization, and the cost of transfusion – with costs assessed by two methods: 1) blood acquisition costs, and 2) activity‐based costs (total cost of transfusion including overhead).
Results/Finding: Data are shown in the table. The GSW patients were younger, more likely to be male, and had a higher injury severity score. Among the 1,336 trauma patients requiring blood product administration, 538 were victims of gun violence (40.3%). Mortality in the Emergency Department (ED) was ≈6 times higher, and overall mortality was ≈2.5 times higher in the GSW cohort compared to the non‐GSW cohort. GSW patients requiring transfusion demonstrated an approximate 13% ED mortality and a 33.5% overall mortality. GSW patients received on average ≈2 times the amount of blood products per patient compared to non‐GSW patients (including PRBCs, FFP, platelets, and cryoprecipitate). For the 540 transfused GSW patients, ≈$6 million went to activity‐based transfusion costs. The average transfusion cost per patient was ≈2 times higher in GSW victims versus non‐GSW trauma patients.
Conclusion: Compared to other traumatic injuries, gunshot‐associated injuries are associated with substantially greater mortality as well as greater blood utilization and costs. Transfused GSW patients are a select high‐risk group, since previous reports from our own institution including all GSW victims (transfused or not) report one‐half the mortality rate we report here.
(PBM10)
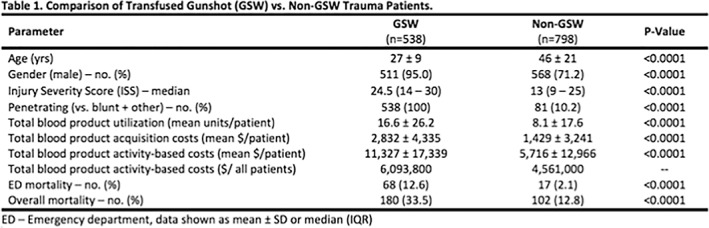
PBM11
A Retrospective Comparison of Salvaged Blood Recovery Using Continuous vs. Discontinuous Washing Device in Pediatric Cardiac Surgery: A 5‐Year Timeline
Margaret A. McGill‐Zimny*, Nicole B. Miller, Rae Nason, Chelsea Conn, Adam Knutson, Pamela M. Johnson, Camille Van Buskirk and Paula Santrach
Mayo Clinic
Background/Case Studies: Prior to 2015, one type of blood salvage device was available for surgical cases at our institution. The Medtronic Autolog® salvage device utilizes a discontinuous fixed volume bowl which requires a minimum of 135 mL of RBCs to produce a unit. This created limitations for pediatric low‐ volume‐blood‐loss cases. The Fresenius Continuous Auto transfusion System® (CATS) is a salvage device that utilizes a chamber that can continuously wash low volumes of blood and requires a minimum of 15 mL of RBCs to produce a unit. In early 2015, the CATS was implemented to accommodate low blood volume loss cases. This study evaluated the pre and post implementation of the CATS device for pediatric cardiac cases.
Study Design/Method: Processed blood recovery volumes from patients ≤ 30 kilograms (kg) were compared with each device from 2012‐2017. Additional key factors that were included were patient weight and age. Cases that did not recover salvaged blood for reinfusion (NETP) were also compared between the two devices.
Results/Finding: From January 2012 – September 2014, 222 pediatric cardiac cases requested intraoperative blood salvage in which the Autolog® was utilized. From October 2014 – December 2017, 375 pediatric cardiac cases utilized the CATS® device for intraoperative blood salvage. The means, standard deviations and p values are shown in the table below.
(PBM11)
| Mean ± SD | # of total cases | Volume Recovered (excludes NETP) (mL) | Patient Weight (kg) | Patient Age (average years) |
|---|---|---|---|---|
| Autolog | 135 | 184.8 ± 109.8 | 12.3 ± 7.7 | 2.8 ± 3.2 |
| CATS | 301 | 167.3 ± 191.8 | 10.7 ± 2.6 | 1.9 ± 2.6 |
| P value | 0.3230 | 0.0014 | 0.0020 | |
| Mean ± SD | # NETP‐only cases | Volume Recovered (mL) | Patient Weight | Patient Age |
| Autolog | 87 (40%) | 0 | 8.7 ± 5.8 | 1.2 ± 1.8 |
| CATS | 74 (20%) | 0 | 9.2 ± 6.6 | 1.6 ± 2.5 |
| P value | 0.6118 | 0.2411 |
Conclusion: When comparing blood recovery, each device processed similar blood volumes. The CATS® device recovered statistically significantly more blood volume from patients of smaller weight and younger age than the Autolog ®. Overall, approximately 40% of pediatric cardiac cases were NETP while using the Autolog®. Of the 375 CATS® cases, 20% were NETP. Post implementation of the CATS® has allowed for greater blood volume recovery in pediatric cardiac cases.
PBM12
Iatrogenic Anemia and Transfusion within the Medical ICU Patient Population
Lindsey Wlosinski*1 and LeeAnn Walker2
1Henry Ford Hospital, 2University of Texas Medical Branch
Background/Case Studies: Patients admitted to the Medical Intensive Care Unit (MICU) have frequent blood collection for laboratory testing. They are also often transfused to correct anemia. The goal of this study is to understand if laboratory phlebotomy is cause for anemia and subsequent transfusion within the MICU at this facility. The specific aims of this investigation are to (1) investigate patient's anemia status, (2) quantitate the volume of blood lost from diagnostic phlebotomy, (3) identify relation of laboratory phlebotomy to transfusion, and (4) determine if clinicians are following transfusion trigger guidelines at this facility.
Study Design/Method: A prospective and retrospective cross‐sectional study investigated non‐pediatric MICU patients who were transfused (n=120) and who had no transfusion (n=120) between January 1 and June 30, 2017. This study utilized this facility's Laboratory Information System and Electronic Medical Record system to identify (1) patient demographics, diagnosis, and anemia status (pre‐admission, specified or undetermined), (2) hemoglobin (Hgb) tracking during admission, (3) transfusion triggers, (4) laboratory phlebotomy performed, and (5) number of RBC units transfused. Chi Square and t‐tests were used to analyze the data.
Results/Finding: For the study population investigated, an undetermined anemia status was identified for the majority of transfused (39%) and untransfused (73%) patients. The mean total phlebotomy blood loss in transfused patients was 280.18 mL while the phlebotomy blood loss of untransfused patients was 131.23 mL (p < 0.0001). 38% of transfused patients only received 1 unit of RBC's during their admission. The change in Hgb from admission to discharge was interpreted and with 95% confidence it was determined that Hgb values changed between ‐1.37 and ‐0.33 g/dL between groups. The overall change in Hgb was not significant between groups (p=0.015). Transfusion triggers initiated by clinicians had a mean Hgb value of 6.64 g/dL and median Hgb of 6.70 g/dL.
Conclusion: There is evidence to suggest that iatrogenic anemia is a cause for transfusion in the MICU population at this facility. Though the transfused population was admitted with lower Hgb levels, discharge Hgb levels were lower in both study and control groups. Higher Hgb levels in the control group possibly mitigated the need for transfusion intervention. Also, an undetermined anemia classification was identified in the highest frequency for both study populations. These data may relate to diagnostic phlebotomy and iatrogenic anemia within the transfused population. Many patients received only 1 unit of RBCs (average volume 320 mL) during the admission which corresponds to the average total blood loss. Based on transfusion trigger data and guidelines at this facility, clinicians are not unnecessarily transfusing patients in the MICU patient population.
PBM13
Efficacy of Low and High Dose Prophylactic Platelet Transfusion Therapy in Hematology‐Oncology Patients
Yashaswi Dhiman1, Ratti Ram Sharma*1, Pankaj Malhotra1, Rekha Hans1 and Neelam Marwaha2
1Postgraduate Institute of Medical Education and Research, 2Department of Transfusion Medicine, PGIMER
Background/Case Studies: It is important to determine an optimal platelet dose in thrombocytopenic patients for the judicious use of this scarce resource. This can be achieved by transfusing platelets in different doses and comparing their post transfusion response indicators.
Study Design/Method: This prospective study was performed to compare the efficacy of low and high dose with standard dose of Single Donor Apheresis Platelet (SDAP) transfusions in terms of platelet transfusion response indicators ‐ Corrected Count Increment (CCI) and Percent Platelet Recovery (PPR) and their correlation with patient's clinical profile.
A total of 28 stable, non‐refractory hemato‐oncology patients were enrolled in the study after fulfillment of inclusion criteria. The study was approved by the Institute Ethics Committee. Patients received apheresis platelets as low dose (1.5X10¹¹platelets /unit), medium dose (3x10¹¹ platelets/unit) and high dose (>4X10¹¹platelets/unit) at different time points in a sequence of standard, low and high dose as and when a request was received based on his/her pre transfusion platelet count and clinical profile. The post transfusion counts were assessed after 20‐24 hours of transfusion and post transfusion response indicators were calculated in terms of platelet increment, corrected count increment (CCI), percent platelet recovery (PPR). Transfusion free interval and the bleeding events were also recorded for different doses.
Results/Finding: Post transfusion response indicators CCI and PPR were comparable for standard dose (CCI=12553 ± 7598, PPR=36.11 ± 24) and low dose (CCI=12279 ± 10842, PPR=35.00 ± 31.7). Post transfusion increments were comparable with standard (22318.18 ± 12159) and high dose (22636.3 ± 18062), however CCI (p=0.006) and PPR (p=0.008) were better with standard dose and were statistically significant. Higher post transfusion increments were observed with high dose as compared to low dose, however CCI (p=0.04) and PPR (p=0.05) were better with low dose and were statistically significant. The transfusion free interval after the standard dose, low dose and high dose was 3.71 ± 3.4 days, 3.36 ± 4.4 days and 7.24 ± 7.9 days respectively, however,the difference was not statistically significant. Donor exposure to patients was significantly (p=0.000) reduced to 17.5% owing to the splitting of platelet products to form customized doses for the transfusion
Conclusion: Standard dose of apheresis platelets is the best choice for adequate post transfusion response in hemato‐oncology patients however, the possibility of low dose as an alternative to standard can be considered in stable thrombocytopenic patients owing to the comparable post transfusion response indicators (CCI and %PPR) in the two groups
PBM14
The Hematology Blood Utilization Calculator: An Adaptive (Learning) Algorithm for Management of the Transfusion Dependent Patient
Joseph Connor*1, Thomas Raife1, Joshua Medow2, Ryan Mattison3, Mark Juckett3, Moniba Nazeef3, Meredith Winkelhake4 and Tony Frey5
1Department of Pathology and Laboratory Medicine, University of Wisconsin Hospital and Clinics, 2Department of Neurologic Surgery, University of Wisconsin, 3Department of Medicine, Division of Hematology/Oncology, University of Wisconsin, 4University of Wisconsin Hospital, 5Information Services, University of Wisconsin
Background/Case Studies: Target based transfusion strategies aim to provide enough blood to achieve a selected target Hgb/HCT. Due to the significant variability in response to transfusion in the transfusion dependent patient, blood is usually ordered empirically rather than to achieve a specific goal for Hgb or transfusion schedule. In these patients both the dose of red cells transfused and the degree of red cell production influence how long a given transfusion may keep a specific patient above a desired target Hgb. An individualized model to guide transfusion could improve the precision of ordering and reduce unnecessary visits as well as units transfused. Based on this we developed a computer algorithm for decision support capable of individualized transfusion recommendations for the transfusion dependant patient.
Study Design/Method: The Hematology Blood Utilization Calculator or HEME BUC predicts an individual patient's response to transfusion based on data from past transfusions. The calculator pulls information from the electronic medical record to calculate transfusion half‐lives for up to 6 prior transfusions. These half‐lives are used predict the response to future transfusion given the patient's current Hgb and weight. Options are then presented to the ordering provider to select a transfusion dose, in units, which determines a follow‐up time over which the patient is expected to stay at or above the selected target Hgb. We performed a prospective pilot of the HEME BUC in patients with transfusion dependent anemia with the primary outcome being the percentage of patients that return as scheduled with a Hgb at or above (within 0.5g/dL) the selected target in an intent to treat fashion.
Results/Finding: Over nine months, 148 transfusions were ordered using the HEME BUC of which 117 had complete data for analysis. A target Hgb of 8 was selected in 80% of cases. Forty‐five percent of transfusions were single unit and 55% were two units, which represents a significant increase in single unit transfusions from historic orders. The mean predicted time to return after transfusion was 10.5 days and 75% of patients had follow‐up within 3 days of the selected BUC return time. Overall, in 91% of transfusions, patients returned with a Hgb at or above target.
Conclusion: The HEME‐BUC provides flexible and individualized transfusion recommendations in transfusion dependent patients using an adaptive mathematic algorithm that learns from each patient's personal experience with RBC transfusion. Within the options presented by the HEM‐BUC, over 90% of patients remain at or above the target hemoglobin selected by the ordering provider. Further studies to expand the role of such adaptive/learning decision support technologies are ongoing.
PBM15
Efficacy of Intravenous Iron Administration in Women with Heavy Uterine Bleeding – a Retrospective Study
Soraia Campaniço, Catarina Jacinto Correia, Ana Oliveira* and Carla Pereira
CHLN ‐ Hospital de Santa Maria
Background/Case Studies: Heavy uterine bleeding (HUB) has been reported to cause iron deficiency anemia in one‐fifth to two‐thirds of affected women. HUB not only carries important clinical problems, but also emotional and social issues, limiting normal activity and affecting significantly the quality of life. Anemia due to HUB can potentially be treated with iron therapy.
The objective was to evaluate efficacy of intravenous administration of ferric carboxymaltose in correcting iron deficiency anemia due to heavy uterine bleeding using real life data from a Terciary Center/Hospital with a DayCare Hospital dedicated to Patient Blood Management (PBM).
Study Design/Method: Retrospective study with selection of 24 women referred to the ImmunoHemotherapy DayCare Hospital from the Gynecology/Obstetrics Department with a medical appointment between January to April 2018 with diagnosed iron‐deficiency anemia secondary to HUB due to non‐oncological causes.
Collection of laboratory data, including hemoglobin concentration, ferritin levels and transferrin saturation previous to administration of intravenous ferric carboxymaltose and comparing those values 3‐4 weeks after therapy, observing the effect of iron therapy in anemia and body iron stores on this subset of anemic patients.
Results/Finding: The medium age of the women referred from Gynecology appointments after the diagnose of iron‐deficiency anemia for follow‐up and management in the ImmunoHemotherapy DayCare Hospital and selected for the study was 44.9 years.
Previous to therapy, the medium hemoglobin concentration was 8.43 g/dL, with a ferritin medium value of 15.2 ng/mL and a medium transferrin saturation of 7.57%.
On laboratory reevaluation 3‐4weeks after intravenous iron therapy, there was a rise in hemoglobin concentration to a medium of 12.9 g/dL (increase of 4.47 g/dL).
There was also a ferritin increase of 194 ng/mL to a medium of 209 ng/mL and an improvement on transferrin saturation, with an increase of 19%, obtaining medium values of 26%.
Of those women treated on the first visit, 75% didn't need additional intravenous iron therapy on reevaluation. There was also report of improvement of clinical symptoms and quality of life.
Conclusion: Women with HUB commonly have iron deficiency anemia, therefore it is important to assess iron body stores on these patients and if appropriate, initiate the most adequate treatment. It is also important to establish good inter‐department communication between the different medical specialties that will provide the assessment, follow‐up and treatment to this particular subset of the population – a well‐established protocol between the Gynecology/Obstetrics department and the ImmunoHemotherapy DayCare Hospital is essential to a better management of anemia in these patients and to facilitate the referral procedures and reduce the time until proper treatment.
Intravenous iron is a safe and effective therapy, with quick replenishment of body iron stores and correction of anemia with few administrations and is therefore the therapeutic of choice in this particular clinical entity.
PBM programs have facilitated the interdisciplinary management of anemia while reducing blood transfusions whether in medical settings as well as perioperative settings and should continue to be implemented.
PBM16
Patient Blood Management (PBM) Applied to the Surgical Practice of an Academic Medical Center Yields Significant Reductions in Transfusion Utilizations
Andrew Higgins*, Justin D. Kreuter, Matthew A. Warner, Eapen K. Jacob, Jennifer Burt, Nageswar Madde, James R. Stubbs and Daryl J. Kor
Mayo Clinic
Background/Case Studies: Patient Blood Management (PBM) principles are highly applicable to surgical practices. An ideal PBM approach is multifaceted, multi‐modal, and multidisciplinary in design, implementation, and execution. The goal of this investigation was to assess changes in transfusion behaviors before and after implementation of a robust PBM program at a large tertiary care surgical center.
Study Design/Method: This is a single center observational study of PBM implementation for a large and diverse surgical practice from 2012 through 2017. Formal multidisciplinary PBM efforts were initiated early in 2014. This consisted of multiple simultaneous interventions, including education (presentations and online training modules), standardization of transfusion guidelines, and electronic clinical decision support (CDS) rules for transfusion ordering, advanced transfusion analytics, and provider specific transfusion reports. Transfusion data derived from 2012 and 2013 were used as baseline information. The majority of the PBM efforts were initiated in early 2014 with the subsequent years comprising the post‐implementation cohort. Outcomes included annual blood product transfusion totals and percentages. For surgical patients receiving at least one unit of allogeneic RBCs the frequency and percentage of patients discharged from the hospital with hemoglobin values > 10 g/dL was also assessed.
Results/Finding: A total of 293,139 surgical patient admissions were included, with the annual surgical volume increasing by 8.8% from 2012 to 2017 (46,785 to 51,310; p < 0.05). The percentage of surgical patients transfused with one or more units of allogeneic RBCs decreased from 11.2% to 7.7% over the study period (p < 0.05). The percentage of patients receiving plasma decreased from 3.7% to 2.5%(p < 0.05), with relative stability in platelets (2.8% to 2.7%), and cryoprecipitate (1.0% to 1.3%) utilization. For the patients receiving RBCs, the number of patients discharged with hemoglobin values >10 g/dL decreased by more than 40% (21.1% to 11.9%; p<0.05)
Conclusion: PBM implementation efforts for a large surgical practice were associated with substantial reductions in RBC and plasma transfusions, with minimal effect on the utilization of platelets and cryoprecipitate. Additionally, patients receiving RBCs were more likely to be discharged with hemoglobin values < 10 g/dL, suggesting increased tolerance of postoperative anemia. Further efforts are underway to assess relationships between changes in transfusion patterns and patient centered outcomes.
PBM17
Red Blood Cell Product Utilization in Patients Undergoing Allogeneic Stem Cell Transplantation
Karen Gastecki*1, Ryan Shanley2, Julie Welbig3, Claudia S. Cohn3 and Claudio G. Brunstein3
1University of Minnesota Medical Center, Fairview, 2University of Minnesota Masonic Cancer Center Biostatistics Core, 3University of Minnesota
Background/Case Studies: The transfusion of red blood cells (RBC) is essential for hematopoietic stem cell transplants (HCT). The risk of transfusion reactions (TR) and the cost of blood has led to efforts to reduce blood use. Patient blood management (PBM) recommendations include transfusing 1 rather than 2 units when RBC are needed. We changed our inpatient practice to transfuse just 1 instead of 2 units of red blood cells (RBC) when HCT patient's hemoglobin < 8g/dl. Our hypothesis is that this would reduce RBC utilization. We describe the impact of this change on RBC utilization, prevalence of transfusion reactions, and nursing staff workflow.
Study Design/Method: We included patients > 18 years who received an allogeneic HCT between 7/1/2015 – 6/30/2017. On 7/1/2016 we changed our practice to transfuse 1 instead of 2 units of red blood cells (RBC) when the hemoglobin was < 8g/dL. We compared RBC utilization in patients receiving allogeneic HCT in the 12 months before (control arm) and after implementation of this new practice (intervention arm). We used regression models to estimate the independent effect of transfusion practice (1 vs. 2 units/episode), length of hospitalization, the conditioning regimen, and donor type for patients who received at least 1 RBC unit. The outcome variable was total number of inpatient transfusions. In addition, a survey assessed the impact of this.
Results/Finding: 176 patients were included in this analysis (100 in control group; 76 in the intervention arm). Cohorts were matched for age, primary diagnosis, graft source and conditioning regimen. The median number of RBC units transfused/patient was identical in both arms (4. Interquartile range 1‐9 units/patient). The mean number of RBC transfusions were 7.2 vs 6.1; however, this difference was attributable to a few highly transfused patients. Using the regression model, only length of stay (relative increase of 1.035 units/day; 95%CI, 1.027‐1.044) was an independent predictor of the number of RBC units a patient received. When data were normalized/1000 patient days, the control arm received 230 units vs the intervention arm, which received 195 units, resulting in a reduction of 35 units transfused/1000‐patient‐days. There were 0.07 TR/patient (standard deviation [SD]: 0.29) for the control arm vs 0.05 reactions/patient SD: 0.23) in the intervention arm. The survey of RNs showed that 39 (78%) felt that it positively affected the workflow, 10 (22%) were neutral, and 1 RN felt it had an adverse impact.
Conclusion: We found no significant difference in the median number of RBC units transfused and the number of transfusion reactions per patient, as compared to historical controls. There was a modest reduction in RBC utilization based on units transfused/1000‐patient‐days. In addition, there was a positive impact on RN workflow.
PBM18
Transfusion Trends of Whole Blood and Blood Components in Electronic Health Records and Claims Databases
Kinnera Chada*1, Joyce Obidi1, Joann Gruber1, Graca Dores1, Emily Storch1, Alan Williams1, Juan Banda2,3, Saurabh Gombar2, Deepa Balraj2, Ross Hayden4, Daniel Hood4, Thomas Falconer3,5, Karthik Natarajan3,5, Eldar Allakhverdiiev3,6, Sara Dempster3,7, Christian Reich3,7, Nerissa Williams7 and Azadeh Shoaibi1
1Center for Biologics Evaluation and Research (CBER), Food and Drug Administration, 2Stanford University, 3Observational Health Data Sciences and Informatics, 4Regenstrief Institute, 5Columbia University, 6Odysseus Data Services Inc., 7IQVIA
Background/Case Studies: Assessment of whole blood and blood component utilization comprises a vital piece of information to promote optimal and safe blood supply management. While some clinical guidelines have been developed for blood component use over the past decade, the practical impact of these guidelines is uncertain. The aim of this study is to assess the prevalence of whole blood and blood component transfusion in the Biologics Effectiveness and Safety (BEST) Initiative from 2010 to 2017.
Study Design/Method: We used electronic health records and health claims databases from the BEST Initiative, a Center for Biologics Evaluation and Research (CBER) Sentinel Program component. Three data partners participated and provided records for approximately 27 million patients. Transfusion events were captured using medical billing and reimbursement data, including the International Classification of Diseases Clinical Modification – Ninth or Tenth Revision (ICD9‐CM or ICD10‐CM), Current Procedural Terminology (CPT), and Healthcare Common Procedure Coding System (HCPCS) codes. These codes were further categorized to identify transfusion events for whole blood, red blood cells (RBC), platelets, and plasma. An event was defined as occurrence of component specific codes per person regardless of the number of units transfused.
Results/Finding: Table 1 shows transfusion of whole blood and blood components from 2010 to 2017. Of the 390,168 total transfusion events in this period, RBC comprised most of transfused components (n=269,402; 69%) with platelets, plasma, and whole blood accounting for 91,130 (23%), 26,164 (6.7%), and 3,472 (0.9%), respectively. Over this period, overall transfusion events and that of whole blood decreased. The transfusion of plasma and platelets slightly fluctuated whereas RBC transfusions had a slight increase in 2011 but showed a decline from 2012 to 2017.
TABLE 1 (PBM18) Transfusion trends in the BEST Initiative 2010‐2017
| Year | 2010 | 2011 | 2012 | 2013 | 2014 | 2015 | 2016 | 2017 | Total |
|---|---|---|---|---|---|---|---|---|---|
| Whole Blood | 1,299 | 698 | 361 | 307 | 342 | 202 | 156 | 107 | 3,472 |
| RBC | 44,224 | 46,407 | 43,259 | 39,150 | 32,014 | 25,613 | 19,716 | 19,019 | 269,402 |
| Plasma | 3,665 | 3,027 | 2,838 | 2,705 | 3,360 | 3,571 | 3,719 | 3,279 | 26,164 |
| Platelets | 12,810 | 12,781 | 11,601 | 10,836 | 12,048 | 11,363 | 10,414 | 9,277 | 91,130 |
| All Transfusions | 61,998 | 62,913 | 58,059 | 52,998 | 47,764 | 40,749 | 34,005 | 31,682 | 390,168 |
Conclusion: This study demonstrates that medical billing and reimbursement data in medical records capture blood transfusions and provide additional capability for the CBER hemovigilance system. We observed an overall decline in whole blood and RBC transfusions between 2010 and 2017 in the Sentinel BEST Initiative. Hemovigilance activities, including whole blood and blood component utilization trends, can inform and encourage implementation of transfusion guidelines for managing blood resources in the United States.
PBM19
Appropriateness of Red Blood Cell Transfusion Following Computerized Provider Order Entry Alerts
Jacob C. Snyder*1, Mohamed Osman2, Anna W. Rains2 and Christopher T. Clark1
1University of Tennessee Graduate School of Medicine, 2Univeristy of Tennessee Medical Center
Background/Case Studies: Computerized provider order entry alerts (CPOE) with clinical decision support can reduce inappropriate transfusion. The goal is to determine if the alerts truly decrease inappropriate transfusion or just delay red blood cell (RBC) transfusion. The goal is to determine effectiveness of CPOE alert system in lowering RBC transfusion rates and determine what patient populations are receiving additional RBC units after the alert.
Study Design/Method: Retrospective 6‐month data of CPOE alerts aimed at restrictive strategy and promoting 1‐unit transfusion ordering practice for RBC transfusion are collected (June 1 through November 30, 2016). Alerts fire based on specific criteria in an effort to avoid alert fatigue in providers. Transfusions are reviewed for appropriateness based upon 2012 AABB RBC transfusion guidelines. Patient population consists of inpatients, and excludes intraoperative transfusion, massive transfusion, and outpatient transfusions. Patients receiving additional units within 48 hours after the alert are reviewed for appropriateness, hemoglobin levels pre‐ and post‐transfusion, demographics, listed indication for transfusion, and clinical scenario.
Results/Finding: After initial 2‐unit order, alert fired 226 times. Initial 2‐unit order was cancelled 24 times, changed to 1‐unit 151 times, and continued 51 times. Of the patients receiving 1 unit, 42 patients received additional RBC units and 109 patients did not receive additional RBC units within 48 hours of the initial alert. With CPOE alerts, 157 RBC units were saved during this 6‐month period, resulting in product acquisition cost savings of nearly $27,000. The alerts resulted in a 35% reduction of number of RBC units transfused in this population. The clinical setting in the additional unit population included: Gastrointestinal (GI) bleed (39%), sepsis (22%), surgical patient (14.5%), oncology diagnosis (9.6%), non‐GI active bleeding (7.3%), trauma (4.9%), and other (2.4%). All final initial 1‐unit orders met AABB guidelines, while only 5% (2 of 42) of the additional units did not meet criteria. The average age of patients receiving additional units is 55 years‐old (15‐92) with male to female ratio of 1.4:1.
Conclusion: CPOE alert system with clinical decision support is effective in reducing inappropriate RBC transfusion. The most common setting for additional transfusion was GI bleeding (39%) in which there was continued blood loss. The vast majority of patients receiving RBC units following the alert had clinical situations meeting guidelines. Therefore, the alerts are effective in promoting restrictive transfusion strategy and 1‐unit RBC orders without delay in transfusion needs.
PBM20
Improving Plasma Utilization: Evaluation of Computer Provider Order Entry Overrides
Jensyn Cone Sullivan*1, Anh Dinh2 and Kerry O'Brien1
1Beth Israel Deaconess Medical Center, 2Brigham and Women's Hospital
Background/Case Studies: Plasma is routinely transfused for non‐evidence‐based indications, exposing patients to risks including transfusion‐associated circulatory overload, alloimmunization, and hemolytic transfusion reactions. Clinical orders for plasma transfusion at our academic medical institution occur through a computer provider order entry system (CPOE) that filters the patient's most recent labs through evidence based and institution‐chosen transfusion guidelines. Orders not meeting guidelines trigger a request for further information. Providers choose indications from pre‐populated, pull‐down menus (e.g. “DIC with INR > 1.5”) and/or add a comment. The laboratory data, selected indication, and comment are collected for retrospective review.
Study Design/Method: Plasma override orders from January 2016 to December 2017 were reviewed to determine prefixed indication, most recent INR, free‐text comment and the attending service/department. Each order was assigned one of the following codes: I‐Indicated, NI‐Not Indicated (based on institutional and AABB guidelines), NMI‐Need More Information, P‐Protocol and NIC‐Non Indication Comments. Free‐text comments were each assigned a code, tabulated, and analyzed.
Results/Finding:
| Order Date | 2016 | 2017 | Totals | |||||||||||||||||||||||
|---|---|---|---|---|---|---|---|---|---|---|---|---|---|---|---|---|---|---|---|---|---|---|---|---|---|---|
| 1 | 2 | 3 | 4 | 5 | 6 | 7 | 8 | 9 | 10 | 11 | 12 | 1 | 2 | 3 | 4 | 5 | 6 | 7 | 8 | 9 | 10 | 11 | 12 | |||
| Code % | I | 21 | 9 | 11 | 25 | 16 | 18 | 14 | 15 | 14 | 25 | 17 | 18 | 14 | 11 | 15 | 22 | 10 | 18 | 12 | 19 | 28 | 12 | 19 | 15 | 398 |
| NI | 4 | 9 | 4 | 7 | 5 | 3 | 4 | 4 | 7 | 6 | 2 | 1 | 3 | 14 | 3 | 2 | 4 | 12 | 8 | 3 | 6 | 5 | 1 | 7 | 124 | |
| NMI | 8 | 9 | 5 | 9 | 9 | 8 | 3 | 8 | 4 | 5 | 9 | 5 | 6 | 6 | 3 | 3 | 4 | 0 | 1 | 6 | 8 | 6 | 11 | 16 | 152 | |
| P | 1 | 2 | 3 | 4 | 2 | 4 | 6 | 1 | 9 | 2 | 6 | 9 | 2 | 3 | 8 | 5 | 11 | 0 | 8 | 1 | 12 | 0 | 3 | 9 | 111 | |
| NIC | 1 | 2 | 0 | 0 | 1 | 1 | 1 | 2 | 0 | 1 | 0 | 0 | 1 | 1 | 1 | 0 | 0 | 0 | 0 | 0 | 1 | 1 | 2 | 1 | 17 | |
| Monthly Totals | 35 | 31 | 23 | 45 | 33 | 34 | 28 | 30 | 34 | 39 | 34 | 33 | 26 | 35 | 30 | 32 | 29 | 30 | 29 | 29 | 55 | 24 | 36 | 48 | 802 | |
Transfusions deemed I comprised 50% of the total orders (n=398); NI, 15% (n=124); NMI, 19% (n=152); P, 14% (n=111) and NIC, 2% (n=17).
The most common words in free text indications included “bleed”, “bleeding” or “hemorrhage” (315 times), “INR” (140 times), and “transplant” (45 times). Services most commonly ordering override‐triggering transfusions were Internal Medicine (n=254, 32%) and Allied Health (n=150, 19%). The Neurosurgery, Transplant, and Vascular services rarely triggered NI overrides (n=1, < 1% total NIs, respectively). Services commonly ordering plasma deemed NI were Orthopedic Surgery and Neurology (NI=6/17, 35% and NI=2/6, 33%, respectively). Services least frequently ordering plasma deemed NI were Emergency Medicine (NI=10/104, 10%) and General Surgery (NI=13/100, 13%).
Conclusion: At our institution, plasma is frequently ordered for non‐indicated reasons, exposing patients to unnecessary transfusion‐associated risks. No clear trends in NI orders were noted among trainees of differing academic years, suggesting medical service culture may affect order entry more than level of academic training. Our data identified the services that most commonly order non‐indicated products, illustrating an area that could be targeted for focused education and improvement.
PBM21
Anemia Diagnosis and Management Utilizing a Reflexive Algorithmic Laboratory Panel
Christine Cahill*1, Amy E. Schmidt1, Hannah McRae1, Nathaniel Connolly1 and Majed A. Refaai2
1University of Rochester, 2Transfusion Medicine, University of Rochester
Background/Case Studies: Anemia is a deficiency in the total amount of red blood cells (RBC) or hemoglobin (Hgb) concentrations that affects the oxygen carrying capacity. It is prevalent in up to 50% of all hospitalized patients. The appropriate treatment varies based on etiology, with iron deficiency being the most common cause. Anemia is an independent risk factor for hospitalization, readmission, prolonged length of stay, diminished quality of life, and increased risk of morbidity and mortality. This newly developed laboratory anemia panel provides more efficient assessment and anemia screening through one simplified order algorithm.
Study Design/Method: A reflexive algorithmic anemia panel was established in our lab on June 2017. Medical records of 57 adult patients screened for anemia using this reflexive panel were retrospectively reviewed over an 11 months period. Patient characteristics and treatment modalities were collected along with clinical and laboratory data including iron studies.
Results/Finding: A total of 44 (77%) patients were found to be anemic with the most common diagnosis being iron deficiency anemia (n=32, 73%). Significant improvement in the post treatment Hgb was observed when compared to the screening Hgb (10.5 ± 2 vs. 8.6 ± 1.5; p<0.0001). Similar improvements were also detected in MCV and RDW indicating improved RBC and Hgb production (Table). The average treatment duration was 206+29 days. Oral iron replacement therapy was the most common intervention (n=23, 52%). Two patients were treated with IV iron and one patient was treated with folic acid. No significant reactions or complications were reported.
Conclusion: This newly developed reflexive algorithmic anemia screening panel provides timely diagnosis and earlier initiation of management while utilizing laboratory resources more efficiently. Patients in our study cohort showed significant increase in Hgb indicating successful management and follow up of anemia.
Table: Screening and post treatment hemoglobin, MCV and RDW levels. Data are shown in mean ± standard deviation and median (range).
(PBM21)
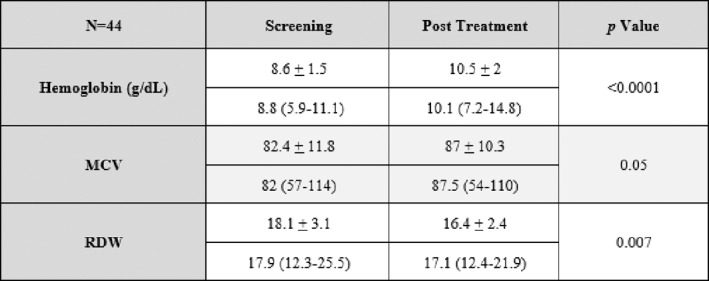
PBM22
Inter‐Institutional Comparison of Red Blood Cell Usage
Kimberly Ouellette*1 and Joseph D. Sweeney2
1Rhode Island Hospital, 2Lifespan Academic Medical Center
Background/Case Studies: It is problematic to compare blood usage between institutions of various sizes and complexity. A large tertiary care hospital will use more blood components than a small community hospital, but this does not mean that the usage at either hospital is appropriate or otherwise. There are three hospitals in our hospital system: Hospital A, a tertiary care teaching hospital licensed for 719 beds, Hospital B, a 247‐bed teaching hospital, and Hospital C, a small community non‐teaching hospital with 129 beds. Since the absolute number of red cells transfused per hospital differ substantially and likely related to patient volume and acuity, adjusting the red cell usage for both variables could allow for a more valid comparison of usage.
Study Design/Method: Data were collected for a five‐year period, 2013 through 2017 for all three hospitals. Included were: total red cell usage, number of discharges, and the mean case mix index (CMI). The CMI is a value representing the clinical complexity and case diversity of patients. In general, the CMI varies from 0.5 to 18 per discharge; patients with more complex medical problems, complications, or surgery have higher CMIs. Thus CMI was used in this calculation as a surrogate for acuity. A higher CMI, should correlate with greater blood usage. The comparison was performed first by calculating usage of red cells per 1000 discharges to correct for patient volume. A second calculation divided the usage per 1000 discharges by the CMI, to correct for patient acuity.
Results/Finding:
| 2013‐2017 (5 year comparison) | Hospital A | Hospital B | Hospital C |
|---|---|---|---|
| # Red Cell Units transfused | 68, 241 | 25,879 | 7,781 |
| # Discharges | 177,669 | 84,494 | 22,982 |
| Mean Case Mix Index | 1.70 | 1.49 | 1.36 |
| # Red Cell Units/ 103 discharges | 384 | 306 | 339 |
| # Red Cell Units/ 103 discharges/ CMI | 226 | 205 | 249 |
Results are shown in the table. The first three rows show data for gross usage, discharges, and CMI. The fourth row adjusts for patient volume, and the final row adjusts for volume and acuity. Using this calculation, it is clear that Hospital C, the small community hospital, has higher adjusted rates of transfusion and should be targeted for educational intervention.
Conclusion: Blood management focused on red blood cell usage per discharge as a metric for appropriate usage does not take into account the complexity of the cases. Our proposed calculation may give greater insight into appropriate usage and identify hospitals which would benefit from interventions to change transfusion practice.
PBM23
Implementing a Patient Blood Management Program in a Complex, Multi‐State Hospital System
Sunny Bhatia1, Kavitha Reddy Bhatia1, Paryus Patel1, Rafael Millare*1, Irwin Gross2, Marguerite Johnson2, Lisa Kelly2 and Carolyn Clancy2
1Prime Healthcare, 2Accumen
Background/Case Studies: Despite acknowledged benefits of Patient Blood Management (PBM), implementing effective programs remains challenging especially for multi‐hospital healthcare systems serving multiple states. A large healthcare system with 45 hospitals in 14 states, on a total of 12 electronic medical record platforms, with an initial system‐wide blood acquisition expenditure blood spend of $18M annually, formed an interdisciplinary partnership to expedite a comprehensive PBM program in less than a year.
Study Design/Method: An implementation plan was developed to support first year goals: establishing a PBM infrastructure, developing state of the science transfusion guidelines and order sets, disseminating education, and providing system and provider level data. The team developed a prioritization matrix formula consisting of hospital size, data availability, and transfusion volumes to guide efficient workflow. Strong emphasis was placed on each phase to maximize behavioral modification effects. A system level PBM Steering Committee formed individual PBM task forces throughout 25 hospitals to carry out the strategic plan. All in‐scope hospitals implemented guidelines and CPOE blood order sets. The committee launched an awareness campaign across all hospitals and delivered CME /CE educational programs at the largest hospitals. Transfusion data reports were developed for the hospitals utilizing one of the system's largest information technology platforms (n=12 sites). Key performance indicators (see below) form the basis for evaluating the program.
Results/Finding: Over a 7‐month period, through process‐driven and aggressive oversight, RBC utilization declined ∼13% for the system overall, despite a 3% patient volume increase. There was an ∼16% decrease in transfusion volume at the 12 sites for which data reports were implemented. Overall, RBC transfusions at hemoglobin (Hgb) > 8g/dL declined 5%, RBC transfusion at Hgb <7g/dL increased by 7% and single unit orders increased 12% during the first 6 months. The healthcare organization's blood acquisition costs declined $2.3M; $/average patient day fell to $8.48 during 2017 vs. $9.81 in baseline year 2016 (14.3%).
Conclusion: Creating a comprehensive PBM program in an expansive healthcare structure requires innovative strategies to successfully scale key programmatic components. Direct and regular access to key decision makers along with streamlined decision‐making processes, provider education, CPOE, and data and analytics were key drivers for success. Findings show a significant reduction in red blood cell utilization is possible across a large system over a one‐year time frame
PBM24
In Minor Allergic Transfusion Reactions There Is Tendency to Waste Associated Blood Product and Transfuse Again: A Single Institution Experience
Fatima Aldarweesh*1, Joseph Connor2 and Jesse Kassim1
1University of Wisconsin, 2Department of Pathology and Laboratory Medicine, University of Wisconsin Hospital and Clinics
Background/Case Studies: Allergic transfusion reactions are the most common adverse reaction to blood products. There is a wide range of severity of reactions but they are usually mild, occur within 2 hours of transfusion, and present as cutaneous manifestations such as localized urticarial lesion and pruritus. The presumed mechanism is mast cell degranulation and histamine release. Diphenhydramine, an inverse agonist of histamine H1 receptor, is the most commonly used medication to alleviate symptoms. It has not been proven to prevent allergic reactions although it is recommended as a premedication in patients with history of allergy to blood transfusion.
Study Design/Method: We conducted a retrospective analysis through our blood bank software, HCLL™ Transfusion (Mediware, Lenexa, KS), to find all cases accessioned for reaction workup and narrowed it to allergic reactions from June 2010 to August 2017. Then, we reviewed pathologist interpretation reports for each reaction. Our outcomes were categorized according to implicated blood products, volume transfused (partial/incomplete, complete), premedication and post‐medication, attempted repeat transfusion within 48 hours of reporting a reaction, and severity (severe, non‐severe/mild). Definition of severity was in compliance with Centers for Disease Control and Prevention (CDC), National Healthcare Safety Network Biovigilance Component Hemovigilance Module Surveillance Protocol V2.1.3 published on Aug 2014.
Results/Finding: We reviewed a total of 201 allergic transfusion reactions in 164 patients (37 patients had two reactions). For analysis purposes, the total number was rounded to 164. Mild allergic reactions were reported in 77% of cases while severe reactions were seen in 23%. The majority of mild reactions, 39%, were associated with RBC while the majority of severe reactions, 50% (19/38), were associated with platelets. There was no premedication in 83% of mild reactions but there was post‐medication in 80% of cases. Incomplete transfusion was seen in 63% of all cases of which 72% were associated with red blood cells. Thirty three percent of patients with mild reactions had incomplete/partial transfusions and were transfused again within 48 hours of the reaction. This represents 16% of all allergic reactions.
Conclusion: Incomplete transfusion occurred in many mild allergic transfusion reactions. The majority of these reactions resolved with treatment and could have in theory been completed hence representing a significant waste of blood product. Our results present an opportunity for quality improvement regarding management of mild allergic transfusion reactions. While making patient safety our first priority there is an opportunity to minimize or avoid blood products wastage in many of these reactions.
PBM25
Patient Blood Management (PBM): A Community Hospital Success Story
Rhonda Cooke*1, Janette Beck2, Michael C. Mauney3, Michael J. Bolger3 and Frank Caruso2
1Parkway Pathology Group, 2Missouri Baptist Medical Center Laboratory, 3Missouri Baptist Medical Center
Background/Case Studies: It is estimated that approximately 11.3 million red blood cells (RBCs) were transfused in the United States in 2015. Although transfusions have decreased in recent years, they are still considered one of the five most overused procedures in hospitals. Blood transfusions can be harmful, and have been shown to increase the risk of hospital acquired bacterial infections and length of hospital stay, as well as exposing the patient to transfusion reactions or alloimmunization. In addition, the cost of blood components is one of the greatest hospital expenses after personnel. It is estimated that a large percentage (up to 40% by some estimates) of blood transfusions are performed without a valid clinical indication and/or potential for clinical benefit. Patient Blood Management programs aim to reduce unnecessary transfusions.
Study Design/Method: A hospital‐wide initiative was launched in 2008 with a goal to decrease blood utilization at Missouri Baptist Medical Center (MBMC), a 489‐bed community hospital in St. Louis. A Blood Utilization committee was formed in November, 2008, comprising Laboratory and Blood Bank personnel, as well as the Chief Medical Officer (CMO). The CMO personally invited Clinical Champions from Oncology, Cardiothoracic Surgery, and Critical Care. Transfusion triggers were established by the transfusion service. Educational outreach programs were presented by physicians to all departments and Chiefs and at quarterly staff meetings. Grand Rounds was presented by the Clinical Champion for Oncology and video was made available on the hospital intranet site to all employees. A Tableau dashboard was created to track transfusions according to hemoglobin values, patient care area, and physicians. Implementation of clinical decision support tools is ongoing as the hospital system transitions to an EPIC electronic medical record in phases during 2017‐2018.
Results/Finding: From 2008‐2013, MBMC reduced RBC transfusion from 9,691 to 4,640 units, a 52% reduction. Reducing transfusion improved patient safety by reducing the risk of transfusion reactions to a similar degree. Blood transfusion rates have remained flat since 2014, despite an increase in case mix index (CMI) from 1.56 in 2008 to 1.76 in 2017. Transfusions per CMI adjusted discharges decreased from 0.2721 in 2008 to 0.1370 in 2017. Blood costs decreased from $2,766,724 in 2008 to $1,591,459 in 2014, a reduction of 42.5%. Since its inception, the blood utilization program has saved $7 million in blood component expenses.
Conclusion: A robust PBM program can reduce transfusion rates, reduce adverse events, and save money in a community hospital setting. Sustained reductions are possible with physician engagement, prospective review of transfusion requests, real‐time transfusion data, and employment of clinical decision support tools.
PBM26
A Contemporary Evaluation of Red Blood Cell Transfusion Practices in High Risk Non‐Cardiac Surgeries: A Retrospective Cohort Study
Brett L. Houston1, Emily Krupka2, Thomas Mutter2, Dean A. Fergusson3, Jamie Falk2, Jo Ann Colas4, Malia Murphy4, Rodney Breau3, Alexis F. Turgeon5 and Ryan Zarychanski*1
1University of Manitoba / CancerCare Manitoba, 2University of Manitoba, 3The Ottawa Hospital Research Institute / University of Ottawa, 4The Ottawa Hospital Research Institute, 5Université Laval
Background/Case Studies: Perioperative bleeding is a major indication for allogeneic red blood cell (RBC) transfusion. In the era of widespread blood conservation initiatives, transfusion rates in major non‐cardiac surgeries are poorly quantified, outdated and do not reflect interval efforts to minimize perioperative transfusion. A current assessment of transfusion patterns in high‐risk non‐cardiac surgeries is needed. The objective of this study is to describe contemporary transfusion practices in patients undergoing major high‐risk non‐cardiac surgery.
Study Design/Method: We completed a retrospective cohort study to evaluate all patients ( ≥ 18 years of age) undergoing non‐cardiac surgery at five hospitals in two cities between January 1, 2014 and December 31, 2016. We used standardized Canadian Classification of Health Interventions (CCI) procedure codes contained within the hospital Discharge Abstract Database (DAD). We linked the DAD with transfusion databases and laboratory databases to obtain supplementary transfusion and laboratory data. We excluded uncommon ( < 15 procedures) and low‐risk ( < 5% transfusion rate) procedures. For the remaining procedures, we characterized the proportion of patients transfused, the mean number of RBC units transfused, and the number of RBC units transfused annually.
Results/Finding: In 5 centres, we identified 74,906 patient admissions with a surgical procedure in the main operating room. We identified 95 open non‐cardiac surgeries associated with a transfusion rate ≥5%. In these procedures, the baseline transfusion rate was 16%, and ranged from 5% to 49%. 37% received 1 RBC unit, 32% received 2 RBC units, and 11% were transfused ≥ 5 units. Of those transfused, the mean number of RBCs transfused was 2.8 units ( ± 1.1 units). The ten procedures with the highest transfusion rates were abdominal aortic aneurysm repair (44%), abdominal aortic aneurysm bypass (42%), vertebrectomy (35%), above knee amputation (36%), below knee amputation (33%), femur open reduction and internal fixation (33%), cystectomy (43%), gastrectomy (31%) and colonic repair (30.4%). The procedures with the highest annual number of RBC units transfused included total hip arthroplasty (5426 procedures; 10,704 RBC units), hysterectomy (3479 procedures; 9045 RBC units), and vertebral fusion (1727 procedures; 4655 RBC units).
Conclusion: In the era of blood conservation, we have described the transfusion practices in major non‐cardiac procedures at high risk for transfusion. This has implications for patient consent, pre‐operative planning and blood bank utilization.
PBM27
Risk‐Adjusted Blood Utilization Across All Inpatient Hospital Stays
Ryan A. Metcalf*1, Sandra K. White1, Scott Potter1, Reed Barney2, Michael White2, Cheri Hunter2 and Robert Blaylock1
1University of Utah and ARUP, 2University of Utah
Background/Case Studies: Blood transfusion is a high‐volume activity that is often overused and risk‐adjusted benchmarking may be useful. The aim of this study was to define risk‐adjusted blood use across the entirety of all inpatient hospital stays using diagnosis related groups (DRGs).
Study Design/Method: All adult inpatient hospital stays from 5/2014‐3/2018 at a large academic center were analyzed with descriptive statistics. Blood usage, Medicare Severity (MS)‐DRGs, All Patient Related (APR)‐DRGs, and other variables were captured over entire hospital stays.
Results/Finding: 97955 hospital stays were evaluated (Table 1). Burn, cardiac surgery, trauma, and surgical ICU showed the highest correlation between RBC use and DRG weights (Spearman Rho ranges 0.5‐0.6). Hematology, cardiothoracic surgery, gastroenterology, and transplant surgery showed the highest correlation between platelet use and DRG weights (Spearman Rho ranges 0.39‐0.54). All p‐values for RBCs and platelets were <0.003 except for a couple services performing very few transfusions.
Conclusion: Blood use for services with the greatest number of blood components per hospital stay correlated most strongly with DRG numerical weights across entire inpatient hospital stays. Risk‐adjusted utilization could be used for benchmarking within or between hospitals.
(PBM27)
| Service | Hospital stays | Mean length of stay (days) | Hospital stays with transfusion (%) | RBC units/ DRG Weight (APR,MS)* | FFP units/ DRG Weight (APR,MS)* | Platelet units/ DRG Weight (APR,MS)* |
|---|---|---|---|---|---|---|
| Burn | 828 | 17.4 | 25.1 | 1.20, 1.09 | 0.16, 0.15 | 0.07, 0.06 |
| Cardiology | 6355 | 5.9 | 11.4 | 0.32, 0.32 | 0.19, 0.19 | 0.08, 0.08 |
| Cardiac Surgery | 2209 | 8.4 | 33.3 | 0.47, 0.38 | 0.28, 0.23 | 0.17, 0.13 |
| Gastroenterology | 75 | 5.2 | 22.7 | 1.03, 0.73 | 1.1, 0.78 | 0.76, 0.53 |
| General Surgery | 6656 | 5 | 7.8 | 0.18, 0.15 | 0.13, 0.11 | 0.05, 0.04 |
| Gynecology | 1304 | 4 | 17.8 | 0.43, 0.32 | 0.04, 0.03 | 0.01, 0.01 |
| Hematology | 3386 | 9 | 50.2 | 1.04, 0.99 | 0.28, 0.26 | 1.40, 1.32 |
| Hepatology | 77 | 7.2 | 27.3 | 1.09, 0.87 | 1.26, 1 | 0.92, 0.74 |
| Medicine | 15970 | 4.4 | 12.1 | 0.32, 0.26 | 0.21, 0.17 | 0.08, 0.07 |
| Interventional Radiology | 139 | 5.8 | 15.8 | 0.22, 0.23 | 0.06, 0.06 | 0.1, 0.1 |
| Medical ICU | 4169 | 6.8 | 23.3 | 0.44, 0.47 | 0.25, 0.27 | 0.16, 0.17 |
| Nephrology | 220 | 5.1 | 24.1 | 0.38, 0.34 | 2.00, 1.84 | 0.13, 0.12 |
| Neurology | 4312 | 4.7 | 3.3 | 0.07, 0.05 | 0.13, 0.11 | 0.0, 0.045 |
| Neurosurgery | 6649 | 5.2 | 8.6 | 0.08, 0.08 | 0.04, 0.03 | 0.04, 0.03 |
| Obstetrics | 16233 | 3.1 | 2 | 0.13, 0.09 | 0.04, 0.03 | 0.02, 0.02 |
| Oncology | 5676 | 4.8 | 19.5 | 0.38, 0.3 | 0.05, 0.04 | 0.17, 0.13 |
| Orthopedics | 9051 | 3 | 7.6 | 0.12, 0.09 | 0.02, 0.01 | 0, 0 |
| Otolaryngology | 1294 | 4.7 | 7 | 0.13, 0.1 | 0.01, 0 | 0.01, 0 |
| Plastic Surgery | 1099 | 4.8 | 6.5 | 0.15, 0.13 | 0.01, 0.01 | 0. 0 |
| Pulmonology | 1714 | 8.6 | 4.1 | 0.06, 0.08 | 0.02, 0.03 | 0.01, 0.01 |
| Surgical ICU | 616 | 9.4 | 51 | 0.69, 0.67 | 0.35, 0.34 | 0.18, 0.17 |
| Transplant Surgery | 1483 | 7.2 | 21.2 | 0.63, 0.7 | 0.59, 0.65 | 0.32, 0.36 |
| Trauma | 1934 | 6.1 | 20.4 | 0.59, 0.47 | 0.25, 0.2 | 0.08, 0.06 |
| Urology | 2585 | 3.4 | 8.1 | 0.21, 0.16 | 0.06, 0.04 | 0.02, 0.01 |
| Vascular Surgery | 951 | 6.3 | 22.9 | 0.45, 0.37 | 0.17, 0.14 | 0.05, 0.04 |
| Overall | 97955 | 8.3 | 12 | 0.34, 0.28 | 0.16, 0.13 | 0.15, 0.12 |
* Median DRG weights
PBM28
Red Cell Antigen Sensitization in Pediatric Sickle Cell Disease Patients: A Ten Year Retrospective Analysis
Gregory Halverson*1, Morgan McCoy2, Ghazala Hashmi3, Michael Seul4, David Oh1, Matthew Montgomery1, Jeffrey Papiernik1 and Jose Cancelas1
1Hoxworth Blood Center, 2Cincinnati Children's Hospital, 3BioMolecular Analytics, 4ImmunoInformatica
Background/Case Studies: Alloimmunization to human red cell antigens plays an important role in the management of patients with Sickle Cell Disease (SCD). Our pediatric center supports a large population of SCD patients, including many on chronic transfusion protocols, and, in order to reduce the risk of alloimmunization, we have, since 2002, selected our red cell donors so as to match their Rh (C, E) and Kell (K) phenotype to that of the recipient. The purpose of this study was to evaluate the state of alloimmunization in this patient population to assess the benefit of this approach.
Study Design/Method: For 34 chronically transfused patients, every donor unit transfused was traced back through patient electronic records and compared to the donor antigen profile on record at the blood collection facility using methods developed by an independent data analysis group. We reviewed each patient's transfusion history, which was comprised of a median range of 96.5 months of transfusion data, and determined how often a mismatch resulted in the formation of alloantibodies. To compare the alloimmunization state of our patients with that of a reference population, studied prior to the adoption of C, E and K matching (Castro2002‐https://www.ncbi.nlm.nih.gov/pubmed/12147019), we generated the allo‐antigen distributions for both populations.
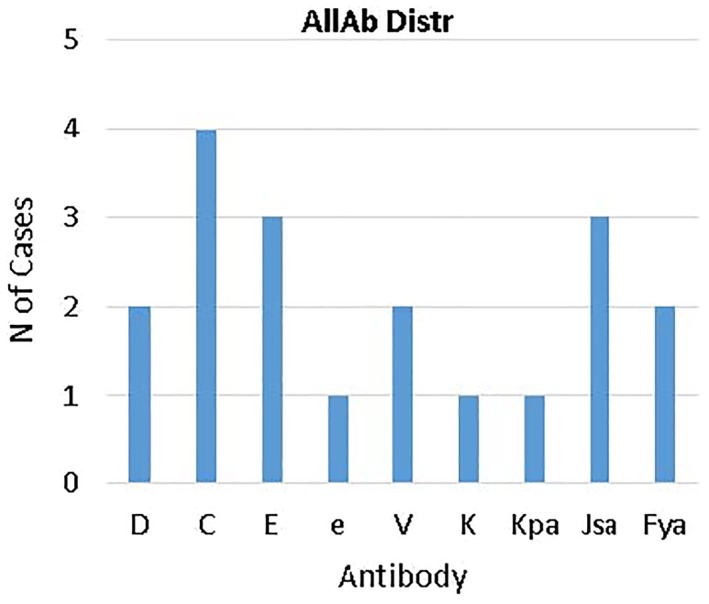
Results/Finding: Our program has achieved a significant reduction in the incidence of alloimmunization to C, E and K in our population, and it has limited the proliferation of antibodies often observed in chronically transfused patients. Thus, while the allo‐antibody distribution in the population studied by Castro and colleagues extends to as many as 9 antibodies per patient, ours is limited to at most 3. Nevertheless, 32.4% (=11/34) patients, having received dozens of transfusions, made at least one allo‐antibody, including antibodies to Js(a) (3/11 = 27.2%), Fy(a) (18.2%), V (18.2%), Kp(a) (10%) and e (1/11), along with C (4/11) and E (3/11). Interestingly, we observed instances, including anti‐Fya, in which an antibody was formed only after repeated exposures to Fy(a+) red cells.
Conclusion: The data obtained from our patient cohort is consistent with the prediction of Castro and colleagues, and the conclusions of subsequent studies (e.g. Shafi2014 ‐ https://www.ncbi.nlm.nih.gov/pubmed/24628032), namely that an overall reduction in sensitization is possible by carefully selecting donors whose antigen profile matches that of the recipient. The implementation of novel algorithm for selecting donor units over a large set of antigens, with quantitative consideration of the immunogenicities of individual antigenic determinants, we believe will achieve further improvement in the prevention of alloimmunization.
PBM29
Type and Screen: From Overutilized to Underutilized
Ian M. Harrold* and Melissa R. George
Penn State Health Milton S. Hershey Medical Center
Background/Case Studies: Maximum surgical blood ordering schedules (MSBOS) were first described in the 1970s to provide some guidance for surgeons about how much blood should be ordered in the pre‐op phase. The goal was to cut down on unnecessary type and cross orders and to make sure an appropriate quantity of blood was available for surgeries likely to require transfusion. This concept, the recent emphasis on patient blood management, and newer surgical techniques have all contributed to a decreased utilization of blood products and unnecessary crossmatches. One unintended consequence to these policies might be an underutilization of type and screens. Most operations do not require blood transfusions routinely. Yet if an unexpected complication arises during an operation, the lack of a type and screen can have negative consequences if emergency release blood is needed.
Study Design/Method: We evaluated all scheduled operations at our institution over a 4 week period. For each procedure we identified if the patient had a type and screen on file within 3 days of the operation (within 14 days for cardiac procedures). The results were compared to published MSBOS guidelines that recommended which procedures should have a type and screen.
Results/Finding: A total of 1622 scheduled procedures were identified with type and screens on file for 317 (20%). On average there were 81.1 procedures a day with 16 type and screens ordered. All of the urology, cardiovascular, and gastrointestinal surgeries that had a type and screen recommended by a published MSBOS had a 100% type and screen rate at our institution. Other procedures that were recommended to have a type and screen had varying rates of compliance including open hysterectomies (25%), ovarian surgery (5%), spinal fusions (57%), laminectomies (33%), hip replacement (92%), knee replacement (31%), open shoulder (25%) and neck dissections (17%). There were inconsistencies amongst different surgeons in the frequency of ordering a type and screen for the same procedure and also inconsistencies for the same surgeon on different days.
Conclusion: Many of our surgeons are able to complete most of their operations with minimal blood loss and little need for transfusions, but many procedures are also being performed without a type and screen on file. While most of these procedures have no need of blood, orthopedic, gynecologic and ENT surgeries all have potential for high blood loss due to unexpected complications or unusual anatomy. If the patient already has an alloantibody that was unidentified, emergency release O negative blood could lead to hemolytic transfusion reactions. The inter‐surgeon and intra‐surgeon variability across the hospital demonstrates a lack of a unified approach to the utilization of type and screens and shows that the push to decrease overutilization of blood products has possibly swung the pendulum towards underutilization.
PBM30
Nurses Promoting Patient Blood Management Standards
Hind Jaber‐Daou*1, Kimberly Sanford2 and Steven Armstrong1
1VCU Health, 2Virginia Commonwealth University
Background/Case Studies: Implementing a Patient Blood Management (PBM) program requires a multidisciplinary approach coordinated and supported by all healthcare providers. Nurses’ knowledge about PBM is empirical as they play a major role in administering blood products. Knowledgeable nurses exhibit confidence for a questioning conduct, contribute to the decision‐making process, and participate in knowledge transfer actions. Enhancing nurses’ knowledge about PBM is disseminated in scheduled meetings and educational sessions. The purpose was for nurses to embed in their practice what they learned about PBM, influence other providers’ practices, and educate patients.
Study Design/Method: The study adopted a qualitative research approach and employed the direct application of knowledge to change the understanding and influence the thinking and behavior of nurses toward transfusions. Purposeful sampling of 10 nurses selected based on the inclusion criteria that nurses have no previous knowledge about PBM and be working in a clinical area where blood products are administered. Data were collected via face‐to‐face interviews with follow‐up questions via email, if needed.
Results/Finding: Themes generated from data analysis revealed an increase in knowledge (10/10) related to associated risk factors and adverse reactions of blood transfusions; competence (8/10) conveyed in performing expertly and acting independently; confidence (7/10) voiced in becoming inquisitive, making decisions, and educating colleagues; and motivation (4/10) to spreading knowledge and educating other nurses and providers. All participants initiated action plans to share their knowledge, spread awareness, and provide support to their clinical units through exploiting presentations, learning modules, in‐services, and creating reference pages for PBM. Feeling empowerment was mutual among 8 participants who were enthusiastic to inform others about risks associated with transfusions, ensure safe and appropriate use of blood products, and encourage patients to make educated decisions on transfusions. Only 2 participants reported empowered, but not to the extent of challenging the inappropriate ordering of blood products.
Conclusion: Educating nurses on PBM standards was constructive and vesting. Nurses empowered by information about PBM, awareness of adverse risks of transfusions, and evidence of improved outcomes participate in personal knowledge transfer actions that benefit other nurses, providers, and patients.
TA4
Thrombotic Thrombocytopenic Purpura (TTP) in a Patient with Multiple Sclerosis Receiving Alemtuzumab
Lanu Stoddart*1, Nickul Shah1, Sajjad Hassan2 and Chester Andrzejewski2
1Baystate Health, 2Baystate Health / Baystate Medical Center
Background/Case Studies: Alemtuzumab (ALE), a recombinant humanized IgG1 kappa monoclonal antibody (CD52 specificity) is indicated for patients (pts) with relapsing forms of multiple sclerosis (MS). Infusion reactions, malignancies, and autoimmunity (e.g., Immune Thrombocytopenia (ITP)) may occur. To date, TTP has not been reported in pts during or after treatment with ALE. Here we report a pt with ALE‐associated ITP who subsequently developed autoimmune thyroid storm and TTP.
Study Design/Method: Case Report. 31 year old male with MS (diagnosed 3 years prior to admission (PTA)) received ALE (last dose 16 months PTA) and developed ALE‐associated ITP during post‐treatment surveillance 4 months PTA. Five days PTA due to dark urine and a platelet count of 5,000/mm^3, he was referred to a local hospital for evaluation. At admission a diagnosis of ITP exacerbation was made. He was treated with intravenous immunoglobulins (IVIg) and prednisolone. His hematuria continued and due to severe anemia (hemoglobin (Hgb) = 6.5 g/dL), he received multiple RBC transfusions. Due to his worsening status and refractoriness to hemotherapy, further studies were performed showing platelets=6000/mm^3, creatinine=1.3 mg/dL, total bilirubin=3.9 mg/Dl, and LDH > 2000u/L. Peripheral blood smear inspection showed schistocytes/spherocytes. He was emergently transferred to our hospital for therapeutic plasma exchange (TPE) for presumed TTP.
Results/Finding: Upon admission laboratory studies revealed Hgb=6.1 g/dL; platelet count = 11,000 /mm^3. Studies for ADAMTS13 activity/ADAMTS13 inhibitor levels were collected and subsequently measured, confirming TTP (<5%; 1.2 BU, respectively). Despite multiple RBC/FFP transfusions prior to TPE initiation, he experienced a generalized tonic clonic seizure and was admitted to the critical care unit. Additional testing (TSH < 0.02 mIU/mL, free T4 = 3.09 ng/dL, and sodium=148 mmol/) supported a further diagnosis of thyroid storm (autoimmune etiology based on subsequent studies). TPE (1.0 plasma volume) using FFP replacement was begun. He underwent a total of 21 TPE procedures, and a 4 dose cycle of Rituximab with normalization of platelets, Hgb and LDH levels. His mental status/neurological functioning returned to baseline post stabilization of T4 and sodium levels.
Conclusion: ALE may cause severe life threatening autoimmune disorders. Although ITP has been reported as the major autoimmune cytopenia in pts, the development of TTP needs to be considered. Early recognition/treatment with TPE of this drug induced autoimmune disorder necessitates clinical hyperawareness during the post therapy surveillance period for this at risk pt population. Further studies regarding the risk and etiology of TTP in this setting are warranted.
TA5
Antibody Mediated Diffuse Alveolar Hemorrhage in Pulmonary‐Renal Vasculitides: Enhanced Resolution with Emergent Adjunctive Plasma Exchange
Jan C. Hofmann* and Dobri D. Kiprov
California Pacific Medical Center
Background/Case Studies: Antibody mediated diffuse alveolar hemorrhage (DAH) in pulmonary‐renal vasculitides is an acute, often life‐threatening condition. While high dose immunosuppressive (IS) therapy is paramount in controlling this condition, plasma exchange often proves to be critically important.
Study Design/Method: We reviewed the medical records of 81 patients (pts) who were diagnosed with DAH from 1/08‐1/18, and referred for immunotherapy evaluation and treatment. Of 192 pts with ANCA (antineutrophilic cytoplasmic antibody) or anti‐GBM (anti‐glomerular basement membrane) antibody renal vasculitis (RV), or severe SLE (systemic lupus erythematosus) treated with adjunctive plasma exchange during this 10‐year period, 42.2% (81/192) pts were diagnosed with DAH: 43.0% (37/86) pts with myeloperoxidase positive ANCA RV, 40.4% (23/57) pts with proteinase‐3 positive ANCA RV, 32.1% (9/28) pts with anti‐GBM RV, and 57.1% (12/21) pts with severe SLE. Pts were defined as having DAH if the pt had progressive hemoptysis and/or evidence of DAH by bronchoscopy. Median pt age was 54 years (19‐85 years old; 59% (48/81) pts were female. Majority of pts presented with cough, dypsnea, and hemoptysis; hypoxemia; and diffuse bilateral alveolar opacities. 84% (68/81) pts underwent bronchoscopy; 73% (59/81) pts were intubated during hospitalization. All pts received the following IS regimen: high dose corticosteroid (CS) therapy, plasma exchange (TPE), and cyclophosphamide (CP) or rituximab (RTM). Pts received pulse CS (methylprednisolone 500‐1000 mg IV X 3‐5 days) followed by prolonged prednisone taper (initially 1 mg/kg/day), and CP (500‐750 mg/m2 IV every 4 weeks or 75‐150 mg/day PO, for 3‐6 months) or RTM (375 mg/m2 weekly X 4 weeks, or alternate bi‐weekly protocol X 2 infusions). Pts received daily TPE treatments (1‐1.5 plasma volumes with fresh frozen plasma (FFP) replacement, or 5% albumin followed by FFP, 0.5‐0.75 plasma volume each) until DAH resolved. TPE treatments (txs) were initiated within 4‐8 hours of the referral.
Results/Finding: 88% (71/81) pts experienced resolution of DAH ≤7 days after starting IS regimen. Resolution of DAH was defined as: complete (or near complete) resolution of alveolar bleeding or hemoptysis, and improvement in oxygenation (decrease in FI02 requirements ≥ 0.30, and/or increase in SA02 ≥ 10%), with or without improvement in chest x‐ray findings). The mean number of TPE txs was 3.7 (2‐8 txs). 88% (52/59) of intubated pts were extubated. 86% (70/81) pts had significant improvement in oxygenation and 77% (62/81) pts had decreased pulmonary infiltrates. 11% (9/81) pts died of complications of pneumonia and sepsis. 7% (6/81) pts experienced recurrent DAH over a median follow‐up of 67 months (3‐117 months). Study limitations include: 1) retrospective case series, and 2) no historical control group.
Conclusion: Diffuse alveolar hemorrhage is an uncommon, but potentially life‐threatening complication of pulmonary‐renal vasculitides, including SLE. High dose corticosteroids, cyclophosphamide or rituximab, and plasma exchange are useful treatment modalities and, when initiated promptly, appear to be highly effective in providing rapid resolution of antibody mediated alveolar hemorrhage.
TA6
Individual Selection and Plasmapheresis Help to Fight Refractoriness to Transfusions of Platelet Concentrates in Hematological Patients
Anzhelika Rakhmani*, Elena Mikhaylova, Igor Dubinkin, Olga Kalmikova, Vladimir Galuzyak, Vera Troitskaya and Tatjana Gaponova
National Research Center for Hematology, Moscow, Russian Federation
Background/Case Studies: Refractoriness to platelets concentrates (PC) transfusions adversely affects the conduction of comprehensive therapy in hematological patients. Individual selection of PC is recommended for such cases. When individual PC selection is complicated because of the high degree of alloimmunization due to the formation of antibodies (HLA/HPA), plasmapheresis procedures (PPs) are included in the treatment program. The aim of the study was to assess the effectiveness of transfusions of individual selected PC for patients with refractoriness, and the use of PPs as the second line of therapy.
Study Design/Method: From September 2015 to December 2017, 91 out of 1263 hematological patients with PC transfusion showed refractoriness and were enrolled in the study. All enrolled patients received PC transfusions after individual selection by cross‐matching using Immucor Capture‐P solid phase technology. In 28 (30%) out of 91 patient individual PC selection was unsuccessful so PPs were used as a second line of therapy. Patients received PPs: AA‐4 (20%); MDS‐8 (47%); AML‐12 (26%); ALL‐4 (44%). The median age was 48 (23‐71) years. M/F‐8/20. From 2 to 15 PPS were performed (on average – 4) for each patient. All patients after the PP procedure immediately received transfusions of individually selected by cross‐matching PC. The efficacy of PC transfusions was assessed by API, CCI, and hemorrhagic syndrome relief.
Results/Finding: In 26 of 28 patients with refractory to PC transfusions, in the absence of compatible donor's platelets, PPs in combination with subsequent transfusions of individually selected PCs promoted relief of hemorrhagic syndrome, change in API from 3,3х109/l to 29,5 x10⁹/l and CCI from 1,3 to 10,7. PPs combined with individual selection of PC allowed reducing the degree of alloimmunization (ratio of incompatible donor‐recipient pairs during PC selection, %): for patients with AA (n=4) ‐ from 91.7% to 50.2%; MDS (n=8) ‐ from 89.6% to 31.6%; AML (n=12) ‐ 86.0% to 40.5% and ALL (n=4) ‐ from 91.7% to 37.7%. In 2 patients with high degree of alloimmunization after PPs, selection of compatible platelets was unsuccessful, and therefore PC transfusions were ineffective (API = 5 x10⁹/l, CCI=1), and hemorrhagic syndrome was not completely managed, although its severity was reduced.
Conclusion: Development of refractoriness to PC transfusions and unsuccessful individual selection of platelet in one hematological patient calls for PPs as the second line of therapy. PPs combined with the individual selection of PCs decreases the degree of alloimmunization, and therefore increase donor‐recipient compatibility and clinical efficacy of PC transfusions. When PPs combined with the individual selection of PCs is ineffective, it is necessary to seek for the syndrome of increased consumption and other mechanisms of development of refractoriness.
TA7
Mathematical Model and Smartphone App for Predicting Coagulation Factor Levels after Therapeutic Plasma Exchange
Ray Zhang*1, Aaron Dahl1, Bryan Marchant1, Ronald Jackups1, Hope Karnes2, Priyank Shah1, Marian Dynis3, Suzanne Thibodeaux1 and George Despotis1
1Washington University School of Medicine, 2Veteran Affairs Medical Center, 3Barnes‐Jewish Hospital
Background/Case Studies: Therapeutic plasma exchange (TPE) is a procedure used to remove pathologic substances in the plasma. However, the procedure also depletes plasma coagulation factors, which can lead to major bleeding. The goal of this study was to evaluate performance of a mathematical model for predicting post‐procedure coagulation factor levels in a cohort of hospitalized patients. A smartphone app based on the model was created for determining how much plasma replacement is needed to achieve a target post‐TPE factor level.
Study Design/Method: Our model utilizes patient weight, pre‐TPE hematocrit and pre‐TPE coagulation factor levels, as well as the volumes of plasma processed and plasma replaced. Model accuracy was assessed by comparing predicted versus measured post‐TPE fibrinogen and antithrombin levels for 49 inpatient TPE procedures occurring at a large academic medical center between 2013 and 2017. Upon model validation, a smartphone app was developed for iOS and Android devices.
Results/Finding: Minor adverse events occurred for 25% of patients, all of which resolved spontaneously or with management. No bleeding or thrombotic complications occurred. The mean difference between predicted and measured post‐TPE fibrinogen concentrations was 4.3 mg/dL (SD ± 23.1, range: ‐66 to 44), while percent difference between measured and predicted fibrinogen concentration was 3.10% (SD ± 12.8, range of ‐29 to 30). The mean difference between predicted and measured post‐TPE antithrombin concentrations was 3.4% activity (SD ± 9.4, range ‐18 to 33), while mean percent difference between predicted and measured antithrombin percent activity was 3.75% (SD ± 13.1,range ‐25 to 36).
Conclusion: Our model reliably predicts post‐TPE fibrinogen and antithrombin concentrations within 25% of the measured value. When maintenance of critical factor levels is essential, clinicians should consider targeting coagulation factors 20‐25% higher than projections. The app, Plexfactor, greatly simplifies calculation of plasma replacement needed to achieve a target post‐TPE factor level. It is available free for iOS and Android.
TA8
Effects of Nominal and High Ultraviolet‐A Dose Photopheresis Treatment on Monocytes
Katherine Radwanski* and Kyungyoon Min
Fresenius Kabi
Background/Case Studies: While the mechanism of action of extracorporeal photopheresis (ECP) has not been fully elucidated, several theories ascribe a key role to ECP treated lymphocytes as the starting point for the immunological cascade that follows in vivo. Numerous studies have shown that lymphocytes are particularly susceptible to ECP; a majority become apoptotic 48–72 hours post treatment. The reported effects of ECP on monocytes have been mixed. Short term studies show that monocytes are resistant to apoptosis, while longer term studies show that monocyte viability is ultimately impacted by ECP. Additional studies on monocyte to dendritic cell (DC) maturation post ECP have suggested that monocytes treated with lower doses of ultraviolet A (UVA) light differentiate into mature DCs while those treated with larger doses of UVA become immature DCs. In light of these reports, an investigation was undertaken to evaluate the impact of nominal and high UVA dose ECP on monocyte apoptosis and differentiation into DCs.
Study Design/Method: Mononuclear cells obtained from healthy subjects using leukapheresis were diluted with plasma and saline and transferred to polyolefin treatment containers. 8‐Methoxypsoralen was added (330 ng/mL) and the cells were treated with either 1.5 (nominal) or 3.0 (high) J/cm2 of UVA light under constant agitation (1 Hz) using a standalone photoactivation device. ECP treated cells and leukapheresis only controls were purified using density gradient separation and cultured for up to 3 days in 10% human serum or plasma in RPMI 1640 with 2 mM glutamine in gas permeable containers at 37°C with 5% CO2. Flow cytometric analyses included lymphocyte and monocyte apoptosis (LA and MA, respectively) and monocyte/DC subsets and enumeration. Cytokine induced DCs were prepared as positive controls from healthy subject monocytes.
Results/Finding: LA levels were higher in ECP arms compared to controls throughout storage, with levels converging to 90‐95% in the ECP arms by Day 3 vs 14% in controls (n = 5 per arm). MA levels on Day 1 were similar between control and nominal UVA (14 vs 16%, p=0.72), which were both lower than high UVA (53%, p<0.01). After Day 1, MA levels in nominal UVA increased above controls and approached levels in high UVA by Day 3 (81 vs 92%, p=0.06) compared to 27% in the control (p<0.02). Approximately 5% of monocytes differentiated into mature DCs overnight in nominal UVA and controls (p=0.79) compared to 2% in high UVA (p<0.04). During storage, mature DC levels declined more rapidly in the ECP treated arms. Immature DC levels remained low (1% or less on average) during storage in all arms.
Conclusion: ECP treatment promoted monocyte apoptosis and reduced the number of monocyte‐derived mature DCs during in vitro culture. ECP with high UVA doses led to a more rapid decline of monocyte viability and did not promote monocyte differentiation into immature DCs. The implication of these findings with respect to ECP's mechanism of action remains to be determined.
TA9
Heterogeneity of Pediatric Apheresis Provider Opinions and Utilization Patterns
Laura Cooling*1, Meghan Delaney2 and Jay S. Raval3
1University of Michigan, 2Children's National Health System, 3University of North Carolina
Background/Case Studies: Utilization data for pediatric apheresis is unclear. While the American Society for Apheresis publishes recommendations (ASFA Guidelines), these are not pediatric‐specific and many children with diseases treated with apheresis may not be included. Thus, needs exist to more definitively assess impressions of apheresis physicians treating pediatric patients and cross‐reference this with actual apheresis procedure performance data.
Study Design/Method: In this descriptive 2‐part pilot investigation consisting of a survey and retrospective analysis, 3 members of the ASFA Pediatric Subcommittee each listed what 10 disease indications they believed were the most important 10 conditions for which apheresis should be performed in children. This list was based on the participants’ own medical judgments/experiences and were not restricted to any source material. Each member then collected pediatric apheresis procedure data from their respective centers for the 2014 calendar year. To keep analyses consistent, the 2013 ASFA Guidelines were used, as this was the most current version available during the study period.
Results/Finding: The 10 top conditions for which the 3 respondents felt apheresis therapy should be performed in children were: humoral rejection of various solid organ transplants (5), thrombotic thrombocytopenic purpura (3), acute sickle cell disease crisis (3), graft versus host disease (3), sickle cell disease maintenance therapy (2), myasthenia gravis (2), Guillain‐Barre syndrome (2), focal segmental glomerulosclerosis recurrence (2), ABO incompatible liver transplant desensitization (1), acute disseminated encephalomyelitis (1), familial hypercholesterolemia (1), rapidly progressive glomerulonephritis (1), neuromyelitis optica (1), anti‐N‐methyl‐D‐asparate receptor encephalitis (1), multiorgan failure/sepsis (1), and fulminant Wilson disease (1). In the retrospective procedure analysis, 82 children were treated with apheresis; 65 (82%) had diagnoses in the “top 10” conditions to treat. Patients with treated conditions not in the “top 10” included: leukapheresis for acute leukemia (5), cold agglutinin disease (2), meconium aspiration hemolysis (2), atypical hemolytic uremic syndrome (2), and 1 patient each for diffuse alveolar hemorrhage, systemic lupus erythematosis, brochiolitis obliterans syndrome, malaria, hypereosinophilia, and major ABO incompatible stem cell transplant. All conditions except anti‐N‐methyl‐D‐asparate receptor encephalitis, meconium aspiration hemolysis, and hypereosinophilia were listed in the ASFA Guidelines.
Conclusion: There is heterogeneity in what are considered the most important conditions to treat pediatric patients by apheresis professionals, and uncommon conditions neither listed as most important nor in the ASFA Guidelines are treated with apheresis. These findings provide the ASFA Pediatrics Subcommittee justification to perform a multicenter analysis to help clarify these issues.
TA10
Benchmarking the Centralized Urgent RBC Exchange Service for Patients with Severe Complications of Sickle Cell Disease
Jacob Smith*1, Jansen N. Seheult1, Joseph E. Kiss2, Joan Sevcik3 and Alesia Kaplan1
1Department of Pathology, University of Pittsburgh, 2Division of Hematology/Oncology, University of Pittsburgh, 3Blood Systems Inc.
Background/Case Studies: Urgent red blood cell (RBC) exchange is required for sickle cell patients with severe complications such as acute chest syndrome and stroke. There is no consensus on the recommended time from request to initiation of RBC exchange in these patients.
Study Design/Method: A retrospective review of the electronic medical records and blood bank records from 2012 to 2016 was conducted to identify patients with complications of sickle cell disease requiring an urgent RBC exchange procedure at three hospitals serviced by a centralized hemapheresis center. Demographics, clinical features and laboratory parameters, such as hemoglobin/hematocrit, hemoglobin fractionation results and history of RBC alloantibodies, and temporal parameters, including time of procedure request, line placement, nurse/ equipment arrival, time of RBC issue and start of the procedure, as well as outcome data were recorded.
Results/Finding: Thirty‐eight patients (22 females and 16 males, mean age 30 ± 15 years) received a total of 42 RBC exchanges for stroke/ TIA (13) and acute chest syndrome (29). Thirty patient had SS disease, 3 patients had SC disease, 4 patients had S/β thalassemia and 1 patient had S/ O(Arab) disease. Nine patients (24%) had current/historic RBC antibodies. Most (40/42) procedures were performed using central venous access; two procedures were performed using peripheral access. Temporal data for major steps in the process are shown in Table 1. The presence of current or historic RBC alloantibodies did not result in a significantly longer time to initiation of RBC exchange (p=0.09, independent samples t‐test). All procedures were successful in reaching targeted hematocrit and fraction of cells remaining. There were no in‐hospital deaths.
Conclusion: The major delay in initiating urgent RBC exchange was due to finding compatible RBC products (Rh, Kell match and honoring allo RBC antibodies) and not in obtaining central venous access. Benchmarking the steps of urgent RBC exchange in sickle cell patients can facilitate quality improvement of the process and establishment of local and national guidelines for patients with severe complications of sickle cell disease.
TABLE 1 (TA10) Temporal data for major steps from request to initiation of urgent red blood cell exchange
| Mean±SD (hours) | Median, interquartile range (hours) | |
|---|---|---|
| Request‐line placement (n=38)* | 7.43 ± 13.09 | 4.07 (5.91‐2.53) |
| Request‐RBC issue (n=42) | 14.99 ± 21.06 | 6.57 (5.2‐15.3) |
| Request‐nurse arrival (n=42) | 15.46 ± 21.27 | 7.11 (5.2‐15.0) |
| Nurse arrival‐procedure start (n=42) | 1.09 ± 0.47 | 1.0 (0.8‐1.3) |
| Request‐procedure start (n=42) | 16.55 ± 21.21 | 8.3 (6.4‐16.6) |
*Two procedures were performed with peripheral access and two patients had central venous access placement prior to procedure request.
TA11
Efficiency of Plasma Exchange in Patients with Inflammatory Dilated Cardiomyopathy
Victoria Kulikova*1, Alexandr Nedostup1, Olga Blagova1, Vladimir Zaidenov2, Ilya Nechaev1 and Aligeydar Ragimov1
1I.M. Sechenov First Moscow State Medical University, 2Institute of Transplantology and Artificial Organs
Background/Case Studies: to investigate the clinical efficiency of plasma exchange (PE) in patients with inflammatory dilated cardiomyopathy (iDCM) due to immune‐mediated myocarditis in comparison with group without PE.
Study Design/Method: There were 14 iDCM patients due to immune‐mediated myocarditis in the treatment group (13 male, mean age 44.8 ± 11.5 years, left ventricular end‐diastolic diameter (LVEDD) 6.3 ± 0.6 cm, left ventricular ejection fraction (LVEF) 33.5 ± 8.1%, NYHA functional class 2 [1;3]) and 19 iDCM patients (12 male, mean age 46.3 ± 12years, LVEDD 6.6 ± 0.8 cm, LVEF 32.6 ± 7.3%, NYHA functional class 3 [2;3]) who were followed without PE. Treatment group patients were underwent a single volume therapeutic PE. All the patients had two or more fold increase of at least two anti‐heart antibodies (AHA) level (to cardiac nuclear antigens, endothelial, cardiomyocytes, conduction and smooth muscle cells antigens) and underwent endomyocardial biopsy (EMB, n=17), cardiac CT (n=38), MRI (n=21), myocardial perfusion scan (n=39), and coronary angiography (n=20) to diagnose myocarditis. All the patients were treated either with immunosuppression drugs or without them. Echocardiographic parameters and AHA level detection were assessed at baseline and with two follow‐up (FU) visits in about 6 and 12 month in both groups. We also evaluated a 6‐minute walk test (6MWT) distance in the treatment group.
Results/Finding: AHA level significantly decreased just after PE and during the FU in the treatment group (p<0.05). Treatment group patients had significant improvement in LVEF (41.4 ± 8.2% and 46.3 ± 12.7% during the first and the second FU vs. 39.1 ± 13.7% and 37.2 ± 10.7% in the control group, p<0.05). LVEDD, left and right atrial volume significantly decreased as well while they did not change during FU in the comparison group. PE group patients had significant improvement in 6MWT distance during all the period. Seven (50%) PE group patients with absolute LVEF improvement >10% were classified as responders vs. 6 (32%) responders in the control group. Responders in the study group were characterized by initial higher systolic PAP (44 ± 13.4 vs. 27.9 ± 6.0, p<0.05). Six (43%) treatment group patients and 17 (89%) control group patients got methylprednisolone (p<0.05). The mean dose was 11.8 ± 6.6 and 21 ± 12.4 mg per day respectively (p<0.05).
Conclusion: PE improves cardiac function and daily activities in patients with iDCM. There were 50% study group responders. Systolic PAP 28.5 mmHg and higher was good outcome predictor of PE efficiency. PE helps avoid using immunosuppressive medications or reduce high doses of it.
TA12
Transfusion Management of Erythropoietic Protoporphyria in a Post‐Orthotopic Liver Transplant Patient
Brian D. Adkins* and Garrett S. Booth
Vanderbilt University Medical Center
Background/Case Studies: Erythropoietic protoporphyria (EPP) is a disorder of heme synthesis caused by an abnormality in the terminal enzyme ferrochelatase. Protoporphyirin (PPIX) accumulates within red cells and deposits in the skin and liver manifesting as photosensitivity and less commonly liver disease. Hematopoietic stem cell transplantation (HSCT) corrects the enzymatic abnormality, but patients may also require orthotopic liver transplant (OLT). In the post‐OLT period multiple therapies have been employed to reduce plasma PPIX levels, such as simple transfusion and hemin infusion which reduce PPIX production. Therapeutic plasma exchange (TPE) and red blood cell exchange (RBCx) have been shown to transiently improve laboratory values and histologic findings but fail to prevent progression of liver disease. As such, the 7th edition of the American Society for Apheresis guidelines categorized EPP as a category III indication for apheresis. We herein present a pediatric patient with EPP who underwent OLT as a bridge to SCT and was managed with simple transfusion, TPE, and RBCx.
Study Design/Method: We present a 17‐year‐old male with EPP and recurrent hepatic porphyria crises. The patient presented with right upper quadrant pain, transaminitis, and anemia (hemoglobin 8.9 mg/dL, hematocrit 27%). He was started on hemin (Panhematin; Recordati Rare Diseases Inc, Lebanon Brunswick, New Jersey) and daily TPE while undergoing evaluation for OLT. After OLT, he was started on RBCx every 3 weeks and underwent a total of 12 RBCx procedures. TPE was gradually weaned from daily to once a week with a total of 47 TPE procedures performed. Additionally, the patient's hemoglobin threshold was raised to 9 mg/dL to suppress erythropoiesis.
Results/Finding: In the 10 months following OLT, the patient's mean hemoglobin and hematocrit were 8.6 mg/dL and 27%. The patient continued to have elevated PPIX (mean=1105.8, normal < 20 μg/dL) and total plasma porphyrin (mean=1180.1, normal < 80 μg/dL) with associated diffuse axonal polyneuropathy. He additionally continued to have elevated liver enzymes and post‐transplant liver biopsies showed increasing iron deposition, mixed inflammation, and increased fibrosis. The patient also developed hypogammaglobulinemia associated with chronic TPE. The patient was ultimately transferred due to the high acuity of care and is preparing for HSCT.
Conclusion: TPE and RBCx are often employed in the management of EPP patients despite being an ASFA category III indication. In our experience PPIX and total porphyrins remained elevated and the patient had continued liver injury. Chronic red cell transfusion maintaining a hematocrit of >39% has been shown to improve symptoms in a patient with congenital erythropoietic porphyria by suppressing erythropoiesis; however, our patient was not transfused to that level. Interest has waned in hypertransfusion with patients being successfully managed by hemin infusions, which have a lower iron burden, though this treatment was also inadequate in our patient. As it stands apheresis remains insufficient in impacting the long‐term effects of EPP and hypertransfusion remains incompletely explored.
TA13
Early Plasma Exchange Is Effective in Anti‐Thymocyte Globulin‐Associated Serum Sickness
Sarita Joshi*1 and Kristin Ricci2
1Section of Transfusion Medicine, Cleveland Clinic, 2The Cleveland Clinic, Section of Apheresis
Background/Case Studies: Anti‐Thymocyte Globulin (ATG) is a potent anti‐rejection agent for kidney allograft recipients. Serum sickness (SS), an immune complex mediated condition, occurs in 7‐27% of kidney transplant patients who receive rabbit ATG (rATG). Prior rabbit exposure is considered a risk factor for SS development. Patients classically manifest with high fevers, polyarthritis, arthralgias, rash, lymphadenopathy, renal failure and rarely with rapidly progressive paralysis. Treatment includes corticosteroids, antihistamines, and symptomatic therapy. Case series suggest effectiveness of 1‐2 therapeutic plasma exchange (TPE) procedures in the management of rapidly evolving serum sickness. We report a case of rATG‐associated SS in a renal transplant patient who improved after a single plasma exchange treatment.
Study Design/Method: Case report and literature review.
Results/Finding: A 36 year old female with end stage renal disease secondary to anti‐GBM antibody (Goodpasture) disease presented ten days after a deceased donor kidney transplant with debilitating polyarticular arthralgias, pleomorphic rash, severe allodynia and rapidly progressive upper limb weakness. She had received a total of 625 mg of rATG as induction therapy for her transplant. At presentation, she had severe joint tenderness, upper and lower extremity swelling and proximal, bilateral upper extremity paresis. She had been ambulating normally the evening prior to admission.
Imaging of the brain and spinal cord was unremarkable. Hypercoagulability and other causes of neuropathy were ruled out. Her complement levels were low. The patient had undergone a course of TPE early in her post‐transplant course for suspected antibody‐mediated rejection, which was later excluded. She had no prior exposure to rabbits. However, her past medical history was significant for exposure to rATG during a prior renal transplant. She had no past history of serum sickness.
Due to the severity of her symptoms and lack of response to corticosteroids, plasma exchange using albumin replacement was initiated. Following the procedure, the patient noticed an impressive reduction in pain. The next day her rash waned, swelling had subsided and she regained upper extremity function. She was able to ambulate with a walker at the point of discharge, a week later. No additional apheresis treatments were performed.
Conclusion: Early plasma exchange is highly effective at reversing the symptoms of serum sickness, especially in patients with rapidly progressive neuropathy, weakness and severe pain, who are refractory to corticosteroids. Current apheresis guidelines do not list SS as an indication for TPE. This report and a review of literature support the inclusion of TPE for Serum Sickness, as a Category III indication with a Grade 1C level of evidence, for future practice guidelines.
TA14
Management of Severe Anti‐D, Anti‐G, and Anti‐E Hemolytic Disease of the Fetus and Newborn with Plasmapheresis, IVIG, and Intrauterine Transfusion
Erica Swenson*1, Mark Zivney1, Leonardo Pereira2, Thomas Deloughery3, Trisha Wong4 and Amanda Vansandt1
1Oregon Health & Science University ‐ Pathology/Transfusion Medicine, 2Oregon Health & Science University ‐ Perinatology, 3Oregon Health & Science University ‐ Hematology/Transfusion Medicine, 4Oregon Health & Science University ‐ Pediatric Hematology/Transfusion Medicine
Background/Case Studies: We present the case of an O negative 31‐year‐old female with a history of 2 uncomplicated term pregnancies, for which she appropriately received Rh immune globulin. In spite of this, the antibody screen became positive in an anti‐D+C pattern during her 3rd pregnancy, which unfortunately ended in an intrauterine fetal demise at 26 weeks. She then presented to our institution for prenatal care for her 4th pregnancy at 6 weeks 6 days gestation. Her husband is homozygous D/D.
Study Design/Method: Reference lab testing revealed the presence of anti‐D, anti‐G, and anti‐E antibodies, and was negative for anti‐C. The anti‐D+G titer was 1:4,000 and the anti–E titer was 1:2,000 initially (see table 1). At 11 weeks and 0 days the patient underwent a three day course of plasmapheresis. On her third day of plasmapheresis, she also had IVIG administration. Weekly antibody titers were followed clinically, and the patient was managed with weekly IVIG administration until intrauterine transfusion (IUT) was possible.
At 22 weeks 7 days gestation the patient underwent IUT for middle cerebral artery peak systolic velocity greater than 1.5 MoM by Doppler ultrasonography. She had a total of 5 IUTs, every 3‐4 weeks, until delivery (table 2).
Results/Finding: The patient delivered a 5 lb 3 oz male infant at 33 weeks gestation. At delivery his hemoglobin was 17.4 mg/dL, hematocrit 51.9%, and total bilirubin was 3.5 mg/dL. During hospitalization he was managed with IVIG and seven days of phototherapy. One packed red blood cell transfusion for a hematocrit nadir of 22.1% was administered on day of life 21. The infant was discharged on day of life 28 with a stable hematocrit of 30.2%. He received two more pRBC transfusions over the course of three months until his hemoglobin and hematocrit stabilized.
TABLE 1 Interventions vs Titers
| Gestational Age | Intervention | Anti D+G Titers |
|---|---|---|
| 11w2d‐11w5d | Plasmapheresis × 3IVIG 5% 50g | 1:4000 |
| 11w6d | None | 1:256 |
| 12w3d | IVIG 10% 60g | 1:1000 |
| 13w3d | IVIG 10% 80g | 1:1000 |
| 14w3d | IVIG 10% 80g | 1:1000 |
| 15w3d | IVIG 10% 80g | 1:1000 |
| 16w3d | IVIG 10% 80g | 1:500 |
| 17w3d | IVIG 10% 80g | 1:256 |
| 18w3d | IVIG 10% 80g | 1:256 |
| 19w3d | IVIG 10% 80g | 1:256 |
| 20w3d | IVIG 10% 80g | 1:1000 |
| 21w3d | IVIG 10% 80g | 1:2000 |
| 22w3d | IVIG 10% 80g | 1:2000 |
| 23w3d | IVIG 10% 85g | 1:4000 |
| 24w3d | IVIG 10% 85g | 1:8000 |
| 25w3d | IVIG 10% 85g | 1:16000 |
| 26w3d | IVIG 10% 85g | 1:16000 |
| 27w3d | IVIG 10% 90g | 1:16000 |
| 28w2d | IVIG 10% 85g | 1:4000 |
| 28w3d | IVIG 10% 90g | Not measured |
| 29w0d | IVIG 10% 90g | 1:4000 |
| 29w3d | IVIG 10% 90g | 1:8000 |
| 30w0d | IVIG 10% 90g | 1:4000 |
| 30w3d | IVIG 10% 90g | 1:8000 |
| 31w0d | IVIG 10% 90g | 1:2000 |
| 31w3d | IVIG 10% 90g | 1:4000 |
| 32w0d | IVIG 10% 90g | 1:2000 |
| 32w3d | IVIG 10% 90g | 1:2000 |
TABLE 2 Intrauterine transfusions
| Gestational age | Pre‐ Hematocrit | Intervention | Post‐Hematocrit | Estimated Fetal Weight |
|---|---|---|---|---|
| 22w1d | 18.4% | 32 mL RBCs | 43.1% | 560g |
| 24w2d | 19.4% | 42 mL RBCs | 42.3% | 730g |
| 27w1d | 24.3% | 53 mL RBCs | 40.5% | 1014g |
| 29w5d | 25.4% | 75 mL RBCs | 58.9% | 1500g |
| 32w1d | 30.5% | 83 mL RBCs | 42.7% | 2233g |
| 36w1d* | 22.1% | 50 mL RBCs | 31.2% | 2930g |
| 39w1d* | 19.7% | 50 mL RBCs | 23.5% | 3415g |
| 42w0d* | 19.8% | 70mL RBCs | 26.1% | 4080g |
*Note: Patient was born at 33w0d. Asterisk denotes postnatal transfusions.
Conclusion: We present a case of severe hemolytic disease of the fetus and newborn, in the setting of suspected Rh immunoglobulin failure, successfully managed with plasmapheresis, IV IG, and intrauterine transfusions.
TA15
Successful Plasma Exchange Combined with Unfractionated Heparin Anticoagulation in a Patient Exhibiting Anaphylaxis to Acid‐Citrate‐Dextrose Formula A
Do‐Hoon Kim*, Dong‐Seok Jeon, Nam‐Hee Ryoo, Wonmok Lee and Jung‐Sook Ha
Keimyung University School of Medicine
Background/Case Studies: In general, apheresis performed with the aid of Acid‐Citrate‐Dextrose Formula A (ACD‐A) is considered safe. The adverse effects of ACD‐A are caused principally by the physiological effects of hypocalcemia, and can be prevented by oral or intravenous calcium supplementation. Serious side effects such as anaphylaxis are very rare. In such cases, unfractionated heparin (UFH) can serve as an anticoagulant during apheresis; however, no guideline for stand‐alone UFH dosing during apheresis is available. We report on a patient who developed anaphylaxis to ACD‐A during plasmapheresis; we successfully used UFH as a stand‐alone anticoagulant.
Study Design/Method: A 55‐year‐old man with chronic kidney disease caused by focal segmental glomerulosclerosis presented to the nephrology clinic for his third kidney transplantation. The first and second transplantations had been performed at the ages of 25 and 34 years. The only available kidney donor was his wife, who was blood‐group incompatible. The patient's blood type was A+; his wife's was B+. After admission, plasmapheresis was commenced to deplete anti‐ABO antibodies (a preconditioning protocol). A 1.0‐volume plasma exchange featuring ACD‐A anticoagulation with Spectra Optia (Terumo BCT, Lakewood, CO, USA) was planned every other day. The replacement fluid was AB+ fresh frozen plasma (FFP). During the first plasmapheresis session, the patient developed generalized itching. About 10 min after commencement of the second session, he developed urticaria, followed by dyspnea, hypotension, and loss of consciousness. Plasmapheresis was stopped immediately, and intravenous dexamethasone and chlorpheniramine maleate were administered; the symptoms disappeared in about 1 h. Thereafter, skin prick and intradermal citrate tests yielded strongly positive results. We thus used UFH as a stand‐alone anticoagulant during plasmapheresis, eliminating ACD‐A. The replacement fluid was changed from FFP to albumin because FFP contains citrate. When UFH was infused continuously during plasmapheresis, the whole blood:UFH ratio was held at 1:28. A 1.5‐volume plasma exchange was performed during every plasmapheresis session.
Results/Finding: We successfully performed five plasmapheresis sessions using UFH as the sole anticoagulant. Two sessions were scheduled preoperatively (to deplete anti‐ABO antibodies) and three postoperatively (to remove class II anti‐HLA donor‐specific antibodies). The patient underwent successful kidney transplantation and maintains good graft function at 3 months of follow‐up.
Conclusion: When a patient develops an allergic reaction to citrate during plasmapheresis, UFH can be used safely as a stand‐alone anticoagulant.
TA16
Cognitive Improvement in Hemochromatosis Patient with Testosterone Induced Polycythemia after Consecutive Automated Double Red Cell Collections
Monisha Dey*, Cheryl Chavez and Tina S. Ipe
Houston Methodist Hospital
Background/Case Studies: Therapeutic phlebotomy (TP) is the standard treatment for patients with blood disorders resulting in excess red cell production. A Double Red Blood Cell (dRBC) procedure offers an alternative to therapeutic phlebotomy. This option is potentially a more efficient means of depleting excessive red cells than TP.
A sixty‐eight‐year‐old male presented to our hospital's emergency room with altered mental status and stroke‐like symptoms. The patient's past medical history was notable for hypertension, hypothyroidism, and possible hemochromatosis. On physical examination, he was confused, tachycardic, and plethoric. Initial laboratory results showed an elevated hemoglobin (Hgb) and hematocrit (Hct) at 19.6 g/dL and 54.8% respectively. His other laboratory results such as white blood cell (10.27 × 10⁹) and platelet count (150 × 103) were within the normal range.
Study Design/Method: We performed an emergent, back‐to‐back dRBC procedures on the patient given his rapid clinical deterioration. We monitored the patient's CBCs through the course of the dRBC procedure (Table 1).
Results/Finding: After the completion of two consecutive dRBC procedures, the patient's total Hgb and Hct levels decreased by 27.6% and 25.3% respectively. The first dRBC collection was 22 minutes in duration with removal of 345 mL of red blood cells (RBCs). The second dRBC collection was 21 minutes with an additional removal of 456 mL of RBCs. Albumin was administered during the procedure as a replacement fluid instead of isotonic saline to maintain appropriate intravascular oncotic pressure. No adverse events were noted during both procedures and the patient tolerated them without any difficulty.
TABLE 1 (TA16) Hgb and Hct Values before and after each dRBC Procedure
| Pre Procedure Values | Post dRBC 1 Values | Change (%) After dRBC 1 | Pre dRBC 2 Values | Post dRBC 2 Values | Change (%) After dRBC 2 | Total Change (%) | |
|---|---|---|---|---|---|---|---|
| HGB (g/dL) | 19.6 | 17.3 | ‐11.7 | 17.3 | 14.2 | ‐17.9 | ‐27.6 |
| HCT (%) | 54.8 | 47.4 | ‐13.5 | 47.4 | 40.9 | ‐13.7 | ‐25.3 |
Conclusion: Utilization of an automated double red cell collection allowed for a donor apheresis instrument to be used therapeutically in treating a patient with testosterone induced polycythemia. The patient returned to his baseline cognitive function after the dRBC collection and avoided prolonged hospitalization due to his secondary polycythemia.
TA17
Erythrocytapheresis in Finland – a Blood Bank Perspective
Suvi Toivonen*, Hannele Sareneva, Taru Jäske, Inna Sareneva, Anu Korhonen, Katri Haimila and Susanna Sainio
Finnish Red Cross Blood Service
Background/Case Studies: Erythrocytapheresis (automated RBC exchange transfusion, RBCX) is increasingly used in the treatment of sickle cell disease, with benefits over simple transfusion including the ability to limit iron loading. Erythrocytapheresis practice was initiated in Finland in February 2017 at a single center. All blood products in Finland are provided by a single blood bank, which allowed the monitoring of the use for phenotyped RBC units in erythrocytopheresis practice and consequently the adequacy of the supply of phenotyped blood.
Study Design/Method: Data of RBC units provided by the blood bank to the erythrocytapheresis center was collected during 2/2017 – 3/2018. The patients were genotyped well in advance before the start of the treatment by using the ID Core XT kit. RBC units used in erythrocytapheresis were always matched for RhCE and K, and for JK, FY and Ss whenever such units were available in stock. Fy(a‐b‐) patients were matched for Fya but not for Fyb. Starting from the beginning of 2018, after a patient had been transfused with 12 units unmatched for a certain antigen, the particular antigen was not matched in future transfusions.
Phenotype matched units were reserved for each patient starting from one week before the procedure. Blood group determination, antibody screening and crossmatching were done by the blood bank on the day before the procedure, and crossmatched units were sent to the treatment center.
Results/Finding: Eleven patients (age 1‐44 years) received 2‐16 RBCX each during the study period of 13 months. The number of RBC units used varied from 3 to 12 per RBCX and 10‐166 per patient. Four patients received fully phenotype matched units only. Of the units transfused to the seven other patients, 56 % were unmatched for one or more antigens. Jkb was the antigen that was most often not matched: 293 Jkb positive units were transferred to five Jkb negative patients. In addition, 142 S positive units were transferred to S negative patients, 24 Fyb positive units to one Fy(a+b‐) patient, and 17 Fya positive units to four Fy(a‐b‐) patients. In order to match the R0 (Dce) phenotype, which is common in people of African ancestry, but rare in Europeans, 408 RhD negative units were transferred to RhD positive patients. None of the patients were alloimmunized during the study period.
Conclusion: Erythrocytapheresis practice requires careful planning in a close collaboration between blood bank, laboratory and treatment center. Erythrocytapheresis with phenotype matched RBC units poses a challenge to the supply of phenotyped blood, because of the large number of units required, but furthermore due to the differences in ethnicity between donor and patient populations. This necessitates the review of donor phenotyping strategies and highlights the importance of recruiting blood donors representing ethnic minorities.
TA18
Central Venous Catheter Infection Rate with Use of Chlorhexidine Gluconate 2%
Rebecca T. Lewis*, Grace B. Sese, Ashley Marinacci, Jennifer Scott and Joanne Im
Inova Fairfax Medical Campus
Background/Case Studies: Multiple clinical studies have shown the effectiveness of chlorhexidine gluconate (CHG) to reduce infection. The most common complication of long‐term tunneled catheter is central line associated bloodstream related infections (CLABSI) which strongly contributes to patient morbidity and loss of vascular access. Patients requiring the use of a central venous catheter (CVC) as an access either for hemodialysis, Apheresis and others have been found to have an increased risk CLABSI. The CDC issued guidelines to reduce CLABSI August, 2002. This process to reduce CLABSI was implemented in our Apheresis department prior to March 2003. There are several recommended antiseptic agents: 2% CHG, tincture of iodine, iodophor and 70% alcohol. Biopatch® was added in 2003 for CVC dressing changes with Apheresis patients (pts).
Study Design/Method: Data was collected retrospectively. In March 2003 the new process was implemented to reduce CLABSI. The patients were either on long‐term (>6 months) or short‐term ( < 3 weeks) use of CVC. CVC site was disinfected with betadine swabs followed by occlusive dressing. The CVC dressing was changed every 48 hours. In March 2003 the skin adjacent to the CVC was antiseptically cleansed during dressing changes with CHG & Biopatch® applied. The frequency of CVC infection was calculated. CHG is a cationic biquanide with a broad spectrum of antimicrobial activity. It is shown to be active against most of the pathogens using long‐term catheters. There have been no reports on the resistance patterns for CHG. It is a purely topical agent with minimal to no absorption from the skin, and without any reported toxic effects. Biopatch® is a hydrophilic foam impregnated with CHG, designed to deliver a large amount in the first 3 days, followed by a steady release for the next 7 days. This antiseptic dressing has been shown to decrease the skin microbial colonization at the exit site, thus reducing the catheter tip colonization.
Results/Finding: Prior to implementation of CHG for CVC line dressing, the rate of CVC line related infection was about 11‐13% in 2002. The infection rate significantly declined to 1.23% from January to September, 2004. Thereafter, the annual rate a 0.0% rate or the absence of CVC related infection was achieved and maintained from late 2004 until 2017. Early 2018 data remains similar.
Conclusion: CHG along with Biopatch® has decreased the incidence of CVC line infection for patients undergoing Apheresis procedures at Inova Fairfax Medical Campus’ Apheresis department. The application of Biopatch® significantly decreased the incidence of exit site infections.
References:
TA19
The Impact of Steroids on Serum Fibrinogen Levels during Therapeutic Plasma Exchange
Tammy Stalnaker*, Dawn Gallagher, Rachael Dash, Lidiya Sokolovska and Alexis R. Peedin
Thomas Jefferson University Hospital
Background/Case Studies: Patients who undergo a series of therapeutic plasma exchange (TPE) often receive steroids as part of treatment for the underlying disorder. When using 5% albumin as replacement fluid, fibrinogen is often followed to assess the need for fresh frozen plasma (FFP) as part of replacement fluid. As steroids can affect many laboratory parameters, we hypothesized that use of steroids may affect fibrinogen levels during TPE series. This study evaluated whether steroid use during a series of TPE predicted the need to use FFP as part of replacement fluid due to hypofibrinogenemia.
Study Design/Method: We retrospectively reviewed consecutive patients at our academic medical center from 01/2017‐03/2018 who underwent a TPE series with 5% albumin as initial replacement fluid. Patients with diagnoses for which FFP was indicated as replacement fluid were excluded. Indication for TPE, concurrent use of oral or intravenous steroids, trend in fibrinogen, and whether FFP was ever used as replacement fluid due to hypofibrinogenemia were noted. Statistical analysis was performed using Fisher's exact test and unpaired t‐test (GraphPad) with statistical significance defined as p<0.05.
Results/Finding: A total of 48 patients were identified, but 8 were excluded due to lack of baseline fibrinogen before TPE. One patient underwent two separate series of TPE. TPE was initiated for neurologic disorders in 27 (65.9%) patients, renal‐related disorders in 11 (29.3%) patients, and other disorders in 2 (4.9%) patients. Of the 41 TPE series included, in 31 (73.8%) series the patient received steroids and in 11 (26.2%) series the patient did not receive steroids. Of the patients taking steroids, 16 required FFP while 15 did not require FFP at any point during the TPE series. Of the patients not taking steroids, 3 required FFP and 7 did not require FFP at any point during the TPE series. Patients on steroids were no more likely than patients not on steroids to require FFP at any point during the TPE series (p=0.4913). Fibrinogen recovery before the last TPE procedure was compared for patients who received only 5% albumin; mean fibrinogen of patients on steroids was 77.3% of baseline while mean fibrinogen of patients not on steroids was 69.1% (p=0.7199).
Conclusion: Steroid use was not associated with a higher risk of using FFP at any time during the TPE series. For patients receiving only 5% albumin during the TPE series, the fibrinogen recovery did not differ between patients on steroids and those not on steroids. In this small sample, steroids had no effect on fibrinogen in patients receiving only 5% albumin during TPE.
TABLE 1
| Ever used FFP as replacement fluid | Never used FFP as replacement fluid | ||
|---|---|---|---|
| On steroids (n=31) | 16 | 15 | p=0.4913 |
| Not on steroids (n=11) | 3 | 7 | |
TTB1
Cardiac Valve Allograft Decontamination and Bioburden Reduction as a Tissue Banking Process
Christina Crossie1, Graeme Dowling1 and Jelena L. Holovati*2,3
1Comprehensive Tissue Centre, 2University of Alberta, 3Canadian Blood Services
Background/Case Studies: Bacterial contamination of recovered tissue allografts poses a serious threat to transplant recipients. Antibiotic disinfection is a standard practice utilized in cardiac valve (CV) allograft treatment in an effort to reduce the risk of bacterial contamination, however the composition of the antibiotic cocktail as well as incubation conditions can vary widely depending on the tissue bank. Changes to antibiotic availability and recent revisions to Canadian health standards have resulted in a requirement for further quantitative validation of tissue allograft bioburden reduction. The purpose of this study was to investigate the efficacy of the revised antibiotic cocktail on intentionally contaminated CV allografts, in order to quantitate bioburden reduction and define the optimal incubation temperature for the disinfection process.
Study Design/Method: Disinfection solution, composed of vancomycin (50 μg/mL), tobramycin (80 μg/mL), and cefoxitin (240 μg/mL) in RPMI and was inoculated with 105 CFU/mL of five challenge organisms considered medically significant in tissue banking at 4°C and 21°C. Following 24 hours of incubation, the remaining CFUs were counted and log reduction was calculated. To further evaluate the appropriateness of a disinfection incubation range of 24 hours ± 2 hours, four CVs were bisected and inoculated with 106 CFU of challenge organisms before being placed in the disinfection solution. At each time point one half of the allograft was removed and washed in Lactated Ringer's solution before recovering the remaining bacteria in sterile saline by sonication and mechanical shaking. The final recovery solution was filtered and quantified for bacterial growth.
Results/Finding: Recovery efficiency of the sonicated CV allografts was higher for aerobically vs. anaerobically cultured microorganism (61.89 % vs. 47.65 %). Maximal inhibitory dilution (MID) of the updated antibiotic cocktail utilized throughout the validation study demonstrated that the working concentration of antibiotics was more than sufficient to inhibit growth of all five challenge microorganisms. The most sensitive organisms were Staphylococcus aureus and Streptococcus pyogenes which were both inhibited at a dilution of 1/128, followed by Escherichia coli (1/32), Clostridium sporogenes (1/16) and Pseudomonas aeruginosa (1/8). In the absence of antibiotics, challenge organism growth at 4˚C remained relatively stationary (0.09‐log ± 0.09 and 0.30‐log±0.06 for aerobic and anaerobic cultures respectively). Incubation with antibiotics at this temperature resulted in a 1‐log reduction in growth (‐1.09 (±0.07) aerobic and ‐1.18 (±0.11) anaerobic). When the incubation temperature is increased to 21˚C there is greater than 2‐log increase in bacterial growth after 24 hours (2.64 ± 0.07 aerobic and 2.51 ± 0.25 anaerobic), but the the bioburden reduction was increased to over 4‐log at this incubation temperature (‐4.11log±0.05 for aerobic and ‐4.10log±0.15 for anaerobic).
Conclusion: This study demonstrates cardiac valves are optimally decontaminated in the proposed disinfection solution cocktail when the incubation temperature was increased from 4˚C to 21˚C. The disinfection protocol was shown to reduce bacterial bioburden by greater than 4‐log for both aerobic and anaerobic challenge organisms.
TS28
Fatal Neuroinvasive West Nile Virus Infection: Presumed Transfusion Transmission from Individual Donor NAT Negative Apheresis Platelets
Laura Stephens*1, Chelsea Hayes1, Carol Wilson1, Brent Di Meo1, Robert Snyder2, Vonetta Gladden3, Joy L. Fridey3 and Ellen B. Klapper1
1Cedars‐Sinai Medical Center, 2California Department of Public Health, 3American Red Cross
Background/Case Studies: Blood donor screening for West Nile Virus (WNV) infection using mini‐pool (MP) or individual donor (ID) nucleic acid testing (NAT) has reduced the risk of transfusion transmitted WNV (TT‐WNV). Reports of TT‐WNV have been related to donations that tested negative by MP‐NAT. We describe a case of fatal TT‐WNV that likely represents an ID‐NAT negative, undetected WNV donor infection, which to our knowledge, has not been reported.
Study Design/Method: A WNV ID‐NAT positive unit of apheresis platelets prompted a lookback investigation of prior donations. These included a WNV ID‐NAT negative apheresis platelet unit transfused to a heart transplant recipient who subsequently developed WNV neuroinvasive disease and expired. Pre‐transplant samples from the organ donor and recipient were all negative for WNV. Further investigation included notification of blood suppliers of possible TT‐WNV, follow‐up testing of the suspect platelet donor, and review of all blood components related to the incident.
Results/Finding: The patient received 18 blood components prepared from 25 donors in the perioperative period. Patient/suspect platelet donor events are summarized in Table 1. All donors contacted during lookback investigation denied symptoms of WNV in the month after donation. Negative follow‐up serologic results were also obtained for 9 donors, corroborating negative symptom reports; the remaining were lost to follow‐up.
TABLE 1 (TS28) Timeline of events. (S/CO: signal/cutoff ratio)
| Day | Patient Event (Recipient) | Suspect Donor Event |
|---|---|---|
| ‐4 | Donation of suspect platelet unit (ID‐NAT negative, S/CO < 1.0) | |
| 0 | Heart transplantation | Suspect platelet transfused; co‐component transfused to another recipient who later expired from underlying disease |
| +11 | Fever and altered mental status | |
| +15 | WNV detected by PCR in blood | |
| +17 | WNV IgM positive in CSF | |
| +22 | Transfusion service notified of patient with WNV neuroinvasive disease; investigation initiated | Platelet donation by suspect donor ID‐NAT reactive (S/CO 2.19), WNV IgM and IgG positive |
| +25 | Patient expired | |
| +29 | Follow‐up testing of suspect donor ID‐NAT negative, WNV IgM positive |
Conclusion: We describe a case of fatal neuroinvasive WNV disease in a heart transplant recipient, presumably acquired from a WNV ID‐NAT negative platelet transfusion identified during a lookback investigation. The low S/CO in the ID‐NAT positive donation likely represents the tail end of the donor's viremic period. The suspect ID‐NAT negative donation, 26 days earlier, suggests the donor was in the initial phases of WNV infection with viral load below that which is reliably detected by ID‐NAT. The small residual risk of TT‐WNV when viral load is below levels detectable by ID‐NAT may best be addressed by pathogen reduction technologies, as well as robust mosquito surveillance and control measures.
TS29
Monocyte Monolayer Assay (MMA) to Predict Clinical Significance of Alloantibodies: A 22‐Year Review
Joan L. Maurer*1, Sandra J. Nance2 and Pamela Nickle3
1ARDP, 2American Red Cross and American Rare Donor Program, 3American Red Cross
Background/Case Studies: MMA is a test used to predict the clinical significance of alloantibodies. It is most often used to assess antibodies directed at high prevalence antigens, however, it may also be used to assess common antibody specificities to find blood for patients with difficult‐to‐find antigen requirements. MMA results greater than 3% reactivity result in a transfusion recommendation for antigen negative blood; the negative reference range for the MMA in our laboratory is 0‐3%.
Study Design/Method: In 2011, MMA data was presented. In this review, the data are updated and the previous data was incorporated using results from 1995 through 2017. The assays were performed as previously described (Transfusion 1987; 27:449‐452). Testing was performed with fresh complement (C’) and without fresh complement (NC’) added to the test system.
Results/Finding: The following table contains MMA results for 402 serum samples tested. Some of these antibodies have been reported to have varying degrees of significance. Others were tested because there were insufficient blood products available to support transfusion needs.
Conclusion: Anti‐Yta continues to be the most tested specificity, with 119 of 195 samples yielding positive results (61%). Of the common specificities tested, one example of anti‐s demonstrated reactivity below the cut‐off while 3 of 11 examples of anti‐M (27%) yielded positive results. Emphasizing the importance of testing with and without C’, 10 sera were only positive with fresh C’ added, and 22 were only positive with no C’ present. These MMA results indicate a continued need to evaluate red cells for transfusion for each patient and not by antibody specificity alone.
(TS29)
| Anti‐ | TT | >3%C/NC | >3%C | >3%NC | ≤3% | Anti‐ | TT | >3%C/NC | >3%C | >3%NC | ≤3% |
|---|---|---|---|---|---|---|---|---|---|---|---|
| AnWj | 2 | 1 | 0 | 0 | 1 | Jsb | 1 | 1 | 0 | 0 | 0 |
| Ata | 4 | 3 | 0 | 0 | 1 | Kpb | 6 | 2 | 0 | 0 | 4 |
| Aua | 1 | 0 | 0 | 0 | 1 | Ku | 1 | 1 | 0 | 0 | 0 |
| Coa | 2 | 2 | 0 | 0 | 0 | Lan | 11 | 7 | 0 | 0 | 4 |
| Cra | 4 | 3 | 0 | 1 | 0 | LU Sys | 21 | 16 | 2 | 1 | 2 |
| Dib | 11 | 7 | 0 | 1 | 3 | Lub | 14 | 12 | 0 | 0 | 2 |
| Dob | 5 | 0 | 0 | 1 | 4 | Lw | 3 | 2 | 0 | 0 | 1 |
| E | 1 | 1 | 0 | 0 | 0 | M | 11 | 3 | 1 | 1 | 6 |
| e | 3 | 0 | 0 | 2 | 1 | N | 2 | 1 | 0 | 0 | 1 |
| GE Sys | 31 | 11 | 1 | 4 | 15 | PP1Pk | 1 | 1 | 0 | 0 | 0 |
| hrB | 3 | 2 | 0 | 0 | 1 | RH Sys | 1 | 1 | 0 | 0 | 0 |
| hrS | 7 | 4 | 0 | 0 | 3 | s | 1 | 0 | 0 | 0 | 1 |
| Hy | 9 | 7 | 0 | 0 | 2 | Sc1 | 1 | 1 | 0 | 0 | 0 |
| I | 5 | 1 | 0 | 0 | 4 | Tca | 2 | 1 | 0 | 0 | 1 |
| Jk3 | 1 | 0 | 0 | 0 | 1 | U | 4 | 2 | 0 | 0 | 2 |
| Joa | 10 | 4 | 0 | 0 | 6 | Vel | 13 | 10 | 0 | 0 | 3 |
| Jra | 15 | 7 | 1 | 1 | 6 | Yta | 195 | 104 | 5 | 10 | 76 |
Legend: TT = total tested
TS30
Utility of NT‐proBNP Levels in the Differential Diagnosis of Pulmonary Transfusion Reactions
Nareg Roubinian*1, Darrell Triulzi2, Jeanne Hendrickson3, Jerome Gottschall4, Dhuly Chowdhury5, Daryl J. Kor6, Mark R. Looney7, Michael Matthay8, Sheila Keating1, Steve Kleinman9, Donald Brambilla5 and Edward Murphy10
1Blood Systems Research Institute, 2The Institute for Transfusion Medicine, 3Yale University, 4BloodCenter of Wisconsin, 5RTI International, 6Mayo Clinic, 7UCSF, 8University of California at San Francisco, 9AABB, 10Blood Centers of the Pacific‐Irwin Center
Background/Case Studies: Transfusion‐associated circulatory overload (TACO) and transfusion‐related acute lung injury (TRALI) are important pulmonary complications of blood transfusion. We hypothesized that N‐terminal pro‐brain natriuretic peptide (NT‐proBNP), a marker of cardiac stress, could be used in conjunction with clinical risk factors to improve the identification and classification of patients with pulmonary transfusion reactions.
Study Design/Method: A case control study of risk factors for pulmonary transfusion reactions at four academic hospitals utilized active surveillance to enroll cases as well as transfused controls without pulmonary edema. Diagnoses of TACO and TRALI were derived from criteria used in the National Healthcare Safety Network surveillance definition. Cases were designated as Possible TRALI when acute respiratory distress syndrome risk factors were present. Cases were designated as TACO/TRALI when the two diagnoses could not be distinguished. NT‐proBNP levels were measured prior to and following transfusion. Wilcoxon Rank‐Sum tests and Kruskal‐Wallis tests were used to compare NTproBNP results between groups of TRALI, TACO, TACO/TRALI, Possible TRALI, and control patients.
Results/Finding: Prior to and following transfusion, NT‐proBNP levels were significantly elevated in patients with TACO (n=160) and Possible TRALI (n=51) compared to those with TRALI (n=12), TACO/TRALI (n=7), and controls (n=335) (p < .001 for overall comparison). Pre‐ and post‐transfusion NT‐proBNP were significantly higher in possible TRALI cases compared to TACO cases (p‐value = 0.03 and 0.04). Neither differences in (delta) nor ratios of post‐ and pre‐transfusion NT‐proBNP were different in cases of TACO compared to those of Possible TRALI (p=0.67 & p=0.27). However, the ratio of pre and post‐transfusion NT‐proBNP were significantly different between TACO and TRALI cases (p=0.013). Pre‐transfusion NT‐proBNP levels were higher in cases of TACO (1710 (IQR 389‐3850)) compared to that of controls (536 (IQR 190‐1,385)) in subjects without a history of congestive heart failure or kidney disease (p<0.001). NT‐proBNP levels correlated with the severity of pulmonary edema as measured by the degree of hypoxemia (PaO2/FiO2) (r=‐0.27; p<0.001) and hospital mortality (p<0.001).
Conclusion: NT‐proBNP levels were useful in differentiating cases of TACO, Possible TRALI, TRALI and TACO/TRALI. Thus, cardiac stress may be a major contributing factor to the pathogenesis of both TACO and Possible TRALI relative to that of TRALI. Furthermore, NT‐proBNP levels correlated with the severity of pulmonary edema and mortality. Prospective studies are needed to test the predictive utility of NT‐proBNP testing in identifying patients at risk for TACO prior to transfusion.
Pre‐ and post‐ Transfusion NT‐proBNP levels*
| Transfusion Category | Pre‐TX NT‐proBNP | Post‐TX NT‐proBNP |
|---|---|---|
| TACO (n=160) | 3220 (1,130 – 9,310) | 4450 (1,540 – 13,300) |
| Possible TRALI (n=51) | 6,840 (1,320 – 27,100) | 8180 (2,515 – 29,950) |
| TRALI (n=12) | 1,445 (498 – 6,750) | 3065 (732 ‐9,445) |
| TACO/TRALI (n=7) | 1,070 (885 – 2,590) | 1690 (893 – 2,510) |
| Control (n=335) | 776 (234 – 2,680) | 992 (336 ‐3,070) |
*Reported as median (Interquartile range) in pg/mL
TS31
Transfusion‐Related Anaphylaxis Among the Inpatient U.S. Elderly Medicare Beneficiaries, during 2012‐2017
Mikhail Menis*1, Richard Forshee1, Barbee I. Whitaker1, Bo Kim2, Sumit Verma2, Yunru Phua2, Anji Yi2, Rob Warnock2, Zebulin Kessler2, Stephen McKean2, Hector Izurieta1, Jeffrey A. Kelman3 and Steven Anderson1
1FDA/CBER, 2Acumen LLC, 3CMS
Background/Case Studies: Transfusion‐related anaphylaxis (TRA) is a serious acute transfusion complication that can occur within minutes following transfusion and result in pruritus, urticaria, dyspnea, hypotension, shock, and death. The study objective was to assess TRA occurrence and potential risk factors among the inpatient US elderly, ages 65 and older, during 2012‐2017 study period.
Study Design/Method: This retrospective claims‐based study utilized large Medicare databases for January 1, 2012‐April 30, 2017 in coordination with the Centers for Medicare & Medicaid Services. Transfusions were identified by recorded procedure and revenue center codes, and TRA was ascertained via the diagnosis codes. Our study evaluated TRA rates (per 100,000 inpatient transfusion stays) among the elderly, overall and by calendar year, age, gender, race, number of units and blood components transfused. Fisher's exact tests were performed to compare TRA rates, and Cochran‐Armitage tests were used to ascertain TRA occurrence trends by calendar year, age, and transfusion volume.
Results/Finding: Among 10,073,077 inpatient transfusion stays for elderly beneficiaries during 2012‐2017, 711 had a TRA diagnosis code recorded, an overall rate of 7.1 per 100,000 stays. TRA rates (per 100,000) varied by calendar year, blood components and number of units transfused as well as by age, sex, and race. Annual TRA rates were 8.1 in 2012, 8.2 in 2013, 6.7 in 2014, 6.4 in 2015, 5.9 in 2016, and 5.1 in 2017 (p<0.001). TRA rates by blood component groups were: 2.8 for RBCs only, 33.1 for plasma only, 32.9 for platelets only, 38.8 for platelets and plasma, 17.6 for RBCs and plasma, 30.9 for RBCs and platelets, and 28.1 for RBCs, plasma and platelets. TRA rates for ages 65‐69, 70‐74, 75‐79, 80‐84, 85 and over were 9.0, 8.8, 7.4, 6.3, and 4.2, respectively (p<0.001). Females and males had TRA rates of 5.4 and 9.1 (<0.001), respectively; whites and non‐whites had TRA rates of 7.7 and 4.4 (<0.001), respectively. TRA rates by number of units transfused were: 6.0 for 1 unit, 4.8 for 2‐4 units, 11.0 for 5‐9 units, and 21.4 for > 9 units (p<0.001).
Conclusion: Our population‐based study is the largest‐to‐date among U.S elderly and suggests a decline in TRA occurrence over time. The findings show substantially higher TRA rates with plasma and/or platelet transfusions as compared to RBCs only. The study also identified a significantly increased TRA rates with greater number of units transfused and a reduced TRA risk with advancing age. Our investigation suggests increased TRA risk in males versus females and in whites versus non‐whites, which needs further investigation. Study was based on claims data, and thus limitations include potential under‐ or mis‐recording of transfusion procedures, units, and diagnosis codes, as well as lack of clinical details to validate recorded TRA.
TS32
Post‐Transfusion Purpura (PTP) Among the U.S. Elderly Medicare Beneficiaries, As Recorded during 2011‐2017
Mikhail Menis*1, Richard Forshee1, Barbee I. Whitaker1, Bo Kim2, Sumit Verma2, Yunru Phua2, Anji Yi2, Zebulin Kessler2, Rob Warnock2, Stephen McKean2, Hector Izurieta1, Jeffrey A. Kelman3 and Steven Anderson1
1FDA/CBER, 2Acumen LLC, 3CMS
Background/Case Studies: Post‐Transfusion Purpura (PTP) is a serious immune‐mediated transfusion complication resulting in thrombocytopenia with mucous membrane hemorrhage, epistaxis, gastrointestinal and urinary tract bleeding. PTP may cause substantial morbidity, prolongation of hospitalization and death. The study objective was to assess PTP occurrence and potential risk factors among inpatient elderly Medicare beneficiaries, ages 65 and older, during 2011‐2017.
Study Design/Method: This retrospective claims‐based study utilized large Medicare databases from January 1, 2011 through April 30, 2017 in coordination with Centers for Medicare & Medicaid Services. Blood transfusions were identified by recorded procedure and revenue center codes, and PTP was ascertained via the diagnosis codes. Our study evaluated PTP rates (per 100,000 inpatient transfusion stays) among elderly Medicare beneficiaries, overall and by calendar year, age, sex, race, number of units and blood components transfused. Fisher's exact tests were performed to compare PTP rates, and Cochran‐Armitage tests were used to ascertain PTP occurrence trends by calendar year, age and number of units transfused.
Results/Finding: Among 12,344,025 inpatient transfusion stays for elderly beneficiaries during 2011‐2017, 247 had a PTP diagnosis code recorded, for an overall rate of 2.0 per 100,000 stays. PTP rates (per 100,000) varied by calendar year, age, blood components and number of units transfused. Annual PTP rates were 1.9 in 2011, 1.6 in 2012, 1.4 in 2013, 1.4 in 2014, 2.5 in 2015, 3.2 in 2016, and 3.2 in 2017 (p<0.001). PTP rates by blood component groups were: 1.3 for RBCs only, 2.8 for plasma only, 10.4 for platelets only, 6.5 for platelets and plasma, 2.6 for RBCs and plasma, 15.4 for RBCs and platelets, and 12.8 for RBCs, plasma and platelets. PTP rates for age categories 65‐69, 70‐74, 75‐79, 80‐84, 85 and over were 2.9, 2.5, 1.6, 1.8, and 1.3, respectively (p<0.001). PTP rates by number of units transfused were: 1.3 for 1 unit, 1.1 for 2‐4 units, 3.7 for 5‐9 units, and 7.7 for > 9 units (p<0.001).
Conclusion: Our population‐based study is the largest‐to‐date and shows a significantly increasing PTP risk over time and with greater number of units transfused. The study also identified a substantially higher PTP rates with platelet transfusions, either alone or in combination with RBCs and/or plasma. Our investigation suggests decline in PTP risk with advancing age and no risk difference by race and gender, which need further investigation. The study was based on claims data and thus limitations include potential under‐ or mis‐recording of diagnosis code, transfusion procedures, and units transfused, as well as lack of clinical details to validate the recorded PTP diagnosis.
TS33
A Retrospective Evaluation of the Hemostatic Efficacy of Pathogen Reduced (PR) vs Conventional (CONV) Platelets at an Academic Medical Center
Eric Gehrie*1,2, Wade L. Schulz2, H. Patrick Young2, Amit Gokhale2, Burak Bahar2, Bryan R. Spencer2,3, Rebecca Ross4 and Edward L. Snyder2
1Johns Hopkins Medical Institutions, 2Yale University, 3American Red Cross, 4Yale‐New Haven Hospital
Background/Case Studies: In patients with thrombocytopenia, platelet transfusion is the standard of care to prevent or treat bleeding. To mitigate the risk of transfusion‐transmitted infections, we transitioned our platelet inventory from CONV platelets to FDA‐approved, psoralen‐treated PR platelets. From December 2016 to March 2018, we maintained a dual inventory due to supply constraints from our blood supplier. Both PR platelets and CONV platelets analyzed with a bacterial detection assay were considered standard of care and were dispensed as available per blood bank policy. While FDA‐approved in 2014, some concerns have remained related to the hemostatic efficacy of these products, since post‐transfusion platelet recovery has been shown by some to be lower than that seen with CONV platelets. To assess the use and efficacy of these products, we analyzed platelet and red cell utilization over the 16‐month transition period.
Study Design/Method: For all transfused adults age 18 years and older, we assessed platelet use for those who received only PR or CONV platelets. As an indicator of hemostatic efficacy, we also assessed red blood cell (RBC) utilization by these patients in the 24‐hour period following any platelet transfusion. Numbers shown are mean±1SD and significance was p<0.05.
Results/Finding: Over this period, 2,388 transfusions were given to 1,550 adult patients who received only PR or CONV platelets. Of these, 949 patients received 1,429 transfusions of CONV platelets (1.5 ± 1.2 transfusions/patient). In addition, 601 patients received 959 PR platelet transfusions (1.6 ± 1.8 transfusions/patient), which was similar to the CONV group (p=0.28). In patients who received only CONV platelets during the study interval, 600 also received RBCs with an average of 6.5 RBC transfusions/patient. Similarly, for those who received only PR platelets, 351 received RBCs, with an average of 5.6 RBC transfusions/patient. We also assessed RBC utilization in the first 24 hours after platelet transfusion, as a proxy for hemostatic efficacy. We again found that RBC utilization was similar, with an average of 2.3 RBC units/patient within 24 hours of receipt of a platelet transfusion in those receiving only CONV platelets, and an average of 2.6 RBC units/patient in those receiving only PR platelets (p=0.43).
Conclusion: During our 16‐month period of dual inventory, we determined that platelet usage patterns were similar in patients receiving only CONV or only PR platelet products. While not a direct measure of product efficacy, the additional evidence showing similar RBC utilization patterns in these groups suggests that the hemostatic efficacy of PR platelets is comparable to that of CONV platelet products.
TS34
Gender Differences Unmasked by Suboptimal Interval between Perioperative Autologous Blood Donation and Surgery
Sara Bakhtary*, Elena Nedelcu and Solmaz Manuel
UCSF Health
Background/Case Studies: Preoperative autologous blood donation (PABD) has been declining in use and may be considered in patients who are undergoing elective surgery with significant blood loss if the likelihood of transfusion exceeds 10%. However, PABD rarely has clear indications and is known to increase the risk of perioperative anemia. Compensatory erythropoiesis requires at least three weeks and has not being associated with gender. Here we report perioperative anemia data and gender differences in compensatory erythropoiesis and transfusion associated with the PABD program at our institution.
Study Design/Method: This is a retrospective study of the PABD program at our institution over a two‐year period (January 1, 2016 to December 31, 2017). The following data were collected from the patient medical records: patient characteristics, hemoglobin values, dates of autologous blood donation, and transfusion of any blood products. Hemoglobin decrease for females and males were calculated and compared. Statistical analysis was performed using STATA 13.1 (StataCorp LP Texas, USA).
Results/Finding: 118 patients underwent PABD and donated a total of 141 autologous RBC units. 51% were females and the mean age was 45.3 (range 12‐79). 83% donated one unit, whereas the rest donated 2‐5 units. Review by a transfusion medicine physician showed that none of these autologous units were indicated. The mean number of days between PABD and date of surgery was 18.9 days. The baseline hemoglobin (Hgb) prior to autologous blood donation for all patients was 13.9 ± 1.5 g/dL, 13.1 ± 1.2 g/dL for females and 14.8 ± g/dL for males (p<0.05). Hgb levels measured after autologous donation but prior to surgery were 12.5 ± 1.4 g/dL; 11.7 ± 1.2 g/dL for females and 13.5 ± 1.1 g/dL for males (p<0.05). The mean Hgb decrease after donation was 1.3 ± 0.9 g/dL; 1.3 ± 0.9 g/dL for females and 1.2 g/dL ± 0.8 g/dL, (p=0.76). More female patients (42%) received the autologous transfusion as compared to male patients (32%), but the difference did not reach statistical significance (p=0.39). 95 units (67%) were wasted from 79 patients. Of the patients who were transfused autologous units, 6 patients received allogeneic blood products in addition to autologous units, and 80% of patients had post‐operative Hgb>10 g/dL.
Conclusion: The indications for PABD were not clear. In contrast with male, female patients became anemic and did not show compensatory erythropoiesis at the 19‐day interval between donation and surgery. Additionally, more female patients were transfused compared to males. Although these differences did not reach statistical significance, they may reflect gender‐associated physiological differences. Transfusion of autologous units was also not justified by patient post‐operative Hgb values in a major patient subset.
TS35
Collaborative Implementation of a Massive Transfusion Protocol at a Level One Trauma Center
Matthew Bank*1, Nancy Nikolis1, Shailesh Macwan1, Arline Stein1, Lennart Logdberg1, Maria Sfakianos1, Alexander Indrikovs2, Vishesh Chhibber1 and Sherry Shariatmadar1
1North Shore University Hospital, 2Northwell Health
Background/Case Studies: The American College of Surgeons (ACS) defines the resources needed to provide optimal care of injured patients. The ACS's Trauma Quality Improvement Program (TQIP) introduced massive transfusion protocol (MTP) guidelines in 2014 and all Level One Trauma Centers were required to have a MTP program by 2015. We received initial ACS verification of our trauma center in September 2014 with successful re‐verification in 2017. Here we summarize the necessary blood bank (BB) resources implemented to ensure successful ACS verification/re‐verification of our trauma center.
Study Design/Method: Beginning 2 years before our initial verification visit, the Division of Trauma and the BB collaborated to meet the MTP requirements.
A minimum of 10 O negative/10 O positive PRBCs, 8 AB/A thawed plasma and 2 platelets made available at all times.
-
A complete review/update of MTP written policy that established:
-
Time standards for delivery of blood products.
15 minutes (min) for 1st MTP pack (4units PRBCs/ 4units Plasma/ 1unit Platelet).
PRBC/Plasma/Platelet transfusion ratio best practices.
-
A MTP flow chart placed in all operating rooms.
An on‐line presentation created for MTP re‐education as part of the Trauma Center's internal educational process. All Emergency Medicine, Neurosurgery, Orthopedic and Trauma surgeons required to review presentation.
An MTP worksheet designed for BB personnel to document all communications and time of issue for each MTP pack with retrospective monitoring of performance by Transfusion Safety Officer.
-
An electronic database for all MTPS created in 2014 and a MTP Performance Improvement Committee formed collaboratively between the BB and Division of Trauma.
Meetings held monthly to assess performance indicators, outcome analysis and necessary changes to the process.
Results/Finding: The number of MTPs, average turnaround Time (TAT), % compliance with 15 min. TAT, average number of units of PRBCs, plasma, platelets and average PRBC:Plasma Ratio through the years is illustrated below.
(TS35)
| Year | # of MTP | Average TAT for MTP | % Compliance with 15 min. TAT | Average PRBCs units | Average Plasma units | Average PRBC:Plasma Ratio | Average Platelet units |
|---|---|---|---|---|---|---|---|
| 2014 | 96 | 4 minutes | 99% | 5.3 | 3.9 | 1.36 | 1.88 |
| 2015 | 113 | 5 minutes | 100% | 6.4 | 4.5 | 1.42 | 1.22 |
| 2016 | 127 | 6 minutes | 100% | 4 | 2.9 | 1.38 | 0.94 |
| 2017 | 136 | 6 minutes | 100% | 6.2 | 5 | 1.24 | 1.41 |
All MTPs have a quality audit which includes review of MTP worksheet and video of trauma team activations. An average TAT of 4 to 6 min. was demonstrated for delivery of first MTP pack. Evaluation of our process has indicated that a minimum of 3 staff is required to ensure uninterrupted MTP service. Frequency of perceived TAT issues, lack of appropriate notification, order confusion and wastage have remained minimal.
Conclusion: An MTP process and quality review system collaboratively created by the BB and Division of Trauma has been robust at our center ensuring prospectively agreed upon standards. A high level of compliance with a 15 min. TAT for the 1st MTP pack and a low PRBC:Plasma ratio is attainable. Close collaboration between the BB and the Division of Trauma is imperative in successful planning, implementation and ongoing review of an MTP process.
TS36
Administering Platelets through a Fluid Warmer or Rapid Blood Infusion System Does Not Impair Their Function
Aaron S. Hess*1, Jagan Ramamoorthy1, Joseph Connor2, Thomas Raife2 and John R. Hess3
1Department of Anesthesiology, University of Wisconsin Hospital and Clinics, 2Department of Pathology and Laboratory Medicine, University of Wisconsin Hospital and Clinics, 3Department of Laboratory Medicine, University of Washington
Background/Case Studies: Early and balanced administration of platelets is beneficial for the bleeding patient. Rapid infusion systems and fluid warmers are commonly used during perioperative and massive transfusion in order to keep pace with bleeding and prevent hypothermia. In the United States these devices are not approved for platelet administration due to lack of data, and many physicians are reluctant to use them. Avoiding these devices can lead to delayed and reduced platelet transfusion, which is associated with mortality in bleeding patients. We sought to determine the effect of a clinical rapid infusion system and fluid warmer on the in‐vitro function of stored apheresis platelets.
Study Design/Method: This study was approved by the University of Wisconsin Institutional Review Board. Units of apheresis platelets less than 48 hours past clinical expiry date were supplied by the hospital blood bank. After mixing, a 2‐mL sample was sterilely obtained from each unit. The remaining volume was then run through a commercially available rapid infuser system (The Belmont Rapid Infuser RI‐2, Belmont Instrument Corporation, Billerica, MA) at a rate of 500 mL/min while warmed. After the entire unit was infused, a second 2‐mL sample was drawn from the most proximal port on the outflow line. A platelet count and maximum amplitude by thromboelastogram (TEG™, Haemonetics, Braintree, MA) was measured from each sample. We estimated that testing 10 units would give us greater than 99% power to detect a difference in pre‐ and post‐infusion TEG™‐MA of 10 mm using the paired t‐test, with a p‐value < 0.05 considered significant. The study was repeated with a parallel sampling protocol using 15‐mL platelet aliquots incubated for 5 and 20 minutes in a fluid warmer (Ranger®, 3M Corp, Minneapolis, MN).
Results/Finding: All units reached the goal infusion rate of 500 mL/min. No infuser or circuit malfunctions or clotting were observed. Average post‐infusion temperature was 37.4°C (range 36.1 – 39.0). There was no statistically significant change in post‐infusion TEG™‐MA was (mean 0.1 mm, 95% CI ‐2.7 ‐ 2.8, p = 0.973). The minimum and maximum differences in post‐pre TEG™‐MA were ‐6.7 and 7.9 mm, respectively. There was a statistically significant increase in post‐infusion platelet count (mean 27 × 103 cells/mm3 95% CI 4 ‐ 49, p = 0.047) equivalent to a 3% change from baseline platelet count. Similar results were seen with the fluid warmer (Table 1).
Conclusion: In a well‐powered study, we were unable to detect any significant effect of high‐speed rapid infusion or warming on the in‐vitro function of stored apheresis platelets. There was a statistically significant increase in post‐infusion platelet count, probably the result of disaggregation of small platelet aggregates leading to higher numbers in automated cell counters. These results strongly suggest that rapid infusion and warming of apheresis platelets is safe.
TABLE 1 (TS36) Comparison of the change in mean TEG™‐MA and platelet count for units of apheresis platelets passed through a rapid infuser or fluid warmer
| n | Mean* | 95% CI Lower | 95% CI Upper | p† | ||
|---|---|---|---|---|---|---|
| Rapid | TEG™‐MA (mm) | 10 | 0.1 | ‐2.7 | 2.8 | 0.973 |
| Infuser | Platelet count (% change) | 10 | 3 | 1 | 5 | 0.047 |
| Fluid | TEG™‐MA (mm) | 10 | 1.7 | ‐1.9 | 5.2 | 0.38 |
| Warmer | Platelet count (% change) | 10 | 2 | ‐1 | 2 | 0.194 |
*Values greater than zero indicate an increase in post‐device versus pre‐device result.
†Paired t‐test.
TS37
Comparison between Two Protocols for Platelet Transfusion in Patients Undergoing ABO Incompatible Hematopoietic Stem Cell Transplantation
Nelly Carpio*, Javier Marco, Albert Blanco, Alvaro Diaz, Inés Gómez, Pilar Solves, Jaime Sanz, Guillermo Sanz and Miguel Sanz
Hospital Universitari i Politecnic La Fe
Background/Case Studies: Platelet (PLT) transfusions are an essential part of the supportive care of patients undergoing hematopoietic stem cell transplantation (HSCT), for prophylactic or therapeutic reasons. There are no evidence based guidelines for platelet product selection in the setting of ABO incompatible HSCT. Isoagglutinins of donor origin, (anti‐A and anti‐B antibodies) may target engrafting erythroid precursors, while those of recipient type bind to the transfused platelets decreasing the post transfusion counts. Available guidelines recommend transfusing donor and recipient plasma compatible platelets. However, when platelets are suspended in additive solution, and due to the lower plasma content, respecting cell ABO compatibility seems to be a reasonable approach in order to optimize post transfusion platelet counts. Our objective was to compare two different strategies for platelet selection in ABO incompatible HSCT.
Study Design/Method: We reviewed data from two different platelet transfusion protocols used in patients undergoing ABO incompatible HSCT in our hospital: protocol A in which the platelet transfused were plasma compatible with donor and recipient (ABO donor group in major incompatibility and ABO recipient group in minor incompatibility), and protocol B in which the platelet transfused were of the same ABO group than red blood cells concentrates (ABO recipient group for major incompatibility and ABO donor group for minor incompatibility). These protocols were followed when specific ABO platelets were available. Packed RBCs (RBCC) were transfused if the hemoglobin level of patients was 80 g/dL and prophylactic pooled PLTs were transfused at PLT counts 20 × 109/L. PLT transfusion independence was defined as the last PLT transfusion, with no PLT transfusions in the following 7 days. RBC transfusion independence was defined as the last transfusion, with no RBC transfusion in the following 30 days. We recorded transfusion requirements at 30 days after HSCT. SPSS software (v 15.0) was used to perform statistical analyses.
Results/Finding: We reviewed data from 90 umbilical cord blood transplantations (UCBT) and 61 peripheral blood stem cell transplantations (PBSCT), 61 women and 90 men, median age 41 years (range 15‐65). Myeloablative conditioning regimen was used in all cases. The results are showed in the table below and are expressed as median and range.
(TS37)
| Protocol A (2000‐2013) | Protocol B (2014‐2017) | P | |
|---|---|---|---|
| UCBT | n=75 | n=15 | |
| RBCC29 | 10 (0‐32) | 9 (2‐44) | 0.595 |
| PC*29 | 21 (7‐38) | 16 (7‐70) | 0.134 |
| RBCC TI*** Days | n=46 41 (0‐189) | n=10 22.5 (10‐76) | 0.571 0.221 |
| PC TI Days | n=49 35 (20‐170) | n=11 34 (19‐61) | 0.502 0.485 |
| Graft failure | 4 | 1 | 0.819 |
| PBSCT | n=34 | n=27 | |
| RBCC | 2 (0‐44) | 3.5 (0‐25) | 0.566 |
| PC | 3 (0‐97) | 3 (0‐74) | 0.892 |
| RBCC TI Days | n=30 10.5 (0‐108) | n=24 12 (0‐415) | 0.630 0.283 |
| PC TI Days | n=31 11 (0‐74) | n=24 11 (7‐378) | 0.547 0.278 |
| Graft failure | 1 | 2 | 0.343 |
*RBCC: red blood cell concentrates. **PC: platelet concentrates. ***TI: transfusion independence
Conclusion: There were not statistical differences between two different platelet transfusion protocols (ABO plasma versus ABO cell compatible) in patients undergoing ABO incompatible hematopoietic stem cell transplantation.
TS38
Red Blood Cell Storage Does Not Impact Disease‐Free Survival after Surgery for Epithelial Ovarian Cancer: A Propensity Score Analysis
Oliver Hunsicker*1, Sara Gericke1, Alexander Krannich2, Oliver Meyer3, Jan Adriaan Graw1, Ioana Braicu4, Claudia Spies1, Jalid Sehouli4, Axel Pruß3 and Aarne Feldheiser1
1Department of Anesthesiology and Operative Intensive Care Medicine (CCM, CVK), Charité ‐ Universitätsmedizin Berlin, 2Experimental and Clinical Research Center, Charité ‐ Universitätsmedizin Berlin and Max Delbrueck Center for Molecular Medicine in the Helmholtz Association, 3Institute of Transfusion Medicine, Charité ‐ Universitätsmedizin Berlin, 4Department of Gynecology, European Competence Center for Ovarian Cancer, Charité ‐ Universitätsmedizin Berlin, Campus Virchow‐Klinikum
Background/Case Studies: During blood bank storage, packed red blood cells (PRBC) undergo alterations of cell metabolism, increased oxidative stress, and membrane damage that amount in a significant number of biochemical and structural alterations. These storage lesions are supposed to affect safety of senescent PRBCs, but it is still debated whether transfusion of senescent PRBCs increases risk for recurrent disease after surgery for cancer.
Study Design/Method: Patients were identified from the prospectively maintained Tumor Bank Ovarian Cancer database. Patients were eligible if they underwent surgical tumor debulking due to primary ovarian cancer between 2006 and 2014, had complete cytoreduction after surgery, received transfusion of allogeneic PRBCs during hospital stay, and had PRBC storage data available. According to their oldest unit of PRBCs transfused, patients were assigned to 4 PRBC storage groups: ≤ 21, 22 to 28, 29 to 35, and long‐term storage > 35 days. The primary endpoint was disease‐free survival (DFS). Propensity score matching (PSM) was used to remove the effect of confounders on outcome. An ethical approval was obtained from the ethical committee (Charité ‐ Universitätsmedizin Berlin, No. EA4/128/17).
Results/Finding: A total of 408 patients with a median follow‐up of 47.1 months (95% confidence interval [CI], 43.2‐58.9) were eligible for analysis. There was an inhomogeneity in patients’ characteristics including cancer stage, surgical complexity and transfusion requirements between the 4 PRBC storage groups. In unadjusted analysis, patients transfused with PRBCs stored for 22 to 28, 29 to 35, as well as >35 days were not at higher risk for cancer recurrence or death compared to patients transfused with PRBCs stored for ≤21 days (hazard ratio of DFS 0.95 [95% CI, 0.65–1.38], P = 0.77; HR 0.73 [0.5‐1.07], P = 0.11; and HR 1.19 [0.84‐1.72], P = 0.32). In PSM adjusted analysis, patients’ characteristics were well balanced and it was confirmed that PRBC storage did not affect disease‐free survival after ovarian cancer surgery.
Conclusion: Transfusion of senescent PRBCs and even long‐term stored PRCBs > 35 days is not related to worse oncological outcomes in patients without macroscopic tumor residuals after ovarian cancer surgery who received perioperative RBCT during hospitalization.
TS39
Hemovigilance in Massachusetts: A Three‐Year Data Summary
Anthony Osinski* and Melissa Cumming
Massachusetts Department of Public Health
Background/Case Studies: The Massachusetts Department of Public Health (MDPH) is the first state health department to require reporting of blood products transfused and adverse reactions (ARs) following transfusion via the National Healthcare Safety Network Hemovigilance Module (HM). Here we demonstrate the feasibility of measuring blood bank activity in this way and summarize three years of data.
Study Design/Method: Blood banks in MA reported transfusion, AR, and facility data according to the HM surveillance protocol. Analytic datasets for each data type were extracted and analyzed with SAS 9.3. Complete reporting months from 2015 to 2017, defined as months for which a facility reported both transfusion data and the presence or absence of ARs, were included in analysis. ARs failing to meet imputability or case criteria requirements, and other, unknown, or non‐severe allergic ARs were excluded. AR rates were the number of ARs attributable to a particular group of products divided by the number transfused in that group. Facilities were categorized into three bed size groups according to the number of total beds licensed.
Results/Finding: In total, 2,503 reporting months from 70 facilities were analyzed. Over the three‐year period, 1,099,347 blood products were transfused. Annual transfusion volume decreased each year from 372,990 products in 2015 to 356,589 products in 2017. Discarded products totaled 81,351, also decreasing each year. A total of 1,722 ARs were reported of ten defined types. ARs increased each year from 501 in 2015 to 657 in 2017. AR rates by product type for the period were: 17.4 ARs per 10,000 RBC units transfused, 21.4 ARs per 10,000 platelet units transfused, and 5.2 ARs per 10,000 plasma units transfused. The platelet AR rate increased an average of 1 AR per 10,000 platelet units transfused per quarter. AR rates by facility ranged from 0 to 152 per 10,000 total products transfused.
Conclusion: The decrease in transfusion is consistent with trends reported elsewhere. The increase in ARs may be due to increasing incidence and increasing user familiarity with the HM. Within bed size groups, facilities with outlying AR rates are clear. Limitations include lack of data validation, and possible inconsistent case definition interpretation and application. This could lead to under‐ or over‐reporting of ARs. MDPH has collaborated with the CDC to improve the HM, including clarifying reporting of discarded products and testing automated case definitions. These analyses allow for the detection of trends in usage and AR incidence, providing actionable data. Future work will assess the impact of surveillance, and attempt to detect anomalous rates associated with specific products. Wider use of the HM will allow for more representative surveillance, and ultimately safer transfusion medicine practices.
TS40
Ten Years with National Hemovigilance System in Finland – Time to Focus on What Matters!
Johanna Wiksten*, Susanne Ekblom‐Kullberg and Susanna Sainio
Finnish Red Cross Blood Service
Background/Case Studies: The Finnish Red Cross Blood Service (FRC BS) is responsible for supplying blood products in Finland, a country with a population of 5.5 million. As of 2007, in accordance with the EU blood directive, serious adverse reactions (ARs) and events (AEs) that may affect the quality and safety of blood components must be immediately reported to the Blood Safety Office of FRC BS. Mild adverse reactions, incorrect blood components transfused (IBCTs), and near miss events are reported annually.
Study Design/Method: All AEs reported in 2008–2017 were analyzed and classified as adverse reactions (ARs), IBCTs, or near miss events according to ISBT standard definitions.
Results/Finding: The total number of blood components (NAT screened, leukodepleted) and plasma (S/D treated pooled plasma, OctaplasLG®) distributed from FRCBS to hospitals was 3 051 622 products, with a steady decline of 24% in use seen from 2008 to 2017. A total of 2480 ARs and 214 IBCTs (of which 20% ABO incompatible) were reported, the number remaining steady over the study period. The incidence of all ARs was 93.3 per 100 000 components issued, and the rate of serious ARs was 6.4 per 100 000. Of the 196 severe ARs, 38% were related to allergy/anaphylaxis, 21% to hemolytic transfusion reactions (AHTR or DHTR), 14% to transfusion‐associated circulatory overload (TACO), 8% to transfusion‐associated acute lung injury (TRALI), and 8% to transfusion associated dyspnea (TAD). Transfusion‐associated infections were extremely rare, with bacterial infection confirmed only in 4 cases (0.1 per 100 000). There were no reports on transmission of HIV, HBV, or HCV from transfusions performed in 2008‐2017. Of the reported 9 deaths (0.29 per 100 000), five were related to AHTR (including two ABO incompatible IBCTs), two to TRALI, and one case each to bacterial infection and TACO.
Conclusion: During the study period, despite a significant decline in the use of blood products, the number of reported AEs remained steady, reflecting increased knowledge of hemovigilance. Despite the high quality of blood products, serious adverse events do occur and human errors account for many of them. For example, for most cases of severe dyspnea, especially TACO the doctors are unable to recognize the cause or possibility for prevention. Likewise, we have yet to see any improvement in the number of AHTRs resulting from blood components intended for another person, reflecting serious deviations from SOPs for patient identification. In the future, we need to focus on improving unsafe practices throughout the entire blood chain, especially the bed side procedures. Checklists to ensure patient identification and risk assessment for TACO, or the revised reporting criteria by the joint AABB‐ISBT‐IHN TACO task force will be very welcome.
TS41
High RBC Alloimmunization Rates in Hereditary Hemorrhagic Telangiectasia: Can We Do Better?
Jay S. Raval*, Yara A. Park, Marian A. Rollins‐Raval, Grace Lee, Rance C. Siniard, Stefanie G. Finch, Karen L. Smith and Raj S. Kasthuri
University of North Carolina
Background/Case Studies: Hereditary hemorrhagic telangiectasia (HHT) is a rare autosomal dominant disorder resulting in the formation of abnormal blood vessels. These patients develop recurrent, spontaneous mucocutaneous bleeding and may require RBC transfusion. It has been previously suggested that HHT patients have an increased risk of RBC alloimmunization, with 15.3% of transfused individuals developing an RBC alloantibody, and thus may benefit from a RBC antigen matching policy (Zheng Y et al, 2018). As we do not currently provide extended antigen matched RBCs for our HHT patients, we sought to characterize RBC alloimmunization in these individuals.
Study Design/Method: A prospectively maintained HHT patient registry at our institution was queried for performance of type and screen, RBC transfusion (including number of units), and RBC alloantibody formation. Findings were compared against previously collected data on RBC alloimmunization after simple transfusion in sickle cell disease (SCD), a condition that necessitates extended RBC antigen matching with Rh/Kell compatible units at our institution.
Results/Finding: Of 467 HHT patients, 34 (7.3%) had been transfused with RBCs, and 7 of these 34 (20.6%) had RBC alloantibodies. Five of these patients had anti‐E, one had anti‐K, and one had anti‐V. All patients had only one RBC alloantibody each, and all patients had been transfused with ≥5 RBC units (median 14, range 5‐28). Compared to those 7 who developed an RBC alloantibody, the 27 HHT patients that did not develop alloantibodies were transfused with significantly fewer RBC units (median 4, range 1‐18; p<0.01). There was no association between alloimmunization and ABO group. RBC alloimmunization in our HHT patients was markedly greater compared to the 11% of our SCD patients that developed an RBC alloantibody after simple transfusion (Desai PC et al, 2015). It was interesting that only 105 of our HHT patients (22.5%) had a type and screen performed.
Conclusion: The rate of alloimmunization in transfused HHT patients is high at our institution and greater than that of transfused SCD patients. HHT patients transfused with many RBC units at our institution appear to have a high rate of RBC alloimmunization compared to those HHT patients receiving fewer units. It is unclear what patient or transfusion factors predispose certain HHT individuals to develop an RBC alloantibody. As this is a condition that may result in bleeding requiring RBC transfusion, we recommend that a type and screen be performed on all HHT patients, particularly since 2 valid assessments are now recommended prior to the issue of type‐specific blood components. Given the rarity of HHT, multicenter studies are needed to determine whether an antigen matching strategy is appropriate for all or a subset of these patients.
TS42
Granulocyte Transfusion in Medical Management of Neutropenic Acute Appendicitis
Colin H. Murphy*, Jenna Khan and Monica B. Pagano
Division of Transfusion Medicine, University of Washington
Background/Case Studies: Appendicitis is a common cause of acute abdominal pain and is typically managed with either antibiotics alone or in combination with surgical intervention. Hematologic malignancy and its treatments cause pancytopenia which increases the risk of surgery and post‐surgical complications. Neutropenic patients, however, may not have sufficient immune response to clear a localized infection even with appropriate antibiotics. Granulocyte transfusions have previously been evaluated in the treatment of neutropenic patients with refractory bacterial or fungal infections but have not been extensively reported for the medical management of acute appendicitis.
Study Design/Method: This is a case series of 3 adult patients with hematologic malignancy undergoing chemotherapy who developed acute appendicitis and were managed medically with antibiotics and granulocyte transfusions. Granulocytes were obtained via granulocyte colony‐stimulating factor and dexamethasone stimulation of volunteer donors for apheresis with hydroxyethyl starch for a goal dose of 4.0 × 10⁹ granulocytes per transfusion. Absolute neutrophil count was determined prior to and within 2.5 hours after administration of granulocytes. Vital signs and oxygen saturations were measured before, during, and after each transfusion.
Results/Finding: At the time of granulocyte infusion, all 3 patients were initially severely neutropenic with undetectable neutrophil counts and were deemed not to be surgical candidates. Granulocyte transfusions were generally well tolerated, with one patient having two reported episodes of fevers and chills. Patients received between 3‐4 granulocyte transfusions over a range of 6‐9 days until there was evidence of clinical or radiologic improvement. All 3 patients showed immediate increases in their measured absolute neutrophil counts; these increases were highly variable, with a mean increase of 1.35 but ranging from 0 to 4 thousand neutrophils per microliter (Table One). On days following granulocyte transfusions patients frequently developed either fever or increased abdominal pain, likely related to increased appendiceal inflammation in response to the granulocytes. Imaging studies in all 3 cases gradually improved, showing resolution of inflammatory findings and reduction in appendiceal distention.
Conclusion: Three adult neutropenic patients with hematologic malignancy and radiologically confirmed acute appendicitis were managed with granulocyte transfusions and antibiotics with resolution of their acute appendicitis. Further investigation is necessary to determine if granulocyte infusions provide therapeutic benefits in the treatment of localized infections in neutropenic patients.
(TS42)
| Patient | Patient ABO | Dose | Unit Type | Unit Vol (ml) | Maximum ANC (k/uL) |
|---|---|---|---|---|---|
| 1, 26 year old woman with AML post‐transplant | O positive | 1 | O Pos | 575 | 4 |
| 2 | O Pos | 162 | 2.06 | ||
| 3 | O Neg | 354 | 2.3 | ||
| 4 | O Neg | 329 | 1.62 | ||
| 2, 27 year old woman with AML with t(6;11) | A positive | 1 | A Pos | 278 | 1.4 |
| 2 | A Pos | 200 | 0.43 | ||
| 3 | A Pos | 301 | 0 | ||
| 4 | A Pos | 255 | 0.85 | ||
| 3, 69 year old man with AML from MDS | AB positive | 1 | O Pos | 301 | 0.33 |
| 2 | O Pos | 173 | 0.92 | ||
| 3 | O Pos | 117 | 1.97 |
Table One: Patient details and responses to individual granulocyte doses.
TS43
Use of Group O RhD‐Negative Red Cells in Patients with Critical Bleeding: Data from the Australian and New Zealand Massive Transfusion Registry
Rosemary Sparrow*, Helen Haysom, Mark Tacey, Zoe K. McQuilten and Erica M. Wood
Department of Epidemiology and Preventive Medicine, Monash University
Background/Case Studies: Critical bleeding (CB) resulting in massive transfusion (MT) is often unexpected. Guidelines recommend transfusion of blood group O RhD‐negative (ONeg) red blood cells (RBCs) until the patient's blood group is known. Due to the low frequency of ONeg blood group, supply may be exhausted. Limited data exist on use of ONeg RBCs in MT, particularly for patients (pts) admitted with CB compared to MT onset in‐hospital, such as during surgery. The Australian and New Zealand Massive Transfusion Registry (ANZ‐MTR) captures clinical and laboratory data on pts who received a MT (≥5 RBCs in any 4h period) for any type of CB during their hospital admission (ADM). The aims of this study were to compare 1) ONeg RBC use in pts whose MT began within 2h of ADM (Group 1) or > 2h after ADM (Group 2); 2) MT management of ONeg pts.
Study Design/Method: MT cases from 2011 to 2015 that had all required data were assigned to Group 1 or 2. Variables included blood groups of pts and transfused (Tx’d) RBCs, number of Tx’d RBCs, RBC issue‐time relative to MT onset, patient demographics and CB context data. All RBCs Tx’d 24h before MT and 48h post MT were included.
Results/Finding: Data for 5,444 MT cases from 24 hospitals were available (1359 Group 1; 4085 Group 2) (Table). MT due to nonsurgical CB (i.e. trauma, gastrointestinal hemorrhage) occurred in 69% Group 1 and 36% Group 2 (p<0.001). Group 1 pts were Tx’d significantly more RBCs than Group 2 pts; median [interquartile, IQR]: 7 [6, 11] vs 6 [5, 8] respectively (p<0.001). Of all RBCs Tx’d, 25.5% were ONeg for Group 1 and 8.6% for Group 2 (p<0.001).
A higher proportion of ONeg pts in Group 2 were Tx’d exclusively ONeg RBCs compared to Group 1 (76.8% vs 62.3% respectively; p<0.01). One female ONeg pt <50 yrs received OPos RBCs (Group 2). She was a surgical pt with metastatic cancer aged 48, Tx’d 7 ONeg and 8 OPos RBCs in 24h.
TABLE (TS43) Comparison of early MT (Group 1) and later MT (Group 2)
| Factor | MT start time | p value | |
|---|---|---|---|
| Group 1 | Group 2 | ||
| MT cases, n | 1359 | 4085 | |
| Nonsurgical bleeding context, n (% MT cases) | 935 (69%) | 1481 (36%) | <0.001 |
| RBCs Tx’d 4h post MT, n median [IQR] | 7 [6, 11] | 6 [5, 8] | <0.001 |
| ONeg RBCs Tx’d / All RBCs Tx’d 48h post MT start, n (%) | 4,125 / 16,192 (25.5%) | 3,759 / 43,653 (8.6%) | <0.001 |
| ONeg pts Tx’d only ONeg RBCs / All ONeg pts, n (%) | 48 / 77 (62.3%) | 182 / 237 (76.8%) | 0.01 |
| Female ONeg pts < 50 yrs Tx’d any OPos RBCs / All Female ONeg pts < 50 yrs, n (%) | 0 / 11 (0%) | 1 / 23 (4%) | ‐ |
| Non‐ONeg pts Tx’d any ONeg RBCs / Non‐ONeg pts, n (%) | 753 / 1282 (58.7%) | 709 / 3848 (18.4%) | <0.001 |
Conclusion: In this cohort from the ANZ‐MTR, 25% of all RBCs Tx’d in early MT onset (Group 1) were ONeg RBCs, compared to <9% in later MT onset (Group 2). Of 34 female ONeg pts < 50 yrs, only one was transfused OPos RBCs. Our findings suggest that transfusion laboratory inventories largely met MT requirements for ONeg RBCs.
TS44
International Assessment of Massive Transfusion Protocol Types and Activation Indications
Reggie R. Thomasson*1, James D. Gorham2, Mark H. Yazer3 and Nancy M. Dunbar1
1Dartmouth‐Hitchcock Medical Center, 2University of Virginia School of Medicine, 3Department of Pathology, University of Pittsburgh
Background/Case Studies: Evidence indicates that the use of a massive transfusion protocol (MTP) improves outcomes in patients with traumatic injury. Many institutions have adopted MTPs for use in other clinical settings, though evidence to support improved outcomes in non‐traumatic hemorrhage is lacking. The goal of this study is to describe (1) the types of MTPs available at participating institutions, and (2) the clinical indications that lead to MTP activation.
Study Design/Method: A survey was distributed to 353 transfusion medicine specialists to assess both the types and contents of available MTPs. Participants were invited to submit data indicating clinical indications for consecutive adult and pediatric MTP activations for at least six months during 2015‐2017.
Results/Finding: 154 surveys were received (44% response rate). Surveys that were incomplete or in duplicate were excluded, leaving 125 responses for analysis. Most sites (n=90, 72%) provide only one MTP for all bleeding emergencies in adult patients. Of the 31 sites that provide more than one MTP, 20 provide MTPs specific for bleeding obstetrical (OB) cases, 18 specific for trauma, and 1 specific for gastrointestinal bleeding. One site provides no MTP, and 3 sites treat only pediatric patients. Of the sites that provide OB‐specific MTPs, 50% (10 of 20) include at least one pool of cryoprecipitate in round one of their MTP, compared with 14% (13 of 90) of the sites with only one MTP (p=0.001). Thirty‐eight centers provided data on MTP indications, for a total of 2821 adult and 103 pediatric activations (Table 1). The majority of adult and pediatric activations (54% and 60%, respectively) were for non‐traumatic indications. Such indications include gastrointestinal bleeding (16%) in adults and ECMO related bleeding (17%) in the pediatric population.
Conclusion: The majority of centers use a “one‐size‐fits‐all” MTP to manage hemorrhage in multiple clinical settings. Among participating sites, the majority of indications for MTP activation were in a non‐traumatic setting, despite the lack of supportive clinical evidence in this patient population. These findings warrant the need for further studies to determine the optimal approach for massive transfusion support of non‐traumatically injured patients.
TABLE 1 Common Indications for MTP activation
| N | % | |
|---|---|---|
| ADULT (>15 yrs) | 2821 | 100% |
| Trauma | 1291 | 46% |
| Gastrointestinal Bleeding in Non‐Cirrhotic | 257 | 9% |
| Gastrointestinal Bleeding in Decompensated Cirrhotic | 204 | 7% |
| Obstetric Bleeding | 200 | 7% |
| Other Surgical Bleeding | 172 | 6% |
| All Other Categories | 697 | 25% |
| PEDIATRIC (</=15 yrs) | 103 | 100% |
| Trauma | 41 | 40% |
| ECMO related bleeding | 18 | 17% |
| Non‐surgical complications of neonatal patient | 12 | 11% |
| Other Surgical Bleeding | 11 | 11% |
| Non‐surgical complications of pediatric patient | 10 | 10% |
| All Other Categories | 11 | 11% |
TS45
Analysis of P50 and Oxygen Transport in Cancer Patients after Blood Transfusion
Christine Cahill*1, Alexa Turgeman1, Alan D. Gray2, Kyle Kausch3, Matt Landrigan3 and Majed A. Refaai4
1University of Rochester, 2Citra Labs, LLC, a Zimmer Biomet Company, 3Zimmer Biomet, 4Transfusion Medicine, University of Rochester
Background/Case Studies: Transfusion of packed red blood cells (pRBC) is used to treat anemia, reflected by a low hemoglobin (Hb) level, and to improve oxygen delivery. Hb has a finite oxygen carrying capacity and tissues supply of oxygen depend on a sufficient Hb oxygen content. The variable affinity of Hb for oxygen can impact the release of oxygen within the patient's tissues. Due to decreases in 2, 3‐diphosphoglycerate (DPG) over the pRBC storage period, the transfused pRBC Hb has high affinity to O2. The objective of this study was to evaluate the effect of pRBC transfusion on oxygen saturation (SpO2) and delivery (DO2) and a model for oxygen consumption (VO2) and extraction (O2ER) as described previously (Srinivasan 2018).
Study Design/Method: Hemodynamically stable cancer patients >18 years old requiring 1‐2 unit pRBC transfusion in an out‐patient setting were enrolled in this study. Patients’ medical condition, diagnosis, comorbidities, vital signs before, during, and after transfusion, transfusion complications, oxygen delivery changes, outcome, and any related changes in medical conditions within 24 hours after transfusion were collected and analyzed. Oxygen dissociation curves (Hemox Analyzer, TCS Scientific) were prepared from a blood sample pre and post‐transfusion and on each pRBC unit and analyzed to model patient DO2, VO2, and O2ER.
Results/Finding: Hemodynamically stable cancer patients (n=6), age 40–83 years were enrolled and received a transfusion of 1 or 2 pRBC units (storage age 10.7 ± 3.1 days). Transfusion increased hemoglobin significantly (mean±SD; 7.7 ± 1.0 to 9.1 ± 1.8 g/dL, p = 0.04) but left shifted the oxygen dissociation curve and p50 in five of six patients by an average of 5.4% (27.8 ± 1.1 to 26.3 ± 1.8 mmHg, p = 0.16). SpO2 did not change with transfusion (Table). Modeled DO2 and VO2 increased by 22% and 16% on average, respectively, while the O2ER decreased 5.4% with the transfusion of stored pRBCs.
Conclusion: As expected, pRBC transfusion increased the patient's Hb in hemodynamically stable cancer patients. However, while the main aim of pRBC transfusion in these patients is to improve oxygenation (i.e., increased p50 and SpO2), the left‐shifted oxygen dissociation curve resulted in decreased p50 and no changes were detected in SpO2. The increased Hb due to transfusion offset the left‐shift of the dissociation curve by increasing the RBC mass. While only modest decreases in p50 and O2ER were observed in this hemodynamically stable population, critically ill and surgical patients requiring larger transfusion volumes may be adversely affected by reductions in the oxygen extraction ratio.
| Pre Transfusion | Post Transfusion | % Change | |
|---|---|---|---|
| Hemoglobin | 7.7 ± 1.0 | 9.1 ± 1.8 | 18.7% |
| p50 | 27.8 ± 1.1 | 26.3 ± 1.8 | −5.4% |
| SpO2 | 98.0 ± 2.5 | 98.0 ± 1.8 | 0.0% |
| pCO2 | 41.0 ± 8.6 | 38.9 ± 9.4 | −5.1% |
| PO2 | 32.3 ± 1.7 | 36.3 ± 6.9 | 12.3% |
| FO2 Hb | 62.5 ± 18.2 | 69.2 ± 19.5 | 10.7% |
TS46
Natural History of HLA Alloimmune Platelet Refractoriness and Transfusion Support
Anh Dinh1,2 and J. Ryan Pena*2,3
1Brigham and Women's Hospital, 2Harvard Medical School, 3Beth Israel Deaconess Medical Center
Background/Case Studies: There is a lack of data with regard to the natural history of Human Leukocyte Antigen (HLA) antibodies and the impact on transfusion support of patients with HLA alloimmune platelet refractoriness (alloPR). Current management strategies commonly involve the use of HLA‐matched, antigen‐negative, or crossmatched (XM) platelets (PLT). Understanding the natural history may enable optimization of donor product selection.
Study Design/Method: We retrospectively identified patients with alloPR who were supported between 1/2014 to 9/2017 in a medium‐large academic medical center. AlloPR is diagnosed upon repeated poor corrected count increments (CCI) of < 7500 (or in practice, count increment of <10,000K/µL) to random apheresis donor PLTs and detection of HLA antibodies by single antigen (SAG1) flow‐cytometric bead array. Patients receive HLA‐compatible PLT products, which include HLA‐matched (grade A or BU), antigen‐negative, or XM PLTs, and 1‐2‐hour CCIs are used to monitor response. Repeat SAG1 testing is generally performed for patients who lack HLA‐matched donors or when increasing allosensitization is suspected in order to improve donor selection. The change in calculated panel reactive antibody (CPRA), representative of broadness of antibody repertoire, was determined for patients with more than one SAG1 test. HLA compatible PLTs are primarily supplied by one blood vendor.
Results/Finding: Over a 44‐month period, forty‐six patients (70% female) met criteria for alloPR. Primary diagnoses at the time of refractoriness included hematologic diseases (85%), non‐hematologic malignancy (9%), bleeding (4%) or obstetrics (2%). The majority of patients (85%) had concomitant splenomegaly, fever, sepsis, and/or consumptive process. AlloPR was detected from poor increments (78%) or suspicious transfusion reactions (22%). Prior to diagnosis of alloPR, patients received a median of 9 unselected PLTs (range 1‐122) over a median of 12 days (range 1‐2532). The interval between suspicion of alloPR to the first HLA‐compatible PLT transfusion was a median of 3 days (range 1‐111). When possible, HLA‐compatible PLTs (n=736) were categorized as: HLA‐matched (17%), antigen‐negative (78%), and XM (5%). Upon provision of HLA‐compatible PLTs, 85% of patients had 1‐2‐hour CCI > 7500 (70% of all HLA‐compatible PLTs). There was no significant difference between the proportion of HLA‐matched and antigen‐negative PLTs that resulted in a 1‐2‐hour CCI of > 7500 (p=0.1959). Patients were supported for a median of 34 days (range 0‐2530). Repeat SAG1 testing (30% of patients) occurred at a median of 90 days (range 22‐1307). CPRAs either increased (30%), decreased (50%), or were unchanged (20%) over time.
Conclusion: In a medium‐large sized academic hospital, approximately 12 alloPR patients annually receive HLA‐compatible transfusion support, with the majority being antigen‐negative PLTs. Patients ultimately diagnosed as alloPR often present with other plausible medical causes for platelet refractoriness, such as splenomegaly or sepsis. However, as demonstrated in the present study, these findings should not exclude them from evaluation for alloPR. Furthermore, as these antibodies may fluctuate, repeated testing may be critical in guiding future transfusion support strategies.
TS47
Febrile Non‐Hemolytic Transfusion Reaction Among the Inpatient U.S. Elderly Medicare Beneficiaries, As Recorded during 2011‐2017
Mikhail Menis*1, Richard Forshee1, Barbee I. Whitaker1, Zebulin Kessler2, Bo Kim2, Rob Warnock2, Sumit Verma2, Anji Yi2, Yunru Phua2, Stephen McKean2, Hector Izurieta1, Jeffrey A. Kelman3 and Steven Anderson1
1FDA/CBER, 2Acumen LLC, 3CMS
Background/Case Studies: Febrile Non‐Hemolytic Transfusion Reaction (FNHTR) is an acute transfusion complication resulting in fever, chills, headache, nausea, and/or vomiting. FNHTR may lead to prolonged hospitalizations and increased morbidity and mortality. The study objective was to assess FNHTR occurrence and potential risk factors among inpatient elderly Medicare beneficiaries, ages 65 and older, transfused during 2011‐2017.
Study Design/Method: This retrospective claims‐based study utilized large Medicare databases for the study period of January 1, 2011‐April 30, 2017 in coordination with the Centers for Medicare & Medicaid Services. Transfusions of blood components were identified by recorded procedure and revenue center codes, and FNHTR was ascertained via the diagnosis codes. Our study ascertained FNHTR rates (per 100,000 inpatient transfusion stays) among the elderly, overall and by calendar year, age, sex, race, blood components and number of units transfused. Fisher's exact tests were performed to compare FNHTR rates, and Cochran‐Armitage tests evaluated trends by calendar year, age, and transfusion volume.
Results/Finding: Among 12,344,025 inpatient transfusion stays for elderly beneficiaries during study period, 6,938 had a FNHTR diagnosis code recorded, for an overall rate of 56.2 per 100,000 stays. FNHTR rates (per 100,000) varied by calendar year, blood components and number of units transfused as well as by age and sex. Annual FNHTR rates during 2011‐2017 were 58.3, 58.1, 56.6, 57.0, 54.5, 52.9, and 50.7 (p=0.003). FNHTR rates by blood component groups were as follows: 28.9 for plasma only, 72.0 for platelets only, 66.4 for RBCs only, 45.2 for platelets and plasma, 60.7 for RBCs and plasma, 221.1 for RBCs and platelets, and 69.1 for RBCs, plasma and platelets. FNHTR rates for age categories 65‐69, 70‐74, 75‐79, 80‐84, 85 and over were: 62.7, 61.9, 58.7, 52.7, and 46.3, respectively (p<0.001). Females and males had FNHTR rates of 57.6 and 54.5, respectively (p=0.02). FNHTR rates by number of units transfused were: 38.4 for 1 unit, 52.8 for 2‐4 units, 76.5 for 5‐9 units, and 94.0 for > 9 units (p<0.001).
Conclusion: Our population‐based study on FNHTR is the largest‐to‐date among U.S. elderly and suggests a decline in FNHTR occurrence over a seven‐year study period. The study also identified a significant increase in FNHTR occurrence with greater number of units transfused and suggests decline in FNHTR occurrence with older age. The findings show the highest FNHTR rates for stays with RBCs and platelets transfusions and suggest the lowest risk for plasma only and autologous only transfusions. Our study suggests higher FNHTR risk in females, likely due to prior alloimmunization (i.e. pregnancy), which need further investigations. The study was based on claims data and thus limitations include potential under‐ or mis‐recording of FNHTR diagnosis code, transfusion procedures, and units transfused as well as lack of clinical details to validate the recorded FNHTR diagnosis.
TS48
Can Prevention and Recognition of TACO Become Child‐Friendly?
Nicole M. Crews*1,2, Lisa Hensch1,2, Kerryn Harris1,3 and Jun Teruya1,2
1Texas Children's Hospital, 2Baylor College of Medicine, 3University of Alabama
Background/Case Studies: Transfusion Associated Circulatory Overload (TACO) is a potential adverse transfusion reaction associated with high morbidity and mortality and is underdiagnosed and underreported. Diagnostic criteria and risk factors are not well established in the pediatric population. We aim to assess utilization of 1. patient data for potential future risk stratification and 2. vital sign data as an indication for further investigation of TACO.
Study Design/Method: This is a retrospective, observational case review series of pediatric patients that experienced TACO during hospital admission on an acute care floor at a large pediatric hospital from September 2017 through March 2018. Abnormal vital signs were defined by using the patient as its own control by comparing pre (within 4 hours) and post (within 24 hrs) transfusion data. TACO cases were defined (and TRALI ruled out) according to the National Health and Safety Network case definition.
Results/Finding: Six patients (age 1 to 19.1 yo) met study design criteria and data was collected. All had an admission diagnosis of oncologic disease, 3 had > 1 co‐morbidity and 2 had an active infection. A positive fluid balance was noted in 83% (1 patient had a negative balance however input was not assessed due to breastfeeding). Five patients required oxygen therapy, but one patient did not have an oxygen saturation assessed. Three required escalation of care to the pediatric intensive care unit. All patients had a post transfusion chest x‐ray and all had signs of fluid overload. Two patients were originally diagnosed by the medical team as experiencing an allergic reaction. Four of six patients were not reported to the blood bank for a possible transfusion reaction.
(TS48)
| Volume Status (mL/kg) since admission on AM of transfusion (n=5, breastfed infant excluded) | Rate (mL/kg/hr) of transfusion precipitating TACO (n=5, intra‐op transfusion excluded due to rate unknown) | % change in respiratory rate (n=6) | Oxygen saturation (%) post‐transfusion (n=5) | |
|---|---|---|---|---|
| Mean (range) | +127.8 (60.4‐239.5) | 10.4 (1‐24) | +42.5 (0‐73.3) | 88.6 (88‐95) |
| Median (IQR) | +73 (70.6‐195.6) | 10 (4‐13) | +44.3 (20.5‐66.5) | 88 (88‐90.4) |
Conclusion: Due to the close follow up of transfusion recipients by a Transfusion Safety Officer, more than expected numbers of patients with TACO were found. Pediatric patients have unique risk factors and diagnostic features. Our data suggest oncologic diagnoses with comorbidities, positive fluid balance and receipt of multiple transfusions are potential risk factors. Both respiratory rate and oxygen saturation are essential assessment tools and a change in either indicates a need for investigation of TACO.
TS49
Transfusion Reaction Rates of Pathogen Reduced (PR) Platelets vs Conventional (CONV) Platelets in Adults: A Single Academic Center Experience
Amit Gokhale*1, Wade L. Schulz1, Burak Bahar1, Bryan Spencer1,2, Eric Gehrie1,3 and Edward L. Snyder1
1Yale University, 2American Red Cross, 3Johns Hopkins Medical Institutions
Background/Case Studies: Platelet transfusion is a standard approach to prevent or treat bleeding in thrombocytopenic patients. Due to implementation of improved donor history questionnaires and donor testing protocols, the risks of platelet‐associated transfusion transmitted infections have decreased over the years. Sepsis from bacterial contamination of platelets, however, still remains a concern. To further mitigate this risk, our institution migrated our platelet inventory from CONV platelets to an FDA licensed PR platelet product for all patients. Supply constraints during the transition, however, necessitated maintenance of a dual inventory of CONV and PR platelets. We analyzed the incidence of transfusion reactions between these two products in our adult patients over a 16‐month conversion period.
Study Design/Method: From December 2016 to March 2018, all platelet transfusion reactions reported in adults aged 18 years and older were evaluated. We considered both CONV platelets, analyzed with a bacterial detection assay as a safety measure, and PR platelets to represent the standard of care at our institution. Accordingly, when platelets were requested, either product was dispensed by the blood bank as per usual blood bank inventory management policy. For our study, we analyzed the type of platelets transfused, category of any transfusion reaction, and patient demographics. For patients who received both PR and CONV platelets, the reaction was ascribed to the appropriate product based on the timing of the reaction in proximity to the transfusion and the nature of the reaction using National Hemovigilance Network Guidelines.
Results/Finding: A total of 79 transfusion reactions were identified following 12,351 platelet transfusion episodes (Table 1). Results included all adult patients regardless of admitting diagnosis and without stratification for co‐morbidities. Mean age for the CONV group patients was 57.5 years and in the PR group, mean patient age was 60.0 years. In the CONV group, 48 reactions were recorded over 6,948 transfusion episodes. In the PR Group, a total of 31 reactions were identified over 5,403 transfusions. Statistical significance was taken at P<0.05, using Fisher Exact Test. The rate and type of reactions were similar between the two groups, with allergic reactions being the most frequently reported category. No reports of TRALI, septic reactions, or other transfusion transmitted infections were noted in either group.
Conclusion: For adult recipients in our study, there was no difference in the rate or type of transfusion reactions between PR or CONV platelets. Based on our data, PR platelets are safe for transfusion without any increase in the rate or type of transfusion reactions noted.
TABLE 1
| Type of Reaction | CONV Platelets n = 6948 | PR Platelets n=5403 | Total | P Values (Significance = P<0.05) |
|---|---|---|---|---|
| Acute Hemolytic | 0 | 0 | 0 | 1.00 |
| Allergic | 24 (0.35%) | 16 (0.30%) | 40 | 1.00 |
| FNHTR 1 | 19 (0.27%) | 10 (0.19%) | 29 | 0.63 |
| Septic | 0 | 0 | 0 | 1.00 |
| TACO 2 | 3 (0.04%) | 4 (0.07%) | 7 | 0.42 |
| TRALI 3 | 0 | 0 | 0 | 1.00 |
| TAD 4 | 2 (0.03%) | 0 | 2 | 0.52 |
| Hypotensive | 0 | 1 (0.02%) | 1 | 0.39 |
| Total | 48 (0.69%) | 31 (0.57%) | 79 | 0.13 |
1 = Febrile Non‐Hemolytic Transfusion Reaction
2 = Transfusion Associated Circulatory Overload
3 = Transfusion Related Acute Lung Injury
4 = Transfusion Associated Dyspnea
TS50
Adverse Transfusion Reactions Notified to the Hemovigilance Information System “Sihevi‐Ins” in Colombia
Maria I. Bermudez Forero1, Michel Garcia*1,2, Paula A. Gardeazabal1 and Jonathan A. Soto1
1National Institute of Health, 2Universidad Del Rosario
Background/Case Studies: Colombia has made progress in Haemovigilance Program led by the Coordination of the National Network of Blood Banks and Transfusion Services of the National Institute of Health. The aim of this work was to describe the findings after the official online implementation of the haemovigilance information system (SIHEVI) at a national level, regarding the notification of adverse transfusion reactions (ATR), classified according to International Society of Blood Transfusion
Study Design/Method: SIHEVI software was developed to connect all blood banks (82) and hospital services in the country (588). A module was included in the software to verify at the national level the background of ATR that a patient has, prior to a new transfusion. A retrospective analysis was made from January 2017 to March 2018, of the records provided to SIHEVI which currently receives notification from 287 hospital institutions (67% of transfusions made in the country).
Results/Finding: In accordance with reports the blood components most frequently transfused were leukocyte‐poor red blood cells (45%) and fresh frozen plasma (16.3%), with an average of 4 units transfused per patient. There were 458 RATs in 423 patients, who received 959 hemocomponents (20.3 patients out of every 10,000 transfused). Considering the active notification of ATR by 111 hospital institutions, a rate of 26.4 ATR out of 10,000 components transfused was estimated, presenting the highest proportion of cases associated with leukoreduced‐irradiated platelets (367 out of every 10,000 units transfused), followed by fresh frozen plasma (FFP) (48 out of 10,000 transfused units), table.
| Blood Component | units associated with ATR | total transfused | rate × 10.000 |
|---|---|---|---|
| Platelets‐irradiated‐leukoreduced | 16 | 436 | 367.0 |
| Leukocyte‐poor platelets | 25 | 4,996 | 50.0 |
| FFP | 285 | 59,342 | 48.0 |
| RBCs‐irradiated‐leukoreduced | 1 | 240 | 41.7 |
| Platelets‐leukoreduced | 17 | 4,672 | 36.4 |
| Platelets | 135 | 39,234 | 34.4 |
| Cryoprecipitated | 53 | 18,785 | 28.2 |
| Plateletpheresis | 92 | 40,452 | 22.7 |
| RBCs filtered/leukoreduced or apheresis | 335 | 194,907 | 17.2 |
| Total | 959 | 363,064 | 26.4 |
227 ATR (53.7%) were reported as allergic, 98.2% were non‐severe, and in 13 patients the same ATR was identified more than once as they underwent more than one transfusion. In these patients, it was found that the shortest interval between the notification of an ATR, and another was one month, and in a patient the same type of ATR was notified, with an interval of 5 months, being transfused in two different institutions. Of all reported allergies, 69.2% meet a degree of probable or definitive. In addition, 5 cases were life‐threatening (3 TACO and 2 TRALI) and one caused death (TACO).
Conclusion: Although the haemovigilance programs focus mainly on the notification of severe ATR when individual monitoring of each patient is reported, it is considered relevant for the safety of them to identify the transfusion history in order to mitigate the appearance of new ATR.
TS51
Indications and Dosing of Cryoprecipitate in Neonates
Robert A. DeSimone*1, Melissa M. Cushing1, Aarti V. Sharma1, Jeffrey M. Perlman1, Ericalyn Kasdorf1, Yen‐Michael S. Hsu1, Ljiljana V. Vasovic1, Marianne E. Nellis1 and Ruchika Goel2
1Weill Cornell Medicine, 2Department of Pediatrics, New York Presbyterian Hospital, Weill Cornell Medicine
Background/Case Studies: Cryoprecipitate (Cryo) is a source of high‐molecular weight plasma proteins, including factor VIII, von Willebrand factor, factor XIII, fibrinogen and fibronectin. It is produced from the cold insoluble fraction of FFP. The dose and indications for Cryo are not well‐defined, but today Cryo is largely given to replace fibrinogen. No randomized controlled trials exist to evaluate its indications and there is limited information on patterns of Cryo use in neonates.
Study Design/Method: Data was retrospectively collected from neonates admitted to our NICU and transfused with Cryo from May 2013‐May 2017, including clinical scenario, indications, dose, fibrinogen levels pre‐ and post‐transfusion and other components transfused on the same day as Cryo. Our institutional recommended Cryo dose in pediatric patients is 1 single, non‐pooled unit per 10kg (approximately 1.5mL/kg). AABB recommends 1‐2 units/10kg (with a maximum unit volume of 15mL).
Results/Finding: Twenty‐one neonates were transfused 65 doses of Cryo over 4 years. The median age of recipients at first Cryo transfusion was 10 days (range: 0‐76 days). Five patients (24%) were transfused prophylactically, and the remainder (76%) were transfused in the setting of bleeding or surgery. The most common indication for Cryo transfusion was in the setting of bleeding in open heart surgery with bypass for repair of congenital heart disease (15/21, 71%). Remaining patients were transfused in the context of DIC (3/21, 14%), intraoperatively during exploratory laparotomy (1/21, 5%) and coagulopathy (prolonged PT and aPTT) not meeting clinical criteria for DIC (1/21, 5%). One patient (1/21, 5%) with hemophagocytic lymphohistiocytosis and renal failure received 42 doses of Cryo for uremic bleeding over 3 months duration. While Cryo was often transfused for bleeding, pre‐ and post‐transfusion fibrinogen levels were assessed in only 9/65 (14%) and 8/65 (12%), respectively. Viscoelastic testing was not utilized. The median dose of Cryo transfused was 6.5mL/kg (IQR: 4.6‐20.7mL/kg). Excluding the patient receiving 42 doses, the median dose was 10.3mL/kg (IQR: 8.1‐15mL/kg). Components transfused concurrently included platelets (55/65, 85%), RBCs (33/65, 51%) and plasma (19/65, 29%). No transfusion reactions were reported following Cryo.
Conclusion: The majority of neonatal Cryo transfusions were in the setting of bleeding or surgery, with the most common being cardiac surgery and DIC. Pre‐ or post‐transfusion fibrinogen levels were not routinely assessed. The median Cryo dose administered was higher than our institutional and AABB guidelines. Further study of Cryo utilization, dosing and associated outcomes is warranted in neonates, especially in cardiac surgery cases, to standardize transfusions and dosing decisions.
TS52
Poor Sensitivity of AABB Criteria for Culturing Residual RBC and Platelets
Claudia S. Cohn*1, Meghan Delaney2, Magali J. Fontaine3, Isabella Martin4, Andrew W.Y. Shih5 and Nancy M. Dunbar4
1University of Minnesota, 2Children's National Health System, 3University of Maryland School of Medicine, 4Dartmouth‐Hitchcock Medical Center, 5University of British Columbia
Background/Case Studies: Storage of platelet units at 22C encourages bacterial growth and increases the risk of septic transfusion reactions (STR). Concern for STR led to AABB Standard 5.1.5.1, which resulted in universal screening of platelets (PLTs) using culture‐based methods. AABB also issued criteria for culturing PLTs implicated in adverse events to identify STR (AABB Bulletin #14‐04). According to AABB criteria, signs/symptoms suggestive of STR include 1) fever (>/=38C with a rise >/ = to 1C) PLUS any of the following: rigors, hypotension, shock, tachycardia, dyspnea and/or nausea/vomiting ÐOR‐ 2) isolated hypotension. The estimated risk of STR from apheresis PLTs is 9.1‐14.3 per 1,000,000 units, compared to the estimated risk of STR from red blood cells (RBCs) of 0.56 per 1,000,000 units. Nonetheless, serious STR have been caused by RBCs, including two deaths between 2011‐2015, and a series involving Yersinia enterocolitica. The goal of this project was to analyze a large database of transfusion reaction data to calculate the sensitivity and specificity of AABB criteria for culturing suspected STR for PLTs compared to RBCs.
Study Designs/Method: We collected retrospective data for all transfusion reactions in adults (>15 years) that resulted in culture of the residual product during calendar year 2016. We also collected the same data for any reactions with positive residual culture results from 2012‐2015, to enrich the dataset for positive results. We limited the analysis to reactions in which a single PLT or RBC was implicated; reactions involving plasma, cryoprecipitate, or multiple products were not included. We analyzed the AABB culture criteria to assess their sensitivity and specificity for detection of positive residual product cultures in PLTs compared to RBCs. Definite STR was defined as a reaction with concordance between the bacterial species isolated from the implicated unit and from the affected patient. In a possible STR the unit culture was positive but the patient culture was either negative, discordant or the patient was not cultured.
Results/Finding: 22 institutions submitted complete reaction data for 810 reactions with a cultured residual implicated PLT or RBC. Of these, 331 (41%) involved a PLT, and 479 (59%) an RBC. Among the PLTs, 32 had positive culture results with 7 definite STR and 25 possible STR. Among the RBCs, 28 had positive culture results with 1 definite STR and 27 possible STR. A comparison of the specificity and sensitivity of the AABB criteria for detection of positive cultures in PLTs compared to RBCs is shown in the table.
Conclusion: Our results indicate that the sensitivity of AABB criteria for detection of positive cultures in residual products is poor. Although these criteria were designed for PLTs, the criteria perform equally poorly for reactions involving RBCs.
| Component | Sensitivity of AABB Criteria | Specificity of AABB Criteria |
|---|---|---|
| Platelets | 41% (95% CI 24‐59%) | 65% (95% CI 58‐69%) |
| Red Blood Cells | 39% (95% CI 22‐59%) | 64% (95% CI 60‐69%) |
TS53
Red Blood Cell Alloimmunization Rate in Pediatric Sickle Cell Disease Patients in Costa Rica
Jose P. Mora‐Fallas*
Children's Hospital of Costa Rica
Background/Case Studies: Repetitive transfusions of packed red blood cells (pRBC) are an important component of the supportive treatment for patients with sickle cell disease (SCD). Alloimmunization against red cell antigens (RBC‐AI) is a major obstacle in transfusion therapy and may lead to life‐threatening complications such as acute hemolytic transfusion reaction (HTR), delayed HTR, or the rare but serious hyperhemolytic syndrome; in addition, RBC‐AI complicates the laboratory work needed to identify antibodies and to find compatible pRBC units. RBC‐AI incidence is significantly higher in SCD patients, ranging from 20% to 60%, compared to the general population or other polytransfused populations, ranging from 2% to 4%. To date, there are no reports on the RBC‐AI incidence or rate in pediatric SCD patients in Costa Rica. The purpose of this study was to determine the RBC‐AI incidence and rate in a cohort of sickle cell disease patients who are under a transfusion protocol with extended compatibility to RhCcEe and K antigens in a national pediatric hospital in Costa Rica.
Study Design/Method: A retrospective analysis of the immunohematological and transfusion history, between July 2008 and June 2015, of 79 SCD patients with ages between 1 and 15 years transfused at a national pediatric hospital was conducted. Descriptive statistics are reported as percentage or medians and inter‐quartile range (IQR), RBC‐AI rate is reported as antibodies per 100 pRBC transfusions. Comparisons between alloimmunized and non‐alloimmunized patients were made using Fisher's exact test and Mann‐Whitney U test where appropriate, with SPSS v.20 (IBM Corp., Armonk, NY, USA).
Results/Finding: The RBC‐AI incidence was 6.5% with a rate of 0.6 antibodies per 100 pRBC transfusions. Age and number of pRBC transfusions were significantly higher in the alloimmunized group with reference to the non‐alloimmunized group (median of 10.5 years [IQR 5.2 years] vs. 7.65 years [IQR 4.9 years], p = 0.044; and median of 22 pRBC transfusions [IQR 30 pRBC transfusions] vs. 4 pRBC transfusions [IQR 8 pRBC transfusions], p = 0.005, respectively); gender distribution was similar in both groups (female patients: 40% in alloimmunized vs 44.6% in non‐alloimmunized, p=0.609). The frequency of RhDCE phenotypes in these patients were DC+c+E+e + (24.3%), DC+c‐E‐e + (20.3%), DC+c+E‐e + (18.9%), DC‐c+E+e + (13.5%), DC‐c+E‐e + (10.8%), dC‐c+E‐e + (6.8%) and DC‐c+E+e‐ (5.4%); all patients were K‐. Antibodies found were directed against K, Fya, E, f, and non‐identified. K + and E + pRBC units were transfused to antigen negative patients at rural centers.
Conclusion: This is the first report on the rate of RBC‐AI in pediatric SCD patients in Costa Rica. The RBC‐AI incidence and rate in the study cohort are similar to those reported in less heterogeneous populations of donors and patients. The frequency of RhCE phenotypes found in this study differ from the commonly reported in SCD patients. These reports strengthen the recommendations for developing countries to 1) establish transfusion programs that include extended phenotypic compatibility, at least, to RhCcEe and K, even in the absence of molecular extended typing of patients and donors, and 2) generate communication mechanisms between reference transfusion centers and rural or peripheral transfusion centers to minimize the risks of exposing the patient to different RhCcEe and K phenotypes and of developing RBC‐AI.
TS54
Dilution Is Not the Solution: Acute Hemolytic Transfusion Reaction after ABO‐Incompatible Prepooled Platelet Transfusion
Alexis R. Peedin*, Mary Harach, Joy Gould and Julie Katz Karp
Thomas Jefferson University Hospital
Background/Case Studies: Acute hemolytic transfusion (AHTR) reaction is a rare but recognized complication of transfusing ABO incompatible platelets. The most common scenario involves a single donor platelet (SDP) unit obtained from a type O donor with high anti‐A titer transfused into a type A recipient. AHTR following transfusion of ABO incompatible prepooled (PP) platelets is less common because PP platelets pool together several donors, and high anti‐A titer from any one donor is diluted. We report a case of an AHTR following the transfusion of an ABO incompatible PP platelet unit.
Study Design/Method: We evaluated a transfusion reaction in a type A patient with myelodysplastic syndrome who received a type O PP platelet unit for thrombocytopenia with pulmonary hemorrhage.
Results/Finding: Shortly after transfusion initiation, the patient developed rigors, hypoxia, and gross hematuria. Transfusion was stopped and a transfusion reaction was reported. Diphenhydramine, acetaminophen, and meperidine were given. Within a few hours, the patient became febrile to 39.3C. Laboratory testing revealed a drop in hemoglobin from 8.3 g/dL to 6.4 g/dL, new indirect hyperbilirubinemia (0.8 mg/dL), newly elevated lactate dehydrogenase (836 IU/L), and undetectable haptoglobin (<10 mg/dL). No clerical errors were identified. The patient's ABO/Rh type was re‐confirmed. Visual inspection of the plasma was negative for hemolysis. Antibody screen was repeated and found to be negative. The direct antiglobulin test (DAT) was positive, and anti‐A1 was identified in the eluate. Anti‐A titer of the PP platelet unit was 64. The blood supplier was notified; their testing revealed that 4 of 5 donors had anti‐A titer < 200 at immediate spin, while the fifth had anti‐A titer of 2048 with saline‐IgG (Table 1).
Conclusion: Our transfusion medicine service and the blood supplier agreed that this patient experienced an AHTR due to a high titer anti‐A donor in the PP platelet unit. Fortunately, this patient recovered in less than 24 hours and was discharged 1 week later. While it may be tempting to think that PP platelet units dilute high titer antibodies, this case serves as a reminder that out of group transfusion of any platelet, pooled or otherwise, has the potential to cause AHTRs.
TS55
Collaborative Practices and Preemptive Surveillance Reduce the Risk of Unrecognized Passenger Lymphocyte Syndrome in ABO Minor‐Mismatched Stem Cell Transplantation
Sarita Joshi*1, Carol Dumont2, Karen McCasson2, Margaret Gulyas2 and Priscilla I. Figueroa2
1Section of Transfusion Medicine, Cleveland Clinic, 2Cleveland Clinic
Background/Case Studies: Passenger lymphocyte syndrome (PLS) is a serious and potentially fatal complication of ABO minor‐mismatched (minor‐MM) hematopoietic stem cell transplantation (HSCT). In PLS, donor B lymphocytes in the graft mount an immune response against recipient RBC antigens, potentially resulting in severe intravascular hemolysis, typically within 21 days of HSCT. Signs and symptoms of PLS may be mistaken for other complications of HSCT, possibly delaying appropriate care. After a fatality associated with unrecognized PLS in 2010, we implemented a preemptive process for monitoring patients at risk for PLS.
Study Design/Method: Any patient undergoing allogeneic HSCT requires assessment for donor/recipient ABO minor‐MM by the clinical service. The HSCT team informs Transfusion Medicine (TM) of any upcoming minor‐MM patients. TM enters a “safety alert” note in the laboratory information system and the electronic medical record (EMR) so that TM and clinical personnel are aware of the potential for PLS. A case folder is created for each patient to track ABO forward and reverse type, direct antiglobulin test (DAT), blood counts and transfusion requirements. The HSCT team orders the required tests at D+3 and at a minimum, every 3 days while the patient is in house, and then with every outpatient visit until D + 21. The TM resident collects and reviews results with the TM attending during morning TM rounds. A new positive DAT or detection of donor isohemagglutinins triggers additional investigation including, when indicated, an eluate. The HSCT physician on service is directly notified of any positive findings by the TM resident. A note describing identification of a donor‐derived antibody and an interpretation supporting serological evidence of PLS, is placed in the patient's EMR by the TM attending staff.
Results/Finding: After IRB approval, records of all 114 adult patients undergoing ABO minor‐MM HSCT between January 2011 and December 2017 were assessed for adherence to protocol. Peripheral Blood Human Progenitor Cell (HPC‐A) and Marrow (HPC‐M) grafts were equally represented in this cohort. Fifty‐two patients (46%) were detected to have a positive DAT during the monitoring period. Fifteen of 52 (29%) demonstrated donor‐derived antibody in the eluate. The antibody was identified as Anti‐A in 73% of cases. One of 15 patients with serological PLS had clinical hemolysis. He was managed with transfusion support and did not require urgent red blood cell exchange or B‐cell directed therapy. There were no deaths among the transplanted patients at risk for PLS, during the surveillance period. All 114 patients with ABO minor‐MM had evidence of monitoring by the TM service during the 21 days post HSCT. Seven patients were found not to have a safety alert note found in the EMR. One patient had suboptimal adherence to SOP, with a DAT never having been ordered by the clinical team. Clinical team notification occurred for every patient with serologic evidence of PLS.
Conclusion: There were no failures to identify or monitor patients at risk for PLS, by the Transfusion Medicine Service. Collaborative processes and preemptive surveillance of patients detected 14 serologic and 1 hemolytic case of PLS, allowing for appropriate escalation of management, supportive care and follow up. There was no mortality associated with PLS in patients detected to have serological evidence of PLS.
TS56
Platelet PGD® Test: False Positive Versus Culture: False Negative
Eric Beck1, Kimberly Polsley1 and Michael Phillips*2
1ACL Laboratories, 2Aurora Health Care
Background/Case Studies: One of our hospital sites that recently implemented Platelet PGD® Test (Verax Biomedical) observed a 1.3% positivity rate. Since we have yet to get a culture confirmed positive result on any Verax positive units, we questioned whether these represented false positive results or whether the culture method lacked the sensitivity to confirm Verax positive results.
Study Design/Method: Patient Specimens:
Upon receipt in the microbiology laboratory, Verax‐positive platelet units are gram stained and 7.5 mLs of each specimen is inoculated into a BacT/Alert FA Plus Aerobic bottle and an FN Plus Anaerobic bottle (Biomerieux, Durham, NC). Each bottle also gets 2.5 mLs of Fildes Enrichment Medium (Remel, Lenexa, KS) and is placed into a BacT/Alert 3D Automated Blood Culture System at 35°C until they are flagged positive. Negative bottles are removed from the system and discarded after five days. Positive bottles are Gram stained and sub‐cultured for further identification using the Vitek MS MALDI‐TOF system (Biomerieux).
Spiking Study:
TABLE 1
| Laboratory parameter | Pre‐transfusion | Post‐transfusion |
|---|---|---|
| ABO/Rh type, patient | A‐POS | A‐POS |
| ABO/Rh type, PP platelet unit | O‐POS | O‐POS |
| Antibody screen | Negative | Negative |
| DAT | Negative | Positive |
| Eluate | – | Anti‐A1 |
| Anti‐A titer, PP unit | – | 64 |
| Anti‐A titer, donor #5 (saline‐IgG) | – | 2048 |
| Hemoglobin | 8.3 g/dL | 6.4 g/dL |
| Total bilirubin | 0.5 mg/dL | 1.0 mg/dL |
| Indirect bilirubin | – | 0.8 mg/dL |
| Lactate dehydrogenase | – | 836 IU/L |
| Haptoglobin | – | <10 mg/dL |
Serial 10‐fold dilutions of Staphylococcus aureus (ATCC 29213) and Pseudomonas aeruginosa (ATCC 27853) were prepared in sterile saline. Surrogate specimens were prepared by combining 750 µL of each dilution with 6.75 mL of Apheresis Platelet Leukocytes Reduced (E3088) that were less than 3 days beyond their expiration date. The final concentration of bacteria in the surrogate specimens ranged from 1.5x10⁵ ‐ 1.5x101 CFU/mL. 7.5 mLs of each specimen was inoculated into a BacT/Alert FA Plus aerobic bottle along with 2.5 mLs of Fildes Enrichment Media. The cultures were loaded into the BacT/Alert System and incubated until they flagged positive. Bottles that remained negative after five days of incubation were called negative and discarded.
Results/Finding: According to the package insert for the Verax test, the limit of detection for both P.aeruginosa and S. aureus is 8200 CFU/mL of platelets, which falls right in the middle of the range tested with spiked specimens. The limit of detection for our culture method was not reached in this study indicating the sensitivity is less than the lowest dilution tested (1.5 × 101 CFU/mL) for both S. aureus and P. aeruginosa. The bottles spiked at the lowest concentration were nearly 1,000 fold below the concentration required to give a positive Verax result and still went positive in less than a day.
Conclusion: To this date, 1404 platelet units have been tested with 9 positive results, all of which were negative by subsequent culture (false positive rate of 0.6%, which is within the 0.3 – 0.7% false positive rates claimed in the package insert). Additional studies, have demonstrated that our culture methodology is sufficiently sensitive to detect true Verax positive specimens and that all the Verax positives to date most likely represent false positives.
TS57
Selective IgA Deficiency Surveillance by a Hospital‐Based Transfusion Medicine Service
James R. Richter* and Claudia S. Cohn
University of Minnesota
Background/Case Studies: Selective IgA deficiency (SIgAD) is the most common primary immunodeficiency (PI), with a frequency estimated at 1 in 600‐12000, varying by ethnicity. Severe anaphylactic or allergic reactions may occur with blood transfusion in patients with SIgAD who have anti‐IgA. Screening tests usually identify mild deficiency (<7 mg/dl), however secondary testing is necessary to identify true deficiency (IgA < 0.05 mg/dL) and demonstrate the presence of antibodies against IgA. We present data from a hospital‐based surveillance program for SIgAD in an effort to identify patients at risk for possible severe transfusion reactions.
Study Design/Method: From 7/1/2018‐4/1/2018, an automated weekly report of low IgA results (<7mg/dL) based on data resulted from our immunology department was analyzed by the transfusion medicine service. We retrospectively reviewed the electronic medical record (EMR) to assess each patient for SIgAD, and developed an algorithmic approach to identify patients presumptively before discussing each patient with the clinical team, making additional testing recommendations for true IgA deficiency, and documenting the concern for possible transfusion reactions and delayed blood products in the EMR. The goal was to categorize each patient as SIgAD (at least low IgA) or true IgA deficient and assess for IgA antibodies.
Results/Finding: There were 75 low IgA test results for 52 patients. A new diagnosis of SIgAD was made for 10 patients, of which five were unexpected based on the clinical impression at the time of the testing. Nine patients with a known diagnosis of SIgAD were also identified: their diagnosis and history already noted in the EMR. Of these 19 cases, three patients had true IgA deficiency with anti‐IgA antibodies testing performed: one new and two known cases. Three patients had low IgA and IgM. The remaining 30 patients had at least one of a number of diagnoses that explained the low IgA result. For each new diagnosis of SIgAD, the ordering physician was contacted by fax, email, page or phone. We recommended additional testing to include high sensitivity IgA level and anti‐IgA ELISA, and documented possible issues related to transfusion and IVIG administration in the EMR. There were no identified cases of severe allergic transfusion reaction in low or IgA deficient patients.
Conclusion: This retrospective chart review identified 10 new cases of SIgAD in our patient population, including five patients with SIgAD for whom an immunodeficiency of IgA was an unexpected finding. This review allowed us to make testing recommendations in their work up and discuss these cases with their provider. Of these new cases, one patient was identified as having true IgA deficiency and anti‐IgA antibodies, and testing for nine patients is not completed. This study highlights the importance of communication between the transfusion medicine service and our clinical colleagues, and the interdisciplinary effort needed to help avoid possible patient harm.
| Diagnosis | Number of Patients |
|---|---|
| Selective IgA Deficiency, new case | 10 |
| Selective IgA Deficiency, new case and unexpected diagnosis | 5 |
| True IgA Deficiency, new case (new case and with testing) | 1 |
| Selective IgA Deficiency, known case | 9 |
| True IgA Deficiency, known case (known case and with testing) | 2 |
| IgA Deficiency due to other causes | 30 |
| Low IgA and IgM | 3 |
TS58
It's Normal, Right? Measuring the International Normalized Ratio of FFP
Alexis R. Peedin*, Faisal Huq‐Ronny, Karen Smith, Jerald Gong and Julie Katz Karp
Thomas Jefferson University Hospital
Background/Case Studies: Fresh frozen plasma (FFP) can successfully normalize the International Normalized Ratio (INR) in patients with an elevated INR due to warfarin overdose. However, FFP is often requested for patients not taking warfarin with mildly elevated INRs before an invasive procedure. Because these patients’ INRs fail to normalize, our transfusion medicine service has been frequently asked what the INR of FFP is. A literature search failed to provide this information. The purpose of this study was to assess the coagulation profile of FFP, including the prothrombin time (PT), INR, and activated partial thromboplastin time (aPTT).
Study Design/Method: Fifty units of FFP collected in our hospital‐based blood donor center were identified. Plasma frozen within 24 hours of collection, thawed plasma, liquid plasma, and cryopoor plasma were not tested. The ABO type and days since initial freezing were recorded for each unit. A segment from each unit was obtained when the unit was thawed for a patient, and an aliquot was re‐frozen. All aliquots were re‐thawed at the same time; PT, INR, and aPTT were tested on the Stago STA‐R Evolution coagulation analyzer. A one‐way ANOVA and Tukey HSD test (Vassarstats) were used to compare mean INR between ABO types, and statistical significance was defined as p<0.05.
Results/Finding: The average days since initial freezing was 44.1 days (range 14‐109 days), and the average time between thawing, aliquoting and re‐freezing was 1.1 days. The overall average PT was 10.6s, average INR was 0.96, and average aPTT was 35.9s (Table 1). The PT and INR for all units were within normal limits. The INRs ranged from 0.82‐1.19. When comparing the INR between units of different ABO types, the means were significantly different between type B and type O FFP (p=0.037). Eleven (22%) units’ aPTT were above the upper limit of normal (38s), with a maximum of 47.5s. These eleven units had been thawed for an average of 1.2 days prior to re‐freeze.
Conclusion: Perhaps not surprisingly, the INR of FFP was within normal limits. The difference in INR between types B and O FFP, while statistically significant, was clinically trivial (0.92 vs. 1.02 respectively). The units were tested after an average of 1.1 days since initial thaw, which is a typical timeframe within which FFP would be transfused. Failure to normalize patients’ mildly elevated INR after FFP transfusion is more likely due to transfusion of an inadequate dose. Such patients may benefit more from administration of vitamin K while entirely avoiding FFP transfusion.
TABLE 1 (TS58)
| ABO type | % (n) | PT, avg (s) | INR, avg | aPTT, avg (s) | Avg time since initial freeze (days) | Avg time from initial thaw to aliquot re‐freeze (days) |
|---|---|---|---|---|---|---|
| Overall | 100% (50) | 10.6 | 0.96 | 35.9 | 44.1 | 1.1 |
| A | 64% (32) | 10.5 | 0.96 | 35.0 | 46.5 | 1.0 |
| B | 18% (9) | 10.1 | 0.92 | 34.9 | 27.0 | 1.0 |
| O | 18% (9) | 11.2 | 1.02 | 35.0 | 52.7 | 1.3 |
TS59
Safety Evaluation of ABO Incompatible Plasma Containing Components during Emergency Release Transfusions
Lianqun Qiu1,2, Shannon Crown2, James Hemmi2 and Leslie Greebon*1,2
1UTHSCSA, 2University Hospital System
Background/Case Studies: Group AB plasma has limited availability in emergency transfusion, leading to an increasing utilization of group A plasma during emergency release transfusions (ERTs). ABO incompatible plasma transfusions have become acceptable practice with minimal risk of hemolysis often accredited to a protective dilutional effect. This study was performed to determine if increased volume of incompatible plasma transfused is associated with an increased risk of transfusion related complications or mortality.
Study Design/Method: A retrospective study was performed to evaluate the incidence of transfusion‐related complications such as mortality and hemolytic transfusion reactions in group B and AB patients receiving ABO‐incompatible plasma containing blood components from December 2015 to January 2018 during ERTs in a large level 1 trauma center. The ABO blood type and volume of blood components transfused were reviewed, in conjunction with clinical chart review.
Results/Finding: 50 group B and AB patients received group A and/or group O plasma components during ERTs. At 7 days, 38 (76%) patients had survived and 12 (24%) had died. Most deaths (83%) occurred within 48 hours of ERTs and were secondary to underlying medical conditions (Table 1). None of the deaths were associated with transfusion complications. An unexplained drop in the hemoglobin (Hgb) level by 4.6 ± 0.38 g/dl at an average of 4 days following ERTs was experienced by 27 (71%) of the surviving patients. An association between the changes in Hgb levels and the amount of incompatible plasma volumes transfused was not established. A higher mortality rate was present in patients that received >75% of blood volume replaced by incompatible plasma, compared to lesser percentages (Table 1).
Conclusion: Incompatible ABO plasma transfusion in ERTs is a safe and life‐saving strategy that is not associated with increased transfusion related adverse events. Incompatible plasma transfusions accounting for >75% of blood volume was associated with an increased mortality compared to a lesser percentages. However, overall severity of injury cannot be ruled out as a confounding factor leading to increased mortality in this high risk group.
TABLE 1 Association between mortality and percentages of incompatible plasma transfused
| Mortality | % Incompatible plasma transfused groupsa | Total | |||
|---|---|---|---|---|---|
| < 25% | 25‐50% | 50‐75% | >75% | ||
| Day 1 | 1 | 1 | 1 | 2 | 5 |
| Day 2 | 1 | 1 | 0 | 3 | 5 |
| Day 3‐7 | 1 | 0 | 0 | 1 | 2 |
| Alive | 26 | 8 | 3 | 1 | 38 |
| Total | 29 | 10 | 4 | 7 | 50 |
| Mortality Rate (%) | 10.3 | 20 | 25 | 85.7 | 24 |
Percentages of incompatible plasma transfused calculated by total volumes of incompatible plasma transfused including plasma, platelet and cryoprecipitate volume relative to total blood volume derived from body weights. P < 0.001 by Fisher's exact test. Spearman correlation coefficient:‐0.481 (P < 0.001).
TS60
Rotating Three Mobile Blood Storage Refrigerators Provides a Constant Bedside Supply of Blood Products during Massive Transfusion
Wesley Rubenstein*, Elizabeth S. Allen, Aaron J. Harding, Lilia Mejia and Patricia Kopko
University of California San Diego
Background/Case Studies: During a massive transfusion event, the time required to issue large quantities of blood products and transport them to the patient can be problematic; clinicians often stockpile blood products at the bedside for better availability. Prompted by moving to a new building in which the blood bank was far from the operating room, we implemented the use of Hemoroam 15XL mobile blood storage refrigerators (MBRs) (Roemer Industries, Santee, CA) at our university health system, which includes 2 hospitals, a Level I trauma center, an obstetrics service and a liver transplant service (750 inpatient beds, transfusion volume: 23,000 red cell units annually). Our new massive transfusion protocol (MTP) utilizes a rotation of 3 MBRs to keep blood products continuously available at the bedside.
Study Design/Method: Approval and funding were obtained from the hospital administration, and 10 MBRs were purchased and validated. A new standard operating procedure (SOP) for the MBR was implemented, and our blood issuing SOP was updated. Previously, our issue process involved a courier reading the product information to a technologist. In the new process, one technologist issues products in the computer system, and a second technologist checks the products in the MBR against the printed report. The first MBR is stocked with 10 units of red cells and 10 plasma. A room‐temperature drawer contains 1 apheresis platelet and if ordered, cryoprecipitate. When the first MBR is issued, a second is prepared. After the second MBR is issued, a third is prepared. The third MBR is issued upon the return of the first, and the cycle can continue as long as the MTP is active. The MBRs were piloted with the liver transplant program, and usage was subsequently expanded to the entire health system, including MTPs and other high‐volume transfusion events upon request. Issuing time and usage trends were evaluated.
Results/Finding: The new MBR system has been used 207 times at our institution between August 2017 and March 2018. Of these, 61 (28%) were for massive transfusions (28 for liver transplants, 10 for trauma, 23 for other non‐trauma, including obstetrics and critical care). Evaluation demonstrated minimum usage in October (0.16 protocols per day) and a maximum in January (0.39 protocols per day), with an overall average of 0.27 protocols per day. The time to issue 10 blood products using the old SOP was 8 minutes (48 seconds/unit) while issuing time using the new SOP is 7.1 minutes (42.6 seconds/unit, 11% decrease).
Conclusion: Rotating 3 MBRs during an MTP event facilitates a constant supply of blood at the patient's bedside and decreases blood issuing time. Clinicians have embraced this strategy and the transfusion service has received positive feedback.
TS61
Sickle Red Blood Cells Are More Susceptible to in Vitro Hemolysis When Exposed to Normal Saline Versus Plasma‐Lyte A
Majed A. Refaai*1, Kelly F. Henrichs2, Jill M. Cholette3, Anthony P. Pietropaoli4, Sherry Spinelli5, Suzie Noronha6, Richard P. Phipps5, Christine Cahill7 and Neil Blumberg7
1Transfusion Medicine, University of Rochester, 2University of Rochester Medical Center, 3Pediatric Critical Care and Cardiology, University of Rochester Med. Ctr., 4Critical Care Medicine, University of Rochester Medical Center, 5Transfusion Medicine, University of Rochester Medical Center, 6Pediatric Hematology‐Oncology, University of Rochester Medical Center, 7University of Rochester
Background/Case Studies: Normal saline (NS) has been the fluid of choice for resuscitation, rehydration and fluid replacement during therapeutic red blood cell (RBC) exchange for patients with sickle cell anemia. There are increased concerns about NS's renal toxicity, and data demonstrating greater in vitro hemolysis of normal RBC with NS than with buffered solutions such as Plasma‐Lyte A (PLA).
Study Design/Method: We investigated the degree of hemolysis of normal RBCs (n=10) and sickle RBCs (n=20) after in vitro incubation with either NS or PLA. We also analyzed RBC indices including mean corpuscular volume (MCV) to assess the biophysical effects of short term (24 hours) storage in these solutions.
Results/Finding: Sickle RBC experienced significantly greater hemolysis (p<0.0001) than normal RBC in both crystalloid solutions (Table). NS caused increased hemolysis compared with PLA for sickle RBC after 24 hours of exposure (p<0.0001) (Table). In patient samples containing increasing quantities of hemoglobin S red cells, increasing hemoglobin S was associated with increasing hemolysis in NS (Spearman's correlation coefficient = 0.52; p=0.003). A similar but smaller effect was seen for PLA (Spearman's=0.44; p=0.02). After 24 hours of exposure, sickle RBC increased their MCV by 7.3 f. in NS vs. 6.3 f. in PLA (p=0.0078) (n=10). MCV of normal RBC increased by 13 fl in NS and 12.4 in PLA (p=0.15) (n=5).
Conclusion: This in vitro model demonstrates that short term exposure of sickle RBC to crystalloid leads to greater hemolysis than for normal RBC. This effect is significantly greater with NS than PLA. Whether use of NS causes increased hemolysis in vivo is unknown. Given recent evidence that NS increases renal failure and mortality in critically ill patients, further investigations are well justified. Until further studies can be conducted, patients with sickle cell anemia may benefit from rehydration and resuscitation with PLA or similar buffered solutions, given the existing evidence for adverse effects of low level hemolysis.
TABLE 1 Free Hemoglobin (mg/dL) concentrations after 24 hour in vitro incubation of normal RBC and sickle RBC with normal saline or Plasma‐Lyte A. Data are median and interquartile range (IQR). p value by Wilcoxon signed rank test.
| Normal Saline | Plasma‐Lyte A | p value | |
|---|---|---|---|
| Normal RBC | 53 (48‐92) | 43 (39‐70) | 0.08 |
| Sickle RBC | 163 (105‐247) | 126 (93‐172) | <0.0001 |
| p value | <0.0001 | <0.0001 |
TS62
Septic Transfusion Reaction to Apheresis Platelets with Negative Point of Issue Testing
Colleen A. Aronson*1, Mona Papari2, Andrea Pelock3, James J. Walsh3 and John Hamilton3
1ACL Laboratories/Advocate Hospitals, 2ITxM/LifeSource, 3Advocate Christ Medical Center
Background/Case Studies: Orders were received to transfuse 2 units of platelets (PLTs) to a 17 year old neutropenic patient with Acute Lymphoblastic Leukemia (ALL) in the outpatient setting. Two apheresis PLTs were allocated and issued at about 11 am and transfused within the next hour. There were no signs of a transfusion reaction noted during or immediately after the transfusion but approximately 30 minutes after completing the outpatient visit, the patient returned to the Emergency Department (ED) with fever and chills. Blood cultures were collected and the patient was admitted to the hospital. Initial thought was that the patient's central line (port) was contaminated. The following evening the septic symptoms were linked to the transfusion and a transfusion reaction was reported to the transfusion service (TS).
Study Design/Method: The blood supplier was notified of the transfusion reaction, but the original PLT containers were no longer available for culture. The 1st unit transfused had a concurrent plasma available and a second PLT container from this same collection that was transfused to a patient in another hospital facility without any reports of adverse reactions. The 2nd unit transfused was part of a triple collection with a 2nd container returned to the blood supplier due to the presence of clots on the 4th day after collection. The 3rd PLT container from the 2nd unit transfused had been transfused to a post‐bone marrow transplant patient about 6:30 am on the same day as the other transfused container with no signs or symptoms of a transfusion reaction. Cultures from the concurrent plasma of the 1st unit transfused were negative, but cultures from the clotted PLT from the 2nd unit transfused were positive and identified as Methicillin‐susceptible Staphylococcus aureus. Blood cultures from the septic patient also grew Methicillin‐susceptible Staphylococcus aureus.
Results/Finding: The initial culture performed on the parent PLT product by the blood center was sampled 24 hours after the collection and was negative after 5 days incubation on the BACT/ALERT® instrument; additionally, the initial samples were subsequently plated after notification of the transfusion reaction and found to be negative. All 3 PLT containers from the suspect collection were tested at the hospital using point of issue bacterial testing (Verax Platelet PGD® Test) on midnight of day 3 into day 4 and found to be negative for the presence of bacteria. S. aureus from the patient blood culture and the positive PLT container were sent for genotyping and found to be identical, indicating that the patient's septic reaction was caused by the transfused PLT product.
Conclusion: Although point of issue bacterial screening was performed, it appears that the level of bacteria was below the limit of detection which may have resulted in the false negative results. On the clinical side, even after symptoms of a reaction were present, the initial assumption was that the patient had a central line‐associated blood stream infection (CLABSI). Discussion with clinical staff shows that the current CLABSI investigation process does not include checking to see if blood products have recently been given that may have caused patient to be septic. The other lesson learned was that the TS did not realize that the clot found in one of the containers might indicate the presence bacteria and that the co‐components should have been removed from the inventory.
TS63
Massive Fetomaternal Hemorrhage Approaching the Total Fetal Blood Volume and Successful Prevention of Maternal Rh Alloimmunization
Sajjad Hassan*, Lauren Orr, Corina Schoen and Chester Andrzejewski
Baystate Health / Baystate Medical Center
Background/Case Studies: Admixture of fetal blood into the maternal circulation is common. Massive feto‐maternal hemorrhage (MFMH) may cause severe fetal morbidity/mortality. Although no exact blood volume (BV) has been defined, MFMH typically involves BVs ≥ 80 mL. MFMH > 80 mL is estimated to occur in 0.1% deliveries. MFMH > 150 mL is estimated at 0.02% deliveries and has been previously reported in only a few cases, mostly without follow‐up of maternal Rh sensitization status. Here we describe a case of MFMH (240‐280 mL) and its consequences regarding fetal outcome and maternal RhD alloimmunization status.
Study Design/Method: Case Report: 30 year old female G3P2‐011 (O Rh negative) given Rh immunoglobulin (Rh Ig) at 26 weeks gestational age (GA) presented at 40 weeks 2 days GA for a scheduled biophysical profile for post due date evaluation. The patient did not remember the last time she had felt fetal movements and denied vaginal bleeding, trauma, fluid leakage or contractions. Ultrasonography revealed absent fetal heart rate (two weeks prior, normal fetal heart sounds present). She underwent induction of labor and delivered a 3450 grams stillborn female fetus. Fetal autopsy revealed chronic placental abruption most likely resulting in MFMH.
Results/Finding: Kleihauer‐Betke Test (KBT) performed after delivery showed a result of 6.0 %. Seven hours later, KBT was repeated (5.4%). Based on these findings and a calculated maternal BV of 4940 mL, a calculated fetal maternal hemorrhage (FMH) was estimated to be 240 mL to 280 mL (approaching the total fetal BV calculated as 293 mL). She was given 2 vials of intramuscular RhIg (300 micrograms/vial) and 8 vials of intravenous RhIg over a 3 day period with no observable clinical adverse sequelae. Serological investigations (SI) at 6 months postpartum during a pre‐conception consultation revealed anti‐D antibodies (titer not ordered). SI testing at 8 months postpartum was inconclusive (4/8 RhD antigen positive, weakly reacting). At 10 months postpartum, no anti‐Rh D antibodies were detected. She was 9 weeks pregnant at the time of this follow‐up SI. She was treated with intramuscular RhIg (300 mcg/vial) and delivered a healthy RhD positive neonate at term. Fetal blood screen was negative after delivery.
Conclusion: MFMH of > 150 mL has been described in rare cases with most reports not indicating maternal sensitization status. Our case of MFMH, along with maternal serial follow‐up SI, indicates adequate dosing of RhIg was achieved in our patient to prevent isoimmunization and supports current guidelines regarding the dosing of RhIg in MFMH. After high dose RhIG is given, SI may be positive for several months and may not necessarily indicate maternal alloimmunization.
TS64
Precision and Accuracy of Vital Sign Reporting in Transfusion Reactions
Magali J. Fontaine*1, Claudia S. Cohn2, Meghan Delaney3, Isabella Martin4, Andrew W.Y. Shih5 and Nancy M. Dunbar4
1University of Maryland School of Medicine, 2University of Minnesota, 3Children's National Health System, 4Dartmouth‐Hitchcock Medical Center, 5University of British Columbia
Background/Case Studies: Identification of septic transfusion reactions (STR) relies on recognition of signs and symptoms and prompt reporting of suspected transfusion reactions. Clinical signs and symptoms associated with possible STR include fever, hypotension and tachycardia. Current AABB criteria define fever as >/ = 38C with a rise of >/ = 1C; however, hypotension and tachycardia are undefined. The goal of this study was to compare subjective reported symptoms to objective recorded vital signs by analyzing a large database of transfusion reaction reports in adults (> 15 years).
Study Designs/Method: We collected retrospective data for all transfusion reactions that resulted in culture of the residual product during calendar year 2016. We also collected the same data for any reactions with positive residual product culture results from 2012‐2015, to enrich the dataset for positive results. Vital signs changes were defined as follows: 1) Fever: > /=38C and increase of 1C; 2) Hypotension: systolic blood pressure (SBP) < / = 90 mmHg and/or diastolic blood pressure (DBP) < / = 60 mmHg and 15% decrease from baseline; and 3) Tachycardia of HR > / = 100bpm and 15% increase from baseline. Reported subjective and observed objective vital signs were compared for precision and accuracy of reporting.
Results/Finding: Reaction vital sign data from 807 adult transfusion reaction reports were analyzed. Fever was reported in 490 reactions, 120 of these (24%) did not meet AABB criteria whereas 3 of 317 (1%) reactions with no fever reported had a fever meeting AABB criteria. Hypotension was reported in 126 reactions, 31 of these (24%) did not meet definition for hypotension, whereas 48 of 681 (7%) reactions with no hypotension reported had hypotension. Tachycardia was reported in 263 reactions, 109 of these (41%) did not meet definition for tachycardia, whereas 25 of 544 (5%) reactions with no tachycardia reported had tachycardia. A comparison of the precision and accuracy of subjective reporting compared to defined criteria is shown in the table.
(TS64)
| Symptom Subjectively Reported | Precision; False Positive (FP) Rate | Accuracy | Negative Predictive Value |
|---|---|---|---|
| “Fever” | 370/490 (76%); [FP:24%] | 684/807 (85%) | 314/317 (99%) |
| “Hypotension” | 95/126 (75%); [FP:25%] | 728/807 (90%) | 633/681 (93%) |
| “Tachycardia” | 154/263 (59%); [FP:41%] | 673/807 (83%) | 519/544 (95%) |
Conclusion: These study results indicate that the accuracy of reporting fever, hypotension, and / or tachycardia, during a blood transfusion in adult patients, is high (greater than 80%) but could be further improved. Indeed subjective reporting is associated with a high false positive rate (greater than 20%) despite a high negative predictive value (greater than 90%), meaning that transfusion associated vital signs changes tend to be over‐reported.
TS65
Improved Pairwise Kinship Analysis Using Massively Parallel Sequencing
Ran Li and Hongyu Sun*
Sun Yat‐sen University
Background/Case Studies: At present relationship testing is usually performed by detecting 15∼23 STR loci using capillary electrophoresis technology. Powerful discrimination can be obtained for parent‐child relationship but it may not be confident enough to determine more distant relationships. More genetic markers are needed for the distant relationships. Massively parallel sequencing (MPS), also known as next generation sequencing (NGS), offers the possibilities to analyzing multiple types of markers in a single reaction. In this study, we evaluated the performance of the Forenseq™ signature system, a novel typing system based on NGS platform, for pairwise kinship analysis.
Study Design/Method: 67 individuals from two families were analyzed to explore the efficacy of the Forenseq™ signature system for pairwise kinship analysis. Amelogenin, 27 autosomal STRs, 24 Y‐STRs, 7 X‐STRs and 94 identity informative SNPs were analyzed simutaneously in one reaction. 5 types of pairwise relationships including parent‐offspring, full siblings, grandparent‐grandchild, uncle/aunt‐nephew / niece and first cousin were selected from these two families and the corresponding likelihood ratios (LRs) were calculated using either sequence or length genotype data (i.e., LRsequence and LRlength). In addition, the system powers of the STRs and SNPs in the panel were also estimated by simulation.
Results/Finding: 54, 9 and 5 additional alleles were observed based on sequence for autosomal STR, Y‐STR and X‐STR respectively compared to those based on length and 11 novel alleles were identified. 5 mutations were found for STRs but no mutation was observed for SNPs. For 27 autosomal STR loci, the LRs were increased from 9.20, 7.87, 2.01, 2.07 and 0.42 for log10LRlength to 11.52, 10.12, 2.61, 2.60 and 0.52 for log10LRsequence for paternity index (PI), full siblings index (FSI), grandparent‐grandchild index (GI), uncle/aunt‐nephew/niece index (UNI) and first cousin index (FCI) respectively. PI values for 94 SNPs separated more than those of 27 STRs if two individuals were non‐parent‐offspring relatives. For the simulation study, the effectiveness was 1 for the parent‐offspring relationship at the thresholds of ‐4≦log10LR≦4 and was > 0.9996 for full siblings at the thresholds of ‐2≦log10LR≦2 With an low error rate of 0.47%, 92.79% of second‐degree relative pairs could be determined at the thresholds of ‐1≦log10LR≦1, while the effectiveness was only 0.4302 for first‐cousins with a relatively high error rate of 2.32%.
Conclusion: STR typing according to the sequence information were more polymorphic, which increased the discrimination power for kinship testing. Compared to these 27 STR markers, 94 SNP markers in this panel had advantages in paternity testing especially when mutated STRs were involved or when a relative was an alleged parent. This panel was powerful enough to resolve paternity testing, full sibling testing and most second degree relationships testing with a very low error rate, while more markers were still needed for first‐cousin testing.
TS66
Red Blood Cell Preparation and Processing: Results from the 2017 AABB Neonatal and Pediatric Blood Bank Practices Survey
Hollie M. Reeves*1, Ryan Pyles2, Sarah K. Harm3, Erin Meyer4, Lani Lieberman5, Srijana Rajbhandary6, Gabriela E. Perez6, Barbee I. Whitaker6 and Meghan Delaney7
1University Hospitals Cleveland Medical Center, Department of Pathology, 2SSM Health Cardinal Glennon Children's Hospital, 3University of Vermont Medical Center, 4Nationwide Children's Hospital, 5University Health Network, 6AABB, 7Children's National Health System
Background/Case Studies: Blood transfusions occur frequently for inpatient neonatal and pediatric patients. The current range of red blood cell (RBC) preparation and processing for these patients is largely unknown.
Study Design/Method: Members of the AABB Pediatric Transfusion Medicine Subsection Committee (PTMSCC) developed a 74 question web‐based survey to assess national neonatal and pediatric blood bank practices. Between April 2017 to January 2018, the survey was sent to 221 centers in the U.S. The centers surveyed included AABB member institutions that transfused or prepared blood components for neonatal and/or pediatric patients. Results were evaluated using descriptive statistics including frequencies and percentages.
Results/Finding: Thirty five centers completed the survey for a response rate of 15.8%. Most (94%) centers transfuse both neonatal and pediatric patients. Tertiary/quaternary academic pediatric hospitals were 40% of responses; most had both neonatal and pediatric intensive care units. All sites defined a neonate as ≤ 4 months, with the exception of one that defined neonates as less than 28 days. The use of additive containing RBCs (AS‐1, 3 or 5) is common for small volume (<20 ml/kg) and large volume (>20 ml/kg) transfusion of both neonates (57%) and pediatric patients (68%). The majority of centers had a policy on the storage age of RBCs for small and large volume neonatal transfusion although the definition of shorter storage was variable. Conversely, > 70% of centers did not have a policy regarding the storage age thresholds for large or small volume pediatric transfusion. Nearly all centers provide leukocyte reduced RBCs to neonatal and pediatric patients; 31% always provide cytomegalovirus (CMV) seronegative RBCs to neonates while 9% do for pediatric patients. 89% of centers always irradiate RBCs for neonatal patients and 22% for pediatric patients. Approximately 50% of centers have policies limiting the storage age of irradiated RBCs transfused to neonates; the majority limit to 24 hours. 63% and 72% sometimes wash RBC units for neonates and pediatric patients respectively; most commonly cited indications for washing RBC units were patients at risk for hyperkalemia and history of transfusion reactions. The majority never volume reduce RBCs for transfusion to neonates (66%) or pediatric patients (71%).
Conclusion: RBC preparation and processing for neonatal and pediatric patient transfusion is varied among centers. Irradiation and transfusion of CMV seronegative RBCs is more commonly performed for neonates compared to pediatric patients. Centers were also more likely to have storage age thresholds for neonatal transfusion. Specific recommendations from expert groups and/or clinical studies may aid in standardizing these practices.
TS67
Mislabeled Samples Frequently Contain Wrong Blood in Tube Errors
Mark H. Yazer*1, Danielle Chasse2, Anh Dinh3, Nancy M. Dunbar2, Peter Flanagan4, Kimberly Gabert5, Bryon Jackson6, Debra Lane7, Michael Murphy8, Charles Ray2, Julie Staves9 and Richard M. Kaufman10 on behalf of the Biomedical Excellence for Safer Transfusion (BEST) Collaborative2
1Department of Pathology, University of Pittsburgh, 2Dartmouth‐Hitchcock Medical Center, 3Beth Israel Deaconess Medical Center, 4New Zealand Blood Service, 5The Institute for Transfusion Medicine, 6Emory University School of Medicine, 7Canadian Blood Services, 8John Radcliffe Hospital, 9Oxford University Hospitals NHS Foundation Trust, 10Department of Pathology, Brigham and Women's Hospital
Background/Case Studies: Minor label errors on pretransfusion samples have been associated with a high rate of serious wrong blood in tube (WBIT) errors, which can lead to ABO mistransfusions. Many transfusion services reject all samples with any label error, regardless of how minor, but the data supporting this practice are limited. This study evaluated the WBIT rate in mislabeled samples in an era of heightened attention to patient identification.
Study Design/Method: At participating transfusion services, blood and cord blood samples that were rejected for any reason per local policies were tested for ABO and RhD (these results were not reported to the clinical service). ABO/RhD results on the mislabeled samples were compared to historic ABO/RhD results to determine if a WBIT error had occurred in the mislabeled sample.
Results/Finding: There were 12 institutions that participated. A total of 1548 mislabeled samples were identified. Most (854/1548, 55.2%) of the mislabeled samples were collected on a ward, in the emergency department (253/1548, 16.3%), or in the intensive care unit (ICU; 248/1548, 16%). The main reasons for rejecting the samples was that the phlebotomist's identification was not properly documented, or was missing from, the sample (623/1548, 40.2%), that the label itself was unacceptable for testing because it was pre‐printed, not affixed to the tube of blood, was not provided at all etc. (450/1548, 29.1%), or that the patient's name was incomplete or misspelled (178/1548, 11.5%). In total there were 33 (2.1%, 95% CI: 1.5%‐3.0%) WBIT errors detected amongst the 1548 mislabeled samples. The overall median (IQR) rate of WBIT errors amongst the mislabeled samples at these 12 institutions was 0.2% (0%‐2.9%). Between these 12 institutions, the rate of WBIT errors amongst mislabeled samples ranged from 0%‐9.5%. The samples with WBIT tended to be found in samples where the phlebotomist's identification was not properly documented, or was missing from, the sample (14/33, 42.4%), those that had unacceptable labels (8/33, 24.2%), those where the patient's name was incomplete or misspelled or where the patient's medical record number was missing or incorrect (both 5/33, 15.2%). The samples with WBIT were mostly collected on wards (12/33, 36.4%), in the ICU (9/33, 27.3%), in the emergency department (6/33, 18.2%). Most of the WBIT samples were identified because of a discrepancy between the current and historical samples’ ABO typing (20/33, 60.6%), followed by discrepancies between both the ABO and RhD typings (8/33, 24.2%), or by discrepancies in the RhD typing alone (5/33, 15.2%).
Conclusion: These data support the continued rejection of all samples that do not meet the local patient and phlebotomist identification criteria. Furthermore, these data support performing both an ABO and RhD typing on samples that are collected to verify the fidelity of the initial ABO and RhD typing on patients without a historical ABO and RhD typing on file.
TS68
Simplified and Cost‐Effective Approach to DAT Testing in Patients with Positive Antibody Identification Workups
Voicu Suciu*1, Dawn C. Ward2, Rebecca Jeffrey1, Alyssa Ziman2 and Andrea M. McGonigle2
1Wing‐Kwai and Alice Lee‐Tsing Chung Transfusion Service, Department of Pathology and Laboratory Medicine, David Geffen School of Medicine at UCLA, 2Division of Transfusion Medicine, Department of Pathology and Laboratory Medicine, David Geffen School of Medicine at UCLA
Background/Case Studies: The direct antiglobulin test (DAT) can detect IgG and C3d attached to red cell membranes and is commonly used as part of the pre‐transfusion workup in patients with a positive indirect antiglobulin test (IAT). In 2014, our transfusion service policy included performance of a DAT reflexively with each positive autocontrol. In 2016, we switched policies such that only an IgG DAT would be performed with each positive IAT; autocontrols and DAT testing with polyspecific (PS) and anti‐C3d reagents were no longer routinely performed as part of the pre‐transfusion workup.
Study Design/Method: Data regarding the number of positive IATs, autocontrols and DATs were obtained from records of all antibody workups performed. The number of physician‐ordered DATs and DATs performed for a transfusion reaction were derived from blood bank records and excluded. Cost calculations were based on supply/reagent costs, average hourly rates for technical staff and average staff time to perform testing.
Results/Finding: The cost savings over one year associated with switching to IgG‐only DAT as part of positive IAT workup was approximately $8,500; the staff time saved was approximately 180 hours. The percentage of new antibodies identified post‐transfusion in 2014 and 2016 were the same (Table 1), suggesting that the new policy provided equal opportunity to evaluate patients whom may be at risk for clinical hemolysis associated with RBC antibody formation.
TABLE 1 (TS68) Number of tests performed in 2014 versus 2016
| Number of Procedures Performed | ||
|---|---|---|
| Year | 2014 | 2016 |
| Pre‐transfusion/Antibody Identification Workups (ABID) | 1185 | 906 |
| Autocontrol (Column Agglutination methodology) | 828 | 0 |
| PS DAT (Tube methodology) | 809 | 0 |
| DAT: IgG + C3d (Tube methodology) | 440 | 6 |
| DAT: IgG only (Solid Phase Red Cell Adherence or Column Agglutination methodology) | 0 | 900 |
| New antibodies identified post transfusion | 39 (3.3%) | 30 (3.3%) |
Conclusion: Performance of an IgG DAT only instead of an autocontrol with reflexive DAT for positive IAT results is cost‐effective, simplified pre‐transfusion workup workflow, improved resource utilization of technical staff and demonstrates at least equal efficacy.
TS69
Qualification of Whole Blood in Citrate Phosphate Dextrose Adenine for Pathogen Reduction Treatment with Riboflavin and Ultraviolet Light
Susan Yonemura, Suzann Doane*, Jane Gosney, Nick Hovenga, Melissa Tran and Susanne Marschner
Terumo BCT
Background/Case Studies: A riboflavin and ultraviolet light (R+UV) pathogen reduction system has been CE marked for extracorporeal treatment of Whole Blood (WB). The system is designed to reduce the pathogen load and to inactivate WBCs in WB for transfusion. A recent clinical trial demonstrated that R+UV treatment significantly reduced transfusion transmission of Plasmodium spp., the parasite that causes malaria. When the system was initially released, treatment with R+UV was limited to WB collected in CPD, but CPDA‐1 is more commonly used for WB transfusion. Thus, a series of studies was performed to qualify system performance when treating WB in CPDA‐1.
Study Design/Method: System performance was assessed via photochemistry (PC), pathogen reduction (PR), cell quality (CQ), WBC inactivation, and hemostatic function. For PC analysis, pooled‐and‐split paired units of WB in CPD or simulated CPDA (CPD+A) were treated and analyzed for riboflavin and lumichrome content by high‐performance liquid chromatography and liquid chromatography‐tandem mass spectrometry. Assessment of PR used the cold‐growing bacterium Yersinia enterocolitica. CQ testing included CBCs, blood gases, and electrolyte measurements following collection, after treatment, and on days 7, 14, and 21 of storage; % hemolysis was evaluated per the Council of Europe (COE) criterion (<0.8%). The limiting dilution assay (LDA) evaluated WBC inactivation in comparison to gamma irradiation. Hemostatic function was assessed by ROTEM.
Results/Finding: PC analysis demonstrated < 1% difference in the photoconversion of riboflavin to lumichrome in WB units in CPD+A compared to WB units in CPD. Y. enterocolitica log reduction in CPDA‐1 was 2.66 ± 0.26 (range 1.92‐3.10, N=6) and in CPD was 2.86 ± 0.44 (range 2.36‐3.56, N=7) (p=0.3566). In CQ testing, the mean hemolysis for R+UV‐treated WB units in CPDA‐1 was 0.32 ± 0.10% (range 0.14‐0.60, N=33) after 21 days of storage, meeting the COE criterion. Log reduction in frequency of proliferating WBCs was ≥4.7 logs and 4.1 logs for R+UV and gamma irradiation, respectively. Mean values for clotting time and maximum clot firmness as measured by ROTEM were within normal reference ranges through 7 days of storage.
Conclusion: An extensive battery of in vitro tests has shown acceptable performance for the R+UV system when treating WB in CPDA‐1. The photochemistry remains the same and there was no statistically significant difference in PR when compared to R+UV‐treated WB in CPD. CQ met the COE criterion, R+UV inactivates WBCs as effectively as gamma irradiation, and hemostatic function is preserved. The R+UV pathogen reduction system can be used to treat WB in CPDA‐1 for clinical use.
TS70
Comparison of Volume Reduction and Washing of AS1 Red Cells Using Catsmart Cell Saver in Infants < 4 Months of Age Undergoing Cardiovascular Surgery
Lejla Music‐Aplenc*, Gabriel Metzler, Angela Ferguson and Uttam Garg
Children's Mercy Hospital
Background/Case Studies: During cardiovascular surgery (CVS), infants < 4 months of age are exposed to large volume transfusions. The evidence supporting the use of AS1 RBCs in large volume transfusions is not well established. Blood bank at our institution has performed a volume reduction of the AS1 RBCs for infants < 4 months of age undergoing CVS. It has been a labor intense process and decision was made to switch to washing of the AS1 RBCs by using the Catsmart Cell Saver by Fresenius Kabi. The purpose of this study was to establish that change in process, from volume reduction to washing AS1 RBCs in the Catsmart Cell Saver, prior to placing the patient on the cardiopulmonary bypass will provide safe and consistent results.
Study Design/Method: First, we analyzed laboratory characteristics of 6 AS1 RBC units pre and post volume reduction and pre and post cellwash using the Catsmart Cell Saver (table not included in this abstract). Second, samples were obtained at four time points including a sample from the unmanipulated AS1 red cells (pre cellsaver), a sample after the post cellsaver wash, a sample from a pump (bypass prime) and a sample collected 5 minutes after the patient was on the bypass. Blood samples were analyzed for analytes considered clinically significant if outside of the normal range. The blood samples were collected on seven cases at the time of CVS in infants < 4 months of age. Testing was performed on a GEM 4 blood gas analyzer and osmolality was performed on the Advanced Instrument Micro‐Osmometer. This particular test was not part of the standard electrolyte panel tested at the time of the surgery thus it was omitted from the last (bypass) time point.
Results/Finding: Pre and post red cell washing
(TS70)
| Specimen | Expected Range | Pre‐Cell Saver | Post‐Cell Saver | Bypass Prime | On bypass |
|---|---|---|---|---|---|
| PH Mean (Min‐Max) | 7.35‐7.45 | 6.8 (6.6‐6.8) | 6.9 (all) | 7.405 (7.367.43) | 7.35 (7.26‐7.47) |
| Na Mean (Min‐Max) | 135‐145 mmol/l | 130.4 (125‐135) | 140.4 (138‐145) | 140.71 (136‐146) | 137.1 (134‐139) |
| K Mean (Min‐Max) | <5mmol/l | 12.07 (7.7‐16.8) | 1.48 (1‐2.9) | 2.04 (1.7‐2.3) | 3.58 (2.8‐4.2) |
| iCa Mean (Min‐Max) | <1 mmol/l | 0.2 (all) | 0.25 (all) | 0.25 (all) | 0.81 (0.5‐0.9) |
| Glucose Mean (Min‐Max) | <120 mg/dl | 710.14 (452‐797) | 292.14 (121‐369) | 78.85 (64‐97) | 104.14 (82‐146) |
| Lactic Acid Mean (Min‐Max) | <2 mmol/l | 8.8 (7.5‐10.5) | 2.607 (2.4‐5.1) | 1.44 (1.1‐1.9) | 1.31 (1‐2.1) |
| Hematocrit Mean (Min‐Max) | 30‐35% | 64.3 (57‐71.5) | 56.71 (53‐64) | 31.8 (29‐34) | 31 (28‐34) |
| Osmolality Mean (Min‐Max) | 275‐300 mOsm/kg | 359 (303‐379) | 300 (293‐304) | 284 (275‐293) | NA |
Conclusion: Potassium and glucose concentrations were high in the RBC AS1 units prior to any manipulation and concentrations were significantly decreased with washing, and increased or stayed the same with volume reduction. Plasma free hemoglobin was slightly elevated prior to any manipulation and was increased with any manipulation of the RBC units, more so with volume reduction then washing. Osmolality was mildly elevated prior to any manipulation. It was about the same after volume reduction and decreased after washing. Lactic acid was elevated in the RBC units prior to washing and was significantly decreased after washing. Summary: Washing of the red cells, using the CATSmart Cell Saver by Fresenius Kabi, prior to major CVS in infants < 4 months of age, is safe as shown by this study.Washing might be somewhat better then volume reduction in providing a final red cell product with electrolyte concentrations close to the normal physiologic values.
TS71
Retrospective Analysis of Blood Product Utilization in Adult Hepatic Transplantation Surgeries Pre and Post Introduction of Intraoperative Thromboelastography
Alexander L. Braun*1, Scott Koepsell1, Sara Shunkwiler1 and Debra Brown2
1University of Nebraska Medical Center, 2Nebraska Medicine
Background/Case Studies: Hepatic transplantation was first performed in 1963, with the resultant death of the patient due to exsanguination. Since this time massive advances have been made in surgical techniques, anesthesia, transfusion medicine, and coagulation testing including the use of thromboelastography (TEG). In July of 2016 at our institution, TEG was moved from a standalone test run by operating room staff with paper resulting to the laboratory where results were available online in real time, which drastically increased the use of TEG. As a result, we examined intraoperative transfusion practices during hepatic transplantation over a period where TEG was rarely used compared to a period where TEG was consistently used.
Study Design/Method: Transfusion data was obtained on product utilization for 73 adult hepatic and hepatic combined transplants six months before and after TEG was moved to the laboratory with real time resulting. Product utilization was broken down by component type (packed red cells, plasma, platelets, and cryoprecipitate) and the usage of the components was compared for pre‐ and post‐ usage by two‐sample t‐test for unequal variances (Welch's test).
Results/Finding: There was no significant difference in pre‐ and post‐real time TEG usage for packed red cells (p = 0.06), plasma (p = 0.11), or platelets (p = 0.11). There was a significant difference in the usage of cryoprecipitate (p = 0.05). The mean units of cryoprecipitate used pre‐real time TEG was 3.17 and the mean units post‐ was1.89. Real time TEG was utilized in 50% of surgeries that used cryoprecipitate. There was also a significant difference in the ratio of units of packed red cells to plasma used (p = 0.03).
Conclusion: While there was no significant difference in the usage of packed red cells, plasma, or platelets, there was a trend in decreased usage of these products. Cryoprecipitate use was significantly reduced, as was the ratio of units of packed red cells to plasma used. These trends support the theory that clinicians are using real time TEGs to better guide product selection. The fact that p values for packed red cells, plasma, and platelets are close to significance leads us to consider expanding our data set for future quality purposes.
TS72
Prospective and Retrospective Adjudication of Appropriateness in Single Versus Multiple Unit Red Blood Cell Transfusions
Samuel Marleau1, Jacqueline Trudeau2, Kristine Roland1,3 and Andrew W.Y. Shih*1,3
1University of British Columbia, 2Vancouver General Hospital, 3Vancouver Coastal Health Authority
Background/Case Studies: Evidence for restrictive transfusion thresholds has prompted recommendations to order one red blood cell (RBC) unit at a time. Auditing may facilitate this practice and improve patient safety and RBC utilization by encouraging the avoidance of unnecessary transfusions. Retrospective auditing is labor‐intensive and relies on changing physician practice after the fact. Thus, we sought to perform a prospective audit without interfering with transfusion practice and subsequently perform a retrospective audit following transfusion to further refine appropriate screening criteria for transfusion.
Study Design/Method: Screening criteria for prospective auditing were developed, where patient transfusion episodes meeting these criteria were adjudicated as appropriate or inappropriate by a trained delegate (SM). At the time of transfusion, pre‐defined clinical information, including the indication for transfusion, was collected by chart review. In cases where there was insufficient information to adjudicate, a retrospective chart review was performed and appropriateness adjudicated by three physicians (AS, JT, KR). All RBC transfusions in an academic tertiary care center from July 10‐August 10, 2017 that did not occur in the operating room, intensive care unit, emergency room, or bone marrow transplantation ward were enrolled.
Results/Finding: 175 patients were enrolled, with 181 one‐unit and 121 two‐unit transfusions. Medical and surgical wards encompassed the most transfusions (n=132 and n=114 respectively), where inappropriate transfusions were observed (n=77; 58.3% and n=76; 66.6% respectively). Both had a significant number of two‐unit transfusions (n=51; 38.6% and n=49; 43.0%), where the majority were deemed inappropriate (n=41; 80.4% and n=40; 81.6%).
Retrospective chart review influenced adjudication most often in bleeding patients (Table). Transfusions for upcoming procedures were only generally appropriate when a single unit was ordered and hemoglobin levels were <8 g/dL.
Conclusion: Criteria for prospective screening were largely considered suitable even after further detail was gathered on retrospective review, with the potential exception of bleeding patients. We propose prospective screening of RBC transfusion is likely otherwise appropriate and medical/surgical wards may be initial targets for intervention.
TABLE Selected Prospective vs Retrospective Case Adjudications
| Pre‐transfusion hemoglobin (g/dL) and indication | Units Ordered | Prospective Adjudication (✓ = Appropriate, X = Inappropriate) | Retrospective Adjudication |
|---|---|---|---|
| ≥9 & bleeding (n=6) | 1 | X | ✓ (n=4) |
| 2 | X | X (n=2) | |
| <9 & bleeding (n=90) | 1 | ✓ | ✓ (n=32) X (n=18) |
| 2 | X | ✓ (n=24) X (n=16) | |
| ≥8 & procedure (n=9) | 1 | X | ✓ (n=1) X (n=2) |
| 2 | X | ✓ (n=1) X (n=5) | |
| <8 & procedure (n=5) | 1 | ✓ | ✓ (n=3) |
| 2 | X | X (n=2) |
TS73
Prolonged Hemolytic Disease of Fetus and Newborn Due to Anti‐D and/or Anti‐G
Thandar Aye1, Lay S. Er1, Samantha Harris1, Askale Haile1, Rosalind Armour1, Cecilia Canyas1, Jennifer Prigg1, Gayle Teramura1 and YanYun Wu*2
1Immunohematology & RBC Genomics Reference Laboratory, BloodworksNW, 2BloodworksNW
Background/Case Studies: The hemolytic disease of fetus and newborn (HDFN) caused by certain maternal IgG antibody to infant's red blood cell (RBC) antigen is well recognized and typically can be managed effectively with phototherapy, IVIG, transfusion and/or exchange transfusion. Here we report a case of prolonged HDN with a possible inhibition of hematopoiesis, despite intense phototherapy, IVIG, and multiple transfusions. The infant eventually responded to erythropoietin treatment.
Study Design/Method: All tests were performed by routine tube method using PEG, LISS, Saline or by use of IgG gel cards. Acid elution and EDTA‐Glycine acid treatment (EGA) of RBCs were also performed. Identification of anti‐D, anti‐C and/or anti‐G in maternal plasmawere performed by differential adsorption/elution using papain‐treated R2R2 and r’r adsorbing cells. Titration of anti‐D and/or anti‐G in mother's and infant's plasma is performed by use of R2R2 and r’r indicator cells. RHD genotyping of the newborn was performed using PCR‐RFLP and PCR‐SSP targeting exon 7, intron 4, the RHD pseudogene, and Rhesus box identity regions initially. Further evaluation by Sanger sequencing for RHD and RHCE exons 1‐10 was also done to determine the underlying RH genotype.
Results/Finding: The mother was G1P0, with a history of hepatitis and drug use. Middle Cerebral Artery Peak Systolic Velocity and antibody titer were performed throughout pregnancy and there was no indication of HDFN or fetal hydrops. Her blood type is A negative. Anti‐D and anti‐G were identified by differential adsorption/elution method. The last antibody titer was performed 50 days prior to delivery. Using R2R2 cells, plasma was reactive up to 1:2048 dilution and titer using r’r cells was 1:64.
The full term male infant was not visibly jaundiced or hydropic(Total Bili 5.9 mg/dL, Direct Bili 0.9 mg/dL) with Hct of 42%, but had an elevated retic count (9.7%) at birth. Peripheral blood smear showed marked polychromasia with increased nucleated RBCs. He was breast fed right after birth, but with poor feeding for many of the days. The infant blood type was A positive. D antigen typing was predicted by genomic testing due to serologic blocking of D antigen on cord cells (DAT anti‐IgG 4+).Genetic sequencing of RHD gene revealed the nucleotide substitution c.1136C>T, which is associated with RHD*DAU0 allele. Acid eluate prepared from the infant's RBC demonstrated anti‐G and anti‐D. Note that whole blood exchange was not performed due to venous access,care issues and the fact that bilirubin was only mildly elevated. The newborn's anemia was prolonged almost 9 weeks after birth. Severely decreased reticulocyte count (0.2%‐0.3%) was observed from 5 to 8 weeks after birth. It is interesting to note the mild initial presentation of HDFN, prolonged clinical course, as well as drastic decrease of retic count and rapid response to erythropoietin treatment.
Conclusion: Here we reported a clinical presentation of prolonged HDFN due to anti‐D and/or anti‐G. With the low retic count and positive DAT of reticulocytes, possible inhibition of hematopoiesis by passively transferred maternal antibody was suspected. Severely low reticulocyte count was not observed until 5 weeks after birth. Therefore, we also hypothesize that the coating of anti‐G may protect against severe hemolysis or inhibition of hematopoiesis by anti‐D at birth.
TS74
Please Don't Beg for O Neg
Jane Fischman*1, Alexandra Benedetto1, Nancy Nikolis1, Lennart Logdberg1, Alexander Indrikovs2, Vishesh Chhibber1 and Sherry Shariatmadar1
1North Shore University Hospital, 2Northwell Health
Background/Case Studies: Our Transfusion Service issues over 22,000 red blood cell (RBC) units each year, ten percent of which are group O negative. In November 2017 we revised and implemented our Emergency Release Policy to reflect situations when it is acceptable to give Rh positive blood to an Rh negative patient. In January 2018, as a Process Improvement (PI) initiative and result of a regional blood shortage, we implemented a process to track our O Negative RBC utilization in order to ensure appropriate usage and keep our inventory at acceptable levels.
Study Design/Method: The following processes were established:
-
‐
November 2017: Emergency Release Policy:
-
1.
Male patient age ≥ 18 or female age ≥ 55, with a historical type of Rh Positive, give Rh Positive.
-
2.
Male patient age ≥ 18 or female age ≥ 55, with historical type of Rh Negative (and no anti‐D), switch to Rh Positive if > 4 units ordered.
-
3.
Male patient age ≥ 18 or female age ≥ 55, with no historical type, give O Positive if > 2 units ordered.
-
4.
Male patient age ≤ 18 or female age ≤ 55, with no historical type, give O negative.
-
1.
-
‐
January 2018: Each day a Technical Specialist reviews and presents the following for discussion at the management meeting:
-
1.
O Negative RBC Inventory
-
2.
O Negative RBCs issued the previous day
-
3.
Units issued to O Negative patients or those with special instructions to give O Negative RBCs
-
4.
Units issued to non O Negative patients are investigated and technologist is counseled if necessary.
-
5.
O Negative RBCs in crossmatched status
-
6.
Units that are crossmatched on non O negative patients with no special instructions are removed from crossmatched status and the technologist is counseled.
-
7.
O Negative utilization data is recorded and monitored to track and trend reasons for issuing O Negative units to non‐O Negative patients and units that were saved from being issued.
-
1.
Results/Finding:
| Q1 2017 | Q1 2018 | 2017 vs. 2018 | |
|---|---|---|---|
| O Negative RBC Transfusions | 580 | 500 | ↓14% |
| # of Patients Received O Negative RBCs | 214 | 161 | ↓25% |
| # Issued to O Negative Patients | 274 | 340 | ↑45% |
| # of Patients Switched to O Positive | 0 | 3 | |
| # of Emergency Release O Negative Units | 78 | 50 | ↓36% |
| # of Emergency Release Patients | 34 | 34 |
Conclusion: Our dynamic processes of monitoring O negative usage has resulted in a reduction of overall O negative transfusions as well as a decrease in O negative RBCs issued to non O negative patients. Reduction of orders from our blood supplier has improved inventory management and overall efficiency of our transfusion service.
TS75
Transfusion Management of Conjoined Twins Undergoing Surgical Separation: A Single Center Experience with Three Sets of Thoraco‐Omphalopagus Twins over Ten Years
Hamilton Tsang*1, Calvin Kuan2, M. Gail Boltz3, Gary Hartman4, Rohan P. Joshi5, Anil Panigrahi6 and Jennifer Andrews5,7
1Department of Laboratory Medicine, University of Washington Transfusion Service, University of Washington School of Medicine, 2Department of Anesthesia, Stanford University School of Medicine, 3Pediatric Cardiac Anesthesia, Department of Anesthesia, Stanford University School of Medicine, 4Department of Surgery, Division of Pediatric Surgery, Stanford University School of Medicine and Lucile Packard Children's Hospital at Stanford, 5Department of Pathology, Stanford University School of Medicine, 6Stanford University School of Medicine, Department of Anesthesiology and Pathology, 7Department of Pediatrics, Division of Hematology/Oncology, Stanford University School of Medicine
Background/Case Studies: The birth of conjoined twins constitutes a rare congenital malformation, with an estimated incidence between 1:50,000–1:200,000 births 1. Conjoined twins usually present with complex anatomical conjunction, multiple congenital anomalies, and varying degrees of conjoined circulation, posing multiple challenges in transfusion and anesthetic management. This case series aims to summarize our experience in the transfusion management of three sets of conjoined twins undergoing separation surgery at a single institution.
Study Design/Method: Medical records of conjoined twins admitted to our hospital for surgical separation from 2007 to 2017 were retrospectively reviewed. Three sets of conjoined twins underwent surgical separation under general anesthesia. Preoperative evaluation was performed to determine the extent of anatomical conjunction and associated anomalies. Anesthesia was simultaneously induced in all conjoined twins. Blood usage was tracked through the anesthesia record and transfusion service laboratory information system.
Results/Finding: 3 sets of female twins were identified; 2 sets of twins were thoraco‐ompalopagus and 1 set of twins was thoraco‐omphalo‐ischiopagus. A multidisciplinary approach was used in the operative planning involving anesthesia, pediatric surgery, plastic surgery, radiology, transfusion medicine, operating room staff, biomedical engineering, nursing staff, and clinical care units. Intradepartmental anesthesia‐transfusion planning meetings involved the director of transfusion service, senior and junior transfusion medicine attending physicians, fellows, residents, laboratory manager, and staff supervisors. Based on transfusion‐anesthesia meetings, special needs of the blood components were typical for pediatric transfusion with modifications based on hemodynamic considerations and the potential for massive transfusion, i.e. leukoreduced, fresh, etc. All conjoined twins were successfully separated. Estimated blood loss ranged between 400 mL and 700 mL during separation and reconstruction with red blood cell transfusion ranging between 13 mL/kg and 30 mL/kg.
Conclusion: Complex anatomy related to risk of bleeding in conjoined twin separation manifests most commonly as communicating vasculature across twins, specific fused organs, or unclear anatomical structures on imaging. Besides having implications for anesthesia administration, the degree of shared circulation poses an inherent risk of mutual exsanguination should significant bleeding arise. Transfusion services should be consulted early in the preoperative period to optimize safest blood products and timely blood delivery in these complex high‐risk operations.
1. Mutchinick OM, et al. Conjoined twins: a worldwide collaborative epidemiological study of the International Clearinghouse for Birth Defects Surveillance and Research. Am J Med Genet C Semin Med Genet 2011;157C: 274‐87.
TS76
Extending the Storage of DTT Treated Reagent Cells in Alsever's Solution
Kimberly Squyars*1, Neil Bangs1, Steven Armstrong2 and Kimberly Sanford3
1VCU Health, 2VCU Health System, 3Virginia Commonwealth University
Background/Case Studies: Patients receiving anti‐CD38 drug therapy demonstrate panreactivity in serologic testing and require testing with dithiothreitol (DTT). The increased use of anti‐CD38 therapies requires maintaining DTT pretreated red blood cells (RBCs) available to expedite testing. Previous studies have demonstrated storage of DTT pretreated RBCs for up to nine days (Lally, et al. 2016, Transfusion 56:136A). Our study looked to extend the shelf life by storing the pretreated RBCs in Alserver's solution.
Study Design/Method: Reagent screening RBCs were treated with DTT at a ratio of 4:1. RBCs were incubated at 37 degrees Celsius for 30 minutes and washed three times with normal saline. Subsequently, the RBCs were washed one time with Alsever's Solution. After the final wash, RBCs were resuspended to 2‐4% in Alsever's Solution. The K positive cell was tested using K antisera to ensure the DTT treatment was effective. Baseline testing of the RBCs included testing for D,C,E,c,e,Jka,Jkb,Fya,Fyb,S, and s antigens, examining for hemolysis and testing with anti‐CD38 positive plasma to ensure the expected lack of reactivity. A control consisting of untreated screening RBCs was maintained for parallel testing. Hemolysis was graded using a predefined hemolysis table, ranging from 0‐3200. The antigen testing, observation for hemolysis and testing with anti‐CD38 positive plasma was repeated every four days. The storage end point was to be determined if any antigen had decreased reactivity by two or more grades, hemolysis reached 400, or anti‐CD38 plasma demonstrated positive reactivity.
Results/Finding: The antigens tested on day 16, maintained reaction strengths that were within one grade of testing on day 1. Slight hemolysis was first noted on day 8, however did not reach the cut off value during the study. The control RBCs demonstrated similar increase in hemolysis as the treated RBCs. Testing against anti‐CD38 positive plasma also remained consistent. The study was concluded on day 16 due to insufficient quantity of reagent RBCs for testing.
Conclusion: The study demonstrated that Alsever's solution preserves the integrity of the red cell and does not affect the reactivity of those RBCs in vitro. The study concluded that DTT treated RBCs suspended in Alsever's solution can be prepared and stored at 2‐8 degrees Celsius for at least two weeks without degradation. By having treated screening RBCs readily available, we have decreased our turnaround times for antibody identification.
TS77
Platelet and Plasma Preparation and Processing: Results from the 2017 AABB Neonatal and Pediatric Blood Bank Practices Survey
Hollie M. Reeves*1, Ryan Pyles2, Sarah K. Harm3, Erin Meyer4, Lani Lieberman5, Srijana Rajbhandary6, Gabriela E. Perez6, Barbee I. Whitaker6 and Meghan Delaney7
1University Hospitals Cleveland Medical Center, Department of Pathology, 2SSM Health Cardinal Glennon Children's Hospital, 3University of Vermont Medical Center, 4Nationwide Children's Hospital, 5University Health Network, 6AABB, 7Children's National Health System
Background/Case Studies: The 2017 AABB Neonatal and Pediatric Blood Bank Practices Survey was developed by the AABB Pediatric Transfusion Medicine Subsection Committee (PTMSCC) to capture the national variability in neonatal and pediatric blood bank practices. Here we report results from the analysis of questions pertaining to the preparation and processing of non‐RBC components.
Study Design/Method: The survey questionnaire was released through a web‐based survey platform (http://www.surveymonkey.com). Skip logic was utilized to capture platelet and plasma preparation and processing practices for neonatal and pediatric patients. Responses completed between April 2017 and January 2018 were analyzed. Descriptive statistics including frequencies and percentages were used to evaluate overall differences in practice among neonatal and pediatric patients.
Results/Finding: Thirty five centers completed the survey for a response rate of 15.8%. See Table for platelet special processing results. Twenty nine percent and 42% of centers allow ABO incompatible (ABOi) platelet transfusion to neonates and pediatric patients, respectively. Of the hospitals that provide ABOi platelets to neonates and pediatric patients, 50% titer ABO isoagglutinin levels and all use the tube method with saline (without enhancement). Of the hospitals that titer platelet products for pediatric patients, 3 hospitals define high titer as 50, two use 100, and two use 200. Group O apheresis platelet units represent the majority of platelet products that are tittered in both neonatal and pediatric patients. Only group AB plasma is selected for non‐urgent transfusion to neonates at 29% of centers and pediatric patients at 21% of centers. For non‐urgent transfusions, only one hospital reported permitting ABOi plasma transfusions to neonates and two hospitals reported ABOi plasma transfusions to pediatric patients. Of the hospitals that provide ABOi plasma to neonates and/or pediatric patients, all perform titers of ABO isoagglutinins using the tube method with saline (without enhancement) and use a high titer definition of 50.
TABLE Special Processing of Platelet Components
| Always provide | Neonatal Transfusions (n=35) | Pediatric Transfusions (n=33) |
|---|---|---|
| Leukocyte reduced platelets | 100% | 97% |
| CMV seronegative platelets | 34% | 6% |
| Irradiated platelets | 89% | 36% |
Conclusion: Preparation and processing practices for neonatal and non‐neonatal pediatric patient transfusion of platelets and plasma vary widely between hospitals. Specific recommendations from expert groups and/or clinical studies may aid in standardizing these practices.
TS78
Insulated Bio Transport Bag Enables Return of Blood Products into Inventory
Janet Dornfeld*, Eyob Girma and Camille Van Buskirk
Mayo Clinic
Background/Case Studies: Regulatory standards require that transported blood products stay within 1 to 10°C. Studies have demonstrated that products, when removed from refrigerated storage, do not maintain this transport standard for greater than17 to 20 minutes, on average. This can severely limit the time a unit can be issued and received back into inventory. The purpose of this study was to determine how long an Insulated Bio Transport bag would maintain product transport temperature, allowing for product return to inventory.
Study Design/Method: A process validation was designed using 30 RBCs and 30 FFP to determine time transport parameters of the Bio Transport bag. RBC and FFP units were removed from refrigerated storage with a temperature‐monitoring probe to record length of time the product stayed within 1 to 10°C. To simulate actual product transport conditions, units were taken to patient rooms and sent in our pneumatic tube system to multiple locations and left in place for the validation trials. The validation trials for RBC products were run for at least 90 minutes and FFP products for at least 40 minutes. The ambient temperature for the locations was also recorded. The temperature recorder was set to read temperature measurements at one‐minute intervals.
Results/Finding: The table below reports the estimates of Bio Transport bag parameters. For RBCs, the median (range) time that the units stayed within 1 to 10°C was 54 minutes (35 to 110). During transport, the median (range) high ambient temperature was 22.6°C (20.3 to 26.2).
For FFP, at 35 minutes after removal from the refrigerator, the median (range) product temperature was 7.1°C (5.3 to 8.8). The median (range) high ambient temperature during this study was 22.5°C (20.8 to 24.2).
Conclusion: These finding demonstrated that the Bio Transport bag prolonged product viability. It was concluded that using the Bio Transport bag, RBCs and FFP could be returned to inventory if the return time was 35 minutes or less. If a unit is returned after this time limit, the temperature of the unit is taken to determine acceptability for return to inventory.
(TS78)
| Variables | Number | Mean | Std. Dev. | Median | Min. | Max. |
|---|---|---|---|---|---|---|
| RBC Time (minutes) | 30 | 56.7 | 16.36 | 54 | 35 | 110 |
| FFP Temp (°C) | 30 | 6.96 | 0.83 | 7.05 | 5.3 | 8.8 |
| Ambient High Temp RBC | 30 | 22.7 | 1.23 | 22.6 | 20.3 | 26.2 |
| Ambient High Temp FFP | 30 | 22.5 | 1.01 | 22.5 | 20.8 | 24.2 |
TS79
Multi‐Center Collaborative Study on Antigen‐Positive Red Blood Cell (RBC) Transfusion for the Patients Who Have Irregular RBC Antibodies
Chiaki Yamada*1, Akihiro Takeshita1, Kenji Tadokoro2, Hitoshi Ohto3, Hiroko Watanabe1, Kinuyo Kawabata3, Yuriko Nomaguchi4, Kouki Sobue5, Yasue Haraguchi6 and Misao Abe7
1Hamamatsu University School of Medicine, 2The Japanese Red Cross Society, 3Fukushima Medical University, 4Fukuoka University, 5Toho University, 6Kagoshima University, 7Kansai Medical University
Background/Case Studies: Allo‐immunization to red blood cells (RBCs) has been an important issue in blood transfusions. The specificity and clinical significance in each antibody have been reported (Fung MK, et al, 2017). However, the frequency and severity of transfusion related adverse reactions, caused by receiving antigen (Ag)‐positive RBCs, have not been well elucidated.
Study Design/Method: The survey items included back grounds of the patient, Ags included in RBC transfusion, total units of Ag‐positive RBC transfusion, results of screening and direct anti‐globulin test (DAT), specificity of antibodies, adverse reactions and efficacies. RBC Ags were analyzed in the Japanese Red Cross Society. All antibody was surveyed regardless of the clinical significance. The protocol was reviewed and approved by the institutional review board of our university (E14‐210) and each participating institution.
Results/Finding: From November 2011 to March 2018, 429,861 units of RBCs were transfused to 54,638 cases from 45 institutions in Japan, in which 7,638 units of Ag‐positive RBCs were transfused to 786 cases (male / female: 418 / 368). Non‐specific auto‐antibody was determined in 24%, anti‐Lea 18%, cold‐antibody 17%, anti‐P1 9% and anti‐E 9% (Table 1). The most frequent reason for Ag‐positive RBC transfusion was ‘negative for indirect anti‐globulin test (IAT)’ (41%), followed by ‘detection of non‐specific auto‐antibody’ (26%), and ‘lack of time for preparing Ag‐negative RBCs’ (2%) (Table 1). Clinically apparent hemolysis was observed in 4 cases (1%). Two were positive for anti‐Jra, one each for anti‐E+anti‐Dib and anti‐E. Ninety‐nine (13%) of 765 cases without adverse effects had the clinically significant antibodies, such as anti‐E (30%), anti‐Lea (19%) and anti‐Jka (10%).
Conclusion: This is the first multi‐center collaborative study on backgrounds, reactions and outcome of Ag‐positive RBC transfusion. These data will be helpful for the patients who have irregular antibodies to RBC antigens.
TABLE 1 A. The frequency of each antibody detected from the patients who received Ag‐positive RBCs B. The reasons of Ag‐positive RBC transfusion
| A. | |
|---|---|
| Antibodies | Number of cases (frequency, %) |
| Non‐specific auto‐antibody | 217 (24%) |
| Anti‐Lea | 159 (18%) |
| Cold‐antibody | 155 (17%) |
| Anti‐E | 77 (8%) |
| Anti‐P1 | 77 (8%) |
| Others | 225 (25%) |
| B. | |
|---|---|
| Reasons | Number of cases (frequency, %) |
| Negative for IAT | 335 (41%) |
| Detection of non‐specific auto‐antibody | 209 (26%) |
| Lack of time for preparing Ag‐negative RBCs | 19 (2%) |
| Negative in the screening test | 16 (2%) |
| Critical situation | 11 (1%) |
| Others | 224 (28%) |
TS80
Two Effective Changes to the Massive Transfusion Protocol in a Level 1 Trauma Center
Kristin Flynn*1, Amy Mata2, RaeAnne Stensgard1 and Camille Van Buskirk2
1Mayo Clinic Rochester, 2Mayo Clinic
Background/Case Studies: The Massive Transfusion Protocol (MTP) has been an essential process in this Level 1 Trauma Center since it implemented in 2008. This pull‐based model consisted of packs with 6 Red Blood Cells (RBC), 6 Fresh Frozen Plasma (FFP), and 1 Platelet (PLT) with Cryoprecipitate (CRYO) upon request with different issue options based on the clinical situation.
Periodic review identified areas of improvement and led to two distinct process changes in 2017. The initial change (May) required the first pack to be uncrossmatched products (O negative RBC's, A FFP, and an Rh negative PLT) issued on prepared backup issue forms. This ‘Backup Pack’ evolved from the pre‐made pack previously used for Codes.
The second change (September) reduced MTP pack size for all services from 6 RBC's, 6 FFP, and 1 PLT (6:6:1) to 4 RBC's, 4 FFP, and 1 PLT (4:4:1). This was in response to a review of 2015 MTP's showing that only 47% of cases used the equivalent of 1 pack (or more) within 24 hours.
Study Design/Method: Excel was used to analyze the data collected from the Laboratory Information System (LIS) and backup issue forms from September 2016 to March 2018 (n=289). The start time was the first record of the order or issue of the first pack, whichever came first. The products transfused were counted and classified based on the packs needed to provide the number of RBC's and FFP transfused within 24 hours. In addition, a concurrent manual record was used by techs after each process change to confirm O negative RBC inventory and MTP events.
Results/Finding: The Backup Pack caused the expected decline in O negative RBC inventory as well as a re‐evaluation of suitable products (i.e. irradiated) and a resulting increase in donor collections. Turn‐around time (TAT) in the lab was essentially eliminated for the first pack.
There was no increase in the total number of products used with the reduced pack size, but rather a slightly different distribution pattern of usage over time (See Table). The majority (53%) still used 1 pack or less.
In addition to reducing TAT, the uncrossmatched status of the first round led to productive discussions between lab technologists, residents, and physicians. When a physician preferred to wait rather than take uncrossmatched, it allowed time for discussion about the most suitable protocol.
Conclusion: In conclusion, the review process put into place at this Level 1 Trauma Center allowed for proposal and monitoring of two effective MTP protocol changes. The main effects of the Backup Pack implementation were on RBC inventory, lab TAT, and productive discussions. While a number of MTP's used more packs after the reduction in pack size, the overall picture did not differ. Greater than half (53%) of MTP's used only the initial pack whether the pack was large (6:6:1) or small (4:4:1). The greatest effect was on the lab with an increased availability of products during and after an MTP.
TABLE 1 (TS80) Effect of Change in MTP Pack Size*
| 1 Pack | 2 Packs | 3 Packs | 4 Packs | ≥5 Packs | Average RBC Used | Average FFP Used | |
|---|---|---|---|---|---|---|---|
| Before (Pack: 6:6:1) n=177 | 66% | 19% | 5% | 3% | 6% | 7 | 5 |
| After (Pack: 4:4:1) n=112 | 53% | 21% | 12% | 6% | 8% | 7 | 4 |
*Based on RBC's and FFP transfused ≤ 24 hours from MTP activation
TS81
Making Blood Available ‘Just‐in‐Time’ – Eliminating Supply Chain Complexities and Improving Efficiencies
Lorraine Wyne*, Tahani Sayyad and Richard Hairston
MedStar Washington Hospital Center
Background/Case Studies: We implemented BloodTrack OnDemand with HaemoBank ‘smart blood dispensing’ devices (Haemonetics, Braintree, MA) to improve our overall process for managing the blood supply to the operating room (OR) suite, increase blood availability, reduce hand‐off risks and decrease waste.
Study Design/Method: An assessment of our current OR blood supply chain revealed a complex process with anywhere from 20 to 34 steps to get blood from the blood bank to a patient in the OR suite, several areas for handoff failures and typical transport times of 30 minutes to as long as 60 minutes in some instances. Blood units, received but not needed for immediate transfusion, were stored in unlocked refrigerators in the OR Core. Units for multiple patients were stored in the same refrigerator –including units for those patients who were no longer in the OR–with no mechanical barrier in place to prevent removing the wrong unit. Additionally, there was no effective way to control access to refrigerators, monitor temperature or maintain traceability.
Results/Finding: We went live in July 2013 with BloodTrack OnDemand using a HaemoBank device in our 20‐room OR, post‐anesthesia care unit (PACU) and cardiovascular recovery room (CVRR). The table below summarizes the results. Supply chain complexities were reduced, eliminating 22 steps. Blood availability in the procedure room is now < 5 minutes– an 83% faster delivery time –without requiring OR staff to leave the inner OR core. Blood wastage, which was previously 5.4% of units issued to the OR, decreased by 78% to 1.1%, saving approximately $90,000 annually. These efficiencies enabled the blood bank to reposition staff and eliminate 1.0FTEs. Blood bank workload related to preparing, packaging and transporting blood products – and tracking down missing or delayed units – has been significantly reduced. In 2017, a second HaemoBank was installed in a new CVRR/ICU unit. With this addition, the average number of units dispensed from a controlled remote dispensing device increased from 14% to 25% of total red cell usage. Lastly, and most importantly for our patient safety, BloodTrack electronically captures and records blood product movements and verifies that the right blood is removed for the right patient.
| Before BloodTrack | Using BloodTrack | Improvement | |
|---|---|---|---|
| Hand‐off steps | 34 | 12 | 22 fewer steps |
| Transport time | 30 min ave | <5 min | 83% faster delivery time |
| Labor | 19.9 FTEs | 18.9 FTEs | ($82,000) |
| Wastage | 38 units/mo | 8 units/mo | ($90,000) |
| $172,000 Total annual savings | |||
Conclusion: Implementing BloodTrack OnDemand with HaemoBank devices to manage blood product allocation for the hospital's OR, PACU and CVRR has significantly streamlined the hospital's processes, eliminating hand‐off risks, improving availability and reducing costs.
TS82
Effect of Riboflavin and Ultraviolet Light Pathogen Reduction Treatment on Blood Type Testing Using the Gel Column Agglutination Method
Suzann Doane*, Susan Yonemura, Ozus Lohani and Susanne Marschner
Terumo BCT
Background/Case Studies: A pathogen reduction device that uses riboflavin and ultraviolet light (R+UV) to reduce the potential infectious pathogen load and to inactivate white blood cells (WBC) in whole blood (WB) products intended for transfusion is in development. Several substances have been shown to interfere with ABO blood group testing due to patient sera reactivity to non‐blood group agglutinins such as acriflavin (dye used in anti‐B typing serum), neomycin (antibiotic), and some monoclonal antibodies (daratumumab) used in immunotherapy, to name just a few. One step in the development process for R+UV leukoreduced red blood cells (R+UV LR‐RBC) was to ensure that riboflavin or any other elements of the treatment process would not alter or otherwise interfere with blood type antigen testing. There are various manual and automated blood group typing methods employed in the U.S. One of the more common methods (automated and manual) is the gel column agglutination (GCA) method. This study evaluated the use of GCA for testing the blood type and Rh factor of RBC from untreated WB, R+UV treated WB (R+UV WB) and R+UV LR‐RBC.
Study Design/Method: Ten (10) units of WB of various blood types (A, B, AB, and O) were collected in citrate phosphate dextrose (CPD) anticoagulant in 450 mL collection sets and treated with R+UV. Samples were taken from each unit prior to R+UV treatment (untreated WB), following treatment (R+UV WB), and after component separation (R+UV LR‐RBC) to confirm blood type using the Ortho‐Clinical ID‐Micro Typing System™ (ID‐MTS™) Gel Column Agglutination Technology and MTS™ A/B/D Monoclonal and Reverse Grouping cards. Samples were tested for blood type, with additional unit characterization via cell quality measurements.
Results/Finding: On the day of processing, all unit blood types and Rh factors matched those recorded by the collecting blood center, with no changes observed after R+UV light treatment or as R+UV LR‐RBC. Cell quality parameters were in the expected ranges for R+UV‐light‐treated WB based on historical data, with key parameters of pH well above and % hemolysis well below the required values of >6.2 and <1%, respectively.
Conclusion: Pathogen reduction using R+UV light did not interfere with A, B, AB or O blood types or Rh factor of RBC from treated WB or R+UV LR‐RBC when tested with a common GCA testing system.
TS83
Frequency of Patient Diagnosis Categories and Neutropenia in Reported Cases of Septic Transfusion Reactions
Faisal Huq‐Ronny*1, Beth A. Dy2 and P. Dayand Borge2
1Thomas Jefferson University Hospital, 2American Red Cross
Background/Case Studies: Septic transfusion reactions can occur in any patient transfused with a contaminated blood product. However, in some patients exposed to a contaminated unit, they exhibit no signs of a reaction while in others the reaction is severe. The overall clinical circumstances of a patient exposed to a contaminated unit may affect the likelihood of a reaction. In this study, we assessed the incidence of patient diagnoses and the presence of neutropenia in septic transfusion reaction cases.
Study Design/Method: We reviewed all highly probably/definite septic transfusion reactions reported to the American Red Cross from January 2012 to December 2016. The clinical diagnoses of the patients were recorded and the patients were categorized as follows: hematologic malignancy (including transplants), aplastic anemia/pancytopenia (including transplants), solid organ transplant, other hematologic condition, non‐hematologic cancer, cardiac/cardiovascular condition, infection, obstetric/gynecologic condition, accident/trauma, renal failure. The patients’ neutrophil count statuses were recorded as definite, likely (not specifically recorded but likely given other clinical factors in the patient's history/record), and possible (based on clinical diagnosis).
Results/Finding: Of the 49 cases reported, 24 (49%) occurred in patients with hematologic malignancy (21 cases, 42.9%) and aplastic anemia (3 cases, 6.1%). Neutropenia was present as definite, likely, or possible in 14 (28.6%), 5 (10.2%), and 9 (18.4%) of all cases respectively. The percent incidence of definite/likely neutropenia or definite/likely/possible neutropenia in all cases was 38.8% and 57.1% respectively. 12 (85.7%) of the cases with definite neutropenia were in the hematologic malignancy and aplastic anemia combined categories and in those combined categories, 50% of the cases were in patients with neutropenia. In the same combined group, definite/likely neutropenia was present in 16 cases (66.7%) and definite/likely/possible neutropenia was present in all 24 cases (100%).
Conclusion: Among the reported septic transfusion reaction cases, patients with hematologic malignancies or aplastic anemia are more common than those with other diagnoses. Neutropenia or risk for neutropenia is also more common in these groups that have had septic transfusion reactions. These findings may be due to the frequency of blood product transfusion in these groups, but other causes may be present. Further clinical assessment is warranted.
(TS83)
| Diagnosis Category | # of Cases | Definite | Neutropenia Likely | Possible |
|---|---|---|---|---|
| Hematologic Malignancy (including transplants) | 21 | 9 | 4 | 8 |
| Aplastic Anemia/Pancytopenia (including transplants) | 3 | 3 | 0 | 0 |
| Solid Organ Transplant | 2 | 1 | 0 | 0 |
| Other Hematologic Condition | 5 | 0 | 0 | 0 |
| Non‐Hematologic Cancer (e.g. solid organ) | 4 | 0 | 1 | 1 |
| Cardiac/Cardiovascular Condition | 7 | 0 | 0 | 0 |
| Infection | 2 | 1 | 0 | 0 |
| OB/GYN | 2 | 0 | 0 | 0 |
| Accident/Trauma | 2 | 0 | 0 | 0 |
| Renal Failure | 1 | 0 | 0 | 0 |
| Totals | 49 | 14 | 5 | 9 |
TS84
Development of an Immediate‐Postnatal Neonatal Transfusion Protocol
Richard Morris*, Amna Iftikhar, Heidi Taylor, Mohamed Alsammak and Edward J. Yoon
Temple University Hospital
Background/Case Studies: Emergent neonatal transfusions are fraught with challenges. The blood bank (BB) and neonatology services must provide blood in a timely manner while simultaneously adhering to proper blood banking standards and navigating hospital processes and information systems. As they can occur outside of the controlled setting of a neonatal ICU, neonatal transfusion immediately following birth poses its own unique challenges. We describe here our institution's experience in developing a protocol for these particularly difficult scenarios.
Study Design/Method: The need for an inter‐departmental protocol addressing immediate‐postnatal red blood cell (RBC) transfusions was recognized, specifically in the settings of the delivery room, operating room, and emergency department. Key stakeholders included: BB, neonatology, nursing, emergency, hospital admission/registration, laboratory information systems, and information technology services. Challenges to be addressed involved: 1.) unique identification of an unborn patient, 2.) documenting transfusion for said patient in the immediate post‐natal period, 3.) efficient communication to BB, and 4.) rapid provision of unmodified, non‐crossmatched RBC units while adhering to regulations and standards set forth by the FDA and accrediting agencies. Through multiple meetings, a protocol was drafted to define the respective roles of the BB and neonatology services.
Results/Finding: After several revisions, the protocol outlined the following:
-
1.
Neonatology creates a pending neonatal admission profile in the electronic medical record with two unique identifiers assigned immediately.
-
2.
If transfusion is deemed necessary, neonatology telephones the blood bank for a “Code Baby Blood” – an unambiguous prompt for this emergent situation.
-
3.
BB is given the neonate's unique identifiers and a request for RBC under emergency release, read back for confirmation.
-
4.
BB issues one whole unit of additive solution packed RBC, group O, Rh‐negative, leukoreduced, hemoglobin S negative, non‐irradiated, freshest available.
-
5.
If not yet performed, BB performs maternal type and screen – a positive screen prompts immediate follow‐up testing of the issued unit.
Two timed simulations were conducted to identify areas for improvement. The first was completed in 13 minutes, and the second in 8 minutes.
Conclusion: A thoughtful protocol for immediate‐postnatal neonatal transfusion helps to streamline efforts and decrease confusion among caregivers in these situations. Our experience reflects one possible approach within the physical and logistic limitations of our institution. Future efforts will disseminate knowledge of this protocol to all potentially‐involved caregivers within the hospital.
TS85
Sex‐Mismatched Red Blood Cell Transfusions and Mortality: A Systematic Review and Meta‐Analysis
Michelle P. Zeller*1,2, Bram Rochwerg3, Christopher Hillis4,5, Ryan J.R. Runciman4, Shannon Lane4, Erin Jamula4, Na Li1, Donald M. Arnold1 and Nancy M. Heddle6
1McMaster Centre for Transfusion Research, 2Canadian Blood Services, 3Department of Medicine, Division of Critical Care, McMaster University, 4McMaster Centre for Transfusion Research, McMaster University, 5Department of Oncology, McMaster University, 6McMaster University
Background/Case Studies: Selection of a compatible red blood cell (RBC) unit does not include matching for donor sex. This systematic review and meta‐analysis aims to summarize the evidence examining the impact of sex‐mismatched RBC transfusion on recipient mortality.
Study Design/Method: Ovid MEDLINE, Ovid EMBASE, CINAHL, PubMed, Web of Science, and the Cochrane Database of Systematic Reviews were searched up to January 12, 2018 to identify randomized control trials (RCTs) and observational studies examining the impact of donor sex on recipient outcomes. A meta‐analysis was conducted on eligible studies and generated pooled hazard ratios (HRs) using a random‐effects model. A three‐level meta‐analytic model was applied to emphasize the unknown dependence among the effect sizes. Prespecified analysis was done on the subgroup of cardiac surgery patients. Study quality was in duplicate using the ROBINS tool and certainty of the evidence for all outcomes was assessed using GRADE.
Results/Finding: Five retrospective observational studies (n = 86,737) were included, no RCTs were found. Sex‐mismatched RBC transfusions were associated with a higher risk of death compared with sex‐matched transfusions (pooled hazard ratio [HR] 1.13; 95% confidence interval [CI] 1.02‐1.24) (See Figure). In the subgroup of cardiovascular surgery (n = 57,712), there was no significant increase in mortality with sex‐mismatched transfusions (pooled HR 1.08; 95% CI 0.95‐1.22). The data were prone to confounding, selection bias and reporting bias. Certainty of the evidence was very low.
Figure (TS85) Three‐level meta‐analysis comparing recipient mortality outcomes in patients transfused sex‐matched compared to sex‐mismatched red blood cell transfusions across different study follow up periods.
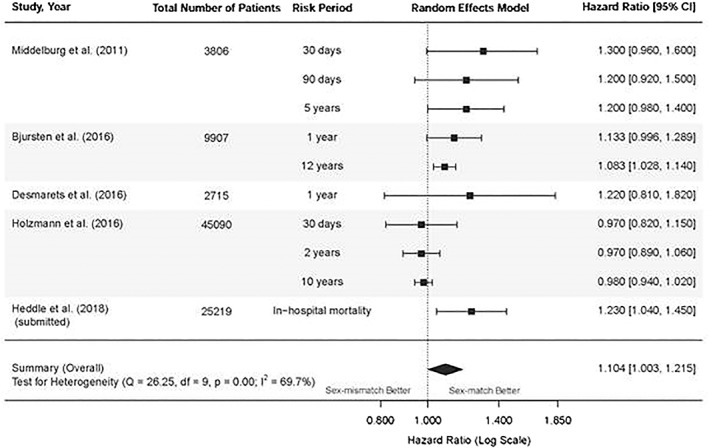
Conclusion: Sex‐mismatched RBC transfusions were associated with an increased risk of death in this pooled analysis. However, the certainty of the evidence was very low from observational studies. There is a pressing need to further study the impact of donor sex because of its potential widespread impact.
TS86
Analysis of Role of Absolute Immature Platelet Count in Platelet Count Recovery during Neonatal Transfusions
Kara L. Roncin*1,2, Hollie M. Reeves1,2 and Robert W. Maitta1,2
1University Hospitals Cleveland Medical Center, Department of Pathology, 2Case Western Reserve University, School of Medicine
Background/Case Studies: The role of immature platelets in transfusion increments has not been elucidated. Immature platelets in single donor platelet (SDP) have greater longevity and are more biologically active than their mature counterparts, and have been used as diagnostic markers in thrombocytopenic patients. In this study we looked at the absolute immature platelet counts in SDP units given to neonatal patients receiving multiple transfusions to determine if they affect platelet recovery/increment.
Study Design/Method: SDP units for neonatal patients were identified at the time of aliquot preparation. A total of 12 SDP transfused to 3 patients (4 SDP/patient) were identified over a one‐month period. A 1‐2 mL sample for A‐IPC measurement was collected from units at time of aliquot preparation. Samples were analyzed using an automated hematology analyzer for complete blood count (CBC) and percent immature platelet fraction (%‐IPF). A‐IPC was obtained by multiplying platelet count times %‐IPF. Percent platelet recovery (PPR) was obtained with formula: [post‐transfusion platelet count – pre‐transfusion platelet count]/[(unit platelet count × splenic factor)/(total blood volume (TBV))], where splenic factor is 0.67 and TBV was body weight times 100 mL/kg for < 37 weeks estimated gestational age (EGA) or 85 mL/kg for > 37 weeks. Post‐transfusion CBC were obtained within 24 hours.
Results/Finding: Of the 12 SDP transfused to 3 patients, SDP platelet count (×109/L) of 822 ± 418, %‐IPF of 1.75 ± 0.91%, A‐IPC (×109/L) of 18.10 ± 10.83, and PPR (%) of 972.57 ± 945.66 are shown in Table 1. %‐IPF did not appear to correlate with platelet increment and instead the A‐IPC indicated that A‐IPC of 13‐20 × 109/L lead to approximately 40% improvement in platelet count. Higher A‐IPC appear not to provide additional benefit which could be secondary to reduction in physiological capacity of higher numbers of immature platelets by irradiation.
(TS86)
| Patient 1 | Patient 2 | Patient 3 | |
|---|---|---|---|
| EGA [weeks, days] | 23.5 | 40.6 | 24.4 |
| Aliquot Volume [mL] | 14.50 ± 1.66 | 47.00 ± 5.00 | 13.75 ± 5.76 |
| # Aliquots Transfused | 4 | 4 | 4 |
| SDP Unit | |||
| Platelet [×109/L] | 1098 ± 290 | 870 ± 44 | 1141 ± 183 |
| %‐IPF [%] | 1.43 ± 0.86 | 2.28 ± 0.86 | 2.53 ± 0.82 |
| A‐IPC [×109/L] | 13.30 ± 4.22 | 20.16 ± 8.67 | 30.22 ± 12.86 |
| Patient | |||
| Pre‐transfusion Platelet [x109/L] | 83 ± 17 | 52 ± 23 | 67 ± 23 |
| Post‐transfusion platelet [x109/L] | 152 ± 27 | 85 ± 12 | 82 ± 47 |
| PPR [%] | 837.64 ± 566.32 | 2444.83 ± 642.21 | 159.49 ± 392.59 |
Table 1: Comparison of A‐IPC and PPR in SDP Aliquot Transfusions for 3 Neonatal Patients. All values, except where noted, are mean ± SD. SD: standard deviation, EGA: estimated gestational age, SDP: single donor platelet, %‐IPF: percent immature platelet fraction, A‐IPC: absolute immature platelet count, PPR: percent platelet recovery.
Conclusion: There may be a trend towards higher count recovery in the presence of higher A‐IPC. Higher number of patients will determine if these trends become statistically significant and if the potential benefit of higher A‐IPC content of a unit is affected by irradiation of SDP units destined for neonatal transfusion.
TS87
False Positive Kleihauer‐Betke Acid Elution Test and Unnecessary Administration of Rh Immune Globulin
Swathi Ratkal*1, Sonia Kamanda1, Rakijah Galloway‐Haskins1, Nancy Nikolis1, Arline Stein1, Lennart Logdberg1, Vishesh Chhibber1, Alexander Indrikovs2 and Sherry Shariatmadar1
1North Shore University Hospital, 2Northwell Health
Background/Case Studies: Rh prophylaxis has led to a significant reduction in the incidence of Rh hemolytic disease of the fetus and newborn. Many facilities perform the Kleihauer‐Betke acid elution (KB) test to assess for fetomaternal hemorrhage (FMH) and to determine the dose of Rh Immune globulin (RhIg). Overestimation of FMH is a known limitation of KB test. Here we describe a case of a woman with a significantly elevated KB test result that led to the administration of a large amount of RhIg inappropriately. This case illustrates the importance of careful clinical evaluation and correlation with laboratory test results in order to provide the best care for obstetrical patients.
Study Design/Method: A 35 year old group A, RhD‐negative woman in her 2nd pregnancy received a dose of RhIg at 28 weeks of gestation. She gave birth to a healthy group A, RhD‐positive male baby via normal spontaneous vaginal delivery at 40 weeks of gestation following an uneventful pregnancy. Eight vials of RhIg were administered to the mother postpartum after KB test revealed 5% fetal erythrocytes in maternal blood corresponding to estimated FMH of 240 mL. The KB test result and RhIg requirements was evaluated further at our daily management meeting where it was determined to perform further investigation.
Results/Finding: The neonate clinical status was reviewed indicating no evidence of neonatal distress. The lack of correlation between the clinical picture and lab results triggered further laboratory investigation. Although a repeat of KB test was persistently elevated, a negative rosette test subsequently confirmed disparity in the calculated FMH suggesting the possibility of secondary causes of elevated HbF in maternal serum. Hgb electrophoresis revealed HbF of 2.3% before and 2.0% after delivery suggestive of elevation of maternal F cells during pregnancy or hereditary persistence of fetal hemoglobin (HPFH). Other hematological parameters were normal making the probability of maternal thalassemia minor or other hemoglobinopathies less likely.
Conclusion: This case highlights the need for real time clinical correlation of patients with positive KB test results. This is especially important for patients with high volumes of estimated FMH based on results of the KB test. If the clinical picture is not consistent with a high volume of FMH, additional investigation must be performed in order to prevent unnecessary RhIg administration.
TS88
Improving Turnaround Time for Issue of Urgent RBC in a Tertiary Hospital Blood Transfusion Centre
Liting Yang*, Joanne Lee, Karen Lim, Susan Lim, Lip Kun Tan and Shir Ying Lee
National University Hospital, Singapore
Background/Case Studies: Timely delivery of blood during emergency is crucial in life‐saving efforts. Despite turnaround time (TAT) being a key performance indicator of transfusion services, there is no established benchmark. We aim to describe the impact of interventions for request of urgent RBC (URBC) to improve TAT.
Study Design/Method: We monitored TAT for URBC transfusions prospectively from Dec 2014 to 2017. TAT was targeted as 15 min and defined as time taken from urgent request to URBC issue. This included unmatched (UX), rapid‐ (RX) and routine‐matched (RO) RBC. Patients requiring AHG crossmatch (XM) and/or RBC for standby were excluded. Cases with prolonged TAT were investigated and reasons for delay documented. Interventions implemented in Feb 2015 included: (1) new standardised protocol for ordering urgent blood via telephone, (2) poster aids with clear simple instructions and reminders to relay urgency of request using keywords like ‘urgent’ and ‘now’, (3) creating a dedicated extension line for urgent orders only, (4) initiation of requests by a single doctor or nurse (only for Emergency (EMD)/OT/O&G) at any one time to prevent confusion. Prior to this, blood bank would receive requests where urgency was not indicated and/or multiple calls received for a single patient.
Results/Finding: Over 3 years, 4403 RBC were issued in response to 2402 requests for URBC transfusions from OT (70.82%), EMD (15.74%), ICU (7.95%), wards (3.96%), Paediatrics (0.87%) and other locations (0.67%). Pre‐ and post‐implementation, the mean TAT of UX, RX and RO URBC was 4 and 5.6 min, 10 and 9.6 min, and 17.5 and 6.8 min respectively. Pending likely receipt of a type and screen (T&S) sample prior to XM contributed to overall longer TAT for RX URBC. All mean TAT were less than 15 min except for pre‐implementation RO URBC. TAT for RO URBC was significantly shortened by 61% post‐implementation, hence faster URBC delivery. Before interventions, 88.9%, 78.1% and 52.1% of UX, RX and RO URBC met the target TAT. Post‐implementation, the target achievement rate was 75.6% for UX, maintained at 78.7% for RX and was greatly improved to 87.4% for RO URBC (Chi‐square test p < 0.001). There was a 19.9% improvement in the overall TAT for all URBC issued. This likely resulted from greater awareness and familiarity in the new workflow among laboratory and clinical staff. Despite efforts, delayed courier collection remained the main reason for delay (Lee, 2017). Others included invalid T&S samples for RX URBC requests (22.1%) and laboratory‐related issues, like manpower shortage (10%) (Ramanathan, 2017).
Conclusion: Through a well‐defined workflow and an internal benchmark, we demonstrated improvements in efficiency and target TAT compliance for RX and RO URBC by 0.6% and 35.3% respectively. Continuous monitoring and evaluation will help improve if not maintain a good minimal TAT for URBC issuance.
TS89
Electronic Remote Blood Issue (ERBI) Supports the Efficient Supply of Blood and Reduces Costs; Evidence from 5 Hospitals at Different Stages of Implementation
Sophie Staples*1, Julie Staves1, Jennifer Davies2, Nicola Polley3, Joan S. Boyd4, Mike Lukas5, Mark A. Popovsky5, Steven M. Frank6, Paul M. Ness6 and Michael Murphy7
1Oxford University Hospitals NHS Foundation Trust, 2Royal Devon and Exeter NHS Foundation Trust, 3Glan Clwyd Hospital (Betsi Cadwaladr University Health Board), 4Johns Hopkins Hospital, 5Haemonetics Corporation, 6Johns Hopkins Medical Institutions, 7NHS Blood and Transplant
Background/Case Studies: Electronic issue (EI) has been shown to improve the efficiency of hospital blood banks and provides the ability for blood banks to respond quickly to urgent requests for patients with a known blood group and recent negative antibody screen. This study evaluated the extension of EI to allow the release of blood in 2 ways: 1) away from the blood bank, close to the patient ‐ utilizing the electronic remote blood issue (ERBI) a networked electronic remote blood release system, and 2) where blood bank staff issue blood using the same ERBI process but at a blood refrigerator in the blood bank.
Study Design/Method: Of the 5 study sites (4 in UK and 1 in USA), 3 sites performed ERBI at blood refrigerators remote from the blood bank and 2 at blood refrigerator in the blood bank.
Retrospective data were collected from the ERBI software databases and each blood bank laboratory information system (LIS). Prospective ‘time and motion’ study data collection methods were used to determine the blood bank and clinical staff time for each step of the blood issue processes for a unit of red blood cells.
Results/Finding: ERBI from remote blood refrigerators (Table 1)
• The time taken for blood units to reach the clinical area was reduced in 3 hospitals using ERBI at remote blood refrigerators.
• Blood bank staff time was not increased for ERBI blood.
• Blood bank efficiency was improved. The issue:transfusion (IT) ratio was lower for blood units obtained from the ERBI refrigerators when compared to EI from the blood bank.
The staff cost of performing ERBI was reduced when compared to non‐ERBI at all 3 sites; the median reduction was $1.65 (range $1.08‐$2.09) per unit.
• ERBI from blood refrigerators in the blood bank (Table 1)
• The time taken for clinical staff to obtain blood was not reduced with ERBI at a blood refrigerator in the blood bank but blood bank staff time to perform an ERBI was reduced compared to EI performed in the blood bank: median 240 (range 180‐300) seconds/unit.
• There was a mean increase in cost per blood unit for ERBI by clinical staff at these refrigerators of $0.19 (range $0.16‐$0.21) per blood unit.
Conclusion: ERBI at remote refrigerators improves the efficiency of transfusion by reducing the time taken for blood units to reach patients, clinical and blood bank staff time, and costs. The same benefits are not realized with ERBI from a blood refrigerator in the blood bank except that the time involved is shifted from blood bank to clinical staff collecting the blood.
TABLE 1 (TS89) Summary of results from ERBI refrigerator and blood bank staff issue (All data are given as median (range))
| ERBI | Blood bank issue (EI) | |
| ERBI from remote blood refrigerators | ||
| Time to reach clinical area (seconds) | 78 (30‐79) | 355 (240‐466) |
| Blood bank staff time (sec/unit) | 300 (154‐300) | 303 (302‐378) |
| Issue:Transfusion Ratio | 1.06 (1.02‐1.09) | 1.57 (1.48‐1.58) |
| Staff costs ($/unit) | 2.23 (1.42‐2.96) | 3.51 (3.31‐4.61) |
| ERBI from blood refrigerators in the blood bank | ||
| ERBI | Blood bank staff performing ERBI | |
| Blood bank staff time maintaining stock (sec/unit) | 130 (79‐180) | 130 (79‐180) |
| Blood bank staff time performing ERBI | 0 | 47 (44‐50) |
| Non blood bank staff time (sec/trip) | 265 (236 ‐ 294) | 236 (196 ‐ 275) |
| Issue:Transfusion Ratio | 1.24 (1.23‐1.25) | 1.24 (1.23‐1.25) |
| Blood cost ($/unit) | 1.73 (1.16‐2.30) | 1.55 (1.00‐2.09) |
TS90
Major Hemorrhage Protocol Activation Profile and Blood Product Use in a Tertiary University Hospital
Sarah Darcy*, Julie McCabe, Deirdre Gough, Ciara Finucane, Cian McEllistrim, Anne Marie McCann, Eibhlin Conneally and Diarmaid O'Donghaile
St. James's Hospital
Background/Case Studies: Major Hemorrhage Protocols (MHP) can provide a timely, coordinated delivery of blood products for the bleeding patient. Evidence from military and civilian trauma studies advocate a ratio based transfusion protocol approach, which is now widely adopted by hospitals treating patients with diverse bleeding etiologies. This study investigates the success of a MHP in a tertiary university hospital in achieving these aims, including blood product wastage where the sole plasma product is frozen Solvent Detergent (SD) plasma.
Study Design/Method: A retrospective analysis of MHP activations over 4 years (2014‐2017) was performed. Data was collected using the hospital laboratory information system and electronic patient record database, to determine the number, location, clinical indication of the MHP activation, and evidence of blood product wastage.
Results/Finding: One hundred and forty one MHP activations (male, 67%) occurred. Seventy two (51%) occurred in the Emergency Room (ER), 33 (23%) in the Operating Room (OR) and 16 (11%) in Intensive Care. Trauma accounted for just 34 (24%) activations. Gastrointestinal was the most common at 37 (26%) followed by vascular surgical bleeding events at 25 (18%). In 57% of cases emergency group O RhD negative red cells were used prior to MHP activation. When MHP was activated, pre‐specified blood packs were requested rather than individual components (off‐protocol) in 74% of cases. The median red cell:plasma ratio transfused was 3:2. Post activation delivery time of products varied by product type. Red cell and plasma median delivery times were 22 and 45 minutes respectively. Blood product wastage was significantly higher with plasma (18%) compared to red cells (2%). MHP activation analysis revealed plasma wastage in 46 of 141 (33%) activations. The majority occurred in the ER (plasma wastage, 29 of 46 (63%)) which also has the majority of MHP activations. In 14 of all 46 (30%) wastage cases death occurred prior to transfusion. Where ≤ 4 units of red cells were transfused, plasma was wasted in 25 of 46 (54%) cases.
Conclusion: This study demonstrates that trauma is not the most common cause of MHP in this tertiary center. When activated a relatively high red cell:plasma ratio is achieved. Plasma wastage is high and reflects a limited post thaw shelf life. Non protocol MHP activations and plasma wastage that occurs in low red cell transfusion events indicate the need for continuous education for staff involved in MHP activation. Future efforts to reduce plasma wastage would necessitate increased post thaw shelf life. This would require change in licensure or manufacture of alternative plasma product in this region.
TS91
Cutting the Cord on Specimen Labeling Errors in Labor & Delivery
Heather Toeppner*1, Jerry Squires1 and Michelle Sharp2
1Medical University of South Carolina, 2MUSC Health
Background/Case Studies: According to the College of American Pathologists (CAP), approximately 169,000 adverse events occur in U.S. hospitals annually due to specimen identification errors, with 55% of all ID errors resulting from labeling errors. Mislabeled specimens are associated in almost 35% of actual or near‐miss patient safety events and pose a serious concern in the Blood Bank (BB). From 2014‐2016, there were 29 cord blood specimen labeling errors identified as either mislabeled or unlabeled. In 2016, our organization implemented a second independent sample requirement for ABO blood group verification. While this collection process improved outcomes with type & screen specimens, cord blood specimen collections in the Labor & Delivery (L&D) unit continued to demonstrate inconsistencies in labeling practices. A performance improvement initiative was identified by BB and the Transfusion Stewardship Officer.
Study Design/Method: Standard of practice in obstetrical units is for cord blood samples to be collected from the newborn at delivery of all group O and/or Rh negative mothers. L&D is a unique environment in that when a pregnant patient delivers a newborn(s) there are 2 or more patients present in one hospital room which increases the risk of specimen labeling errors. In an attempt to improve the collection and labeling process, a Cord Blood Collection Kit was piloted in June 2016. This prepared collection kit was kept in the patient's room and contained a clear storage bag, a 2mL specimen tube with a neon green advisory label “CORD BLOOD USE ONLY” and a red bio‐hazard bag for delivery.
Results/Finding: Cord Blood Collection Kits were piloted for 90 days in June 2016 in 9 inpatient rooms of L&D. This 3‐month trial resulted in a 93% decrease of cord blood specimen labeling errors. Based on this outcome, L&D leadership agreed to the official adoption of the prepared collection kits for best practice purposes, which, in a 2‐year period, has demonstrated an almost 80% reduction in cord blood specimen labeling errors.
Conclusion: Prior to the implementation of the prepared collection kits, cord blood specimen collection and labeling practices within L&D were inconsistent and non‐compliant as evidenced by incidents reporting. After 6 months of prepared collection kit usage, L&D leadership recognized the marked decrease in specimen collection errors, the ease of use of the prepared kits, and the low cost of this intervention. These elements, together, contributed to the ongoing success within the department for improving cord blood specimen collection and labeling practices. Through the use of a prepared collection kit, cord blood specimen outcomes have had a positive and lasting impact on collection compliance and improved patient safety among a vulnerable patient population, the newborn infant.
TS92
De Novo Development of RBC Alloantibodies in a Pediatric Heart Failure Patient on a Left Ventricular Assist Device
Deborah Sesok‐Pizzini*1,2, Matthew J. O'Connor1,2, Pamala M. Blair1 and J. Wade William Gaynor1,2
1Children's Hospital of Philadelphia, 2University of Pennsylvania, Perelman School of Medicine
Background/Case Studies: Patients awaiting heart transplantation and receiving transfusions are at risk for developing anti‐human leukocyte antigen (HLA) antibodies which may impact the compatibility of a future organ. Ventricular assist devices (VADs) are used as bridges to transplantation and are known to be associated with increased HLA antibody production. Patients receiving transfusions may also be at risk for developing red blood cell (RBC) alloantibodies which can complicate finding compatible blood prior to the surgery. This case describes a patient with de novo development of red blood cell antibodies while on a HeartWare HVAD®, a continuous flow VAD device commonly used in adult and older pediatric patients.
Study Design/Method: A 11 year old male with a history of dilated cardiomyopathy and left ventricular heart failure was placed on a HeartWare HVAD May 2017 as a bridge to cardiac transplant. The patient had several routine type and screens which were all negative. The last date of transfusion was 6/9/2017 prior to the patient being activated for transplant. On 9/20/2017 a new finding of a warm autoantibody was reported. The patient was admitted to the hospital since 8/27/2017, so transfusions at an outside hospital were not a cause. Absorption studies were negative for all underlying alloantibodies. Type and screens were then routinely performed once a month in anticipation of a future transplant. On 11/21/2017, a new antibody, anti‐Fya, was identified. On 3/15/2018, a second antibody was identified, an anti‐S, in the absence of a recent transfusion.
Results/Finding: At the time the anti‐S was demonstrating, the anti‐Fya and warm autoantibodies were not evident in the patient's serum. The patient is negative for both S and Fya antigens.
Conclusion: The patient was transplanted on 3/15/2018 and was transfused with Fya and S antigen negative RBCs. The development of the new alloantibodies outside of the expected window for alloimmunization raises many questions with regard to VADs and the association of increased expression of RBC antibodies which may occur in addition to HLA antibodies. The RBC sensitization patterns for orthotopic heart transplant candidates using bridge devices to transplantation requires further study.
TS93
Refractoriness to Red Blood Cell Transfusion Therapy Due to Hypersplenism
Ilyas Sahin*1 and Joseph D. Sweeney2
1Division of Hematology‐Oncology, Lifespan Cancer Institute, The Warren Alpert Medical School of Brown University, 2Lifespan Academic Medical Center
Background/Case Studies: Red blood cell (RBC) transfusion increases hemoglobin concentration by 1 g/dL per unit in a typical adult. This increase is attenuated in the presence of ongoing hemolysis or active blood loss. Occasionally, a low red cell volume unit transfused to a recipient with a large intravascular blood volume may show an unexpectedly small increase. In rare situations, however, the etiology of a greatly attenuated response is more perplexing.
Study Design/Method: A case report
Results/Finding: The patient is a 55 year‐old male with myelodysplastic/myeloproliferative neoplasm (MDS/MPN) and massive splenomegaly. The patient is blood group O, Rh (D) positive with a negative direct and indirect antiglobulin test. Transfusion of 5 Units of RBCs only increased the hemoglobin from 6.7g/dL to 7.2g/dL. There was no evidence of bleeding or hemolysis. Laboratory tests showed LDH of 105 IU/L (N, 100‐220 IU/L), haptoglobin of 76 mg/dl (N, 14‐258 mg/dl), total bilirubin of 1.8 mg/dl (N, 0.2‐1.3) and a reticulocyte count of 3%. Peripheral blood smear did not reveal any schistocytes, polychromasia or spherocytosis. Hemoglobin concentration remained essentially unchanged throughout the rest of the stay and patient was discharged. The patient was readmitted one week later with hemoglobin of 3.3g/dL, again without active bleeding or hemolysis. An additional 6 Units of RBCs resulted in an increase from 3.3 g/dL to 3.5 g/dL. The patient typed as R2r, K‐1, Fya, M and S negative. On account of this, a Rh (D) negative (rr), K‐1 negative unit was transfused in order to serially monitor the allogeneic cells which demonstrated shortened survival of the RhD negative cells. A partial splenectomy was performed using embolization of the splenic artery, which resulted in a stabilization of the hemoglobin around 7g/dL. Based on the apparent stabilization of the hemoglobin after splenic artery embolization, a surgical splenectomy was performed resulting in a hemoglobin increase to ∼12 g/dL. The patient remains transfusion free 140 days post‐splenectomy.
Conclusion: Severe refractoriness to RBC transfusion is a rare event. Although the spleen is the likely culprit organ, there are few reports of the outcome of splenectomy, and frequently a reluctance to perform splenectomy in such patients. Our case illustrates that splenic artery embolization may be a useful initial approach and a potential predictor of the utility of a subsequent surgical splenectomy.
TS94
Delayed Hemolytic Transfusion Reaction Secondary to a Warm Anti‐N Alloantibody
Danielle Harrell*1, Faisal Mukhtar2 and J. Peter Pelletier2
1University of Florida, 2University of Florida College of Medicine
Background/Case Studies: A 28 year old O + female with a history of sickle cell anemia presented to our institution in an acute sickle cell crisis. Hemoglobin on arrival was 7.6 g/dL and decreased to 6.2 g/dL on hospital admission day 2. Given the patient's long history of transfusions with multiple known antibodies (Anti‐C, anti‐e, anti‐Jkb, anti‐K, warm alloantibody and recently identified cold reacting anti‐N) and previous delayed hemolytic transfusion reaction (unidentified alloantibody), red blood cell transfusion was avoided. Due to a continuing downtrend in the hemoglobin, she was given one compatible unit (C=, e=, Jkb=, K=, N+) of packed red blood cells.
Study Design/Method: A transfusion reaction work‐up was requested by the clinical team due to a progressive decrease in hemoglobin from 6.2 g/dL to 2.3 g/dL following RBC transfusion (C=, e=, Jkb=, K=, N+). Given N antibodies are typically IgM and cold reacting, the transfused unit was N+. A direct polyclonal Coombs (DAT) was performed on the pre‐transfusion and post‐transfusion samples. Based on positive post transfusion DAT and negative pre‐transfusion DAT, an antibody screening test was performed.
Results/Finding: The patient's pre‐transfusion DAT was negative, however post‐transfusion polyclonal and IgG DATs were positive and negative for complement (C3). An antibody screen post‐transfusion was also 2‐3 pan‐positive on Gel and LISS on both screening and subsequent red cell panels. An initial elution was also pan‐positive at 37°C. Adsorption was performed with R1R1, R2R2, rr cells. The resultant eluate was consistent with IgG anti‐N. A red cell genotype showed the patient to be N=, C=, e=, K=, Jkb = and Doa=. Antibody identification showed an anti‐N reactive at AHG and IgG while being nonreactive with C3. Previous unidentified antibody was found to be Doa. The patient was subsequently transfused with 1 of 2 crossmatch compatible units.She had a good response of an increase of 1g/dL with no repeat hemolytic reactions. Patient recovered after treatment of reactivated warm autoimmune hemolytic anemia and medical support with Hemopure®. The patient was ultimately discharged home.
Conclusion: Anti‐N is usually a naturally occurring IgM/IgG cold‐reactive, non‐RBC stimulated antibody. They act as agglutinins in tests performed at temperatures below 37°C. However, few cases of warm reacting anti‐N have been described. The presence of warm reacting anti‐N in the eluate combined with the patient's severe anemia in the days following N + red cell transfusion resulted in a delayed hemolytic transfusion reaction secondary to a warm alloantibody to anti‐N. In conclusion, the presence of new onset anti‐N in patients with recurrent red cell transfusions may merit the administration of N = red cells.
TS95
Stability of Immature Platelet Counts in Platelet Units Used for Neonatal Transfusions
Kara L. Roncin*1,2, Hollie M. Reeves1,2 and Robert W. Maitta1,2
1University Hospitals Cleveland Medical Center, Department of Pathology, 2Case Western Reserve University, School of Medicine
Background/Case Studies: Clinical implications of immature platelet content in platelet units remains uncertain. It is known that they can be viable longer throughout shelf life of a single donor platelet (SDP) unit and can be used as a diagnostic gauge in thrombocytopenic presentations. However, it has not been ascertained if stability of immature platelet count is affected by the timing of testing. We analyzed if the timing of absolute immature platelet count (A‐IPC) measurement changes by testing it at defined time points post‐SDP unit release for neonatal patient transfusions.
Study Design/Method: SDP units for neonatal patients were identified at the time of aliquot preparation. All units were collected from healthy donors, stored at room temperature (22‐24oC), gently agitated. A total of 14 SDP were identified over a one‐month period. A 1‐2 mL sample for A‐IPC was collected from units at the time of aliquot preparation for patient transfusion. Samples were analyzed using an automated hematology analyzer for complete blood count (CBC) and percent immature platelet fraction (%‐IPF). A‐IPC was obtained by multiplying the platelet count times %‐IPF. Samples were separated into groups depending on the time elapsed from the aliquot issue to sample run time; < 24 hours, between 24‐48 hours, and between 48‐72 hours. There were no samples analyzed after 72 hours. Results are reported as mean ± standard deviation (SD) unless otherwise indicated.
Results/Finding: Of the 14 aliquots identified, there were 9 unique units and 5 unique patients, with unit platelet count (x109/L) of 1035.29 ± 237.79 (range 673‐1453), %‐IPF of 2.19 ± 0.97% (range 0.60‐3.70), and A‐IPC (x109/L) of 22.23 ± 11.03 (see Table 1). There was no statistical difference from the mean between platelet count, %‐IPF, or A‐IPC when separated into <24 hours, 24‐48 hours, or 48‐72 hours.
| Count | Mean | SD | CI (95%) | |
|---|---|---|---|---|
| Platelet [×109/L] | ||||
| Overall | 14 | 1035.29 | 237.79 | 124.56 |
| <24 Hours | 9 | 1007.56 | 216.06 | 189.38 |
| 24‐48 Hours | 3 | 1013.00 | 243.81 | 275.90 |
| 48‐72 Hours | 2 | 1193.50 | 259.50 | 359.64 |
| %‐IPF [%] | ||||
| Overall | 14 | 2.19 | 0.97 | 0.51 |
| <24 Hours | 9 | 2.19 | 0.91 | 0.80 |
| 24‐48 Hours | 3 | 2.17 | 0.70 | 0.80 |
| 48‐72 Hours | 2 | 2.25 | 1.45 | 2.01 |
| A‐IPC [×109/L] | ||||
| Overall | 14 | 22.23 | 11.03 | 5.78 |
| <24 Hours | 9 | 21.58 | 10.01 | 8.77 |
| 24‐48 Hours | 3 | 23.61 | 13.26 | 15.01 |
| 48‐72 Hours | 2 | 23.09 | 11.47 | 15.89 |
Table 1: Analysis of 14 Platelet Samples Obtained In Tandem With Neonatal Aliquots. SD: standard deviation, CI: confidence interval, %‐IPF: percent immature platelet fraction, A‐IPC: absolute immature platelet count.
Conclusion: A‐IPC and %‐IPF can be accurately measured beyond 24 hours after an aliquot is obtained for neonatal transfusion. In light of this, studies that aim to look at the role of immature platelets in transfusion do not need to be limited to 24 hours post‐aliquot sampling and still provide valuable information to establish the role A‐IPC content had in a recipient's platelet count.
TS96
Hemolysis Paradigm in the Setting of Sickle Cell Disease Exacerbated by Red Blood Cell Transfusion
Swati Srivastava1, Bhunesh Maheshwari*1, Hollie M. Reeves2, Katharine A. Downes1 and Robert W. Maitta2
1University Hospitals Cleveland Medical Center, 2University Hospitals Cleveland Medical Center, Department of Pathology
Background/Case Studies: Sickle cell disease‐related complications represent a clinical challenge in patients presenting in crisis with laboratory results that potentially complicate their treatment options during acute presentations. Specifically, this is the case when results indicate that patients have unexplained decreases in hemoglobin (Hgb) in response to blood transfusions in the setting of increased lactate dehydrogenase (LDH) and bilirubin leading to clinical suspicion for a hemolytic process.
Study Design/Method: A 32 year old male with sickle cell disease Hgb SS, diagnosed at age of 8 months, complicated with episodes of acute chest syndrome, vasoocclusive crises, pulmonary hypertension and baseline Hgb of ≥ 5.5 g/dL. Patient was managed with Hydroxyurea and red cell transfusions. An acute fall in hemoglobin was noted after transfusion of 2 red cell units when Hgb decrease to 4.6, LDH was 1164 U/L and bilirubin of 1.6 mg/dL and a delayed hemolytic transfusion reaction (DHTR) was suspected. Patient received C‐, E‐, K‐antigen negative and sickle negative blood. His blood type is O pos
Results/Finding: Three post‐transfusion samples sent to the blood bank tested negative by direct antiglobulin test (DAT): poly, IgG and C3. Antibody screens and panel were negative for all samples regardless of testing media/enhancers used. Retest of units transfused showed them to be crossmatched compatible. Bilirubin in pre‐ and post‐specimens was unchanged. Samples were sent to a reference laboratory which found no presence of alloantibodies or autoantibodies. Additionally, testing for antibodies to low frequency antigens: V, VS, Kpa, JsA, Cw, Lua, Cob, Dia, He, Wra, Ytb and GP.Mur was also negative. Genotyping for Rh variant showed probable RHD genotype RHD*01/RHD*DAU5; Probable RHCE*ce/ RHCE*ce48C; Predicted phenotype D+C‐E‐c+e+VS‐V‐hrB + . Patient was found to have a GATA mutation that results in loss of Fyb expression on red blood cells but not on the tissue endothelium and hence patient was not expected to make alloantibodies to Fyb antigen. Patient was started on high dose steroids which led to a slow but steady increase in Hgb and subsequent improvements in LDH and bilirubin.
Conclusion: Sickle cell can present with hemolytic responses which could be temporally‐associated to transfusion. However, this may be a distinct presentation inherent to the patient which is not mediated by antibodies to red blood cells and therefore not qualify as antibody‐mediated delayed hemolytic responses. These hemolytic presentations can improve with strong immunosuppression while holding transfusions to when strictly necessary.
TS97
Assessing the Changes in Albumin Utilization over a 10‐Year Period: A Single Centre Retrospective Study
Alan Tinmouth*1,2, Michael Chasse3, Malia Murphy2, Lauralyn McIntyre2, Dean A. Fergusson2 and Wilson Kumanan2
1Ottawa Hospital, 2Ottawa Hospital Research Institute, 3Centre Hospitalier de l' Université de Montréal
Background/Case Studies: Albumin is a commonly prescribed fractionated blood product, but many of the indications are not supported by strong clinical evidence. The alternatives to albumin include crystalloid fluids and colloid fluids. However, recent studies suggest possible harms associated with the use hydroxyethyl starches, an alternative colloid solution, which may have impacted the use of albumin. In this study, we describe the use of albumin in a tertiary academic centre over a 10‐year period.
Study Design/Method: This was a 10‐year retrospective cohort study of a large tertiary care hospital in Ontario, Canada. The Ottawa Hospital Data Warehouse was queried for all inpatient and outpatient encounters where albumin was transfused between January 2006 and December 2016. Albumin use over the study period was reported, including number of hospital encounters, total amount of albumin administered (normalized for concentration of albumin), concentration of albumin, and attending medical/service. Patient encounters associated with albumin transfusion were compared to a randomly selected cohort of patients not receiving albumin.
Results/Finding: At the Ottawa Hospital, 15,927 patients received albumin from 2006‐2016. There were 25,851 encounters where albumin was transfused, 68.3% of the albumin was administered to inpatients and 30.2% was administered to outpatients. Overall, the annual number of patients receiving albumin more than doubled from 1,153 to 2,359 during the period of study and the total amount of albumin transfused increased by from 255,413 to 384,545 grams. The number of patient encounters with an albumin infusion and the total amount of albumin transfused was stable from 2007 to 20011 and then increase dramatically between 2011 and 2014. The largest patient groups receiving albumin were cardiac surgery (19.3%), internal medicine (13.5%), intensive care (11.8%) and hematology (10.4%). In the patient encounters with albumin transfusion, the increase in the proportion of cardiac surgery patients and intensive care patients was greatest as compared to patient encounters with no albumin transfusions.
Conclusion: The number of patients receiving albumin and the total amount of albumin transfused at the Ottawa Hospital increased from 220 to 2016. The increases were mostly seen between 2011 and 2014, which may be have been related to clinical studies demonstrating possible harm associated with use of alternative colloid fluids. Further analysis will be performed to understand the changes in the indications for the use of albumin as well as differences in clinical outcomes among patients who receive albumin and those that do not.
TS98
Supply Time for Plasma during a Massive Transfusion Protocol: Liquid Plasma vs. Thawed Plasma
Sandra Lamm*, Kimberly Sanford and Joan Shemenski
VCU Health
Background/Case Studies: Acute traumatic coagulopathy has been associated with increased mortality. Studies have shown that prompt administration of plasma products in a high plasma:red cells ratio in a trauma setting can improve outcomes. Prior to April of 2017, Transfusion Medicine (TM) supplied thawed plasma (TP) for trauma patients after initiation of a massive transfusion protocol (MTP). 4 type A and 2 AB TP were typically pre‐thawed on weekdays and 4 type A and 4 AB were typically pre‐thawed on weekends. The first round of the MTP consists of 8 TP, so often 2 more plasma had to be thawed to fulfill the first round, delaying those products by a minimum of 25 minutes. In response to a request from Trauma service and in an effort to improve plasma supply times, TM started supplying liquid plasma (LP) in April of 2017 for the first round of MTPs. This plasma product does not require thawing. TM's labeling and dispensing practices were also modified in an attempt to further decrease time to supply plasma products. This study was performed to determine if the switch to LP and the modifications to TM's labeling/dispense procedures resulted in a significant decrease in time to provide plasma for the first round of a MTP.
Study Design/Method: This was a non‐experimental, retrospective study. Times from initiation of the MTP to dispense time of plasma for the first round were gathered from 1/1/2017 to 4/15/2017 and from 1/1/2018 to 3/31/2018 to determine the dispense times before and after TM's provision of LP and labeling and dispense procedure modifications respectively. Mean dispense times were calculated for each time period. A two‐sample t test was performed to evaluate the two period mean difference for significance.
Results/Finding: A total of 76 records were retrieved. 16 records were excluded as no plasma products were transfused, thus we were unable to determine the dispense time. The mean pre‐LP and procedure modifications time to dispense was 9.81 minutes (n = 30, SD = 4.43) and the mean post‐LP and procedure modifications was 5.66 minutes (n = 28, SD = 3.10). The difference between the means was significant (p < 0.01). Further differentiation by shift also showed a reduction in mean dispense time, with the following results: Day Shift 9.67 minutes (n = 6, SD = 3.50) to 5.43 minutes (n = 7, SD = 3.05), Evening Shift 10.86 minutes (n = 15, SD = 4.73) to 6.64 minutes (n = 10, SD = 3.30), and Late Night Shift 8.67 minutes (n = 8, SD = 5.15) to 4.82 minutes (n = 12, SD = 2.93). These results were significant for Evening Shift (p = 0.04) and Late Night Shift (p = 0.03) but not Day Shift (p = 0.07).
Conclusion: By switching to LP from TP for the first round of a MTP and modifying the labeling and dispense procedures, TM was able to significantly reduce the time required to supply plasma during a MTP.
TS99
Evaluation of the Utility of RHD Genotyping of Serologically Weak D Patients at a Tertiary Care Pediatric Hospital
Jenna Khan*1, Jennifer Hoek2,3 and Nabiha H. Saifee2,3
1University of Washington Medical Center, 2Seattle Children's Hospital, 3Bloodworks NW
Background/Case Studies: Studies of transfusion recipients with weak D types 1, 2, or 3 have not shown anti‐RhD alloimmunization; thus, RhD‐positive blood products may be safely administered allowing better management of limited RhD‐negative inventory. Serologic typing for RhD has variable results depending on the specific reagents and methodologies used and cannot easily distinguish weak or partial RhD variants. This study aims to evaluate the impact of RHD genotyping on inventory of RhD negative blood products at a single tertiary care pediatric hospital.
Study Design/Method: Transfusion history from March 2010 to March 2018 and initial ABO/RhD typing was reviewed for pediatric patients less than 18 years of age at the time of most recent ABO/RhD typing and with a documented serologic weak D positive test. Initial ABO/RhD typing at our institution includes gel column technology from Ortho‐Clinical Diagnostics (Raritan, NJ) with pre‐loaded anti‐D and tube testing using a monoclonal IgM anti‐D blend with polyclonal IgG anti‐D (BioClone, Ortho). Serologic weak D testing was performed if anti‐D results were weak to 1 + or discrepant (e.g. anti‐D reagent in gel shows 2+, but tube is negative or weak). The incidence of anti‐RhD alloimmunization and blood product exposure by gender was evaluated. The number of RhD negative units that could be replaced with RhD positive units if RHD genotyping was performed was determined based on an estimated 80% prevalence of weak D types 1, 2, or 3 in an ethnically mixed US population and our local transfusion practice to give RhD positive blood products to males with weak RhD phenotype and RhD negative blood products to females with weak RhD phenotype.
Results/Finding: Of 13,187 patients less than 18 years old with ABO typing, forty‐eight (0.4%, 23 female, 25 male) were identified to be serologically weak D. 56 RBCs and 43 platelets were transfused to these weak D patients (21 RBCs and 15 platelets to females; 35 RBCs and 28 platelets to males). About 31% of weak D patients received any RBC or platelet transfusions with 69% of these transfusions going to five patients. There was no anti‐RhD alloimmunization detected. It is estimated that ∼17 RBC and ∼12 platelet transfusions could have been replaced with RhD positive products during this 8 year time period had RHD genotyping been performed.
Conclusion: Given the variable rate of transfusion to weak D patients, the decision to perform RHD genotyping should take into consideration the likelihood of transfusion. Although there was no reported RhD‐alloimmunization, our population is predominantly Caucasian and there was a limited number of transfusions and limited follow‐up. It remains particularly important to prevent alloimmunization in the pediatric population as they will have a greater lifetime risk of associated morbidity. To maximize the benefit of RHD genotyping better mechanisms need to be developed for this information to be accessible across institutions to optimize care and prevent repeat testing.
Transfusions in Pediatric Patients with Serologic Weak RhD typing over an 8 year period
| Patients with No Transfusion History | RBC Doses | Platelet Doses | |
|---|---|---|---|
| Male | 16 | 35 | 28 |
| Female | 17 | 21 | 15 |
TS100
Rare Presentation of ABO Subgroup B3
Stephanie M. Labib*1 and Shauna L. Pejouhy2
1University of Massachusetts Dartmouth, 2Tufts Medical Center
Background/Case Studies: Correct classification of ABO blood type is imperative for successful transfusion practices. Allelic inheritance of ABO subtype genes or mutations to the ABO gene can cause quantitative or qualitative differences in antigenic expression. Patients may therefore express variants of classic A or B antigens on their red blood cells (RBCs) that do not react as readily with standardized reagent antisera. These weak reactions can impede the identification of a patient's phenotype, causing potential for transfusion of incompatible blood products. Consequent adverse reactions may result due to the immunogenicity of the ABO blood group system. Subgroups vary in degree of rarity and those of the B antigen are expressed less frequently than those of Group A. B subgroups include B3, Bx, Bw, Bm, and Bel and are found in greater incidence in Asian populations. Most exhibit weak hemagglutination reactions due to antigenic variance. Typically, mixed field reactions occur during forward typing of RBCs expressing B3, although this pattern is not exclusive.
Study Design/Method: ABO/Rh typing was performed via column agglutination technology. In this method, the gel matrix contains microbeads that only allow small, unagglutinated RBCs to pass to the bottom after centrifugation. If a sample contains antigens to the corresponding reagent antisera, hemagglutination will occur and the formed immune complexes will be too large to pass through the column. Positive reactions are indicated by agglutination that remains at the top or suspended throughout the gel matrix. Negative reactions show as a single button of cells at the bottom of the column. Mixed field reactivity is exhibited by two populations of cells showing separate reactions in the same microtube.
Results/Finding: A rare case of B3 was detected in a neonate of Asian descent during ABO forward typing. The patient's RBCs from a cord blood sample reacted weakly (1+) with anti‐B reagent antisera, which caused question of specimen integrity. A venous sample was requested for confirmatory testing and yielded an equally weak reaction (Table 1), although mixed field was not present. The specimen was sent for genotyping, which resulted in ABO*O.01.01, ABO*B3.07, and a predicted phenotype of B3. None of the most common mutations that cause B3 were detected in this patient's genotype profile.
Conclusion: Genotyping is essential in accurately identifying a patient's expression of B3, as subgroups are rare and do not always react characteristically. Patients with B3 phenotype are generally transfused Group O RBCs and Group AB plasma, although transfusion indications vary by institution.
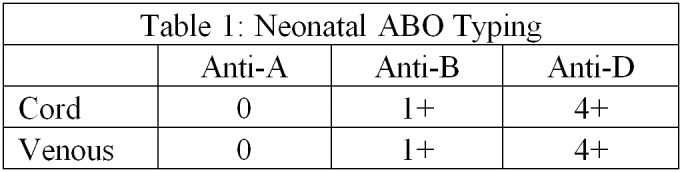
TS101
Multi‐Dimensional Renovations in the Massive Transfusion Protocol Significantly Improve the Efficiency of Transfusion Service
Hongzhi Xu*1, Menchu Ong1 and Melissa L. Sparano2
1LSU Health Sciences Center, 2University Health System
Background/Case Studies: Hemorrhage remains a major cause of potentially preventable deaths. A rapid and effective response is vital for a successful outcome after major blood loss. In our institute, the Transfusion Service responds to massive hemorrhage by following a previously developed massive transfusion protocol (MTP). However, the time it took to issue blood products was too long and the clinical feedback has been unsatisfactory. Recently, multiple changes have been made in our MTP to improve the efficiency of the Transfusion Service in responding to such clinical settings.
Study Design/Method: Based on a root cause analysis of the clinical issue, the following changes were made: 1) redesigned the paperwork and safety check logistics; 2) pre‐assembled MTP packs; 3) optimized/centralized the equipment arrangement in the blood bank work space and 4) MTP‐related staff training. To evaluate the effects of these changes, the length of time from blood bank notification (i.e. activation of MTP protocol) to issuance of the blood products were recorded and compared with previous cases. Paired t‐test was used for the statistical analysis.
Results/Finding: The average time spent from receipt of the call to issuance of the products before implementation of these changes was 10.10 ± 0.06 minutes (n=4). After these changes, the time spent was dramatically reduced nearly ten‐fold 1.75 ± 0.13 minutes,(n=4), P < 0.001. There was no safety‐related incidents reported.
Conclusion: In this study, we demonstrated that the work efficiency in the blood bank under emergency conditions can be significantly improved by strategically rearranging the order of work flow (e.g. pre‐assemble blood products instead of assembling blood products after the activation of MTP). For this extremely time sensitive task, optimizing equipment spatial arrangement to reduce the staff walking distance, redesigning a set of simplified/goal‐orientated paperwork, and relevant personnel training can all contribute to the improved Transfusion Service efficiency without compromising patient safety.
TS102
Ordering Practices for Pediatric Platelet Transfusion at a Tertiary Children's Hospital
Hollie M. Reeves*1,2, Katharine A. Downes1,2, Sneha R. Butala3 and Irina B. Pateva2,4
1University Hospitals Cleveland Medical Center, Department of Pathology, 2Case Western Reserve University, School of Medicine, 3University Hospitals Cleveland Medical Center, Department of Pediatrics, 4University Hospitals Rainbow Babies and Children's Hospital, Department of Pediatrics ‐ Hematology and Oncology
Background/Case Studies: Platelet (Plt) transfusion is second only to red blood cell transfusion in pediatric patients (pts), making up approximately 19% of transfusions in pediatric hospitals. Ordering practices for pediatric plt transfusion are not well characterized in the literature. Additionally, plt transfusion indications are largely based on studies among adult populations and may require adjustment for pediatric pts.
Study Design/Method: An IRB approved, retrospective study of plt orders obtained from the hospital's Quality Center Electronic Medical Record Blood Auditing Report for pediatric pts from 01/01/16 through 12/31/16 was performed. Pts met the following inclusion criteria: inpatient, age 0‐18 years, and a minimum of 1 plt order during admission. Neonatal Intensive Care Unit pts were excluded. The parameters of total number of plt orders with indications, clinical services ordering plt, plt transfusion orders indications, procedure associated plt orders, plt count within 24 hours of order, and minimum/maximum plt orders per pt were analyzed with descriptive statistics used to summarize results.
Results/Finding: Ninety three pts were included. Fourteen clinical services placed 698 plt orders in total with accompanying indication (mean plt count 44x10E9/L; median 22x10E9/L) see Table. Service that most frequently ordered plts was Bone Marrow Transplant followed by Hematology Oncology. Over 75% of 698 orders were associated with a procedure, and in 25% of those an invasive procedure indication was selected. Mean plt count was 20x10E9/L in pts whose indication was prophylaxis against spontaneous hemorrhage. Sixty six percent (n = 61) of pts had multiple plt orders (mean 11, median 7, range 2 – 91). Of the pts with multiple plt orders, 52/61 (85%) had orders associated with more than one indication, whereas only 9 pts (15%) had orders with just one indication.
TABLE (TS102)
| Platelet Order Indications | # Platelet Orders | Mean Platelet Count (×10E9/L) | # Procedure Related |
|---|---|---|---|
| Extracorporeal Membrane Oxygenation | 69 | 87 | 69 |
| Functional platelet defect | 15 | 72 | 13 |
| Hemorrhage after cardiopulmonary bypass for Plt < 100,000/uL | 4 | 211 | 4 |
| Intra‐ or postoperative hemorrhage for Plt < 50,000/uL | 34 | 38 | 28 |
| Invasive procedure or laboring female and Plt < 50,000/uL | 194 | 34 | 138 |
| Massive Hemorrhage | 13 | 94 | 10 |
| Plt < 100,000 for CNS, eye, airway related hemorrhage or other areas where bleeding creates higher risk | 35 | 43 | 26 |
| Prophylaxis against spontaneous hemorrhage for Plt < 10,000/uL | 308 | 20 | 235 |
| Surgical Blood Order (for use in OR) | 26 | 126 | 25 |
| Total | 698 | 44 | 548 |
Conclusion: Plt transfusion orders are common among pediatric patients at our institution, with the majority of pts receiving more than one order. Further studies are required to characterize ordering patterns and indications for pediatric plt transfusion.
TS103
Mild Hemolytic Disease of the Newborn Due to Isolated Anti‐G
Sara Johnston* and Emily Coberly
University of Missouri Health Care
Background/Case Studies: The G antigen is an Rh antigen found on red blood cells that also express either D or C antigens. Anti‐G is difficult to distinguish on an antibody panel, where it may be confused with anti‐D plus anti‐C. Since anti‐G is commonly found in alloantibody mixtures with anti‐D and/or anti‐C, the contribution of a solitary anti‐G alloantibody in causing hemolytic disease of the fetus and newborn (HDFN) is unclear. Two prior case reports of isolated anti‐G in pregnancy demonstrated no evidence of hemolytic disease in one D+, C‐ infant and moderate hemolytic disease requiring prolonged phototherapy in the second D+C + infant.
Study Design/Method: A 26‐year‐old G4P0030 O negative woman was referred to our maternal‐fetal medicine service at 36 5/7 weeks gestation for hypertension and alloimmunization with anti‐D and anti‐C alloantibodies. These alloantibodies were first identified 4 years ago after an ectopic pregnancy; at that time she had received prophylactic RhIg and had been transfused O negative red blood cells. During her current pregnancy she had been followed with serial antibody titers and middle cerebral artery (MCA) Doppler ultrasound by the referring hospital. Although both anti‐D and anti‐C titers were elevated above the threshold of 16, MCA Dopplers showed no evidence of fetal anemia. She did not receive prophylactic RhIg during this pregnancy due to the previous diagnosis of anti‐D alloantibody. Upon arrival at our hospital, G differentiation testing was performed which revealed the presence of anti‐G plus anti‐C, but no anti‐D alloantibody.
Results/Finding: An O positive infant was delivered at 37 1/7 weeks due to maternal hypertension. The neonatal DAT was positive, and the eluate reacted with all D + or C + cells, consistent with anti‐G. The neonatal RBCs were D+C‐. On the first day of life, the infant developed an elevated bilirubin level, and required 2 days of phototherapy for treatment of HDFN. Hematocrit remained stable and no transfusions were given.
Conclusion: Once the presence of anti‐G and the absence of anti‐D was established, RhIg prophylaxis was administered to the mother postpartum. Anti‐G should be suspected in a pregnant woman when anti‐D and anti‐C appear simultaneously on an antibody panel, and prophylactic RhIg should be administered if anti‐D is not present on G differentiation studies. In this case the only maternal alloantibodies were anti‐G and anti‐C, and the infant was negative for C antigen. This case demonstrates development of mild HDFN attributable to an isolated anti‐G alloantibody.
TS104
A Retrospective Audit on RBC, Platelet and FFP Appropriateness in a Tertiary Hospital in Singapore
Liting Yang*, Mulina Mulina, Karen Lim, Susan Lim, Lip Kun Tan and Eng Soo Yap
National University Hospital
Background/Case Studies: The National University Hospital, Singapore, is a 1250 bed tertiary hospital issuing almost 28,000 units of blood components annually. We audited transfusion appropriateness since 2015. Despite clear guidelines, inappropriate usage still persists.
Study Design/Method: A retrospective audit was performed from January to December 2017 using our blood bank registers and patients’ electronic medical records. Appropriateness of Red Blood Cells (RBC) use was determined using Singapore's Ministry of Health 2015 Guidelines. For platelets (PLT), in concordance to AABB and BSH guidelines, Fresh Frozen Plasma (FFP) by the 1994 CAP guidelines. Some appropriate indications are; for RBC if haemoglobin (Hb) level is less than 7g/dL, for prophylactic PLT if PLT count is less than 20,000/uL, for FFP reversal of warfarin with INR of more than 1.5. All requests were inappropriate if the indications did not meet criteria.
Results/Finding: A total of 3093 transfusion episodes (2251 RBC, 659 PLT and 183 FFP) were audited between disciplines (Haematology‐Oncology, Paediatrics, Obstetrics, Medicine, Surgery, Cardiac, Orthopaedic, Liver Transplant).Haematology‐Oncology used the most RBC and PLT, and FFP by Cardiac. 94.8% of total transfusions were deemed as appropriate. Between the disciplines, there were no significant differences in RBC appropriateness (89.0‐100%). There was greater variability in appropriate usage of PLT (73.7‐100%) and FFP (61.5‐100%). FFP had 100% appropriateness in Haematology‐Oncology, Obstetrics and Paediatrics but it had the lowest appropriate use of 61.5% in Surgery which reflects variations in rational FFP usage across disciplines. The high overall percentages of appropriate RBC and PLT transfusions reflect good transfusion practices by clinicians. The main indicators for inappropriate transfusion were attributed to low Hb but not below 7g/dL in 89.61% of RBC and bleed prevention in 89.8% of PLT given. Among blood components, FFP had the lowest appropriate usage of 86.3% with 52% of inappropriate FFP use associated with surgical procedure, likely due to difficulty in assessing bleeding patients. 40% was due to correction of coagulopathy in post‐operative patients; persistent low INR in 4%; pre‐operation reversal of warfarin in 4%. Unlike RBC and PLT, existing FFP guidelines lack clear evidence based indicators for non‐bleeding patients; PT/APTT are poor predictors to substantiate prophylactic FFP usage.
Conclusion: The rate of appropriate transfusions in our institution was determined to be 96.5% for RBC, 91.1% for PLT and 86.3% for FFP. Our study reflected an overall higher rate of appropriate component use when compared internationally (Metz, 1995) and locally for FFP (Chng, 2003). Continuous education and better blood management are necessary to improve appropriate use of blood amidst the increasing demand for blood in a growing ageing local population.
TS105
High‐Rate‐of‐Blood‐Use Events: A One Year Experience
Teodora J. Monoski*1, John R. Hess2, Erin E. Tuott1 and Nina Sen1
1Division of Transfusion Medicine, Harborview Medical Center, 2Department of Laboratory Medicine, University of Washington
Background/Case Studies: Massive transfusion of greater than 10 units of RBC in 24 hours is a well described but increasingly uncommon event. In a previous report, only 55 of 309 massive transfusion protocol (MTP) activations met the old 10 unit criteria to understand other episodes of high rate‐of‐blood‐use. We reviewed a year of blood use in a high acuity hospital for non‐MTP‐activation episodes that met the Critical Administration Threshold‐1 (CAT‐1) definition of three blood components administered in one hour.
Study Design/Method: A year's worth of blood use in a 440 bed urban county hospital was reviewed for episodes of CAT‐1 that occurred outside of MTPs. Descriptive statistics of patients and episodes were assembled into tables and graphs using microcomputer spreadsheet software.
Results/Finding: The hospital admitted 16,967 patients and administered 13,668 blood components in 2017. There were 309 MTP activations, 77% for trauma, and 195 non‐MTP CAT‐1 episodes. Such episodes occurred in secondary surgeries for trauma patients, for episodes of bleeding in in non‐trauma related surgeries, and in patients with severe GI bleeding. In‐hospital‐mortality was low in the surgical bleeding situations, higher with the GI bleeds.
Conclusion: Apart from conventional massive transfusion situations, smaller episodes of high‐rate‐of‐blood use occur frequently in the acute care hospitals. With rapid correction they are of low mortality. Transfusion services need to be able to support these situations with rapid responses of hemostatic products.
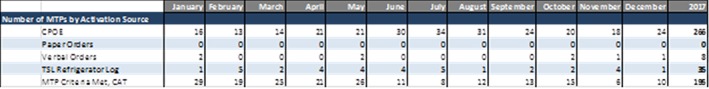
TS106
The Impact of an MTP‐like Protocol (Tier Platelet) Versus Standard Platelet Ordering Practice on the Turn‐Around‐Time and Hemorrhagic Progression Among Adult Patients with Intracerebral Hemorrhage
Violeta Osegueda*
UCLA RRMC
Background/Case Studies: In the acute management of intracerebral hemorrhage (ICH) prioritizing factors such as reduction of hematoma expansion risk are significant in the long‐term care of the patient. Neurological dysfunctions secondary to expansion and intracerebral pressure greatly reduce the quality of life post‐ICH. Current literature on the benefits of platelet transfusion in ICH are inconclusive. The Tier Platelet protocol at our hospital was implemented in June 2015 to improve clinical outcomes by reducing turn‐around‐times (TATs). Data was collected from the electronic medical record for two time‐frames, one prior to Tier Platelet and one following its implementation.
Study Design/Method: Pre‐ and post‐Tier Platelet data was collected from September 2014‐May 2015 and September 2015 – May 2016, respectively. Only emergency room and the neurology intensive care unit were considered, as these departments manage the majority of ICH patients and undergo the standard protocol when requesting blood products. The standard protocol for platelets requires initial review of clinician's order by lab personnel to verify patient's confirmed blood type, a current platelet count (within 24 hrs), and number of previous platelet transfusions (within 24hrs). Orders for two or more adult dose platelet units and platelet count‐related concerns require further auditing at the blood bank by pathology resident or fellow. Counts exceeding 20K cells/mcL in non‐emergent units or 50K cells/mcL in actively bleeding patients require follow‐up to determine clinical need. In suspected brain bleeds, the clinical goal is to maintain platelet count at above 100k cells/mcL, thus a majority of platelet requests for such patients undergo the standard protocol on the basis of the platelet count alone. In addition, the absence of confirmed blood type may present a delay as it requires blood draw and testing prior to releasing platelet for transfusion. Three TATs were defined: time from admission or symptom presentation to transfusion (TAT1), time from platelet request to issue (TAT2; Blood Bank‐dependent), and time from platelet issue to transfusion (TAT3; department‐dependent).
Results/Finding: Our initial TAT1 yielded significant results, reducing TAT by >50% in both ED and non‐ED (Neuro‐ICU) patients. The blood bank dependent TAT, TAT2, also reduced TAT in both patient groups (>50%). Data pertaining to department‐dependent TAT showed overall reduction but without significance (Table 1).
Preliminary data on clinical outcomes indicate hematoma reduction following Tier Platelet implementation (22.7 and 26.3%). (Table 2).
Conclusion: Tier Platelet TATs reduction is limited to blood banking practices. Further investigation is required to determine the factors affecting the transfusion start times of products once they are received by the respective hospital units. The effectiveness of Tier Platelet over trauma protocols is another area for investigation, as trauma protocols also bypass product auditing. Measures of clinical outcomes were limited to notations on CT scans entered in the electronic medical record within a 48 hour period post‐ICH. A more standardized measure of clinical benefit using a combination of CT scans and labs following platelet transfusion would provide a clearer insight.
TS107
Pre‐Operative Autologous Blood Donation and Transfusion‐Related Adverse Reactions: A 14‐Year Experience at a University Hospital
Yoshiaki Furuta*1, Yuki Nakamura1, Miho Tokida1, Kayoko Ichikawa1, Toshiya Ohsawa1, Mitsuo Ohkubo2,3 and Akimichi Ohsaka1,4
1Juntendo University Hospital, 2Juntendo University Urayasu Hospital, 3Juntendo University Graduate School of Medicine, 4Department of Transfusion Medicine and Stem Cell Regulation, Juntendo University School of Medicine
Background/Case Studies: In Japan, pre‐operative autologous blood donation (PAD) transfusion still plays a role in eliminating risks related to allogeneic blood transfusion, especially transfusion‐associated graft‐versus‐host disease. The objective of this study was to determine the rate of adverse reactions to PAD transfusion in a single institution over a 14‐year period.
Study Design/Method: Between January 2003 and December 2016, we investigated adverse reactions to PAD transfusion and compared them with those to allogeneic blood transfusion in the hospital. Adverse reactions were categorized according to the definition proposed by the International Society of Blood Transfusion (ISBT) Working Party on Haemovigilance.
Results/Finding: A total of 178,014 blood components were transfused during the study period, of which PAD transfusions numbered 13,653 (8%), whereas allogeneic blood transfusions numbered 164,361 (92%). The number and rate of adverse reactions to PAD transfusion were 16 and 0.1%, whereas those of allogeneic blood transfusion were 1,075 and 0.7%, respectively, with the latter being significant (p < 0.01). Among 16 adverse reactions to PAD transfusion, the most common was febrile non‐hemolytic transfusion reaction (FNHTR) at 12 (75%), followed by allergic reaction at 4 (25%). The severity of adverse reactions to PAD transfusion was Grade 1 (non‐severe) in all cases. With regard to blood component types, 16 adverse reactions involved: 12 cases of whole blood PAD, 2 of frozen PAD, and 2 of autologous fresh‐frozen plasma. Adverse reactions caused by autologous blood conservation were not observed in perioperative autologous cell salvage or acute normovolemic hemodilution in this study.
Conclusion: Non‐severe adverse reactions were observed on PAD transfusion at a rate of 0.1% at our institution.
ED2
Correlating Transfusion Medicine In‐Service Examination Scores with Outcomes of the American Board of Pathology Transfusion Medicine Subspecialty Certifying Examinations
Alexis R. Peedin*1, Jonathan R. Genzen2 and Julie Katz Karp1
1Thomas Jefferson University Hospital, 2University of Utah Department of Pathology
Background/Case Studies: The Transfusion Medicine In‐Service Examination (TMISE) is offered online in the fall and the spring to Transfusion Medicine (TM) Fellows. First offered in 2010, the exam represents cooperation between the American Society for Clinical Pathology (ASCP) and the AABB and consists of approximately 120 multiple‐choice items. A previous study found that senior pathology Resident In‐Service Examination (RISE) scores correlate with outcomes on the American Board of Pathology (ABP) primary certifying examinations. We hypothesized that TMISE scores correlate with outcomes of the ABP TM subspecialty certifying examination (TM boards).
Study Design/Method: TM fellowship Program Directors and Coordinators were identified via the Accreditation Council for Graduate Medical Education (ACGME) website and were emailed an Excel spreadsheet on which to capture anonymous data about TM fellows from 2010 onward. Fields included the fellow's primary specialty, whether they had clinical hematology/oncology subspecialty training, fellowship graduation year, the season and year of TMISE prior to graduation, whether TMISE was proctored, the fellow's TMISE “Your percentile” and “Your Score”, and year and outcome of any TM board attempt. Average TMISE scores were compared using an unpaired t test (SigmaPlot 13), and p<0.05 was defined as statistically significant.
Results/Finding: Of the 48 TM fellowship programs contacted, 23 (48%) responded with at least some data for a total of 159 fellows. Both TMISE results (score and/or percentile) and outcome of a first attempt at the TM boards were provided for 131of these fellows. The average TMISE score of fellows who passed on the 1st TM boards attempt was 71.2, while the average score of fellows who failed on the 1st TM boards attempt was 64.4 (p=0.012). Fellows scoring in the first quartile of the TMISE had a 96% first time TM boards pass rate, in the second quartile had a 94% pass rate, in the third quartile had an 82% pass rate, and in the 4th quartile had a 93% pass rate (Table 1).
Conclusion: The average score of fellows who passed TM boards on the 1st attempt was significantly higher than that of fellows who failed. The TMISE quartile does not appear to predict TM board outcome. This may be due to the prolonged interval between TMISE and TM boards administration. Fellows scoring in the 1st quartile are at lower risk of failing TM boards.
TABLE 1
| TMISE “Your Score”, avg | ||
|---|---|---|
| Passed on 1st attempt (n = 119) | 71.2 | p=0.012 |
| Failed on 1st attempt (n = 12) | 64.4 | |
| TMISE Quartile | 1st time TM board pass rate | TMISE Score, avg + /‐ SD |
| 1st (n = 28) | 96% | 79.2 + /‐ 5.3 |
| 2nd (n = 50) | 94% | 69.9 + /‐ 4.7 |
| 3rd (n = 17) | 82% | 62.6 + /‐ 4.1 |
| 4th (n = 14) | 93% | 56.9 + /‐ 5.1 |
ED3
Transfusion Medicine Laboratory Professionals Face Increasing Challenges for Accessing High‐Quality Continuing Education Training
Erica Antell*1, Ghislain Noumsi1,2 and LeeAnn Walker3
1Grifols Diagnostic Solutions Inc., 2The Grifols Academy of Immunohematology (TGAIH), 3University of Texas Medical Branch
Background/Case Studies: Continuing education (CE) training for clinical laboratory personnel is critical for maintaining knowledge, proficiency, and skills. In the transfusion medicine laboratory, most certification agencies, as well as employers, require an average of 12 CE credits annually in order to maintain professional certification. However, laboratory and medical staff are facing increasing challenges to find opportunities to meet these requirements.
Study Design/Method: A self‐administered anonymous survey was developed to identify the challenges laboratory professionals face in order to access high‐quality CE training. This survey comprised 38 questions covering education background, institution requirements, funding, and staffing constraints. This survey was distributed electronically to past attendees of the Grifols Academy of Immunohematology Transfusion Science Educational Course (TSEC) in 2017.
Results/Finding: A total of 293 transfusion medicine laboratory professionals were invited to take this survey, and responses were received from 84 (28.7%). The majority of our respondents were MT/MLS/CLS (68.7%), followed by SBB/BB/SH (44.6%). Approximately half (51.8%) of respondents had greater than 20 years of experience in the clinical laboratory. Among the respondents, 51.8% were employed at a hospital transfusion service laboratory and 18.1% at an immunohematology reference laboratory. Almost all (90.4%) of our respondents were certified by the American Society of Clinical Pathology (ASCP). In 60.2% of cases the respondent indicated 11‐15 CE hours were required for maintaining their certification, and the same was required by the employer of 47.0%. Overall, 93.8% of the respondents attended a CE event within the last year. The most common reasons for not attending CE included: staff shortage (75.0%), funding (68.0%), travel (28.8%), necessity to use vacation time (25.0%) and lack of opportunities covering topics of interest (12.5%). When required, costs associated with event registration, travel, accommodation, and other expenses were paid by individuals or employers in 40.5% and 30.4% of cases, respectively.
Conclusion: Certification agencies and most employers require CE as proof of up‐to‐date professional competency. Most laboratories face financial and staffing constraints that affect the capacity for their staff to access high‐quality CE training. Innovative CE training models need to take these challenges into account in order to ensure their effectiveness.
DG/BTS/0418/0008
ED4
Identifying Trends in Transfusion Medicine Fellowship Programs: Available Positions, Fill Rates, and Accredited Programs
Esteban D. Gnass*, Julie Katz Karp and Alexis R. Peedin
Thomas Jefferson University Hospital
Background/Case Studies: Anecdotally, many Transfusion Medicine (TM) fellowship programs have faced a scarcity of applicants. The purpose of this study was to identify trends in TM fellowship positions available and filled, as well as survey formerly accredited programs for insight into their experience and factors that led to withdrawing accreditation.
Study Design/Method: The National Graduate Medical Education (GME) Census was reviewed to identify number of TM fellowship positions available and filled between academic years 2008‐2009 and 2016‐2017. The American College of Graduate Medical Education's (ACGME) website was searched to identify all TM fellowship programs that were currently or formerly accredited. For the formerly accredited fellowship programs, the former fellowship program director (PD) and/or coordinator listed on the ACGME website was emailed an anonymous survey (created with Google Forms). PDs were asked to identify factors that led to fellowship program withdrawal, whether there were plans to reopen the fellowship program in the future, and an open‐ended question for additional thoughts.
Results/Finding: As of December 2017, the National GME Census reported that the number of accredited TM fellowship programs was stable at 48 from academic years 2008‐2009 to 2016‐2017, while the number of available TM fellowship positions rose from 68 to 74 during this same period. An average of 32% (range 24‐45%) of TM fellowship positions were unfilled each year. As of December 2017, the ACGME reported 68 TM fellowship programs ever having received accreditation, of which 20 had withdrawn accreditation (40% of these in the last 10 years; Table 1). Three of the formerly accredited fellowship programs merged into a single program in 2002, and two others subsequently reopened in 2009 and 2015, respectively. Of the remaining 15 formerly accredited programs, only 2 responded to the survey. Both programs cited several years with a lack of applicants and significant ACGME administrative requirements to maintain accreditation as primary reasons for withdrawal. As of April 2018, two additional TM fellowship programs have been accredited to open in July 2018 with one position each.
Breakdown of Transfusion Medicine programs that have withdrawn from ACGME accreditation
| Programs that have withdrawn accreditation | Programs that have re‐accredited or merged | |
|---|---|---|
| Total | 20 | 5 |
| 2013‐2017 | 4 | 1 (re‐accredited) |
| 2008‐2012 | 4 | 1 (re‐accredited) |
| 2003‐2007 | 7 | 0 |
| 2002 and earlier | 5 | 3 (merged) |
Conclusion: While the number of TM fellowship programs has remained steady since 2009, the number of available positions has increased. One‐third of these TM fellowship positions are unfilled annually, giving credence to the anecdotal difficulty in securing a fellow each year. Future studies investigating trainees’ motivations to pursue a TM fellowship could yield valuable information.
ED5
Hematopoietic Stem Cell Apheresis: Explaining the Big Picture to Little Patients
Louise Helander*1, Robert Vasquez2, E. Shannon Cooper3 and Caroline Raasch Alquist4
1Department of Pathology, Louisiana State University Health Sciences Center, 2Section of Pediatric Hematology, Oncology, & Stem Cell Transplantation, Ochsner Health System, 3Ochsner Foundation Hospital, 4Department of Pathology and Laboratory Medicine, Section of Transfusion Medicine and Histocompatibility, Ochsner Health System
Background/Case Studies: This booklet continues the educational pediatric apheresis series with a third installment tackling the issues surrounding hematopoietic stem cell collection by apheresis. Over 2000 hematopoietic stem cell transplants (HSCT) occur annually in the United States in patients under the age of twenty. As of 2016, over twenty percent of these transplants utilized apheresis‐derived autologous or allogeneic products, an increase from recent years. As with any invasive medical procedure, hematopoietic stem cell collection by apheresis can be psychologically upsetting in the pediatric population, causing fear, pain and feelings of helplessness. These feelings can manifest as anger, aggression, and anxiety, which can lead to increased procedure times, treatment delays, and long term psychological trauma. Studies show that educating pediatric patients and their families on what to expect, as well as hospital staff expectations of them, can reduce these feelings of anxiety, help patients feel empowered, and reduce emotional trauma. Previous projects revealed the lack of age appropriate literature on apheresis procedures in general, including the topics covered in the first two booklets of this series, therapeutic plasma exchange and red blood cell exchange.
Study Design/Method: An age‐specific storyboard was developed in collaboration with a pediatric hematologist‐oncologist and apheresis physicians. The accompanying artwork was produced in conjunction with a medical illustrator to enhance the story for our pediatric audience.
Results/Finding: The story discusses why the apheresis stem cell collection is being performed, details the steps leading up to the procedure, and reviews what will occur on the day of collection. Included are strategies for coping, as well as a brief mention of what to expect in the future when the child returns for their transplant. While the storyboard directly addresses the procedure from the standpoint of an autologous donation, the booklet may also be helpful for allogenic pediatric donors preparing for their collections. The booklet has been made available on the hospital website for patient use.
Conclusion: This installment of our pediatric apheresis series provides educational material at an age appropriate level to help prepare and reduce the stress experienced by both children and their caregivers during stem cell collections. This material serves as anticipatory guidance for a vulnerable and sensitive population. Ultimately, it has been designed to promote well‐being, coping strategies, and empowerment by reducing the fear of the unknown as our smallest patients prepare for these complex, invasive procedures.
ED6
Donor Services Quick Tips ‐ Informal Microlearning Videos
Justin McDougall*
OneBlood
Background/Case Studies: The purpose of this study is to gain evidence as to the effectiveness of microlearning videos on donor collections and operations and if videos are favorably accepted by individuals in the organization. The hypothesis is that people are drawn to and respond to video. Much of the information transmitted to the brain is visual and visual aids have been found to improve learning. Video learning is advantageous as it engages both visual and auditory channels of the brain. The assertion is that microlearning videos can help in knowledge retention as videos spread the cognitive load on the learner between auditory and visual learning channels.
Ten microlearning videos have been created in one year and learners are able to access the videos on demand through the organization's internal website. A banner was created on the homepage of the organization's internal website so team members would easily be able to click the banner and access the Quick Tips video library.
Study Design/Method: Videos are developed through the partnership of the Marketing and Communications Department and the Training Department. The videos were filmed at the organization's Orlando location in the multimedia studio. Videos were also filmed in the organization's simulation lab. The scripts are developed by the training department and are then reviewed and approved by the Director of Process Improvement. Then a representative from Quality Assurance attends filming to ensure all videos accurately represent current steps in the SOP for the topic. The following videos have been created during this study on the efficacy of microlearning videos:
Packing Apheresis Blood Products
Minor Consents
Hand Washing
Donor Contact Information
Filling Sample Tubes
Consent Sense
Donor Arm Preparation
Needle Guard
Adverse Reactions
Looking Up Offline SOPs
Results/Finding: Unit event data was obtained regarding insufficient quantity in sample tubes and minor consent forms. Both reports indicated an improvement of 15% and 10% respectively based on three months of event data obtained before and after the videos were presented.
Survey data was obtained for three months prior to submission of this abstract. To date 130 team members have completed the survey. Questions asked on the survey and the responses are as follows:
How did you find out about these videos? 89.23% received an email, 8.46% were asked to view by their manager, and 2.31% found it on the internal website.
How Many Quick Tips videos have you viewed? Of those who completed the survey, the average number of microlearning videos viewed was four. The total number of videos viewed by all respondents is 531.
How easy was it to find the Quick Tip videos? On a scale of 1‐5 with one being not easy to find at all and five being very easy to find the weighted average was 4.57.
Do the Quick Tips help you on your job? On a scale of 1‐5 with one being not helpful and five being very helpful on the job the weighted average was 4.25.
Do you enjoy the short video format for training? On a scale of 1‐5 with one being not really and five being yes, love them! The weighted average was 4.36.
Click count data was obtained for the video titled, Looking Up Offline SOPs, released on 4/16/2018. The video has received 232 hits and 154 unique users.
Conclusion: It has been found that organizationally microlearning videos are favorably received and have a positive impact on team member's daily work. Therefore the Quick Tips microlearning video program will continue.
ED7
Strengthening Clinical Pathology Resident Engagement in Patient Safety Education with Prospective Auditing of Transfusion Orders
Emilio Madrigal*1, Mark T. Friedman2 and Kyle Annen3
1Emory University, 2Mount Sinai St. Luke's‐West Hospital, 3Children's Hospital Colorado
Background/Case Studies: Although blood transfusion remains the most common procedure performed during hospitalization, deficits in transfusion medicine knowledge exist amongst physicians. Improper and unnecessary transfusions may adversely affect patients. Following competency‐based initiatives by the Accreditation Council for Graduate Medical Education and evidence‐based blood‐conservation strategies, clinical pathology (CP) residents at our institution have taken an active role in improving patient safety and healthcare quality by directly engaging clinicians during prospective audits (PA) of out of guideline transfusion orders. In this study, we assessed whether or not pathology residency programs across the United States (US) utilize PA as a way to improve transfusion medicine (TM) education and ultimately patient outcome.
Study Design/Method: A five‐part questionnaire was distributed amongst pathology program directors (PDs) to evaluate whether or not on‐call CP residents participate in PA of transfusion requests, and to learn about the structure of their residency programs.
Results/Finding: Of the 142 surveyed accredited pathology programs, 32% (46/142) responded to the questionnaire. Fifty‐four percent (25/46) of PDs stated that CP on‐call residents perform PA red blood cell (RBC) transfusions that do not meet hospital guidelines. Seventy‐six percent (16/21) of programs without a PA system reported monitoring out of guideline RBC transfusions with other methods. Less than half (18/46) of surveyed PDs held the position of TM director, while only 11% (3/27) of associate PDs hold that responsibility.
Conclusion: CP resident involvement in the PA component of our patient blood management program has significantly improved transfusion practices and reduced unnecessary transfusions. Our assessment of US pathology residency programs reveals a missed opportunity, by close to half of surveyed institutions, to directly involve residents in relevant patient improvement programs. Resident engagement in competency‐based initiatives enhances their medical knowledge and ultimately improves patient safety.
ED8
Bedside Transfusion Practices. Still a Difficult Terrain
Anubhav Gupta1, Hari Krishan Dhawan*1, Ratti Ram Sharma1, Neelam Marwaha2, Amarjeet Singh1 and Vipin Koushal1
1Postgraduate Institute of Medical Education and Research, 2Department of Transfusion Medicine, PGIMER
Background/Case Studies: A good bedside transfusion practice is a critical element in the transfusion chain. It depends on the competency of physicians based on their knowledge regarding the standards and blood transfusions guidelines and its application as practices in patient care. The present study was aimed at assessment of basic knowledge of clinical residents in our institute regarding blood transfusion guidelines and the bedside transfusion practices in our set up. Accordingly, the intervention strategies were planned, executed and a post‐intervention assessment was performed to understand the impact of these interventions.
Study Design/Method: The study was divided into three phases. In pre‐intervention phase, blood transfusion practices were assessed in pre‐decided clinical areas by observing transfusion episodes. All steps occurring at patient bedside were assessed including; Informed consent, Physician order, Blood requisition, Bedside checks, Starting transfusion and monitoring and documentation using pre‐designed proforma. For assessing the knowledge of clinical residents, they were subjected to questionnaire based on Institute's blood transfusion guidelines. To fill the gaps in knowledge and practices of clinical residents regarding blood transfusion practices, educational strategies including audio‐visual interactive seminars in each clinical specialty, regular messages, and e‐mail alerts to regularly sensitize them in the intervention phase were implemented. In post‐intervention phase, same clinical areas were assessed for blood transfusion practices.
Results/Finding: The average score of knowledge regarding bedside transfusion practices in the study was found to be 61%, and this was gained by the residents through word of mouth from senior colleagues and clinical experience during their stay in the hospital. The first year residents had 56% correct response rate to the questionnaire which increased to 60% in 2ndand 63% by 3rd year. However, the actual good bedside transfusion practices were followed in less than 30% observations. Improper bedside storage of blood components was a major concern leading to deterioration of the quality of blood components. Best sample labeling practices were being followed in less than 40% observations, and informed consent record was found in less than 10% of observations despite the fact that > 80% had the knowledge regarding the same in knowledge assessment. After educational interventions, there was a slight improvement in the practices like blood transfusion consent, physician order, documentation of patient identity check in the file, improper storage of components in the ward refrigerator but the improvement was not statistically significant. Multitasking by patient bedside without any help from nursing staff in blood transfusion‐related activities was a major reason for non‐compliance.
Conclusion: The present study gave us the insight that there is a lot of scope for improvement in the bedside transfusion practices in our hospital which can only be achieved through continuous educational efforts followed by effective assessment and gap analysis.
ED9
An International Collaboration to Reinforce the National Hemovigilance Program in Ghana: Education and Training Are the Tools
Srijana Rajbhandary*1, Patricia M. Knox1, Marcia Cardoso2, Shilo Wilkinson2, Stephanie Nealis3, Shirley Owusu‐Oforie4, Diane P. de Coning1, Justina K. Ansah5, Lucy Asamoah‐Akuoko5 and Christine Bales1
1AABB, 2Terumo BCT, 3Dovel Technologies, LLC, 4Komfo Anokye Teaching Hospital, 5National Blood Service Ghana
Background/Case Studies: The Japan International Cooperation Agency (JICA) funded a 2‐year project to support the hemovigilance (HV) program overseen by the National Blood Service, Ghana (NBSG), in collaboration with Terumo BCT, Inc. (TBCT). The objectives of the project were to improve current transfusion practices by training medical staff on HV and establishing a system to monitor and evaluate the safety of blood transfusions, while comparing acute transfusion‐related adverse reactions (TRAR) in patients who received transfusions of whole blood (WB) treated using the Mirasol Pathogen Reduction Technology (PRT) System and patients who received conventional WB transfusions. Korle Bu Teaching Hospital (Accra) and Komfo Anokye Teaching Hospital (Kumasi) were the selected sites.
Study Design/Method: The HV training plan was designed by AABB's consulting services (AABBCS) after assessment of existing practices of NBSG. The aim was to develop practical training materials to create HV awareness and increase transfusion medicine knowledge among the trainees (hospital and NBSG staff). An 11‐day training program incorporating lectures and practice sessions on the wards was developed using Ghanaian and AABB expertise. AABBCS engaged Dovel Technologies, LLC to develop the HV infrastructure — a cloud‐based data repository (portal) for electronic data capture, management, and analysis of transfusions and TRAR. The HV training included following topics: 1) quality systems (as defined in the Africa Society for Blood Transfusion Standards); 2) TRAR (based on the ISBT definitions for non‐infectious transfusion reactions), near misses and follow up; 3) HV form completion and report writing; and 4) database development and use of the cloud‐based portal for analysis. TBCT provided training on the operational process, which included manufacture, issue (Mirasol or non‐Mirasol) and administration of blood products.
Results/Finding: NBSG is currently monitoring the project in collaboration with leads from the two hospitals. Since the launch of the project in early June 2017, more than 1,100 transfusion records have been reported into the cloud‐based portal as of mid‐March 2018. An audit, conducted five months post‐training, demonstrated an increased level of knowledge and enthusiasm for HV and better compliance to the operational processes. In addition, the principle behind the training (“train the trainers”) has been realized, as both the HV knowledge and the Mirasol experience is being shared amongst other staff.
Conclusion: Establishing an effective HV infrastructure is a multi‐stakeholder undertaking. The HV training strengthened quality requirements of transfusion practice through better monitoring and reporting of transfusions and TRAR. Lessons learned will assist in the expansion of similar training programs and HV infrastructure at other sites, with the goal of establishing a national HV system in Ghana.
ED10
Developing a Student‐Centered Donor Workshop in a University Setting
Elizabeth Hart* and Kimberly Ouellette
University of Massachusetts‐Dartmouth
Background/Case Studies: There are over 50 requirements that an individual must achieve to be eligible to donate blood. Students may find it difficult to learn all of these requirements and lecture presentations on this topic may be dry and typically unengaging. The Blood Bank Professors in a Medical Laboratory Science program in the Northeast wanted to find a new method to teach this subject matter. This program generally has 30‐40 senior level students and the instruction during senior year is designed in blocks which students spend a certain number of days in each content area. The immunohematology section consists of 14 days that include both lecture and laboratory experiences. Having this compressed schedule, there is only one day dedicated to the donation process. In an effort to create an interactive learning experience that fits into this schedule, while providing students with quality content, a workshop was developed with role playing to aid the students in learning these requirements.
Study Design/Method: A pilot workshop was designed having students role play the donor interview process to aid in learning the various reasons for deferral. A lecture was presented prior to the workshop to introduce the students to the interview process and donor eligibility.
All students worked in pairs and were given an instructor‐designed donor binder to serve as a guide during the workshop. The binder contains information regarding medication deferrals, travel restrictions, and two predetermined scenarios containing donor information. Using this information, one student completed the interview questionnaire. The student as the “interviewer” was given information regarding the hemoglobin, hematocrit, weight of the donor, and platelet count when applicable as the “mini physical”. The interviewer then reviewed the questionnaire as well as the mini physical card and asked any follow up questions as applicable. The interviewer then completed a worksheet to answer questions whether the donor was eligible and if not, what was the reason for ineligibility. The roles were then switched so all students had the opportunity to play both roles.
Results/Finding: The workshop executed in January 2018 has shown initial success. Students described the workshop as helpful and were engaged during the process. The average exam score for donor eligibility from 2013‐17 was 79.3 and the 2018 exam average was 85.8. This anecdotal evidence shows an increase in understanding this content.
Conclusion: Although the eligibility criteria for donors is complex and ever changing, this information can be presented in a way that maximizes learner engagement and understanding. There is potential for this workshop to be adapted to train other healthcare professionals in donation facilities or as a competency assessment tool, keeping in mind the time constraints in these facilities.
INS1
Are Automated Titration Studies Consistent over Time?
Leigh Frost*, Jenny Petkova, Michael Healy and Michael Lankiewicz
Christiana Care Health Services
Background/Case Studies: In August 2015, FDA approved the ORTHO VISION® Blood Bank Analyzer which employs column agglutination gel technology. In June 2016, two transfusion services within a 1,000 + bed community hospital system implemented routine use of the Ortho VISION®. The test menu was fully evaluated, including antibody titration. Validation studies clearly demonstrated increased sensitivity of automated antibody titrations; resulting in a two‐fold increase in titer on average over traditional tube technique titer results. However, it was unknown whether the age of 0.8% reagent red blood cells was a factor in the sensitivity of the automated assay.
Study Design/Method: A retrospective analysis was conducted comparing automated titration results over time. A minimum of three separate patient sera containing antibodies to each of the following blood group systems were studied: Rh, Kell, Duffy and Kidd. Samples were frozen in multiple aliquots to facilitate study over time. Automated antibody titrations were performed upon receipt of a fresh lot of 0.8% Ortho RESOLVE® Panel A or B. Titration studies were then repeated each week; using the exact same 0.8% reagent red cell reagent until expiration of the panel. Then, one additional titration study was performed on each sample using the next, fresh lot# of 0.8% Ortho panel cells (different reagent red cell donor) in an attempt to fully evaluate automated titration consistency over time.
Results/Finding: Of the 12 total sera evaluated in this study, 10/12 (83.3%) resulted in titer results no more than a one‐fold difference throughout the entire study period, including across lot numbers of 0.8% Ortho Panels. As for the two outliers, one was anti‐K and the other was anti‐Fyb. The anti‐K sample demonstrated a two‐fold increase in titer to 64 (from 16) upon testing with the fresh 0.8% reagent red cell of a different lot. The anti‐Fyb sample demonstrated a two‐fold increase in titer to 16 (from 2) upon testing with fresh 0.8% reagent red cell of a different lot. NOTE: The serological phenotype (for target antigen/allele) of the 0.8% reagent red cells selected for titration studies was identical across lot numbers.
Conclusion: The VISION® provides a standardized methodology to conduct titration studies with a high degree of reproducibility. Automated titer results did not vary more than one‐fold difference over time, upon use of a consistent 0.8% reagent red cell antigen source. But even when antigen source was inconsistent, the titer result did not change more than two‐fold from the original result. The data suggests the age of in‐date 0.8% reagent red cells has no significant impact on automated titration results. However, random differences between individual reagent red cells may affect titer results; up to a two‐fold difference.
INS2
Operational Evaluation of a Hybridization‐Based RBC Genotyping System within a Hospital Environment
Chelsea Hayes*1, Ellen B. Klapper1, Jina Seo1 and Ghislain Noumsi2
1Cedars‐Sinai Medical Center, 2Grifols Diagnostic Solutions Inc.
Background/Case Studies: Our hospital transfusion service uses a US FDA approved DNA genotyping system to predict extended RBC phenotypes of donors and patients. The aim of this study is to evaluate operational characteristics of a research use only genotyping platform (IDCORE XT, Grifols Diagnostic Solutions Inc., CA).
Study Design/Method: DNA was extracted from EDTA whole blood samples and tested using IDCORE XT and the current system. Turnaround time (TAT) from DNA extraction to final result receipt, and technologist hands‐on time were compared for different batch sizes. At the end of the study a questionnaire was administered to each operator to evaluate the ease of performing key procedural steps for each system, using a scale of 1‐5 with 5 being the easiest.
Results/Finding: A total of 408 samples were tested on both systems. TAT, method comparison and associated operator survey results are presented in Table 1. IDCORE XT showed a 24.5% and 51.3% reduction in mean TAT and hands‐on time, respectively, as compared to the current system. Each operator performed a mean of 5.5 IDCORE XT runs. The mean overall operator rating of IDCORE XT and the current system's key features was 4.4 and 3.7, respectively.
TABLE 1 (INS2)
| TAT | Current system | IDCORE XT | ||||
|---|---|---|---|---|---|---|
| Batch size | Number of batches | Mean Hands‐on time (min) | Mean Total TAT (min) | Number of batches | Mean Hands‐on time (min) | Mean Total TAT (min) |
| 8 | 2 | 55.5 | 295.5 | 2 | 42.8 | 236.8 |
| 32 | 1 | 124 | 364 | 1 | 47 | 253 |
| 48 | 3 | 134 | 374 | 4 | 54.9 | 268.9 |
| 96 | 2 | 163.5 | 403.5 | 2 | 87.5 | 325.5 |
| Method comparison and operator survey* (n=2) | Current system | IDCORE XT | ||
|---|---|---|---|---|
| Reagent storage | Frozen; requires thawing | 3 | Refrigerated | 4.5 |
| Reagent inventory control | Manual | 2 | Automated reagent volume tracking with short date notification | 5 |
| Creation of plate layout | Manual | 3.5 | Automated | 4.5 |
| Data analysis | Centralized database management system; high number of image failures | 3 | Integrated analysis software | 4.5 |
| Sample‐result association | Manual | 3 | Automated | 4.5 |
| Troubleshooting | Vendor assistance required | 2.5 | Some in‐house troubleshooting | 4 |
| Daily maintenance time | 5 minutes | 4.5 | 10 minutes | 4 |
| Available kit sizes | 96 | NA | 48 | NA |
| Minimum number of tests per batch without wastage (including controls) | 8 | NA | 3 | NA |
| Indeterminate result | Entire sample is invalid | NA | Only antigen in question is invalid | NA |
| Failed QC | Entire run is invalid | NA | Flexible QC result interpretation | NA |
| Monthly QC monitor | Manual | NA | QC summary data generated by system | NA |
*Operator survey: 1 very difficult, 2 difficult, 3 acceptable, 4 easy, 5 very easy
Conclusion: When comparing operational characteristics, the IDCORE XT system offered certain advantages, including ability to efficiently test a smaller number of samples without wastage, less technologist hands‐on time, faster TAT, and an increase in automated processes, including reagent tracking, QC monitoring, plate layout and sample‐result association. The IDCORE XT system required slightly more time for daily maintenance.
INS3
Comparing Gel to Solid Phase Methodologies in a Large Hospital Transfusion Service: Concordance Data of High‐Throughput Automated Immunohematology Analyzers
Martha Marks1, Robert T. Robinson1, Jaylen Rivera1, Leah M. Golden1, Jessica Poisson2, Melissa J.A. Laufer3, Bob Pembroke3 and Nicholas Bandarenko*2
1Duke University Medical Center, 2Duke University Hospital, 3Bio‐Rad Laboratories, Inc.
Background/Case Studies: The purpose of this study was to prospectively evaluate the performance of 2 high‐throughput gel‐based analyzers (IH‐1000™ Automated Blood Group: Bio‐Rad Laboratories, Inc. Hercules, CA) in an academic hospital transfusion service performing approximately 85,000 type and screen tests annually. The analyzers were evaluated for concordance with a high‐throughput solid‐phase platform (Neo®: Immucor, Inc. Norcross, GA) currently in use, as well as tube testing and blood supplier labeling.
Study Design/Method: Tests for ABO/Rh (forward and reverse), antibody screen (ABS); ABO/Rh donor unit confirmations, and crossmatch compatibility (IgG) were performed on 2 IH‐1000™s using IH‐System Gel Cards, and compared to the Neo® as control method using the same EDTA samples. EDTA cord blood samples were tested with the IH‐Newborn Card compared to the Neo®. Additional samples tested with Anti‐IgG,‐C3d and Anti‐IgG were correlated against tube testing for the DAT. Antigen typing for C, c, E, e, and K were compared with tube testing (using commercial reagents) or blood supplier labeling. The concordance rate was calculated for the IH‐1000™s together compared to the control method used for each assay.
Results/Finding: The IH‐1000s had 100% concordance with controls for ABO grouping assays, ABO/ Rh donor confirmations, Rh and Kell antigen typing assays, as well as the Anti‐IgG crossmatch and Newborn testing card (Table 1). Regarding DAT concordance, the increased sensitivity is reflected in the gel methodology over tube testing.
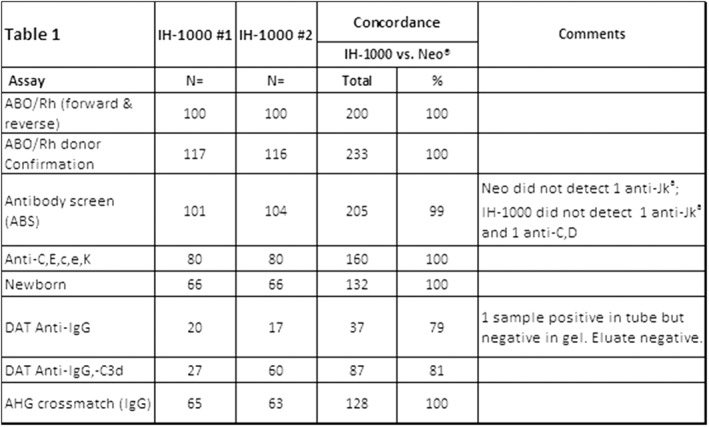
Conclusion: High‐throughput automated immunohematology systems are essential to support the test volumes in a large hospital transfusion service environment that performs type and screens, ABO/Rh unit confirmations, Rh and Kell antigen typing, and antibody identifications. This study demonstrates the IH‐1000™ analyzers with IH‐System Gel Cards are equivalent to the Neo® Immunohematology analyzer or tube tests, using the same samples for concordance. Rare method‐dependent examples of anti‐Jka were identified in both systems. The acceptable lower concordance in comparisons with DAT tube testing was attributed to known increased sensitivity of gel based antiglobulin testing.
INS4
Evaluation of Automated Instrumentation for Blood Bank Implementation
Gwen Howell*, Melissa R. George, Nancy Hinkle, Sue Kale and Laura Duke
Penn State Health, Milton S. Hershey Medical Center
Background/Case Studies: Automated Blood Bank testing platforms allow staff to multitask, reduce turnaround time and improve antibody detection when the automated instrument meets performance expectations. Historical state utilized the Immucor Galileo Echo® instrument to perform Type & Screen testing and antibody identification through solid phase methodology. Staff encountered an increase in positive antibody reactivity that appeared non‐specific and was non‐repeatable by the gold standard method (PEG). This led to an increase in turnaround time for critical patients and a temporary elimination of automated antibody panel testing from workflows.
Study Design/Method: Additional automated instrument platforms (Immucor Echo Lumena™ and Immucor NEO®) were assessed and compared to current instrumentation for ease of use, turnaround time, and method comparison; focusing on non‐repeatable antibody positivity rates. Staff were trained to use the new instrumentation and compared day to day operations to existing instrumentation for ease of use and workflow capabilities. Turnaround time was compared between Echo® and NEO® instruments for Type & Screen sample runs of 2, 6, and 10 specimens as well as concurrent loading of 2 and 6 sample sized runs. Method comparison was performed on twenty samples over a one month period on all three instruments. Samples utilized tested antibody screen positive (? to 3+) on the existing Echo® and negative by PEG. Antibody screens were then repeated on Echo Lumena™ and NEO® to assess reactivity.
Results/Finding: Staff determined that the Echo Lumena™ and NEO® instruments were similar to use when compared to existing instrumentation and would not be difficult to implement in the lab. Comparing turnaround time between the Echo® and NEO® instruments for Type and Screen testing, it was determined that while the Echo® had a shorter turnaround time for a 2 sample run, the NEO® had a shorter turnaround time for all larger or concurrent runs. Turnaround time was reduced by 2‐26 minutes, with the reduction increasing as the run size became larger. The NEO® was able to provide an ABO/RH result 7 minutes faster than the Echo®. Of the samples that initially tested antibody screen positive on the Galileo Echo®, 16 of the 20 samples repeated negative on the Echo Lumena™ and 18 or the 20 samples repeated negative on the NEO®. An overall 5‐10% non‐repeatable antibody positivity rate was found for the NEO® and a 15‐20% non‐repeatable antibody positivity rate was found for the Echo Lumena™.
Conclusion: At the completion of the instrument assessment, it was determined that the Immucor Echo Lumena™ and Immucor NEO® would be acceptable instrument alternatives to existing instrumentation. Factors that lead to this conclusion included the reduction in turnaround time for both Type & Screen and ABO/RH testing on the NEO®, ease of use of the Echo Lumena™ and NEO® by staff, and the reduction of the non‐repeatable antibody positivity rates for both the Echo Lumena™ and NEO® instrumentation. This reduction could lead to a decrease in manual testing required and an ability to again use automated antibody panel testing to complete complex workups without negatively affecting workflow or creating unnecessary reagent utilization.
INS5
Advantages of Capillary Electrophoresis Hemoglobinopathy Testing in a Licensed Public Cord Blood Bank
Kelly L. Anderson*, Guillermo Martinez, Jacob Joye, Edward R. Jones, Juan Merayo‐Rodriguez and Christopher Lough
LifeSouth Community Blood Centers, Inc.
Background/Case Studies: Cord blood units (CBUs) must be tested for hemoglobinopathy prior to release for allogeneic transplant. This test was previously outsourced to a lab that used isoelectric focusing (IEF). An in‐house test using capillary electrophoresis (CE) was evaluated for comparability.
Study Design/Method: A Sebia Capillarys II Flex Piercing instrument using Phoresis 8.6.3 software was evaluated for accuracy and precision. The instrument has eight capillaries, capable of running eight samples simultaneously.
Accuracy was examined by testing Sebia's quality control samples multiple times and comparing results to the package insert expected results. Intra‐run precision was evaluated by running the hemoglobin (Hb) F control 24 times in a single run (3 racks of 8 samples). Inter‐run precision was evaluated by running one normal and two abnormal CBU samples over multiple days using all eight capillaries.
Parallel testing between the external lab and new in‐house instrument was conducted to determine correlation between methods.
Results/Finding: All accuracy results were within range of the manufacturer's specifications for the Hb AFSC, A2 normal, pathological A2 and AF controls.
Precision data (Table 1):
(INS5)
| CBU | Bart % | Hb A% | Hb F% | Hb A2 % | Hb C % | ||
|---|---|---|---|---|---|---|---|
| Intra‐run | HbAF control | Average | 33.4 | 66.2 | 0.5 | ||
| SD | 0.2 | 0.2 | 0.1 | ||||
| CV | 1 | 0 | 11 | ||||
| Inter‐run | Normal | Average | 14.8 | 85.2 | |||
| SD | 0 | 0 | |||||
| CV | 1 | 0 | |||||
| Abnormal #1 | Average | 1.0 | 28.5 | 70.4 | 0.1 | ||
| SD | 0.2 | 0.6 | 0.7 | 0.1 | |||
| CV | 16 | 2 | 1 | 106 | |||
| Abnormal #2 | Average | 10.1 | 83.9 | 6.0 | |||
| SD | 0.1 | 0.1 | 0.1 | ||||
| CV | 1 | 0 | 1 |
Higher CV for A2 and Bart were deemed acceptable due to the low values for each replicate.
(Table 2) Test method correlation
| CE | IEF | |
|---|---|---|
| True Negatives | 99 | 98 |
| True Positives | 21 | 21 |
| False Positives | 0 | 0 |
| False Negatives* | 1 | 2 |
| Total | 121 | 121 |
| CE compared to IEF | ||
| Sensitivity | 95.5% | |
| Specificity | 99.0% | |
| Positive Predictive Value | 100.0% | |
| Negative Predictive Value | 99.0% | |
| Concordance | 99.2% | |
*Further molecular testing revealed the discrepant results were false negatives for the reference lab.
Using the reference lab's results, which do not include a percentage of Bart Hb, 1.7 % of total processed units have been historically excluded from clinical use due to abnormal Hb results. The Phoresis software determines the percent of Bart Hb present, which allows medical directors determine the clinical significance of the hemoglobinopathy, and potentially approve CBUs for clinical use which would have been formerly otherwise discarded. In the first 3 months of employing CE, 3 CBUs have been saved from exclusion due to hemoglobinopathy.
Conclusion: Evaluation of this CE instrument met and exceeded requirements. Turn around time was shortened by approximately 3 weeks. Cost was comparable to IEF. CE is more sensitive than the previous method helping to save potential lifesaving units. For these reasons, the CE method was chosen to replace the reference lab.
INS6
Validation of a Thermocouple Thermometer for Qualifying Units for Return to Inventory
Katheryne Igo*1, Vincent Jones1, Robert P. Igo2 and Priscilla I. Figueroa1
1Cleveland Clinic, 2Case Western Reserve University
Background/Case Studies: Blood products intended for inventory must be maintained at temperatures defined by Federal regulations. We evaluated the Temp‐Check (T‐C) thermometer (Digi‐Trax, Lincolnshire, IL) as a possible enhancement to our existing blood product return process. The T‐C, similar to a scale in appearance, takes the temperature of a blood product by reading the outside of the bag as it sits on the device. Temperature is reported as an integer.
We were unsure how measurement of the outside of the bag would compare to our gold standard used in previous temperature validations, a temperature probe inserted into the center of the unit. According to manufacturer materials, T‐C's are sold with calibration certificates and are stated to be accurate to within one degree Celsius (°C), but no error range such as the standard deviation or confidence interval is provided. The latter is of particular concern for establishing cut‐offs for product return acceptability.
Study Design/Method: Two RBC and two plasma units were removed from the refrigerator and allowed to warm toward room temperature. Multiple paired temperature readings were performed with the T‐C device and the established gold standard at our institution, a LogTag recorder (TREX‐8), (LogTag Recorders, Auckland, New Zealand).
A total of sixty (60) pairs of readings were taken (120 total data points). Using linear regression in the software package R (R Foundation for Statistical Computing) we found that mean measurement error and variability were independent of the true temperature and that error was approximately normally distributed around the true temperature.
With that information established it was possible to estimate the range of possible true temperatures as a normal (bell‐shaped) distribution, with the mean equal to the observed temperature minus the expected error and a standard deviation (SD) equal to the measurement error SD.
Results/Finding: The estimated measurement error mean ± SD relative to the true temperature were ‐0.68 ± 0.70°C. Thus, the T‐C had a detectable downward bias, but within the manufacturer's stated accuracy range of ± 1°C.
From the observed distribution we calculated the probability that the gold standard (“True”) temperature was ≤ 10.0°C given a T‐C reading between 7 and 12°C (see table).
| Temp‐Check Reading, °C | Pr (True ≤ 10.0°C) |
|---|---|
| 7 | 1.000 |
| 8 | 0.970 |
| 9 | 0.676 |
| 10 | 0.166 |
| 11 | 0.008 |
| 12 | 0.000 |
Conclusion: With only a 17% probability that a 10°C reading on the T‐C was actually 10.0°C or less, this cutoff was unacceptable. Our institution chose a reading of 8°C on the T‐C as a reasonably ( > 95%) certain indication that the unit's true temperature was 10.0°C or less.
In conclusion, the advertised accuracy of the Temp‐Check device was found to be true on average, but the error around that reading was such that an upper limit of 8°C needed to be established in order to have reasonable confidence that the unit was acceptable for return to inventory.
INS7
New Automation Results in Improved Transfusion Turnaround Time (TAT)
Andrea Pelock*1 and Colleen A. Aronson2
1Advocate Christ Medical Center, 2ACL Laboratories/Advocate Hospitals
Background/Case Studies: A goal was set by the Transfusion Service (TS) to have 83% of STAT Type and Screen (TAS) orders from the Emergency Department (ED) and Labor and Delivery (L&D) completed within 90 minutes of sample/ order receipt. Samples with a positive antibody screen were considered outliers and were not included in the TAT. This TAT is monitored as data is often required for designation of special clinical areas such as trauma and neonatal intensive care.
Study Design/Method: The TS collected data beginning in 2015. Data collected includes date and time of receipt, completion of testing, and issue of blood products in the computer system. The data showed the combined ED and L&D goal was met in 2015 (88.1%), barely met in 2016 (83.9%) and not met in 2017 (76.4%). It was noted that there had been a 27.1% increase in TAS volume from 2015 to 2017: 2015 was 25,775, 2016 was 30,539 and 2017 was 32,754. The instrumentation used in 2015 to 2017 (Ortho Provue) could not handle the volume of testing and does not have STAT prioritization capabilities. New instrumentation was approved and purchased the end of 2017 and Ortho Vision Max was received, validated and put into use on 01/08/2018. An Ortho Vision instrument was also approved, purchased, validated and put into use on 02/07/2018.
Results/Finding: The first quarter of the 2018 ended with 88.6% acceptable TAT (see table). Monthly data shows steady improvement since both new instruments have been implemented with no decrease in the number of TAS received; there is actually a 1% increase in the number of TAS for 1st quarter of 2018 as compared to the 1st quarter of 2017.
Conclusion: Several things contributed to the failure to meet the 90 minute TAT for 2015 to 2017. The Provue could not handle the volume of testing, the Provue did not have true STAT capabilities (TAS testing time was about 45 minutes) and test volumes continued to increase. Evaluating the data enabled new instrumentation to be purchased that is faster and more reliable. TAS testing is complete in about 26 minutes and the Vision/ Vision Max both have STAT prioritization capabilities. In addition to the improved TAT there was also a huge decrease in the amount of reagents being used. Three months after implementing both instruments, the monthly standing order for reagent red cells was able to be cut by 47% which was a cost savings of ∼ $1600/month.
| Date | ED % completed in 90 min | LD % completed in 90 min |
|---|---|---|
| Jan 17 | 70.9% | 67.7% |
| Feb 17 | 79.8% | 76.6% |
| March17 | 76.5% | 77.1% |
| April 17 | 78.7% | 74.1% |
| May 17 | 71.4% | 72.8% |
| June 17 | 77.8% | 78.4% |
| July 17 | 76.2% | 74.0% |
| Aug 17 | 74.2% | 69.3% |
| Sept 17 | 77.1% | 70.3% |
| Oct 17 | 82.8% | 77.2% |
| Nov 17 | 80.4% | 76.8% |
| Dec 17 | 80.0% | 82.6% |
| Year end 2017 | 76.9% | 74.3% |
| Jan 18 | 83.9% | 85.5% |
| Feb 18 | 88.6% | 90.0% |
| March 18 | 92.4% | 91.5% |
NIT5
Closed‐Loop Bioreactor for In Vitro Platelet Production from Hematopoietic Stem Cells
Alina Lotstein1, Nicholas Erdman1, Tracy Bridges2, Brian Madden2, Lillia Holmes1 and Teresa M. DesRochers*1
1KIYATEC, Inc., 2The Blood Connection
Background/Case Studies: Over 2 million donor apheresis platelet units are transfused yearly in the United States at a cost of over $1 billion. These units have a shelf life of five days and are derived exclusively from volunteer donors, a combination of factors that can result in platelet shortages. In vitro manufactured platelets can overcome the issue of supply by providing a ready source independent of available donors. A closed‐loop bioreactor system was designed to recreate key in vivo characteristics native to the hematopoietic stem cell (HSC) niche in a modified 3D cellular environment. cGMP grade reagents and procedures were utilized throughout the entire process with eventual clinical grade manufacturing in mind.
Study Design/Method: The closed‐loop bioreactor system consists of a peristaltic pump, cell culture bioreactor, fresh media reservoir, waste media container and a platelet collection vessel. Tubing and strategic placement of valves connects the components to create the closed‐loop system. All components, excluding the pump, were designed as one‐time‐use disposables to move the process towards cGMP. The bioreactor consists of a multi‐chamber unit separated by a porous membrane capable of allowing size‐specific cellular products to move between the chambers. Cord blood mononuclear cell‐derived CD34 + HSCs were seeded into the bioreactor and differentiated into mature megakaryocytes (MKs) with serum‐free media. Platelet and platelet‐like particles were harvested from mature MKs extending proplatelets (proPlts) through the chamber‐separating porous membrane by increasing the shear rate in the cell‐adjacent chamber.
Results/Finding: Shear flow played an important role in the system, increasing the percentage of MKs forming proPlts and accelerating the rate of proPlt extension. Physiologically relevant mechanostimulatory interstitial fluid flows (0.1 – 5 µm/s) and bone marrow sinusoid shear stresses (0.1 – 0.4 Pa) were generated within respective chambers of the bioreactor via a programmable peristaltic pump capable of pulsatile or continuous flow. Within the bioreactor chamber, HSCs were differentiated into mature MKs at a rate of 26 – 77%, n = 14, which extended proPlts in response to flow. Platelets were shed in response to shear forces and were analyzed by flow cytometry and using a hematology analyzer. Mature MKs were counted and analyzed by flow cytometry, and proPlt‐producing MKs were assessed by counting cells seeded on fibrinogen‐coated plates.
Conclusion: Using a novel bioreactor system designed to recapitulate the 3D bone marrow microenvironment and physiologically relevant shear forces, improved MK differentiation and platelet production from in vitro derived MKs. This represents a significant step in the road to producing an in vitro‐derived transfusable platelet unit.
NIT6
Dry‐Preservation of Red Blood Cells
Brett R. Janis*, Mariah C. Priddy, Emily M. Murphy, Jonathan A. Kopechek and Michael A. Menze
University of Louisville
Background/Case Studies: Despite recent advances in biostabilization, clinical blood supplies still experience shortages and storage limitations for red blood cells (RBCs) have not yet been sufficiently addressed. Promising new avenues in cell stabilization include biomimetic approaches based on intracellular conditions found in animals with the ability to maintain viable cells and tissues in a frozen or desiccated state (cryptobiosis). Our approach addresses storage limitations by lyophilizing human RBCs into a powder that could theoretically be stored for several years and be rehydrated as needed for transfusion. This process involves the non‐reducing sugar trehalose, a compound with well‐established cytoprotective properties in cryptobiotic animals. However, trehalose is impermeable to mammalian cells which hampered progress in using this promising biomolecule in RBC preservation. Our approach utilizes sonoporation for sugar loading of RBCs. Sonoporation is a process in which transient pores are induced in the cell membrane by the ultrasound‐mediated oscillation of gas microbubbles. The objective of this study is to verify the efficacy of trehalose loading and long‐term stability and functionality of preserved blood units.
Study Design/Method: Human red blood cells were obtained with informed consent from donors. RBCs were resuspended and diluted in loading buffer containing trehalose immediately prior to treatment. Lipid‐coated microbubbles were added to samples and B‐mode ultrasound pulses were applied using an ultrasound imaging system. Trehalose uptake into RBC was confirmed enzymatically. RBCs were cooled to ‐80°C at a rate of ‐1°C/min followed by freeze‐drying. Dried RBCs were stored at ambient temperature and resuspended in deionized water. Cell recovery was measured using automated cell counting and cell viability was assessed by staining with calcein‐AM.
Results/Finding: Sonoporation‐mediated trehalose loading has minimal toxicity as 95‐100% of RBCs were recovered after treatment. Trehalose‐loaded RBCs showed > 95% recovery and viability after storage at ‐80°C, whereas a significantly reduced recovery of 20‐40% was observed without treatment (n = 12; p<0.05). Recovery of lyophilized RBCs after rehydration was 16‐30% and cell viability in this cell population was 70‐80% (n = 12). Without trehalose loading, no viable RBCs were recovered after freeze‐drying and rehydration.
Conclusion: Our results demonstrate that sonoporation enhances delivery of trehalose into RBCs and dramatically increases recovery of intact RBCs following freezing/thawing or drying/rehydration. Although further testing is needed to evaluate RBC function in vivo after dry preservation, our approach offers significant potential to help stabilize the clinical blood supply and to increase the accessibility of blood transfusions in the future.
NIT7
Impact of Cold Storage Delay Time on Cold Stored Platelet Quality
Peter Schubert*1,2, Zhongming Chen2, Brankica Culibrk2, Wayne Zhao1, Dana Devine1,2 and Ken McTaggart2
1Pathology & Laboratory Medicine, 2Canadian Blood Services
Background/Case Studies: Cold stored platelet concentrates (PCs) are receiving renewed attention as a therapeutic product to treat severe hemorrhage due to superior hemostatic effectiveness and fewer inflammatory mediators as compared to room temperature (RT) stored PCs. From a blood banking perspective, for clinical use of cold stored PCs this development would require the production and management of dual inventories: RT stored PCs and cold stored PCs. A recent study by Wood et al explored the opportunity to transform RT stored PCs to cold stored PCs at day 4 of RT storage. Here we analyzed the impact of 22°C RT storage time prior to moving to 4°C cold storage on platelet (PLT) in‐vitro quality after extended storage time.
Study Design/Method: Aliquots of plasma suspended PCs were stored in small in‐house prepared bags which mimic the storage features of common PLT bags. Six bags were filled on the day of production: five were placed into 22°C storage with continuous agitation as per current practice, and one was placed into 4°C storage without agitation. On each of the following five days, one of the RT stored bags was moved into cold storage. After 14‐days, all aliquots were analyzed for metabolic activity (pH, glucose, lactate), PLT activation and response to ADP by CD62P binding, phosphatidyl‐serine exposure by annexin‐V binding, supernatant microvesicle count by CD41 staining, and clot formation evaluation using rotational thromboelastometry (ROTEM).
Results/Finding: With increasing delay in transfer from 22°C to 4°C storage, pH dropped from 7.4 to 7.0. This trend was mirrored in a 1.5‐fold increase in glucose consumption and 1.4‐fold increase in lactate production. PLT activation did not change for the first three cold storage delay times, but thereafter increased from about 63% to 79% CD62P‐positive PLTs. This effect was also reflected in an altered response to ADP, decreasing from a high of 14% for the two shortest cold storage delay times down to almost no response for the longer delay times. Annexin‐V binding increased from 21% to 28%, and the release of microvesicles increased by 20% between the two shortest cold storage delay times and the longer delay times. Increasing cold storage delay resulted in an increase in clotting time from 140 to 154 seconds as measured from the ROTEM profile; however, no change in clot firmness was detected as indicated by similar alpha values for all aliquots.
Conclusion: While PLT quality at day 14 of storage deteriorated with increasing time PCs were held at RT before moving them to cold storage, this study suggests that it may be possible to produce cold stored PC inventory of sufficient quality by transfer of RT stored PCs to cold storage prior to their expiry. Further studies are required to verify the results.
NIT8
A Multicenter Clinical Trial of Cryopreserved Platelets
Igor V. Vysochin*1, Valery B. Khvatov1, Alexander I. Kostin1, Elena N. Kobzeva1, Lyudmila V. Sudakova2, Marina A. Kochetkova3 and Galina S. Goncharskaya3
1Moscow's Sklifosovsky Research Institute for Emergency Medicine, 2Vladimir's Regional Blood Bank, 3Tyumen's Regional Blood Bank
Background/Case Studies: An automated cryopreserved platelet (СPC) production procedure was developed and implemented by the Transfusion Medicine Department's Cryobank at Moscow's Sklifosovsky Research Institute for Emergency Medicine (Patents No.: RU 169287 U1, RU 2623083 C1, RU 167874 U1). The automated technique was implemented at Vladimir's Regional blood bank and at Tyumen's Regional blood bank. Purpose: To compare the quality and the clinical effectiveness of CPC produced in several blood banks.
Study Design/Method: Apheresis platelet concentrates (PC) were collected on the Trima Accel system in all blood banks. Platelets were cryopreserved in a closed system (Patent No.: RU 169287 U1) by the automated technique (Patent No.: RU 2623083 C1). The combination cryoprotectant CryoSure‐DEX40 was used for PC cryopreservation. Pre‐transfusion defrosted platelets were also processed in a closed system (Patent No.: RU 167874 U1). Defrosted PC were stored at 20‐24°C with continuous gentle stirring for no longer than 6 hours before transfusion. Patients were given therapeutic CPC transfusions to correct thrombocytopenia and to control acute bleeding. CPC transfusion was effective if there was clinical evidence of a controlled hemorrhage and 1‐ and 24‐h posttransfusion corrected count increments for platelets (CCI) of > 7,500 m2/µL and 4,500 m2/µL, respectively.
Results/Finding: Over 900 PCs were frozen at the Cryobank of Moscow's Sklifosovsky Research Institute for Emergency Medicine between 2013 and 2018 and more than 600 CPC doses have been stored as yet. 270 therapeutic doses were thawed and transfused to patients. 347 PCs were frozen at Vladimir's Regional blood bank from February 2017 to April 2018. More than 200 CPC doses thawed and transfused into patients. Over 160 PCs were frozen at Tyumen's Regional blood bank from August 2017 to April 2018. More than 80 CPC doses thawed and transfused to patients. Freeze‐thaw recovery of platelets was 80% or more of the original population in all blood bank. The defrosted CPC showed platelets at 229 ± 71х109 cells/dose (Moscow's Sklifosovsky Institute for Emergency Medicine), 170 ± 20х109 cells/dose (Vladimir's Regional blood bank), 182 ± 72х109 cells/dose (Tyumen's Regional blood bank). 52 surgical and 40 Post‐cardiac surgery patients, 21 neurosurgical patients and 47 patients after organs transplant (Moscow's Sklifosovsky Institute for Emergency Medicine); 6 oncologic and 41 haematology patients, 7 neurosurgical patients and 7 surgical patients (Vladimir's Regional blood bank); 31 haematology patients, 7 surgical patients and 8 post‐cardiac surgery patients (Tyumen's Regional blood bank) were received therapeutic CPC transfusions. Hemorrhage stopped in the subjects given CPC transfusions with no complications seen after that in all medical centers. The 1‐and 24‐h posttransfusion CCI was 11,200 ± 3,800 m2/µL and 9,200 ± 4,600 m2/µL, respectively (Moscow's Sklifosovsky Institute for Emergency Medicine), 8,500 ± 3,500 m2/µL and 10,200 ± 3,500 m2/µL respectively (Vladimir's Regional blood bank). The 24‐h posttransfusion CCI was 9,600 ± 1,700 m2/µL (Tyumen's Regional blood bank). The CCI being high at 24 h would be suggestive of the donor's platelets still circulating in the recipient's blood within 24 hours of the completion of transfusion.
Conclusion: CPCs were demonstrated to be highly effective in all blood banks. The marked clinical effect is due to the high performance of CPCs.
NIT9
A New Method for Concentration of Plasma Proteins for Antisera Production by Ice Column Exclusion (ICE)
Michael Gannett*1 and Richard Gammon2
1OneBlood, Inc ‐ Orlando Immunohematology Reference Laboratory, 2OneBlood, Inc
Background/Case Studies: Previously the only pathway to volume reduce a source with an antibody of interest was to use expensive and/or laborious traditional methods (e.g. ultrafiltration membranes, dialysis, fractionation, precipitation). Many antibody specificities are not available commercially and must be obtained from plasma of donors and patients. When a source is found, it typically contains additional antibodies since routine screening does not detect antibodies to low prevalence antigens. For antisera, it is ideal to remove these antibodies, including isoagglutinins. Larger volumes of source material can be harder to manipulate and may require multiple freeze thaw cycles to obtain aliquots. This could affect product stability and requires more storage space. A method was sought to volume reduce source material so that additional antibodies could more easily be removed.
Study Design/Method: A plastic separation device was made with a 3D printer which created two compartments when inserted in a 14 mL tube and allowed for a 3 mL cavity at the tube base. Source material was added to the tube which was immediately inverted and frozen at ‐30°C for 90 min or 24 hours. This created an ice column (IC) between the cap and separation device. The tube was removed from the freezer and immediately centrifuged with a swing bucket rotor at 1100g ‐ 1600g, for 4‐8 minutes. The separation device prevented the IC from entering the tube base, yet allowed solute to separate from the IC and flow into the tube base. The IC was decanted and the concentrated solute (CS) was extracted through the separation device by inserting a syringe with a blunt needle. Total protein was measured via Bradford Assay.
Results/Finding: From the 20 samples tested, the IC had a mean mass of 60% of the initial plasma mass, yet only contained a mean of 6% of the total protein (Table). The CS had a mean mass of 30% of initial plasma mass, while recovering a mean of 70% of the total protein.
Conclusion: We describe a new method, ICE. It can be used to reduce the mass of source material and concentrate protein.
(NIT9)
| Protein (g/dl) | Calculations (Mean %) | |||||||||||
|---|---|---|---|---|---|---|---|---|---|---|---|---|
| Freezing & Centrifuge times | Neat | IC | CS | Protein in Fraction / Initial Protein | Mass of Fraction / Initial Mass | |||||||
| Number | Mean | Mean | Min | Max | Mean | Min | Max | IC | CS | IC | CS | |
| 90' freeze | 10 | 5.21 | 0.72 | 0.34 | 1.44 | 13.26 | 7.94 | 18.01 | 9 | 69 | 66 | 27 |
| 4' | 5 | 5.25 | 0.62 | 0.34 | 0.78 | 13.05 | 7.94 | 15.19 | 8 | 61 | 65 | 25 |
| 5' | 5 | 5.17 | 0.83 | 0.55 | 1.44 | 13.47 | 9.66 | 18.01 | 11 | 77 | 66 | 30 |
| 24hr freeze | 10 | 5.96 | 0.34 | 0.17 | 0.81 | 13.04 | 10.90 | 18.12 | 3 | 69 | 55 | 32 |
| 5' | 1 | 5.64 | 0.56 | – | – | 18.12 | – | – | 6 | 78 | 65 | 24 |
| 8' | 9 | 5.99 | 0.32 | 0.17 | 0.81 | 12.48 | 10.90 | 14.21 | 3 | 68 | 54 | 33 |
| Summary: | 20 | 5.58 | 0.53 | 0.17 | 1.44 | 13.15 | 7.94 | 18.12 | 6 | 70 | 60 | 30 |
NIT10
Development of a Point of Care Aptamer‐Based Coagulopathy Sensor
Scott Ferguson*
Aptitude Medical Systems
Background/Case Studies: Coagulopathy of trauma results in a 4‐fold increase in mortality, and since 30% of deaths caused by this condition occur within the first hour, rapid detection and aggressive correction can significantly improve patient outcomes. Fibrinogen plays a crucial role. It is the most vulnerable coagulation factor during hemorrhage, reaching critically low levels earlier than any other factor. Fibrinogen deficit is a strong predictor of TIC and an independent predictor of mortality at 24h. Fibrinogen replacement can improve survival, however, blanket administration is not feasible, due to both the potential transfusion‐related complications and the high cost and limited supply of cryoprecipitate and fibrinogen concentrate. In result, prompt measurement and data‐driven replacement of fibrinogen is now part of current European guidelines for management of hemorrhage and coagulopathy and is increasingly advocated for in the US. Unfortunately, no rapid point‐of‐care (POC) test currently exists for fibrinogen. The standard Clauss method typically has a slow turnaround time of t>60 min, missing the “golden hour” and no current fibrinogen tests are sufficiently simple, rapid, and robust to be performed in a prehospital setting.
Study Design/Method: To address the need, we are developing the first POC fibrinogen sensor. The sensor exploits a novel high‐affinity/specificity aptamer for fibrinogen and a microfluidic electrochemical architecture analogous to a glucose test strip. Aptamers are well‐suited for POC given their chemical and thermal stability, ease of synthesis, and high consistency. This aptamer is a self‐reporting probe that enables reagentless detection, greatly reducing assay time and complexity. The sensor electrodes are functionalized with the redox‐labeled aptamer. Fibrinogen‐aptamer binding yields a change in redox current corresponding to concentration. The sensor was characterized in buffer, plasma and whole blood samples using fibrinogen standard to demonstrate proof of concept.
Results/Finding: The novel fibrinogen aptamer exhibits a KD = 1.3 nM, and minimal (<2%) cross reactivity with non‐target proteins including Fibrinogen Degradation Products. The prototype sensor quantitates fibrinogen accurately and rapidly across the clinical range (0.5 – 10 mg/ml), with LOD of <0.1 mg/ml, CV < 15% in < 2 min. We developed a handheld reader that integrates a smartphone and portable potentiostat to interrogate the sensor; data is displayed and analyzed in the smartphone via a custom app.
Conclusion: We have demonstrated a prototype sensor that enables measurement of fibrinogen directly from plasma and whole blood in < 2 min. This outcome supports further product development. If successful, this sensor could ultimately be deployed in ambulance, ED and perioperative environments to improve patient outcomes.
NIT11
ABO Antibody Detection with Biolayer Interferometry
Mrigender Virk*1,2, Khoa Nguyen1, Mehrnaz Khosravi2, Evelyn Miller2 and Tho Pham1,3
1Stanford University School of Medicine, Department of Pathology, 2Stanford University Medical Center, Department of Transfusion Medicine, 3Stanford Blood Center
Background/Case Studies: The ABO blood group system and its cognate antibodies are at the foundation of Transfusion and Transplantation medicine. Serologic testing methods have remained essentially unchanged for over 100 years, relying on visual interpretation of agglutination. With increasing rates of ABO incompatible (ABOi) hematopoietic stem cell (HSCT) and solid organ transplants, new testing modalities are necessary. ABOi HSCT patients require extensive monitoring for anti‐ABO antibody‐mediated morbidity including graft rejection and passenger lymphocyte syndrome (PLS). We aim to develop a novel serologic test for anti‐ABO antibodies that is useful in the setting of ABOi transplantation.
Study Design/Method: Biolayer interferometry (BLI) is an optical assay that measures the interference pattern of light reflected from two surfaces. We developed a BLI‐based assay to measure ABO antibodies in human plasma samples. We determined the lower limit of detection by serial dilutions of monoclonal anti‐A antibody into AB plasma. We validated this assay on 20 volunteer blood donor plasma samples. Lastly, we assayed plasma samples pre‐ and post‐transplant from patients undergoing ABOi HSCT.
Results/Finding: Serial dilutions of monoclonal anti‐A antibody into AB plasma determined the lower limit of detection 0.984 ng/uL). The peak absorbance value positively and strongly correlates with antibody concentration (R2 = 0.97). We validated BLI on 20 blood donors from all ABO blood groups. This showed varying levels of antibody binding among different individuals with the highest levels in group O donors. Lastly, we acquired 155 longitudinal samples from 33 HSCT patients, both ABO compatible and ABOi. We identified three ABOi (minor mismatch, O donor into A patient) HSCT patients. One patient showed clinical evidence of PLS on day 10 post‐transplant, with increasing anti‐A titers. BLI detected rising anti‐A antibodies in this patient on day 9, one day before clinical or laboratory evidence of hemolysis. The other two ABOi HSCT patients did not demonstrate PLS/hemolysis; although both these patients had positive DATs, BLI was negative for anti‐A antibodies, indicating that BLI can be more specific for clinically significant hemolysis.
Conclusion: With increasing ABOi transplants, innovative methods to detect clinically relevant ABO antibodies with high sensitivity and specificity are critical. We have demonstrated that BLI offers a technological platform capable of sensitively detecting clinically relevant anti‐ABO antibodies. Furthermore, BLI can be expanded for use in detecting protein‐protein interactions and is not limited to the ABO blood group system. This has the potential to detect clinically relevant antibodies and help direct appropriate clinical care earlier than can be accomplished by current testing modalities.
NIT12
Ready‐to‐Use Lateral‐Flow Dipstick for Visual Blood Group Genotyping
Julien Gomez‐Martinez1,2, Monique Silvy3,4, Jacques Chiaroni3,4, Chantal Fournier‐Wirth1, Francis Roubinet1, Pascal Bailly3,4 and Jean‐Charles Brès*1,2
1Etablissement français du sang Occitanie, 2Pathogenesis and Control of Chronic Infections, University of Montpellier, INSERM, EFS, 3Etablissement français du sang PACA Corse, Biologie des Groupes Sanguins, 4University of Aix Marseille, CNRS, EFS, ADES
Background/Case Studies: Alloimmunization is one of the main side effects of blood transfusion that could severely complicate further red blood cell transfusions, especially for patients with diseases requiring multiple transfusions. Conventional blood group phenotyping by hemagglutination assays, carried out pre‐transfusion, is unsuitable in certain clinical situations. Molecular typing offers an alternative method, allowing the deduction of blood group phenotype from genotype. However, current methods require a long turnaround time and are not performed on‐site, limiting their application in emergency situations. When rapid decision is needed, tests to be performed near or on‐site are advantageous.
Study Design/Method: In this work, we report the development of a novel, rapid multiplex molecular method for visual identification of seven alleles in three clinically relevant blood group systems (FY*01, FY*02, FY*02N.01, GYPB*03, GYPB*04, JK*01 and JK*02). The assay was designed for carrying out unitary testing, in specific clinical situations such as pre‐transfusion testing for patients when serologic methods failed or in emergency situations. Our test, using a dry‐reagent allele‐specific lateral flow biosensor, is a pre‐PCR handling and DNA extraction‐free procedure which includes a multiplex linear‐after‐the‐exponential (LATE)‐PCR amplification performed directly from whole blood. The single‐stranded amplicons migrate on a dry‐reagent allele‐specific nucleic acids lateral‐flow dipstick. Gold nanoparticles, used as reporter, permit the detection of blood group SNPs by the generation of red dots visible to naked eye. The assay parameters were optimized and our test was validated on 108 blood donor samples with known phenotype.
Results/Finding: Optimization of the assay includes both multiplex LATE‐PCR parameters (primer concentration and cycle number) and lateral flow parameters (migration/hybridization temperature and buffer composition). The final protocol enables determination of deduced phenotype with a total processing time of one hour from receiving the blood sample. Validation showed a 100% concordance rate between deduced phenotype and standard serologic phenotype for the 864 alleles investigated.
Conclusion: Our technology protected by patents, allowed accurate determination of deduced phenotype for FY1, FY2, S, s, JK1 and JK2 antigens. Owing to its simple handling, the assay can be operated by non‐skilled health‐care professionals. The proposed assay offers the potential for the development of other relevant SNP panels for immunohematology and new applications in point‐of‐care testing, such as for infectious diseases, in the near future.
NIT13
Comparing the Incidence of Transfusion Reactions in Psoralen Treated Versus Non‐Psoralen Treated Platelets: A US Transfusion Service Experience
Jenny Petkova*1, Michael Healy1, Michael Lankiewicz1 and Richard Thomas2
1Christiana Care Health Services, 2Blood Bank of Delmarva, Inc.
Background/Case Studies: In December 2014, FDA approved the use of psoralen treated platelets prepared by the INTERCEPT® Blood System. In March 2016, FDA issued revised draft guidance for bacterial risk control for platelets ≥ four days old. The local blood supplier initiated manufacture and distribution of psoralen treated platelets in March 2016. The transfusion service at a 1,000 + bed community hospital system immediately initiated utilization of psoralen treated platelets. Beginning in March 2016, the transfusion service maintained a dual inventory of psoralen treated (with PAS; platelet additive solution) and non‐psoralen treated (plasma‐based) plateletpheresis products. Clinicians were not provided an option to electronically order psoralen treated products for transfusion. Rather, order fulfillment for platelets was managed exclusively by the transfusion service laboratory staff and based primarily on product expiration date and patient blood type compatibility.
Study Design/Method: A retrospective analysis was conducted comparing the incidence of transfusion reactions involving psoralen‐treated platelets versus transfusion reactions involving non‐psoralen treated platelets from March 2016 through February 2018.
Results/Finding: During the two year study period, a total 54,811 transfusions were performed across the system to 15,411 patients; which included exactly 7,000 plateletpheresis transfusions. Of the total plateletpheresis transfusions during the period; 2,833 (40.5%) were psoralen treated plateletpheresis products while 4,167 (59.5%) were non‐psoralen treated plateletpheresis products. During the study period, a total of 10 transfusion reactions were associated psoralen treated platelet transfusion; resulting in an incidence rate of 0.35%. During the study period, a total of 11 transfusion reactions were associated with non‐psoralen treated platelet transfusion; resulting in an incidence rate of 0.26%.
Conclusion: Psoralen treated platelets were successfully introduced into a 1,000 + bed community hospital system as of March 2016. In the subsequent two years, psoralen treated and non‐psoralen treated platelets utilization rates were relatively equivalent. There was no clinically significant difference (p = 0.516) in the incidence of transfusion reactions between psoralen treated versus non‐psoralen treated platelet products. Further, no patient experienced a severe transfusion reaction to any platelet product nor was there any report of bacterial contamination associated with platelet transfusion during the entire evaluation period. Thus, introduction of psoralen treated platelets within this hospital system had no impact on the overall incidence of transfusion reaction to platelets.
NIT14
A Multicenter Study to Assess the Performance of Trima Accel 7 for the Collection of Platelets Stored in Platelet Additive Solution
Pamela Lopert*1, Jack Rhodes1, Jose Cancelas2, Jed B. Gorlin3, Mehraboon S. Irani4, Kevin J. Land5, Tuan N. Le6, Beth Shaz7, Robert Tressler8 and Dan A. Waxman9
1Terumo BCT, 2Hoxworth Blood Center, 3Memorial Blood Centers, 4BloodCenter of Wisconsin, 5Bonfils Blood Center, 6Oklahoma Blood Institute, 7Community Blood Center of Greater Kansas City, 8San Diego Blood Bank, 9Indiana Blood Center
Background/Case Studies: The Trima Accel system is an apheresis device that uses a continuous flow centrifuge to take blood from a donor and separates it into transfusable components: red blood cells, platelets, and plasma. Blood components not collected are returned to the donor. Trima Accel 7 was designed to meet the needs of blood centers on a global stage. The purpose of this study was to evaluate the yield and leukoreduction performance of Trima Accel 7 for platelets stored in 65% Platelet Additive Solution (PAS)/35% plasma.
Study Design/Method: This was a prospective, open label, multicenter, controlled study to evaluate the yield and leukoreduction of platelets collected with Trima Accel 7 (Terumo BCT, Lakewood, CO) and stored in 65% InterSol™ (Fresenius Kabi, Bad Homburg, Germany) and 35% plasma. Healthy adult volunteer donors consented to donate either a single, double, or triple platelet product on Trima Accel 7. After donation, the system conducted immediate addition of the InterSol Solution and the products were stored per standard blood banking conditions. The day after collection, platelet products were assessed for residual white blood cell (WBC) content and final platelet yield.
Results/Finding: Two hundred and seventy‐nine (279) participants donated an evaluable single (n=93), double (n=93), or triple (n=93) platelet product. The mean ± SD for the residual WBC count (×106) in single, double, and triple platelet products were 0.32 ± 0.303, 0.49 ± 0.393, and 0.71 ± 1.133, respectively. A breakdown by platelet product showed that 93 single platelet units had WBC counts less than 5 million; 93 double platelet units had WBC contents lower than 10 million; and 93 triple platelet units had WBC contents lower than 15 million. It was determined with 95% confidence that ≥ 95% of the single, double, and triple platelet products had acceptable residual WBC levels, therefore meeting the United States FDA acceptance criteria. The single, double, and triple platelet products had a mean ± SD platelet yield (×1011) of 3.94 ± 0.639; 7.62 ± 0.786, and 10.35 ± 0.729, respectively. There were 4 single platelet products that had a platelet yield < 3.0 × 10¹¹ and none of the double and triple platelet products had a platelet yield below 6.2 × 10¹¹ or 9.3 × 10¹¹, respectively.
Conclusion: Single, double, and triple platelet products collected with Trima Accel 7 and stored in PAS met acceptance criteria for both residual WBC levels and platelet yield.
NIT15
Are There Genetic Variants to Explain the Phenomenon of Donor Cell Survival Following Blood Transfusion?
Rena Hirani*1, Matthew Hobbs2, Aaron Statham2, Marcel Dinger2,3 and David O. Irving1
1Australian Red Cross Blood Service, 2Genome.One, 3Kinghorn Centre for Clinical Genomics
Background/Case Studies: Despite the introduction of leukodepleted blood components, it has been shown that donor leukocyte engraftment (transfusion‐associated microchimerism (TAM)) remains a long‐term consequence of red blood cell (RBC) transfusion in some patient groups. The mechanism by which donor leukocytes survive following blood transfusion is unclear and it has been speculated that genetic factors may be one possible reason. This study was conducted to determine whether there is any association between an individual's genetic profile and the establishment of TAM in blood transfusion recipients.
Study Design/Method: Australian trauma patients (n = 86) transfused with RBC units between 2000 and 2012, with an injury severity score of greater than 15, were recruited. Twelve of these patients were found to have TAM. To date, whole exome sequencing was conducted on four patients with TAM and four patients without TAM. Alignment of the exome data to the human genome reference sequence assembly GRCh37 was conducted and analysis of differential genetic variations was carried out. Variations unique to at least 50% of patients in each group were further investigated, with a primary focus on genes associated with immune regulation.
Results/Finding: Preliminary analysis has been performed. Many of the changes found in 2 of the four patients with TAM, were present in highly heterogenous genes including zinc finger protein genes and the human leukocyte antigen genes (HLA‐B and HLD‐DRB1). Some of the most interesting changes were found in genes with unknown function such as Chr4 70257329 variant ID248066. In addition changes were found in the following genes, BTN3A1 gene (Chr6 26405815 variant ID 340887) which has a role in the regulation and proliferation of T‐cells and in the CCL8 gene (chr 17 32647356 variant ID 847320) which is a chemokine that contributes to tumor associated leukocyte removal.
Conclusion: Next generation (whole exome) sequencing technologies allow for the exploration of genetic variations across different population groups, which can provide clues for the potential indications of mechanisms by which TAM may establish in certain patients. This preliminary analysis provides potential genetic changes that could involve genes that have a role in T‐cell regulation and proliferation. It is expected that further analysis with expanded patient numbers will allow for this genomic data to be explored in more detail.
Australian governments fund the Australian Red Cross Blood Service to provide blood, blood products and services to the Australian community.
NIT16
Hyperconcentrated Platelets Collected on Trima Accel and Stored in Intersol Solution for 5 Days Meet FDA Acceptance Criteria for in vivo Platelet Recovery and Survival
Pamela Lopert*1, Bobbi Carlin1, Mehraboon S. Irani2, Sharon Graminske2, Scott Brooks2, Neeta Rugg3 and Jose Cancelas3
1Terumo BCT, 2BloodCenter of Wisconsin, 3Hoxworth Blood Center
Background/Case Studies: Apheresis platelets can be stored in either 100% plasma, or a portion of the plasma can be replaced with a platelet additive solution (PAS). Platelets stored in PAS may reduce the risk of several plasma‐associated adverse transfusion reactions such as allergic reactions, immune reactions triggered by cellular mediators in the plasma, and potentially transfusion‐related acute lung injury (TRALI). The objective of this study was to quantify the in vivo radiolabeled recovery and survival of apheresis platelets collected on the Trima Accel system (Terumo BCT, Lakewood, CO) and stored for 5 days in 35% plasma/65% InterSol™ Solution (Fresenius Kabi, Bad Homburg, Germany).
Study Design/Method: This was a prospective, open‐label, multicenter study involving healthy adult participants who donated a single hyperconcentrated platelet product on the Trima Accel system. The product was diluted with PAS immediately after collection via AutoPAS metering to attain 35% plasma carryover and 65% InterSol and stored for 5 days under standard conditions. On Day 5, whole blood (WB) was drawn to prepare fresh Control platelets. Test and Control platelets were labeled with either 51Cr or 111In (randomly assigned) and participants were simultaneously infused with the autologous radiolabeled platelets per the Biomedical Excellence for Safer Transfusion (BEST) method. Venous WB samples were collected on the day of infusion and over the following 12 days. Recovery and survival of Test and Control platelets were calculated using the multiple hit model with the COST software.
Results/Finding: Twenty‐four (24) evaluable data points were included in the analysis. On Day 0 all evaluable Test products had a platelet concentration ≥ 1.0 × 10⁶/µL and a platelet yield ≥ 3.0 × 10¹¹. All evaluable Test products had a negative bacterial test (testing was per the Site's standard practice and confirmed on Day 5) and on Day 5 all products had a pH ≥ 6.9. As shown in Table 1, the recovery of Test platelets was greater than 66% of Control and the survival was greater than 58% of Control with a one‐sided 97.5% confidence limit.
TABLE 1 (NIT16) Day 5 Platelet in vivo Data
| Parameter (N=24) | Test Mean ± SD | Control Mean ± SD | Difference* Mean ± SD |
|---|---|---|---|
| Recovery of platelets (%) | 45.2 ± 12.3 | 56.0 ± 13.2 | 8.2 ± 9.8 |
| Lower limit of one‐sided 97.5% CI | 4.03 | ||
| Survival of platelets (days) | 5.4 ± 1.0 | 7.9 ± 1.5 | 0.8 ± 1.0 |
| Lower limit of one‐sided 97.5% CI | 0.39 | ||
*Difference for recovery was calculated as Test – (0.66 × Control); difference for survival was calculated as (Test/24) – (0.58 × [Control/24])
Conclusion: Hyperconcentrated platelets collected on the Trima Accel system and stored in InterSol for 5 days met the United States FDA acceptance criteria for platelet recovery and survival when compared to fresh controls.
NIT17
Use of Porous Polymer Beads to Remove Anti‐A and Anti‐B Antibodies from Fresh Whole Blood and Plasma for Transfusion
David James*, Tamaz Guliashvili, Pamela O’Sullivan, Karl‐Gustav Ruggeberg, Thomas Golobish, Vincent Capponi, Phillip Chan and Maryann Gruda
CytoSorbents Medical Inc.
Background/Case Studies: Fresh whole blood (FWB) is often used in military operation‐transfusions by medics with limited access to blood components. The disadvantage of FWB is that current policy in the US and many other countries call for it to be ABO‐type specific since it contains both RBCs and plasma, significantly constraining the pool of eligible donors. Similarly, plasma from type AB donors is a key resource for trauma resuscitation as it does not require ABO‐type specificity; however the donor pool is limited. Removal of anti‐A/B antibodies would significantly increase supply of “universal plasma” and matching FWB “walking donors”, thus greatly simplifying transfusion logistics. The objective of this research program is to develop a cost‐efficient filter for specific removal of anti‐A and B antibodies from FWB and from plasma sources.
Study Design/Method: Human whole blood and plasma units collected in CPD were obtained from regional blood donor centers. Human whole blood was assessed within 5 days of collection. Plasma was obtained frozen and thawed at 37 ºC just prior to use. Whole blood or plasma was passed through porous polymer beads containing novel modifications designed to remove anti‐A and anti‐B blood group antibodies at a plasma/blood to polymer ratio of 16:1. Samples were collected pre and post‐filtration and analyzed for removal of blood group antibodies with blood typing reagent red cells and standard gel‐card agglutination assays (Ortho Clinical). Effects on coagulation and hemostatic activity were measured by aPTT and PT assays on a Stat 4 Coagulation Analyzer (Diagnostica Stago) and a TEG 9000 Analyzer (Haemonetics, Inc.), respectively. Complete blood cell counts (CBC) were measured on the HemaVet 950FS Hematology Analyzer (Drew Scientific). Antibody removal efficiency was calculated as the lowest dilution with agglutination of the reagent red cells. Starting donor titers ranged from 8 – 256 for both anti‐A and anti‐B.
Results/Finding: Treatment of plasma with the functionalized A and B polymers reduced antibody titers by a mean ± SD of 85.2 ± 8.6% and 90.8 ± 9.7%, respectively (N=5). Non‐functionalized control polymers displayed 10 ± 22.4% and 0 ± 0% titer reductions for both anti‐A and anti‐B antibodies, respectively. Treatment of whole blood with the functionalized A and B polymers reduced antibody titers by 81.5 ± 14.7% and 90 ± 9.9%, respectively (N=5). Non‐functionalized control polymers displayed 10 ± 22.4% and 10 ± 22.4% titer reductions for both anti‐A and anti‐B antibodies, respectively.
Conclusion: These data indicate that the surface modifications significantly and selectively remove anti‐A and anti‐B Antibodies from FWB and plasma. Further research to develop these filters is warranted.
NIT18
Biomimetic Surface Modification of PVC Platelet Bags to Improve Platelet Storage
Lacey Johnson*1, Brooke Farrugia2, John Whitelock2, Denese C. Marks1,3, David O. Irving4 and Megan Lord2
1Research and Development, Australian Red Cross Blood Service, 2Graduate School of Biomedical Engineering, University of New South Wales, 3Sydney Medical School, 4Australian Red Cross Blood Service
Background/Case Studies: Platelet concentrates (PCs) are stored in gas‐permeable plastic bags, under constant agitation at room‐temperature. These conditions result in a progressive decline in platelet quality due to ongoing metabolic activity and platelet activation. Current platelet storage bags are composed of either polyvinylchloride (PVC) or polyolefin, and have been optimised to provide adequate gas‐permeability. However platelets can adhere to these surfaces, which may promote platelet activation. New materials and coatings that support platelet respiration whilst preventing platelet adhesion or activation may enable platelet storage beyond 5 or 7 days. This study examined the impact of storing platelets in PVC bags coated with recombinant serglycin, an intracellular proteoglycan expressed on hematopoietic and endothelial cells, or human serum albumin. These molecules were chosen for their anti‐adhesive properties and differential glycosylation profiles.
Study Design/Method: Buffy‐coat derived platelets (n=3) in 30% plasma/70% SSP + were split into paediatric‐sized PVC platelet storage bags (MacoPharma) that were either uncoated or coated with 20 µg/mL serglycin or albumin (Albumex 20 solution). Serglycin was recombinantly expressed in HEK‐293 cells and purified from the conditioned medium via anion exchange chromatography. Platelet concentrates were stored for 9 days at 20‐24°C with agitation. Platelet metabolism, activation and function were tested on days 1, 2, 5, 7, 9, using in vitro assays.
Results/Finding: The platelet concentration, pH, glucose and lactate values were similar between the groups over storage. The expression of platelet glycoproteins GPIbα, GPIIb, GPIIIa were unaffected by the bag coating. Further, the activation profiles in the platelets stored in the coated and uncoated bags were similar, as determined by PAC‐1 and CD62P binding. Platelet function, as assessed by viscoelastic testing (TEG), was comparable in all groups over storage. Microscopic examination of inner plastic surface of the bags at day 9 demonstrated significantly reduced platelet adhesion in the serglycin and albumin coated bags compared to the uncoated PVC bag, whilst the morphology of adhered platelets was similar.
Conclusion: Storage of platelets in PVC bags coated with serglycin or albumin supported platelet metabolism, and did not adversely affect platelet phenotype or function, during an extended period of 9 days. Although the proteins tested did not reduce platelet activation, these initial findings provide a proof‐of‐concept for the development of the next generation of platelet storage bags, with a biomimetic focus.
| Parameter (day 5) | Uncoated | Serglycin | Albumin | p value (ANOVA) |
|---|---|---|---|---|
| Glucose (mmol/L) | 4.2 ± 0.5 | 4.0 ± 0.6 | 4.2 ± 0.5 | 0.8800 |
| CD62P (%) | 10 ± 1 | 10 ± 0 | 11 ± 1 | 0.3538 |
| TEG MA (mm) | 73 ± 2 | 71 ± 6 | 70 ± 1 | 0.2907 |
NIT19
Apheresis Platelets Collected on Trima Accel and Stored in Intersol Platelet Additive Solution for 5 and 7 Days Are Comparable for pH and Morphology to Plasma‐Stored Platelets in Vitro
Pamela Lopert*1, Gina Aga1, Joe Rice1, Barbara J. Bryant2, Mehraboon S. Irani2, Scott Brooks2, Sharon Graminske2, Neeta Rugg3 and Jose Cancelas3
1Terumo BCT, 2BloodCenter of Wisconsin, 3Hoxworth Blood Center
Background/Case Studies: Apheresis platelets can be stored in either 100% plasma, or a portion of the plasma can be replaced with a platelet additive solution (PAS), which is a common practice in Europe. Platelets stored in PAS may reduce the risk of several plasma‐associated adverse transfusion reactions such as allergic reactions, immune reactions triggered by cellular mediators in the plasma, and potentially transfusion‐related acute lung injury (TRALI). Additionally, PAS allows more plasma to be used for other applications. The objective of this study was to demonstrate the in vitro quality of platelets collected on the Trima Accel system (Terumo BCT, Lakewood, CO) and stored for up to 7 days in 35% plasma/65% InterSol™ Solution (Fresenius Kabi, Bad Homburg, Germany).
Study Design/Method: This was a prospective, paired, open label, multicenter study where each participant donated 2 separate platelet products (Test and Control) on the Trima Accel system. The Test product was a single hyperconcentrated platelet product, which was diluted with PAS immediately after collection via AutoPAS metering to attain 35% plasma carryover and 65% InterSol, whereas the Control product was a single standard platelet product collected in 100% plasma. Both Test and Control products were tested on Day 1, Day 5, and Day 7 for pH, P‐selectin (surface expression of platelet activation), Extent of Shape Change (ESC), Hypotonic Shock Response (HSR), and morphology score.
Results/Finding: Sixty (60) evaluable paired platelet products were collected and tested at 2 sites. All Test products had Day 5 and Day 7 pH22 ºC > 6.2, assuring that > 95% of products will have a pH ≥ 6.2 with 95% confidence (one‐sided confidence limit). Test products were non‐inferior to Control for their morphology score after 5 and 7 days of storage (Table 1; < 20% difference between Test and Control with one‐sided 97.5% confidence interval). As expected based on previous findings (Diedrich et al., 2008; Vassallo et al., 2010), Test platelets’ ESC and HSR scores were decreased and P‐selectin expression was increased compared to Control.
TABLE 1 Day 5 and Day 7 in vitro Data
| Parameter (N=60) | Day 5 (Mean ± SD) | Day 7 (Mean ± SD) | ||
|---|---|---|---|---|
| Test | Control | Test | Control | |
| pH @ 22 ºC | 7.2 ± 0.1 | 7.4 ± 0.1 | 7.2 ± 0.1 | 7.3 ± 0.1 |
| P‐selectin (%) | 26.3 ± 7.6 | 9.4 ± 4.4 | 29.4 ± 8.0 | 14.2 ± 6.4 |
| ESC (%) | 24.1 ± 6.0 | 30.7 ± 5.1 | 19.3 ± 6.1 | 28.0 ± 5.4 |
| HSR (%) | 44.5 ± 8.4 | 56.5 ± 9.7 | 37.0 ± 7.5 | 49.3 ± 11.5 |
| Morphology Score (0 – 400) | 293 ± 32 | 309 ± 33 | 270 ± 31 | 283 ± 35 |
Conclusion: The in vitro data demonstrates that platelets collected on the Trima Accel system can be stored in 35% plasma/65% InterSol for 5 or 7 days with acceptable in vitro platelet quality.
NIT20
A Blood Center Experience ‐ Trima Accel 7
Enrique S. Argumanis*1, Milagros D. Ramirez1, Angelica Gomez2, Luis Alosilla2, Andrew Howell2 and Leslee Simon‐Blum2
1Instituto Nacional de Enfermedades Neoplásicas (INEN), 2Terumo BCT
Background/Case Studies: The blood center in the National Institute of Neoplastic Diseases, upgraded to Trima Accel 7 software to support the demand for platelet for transfusion. AutoFlow is a new feature of Trima Accel 7, intended to reduce access related alerts by making automated adjustments to flow rates based on access flow or system pressure issues detected by the Trima Accel device. Trima Accel 7 is being used with the accessory T‐Cuff (pressure cuff) which is designed to encourage donor squeezing and ensures pressure up to 40 mmHg on the donor's vein. The combination of AutoFlow and T‐Cuff should minimize operator intervention and improve donor experience.
Study Design/Method: This was a retrospective study consisting of 989 donations from November 1, 2017 and February 1, 2018 on Trima Accel V6.0 (Control) compared to 442 donations between February 19, 2018 through April 17, 2018 on Trima Accel 7 (Test). Trima Accel procedural data was captured using the Cadence System (Terumo BCT, Lakewood CO). Venous access alerts and donor information were analyzed between test and control groups for measurable difference.
Results/Finding: A statistically significant difference in the average number of access alerts was measured between Trima Accel 7 and Trima Accel V6. The average number of access alerts dropped from 4.83 per procedure during the control period, whereas during the Test period the average number of access alerts was 0.72 per procedure (P value < 0.001). More than twice as many donations completed successfully without an access related alert when comparing the Test period (72% with V7.0 software) to the Control period (29% with V6.0 software) (P value < 0.001). There were 2 donations with greater than 10 alerts in a single donation during the Trima V7 period, compared to the Control period with 113/989 frequent access alerts in a single donation, p value < 0.001. Of the donations with between 1 and 5 access related alerts per procedure decreased from 50% in the Control period to 26% during test and for 5 and 10 access related alerts per procedure decreased from 10% in the Control period to 2.3% during Test.
The test and control groups were comparable for total blood volume (4.7L versus 4.7L) and pre‐donation platelet counts (277 × 103/µL versus 281 × 103/µL).
| Trima Accel v6 | Trima Accel v7 | |
|---|---|---|
| Total Donations analyzed | 989 | 442 |
| Access based Operator Interventions per procedure | 4.83 | 0.72 |
| % of procedures with zero access alerts | 29% | 72% |
| Frequency for 1‐5 access alerts | 50% | 26% |
| Frequency for 5‐10 access alerts | 10% | 2.3% |
| Frequency for > 10 access alerts | 11% | 0.5% |
Conclusion: Trima Accel 7 reduced the number of access related operator alerts per donation. Reducing operator interventions enables staff to spend more time with donors and to complete additional duties on the donor room floor.
NIT21
Quality Assessment of Stored Platelet Concentrates Prepared by Acoustophoresis
Déborah Francois*, Nicolas Bertin, Xavier Telot, Jérémy Gomez and Jérémie Gachelin
Aenitis Technologies S.A.S.
Background/Case Studies: Prophylactic platelets concentrate (PC) transfusion is the first line therapy for patients with hemorrhagic syndrome. Purity and function of transfused PC is the cornerstone of efficient treatment. To obtain PC from whole blood samples, blood banks currently use hard spin centrifugation (5000g)‐based methods, leading to poor resting platelets yield. Prolonged storage is also an issue for blood banks because of platelet storage lesions. In order to improve platelet quality and preservation for therapeutic aims, we developed an acoustic‐based fractionation device for isolation of human platelets from whole blood bags. We have already shown that acoustic platelet separation is an efficient method to fractionate blood in a low shear stress environment (92.8 % ± 12.8 purity, 58.3% ± 19.3 yield), leading to minimal platelet activation and preservation of platelet responsiveness to agonists and function. We now aim to study the impact of acoustic fractionation on platelet storage by comparing the quality of platelet rich plasmas (PRP) produced by acoustophoresis or by soft spin centrifugation (200g).
Study Design/Method: PRP obtained by soft spin centrifugation or acoustic fractionation were stored for 7 days at 20‐24°C under constant agitation. Platelets were analyzed under resting conditions and after stimulation with common platelet agonists. We used flow cytometry to monitored the expression of activation markers P‐selectin (CD62P), PAC‐1 (CD41/CD61) and Annexin V (Phosphatidylserine) and checked morphologic and metabolic characteristics of platelets after 2, 5 and 7 days of storage.
Results/Finding: PRP obtained by soft spin or acoustic fractionation showed comparable storage response. Surface expression of P‐selectin, PAC‐1, and phosphatidylserine increased upon storage in both types of PRP. There was no difference in the surface levels of those platelet activation markers between the two types of PRP. Interestingly, platelets prepared by acoustophoresis retained a slightly increased responsiveness to A23187 and collagen after 7‐day storage as compared to platelets prepared by soft spin centrifugation. Metabolite concentration increased during platelet storage for both PRP, while pH simultaneously decreased. Compared to various publications, metabolic change is within the standards for therapeutic transfusion.
Conclusion: Preliminary results show comparable platelet aging in PRP prepared by soft spin or acoustic fractionation. Our data suggest that there are no side effects on platelet storage after acoustic fractionation. Platelet storage lesions are the result of metabolically active platelets at 20°C and most of them have been shown to be reversible upon transfusion. Quality and function of 7‐day platelets obtained by acoustic fractionation appear to match blood bank standards for therapeutic transfusion. We have planned a larger trial in collaboration with the EFS, a French blood bank, to confirm our results and validate the device.
NIT22
Effect of Platelet Microparticle Content on Platelet Usage in Hematology/Oncology Inpatients
Laura Stephens*, Chelsea Hayes, Jina Seo and Ellen B. Klapper
Cedars‐Sinai Medical Center
Background/Case Studies: Response to platelet transfusion can vary depending on patient and product specific factors. Platelet microparticles (PMP) may play a role in the efficacy of platelet transfusions. PMP derive from platelet blebs in response to stressors and are hypothesized to reflect platelet activation. Activated platelets may be removed from circulation more rapidly, which can lead to increased platelet transfusions. This observational study investigated the hypothesis that selective transfusion of units with low PMP content to hematology/oncology (heme/onc) inpatients would result in decreased platelet usage.
Study Design/Method: Baseline platelet transfusions per patient per month (PPM) were determined for a 12‐month period for hospitalized heme/onc patients. Over the 4‐month study period, all platelet units were tested for PMP content by ThromboLUX dynamic light scattering measurement (LightIntegra Technology, Vancouver, BC, Canada). Units with less than 15% PMP content were labeled as low PMP, per manufacturer recommendations. All heme/onc inpatients received only platelet units with low PMP, and PPM was calculated. For three months following the study period, platelet units were issued without measurement of or selection by PMP, and PPM was again calculated. Individual patient characteristics and response to platelet transfusions were not captured.
Results/Finding: PPM averages for heme/onc inpatients in the baseline, study, and post‐study periods are reported in Table 1.
TABLE 1 (NIT22)
| Inpatient Heme/Onc Averages | Baseline Period | Study Period (Change in PPM from Baseline) | Post‐Study Period (Change in PPM from Study Period) |
|---|---|---|---|
| Number of Patients Transfused per Month | 30.9 | 30.8 | 31.0 |
| Number of Platelets Transfused per Month | 118.5 | 105.3 | 114.3 |
| PPM | 3.8 | 3.4 (‐11.6%, p = 0.21) | 3.6 (+7.9%, p = 0.59) |
Conclusion: The average PPM for heme/onc inpatients was lowest during the study period with selective transfusion of platelets with low PMP content. The observed differences in PPM between the study period and the baseline and post‐study periods were not statistically significant. This study was limited by the use of average PPM, an overall assessment of platelet usage that may not account for patient factors known to contribute to platelet transfusion requirements. Future studies may benefit from evaluation of the impact of PMP on individual platelet transfusion response and clinical outcomes.
NIT23
Analysis on Physiological Position of a Donor during Platelet Apheresis
Tetsu Yamamoto*
Hokkaido Red Cross Blood Center
Background/Case Studies: The mechanism of onset of VVR during platelet apheresis is difficult to elucidate because withdraw and return flow affect the donor complexly. Therefore, monitoring of indicators that reflect physiological changes in donors should be the most effective means of observing their occurrence. In this study, we used laser Doppler flowmetry, to continuously monitor blood flow and pulse rate (heart rate) during platelet collection, and analyze the process of VVR.
Study Design/Method: This retrospective study included 354 high risk donor for VVR, and 30 VVR cases were experienced. The percent decrease in blood flow (DBF) and the percent decrease in heart rate (DHR) were calculate. The physiological position of a certain time during apheresis was plotted by using the value of DBF as x and using the value of DHR as y. Motion of dots in every 10 seconds were observed during platelet apheresis. X‐Y field was divided into 5 areas, central changeless area as N, increased flow (IF) and decreased heart rate (DH) area as A, IF and increased heart rate (IH) area as B, decreased flow (DF) and IH area as C, and DF and DH area as D. The position changes were able to be painted by giving a color in each area. Each pixel exhibited 10 seconds stay of the positions. Total occupation rate of each area were calculated on a certain period of apheresis.
Results/Finding: Occupation rate of N area was 58.8 ± 14.5% in VVR and 73.6 ± 19.8% in non‐VVR. And the rate of D area in VVR was 18.0 ± 10.5% and 0.7 ± 2.3% in non‐VVR. There were significance (p<0.01) in both values. The rate of D area were gradually increased just 5 minutes before the onset of VVR. In a delayed VVR case, D position area were continued when the donor released from the bed.
Conclusion: Physiological condition of a donor was able to be observed by introducing laser Doppler flowmetry during platelet apheresis. Suitable analysis of these information may give us an effective clue to prevent delayed VVR.
TABLE 1 (NIT23) Position stay in each area before and after VVR
| Time course | n | Total occupation rate of each area (%) | ||||
|---|---|---|---|---|---|---|
| A | B | C | D | N | ||
| Start ∼ 10 min. before VVR | 28 | 6.2 ± 7.5 | 9.9 ± 11.7 | 3.2 ± 5.0 | 3.0 ± 8.0 | 77.6 ± 17.9 |
| 10 min. before VVR ∼ VVR | 30 | 5.6 ± 13.0 | 6.3 ± 9.4 | 18.3 ± 15.2 | 19.5 ± 17.4 | 50.3 ± 18.5 |
| VVR ∼ 10 min. after VVR | 30 | 9.8 ± 23.1 | 1.5 ± 3.8 | 8.3 ± 10.2 | 57.9 ± 31.7 | 22.5 ± 24.8 |
| 10∼20 min. after VVR | 17 | 16.5 ± 23.9 | 3.1 ± 6.6 | 9.8 ± 13.6 | 23.3 ± 29.5 | 47.3 ± 30.8 |
| 20∼30 min. after VVR | 3 | 17.8 ± 28.0 | 22.2 ± 25.5 | 0 | 0 | 60.0 ± 52.4 |
NIT24
A Multicenter Study to Assess the Performance of Trima Accel 7 for the Collection of Platelets Stored in 100% Plasma
Pamela Lopert*1, Jack Rhodes1, Jose Cancelas2, Jed B. Gorlin3, Mehraboon S. Irani4, Kevin J. Land5, Tuan N. Le6, Beth Shaz7, Robert Tressler8 and Dan A. Waxman9
1Terumo BCT, 2Hoxworth Blood Center, 3Memorial Blood Centers, 4BloodCenter of Wisconsin, 5Bonfils Blood Center, 6Oklahoma Blood Institute, 7Community Blood Center of Greater Kansas City, 8San Diego Blood Bank, 9Indiana Blood Center
Background/Case Studies: The Trima Accel system is an apheresis device that uses a continuous flow centrifuge to takes blood from a donor and separates it into transfusable components: red blood cells, platelets, and plasma. Blood components not collected are returned to the donor. Trima Accel 7 was designed to meet the needs of blood centers on a global stage. The purpose of this study was to evaluate the yield and leukoreduction performance of Trima Accel 7 for platelets stored in 100% plasma.
Study Design/Method: This was a prospective, open label, multicenter controlled study to evaluate the yield and leukoreduction of platelets collected on Trima Accel 7 (Terumo BCT, Lakewood CO) and stored in 100% plasma. Healthy adult volunteer donors consented to donate either a single, double, or triple platelet product on Trima Accel 7. After donation, the products were stored per standard blood banking conditions. The day after collection, platelet products were assessed for residual white blood cell (WBC) content and final platelet yield.
Results/Finding: Two hundred and seventy‐nine (279) participants donated an evaluable single (n=93), double (n=93), or triple (n=93) platelet product. The mean ± SD for the residual WBC count (×106) in single, double, and triple platelet products was 0.37 ± 2.599, 0.17 ± 0.175, and 0.32 ± 0.318, respectively. A breakdown by platelet product showed that 92 (out of 93) single platelet units had WBC counts less than 5 million; 93 double platelet units had WBC contents lower than 10 million; and 93 triple platelet units had WBC contents lower than 15 million. It was determined with 95% confidence that ≥ 95% of the single, double, and triple platelet products had acceptable residual WBC levels (1 failure in 93 collections), therefore meeting the United States FDA acceptance criteria. The single, double, and triple platelet products had a mean ± SD platelet yield (×1011) of 4.00 ± 0.556; 7.56 ± 0.655, and 10.60 ± 0.784, respectively. There was 1 single platelet product that had a residual platelet yield < 3.0 × 10¹¹ and none of the double and triple platelet products had a platelet yields below 6.2 × 10¹¹ or 9.3 × 10¹¹, respectively.
Conclusion: Single, double, and triple platelet products collected with Trima Accel 7 and stored in 100% plasma met acceptance criteria for both residual WBC levels and platelet yield.
NIT25
Understanding the Platelet Activation Status of Plateletpheresis Donors to Optimize Platelet Allocation
Gerda Leitner*1, Michaela Horvath2, Vera Kolovratova2, Andreas Tanzmann2 and Elisabeth Maurer‐Spurej3
1Clinic for Blood Group Serology and Transfusion Medicine, 2Medical University Vienna, 3University of British Columbia
Background/Case Studies: Platelet microparticles are known indicators of platelet activation and early markers of inflammatory and autoimmune conditions. It is not known if certain donor demographics are associated with more platelet activation and whether repeat donors consistently have activated or non‐activated platelets. This study aimed to understand the platelet activation status of plateletpheresis donors and quantify any changes in platelet activation status across multiple donations and between two collection technologies. This is important as activated platelets and/or their microparticle fragments could affect the immune and hemostatic properties of platelet transfusions.
Study Design/Method: The 12‐month study was conducted at the Vienna General Hospital Department of Transfusion Medicine starting January, 2016. Microparticle (MP) content (ThromboLUX, LightIntegra Technology Inc., Canada) was measured in platelet‐rich plasma (PRP) of 189 unique donors prior to 285 donations to determine their platelet activation status. Platelets were collected with either Amicus or Trima Accel cell separators and stored in 65% Intersol. Microparticle content was also tested in the final Intercept‐treated product.
Results/Finding: The average age of donors was 39 years (18‐68) and 56% were male. Pre‐donation platelet counts were 299 ± 51 × 109/L. The platelet activation status for donors with MP content (MP%) < 35% was considered non‐activated, while MP% ≥ 35% was considered activated (98 of 189 unique donors, or 52%). The MP% threshold of 35% had specificity = 94%, sensitivity = 77.6%, positive predictive value (PPV) = 78.6% and negative predictive value (NPV) = 93.7% for predicting PRP platelet activation. For repeat donors (N=43) PRP MP% at their first donation was consistent with consecutive results within 3 months but in 20 cases changed significantly after about 100 days. MP content in donor PRP and product samples showed significant positive correlations. Residual MP in the donated PCs from Trima (N=241) and Amicus (N=44) were significantly different (4.6 ± 6% vs. 9.5 ± 10%, 2‐sample t‐test p=0.003 at 0.05 level of significance) even though the donor population was the same.
Conclusion: Platelet activation status as determined by MP content in donor PRP varies significantly between donors regardless of sex or age and often changes after about 3 months. The activation status of platelets in the donated product is a consequence of platelet activation in the donor, however the type of cell separator affects the level of residual MP. Further studies are needed to determine the effect of platelet activation status on clinical outcomes.
NIT26
Investigation of Immunogenicity of Erythrocytes from GGTA1/β4GalNT2/CMAH Triple Gene Knockout Porcine
Qing Chen*1, Qin Chen2, Lili Shi1 and Yifan Dai2
1Jiangsu Province Blood Center, 2Jiangsu Key Laboratory of Xenotransplantation, Nanjing Medical University
Background/Case Studies: Genetic modification of porcine has considerable potential in supply of almost unlimited functional red blood cells (RBCs) to resolve the worldwide shortage of human RBCs for clinical transfusion. There are three major xenoantigens present on porcine, Galactosea a1,3 galactose (aGal), N‐glycolylneuraminic acid (Neu5Gc), and glycan products of β‐1,4‐Nacetyl‐galactosaminyl transferase 2 (β4GalNT2). Most humans have variable levels of antibodies against aGal, SDa, and Neu5Gc epitopes. Recently, GGTA1, β4GalNT2, and CMAH triple gene‐knockout (TKO) pigs through CRISPR/Cas9 mediated gene targeting were successfully produced in our lab. The aim of the present study was to evaluate immunogenicity of RBCs from TKO pigs to human antibody.
Study Design/Method: Pig blood was collected in heparinized vacuum tubes from GGTA1/β4GalNT2/CMAH TKO and wild type (ie, unmodified, WT) pigs. Flow cytometry analysis was performed on RBCs collected from TKO pigs, WT pigs and human with O blood group type to assess aGal, β4GalNT2, and Neu5Gc antigen expression. RBCs from TKO pigs, WT pigs and voluntary blood donors were incubated with heat‐inactivated human AB serum and analyzed for immunoglobulin (Ig) G and IgM binding characterized by flow cytometry. Total antibody binding was evaluated by hemagglutination.
Results/Finding: RBCs from GGTA1/β4GalNT2/CMAH TKO piglets and human with O blood group type were all negative for aGal, β4GalNT2, and Neu5G antigen expression while RBCs from WT pigs were positive for these three antigens. In vitro, the binding of human IgM/IgG to TKO pig RBCs was significantly lower compared to WT pig RBCs. Hemagglutinaion of TKO pig RBCs with human serum was much weaker compared to WT pig RBCs.
Conclusion: Our results indicated that TKO pig RBCs expressed significantly reduced xenoantigens compared to WT pig RBCs. Our data also suggest that GGTA1/β4GalNT2/CMAH TKO erythrocytes may be a source for human transfusions.
NIT27
Residual WBC Enumeration for Leucocyte‐Reduced Red Cell Concentrates Using a Novel Algorithm with the Sysmex XN‐1000 Hematology Analyzer: A Feasibility Study
Hsiu‐Fang Ho*1, Lei‐Fang Tsai1, Atsushi Shirakami2, Nien‐Tung Lee3 and Shun‐Chung Pai1
1Taipei Blood Center, 2Sysmex Corporation, 3Sysmex Corporation Taiwan
Background/Case Studies: In Taiwan, quality monitoring of blood products is a key issue because the ratio of leucocyte‐reduced (LR) products has been increasing to prevent serious transfusion reactions, such as febrile non‐hemolytic transfusion reaction (FNHTR). Currently, we do manual counting with a Nageotte‐Chamber for residual WBC (rWBC) enumeration, which is very time consuming and requires technical skill. In 2017 in Taiwan, the blood supply of LR‐RCC accounted for 18.04% of red blood cells, with a goal of full LR‐RCC. To achieve this, automation will be more important. As we had an opportunity to do a feasibility study of the Sysmex XN‐1000's new Blood Bank application (under development) for quality monitoring of blood products, we report the basic performance of this application for the rWBC, using the routinely manufactured LR Red Cell Concentrates (LR‐RCC). This study evaluates the feasibility of the Sysmex XN‐1000 for analysis of rWBC from LR‐RCC samples.
Study Design/Method: We evaluated three items: repeatability, stability and correlation with manual count/flow cytometry (FCM) methods. Repeatability: we tested 5‐run of rWBC using 10 LR‐RCC samples, Stability: we tested stability (after sampling from pack) of rWBC using 3 LR‐RCC samples. Each sample was run at 0hr, 3hrs, 5hrs, 24hrs and 48hrs. Correlation: we tested correlation with manual count and FCM (BD Leucocount™), using 30 LR‐RCC samples.
Results/Finding: Repeatability: When rWBC<1 cell/μL, CV% was 10‐48%; when rWBC > 1 cell/μL, CV% was 7‐16%. Stability: we confirmed that rWBC showed good stability up to 48 hours. Correlation: The results (r2 and correlation formula) were 0.9896, y = 0.9635x + 0.00001 for manual count; and 0.9941, y = 0.5859x ‐ 0.0001 for FCM, respectively.
Conclusion: The XN‐1000 showed good consistency with the manual count. The FCM results were higher than the XN‐1000/manual count, which may be due to the gating area. The FCM included “rain” dots, which refer to damaged cells, while the XN‐1000 gating excluded suspected artefacts, and the damaged cells were excluded by the manual count which we routinely do.
It will be possible to perform routine residual WBC testing with a hematology analyzer platform in the near future. We believe this will improve the workflow of quality monitoring for blood products by shortening the TAT (about 1.8 minutes/sample), raising the QC sampling rate for RCC packs, and reducing the total testing cost including labor charges.
NIT28
Evaluation of Operational Efficiencies with Trima Accel 7
Ayda Rodriguez*1, Solanyi Forero1, Deissy Baquero1, Claudia Cruz2, Cris Ortegon2, Andrew Howell2, Logan Fender2 and Leslee Simon‐Blum2
1Cruz Roja, 2Terumo BCT
Background/Case Studies: The Trima Accel v6 has been used for collecting platelets in PAS with the goal of collecting a minimum of two platelet products per collection. Collection time often dictates selection of which device is used and which products are collected. In January 2018, our center began using the newest version, Trima Accel 7 with the T‐Cuff accessory(Terumo BCT, Lakewood CO). Trima Accel 7 is designed to meet the needs of blood centers for access management. AutoFlow is a feature of Trima Accel 7 designed to reduce access related alerts by making automated adjustments to flow rates based on donor access flow or system pressure issues detected by the Trima Accel device. The accessory T‐Cuff (pressure cuff) is designed to encourage donor squeezing and ensures pressure up to 40 mmHg on the donor's arm. In addition, Trima Accel 7 was designed to enhance platelet collection productivity through modifications to the platelet collection algorithms and improved procedural management.
Study Design/Method: Trima Accel devices were upgraded to version 7 software on January 30, 2018. Utilizing the Cadence System (TerumoBCT, Lakewood CO) procedure data was captured for 109 donations through March 16, 2018 (Test). Additional procedure data (211 donations) was collected for a control period with Trima Accel v6 between November 1, 2018 and January 30, 2018 for comparison. Platelet product yield, procedure time, venous access alerts and donor information were then analyzed between Test and Control groups.
Results/Finding: Following the software installation to Trima Accel 7, an overall platelet collection efficiency increase of 9% platelet yield E11/hour was noted, 4.41 E11 for test procedures versus 4.06E11/hour for control procedures (P < .001). The average procedure time dropped between test and control groups by approximately 6 min (90.6 min vs 96.0 min, p < .001) while improving the reported collected yield by 0.2E11 (6.7E11 vs 6.5E11, p < .001).
A statistically significant difference was also shown in the average number of access alerts in a donation between Trima Accel 7 and Trima Accel V6.0. The average number of access alerts dropped from 6.57 per procedure during the Control period, to 0.48 per procedure during the Test period (P value < 0.001). More than twice as many donations completed successfully without an access related alert when comparing the Test period (76%) to the Control period (36%) (P value < 0.001). There were zero donations with greater than 10 alerts in a single donation during the Trima Accel7 period, compared to the Control period with 40/209 frequent access alerts in a single donation (P value < 0.001). The Test and Control groups were comparable for total blood volume (5.0L versus 4.9L) and pre‐donation platelet counts (285 × 103/µL versus 277 × 103/µL).
Conclusion: Trima Accel 7 increased platelet collection productivity when compared to current Trima Accel V6.0. Trima Accel 7 also dramatically reduced the number of access related operator alerts per donation. Implementation of this software has enabled our center to collect more platelet components per procedure which contributes to improved cost effectiveness and maintenance of an adequate inventory.
NIT29
Effects of Gamma Irradiation on the Growth of T‐Lymphocytes and Quality of Red Blood Cells Stored in Oxygen‐Reduced Condition
Loren Fast1, Samuel Sowemimo‐Coker*2 and Andrew Dunham2
1Rhode Island Hospital, 2Hemanext
Background/Case Studies: Hemanext has developed a technology for long term storage of red blood cells (RBCs) in AS3 under oxygen‐reduced storage condition. Storage of RBCs under this condition has been shown to improve the quality of the cells for transfusion. White blood cells (WBCs) in RBCs for transfusion may be responsible for causing transfusion associated graft versus host disease (TA‐GVHD) in immunocompromised patients. Gamma irradiation and leukocyte‐reduction of blood products for transfusion are currently being used to prevent this serious adverse effect of blood transfusion. It is unknown if the effectiveness of gamma irradiation for WBC abrogation will be affected by the reduced oxygen content in Hemanext RBC. Therefore, the present study was designed to determine the effects of Hemanext RBC storage condition on the quality of red blood cells and growth and proliferation of T‐lymphocytes following gamma irradiation.
Study Design/Method: Two units of fresh leukocyte reduced red cell concentrates (LR‐RCC) in AS3 were obtained from Rhode Island blood Center (RIBC). The two units were pooled together to create 600mL of homogenous pool of LR‐RCC. Peripheral blood mononuclear cells (PBMNC) were isolated from one or two units of ABO matched non‐leukocyte red cell concentrates (NLR‐RCC) using Ficoll gradient and CD3 antibody coated magnetic beads per manufacturer's instructions for use. The PBMNC isolated from the aliquot of blood were added back to the pooled LR‐RCC at a final concentration of 2 × 10⁵/mL. Equal aliquot of 300mL of the pooled unit was added to a conventional PVC red cell storage bag while the other 300mL was de‐oxygenated for 3 hours at room temperature with Hemanext Red Cell Processing System, transferred into Hemanext bags for storage at 1‐6°C for 42 days. In vitro metrics (ATP, 2, 3DPG, hemolysis etc.) of red cell quality were measured before, after processing and during storage. After storage for 7 days, 100 mL were removed from each of the bags and the RBCs remaining in the bags were then exposed to 25 Gy of gamma irradiation per standard protocol at RIBC. PBMNC were isolated from the pre‐ and post‐ irradiation samples and tested for their ability to respond to mitogens in a limiting dilution assay.
Results/Finding: The percent oxygen saturation of the hemoglobin (%SO2) in the Hemanext RBC samples were reduced from 57.3 ± 15.2% to 6.9 ± 2.4% (N=4). The hemolysis in the samples 7 days after gamma irradiation were 0.25 ± 0.18% for control and 0.24 ± 0.09% for Hemanext. The results showed significant growth and proliferation of T‐lymphocytes at different levels with non‐irradiated control and Hemanext RBCs. The growth and proliferation of T‐lymphocytes were inhibited with at least a 4.7 × 10⁴‐fold reduction in the frequency of responding T cells following gamma irradiation in the PBMNC in RCC stored in normal conventional or Hemanext RBC storage bags.
Conclusion: These results indicate that the proliferation of WBCs present in RBCs processed with Hemanext red cell processing system and stored in Hemanext storage bags is susceptible to gamma irradiation in a similar fashion to those stored with current conventional storage condition.
NIT30
A Multicenter Study to Evaluate the Modified Postcount Algorithm on the Trima Accel System
Pamela Lopert*1, Jack Rhodes1, Logan Fender1, Diane Eklund2, John Asuncion2, Janet Villa2, Kadi Schroeder3, Nero Evero3 and Tuan N. Le3
1Terumo BCT, 2San Diego Blood Bank, 3Bonfils Blood Center
Background/Case Studies: Platelet transfusions are used for the treatment and prophylaxis of bleeding associated with major trauma, surgery, and in individuals that are thrombocytopenic or have other platelet dysfunctions. Most platelets transfused in the United States are collected by apheresis. A challenge of platelet collection by apheresis is to calculate an accurate estimate of the donor's post‐collection platelet count that can maximize the number of platelets that can be collected without jeopardizing the safety of the donor.
Study Design/Method: This was a prospective, open label, non‐randomized, multicenter study to evaluate the safety and efficacy of the Trima Accel system's modified postcount algorithm software. Healthy adult volunteer donors consented to donate either a single or a double platelet product on the Trima Accel system with the modified platelet postcount algorithm software. The participant's post‐procedure platelet count was measured to confirm it was ≥ 100,000 platelets/μL. The collected product was assessed for residual white blood cell (WBC) content and pH.
Results/Finding: One hundred and twenty (120) participants donated an evaluable single (n=60) or double (n=60) platelet product. All single and double platelet collections resulted in a postcount ≥ 100,000 platelets/μL with the lower one‐sided 95% confidence interval for both single and double platelet products of 0.951. Calculation of the mean difference between the measured postcount and the Trima Accel predicted postcount for single and double collections was 7.4 × 10³/µL ± 14.21 × 10³/µL (P‐Value < 0.001) and 19.4 × 10³/µL ± 20.74 × 10³/µL (P‐Value < 0.001), respectively. Thus, the Trima predicted platelet postcounts were on average lower than the actual measured postcounts. Regarding the collected platelet quality, all 120 evaluable platelet units had residual WBC < 5.0 × 10⁶. Specifically, single platelet units had a mean residual WBC of 0.1 × 10⁶ ± 1.7 × 10⁶ and double platelet units had a mean residual WBC of 0.3 × 10⁶ ± 0.56 × 10⁶. Platelet pH was assessed 1 or 2 days after collection (depending on the site's standard practice) and all products had pH ≥ 6.2 (single = 7.48 ± 0.13; double = 7.38 ± 0.23). Finally, 7 adverse events (AEs) were reported by 7 (5.5%) participants. This AE rate was consistent with a prospective clinical study on the previous version of the Trima Accel postcount algorithm with a total of 17 AEs in 12 (6.2%) of 195 total participants.
Conclusion: Collection of single and double platelet products on the Trima Accel system with the modified platelet postcount algorithm software was safe and maintained the participant's post procedure platelet count ≥ 100,000 platelets/μL.
NIT31
In Vitro Functionality Test of Serum Eye Drops
Jos Lorinser1, Stéphanie Groot1, Jaap van Buul2, Anne‐Marieke van Stalborch2, Pieter F. van der Meer1 and Dirk de Korte*1,2
1Department of Product and Process Development, Sanquin Blood Bank, 2Sanquin Research and Landsteiner Laboratory
Background/Case Studies: Human serum eye drops (SEDs) are used for treatment of dry eye syndrome. The hypothesis is that active components of serum, such as growth factors, have an active effect on dry eyes because the adhesion between cells in the cell layers of the eye strengthen, thereby improving the barrier function. However, until now there is no in vitro model to test the effectiveness of SEDs. We developed a standardized in vitro system to test the healing effect of SEDs on human endothelial / epithelial cells, representing the cell layers of the eye. We also investigated at which concentration of serum the healing effect is optimal.
Study Design/Method: Two heat‐inactivated serum pools were tested on cell layers of Human Umbilical Vein Endothelial Cells or human lung epithelial cells H292 and A549. Measuring the resistance across the cell layers, caused by the adhesion of the cells, was carried out in triplicate for each serum pool in 8‐well Electric Cell‐substrate Impedance Sensing (ECIS) arrays with 1.0 × 10⁶ cells per well. After formation of a cell monolayer, 200 μl of serum was pipetted per well in duplicate, with 10, 20 and 40% final concentration and as 0% serum control 200 μL of EGM‐2 growth medium. Results were calculated and normalized from the time of serum addition and measured during 16 hours.
Results/Finding: Very reproducible results were obtained with the various cell lines and serum pools. For endothelial cells, the highest difference in resistance was measured with 10% serum, indicating a strengthening of the barrier function of the cell layer and improved adhesion of the cells. The effect for the various concentrations was almost the same and was maintained the full 16 hours. For epithelial cells, the highest resistance difference was measured with 40% serum, with a dose‐response relationship. With 40% serum, a long activity was measured, while the lower percentages serum returned to the level of 0% serum after an initial effect within the 16 hour measurement.
Conclusion: With ECIS a reproducible in vitro model has been developed to test serum pools with the used endothelial and epithelial cells. There is a direct and reproducible activity measured at all dilutions. For endothelial cells, the improved adhesion between the cells remains for all concentrations during the full measurement time. For epithelial cells this is only the case with 40% serum.
ECIS is very suitable for follow‐up research in which wounding can be applied to the cell layers, in order to determine the maximum healing effect of SEDs.
NIT32
Why Are In Vitro Platelet Characteristics Not Predicting Clinical Outcomes?
Elisabeth Maurer‐Spurej*
University of British Columbia
Background/Case Studies: For decades it has been the notion in transfusion medicine that it would be the “Holy Grail” to find an in vitro assay that could tell what will happen in vivo. Despite great efforts put into developing assays such as flow cytometric assessment of P‐selectin (CD62P) expression, morphology score by microscopy, hypotonic shock response (HSR), extent of shape change (ESC) and others, none is being routinely used in hospital blood banks for platelet (PLT) inventory management. Recently, the detection of PLT microparticles (MP) has been introduced to assess PLT activation status but clinical validation of an association between high MP and poor outcome is still in progress. This study compared MP content with morphology score and clinical outcome with the goal to reveal the challenges and inform future studies.
Study Design/Method: A clinical study conducted at the Vancouver General Hospital, Canada from 2011 to 2014 enrolled 200 hematology/oncology patients. Patient baseline data including pre‐ and post‐transfusion PLT counts and PLT transfusion characteristics including PLT activation status were prospectively collected. PLT activation status was measured as MP content (MP%) by dynamic light scattering (ThromboLUX, LightIntegra Technology Inc., Canada). Morphology scores were obtained by phase contrast microscopy (Nikon, Japan, 100x objective) on small paraformaldehyde‐fixed samples. MP% of single donor PLTs (SDP) suspended in plasma was compared to their morphology score and clinical response measured as 1‐hr and 24‐hr corrected count increments (CCIs).
Results/Finding: All patients received a total of 997 transfusions of which 328 were SDP. Patients were 56% male, 51 ± 13 years of age, diagnosed with ALL/AML (65%), 40% were CMV positive, 10.5% tested positive for anti‐HLA antibodies, baseline PLT counts were 57 ± 53 × 109/L and WHO bleeding >1 was rare. Sensitivity analysis revealed that major ABO mismatch, complex cases with multiple transfusions in short succession, patient testing positive for anti‐HLA antibodies and patient older than 60 years were confounding factors. Activation status measured by MP% of SDP transfusions not impacted by these confounding factors (N = 54) showed a moderate correlation with 24‐hr CCIs in CMV positive patients diagnosed with AML (R2 = 0.304, P = 0.018). For activated PLTs, MP% and morphology scores of SDP (N=54) showed a moderate inverse correlation (R2 = 0.315, P = 0.001). There was no correlation for non‐activated platelets due to the difficulty to differentiate non‐activated platelets accurately by visual inspection.
Conclusion: In contrast to relative quality control parameters such as P‐selectin expression, MP content and morphology score reflect the entire history of PLTs from the donor to the PLT unit. The data suggest that refining the question might lead to a solution: rather than aiming to predict all outcomes the goal might be to predict the worst outcomes. PLT transfusions with MP% > 15% or a low morphology score have a high probability of insufficient increase in 24hr CCI in CMV + AML patients. Thus, a practical approach to improving overall clinical outcomes may be to avoid activated PLT transfusions for prophylaxis.
NIT33
Evaluating Productivity on Trima Accel 7
Burak Deveci*1, Hüsnü Altunay1, Haydar Veske1, Ercan Nogay1, İhsan Karadoǧan1, Alexandra Zelinskaya2 and Logan Fender2
1Antalya Medstar Hastanesi, 2Terumo BCT
Background/Case Studies: Improving platelet apheresis productivity enables blood centers to maintain adequate inventory of a short shelf life product and to improve operational cost effectiveness. Trima Accel 7 (Terumo BCT, Lakewood CO) was designed to enhance platelet collection productivity through modifications to the platelet collection algorithms and improved procedural management.
Study Design/Method: This was a retrospective study consisting of 1,093 donations from January 01, 2016 through July 01, 2016 on Trima Accel V6.0 (Control) compared to 1,995 donations between July 01, 2017 and March 05, 2018 on Trima Accel 7 (Test). Trima Accel procedural data was captured using the Cadence System (Terumo BCT, Lakewood CO). Platelet product yield, procedure time, and donor information were analyzed between test and control groups for measurable difference.
Results/Finding: A statistically significant difference in platelet collection productivity was measured between Trima Accel V6.0 and Trima Accel 7. The average procedure time dropped between test and control groups by approximately 5% (53.2 min vs 56.0 min, p < .001) while improving the reported collected yield by 10% (4.4E11 vs 4.8E11, p < .001). When normalized for donation time, Trima Accel 7 produced a 13% increase in platelet yield / hour, with an average of 5.4E11 versus control procedures at 4.8E11, (p < .001). The test and control groups were comparable for total blood volume and pre‐donation platelet count, despite statistically significant differences in favor of larger TBVs (5.3L versus 5.8L; p < 0.001) and higher pre‐donation platelet counts (264 × 103/µL versus 268 × 103/µL; p = 0.031) for the control group.
Conclusion: Trima Accel 7 resulted a statistically significant increase in platelet collection productivity when compared to current Trima Accel V6. Trima Accel 7 may enable blood centers to collect more platelet components per procedure which contributes to improved blood center cost effectiveness and maintenance of an adequate inventory.
NIT34
Evaluation of the Amotosalen/UVA Pathogen Inactivation Method for Platelets for Routine Use
Tareq Mustafa*
King Abdulaziz Hospital
Background/Case Studies: Bacterial contamination of platelets is one of the major threats for blood safety, approx. 1 of 1500 platelet units is potentially contaminated. That risk may even be higher since evaluations were conducted with culture based methods, which are known to have a high false negative rate. Even receiving a contaminated unit does not necessarily cause a bacterial sepsis, the recipients of platelet transfusions are often immunocompromised or critically ill, so bacterial contaminations may have problematic consequences for the health status. Pathogen inactivation is a technology developed to reduce the risk of transfusion‐transmitted infections. National hemovigilance data of several France, Belgium and Switzerland, as well as several hemovigilance studies, show efficient prevention of transfusion‐transmitted bacterial sepsis.
Aims: Evaluation of the amotosalen/UVA pathogen inactivation technology to mitigate the risk of transfusion‐transmitted bacterial contamination of platelets using a gram‐negative and a gram‐positive organism playing an important role in transfusion‐transmitted bacterial sepsis.
Study Design/Method: Three therapeutic apheresis platelet units (>3x10¹² platelets/unit) in 100% plasma were collected. 1 h post collection, two units were spiked with approx. 2x10³ cfu per bag with S.aureaus (ATCC# 25923) and E.coli (ATCC# 25922) respectively. The third unit served as control. At day 1 post collection (16‐20 h post spiking) samples for testing were taken followed by pathogen inactivation of all units with the INTERCEPT Blood System (Cerus Corporation, U.S.A.) using the Large Volume Processing Kit for Platelets. Post inactivation, the units were incubated until day 7, taking samples for further analysis at day 5 and day 7. Bacterial growth was detected with a BacT/ALERT automated blood culture system (Biomerieux, France). Platelet count, platelet volume and pH were assessed at day 1, day 5 and day 7 with standard procedures.
Results/Finding: The average pH at day 5 was 6.9 ± 0.1 (drop of 2% from day 1), at day 7 6.5 ± 0.3 (drop of 7.8% from day 1); the pH of each unit never dropped below 6.2 during the course of 7 d storage. The platelet count per bag did not change significantly during 7d storage, the average volume loss was negligible (1 ± 0.3% at day 5 and 2 ± 0.1% at day 7). Bacterial growth was detected at day 1 before pathogen inactivation in the E.coli and S.aureaus units, but not in the control unit. At day 5 and 7 of storage, no bacterial growth was detected in blood cultures of all units, showing sterility of the units formerly spiked with bacteria.
Conclusion: Units spiked with E.coli and S.aureus were successfully inactivated by amotosalen/UVA pathogen inactivation, staying sterile for 6 more days of storage post inactivation. The quality parameters of all units were within specifications, but we recognized a significant drop of pH between day 5 and day 7 of storage.
NIT35
Evaluation of Trima Accel 7 Autoflow
Burak Deveci*1, Hüsnü Altunay1, Haydar Veske1, Ercan Nogay1, İhsan Karadoǧan1, Sevgi Beyazova2, Alexandra Zelinskaya3, Logan Fender3 and Leslee Simon‐Blum3
1Antalya Medstar Hastanesi, 2Terumo BCTTıbbı Cihazlar Daǧıtım ve Hizmetleri A.Ş., 3Terumo BCT
Background/Case Studies: Venous access management is crucial to donor experience and operational efficiency of an apheresis device. Terumo BCT has developed Trima Accel 7 (Terumo BCT, Lakewood CO) to improve the donation experience by reducing venous access alerts via the AutoFlow feature. AutoFlow is intended to reduce access related alerts by making automated adjustments to flow rates based on access flow or system pressure issues detected by the Trima Accel device. In addition, the accessory T‐Cuff (pressure cuff) is designed to encourage donor squeezing and ensures pressure up to 40 mmHg on the donor's vein. The combination of AutoFlow and the accessory T‐Cuff should reduce venous access alerts, minimizing operator intervention and improving donor experience.
Study Design/Method: This was a retrospective study consisting of the analysis of 1,093 donations from January 1, 2016 to July 1, 2016 on Trima Accel V6.0 (Control) compared to 1,995 procedures from July 1, 2017 to March 5, 2018 on Trima Accel 7 with the T Cuff (Test). Trima Accel procedural data was captured using the Cadence System (Terumo BCT, Lakewood CO) and analyzed for access alerts.
Results/Finding: During the Control period the average number of access alerts was 2.50 per procedure whereas during the Test period the average number of access alerts was 0.71 per procedure (P value < 0.001). More than twice as many donations completed successfully without an access related alert when comparing the Test period (73% with V7.0 software) to the Control period (35% with V6.0 software) (P value < 0.001). Furthermore, the rate of donations with more than 10 access alerts in a single donation was reduced by a factor of 6.3; in the Test period < 1/130 donations had more than 10 access related alerts, compared to the Control period with approximately 1/20 donations had greater than 10 access alerts, p value < 0.001.
Conclusion: Trima Accel 7 resulted in a significant reduction in venous access alerts. resulting in less operator interventions. Reducing operator interventions enables staff to spend more time with donors and to complete additional duties on the donor room floor.
QT2
Stability of French Lyophilized Plasma Following Accidental Temperature Excursion during Shipping
Michael A. Meledeo*1, Grantham C. Peltier1, Colby S. McIntosh1, William Barnes2, James A. Bynum1 and Andrew P. Cap1
1U.S. Army Institute of Surgical Research, 2HQ AFSOC
Background/Case Studies: Dried plasma provides the same valuable functions as fresh frozen plasma (FFP) in hemostatic resuscitation, including replacing volume, buffering after shock, and providing coagulation factors. Dried plasmas offer advantages of simpler storage (the dried plasma in this study has a two year stability between 2‐25˚C) versus FFP (frozen ≤ ‐18˚C or ≤ ‐65˚C). Additionally, dried plasmas can be rehydrated in <5 min, much more quickly than thawing FFP.
French lyophilized plasma (FLyP) is imported by US Special Operations Command under an FDA investigational new drug protocol. Recently, a FLyP shipment experienced unplanned transit temperature excursions (>40˚C for 14 hours, max 57.5˚C). Functional tests were performed on this FLyP to determine usability.
Study Design/Method: Prothrombin time (PT), activated partial thromboplastin time (aPTT), and factor levels (fibrinogen and labile Factors V and VIII) were measured in rehydrated heat‐exposed FLyP (exFLyP). Coagulation parameters were measured with rotational thromboelastometry (ROTEM). Thrombin (FIIa) generation was quantified by thrombogram. Historical FLyP data were used as a reference. Comparisons were also made vs. pooled FFP, fresh platelet‐poor plasma (PPP), and fresh FFP.
Results/Finding: PT and PTT for exFLyP were prolonged, and fibrinogen, FV, and FVIII levels in exFLyP were decreased compared to controls. Similarly, clotting times in ROTEM were longer in exFLyP, but angle (rate of clotting) and max amplitude (clot strength) were similar to controls. In thrombogram, no change in lagtime was seen for exFLyP vs. FFP/PPP, but peak FIIa and exogenous thrombin potential (ETP) were significantly diminished in exFLyP. No historical thrombogram or ROTEM data for FLyP were available. Table 1 shows exFLyP units vs. FFP/PPP, and table 2 compares exFLyP mean vs. historical FLyP mean.
TABLE 1 (QT2)
| exFLyP (n=3) | Pooled FFP | Fresh PPP | Fresh FFP | |||
|---|---|---|---|---|---|---|
| PT (s) | 17.2 | 18.7 | 16.7 | 13.5 | 13.7 | 13.7 |
| aPTT (s) | 37.7 | 43.4 | 36.7 | 28.1 | 25.8 | 25.9 |
| Fbgn (mg/dl) | 221 | 252 | 240 | 251 | 255 | 268 |
| FV activity (%) | 65 | 56 | 58 | 74 | 79 | 79 |
| FVIII activity (%) | 44 | 43 | 55 | 137 | 214 | 219 |
| FIIa Lagtime (min) | 2.77 | 3.02 | 2.77 | 2.77 | 2.77 | 2.77 |
| ETP (nM*min) | 758.9 | 545.2 | 525.1 | 1244 | 1530.6 | 1342.4 |
| FIIa Peak (nM) | 79.2 | 45.0 | 48.3 | 222.9 | 254.9 | 221.9 |
| Time to Peak (min) | 8.0 | 9.8 | 8.8 | 6.3 | 6.5 | 6.5 |
| INTEM CT (s) | 243 | 269 | 251 | 172 | 160 | 138 |
| MCF (mm) | 18.5 | 26 | 22.5 | 17 | 19.5 | 20.5 |
| Angle (°) | 77.5 | 80.5 | 78.5 | 76 | 78 | 78 |
| EXTEM CT (s) | 72 | 85 | 75 | 54 | 62 | 56.5 |
| MCF (mm) | 20 | 28 | 25 | 18 | 21 | 21.5 |
| Angle (°) | 81.5 | 84.5 | 83 | 80 | 79 | 80.5 |
TABLE 2
| exFLyP (n=3) | Historical FLyP (n=27) | p | |
|---|---|---|---|
| PT (s) | 17.5 | 15.4 | .99 |
| aPTT (s) | 39.3 | 31.9 | .90 |
| Fbgn (mg/dl) | 237.7 | 288.2 | <.0001 |
| FV activity (%) | 59.7 | 58.4 | .99 |
| FVIII activity (%) | 47.3 | 103.9 | <.0001 |
Conclusion: Historically, FLyP has normal FVIII, but because FV was relatively unchanged in exFLyP, FVIII depletion consequences are limited to clot initiation delay (PT and ROTEM CT) and decreased FIIa peak and ETP, consistent with a 3‐month shelf life reduction in prior studies. ROTEM data were comparable to other currently used plasma products.
QT3
The Effect of in‐Process Quality Control Checks within the Laboratory on Overall Turn‐Around‐Time
Douglas Armstrong*1, Emmanuel Casasola1, Valery Freeman‐Allen1, Robert Medina1, Jaime Washington1, Elvie Bayani1, Chris Gomez1, Rachel Beddard2 and Scott Jones1
1QualTex Laboratories, 2BioBridge Global
Background/Case Studies: The review of testing packets at the end of testing adds time to the process. With clients needing results between 10 and 12 hours from sample receipt, every minute is important. Having Quality Control staff separated from the process causes issues to be identified after they occur, resulting in additional delays and rework. In addition, the physical separation of the departments hinders communication. A faster method of providing quality control checks for laboratory testing was needed. This laboratory placed staff within the testing lab to perform quality checks in process and the effect on turn‐ around time was assessed.
Study Design/Method: The first laboratory area selected for study was viral marker testing, which includes antibody testing for HIV 1/2, HTLV I/II, HCV, HBsAg, HBc, and Chagas. A team was assembled to review and identify all critical check points needed within the process. Each critical check point was further assessed to determine if it could be performed in‐process or if computer automation could perform the check. The team identified sample acceptability and external controls as the critical checks to be performed in‐process. Work stations were placed within the laboratory testing area for quality staff to perform these in‐process checks and procedures and training were developed. In addition, the laboratory information system was configured with algorithms to allow for automatic approval of test results if the critical checks were acceptable.
Results/Finding: For each batch of viral marker testing, the in‐process checks take 5 minutes, compared to about 30 minutes for end‐of‐process checks. At end of testing, only exceptions have to be reviewed by quality control staff prior to result release. This process change resulted in an improvement in the average turn‐around time as detailed in the table below. Specifically, the average turn‐around‐time for viral marker testing was decreased 1.35hrs in the Atlanta laboratory and 0.56hrs in the San Antonio laboratory.
Viral Marker Testing Turn Around Time (Hrs)
| End‐of‐Process Review and Manual Result Release | In‐Process Review and Automated Result Release | |
|---|---|---|
| Atlanta Laboratory | 12.98 | 11.63 |
| San Antonio Laboratory | 9.17 | 8.61 |
Conclusion: Implementation of in‐process quality control review reduces the time for result release and at the same time maintains the high quality of the review and result release. It is estimated that implementation of additional areas will further reduce turn‐around time by up to 2 hours. The reduction in review time will allow the Quality Control staff to perform more detailed quality verifications of areas outside of the testing process, including facility cleanliness, appropriate labeling and storage of materials, training, and safety.
QT4
Risk of Transfusion Errors: Are Children Vulnerable in Different Ways?
Sarah Vossoughi*1,2, Gabriela E. Perez3, Barbee I. Whitaker4, Mark K. Fung5, Srijana Rajbhandary3 and Brie Stotler1,2
1Columbia University Irving Medical Center, 2New York‐Presbyterian Hospital, 3AABB, 4FDA/CBER, 5University of Vermont Medical Center
Background/Case Studies: Patient safety remains a critical issue in health care with the National Patient Safety Foundation recently declaring preventable medical harm a public health crisis. A 2016 study estimated patient mortality from medical error at >200,000 deaths annually (Makary MA & Daniel M. BMJ, 2016; 353:i2139) with non‐lethal medical error estimated to be 10‐20 fold more common (James JT. Journal of Patient Safety, 2013; 9: 122‐128). The aim of this study is to evaluate patient safety events related to the transfusion of blood components.
Study Design/Method: This is a descriptive study of patient safety incidents related to blood transfusions reported to the AABB Center for Patient Safety (CPS) and to a non‐CPS medical center from January 2010 through September 2017. Data were aggregated from 3 children's hospitals and 29 adult hospitals. Reported patient safety events in pediatric and adult patients involving the transfusion of any blood component were analyzed. Reports were categorized using codes from the Centers for Disease Control Hemovigilance Module. Denominators were pediatric or adult total transfusions per year. Descriptive statistics were used and rates calculated per 100,000 components transfused with Pearson's Chi Square for comparison (P<0.05 as significant).
Results/Finding: There were 1,806 reports for 1,088,884 transfusions; 249 reports from 99,064 pediatric transfusions and 1,557 reports from 989,820 adult transfusions. The calculated reporting rate per 100,000 components was 251 for pediatric and 157 for adult reports (P<0.001). Among pediatric reports, the most common incident code (Table 1) was UT19 “Transfusion protocol not followed” (31%). Among adult reports, the most common incident code was UT03 “Product not administered” (43%).
Conclusion: The total incident report rate for pediatric vs. adult patients was significantly different, with a higher rate associated with pediatric transfusions. Pediatric patients had a higher number of “protocol not followed” reports while adult patients had a higher number of “not administered” reports. Understanding patient safety events related to blood transfusion will help target hemovigilance education and interventions to the appropriate patient populations.
TABLE 1 (QT4) Most frequent incidents reported
| Product Administration (Incident Code) | Pediatric N (%) | Pediatric Rate (per 100,000) | Adult N (%) | Adult Rate (per 100,000) | P‐value |
|---|---|---|---|---|---|
| UT03 Product not administered | 51 (20%) | 52 | 676 (43%) | 68 | 0.059 |
| UT04 Incorrect storage of product on floor | 50 (20%) | 51 | 380 (24%) | 38 | 0.082 |
| UT07 Administration delayed | 15 (6%) | 15 | 87 (6%) | 9 | 0.072 |
| UT19 Transfusion protocol not followed | 78 (31%) | 79 | 81 (5%) | 8 | <0.001 |
| UT22 Order/consent check incorrect/ not performed | 14 (6%) | 14 | 27 (2%) | 3 | <0.001 |
| Total Product Administration Incidents (N=1,806) | 249 (100%) | 251 | 1,557 (100%) | 157 | <0.001 |
| Total transfusions (N=1,088,884) | 99,064 | 989,820 |
QT5
Implementation of Blood Component Transfusion Using Electronic Positive Patient Identification within the Intra‐Operative Suites
Heather L. McGann*1, Erika M. Reese1, Magali J. Fontaine2, Ashanpreet S. Grewal3 and Amy Hebrank4
1University of Maryland Medical Center, 2Department of Pathology, University of Maryland School of Medicine, 3Department of Anesthesia, University of Maryland School of Medicine, 4Informatics, University of Maryland Medical System
Background/Case Studies: Software for electronic positive patient identification (ePPID) for blood transfusion was implemented in November 2015 for all inpatient and ambulatory transfusions at our hospital. This technology utilizes a 2D barcode wristband with barcodes printed on blood component labels. This implementation was embraced by nursing and removed the manual process for two licensed independent practitioners to verify patient identification (mPPID) for all blood component transfusions. Intraoperative (intraop) transfusions were excluded from initial scope.
Study Design/Method: A multidisciplinary committee was assembled to identify the feasibility to utilize ePPID for intraop transfusions and address 1) removal of mPPID 2) decrease blood component wastage, and 3) improve compliance for blood administration documentation. A pilot was designed for ePPID installation in only Cardiac Surgery operating rooms (ORs). Training included a video and interactive hands‐on sessions led by Clinical Informatics and superusers. A total of 44 anesthesiologist providers were trained. The pilot included 50 cases and ran for 3 weeks. An online survey was created to solicit feedback from providers. The pilot was completed in January 2017, and the committee recommended expansion to remaining 45 ORs, and over 200 providers were trained. The expansion was completed in December 2017. The data included in the pilot: number (n) of cases that used ePPID; blood components (n) scanned and returned to the Blood Bank, which is a patient safety risk; post expansion: transfusions (n) using ePPID compared to mPPID and overall compliance at 30, 60, and 90 days. Massive transfusion events were excluded.
Results/Finding: For the pilot, 60 cases were completed by 24 providers. 233 transfusions used ePPID with 0 units scanned and returned. Online survey conveyed providers felt ePPID improved patient safety, decreased blood wastage, and desire to use ePPID for all transfusions. Following expansion, 138 transfusions were audited (Table 1), 8 showed non‐compliance, 7 due to user error with ePPID software. Post expansion showed ePPID compliance increased to 94% compared to 71% with mPPID from a previous audit. At 30 days post expansion, use of mPPID was at 27% of transfusions, decreasing in the later audits.
TABLE 1 Transfusion Audits Post Expansion
| Days post expansion | Products Transfused Intra‐Op | ePPID n (%) | mPPID n (%) | Overall Compliance of Patient ID |
|---|---|---|---|---|
| 30 | 59 | 38 (73) | 16 (27) | 92 |
| 60 | 25 | 23 (92) | 0 (0) | 92 |
| 90 | 54 | 53 (98) | 0 (0) | 98 |
Conclusion: This pilot study showed feasibility with provider acceptance of ePPID for intraop transfusions and created momentum for the expansion of ePPID to all ORs. The strong collaboration of all stakeholders combined with a 2 step implementation (pilot followed by expansion) of ePPID bar scanning technology, allowed for increased patient safety and workflow efficiency in the intraoperative suites.
QT6
Transfusion Decisions: When Critical Value Is Also a Transfusion Threshold: Does Critical Value Reporting Impact Transfusion Decisions?
Afshan Idrees*, Amal Shukri, Agnes Aysola and Jinous Saremian
University of Florida, College of Medicine
Background/Case Studies: Appropriate utilization of blood components is crucial for patient safety and improved outcomes. Based on multiple randomized control trials, hemoglobin (Hgb) threshold for prophylactic RBC transfusion was lowered from 10 to 7 g/dL; however, guidelines emphasize not to use Hgb level as the sole criterion to make a transfusion decision. At our institute, currently the threshold coincides with the Hgb critical value of 7 g/dL. Critical value is defined as a life threatening laboratory value that requires timely provider notification prompting clinicians to take an action to avoid significant morbidity and mortality. Our hypothesis is that critical value notifications are affecting the providers' decision to transfuse when alerted that the hgb level is ≤7 g/dL. Our aim is to determine if having the critical value for low Hgb at the same value as threshold for prophylactic transfusion leads to over‐utilization of RBC transfusions.
Study Design/Method: A total of 150 cases of adult in‐patients (age > 14 years) were reviewed who received RBC transfusions with a pre‐transfusion Hgb of ≤ 7.0 g/dL at our institute. Pediatric patients, all patients with massive transfusions and surgical patients were excluded. Data was collected regarding demographics, vital signs, diagnosis, symptoms of anemia, pre‐transfusion Hgb, presence of active bleeding, length of stay, number of RBC units transfused and transfusion reactions. Criteria for justification of transfusions were based on the presence of any of the following; a) unstable vital signs, b) cardiac disease, c) active bleeding, d) symptoms of anemia. In the absence of these criteria, transfusion was categorized as not justified. Descriptive analytic tools were used for data analysis.
Results/Finding: A total of 150 cases were analyzed with a median age of 55 years (range 20‐101), M:F ratio of 1.1. Twenty one percent (31/150) of patients had no symptoms of anemia or evidence of bleeding. In this group, 22/31 patients had Hgb level 6.5 ‐7g/dL, 8/31 had 6‐6.5 and 1 patient below 6 g/dL. Sixteen (of 31) patients had cardiac disease. Based on this retrospective review, in 10% (15/150) of cases, transfusion decisions were made only because the provider was alerted of the Hgb critical value. An average of 1.5 RBC units was transfused to these 15 patients and no transfusion reactions were reported.
Conclusion: Our study shows a 10% overutilization of RBC transfusion due to critical value notification at the 7 g/dL Hgb level. Lowering the critical value below transfusion threshold to 6.5 g/dL (based on literature review) will reduce over‐transfusion in our institution.
TABLE 1 Clinical Characteristics
| Patients with no evidence of active bleed and no signs of anemia | 21% (31/150) |
|---|---|
| Transfusion based solely on Hgb level | 10% (15/150) |
| Hgb Levels: | |
| 7.0 ‐ 6.5 g/dL | 22 |
| 6.4 – 6.0 g/dL | 8 |
| <6.0 g/dL | 1 |
QT7
Stop in the Name of Patient Safety
Arline Stein*1, Linda Benison1, Nancy Nikolis1, Lennart Logdberg1, Alexander Indrikovs2, Vishesh Chhibber1 and Sherry Shariatmadar1
1North Shore University Hospital, 2Northwell Health
Background/Case Studies: Our hospital‐based blood bank is a high volume laboratory that processes approximately 60,000 specimens per year. Blood bank specimens are unacceptable when they are unlabeled, unsigned or missing necessary patient identifiers and documentation. In such cases, a new specimen is requested to be drawn as per protocol. In an attempt to decrease the number of unacceptable specimens, an immediate notification of a Nurse Manager (NM) and a prompt debrief process with staff was initiated in June 2016. To further decrease the number of unacceptable specimens we implemented an additional Quality Improvement process.
Study Design/Method: In April 2017, a new patient safety initiative was established and rolled‐out facility wide. It was a multidisciplinary effort, including Nursing Education, Hospital Quality and Laboratory Medicine. It included an awareness campaign of “Be Mindful” when drawing patient's specimens. “Be Mindful” and “Accurate Patient ID begins with ME” were two of the slogans used. These were printed on tee‐shirts worn by project champions and the blood bank also redesigned its specimen requisition form to reflect this initiative. The new requisition form now includes reminders of important steps in the patient identification (ID) and specimen collection process. A stop sign is used as an anchor on the form, along with the slogans and instructions that include prompts to: bring all labels and requisition form to the patient's bedside, minimize disruptions (i.e. close the curtain), check patient identifiers with documents, label tubes at bedside, two staff remaining in patient room until procedure is complete and two signature‐ independent patient ID.
Results/Finding: The chart below represents the % of unacceptable specimens and the average monthly unacceptable specimens identified by the Blood Bank. The 2016 and 2017‐First half (H1) data is prior to and 2017‐Second half (H2) and 2018 first quarter (Q1) is post‐initiative.
(QT7)
| Year | Unacceptable Specimens (%) | Monthly Unacceptable Specimens (mean) | |
|---|---|---|---|
| Pre‐Patient ID initiative | 2016 | 0.83% | 40 |
| 2017‐H1 | 0.66% | 36 | |
| Post‐Patient D initiative | 2017‐H2 | 0.38% | 21 |
| 2018 Q1 | 0.35% | 19 |
Upon reviewing the unacceptable specimens since January 2016, the implementation of this new initiative has led to a 46% decrease in the average number of unacceptable specimens per month since the kick‐off in April 2017.
Conclusion: The “Be Mindful” initiative and its awareness campaign has led to a significant decrease in the number of unacceptable specimens identified by the blood bank. Having the steps mapped out as reminders of the policies related to specimen collection, patient ID and the heightened awareness of correct patient specimen labeling can only further improve patient safety and the patient experience.
QT8
The Successful Role of a Suggestion Box as Part of the Transfusion Service Quality System: A 10 Year Retrospective
Nicholas Bandarenko*1, Roberta Arney2, Nancy Diaddezzio2, Mary Campbell2 and Jessica Poisson1
1Duke University Hospital, 2Duke University Medical Center
Background/Case Studies: The AABB Standard 1.5 Communication of Concerns was introduced in 2009 with the 26th edition of Standards for Blood Banks and Transfusion Services. To fulfill this requirement, a suggestion box was established to have a process for personnel to anonymously communicate concerns about quality or safety. The purpose of this retrospective study was to evaluate the effectiveness of the suggestion box in contributing to the quality system of a large academic hospital transfusion service.
Study Design/Method: A locked suggestion box located in the staff locker area allows personnel to privately enter comments. The medical director (MD) informed staff to provide anonymous concerns and recommendations about quality or safety. Access to the suggestion box is limited to the MD to ensure a mechanism for feedback that could involve senior peers or managers. All submitted suggestions are acknowledged as received by email on a weekly basis. Submissions are distributed to an accountable member of the executive management team and discussed at a monthly Executive Management Quality Meeting to determine actions. Implemented changes are communicated to staff in monthly meetings with MD, and staff is engaged to work out options for optimal resolution such as work flow changes and equipment selection. A retrospective review of all submissions since 2009 was performed. Each was categorized based on the Quality System Essentials (QSEs) used by AABB Standards. Items that did not align with a QSE were categorized as Work Culture. The percent resulting in a change was calculated overall and by category.
Results/Finding: A total of 150 suggestions were received. Ten were not valid quality or safety concerns. There were 113 categorized by QSE, summarized in Table 1. There were 8 recurrences of 2 items (not included in Table 1 data): one concerned IBST bar code scanners and the other cross coverage scheduling. There were 19 items classified as Work Culture, which included employee recognition, holiday staffing, and recycling suggestions. The primary reasons an entry did not result in change included cost, a pre‐existing alternate solution, or suggestions referred to a supplier or customer.
(QT8)
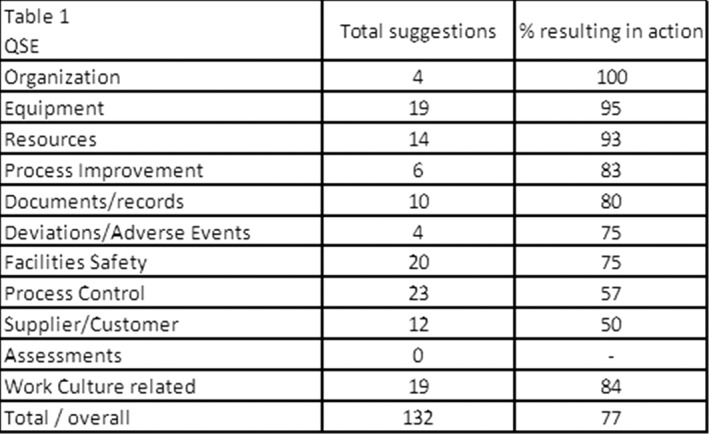
Conclusion: The added suggestion box has become a productive component of the facility's quality system providing feedback across most QSEs. Overall, 77% of suggestions resulted in a meaningful change or addition including work culture enhancements. The findings indicate success of the suggestion box and employee engagement in continuous quality improvement.
QT9
Utilizing Box Plots to Monitor and Investigate Quality Control Results for Multiple Blood Salvage Devices
Chelsea Conn*, Pamela M. Johnson, Camille Van Buskirk and Paula Santrach
Mayo Clinic
Background/Case Studies: An integral component of a perioperative quality program is consistently monitoring routine quality control results for salvaged blood processing devices. Each institution defines quality control (QC) parameters and a schedule for performing QC. Between two hospitals, twenty‐two salvage devices are tested monthly for hematocrit (hct) and residual heparin (hep) by the Autotransfusion (AT) team which evaluates RBC concentration and washout performance. Prior to 2017, only out‐of‐range results per total number of tests were reported as a quality indicator. AT recognized that this method did not capture specific salvage device performance. The purpose of this study was use Six Sigma box plots to monitor the variability of QC results and evaluate the performance of each salvage device on a quarterly basis for one year (2017).
Study Design/Method: A box plot template for hct and hep was developed for each blood salvage device. QC results were input each month as testing was performed. Each box plot included the following QC results: mean, median, 1st quartile, 3rd quartile and minimum/maximum outliers. A threshold line was added to the hct chart indicating results ≥ 40% met acceptance criteria as determined by AT. A threshold line was added to the hep chart indicating results ≤ 0.30 u/mL met acceptance criteria. Each quarter, all box plots were reviewed with the prior quarter results to track and trend the performance of each device.
Results/Finding: Quarterly data showed that all 22 devices produced a mean QC result that met acceptance criteria. All identified outliers that did not meet acceptance criteria were investigated and QC was repeated with acceptable results. When reviewing each quarter at the end of 2017, AT identified two salvage devices box plots with significantly wider quartiles that the other devices. As a result of this review, the two devices were removed from service due to the wide variability of QC results.
Conclusion: Utilizing box plots to monitor QC results are effective when managing multiple pieces of equipment at multiple locations. Displaying acceptable and unacceptable results in this manner creates an accurate picture of how multiple salvage devices are performing over time.
QT10
Using Lean/Six Sigma Methodology to Decrease Error Rate and Cost of Quality
Alexandrea Woods*
Mississippi Valley Regional Blood Center
Background/Case Studies: The inventory management department (IMD) of a blood center that distributes roughly 170,000 units annually found that the six distribution hubs were not standardized in their operations. The department's quality error investigations increased by 154 percent in just two years costing the department an estimated $20,000 in labor. In 2015, after identifying this trend, the department began investigating the use of Lean/Six Sigma methodologies to define process based on value added steps with the outcome of decreased errors and quality.
Study Design/Method: IMD identified increased process investigations resulting in a high potential for loss of product and revenue. IMD implemented Lean/Six Sigma methodology to reevaluate procedures and find the defects in processes. To begin representatives from the blood center's six distribution hubs mapped out how processes were completed currently. IMD utilized the quality improvement tools published in Tool Time for Healthcare by Langford International, INC. The team began with a System Analysis to identify all processes and how their defects were impacting customers. Upon conclusion of the discovery workshop it was found all six hubs were not operating in the same manner. Slight variances in process were creating opportunities for error. The team used a Process Benchmarking tool to identify where the distribution hubs were operating differently. Upon completion of this activity it was determined that the standard operating procedures needed to be updated to include specific steps and to eliminate over documentation.
Results/Finding: Seventeen of the distribution departments standard operating procedures were rewritten to be more inclusive of all hubs and to include more definitive directions for processes the team identified were not being executed the same across the organization. As a result, the department saw a decrease in product quality investigations of almost 45% in just two years – a total cost savings of nearly $2,700
(QT10)
| Year | Product Quality Investigation (PQI) Count | Percent Change from Previous Year | Percent Change from Year 2012 | Estimated Hours Dedicated/PQI | Estimated Cost to Close | Cost Difference from Previous Year |
|---|---|---|---|---|---|---|
| 2012 | 86 | x | x | 1.5 | $2,580 | x |
| 2013 | 160 | 86.05 | 86.05 | 1.5 | $4,800 | $2,220 |
| 2014 | 172 | 7.50 | 100.00 | 1.5 | $5,160 | $360 |
| 2015 | 218 | 26.74 | 153.49 | 1.5 | $6,540 | $1,380 |
| 2016 | 197 | ‐9.63 | 129.07 | 1.5 | $5,910 | ‐$630 |
| 2017 | 127 | ‐35.53 | 47.67 | 1.5 | $3,810 | ‐$2,100 |
| Total: | $28,800 |
Conclusion: The Inventory management department is dedicated to a continuous improvement plan and is motivated by the positive results seen over the 2016 and 2017 calendar years. The distribution department plans to continue evaluating procedure based on the Lean/Six Sigma methodology.
QT11
Frequency and Causes for Standard Operating Procedure Deviations ‐ a 10 Year Review
Linda Mamone*, Amna Iftikhar, Edward J. Yoon and Mohamed Alsammak
Temple University Hospital
Background/Case Studies: Standard operating procedures (SOP) are critical in standardizing laboratory testing and results. In the blood bank, per AABB standards, any exceptions to policies, processes or procedures must be warranted by clinical situations and require justification and pre‐approval by the medical director. These are generally uncommon events, and individually may not raise concern for systemic and actionable issues. In order to better understand the incidence and context of such deviations, identify potential areas for improvement and education, and as a component of ongoing quality assurance and control (QA/QC), we sought to review our institution's prior occurrences of SOP deviations.
Study Design/Method: This retrospective study was undertaken to review and categorize documented reasons for SOP deviations at our institution. All occurrences during a 10 year period from the years 2007 to 2017 were reviewed and analyzed.
Results/Finding: For the 10 year study period, only 48 SOP deviations were identified (average of 4.8 deviations per year). Documented reasons for each deviation were categorized and all occurrences were tabulated as shown in Table 1. Issues surrounding specimen labeling/accessioning were the greatest aggregate cause (23/48; 48%). However, the second single cause of deviations resulted from extending the validity of pre‐admission testing specimens and issues with pre‐admission testing forms (15/48; 31%). Thus, the great majority of deviations are related to only 2 SOPs.
TABLE 1
| SOP Deviation Categories | Occurrences |
|---|---|
| Specimen labeling | 23 |
| Pre‐admission testing specimens and forms | 15 |
| Issue of RhIg with expired specimen | 5 |
| Use of expired reagents | 2 |
| Two specimens drawn simultaneously | 1 |
| RBC unit not screened for necessary antigen | 1 |
| Use of monitored non‐blood bank freezer for temporary storage of plasma | 1 |
| Total | 48 |
Conclusion: Considering the number of activities defined by any blood bank SOPs, deviations are very rare. Retrospective review such as this uncovered several key categories as definite areas for targeted improvement. These patterns may have remained largely unnoticed without a long‐term retrospective review. Hence, periodic review of the frequency and reasons for deviation as a quality monitor provides opportunities for SOP improvement and/or refinement, and staff education.
QT12
Using Lean Techniques to Improve a Rare Process: Suspected Salvaged Blood Reactions
Nicole B. Miller*, Margaret A. McGill‐Zimny, Chelsea Conn, Adam Knutson, Pamela M. Johnson, Camille Van Buskirk and Paula Santrach
Mayo Clinic
Background/Case Studies: On a rare occasion, symptoms of hypotension leading to a transfusion reaction (TR) occur after receiving salvaged autologous blood in the OR. The Autotransfusion (AT) team has a process to investigate possible reasons for these reactions. Due to the infrequency of TR workups, the procedure (SOP) lacked organization and continuous work flow, which hindered the confidence of AT staff. During biennial SOP review, AT recognized the rarely used process had not been revised in five years. In early 2016, AT applied LEAN tools to improve the process and increase efficiency.
Study Design/Method: Three trainers applied the LEAN technique 5S over 12 months: Sort, Set in Order, Shine, Standardize and Sustain. The 5S framework eliminated obsolete and excessive documentation in the SOP. AT improved the location and number of supplies needed to complete a workup. An educational tool was created and practiced with the team assisted by trainers. The revised SOP was implemented and competency assessment was performed with 12 employees. Events were monitored before and after changes were implemented. A survey was presented to the same 12 employees to measure satisfaction with the revisions.
Results/Finding: The new steps were practiced in a wet lab with employees to garner opinions and comfort levels. During the practice scenarios, the trainers gathered questions from the team and included those in a training module for future employees. The SOP was written in a recipe format with action steps. As a result, three pages of steps were eliminated from the SOP. Time to perform the process dropped from four hours to two hours after several timings were measured. Pre‐ made TR kits were eliminated which reduced waste. Supplies were kept in an organized location for accessibility. Competency assessment was 100% passing for 12/12 employees. From 2013‐2016, five events were related to missed steps in the process. After implementation of the new SOP, zero events were reported. A satisfaction survey showed that prior to implementation on a scale of 1‐10 (10 being highest); the average employee's comfort level was four. After the revised process took effect, the employees rated the changes as seven on the same scale.
Conclusion: Utilizing 5S techniques reduced waste, decreased time needed to complete the work up of the intraoperative TR and increased staff comfort level with the new process. With zero events reported after implementation, the new SOP was recognized to be more streamlined, resulting in increased competency. Gauging the employees’ comfort level was an important factor in determining how to change the process to increase accuracy and confidence levels among staff.
QT13
Implementation of Barcode Scanners in the Emergency Department for Charting Transfusions
Lisa M. Button*1, Valerie Wynne Halling2, Renee Ean1, Karen Koch1, Carol R. Immermann1, James R. Stubbs1 and Camille Van Buskirk1
1Mayo Clinic, 2Mayo Clinic‐Rochester
Background/Case Studies: In 2013, a large teaching hospital identified the need to improve compliance with AABB standards and CAP checklist items related to transfusion documentation in the Electronic Medical Record (EMR). The group set out with the goal to decrease the number of transfusion documentation nonconformances (TDN) for patients transfused in the Emergency Department (ED) in the current charting system which included manual entry of unit number and product code. The baseline TDN rate showed that 59.6% of patients, prior to intervention, had at least one incorrect or incomplete portion of their transfusion record. After education and role definition for nurses that perform transfusions, the TDN rate was lowered to 14.7% of patients being impacted the end of 2014. The interdisciplinary group of nurses, Transfusion Medicine personnel, and process engineers continued to meet and determined that an option to scan the blood's ISBT barcodes into the EMR, rather than manually typing the information into the EMR, should be developed. Additionally, the scope of the project included the Trauma Center which was recording all transfusion information from a trauma visit by hand on a paper document and the form was later scanned into the patient's EMR.
Study Design/Method: The ED EMR programmer created fields that would accept data entry via barcode scanner for transfusion charting with the intention that both ED patients and Trauma Center patients would have transfusions charted in this manner. The barcode scanners in the ED and on the transfusion nurses’ (IVTX) mobile computer carts were configured to read ISBT barcode labels. These scanners were tested while the nurses practiced scanning training units into the validation environment of the EMR. The scanners went into use in 2nd quarter 2015. Two nursing work units transfuse blood in the ED (ED nurses and IVTX), and both work units’ compliance with transfusion documentation was tracked.
Results/Finding: Data for 1st quarter 2015, prior to implementation of transfusion charting via scanning, was compared to the first quarter after implementation and the following information was observed:
(QT13)
| Transfusion Documentation Pre‐Project | Transfusion Documentation Post‐Project | |||||
|---|---|---|---|---|---|---|
| ED Nurses | IVTX Nurses | Cumulative | ED Nurses | IVTX Nurses | Cumulative | |
| Total # of Units Transfused (units) | 10 | 40 | 50 | 8 | 54 | 63 |
| Total # Charting Errors (units) | 0 | 2 | 2 | 7 | 2 | 9 |
| Total Patients Transfused | 4 | 13 | 17 | 6 | 13 | 17 |
| Total Patients Impacted | 0 | 1 | 1 | 3 | 3 | 5 (one patient transfused by both ED and IVTX) |
Initially, TDN increased with scanning the unit number and product code in the EMR from Q1 2015 was 5.9% (1/17) to 29.4% (5/17) in Q2 2015. The main source of the TDN in Q2 2015 was that the units were transfused but not charted.
Conclusion: The interdisciplinary group continued to monitor TDN in the ED over the next two years. The number of patients impacted each quarter by TDN decreased. Eventually, the number of patients impacted per quarter was ≤1 and tracking stopped in May 2017 because the process was determined to be in control. Initial challenges with charting transfusions in the EMR using a scanner included ensuring that all units were documented which was addressed through additional education and practice. Another source of error emerged, where the scanner would randomly drop a digit of the unit number or product code. IT resources were able to address the root of this source of error, and the TDN rate remains lower than it was prior to scanner implementation.
QT14
Validity of a Hematology Analyzer for Screening Residual White Blood Cell Content in Platelets
Linda S. Barnes*1, Don Eby2 and Rebecca Haley1
1Bloodworks Northwest, 2Bloodworks
Background/Case Studies: Per FDA Guidelines, leukocyte‐reduced (LR) components must contain fewer than 5X10E6 residual WBC. Methods to determine residual WBC (rWBC) content in platelet components include manual counting (Nageotte) and flow‐cytometry. These methods are time‐consuming and expensive. We sought to determine validity of using a hematology analyzer for screening rWBC content.
Study Design/Method: Samples from single donor platelets and whole blood platelet concentrates CBC were tested within 24 hours of collection using a hematology analyzer (Sysmex© XE‐2100/XE‐21D). Values of 0.02X10E3/µL or greater were considered positive. Confirmatory testing was performed using flow‐cytometry (Beckman Coulter© FC 500).
Results/Finding: The table summarizes the validity results for single donor platelets (SDP) and whole blood‐derived platelets (PSPP or WBPC).
(QT14)
| Single Donor Platelets (N=1972) | Pre‐Storage Pooled Platelets (N=1931) | Single Whole Blood Platelets (N=449) | ||
|---|---|---|---|---|
| Positive by CBC | True positive | 3 | 3 | 3 |
| False negative | 0 | 0 | 0 | |
| Negative By CBC | False positive | 4 | 60 | 298 |
| True negative | 1965 | 1868 | 148 | |
| Sensitivity | 100.00% | 100.00% | 100.00% | |
| Specificity | 99.80% | 96.89% | 33.18% | |
| Positive predictive value | 42.86% | 4.76% | 1.00% | |
| Negative predictive value | 100.00% | 100.00% | 100.00% | |
Conclusion: The CBC does not have power of discrimination to produce an official count at WBC levels required to certify units as leuko‐reduced yet it is a rapid and reliable test method in higher ranges and is easy to use. We find that it is an effective tool for screening out apheresis platelets with rWBC content in excess of allowable limits. Screening PSPP and WBPC is less efficient due to the frequency of false positives. Future use of the CBC as a screening method for SDPs and part of a sequential quality control plan warrants consideration.
QT15
Performing a Failure Mode and Effect Analysis to Ensure the Safe Cryostorage of Your Hematopoietic Progenitor Cells
Wen Lu*, Brian Colcombe, Carol Dumont and Priscilla I. Figueroa
Cleveland Clinic
Background/Case Studies: Proper storage in vapor phase nitrogen freezers (VPNF) and liquid phase nitrogen freezers (LPNF) is essential for ensuring the quality of cryopreserved hematopoietic stem cell products. While our AABB and FACT accredited Progenitor Cell Processing lab has had no deficiencies or incidents with our cryostorage process, in response to a recent well‐publicized cryostorage failure, we wanted to determine if our products are truly as safe as we previously believed.
Study Design/Method: Operations, quality, and medical staff critically reviewed equipment, monitoring systems, processes, and procedures by performing a failure mode and effect analysis (FMEA), to determine where and how our cryostorage system could fail.
Results/Finding: VPNF and LPNF rely on proper vacuum insulation and lid seals to maintain LN2 levels and temperature. Proper function of the solenoid valve enables the VPNF to automatically fill with LN2. Current process controls to detect insulation, lid, or solenoid malfunctions include temperature, oxygen, and LN2 level monitoring. Redundant alarms and checks will detect freezer integrity failures, but not all manufacturer preventative maintenance recommendations intended to prevent failures e.g. biannual solenoid replacement, were being followed. Manual LN2 level measurement and manual filling is our back‐up to assure adequate LN2 levels during automation failures. In LPNF, accumulation of sludge and frost make manual LN2 level measurements difficult and could lead to failure to detect changes in LN2 consumption indicative of compromised freezer integrity. Our procedures did not include standard instructions for LN2 level measurement under these conditions. Our current process controls to ensure ample LN2 supply include standing LN2 orders, manifolds for connecting each freezer to multiple tanks, and monitoring LN2 tank levels. Critical reexamination of our on‐site disaster plan LN2 supply revealed that it did not have external access, and therefore was not readily available. Lastly, failure to respond to an alarm is an additional potential failure mode. We use an electronic monitoring system that will contact designated personnel until a response is obtained. In addition, our procedures clearly delineate the parties responsible for responding to the alarms. Only few select staff with enhanced security clearance may inhibit an alarm for longer than 15 minutes, therefore we are confident that alarms would trigger appropriate action.
Conclusion: This FMEA allowed us to conclude that our products are safely stored and that our risk of an unrecognized temperature excursion is well managed. Opportunities for improvement that would further enhance the safety of our products and provide additional peace of mind were successfully identified.
QT16
Quality Evaluation of Umbilical Cord Blood Cells in an AABB Accredited Cord Blood Bank in Hong Kong
wah Suet Ng*
HKSH
Background/Case Studies: The quality of the umbilical cord blood (UCB) after cryopreservation should be monitored continuously. It is ensured that the quality of thawed UCB is suitable for clinical transplantation. The objective of this retrospective study using fresh UCB and cryopreserved UCB quality control samples (QC vials) to assess the quality process in our cord blood bank.
Study Design/Method: A total of 123 UCB samples were collected between March 1998 and March 2013. The samples were processed and cryopreserved according to validated standard operating procedures (SOP). The total nucleated cell count and cell viability of QC vials were measured and recorded. The total nucleated cells (TNC) and cell viability were determined by and cell counter (Beckman Coulter) and manual counting method (Trypan blue) respectively. The final product (UCB with freezing medium containing 10% DMSO) were cryopreserved in the liquid phase of liquid nitrogen tank. The QC vials were then thawed for testing over different duration of cryopreservation (0.09‐18.2 years). According to our SOP, the acceptable criteria for the quality check point was determined as TNC recovery and cell viability of thawed UCB QC vial was >70%. The storage period of the cryopreserved UCB was further derived into five groups: Less than 3 years, 3‐5 years, 5‐8 years, 8‐12 years and more than 12 years. The Tukey's honest significance test was used to evaluate the effect of different time of storage on TNC recovery rate and thawed cell viability.
Results/Finding: The mean TNC recovery rate was 99.4% (70.5% to 136.1%), and the mean cell viability of thawed UCB QC was 88.7% (71.4% to 113.7%). The thawed TNC and cell viability was not affected by duration of storage (p value > 0.05). The quality of cryopreserved UCB was stable up to 18.2 years as all 123 QC vials were well within the predetermined acceptable criteria.
Conclusion: The objective data as generated from thawed QC vials demonstrated the stability of the stored UCB products over time. Thus, the processing and cryopreservation were well maintained in our cord blood bank. The prospective validation of the UCB products stability should be carried on to find out the longer storage duration of the cryopreserved UCB in the liquid phase liquid nitrogen tank.
QT17
Audit of Antibody Screen and Crossmatch Ordering Practices at a Large Urban Academic Medical Center
Robert D. Rivera*1, Erica Carpenter1,2, Christine Naczek1,2, Jerome Gottschall1,3, Angela Treml1,3 and Matthew S. Karafin1,3
1Medical College of Wisconsin, 2Wisconsin Diagnostic Laboratories, 3BloodCenter of Wisconsin
Background/Case Studies: In healthcare, it is imperative to provide optimal care without wasting resources. A crossmatch that is not followed by an RBC transfusion (Tx) within 72 hours represents a potential area for resource optimization. Concurrently, antibody screens that are unexpectedly converted to a Tx request may result in potentially avoidable delays in patient care. To assess these issues at our own institution, we performed an audit of antibody screen and crossmatch orders, and determined whether they were followed by a Tx within 72 hours.
Study Design/Method: All antibody screen and crossmatch orders for which samples were received at our institution's blood bank were reviewed over a one month period. The department (dpt.) of each ordering provider was obtained via the electronic record, and the Tx record for each patient corresponding to an order was referenced to determine if the patient had received a Tx within 72 hours of a screen or crossmatch order. An efficiency ratio (EFR) was calculated by dividing either the number of crossmatch orders by the number of Tx events that resulted from the orders, or the number of antibody screen orders by the number of non‐Tx events that followed the orders. A ratio of 1 was considered optimal.
Results/Finding: A total of 1139 crossmatch orders and 933 antibody screens were evaluated. 323 (28.4%) crossmatch orders did not result in Tx within 72 hours (EFR: 1.39), and 144 (15.4%) antibody screen orders were followed by a Tx order (EFR: 1.2). Order efficiency differed by department: Emergency Medicine (EM) had the worst EFR for crossmatch orders, while Internal Medicine (IM) had the worst EFR for antibody screen orders (Table 1).
Conclusion: In our audit, crossmatch orders that did not lead to Tx were more common than antibody screen orders that were followed by an unplanned Tx, suggesting that the former might be a more significant issue for focused quality improvement. Not all departments require intervention, as OB/GYN and Heme/Onc dpt. providers demonstrated highly efficient ordering practices. Future work will include evaluation of non‐patient factors in the EM and Surgery dpts., such as protocols or standard order sets, which may be contributing to the relatively inefficient screen and crossmatch ordering practices observed.
TABLE 1 (QT17) Departmental distribution and Tx outcomes of crossmatch and type/screen orders
| Crossmatch Orders | Type/Screen Orders | |||
|---|---|---|---|---|
| Tx (%) No Tx (%) | EFR | Tx (%) No Tx (%) | EFR | |
| EM | 85 (47.5) 94 (52.5) | 2.1 | 57 (31.7) 123 (68.3) | 1.5 |
| Heme/Onc | 352 (97.0) 11 (3.0) | 1.0 | 12 (27.9) 31 (72.1) | 1.4 |
| IM | 140 (72.9) 52 (27.1) | 1.4 | 28 (36.4) 49 (63.6) | 1.6 |
| OB/GYN | 21 (80.8) 5 (19.2) | 1.2 | 4 (1.8) 213 (98.2) | 1.0 |
| Surgery | 216 (57.3) 161 (42.7) | 1.7 | 43 (10.4) 372 (89.6) | 1.1 |
| Overall | 814 (71.6) 323 (28.4) | 1.4 | 144 (16.0) 788 (84.0) | 1.2 |
QT18
Validating Legacy Donor Data in a New Information System
Terri Coyle*, Kristie Clymer, Erik Scott and James R. Stubbs
Mayo Clinic
Background/Case Studies: Our facility recently implemented a new blood donor computer system for collections and manufacturing. Validation of converted data from a donor legacy system (LS) into a new system (NS) is recommended in the FDA Guidance for Industry, Blood Establishment Computer System Validation in the User's Facility (April 2013). Our team developed a conversion and validation plan and these were executed using Dream Coder, Excel Power Query (PQ), and screen print comparisons. Our conversion plan included a risk assessment of software tables and donor data (DD) elements to establish the number of screen prints to verify data from the LS to the NS. Dream Coder was used to populate information that converted the data from the LS to the NS using vendor provided conversion files.
Study Design/Method: Sixty‐four tables were provided for the table conversion process. Sixteen tables were not used for data conversion; those tables were not used in the LS. Forty‐eight tables were loaded into the validation environment, verified, and then copied into the production environment. PQs were developed using the LS and NS databases, taking into account the conversion of data elements from the LS to the NS. PQ was used to ensure that DD coming from the LS matched when migrated into the NS. Forty‐seven PQs were used to compare DD in each database. Each PQ consisted of LS, NS and merged queries. Merged queries filtered out matching records, identifying only discrepant data between the two systems. Screen prints were reviewed to confirm that the converted DD populated into the correct fields in the NS. LS data was migrated about once per week into the NS and any rejected files or PQ issues were reviewed with our Information Technology group to resolve data migration issues. These files were reviewed with the vendor when we could not resolve the issues. When determined that a data migration script needed to be changed, the vendor adjusted the import script and DD was migrated again.
Results/Finding:
Six import scripts needed correction
After the final DD migration there were three rejected files from three different import scripts
PQ identified two additional DD discrepancies
Conclusion: With a decade's worth of DD to move, ensuring that data was correctly converted was required when deploying a new computer system. After performing the data extraction and migration multiple times, and reviewing the data with PQ, we were able to identify data elements that had not transferred correctly and correct the import scripts. All discrepancies were resolved prior to go live. In the end, we were confident that our DD was accurately converted and migrated allowing for a high degree of certainty that we will continue to provide the safest blood for our patients and protect our valuable blood donors.
QT19
Verification of the Performance of Platelet‐Harvesting in Automatic Separators for Single Units
Rocío Magdalena Hernández*1, Leonardo A. Ibarra1, Cinthya S. Martínez1, Madai Vázquez1 and Hector A. Baptista1,2
1Medica Sur Clinic Foundation, 2National Institute of Perinatology
Background/Case Studies: The number of platelets obtained by apheresis depends on the type of cell separator and the characteristics of the donor. The FDA notes that each product obtained need to be validated separately to ensure the desired therapeutic dose of platelets. To comply with the quality control requirement, it is necessary to quantify the amount or harvest of platelets obtained during the apheresis procedure.
Objectives: Verify compliance between the scheduled platelets‐harvest and obtained in AMICUS cell separator.
Study Design/Method: Two devices of the AMICUS separation system were evaluated; (SA1) and (SA2). Prior to verification, the technical support service made the adjustment in each separator on Platelet Yield Adjuster (PYA). The effect of this adjustment was assessed verifying the performance of separators AMICUS simple scheduled harvests 3.5 × 10¹¹, the correlation between platelet programmed in cell‐separator and the platelet‐harvest obtained through quality control is verified, based on the criteria established by the manufacturer (expected bias ≤ 10%), which was carried out through the statistical analysis of an established protocol (CLSI Document EP09‐A2) The platelet count for quality control was carried out using a cell‐counter under analytical control by ISO 15189:2012 accreditation. The regulatory requirement in Mexico to harvest platelets of a single product is 2.0 × 10¹¹ platelets/unit in 100% of the units tested, so we decided to make the comparison with the most demanding requirement (AABB, 3.0 × 10¹¹ Platelets/unit in 90% of the units tested). We evaluated the distribution in SA1 and SA2 of platelet‐harvests obtained, the average bias and the percentage of non‐compliance with the requirement established against the obtained account.
Results/Finding: We performed 480 single procedures; 283 of them in SA1 and 197 procedures in SA2. The average values in the harvest from platelets were 3.65 × 10¹¹ and 4.05 × 10¹¹ for SA1 and SA2 respectively. The minimum values were 2.13 and 2.55 × 10¹¹ and maximums of 5.58 and 5.71 × 10¹¹. The average bias was 0.15 and 0.55 × 10¹¹ for each separator; while the kurtosis value was 0.96 and 0.50. The value of the total bias of the process according to the EP09 protocol was 4.24 and 15.83% for SA1 and SA2. The fulfillment of the comparison between the scheduled harvest and the harvest obtained measured in the cell counter was 65.37% and 88.8% of the processes performed for each separator. The fulfillment of the criteria established by AABB for the platelet harvest (3.0 × 10¹¹) occurred in 93.99% and 97.46% of the processes analyzed for each separator.
Conclusion: The data showed a wide variability between the programmed platelet harvests and those obtained with the compliance of 65.3 and 88.8%. Although other confusing variables related to the donor are not analyzed, the differences could be related to the platelet collection system itself, as well as the fact that the apheresis systems only estimate the platelets collected, while measuring of platelet obtained is carried out in a cell‐counter device under analytical control. This would explain the non‐normal distribution data obtained in both separators, which would question the use of the EP09 protocol, employed for quantitative tests. However, both separators meet the requirement established by the AABB at 93.99% and 97.46% respectively, which validates the performance of the device in single platelet harvests.
QT20
ABO/Rh Testing Events after Gel Testing Methodology Implementation
Stacy Coleman*, Janet Dornfeld, Amy Mata and Camille Van Buskirk
Mayo Clinic
Background/Case Studies: In October of 2017, a large, hospital‐based transfusion laboratory switched manual testing methodologies. The laboratory had been doing tube testing for the previous 10 years. In preparation to change automated platforms, the decision was made to convert manual testing first to gel. It was thought that with a more standardized and stabile testing platform, testing errors would decrease. However, that was not the case, in particular with manual ABO/Rh testing.
Study Design/Method: A control chart is maintained to display events on each of the tests that are performed in the laboratory. These include ABO/Rh, antibody screen, direct antiglobulin test, antibody identification, and antigen typing. The control chart is set up with an upper warning limit of 2 SD and an out of control limit of 3 SD. When the upper warning limit is reached, that indicates that an in‐depth review of those events needs to be done. In October of 2017, this limit was reached for the ABO/Rh test and an analysis of events was performed.
Results/Finding: Comparison of the number of events that occurred in October 2016 to that of October 2017, doubled from 3.36 to 7.87 per 10,000 ABO/Rh tests. Upon investigation, half of these events were pre gel implementation and half were post. However, looking closer at the post implementation events, they impacted twice the number of patients because each involved two patients. In comparing the pre and post events, the pre implementation events ranged from forgetting to add Anti‐D, to missing mixed field, to problems with testing equipment, all of which would be solved with gel technology. The post implementation events occurred when technologists were performing ABO/Rhs on multiple patients and the cards were interchanged when reading and entering reactions in the Laboratory Information System. Labeling cards was left to tech preference, but at minimum, needed two patient identifiers. Techs were trained to verify the specimen label prior to result entry, using the same process as pre implementation, but there was no special emphasis given to techs to verify the gel cards as well. Of the three post implementation events, two were identified by the testing tech after entering the results. The third was caught due to a mismatch on the automated instrument.
Conclusion: While switching to gel testing eliminated a range of defects, it created a new one that was rarely seen in tube testing. Because of the uptick of this specific type of event, the lab standardized how techs labelled their gel cards. It is now required that the cards be labeled with at minimum the patient's initials and full medical record number. In addition, techs are required to open the result grids from the card rather than from the sample. If a card is set down for any reason, card must be re‐verified prior to resulting. Since this standardization was implemented, no similar events have occurred at the time of this publication.
QT21
Process Improvement to Ensure Rh Immune Globulin (RhIg) Prophylaxis for Postpartum Rh‐Negative Women
Jennifer S. Woo*, Rosaline Ma, Elizabet Lomeli, Amy DeCourten, Jennifer Martinez, Ashok Nambiar and Morvarid Moayeri
UCSF Health
Background/Case Studies: Processes to ensure the administration of prophylactic Rh immune globulin (RhIg) are important for the management of Rh‐negative women and compliance with AABB Standards. Determination of postpartum RhIg prophylaxis can be particularly challenging as this entails testing on both mother and baby, the results of which are evaluated together for clinical decision making, including reflex testing for additional laboratory studies. Any missing tests or deviation from testing procedures can result in failure to provide appropriate and adequate doses of RhIg.
Study Design/Method: We examined errors and deviations related to post‐partum immunohematology testing and RhIg prophylaxis at our hospital. Errors arising from the provider side included failure to use electronic order sets resulting in omission of fetal bleed screen tests or RhIG orders. Blood Bank errors included failure to perform reflex testing, such as weak D testing on Rh‐negative cord blood, or Kleihauer‐Betke assay for positive or invalid fetal bleed screens. Other errors included performing weak D when not indicated (Rh‐negative baby born to Rh‐positive mother), reporting Rh‐negative/Weak D‐positive baby's type as Rh‐positive, or reporting invalid positive weak D results. We initially generated a daily laboratory information system report to retrospectively audit and identify cases in which weak D testing had been missed. Subsequently, in order to prevent missed weak D testing and also address additional failure points in our system, we designed and implemented a “cord blood worksheet”. Technologists complete this worksheet for each cord blood test, using an algorithmic checklist approach to perform and complete all required tests on samples from the baby and mother. The worksheet also captures documentation related to the timely ordering (by provider) and issue of RhIg from the blood bank.
Results/Finding: Since implementation of the cord blood worksheet, we have not noted any errors related to blood bank testing or appropriate administration of postpartum RhIg prophylaxis. Worksheets have made our workflow safer and helped ensure our facility's compliance with AABB Standards. The cord blood worksheet also serves as a valuable educational tool for trainees in our graduate medical education programs.
Conclusion: Utilization of cord blood worksheets is a simple yet effective way to guide accurate immunohematology testing, prompt providers to place appropriate orders for postpartum RhIg prophylaxis, and ensure that RhIg has been issued from the blood bank in a timely manner.
QT22
Achieving an Operational Excellence Culture: It's All about the People
Jason Siebert*, Mark Malone and Rafael A. Portela
Blood Systems, Inc.
Background/Case Studies: The Operational Excellence (OE) applications have far reaching benefits for an organization to include reducing significant waste, empowering staff to become problem solvers, and cost savings. Despite the many benefits of OE, the initial struggles and roadblocks with incorporating Operational Excellence (OE) in the existing business culture requires effective strategic planning. In this study, we will explore the strategies used to successfully incorporate Operational Excellence in the business culture.
Study Design/Method: An OE Steering Committee was formulated with members from various functional departments. We developed and evaluated metrics to track Gemba Walks and OE Huddle effectiveness to ascertain if OE was successful deployed throughout the organization. These metrics had targets and were tracked weekly to determine what the gaps were and how to overcome them.
Results/Finding: After initial training, the participation from management was low as only 71% of the functional departments reported doing any Gemba Walks in a given month. In addition, only 48% of managers were performing the required number of Gemba Walks (4 per month).
The OE huddle Pre‐Assessment Score for OE huddle effectiveness was 68 % and a post assessment score of 85%. This was contributed by lack of staff participation, roadblocks not discussed and key business metrics not displayed during the huddles.
After a year into OE, significant improvements were made. 100% of functional departments reported doing Gemba Walks and 73% of Managers are performing the required 4 Gemba walks per month. In addition, the OE huddle Pre‐Assessment score was 92% due to increase staff participation, more effective business metrics and the huddle groups began reviewing their roadblocks and respective countermeasures.
Conclusion: Participation was low in the beginning in various critical OE activities. Low participation was due to other business priorities and challenges forcing OE in the background. In addition, managers were not getting out of the office and observing where work was being performed, and some of those managers who were performing Gemba Walks did not understand the principles behind doing them. Finally, Natural Work Teams indicated they were not all trained and did not understand the basic principles on how to conduct OE huddles.
Over the course of a year, the business started to incorporate OE in their culture. The successes were contributed to more coaching, workshops and frequent reporting of metrics with encouragement for improvement and recognition for successes. Also, staff had a better understanding on how to apply OE to their workplace, which motivated them to start using problem solving tools such as PDSA.
QT23
Undesirable Impact of Implementation of Electronic Medical Records
Nikolina Dioufa*, Richard Morris, Amna Iftikhar, Edward J. Yoon and Mohamed Alsammak
Temple University Hospital
Background/Case Studies: Electronic Medical Records (EMR) and Computerized Physician Order Entry (CPOE) facilitating laboratory testing, medication and imaging orders has revolutionized healthcare across the country in the past decade. Advantages include a significant decrease in drug expenditure, improved efficiency in diagnostics, upgraded recording and reporting of billing services, and decreased billing errors. However, CPOE may also have an unexpected negative impact on laboratories, including the blood bank (BB), affecting test volumes, turn‐around time (TAT) and quality metrics. At our institution, ≥ 90% of STAT requests from the Emergency Department (ED) should be completed within 60 minutes. The average was 90%. After implementation of EMR, the average dropped significantly, mandating analysis to identify causes and possible solutions for improvement.
Study Design/Method: Retrospective review of 1) the number of STAT requests for type and screen (T/S) received from the ED prior to and after execution of EMR in 08/2016 and 2) a sample of ED patient records with STAT orders from 2 nonconsecutive months in 2017 assessing a) clinical justification of the patient's presenting complaint requiring STAT T/S and b) whether the patient was transfused.
Results/Finding: Before EMR, BB received a monthly average of 21.5 hand written STAT T/S orders from the ED. After execution of EMR, the average monthly STAT orders in 2017 increased to 432 with the target TAT met in 75.8 % of orders. We reviewed 186 (30.5%) non‐trauma patient records. Presenting complaints with justified STAT T/S account for 73% and include: Acute neurologic and cardiovascular symptoms, GI and OB/GYN bleeding, and anemia. Within this category, the majority (93%) of patients with anemia received transfusion, while 3.5‐37% of the others were transfused. The clinically unjustified group (27%) included patients with complaints of urologic pain, dermatologic symptoms, localized infection or intoxication – none of whom were transfused. Further investigation showed that the T/S orders from the ED are included by default in pre‐populated order sets, or are defaulted as STAT.
Conclusion: Although implementation of EMR with CPOE facilitates appropriate prioritization and efficient T/S orders, they do not come without pitfalls. Automation and preselected menu options may result in unnecessary requests and exponential increase in workload that could lead to errors, delayed results and issue of blood products, and disrupted quality programs. Close monitoring, education, and communication with clinical and IT teams while developing order sets, judicious use of default settings, and use of evidence‐based best practice alerts (BPAs) may help in early identification and mitigation of undesirable impacts of EMR implementation.
IT2
Smartphone App for Calculating Minimum Blood Volume Needed for Laboratory Testing
Ray Zhang*
Washington University School of Medicine
Background/Case Studies: Blood draws for laboratory testing can lead to iatrogenic anemia, which is a morbidity risk factor in the pediatric and critically ill populations. Calculating the minimum volume needed for tests requires laboratory assistance and is typically impractical for clinicians. The goal of this project was to develop a smartphone app for performing these calculations at the bedside to reduce the number of tubes and volume of blood drawn on at‐risk patients.
Study Design/Method: A smartphone app for iOS and Android devices was developed. The user inputs desired tests selected from our large academic medical center testing menu. The app outputs how many and which types of blood collection tubes are needed, as well as the minimum blood volume required within each tube. Instrument dead volume and hematocrit correction are taken into account. Tests which may be optimally performed from the same blood specimen are combined during calculation. A quick‐selection interface for the most frequently ordered tests is present.
Results/Finding: The app incorporates 168 tests and panels, encompassing 13 central laboratory instrument systems, 10 collection tube types and 5 specimen types. House staff and nurses in our pediatric intensive care unit (PICU) are integrating the app into their critical care workflow. Usage, user feedback, specimen collection patterns and patient outcomes are followed, to be reported. Preliminary feedback from both PICU and central laboratory use has been overwhelmingly positive.
Conclusion: The app, Tinyblood, greatly simplifies calculation of minimum blood volume needed for laboratory testing and has received overwhelmingly positively feedback. It is available free for iOS and Android.
LD1
Hitting a Home Run: Applying Leadership Skills to Successfully Implement a 2RBC Program
Daniel Harrison*1, Xiomara Fernandez2, Redley Daza1 and William T. Lewis1
1Blood Bank of Hawaii, 2University of Hawaii
Background/Case Studies: Only 7% of Hawaii's donors are Rh negative leading to shortages of Rh‐negative RBCs. While 2RBC collections have been widely used to increase the availability of universal RBCs, implementation of these programs has often been prolonged, difficult journeys with variable degrees of success. Effective use of leadership principles can avoid these project pitfalls. This study describes the successful launch of a 2RBC program using strategic phasing, team selection, and multidisciplinary collaborations to exceed productivity and right type mix (RTM) goals.
Study Design/Method: The 2RBC project was divided into 3 phases, validation, ramp‐up, and steady state growth, each with distinct priorities and approaches. The validation phase focused on quickly accumulating the required # of collections meeting quality parameters; therefore the approach included carefully selecting donors from a known pool of committed WB donors, staff technical training, vendor education and onsite support. The ramp‐up phase prioritized WB donor conversion. The approach relied on core team selection and training. Staff performance management, therefore, was based on conversions rather than total WB procedure or RTM goals. To foster collaboration and remove conflict of interest between recruitment and collections staff, both groups received credit for the collection regardless of procedure type. Steady state would prioritize both donor pool management and new donor conversion, with 2RBC procedure, net success, and RTM key performance indicators (KPIs). The core 2RBC collections team was selected from WB and apheresis pools, not only on the basis of technical skill, but also on positive attitude and the ability to communicate with, motivate and influence others, both donors and team members. The training, which included significant vendor support, encompassed technical aspects but also how to approach donors, how to handle a “no” response, and included role‐playing scenarios. Prior to the collection date, team members identified good candidates for 2RBC collections based on blood type and size, previewed eligibility, and notified every member of the collection staff. Every staff member making a touchpoint with the donor participated in their onsite conversion. Daily results were celebrated and obstacles were faced collaboratively.
Results/Finding: The validation was completed in half the time allotted. The table shows 2RBC units collected and % (O+/Rh‐). Collection goals were 67 during ramp‐up and 167 by steady state.
Conclusion: Strategic principles enabled successful execution of a 2RBC program, completion of validation and ramp up 7 months ahead of schedule. Building on these results, similar leadership skills can be applied throughout organizations to facilitate projects.
| Month | Units | Desired ABO/Rh | |
|---|---|---|---|
| # | % | ||
| Jan | 66 | 46 | 70 |
| Feb | 115 | 109 | 95 |
| Mar | 206 | 202 | 98 |
| Apr | 227 | 223 | 98 |
LD2
A Hospital Blood Donor Center's Experience with Implementing Team Huddles
Audrey E. Traun*, Kimberly J. Duffy, Mary M. Benike, James R. Stubbs and Justin D. Kreuter
Mayo Clinic
Background/Case Studies: Industries including blood donor centers have experienced challenges with disseminating information in a timely, effective manner while maintaining minimal disruption to operations. One solution to mitigate this communication issue is team huddles. Prior to the implementation of weekly huddles, monthly meetings were the primary means of communication. However, meeting attendance was low, blood collections were reduced, and staff survey results indicated that communication within the work unit needed improvement. The intent of the weekly huddle was to positively impact communication by reaching more staff with minimal disruption to the work flow, communicating and discussing updates and issues in a timely manner, and providing a forum for staff to bring forth concerns and ask questions.
Study Design/Method: Weekly huddles were implemented in late 2016. Two 5‐20 minute huddles are held each week in a central location within the work area, and blood collections are not reduced. Huddles follow a specific agenda template; covering updates to the donor appointment schedule, mobile schedule, training, equipment, procedures, and staff recognition. In addition, general updates and reminders are discussed and staff is encouraged to ask questions and bring forth concerns. In April 2018, a survey was sent to 55 current staff to gain insight into the perceived impacts of the weekly huddle as well as communication preferences. Attendance records from both monthly meetings and weekly huddles were also compared.
Results/Finding: The survey had a 45% response rate (n=25/55). Results showed the preferred communication method is e‐mail followed closely by the weekly huddle and individual face‐to‐face which tied as the second most‐favored communication method. The less‐favored communication methods included monthly meetings, signage/job aids, and Office Communicator. Huddles have improved communication within the work unit according to 84% of survey respondents; with 92% indicating that information shared at the huddles keeps them up‐to‐date on changes occurring within the work unit. Additionally, 92% agree that the huddles provide a venue to bring forth concerns and ask questions. Overall, 88% of respondents feel that huddles are a worthwhile use of time. Staff attendance at the weekly huddle has shown a 19% increase over monthly meeting attendance.
Conclusion: The frequency and effectiveness of the huddle has improved communication as well as negated the need for the traditional monthly staff meeting. The focus of the monthly meetings will shift to educational opportunities. Recently, management staff attended an education event on team huddles and learned new tactics that will be incorporated into the huddle including a huddle board to display information, a dashboard to share relevant statistics, and scheduling more huddles throughout the week to reach more staff and further improve the timeliness of information delivery.
LD3
Planning and Implementation of a New Transfusion Service
Alexandra Budhai*, John T. Fallon and Patricia V. Adem
Westchester Medical Center
Background/Case Studies: Our organization has undergone dramatic changes in recent years, evolving from a single‐site tertiary‐quaternary care center with greater than 650 beds to becoming the headquarters for a 1,700 bed, multi‐site system. In keeping with the institutional push for unified processes to achieve better patient outcomes while conserving limited resources, we evaluated existing arrangements within the clinical laboratory. Blood products, pre‐transfusion testing, and medical/administrative oversight of transfusion services are currently provided by a regional blood center, a contractual arrangement that began many years ago when the facility was functioning as a small community hospital. The evolution of the medical center and the network necessitated the exploration, development, and implementation of insourced transfusion services, and we describe the processes involved.
Study Design/Method: We sought to develop and expand a global vision for insourced centralized transfusion services to serve patient needs at the main hospital and across the network. Gap analysis, project budgets, and Gantt charts were utilized to determine the minimum necessary requirements, associated expenses (one‐time and recurring), and timelines for deliverables.
Results/Finding: Gap analysis entailed an assessment of existing infrastructure, software systems, personnel, and laboratory equipment for adequacy in tandem with the regulatory, personnel, equipment, and infrastructure requirements necessary to safely support a high volume transfusion service. The items and steps necessary to bridge the gaps were cataloged and budgeted accordingly. The proposal showed favorable return on investment within five years and was approved by hospital administration. We developed Gantt charts to organize deliverables, coordinate task timelines, make an appraisal of appropriate windows for task completion, and to provide aid in formulating and evaluating deadlines for each respective task required. One year prior to go‐live, and continuing post go‐live we hold weekly meetings with formal minutes to ensure adherence to schedules and prompt attention to problems. Many aspects of the project moved in parallel, while some required a carefully choreographed serial approach, necessitating mapping of events in order to avoid pitfalls. The unforeseen hurdle: all hiring and procurement effort briefly stalled when administration was confronted with the possibility of significantly reduced financial allocations from the state.
Conclusion: With careful planning and research, the implementation of a new transfusion service could be achieved on a one year timeline. A timeframe of 18 months would enable adequate buffer to account for unforeseen funding and or regulatory impediments at the state or federal level.
MGT4
Platelet Availability and Economic Impact of Bacterial Risk Reduction Strategies at US Blood Centers
Elan Weiner*, Meredith Lummer and Vera Chrebtow
Cerus Corporation, Deployment
Background/Case Studies: Through draft guidance and BPAC, FDA has proposed methods for mitigating the risk of bacterial contamination in platelets. The extent to which these methods will impact platelet availability and production costs must be evaluated. Herein we attempted to categorize the production and financial impact associated with 8mL Bacterial Detection by culture (BD) per donation, 16mL delayed large volume culture per split unit (DLVC), 3.8% BD per donation as well as a combination of Pathogen Reduction (PR) for eligible donations and one of the aforementioned strategies for the remainder.
Study Design/Method: A model was built to assess production and economic impact of bacterial safety methods described in the background at a blood center (BC) and hospital. In this abstract only BC impact is discussed. 2 months of platelet collections data from one BC were analyzed to determine split rate (SR) and total resulting apheresis platelet components through each bacterial safety method. For each method, collections were optimized to ensure maximum platelet component production. The maximum % of units eligible for PR without impacting SR was also calculated. For each permutation, direct and indirect costs incurred through collection, component processing, testing and release were assessed. Static indirect costs (e.g. administration) were not included. Revenue was based on selling price of BD($460) or PR($595) components at BC, with applicable upcharge for CMV($35) or irradiation($40). Average direct costs associated with DLVC($45) and 3.8%($30) BD were added as upcharge.
Results/Finding:
(MGT4)
| 8mL | PR/8 mL | DLVC | PR/DLVC | 3.8% | PR/3.8% | |
|---|---|---|---|---|---|---|
| Avg. PR/BD hold time (hrs)a | 36 | 24/36 | 48 | 24/48 | 36 | 24/36 |
| Shelf life from release (hrs)a | 60b | 120/60b | 144 | 120/144 | 60b | 120/60b |
| SR | 1.86 | 1.86 | 1.75 | 1.75 | 1.82 | 1.82 |
| # Doses from 12,696 collections | 23,672 | 23,672 | 22,223 | 22,223 | 23,065 | 23,065 |
| % PR | 73 | 86 | 77 | |||
| Revenue ($) | 11,345,842 | 13,251,949 | 11,651,560 | 12,904,030 | 11,746,914 | 13,179,243 |
| Costs ($) | 3,264,149 | 4,192,350 | 3,933,149 | 4,350,972 | 3,587,240 | 4,269,474 |
| Net ($) | 8,081,693 | 9,095,599 | 7,718,411 | 8,553,059 | 8,159,674 | 8,909,769 |
Not including NAT result release time
Shelf life may be extended up to 96 hours if secondary bacterial safety intervention performed at hospital. Costs and additional shelf life are contemplated in separate hospital analysis
Conclusion: Implementation of bacterial safety measures will impact platelet availability, days of usable shelf life and production cost. Performing PR on 73‐86% of product is feasible at this BC without further impacting availability/ SR. PR may offset financial loss associated with bacterial safety measures. Higher value of PR is generally tied to broad safety profile and replacement of CMV and irradiation. BCs must select production methods in consideration of their hospital customer's needs and willingness/ability to perform POI testing or BD.
MGT1
Using Data to Maximize Staff Utilization
Nanette Johnson*1, Kathy J. Kaherl1, Leane Ziebell1 and Sandra J. Nance2
1American Red Cross, 2American Red Cross and American Rare Donor Program
Background/Case Studies: It is well documented that the laboratory workforce is shrinking due to diminished influx of Medical Technology (MT) and Medical Laboratory Technician (MLT) graduates and the imminent retirement of Baby Boomers. Competition for new graduates can be fierce and applications by experienced MT/MLTs for Immunohematology Reference Laboratory (IRL) jobs in large metropolitan areas are rare. Workload for referral labs is increasing as hospitals outsource more and more antibody work. From 2008 to 2015, workload and staffing in our large IRL increased 48% and 68% respectively. A staff retention rate of only 61% since 2010 and multiple compliance risk factors prompted intensive executive leadership scrutiny and oversight. A deep dive into the causes of our compliance risks identified the needs for stratifying our workforce and mapping each task to the most appropriate job position.
Study Design/Method: A complex task timing exercise performed in 2008 and then again in 2015 returned staff utilization figures in our IRL of 125% and 117% respectively (optimal staff utilization target 85‐95%), indicating that staff were stretched beyond maximum capacity. Data from this exercise and staff tables of organization were reviewed for the three largest IRLs, two of which had a high compliance risk. Individual staff interviews and observations were performed by an independent party familiar with laboratory processes and procedures.
Results/Finding: The two IRLs (B, C) with higher compliance risk spent twice as much time on non‐testing tasks such as training, competency assessment and equipment qualification than on testing tasks, while these numbers were virtually identical for the IRL in good standing (A). The IRL in good standing had three to four times the staff in support roles than the two IRLs with higher compliance risk. The data analysis and recommendations of the independent reviewer resulted in the addition of two Lab Assistants, two Operation Support Specialists, a Technical Trainer and an Administrative Assistant to assume most non‐testing tasks and increase supervisory presence in the lab. A Culture of Quality focused on First Time Right was implemented, allowing the laboratory to quickly reach regulatory compliance which has been sustained for 17 months and counting.
2015 Task Timing and Staff Analysis
| Region | Testing hours | Non‐testing hours | Support FTE |
|---|---|---|---|
| A | 30,719 | 30,153 | 8 |
| B | 19,336 | 40,958 | 2 |
| C | 16,610 | 34,072 | 2.5 |
Conclusion: Timing studies coupled with mapping of tasks to job description are essential exercises to maximize the productivity of certified technical staff. Adding staff at lower compensation rates effectively increases manpower and productivity without adding expense. The ability of certified technical staff to focus on testing tasks and increased supervisory oversight enhances regulatory compliance and raises the morale of all staff.
MGT2
A Comparison of Cell Salvage Vacuum Regulators
Joshua Flerchinger*, Roger Godic, Raleigh Krigbaum, Carol Dumont and Suzanne Bakdash
Cleveland Clinic
Background/Case Studies: During intraoperative cell salvage, the perioperative autotransfusion service utilizes either on‐board machine or wall suction through a vacuum regulator to collect blood from the surgical field. The existing regulators required costly, time‐consuming annual preventative maintenance (PM) by an outside vendor, with additional function verification by our techs. Regulators sent out for annual PM were unavailable for several weeks and a few were inoperable when returned, requiring replacement. An alternative vacuum regulator with lower cost and less time and labor‐intensive PM was identified and evaluated against the existing regulators.
Study Design/Method: A vacuum regulator designed for cell salvage, “New Vacuum Regulator” (NVR) was obtained to trial and compare to the existing general use vacuum regulators, “Current Vacuum Regulator” (CVR). No guidelines were available to perform the comparison, so we attempted to simulate conditions of daily use. One of each of the regulator models was attached to the hospital wall vacuum system and set to 150mmHg to aspirate 1000mL of normal saline from a basin. The initial set up used one Aspiration/Anticoagulation Set (ANA Set) with a Yankauer suction tip, and timed how long it took to entirely aspirate the contents of the basin. Since the surgical teams commonly request two ANA Sets, but utilize only one to aspirate from the field, the process was repeated with two ANA Sets, where one line was used to aspirate the contents of the basin and the other was left open to atmosphere.
Results/Finding: Using one ANA Set, both regulator models cleared the saline from the basin in 32 seconds. Using two ANA Sets, with one line in use and the second open to atmosphere, the CVR model aspirated the saline in 62 seconds, while the NVR model cleared the basin in 46 seconds. The findings were reproducible on repeat testing.
The acquisition cost of the NVR model was higher than the CVR model. However, a cost analysis proved that replacing the CVRs with NVRs would yield a 6‐year return on investment since the NVR model has a 10‐year warranty and no annual PM requirement. Given the operational test results, high rating for ease of use by the techs, anticipated time and labor savings and favorable cost analysis, the existing CVR models were replaced by NVRs.
After implementing the new NVRs, there was a significant decrease in complaints from surgeons about ‘weak’ suction, reducing the need for troubleshooting during the case. No changes were noted in cell salvage quality control parameters after the switch.
Conclusion: Switching from the current vacuum regulators to the new vacuum regulators eliminated the time, labor and cost of PM. An unexpected bonus was that the new NVR model performed better when used in the surgeons’ preferred two ANA Set setup, resulting in greater surgeon satisfaction.
MGT5
Blood Bank Ambassadors Bridge Communication Gap and Sustainably Improve Workflow via Project Connect
Antonio G. Insigne*, Joseph Akin, Russell Thorsen, Jennifer Martinez, Leslie Buchanan, Ashok Nambiar, Morvarid Moayeri, Sara Bakhtary and Elena Nedelcu
UCSF Health
Background/Case Studies: Improving communication is known to positively affect healthcare operations and patient safety. Blood Bank (BB) operations can be significantly impacted by interruptions due to phone calls which negatively impact laboratory workflow and potentially affect patient care. Here we report the experience of a newly formed operation taskforce on improving internal workflow and interdepartmental communication.
Study Design/Method: The aim of this study was to improve communication with the nursing personnel from the outpatient Infusion Center at our institution, specifically to reduce the number of phone calls from that unit and the time spent by the BB staff on addressing concerns. An operational taskforce, Blood Bank Ambassadors, was assembled to bridge the communication gap and clarify workflow for nursing personnel. This group was formed by supervisors, specialists and a medical director. Intervention strategies included establishing a platform to safely share ideas, identifying champions of change on both sides, outlining and addressing most significant concerns on both teams, clarifying common goals and ownership, and establishing baseline and follow‐up metrics. Initial meetings were held between Blood Bank Ambassadors and nursing team composed of nursing manager, quality improvement personnel, bedside nurses and information technology specialist. This was followed by additional clarifications and regular communication via email. Pre‐ and post‐intervention metrics were the number of calls to BB and estimated time spent by BB staff to clarify issues and concerns raised by nursing personnel.
Results/Finding: Baseline data showed an average of 241 calls per month (October 2017) made by nurses from the Infusion Center serving outpatients on the Hematology & Oncology Service at our institution. Approximately 20 hours per month were spent on clarifying issues related to the BB workflow to the nursing unit. The most common issues discussed were transfusion requirements on requisition not agreeing with patient's file or transfusion guidelines, specimen problems, requests for additional specimen testing, turn‐around‐time, blood product availability and duplicate orders. After the first interdepartmental meeting followed by additional clarifications via email, the call number was reduced to 27 per month, then further decreased to an average of 2.5 calls per month for four consecutive months (January to April 2018). This represents a reduction of more than 98% from baseline call number and estimated time spent on phone calls.
Conclusion: Blood Bank Ambassadors significantly improved interdepartmental communication by asserting common leadership and goals. Internal workflow was positively affected by a dramatic reduction in phone calls and time spent on clarifying concerns. Further experience with other teams may reveal key factors for successfully implementing organizational change.
MGT6
aPCC vs. rFVIIa for the Treatment of Bleeding in Patients with Acquired Hemophilia – a Cost‐Effectiveness Analysis
Chong H. Kim*1, Sierra C. Simmons2, Chau M. Bui2, Ning Jiang3 and Huy P. Pham4
1University of Colorado Anschutz Medical Campus, 2Independent Researcher, 3Center for Family Life at Sunset Park, 4Keck School of Medicine of the University of Southern California
Background/Case Studies: Acquired hemophilia A (AHA) due to the spontaneous formation of autoantibodies against factor VIII is an acquired bleeding disorder with significant morbidity and mortality. Therapies include immunosuppression, bleeding control, eradication of the inhibitors, and treatment of the underlying condition. In bleeding patients with high‐titered inhibitors, bypassing medications (recombinant activated factor VII (rFVIIa) or activated prothrombin complex concentrate (aPCC)), should be initiated promptly. Both of them are FDA‐approved treatments with its own advantages and disadvantages. For example, rFVIIa is a recombinant product and thus, theoretically, there is less risk of transfusion‐transmitted infections by both known and unknown agents compared to human plasma‐derived products, such as aPCC. However, the cost of rFVIIa is significantly higher. Thus, we developed an economic model to rigorously examine the cost effectiveness of rFVIIa and aPCC in this scenario.
Study Design/Method: A Markov decision analytic model was developed to simulate a hypothetical cohort of adult patients with bleeding due to AHA being treated with either rFVIIa or aPCC for 5 days. Regardless of the treatment, the model was developed such that the patients transitioned into 4 different health states: (1) continuous bleeding, (2) thrombosis, (3) stop bleeding, and (4) death. All patients in the model was bleeding initially and thus, they entered the model at stage (1). Depending on the probability of the treatment efficacy and adverse events, on each subsequent day, the patients either remained in state (1) or entered state (2), (3), or (4), which were modeled as absorbing states, which means that the patients did not transition into other states once they entered one of these 3 states. If the patient experienced a thrombotic event, we assumed that the event was severe so that no additional rFVIIa or aPCC was given. We also assumed that there was no re‐bleeding event in this cohort. Model parameters, including probabilities, health utility index, and costs, were gathered from the medical literature, except for the costs of aPCC and rFVIIa, which were obtained from our institutional data.
Results/Finding: During the 5‐day period, the treatment cost of rFVIIa was substantially more than the cost of aPCC ($19,369 vs. $2,724). The average quality adjusted life days (QALDs) gained for rFVIIa was slightly lower compared to aPCC (4.05 vs. 4.08). Overall, aPCC prevailed over rFVIIa as suggested by the incremental cost‐effectiveness ratio. Sensitivity analysis also confirmed the robustness of the model across tested ranges of all input variables.
Conclusion: In high‐titered AHA patients with bleeding, aPCC is more cost‐effective when compared to rFVIIa. Thus, aPCC should be used in these patients if available and if there is no other contraindication clinically.
MGT7
A Novel Staffing Model for a Highly Engaged Perioperative Team to Improve Work‐Life Balance
Adam Knutson*, Chelsea Conn, Pamela M. Johnson, Camille Van Buskirk and Paula Santrach
Mayo Clinic
Background/Case Studies: Working in a fast paced surgical setting can make it difficult to establish reliable staffing levels. The unpredictable hours can lead to large amounts of overtime and callback time. These extra hours worked can put stress on the employees and also be a source for a high burnout rate. In January 2017 the Autotransfusion (AT) team implemented multiple staffing tools to accommodate the high paced surgical environment while creating an improved work‐life balance for twelve AT technicians.
Study Design/Method: The AT team collected data from all cases in 2016 where AT performed blood salvage procedures to determine the potential changes to the 2017 staffing model. This data included the average length of time a patient was in the operating room (OR) which was 6.32 hours and average number of surgical cases for a 24‐hour period which was 16 cases. This data analysis defended the following additions to the AT schedule: Five 8 hour shifts were converted to 10 hour shifts, a third on‐call technician, and two designated late shifts to cover potential overtime. In addition to schedule changes, AT implemented a point‐system and communication (SBAR) sheet to assist in determining staffing at shift change in August 2017. Each day, current surgical cases were assigned points which translated to how many staff was needed at the end of a scheduled shift (e.g. one OR = one point). This process withdrew any emotion when determining if staff was required to stay overtime.
Results/Finding: There was a slight increase (1%) in AT‐staffed cases between 2016 and 2017. Overtime decreased and on‐call hours increased, however there was a minimal increase (<1%) in call‐back hours per on‐call position (Table 1). The point‐system data indicated that at the end of first shift (0700‐1530), approximately eight points were assigned to the scheduled surgical cases. This number of points specified that on average, four technicians were needed to staff at 1530 each day. Prior to the implementation of this tool, the number of technicians needed to staff varied and was decided by the evening shift technician.
TABLE 1
| Year | Total Cases | Total Overtime (hours) | Total On‐Call (hours) | Mean Hours per on‐call technician |
|---|---|---|---|---|
| 2016 | 3900 | 478.3 | 1034 | 29 |
| 2017 | 3910 | 376.8 | 1431 | 30 |
Conclusion: By introducing the staffing to workload tools, AT was able to make changes to the staffing model. This improved staffing model resulted in a decrease of overtime, less call‐back hours per shift, and a positive work‐life balance.
MGT8
Development of Community‐Oriented Blood‐Center‐Based Medical Clinic
Richard Gammon* and Rita A. Reik
OneBlood, Inc
Background/Case Studies: This blood center (BC) transitioned from traditional model where all therapeutic phlebotomies (TB) were performed by donor services to creation of medical group operating licensed medical clinic (MC) not associated with hospital. This allowed performance and billing for professional nursing and physician consultative services associated with TB. MC served those whose diagnoses did not allow for crossover of the phlebotomized products to the allogeneic inventory. Summarized are operational, financial and regulatory processes.
Study Design/Method: Project was championed by Chief Medical Officer (CMO) and supported by BC Senior Executive Management (SEC). Multidisciplinary working group was established that included from BC: project manager, physicians, training, procedure writers, therapeutic apheresis nursing (TAN), marketing, finance, quality assurance, information technology and facilities; external consultants: billing and credentialing specialists and health‐care attorney. Credentialing of MC and physicians with Centers for Medicare and Medicaid Services and contracts with private carriers needed to be completed for payment. MC needed to be inspected and licensed by Agency for Health Care Administration and procedures written in accordance with appropriate laws and regulations. New electronic medical record (EMR) was created that allowed patient information entered on one tablet to be synced across devices. Method of collecting insurance copayments was created – allowing for credit card processing (cash or checks not accepted). Pilot program was launched using existing BC space with modifications to reconfigure reception area ensuring EMR was not visible to patients. BC physician and TAN staffed MC. Accounts receivable (AR) was reviewed.
Results/Finding: Workflow was as follows: 1) prior ‐ patient scheduled appointment (walk‐ins not accepted), insurance and prescription verified and co‐payments confirmed; 2) day of presentation – check‐in, copayment and health screening including vitals performed by TAN and physician completed history and physical; if patient was cleared, TB occurred. 06/28/17 (clinic opening) to 03/31/18‐ 240 patients presented and mean of 30.3% of payments for charges was recovered. While MC was credentialed with Medicare and Medicaid, contracts with only 02/10 of private carriers have been finalized. Several carriers have allowed out‐of‐network billing. AR: 24.4% current, 18.5% 30 days, 14.9% 60 days, 8.1% 90 days and 34.1% 120 ≥ days.
Conclusion: Creation of a medical group operating under a licensed MC where TB services were performed was successfully implemented. Support of SEC, CMO and multidisciplinary team was needed. Patient experience was optimized. Challenges included obtaining contracts and payments from carriers.
| Quarter | 3Q17* | 4Q17 | 1Q18 |
|---|---|---|---|
| # Patients | 74 | 62 | 104 |
| % Recovery of Charges | 24.8 | 40.8 | 25.4 |
| % Patients TB Performed | ** | 93.2 | 99.0 |
Included 06/28‐06/29/17
Data not captured
PHP4
New HIV Infections from Blood Transfusions Averted by Laboratory Testing in 28 PEPFAR‐Supported Countries, 2004‐2015
Fatima D. Mili*
Centers for Disease Control and Prevention
Background/Case Studies: In 2004, the US President's Emergency Plan for AIDS Relief (PEPFAR) Program integrated blood safety activities into its key strategies in countries with high prevalence of HIV, or a weak blood safety system, or both. The goal was to strengthen their Blood Transfusion Services through a decrease of HIV and other transfusion‐transmitted infections (TTIs), and provide a universal access to safe blood. A standardized screening program implemented in these countries' national and regional blood centers encompassed a questionnaire for screening of HIV‐risk behavior to exclude potential high‐risk blood donors, and a universal laboratory testing for HIV and other TTIs. There is currently a major gap in quantifying the impact of PEPFAR on HIV transmission risks through blood donations.
Study Design/Method: World Health Organization Global Database on Blood Safety data were analyzed from 28 selected PEPFAR‐supported countries in sub‐Saharan Africa, Asia, and Caribbean from 2004‐2015. Statistical analysis was performed using AIM (AIDS Impact Model) and Goals modules of the Spectrum Software version 5.53, and laboratory quality for HIV testing was assumed to have 91.9% sensitivity and 97.7% specificity. Country‐specific incidence rate of HIV was calculated from prevalence rate of HIV infection transmitted from blood transfusions through infected blood donations over time. The impact of laboratory testing programs for blood donations on HIV transmission risk through blood transfusions was determined by estimating the number of new HIV infections averted since the implementation of the PEPFAR program.
Results/Finding: Results indicated that HIV incidence rates in blood donations showed decreasing trends in 20 sub‐Saharan African countries, Cambodia, and Haiti. The following patterns were observed: wide U‐shaped trends in Ghana, Lesotho, Guyana; reverse J‐shaped in Ethiopia; inverted wide U‐shaped in Tajikistan; and increasing trends in Angola, Kazakhstan, and the Kyrgyz Republic. As predicted, new HIV infections from blood transfusions averted by laboratory testing increased over time in all 28 participating countries. The sum total of HIV infections averted was estimated to be 221,130 in sub‐Saharan Africa (ranging from 538 in South Sudan to 50,660 in Mozambique), 3,252 in Caribbean (430 in Guyana to 2,821 in Haiti), and 4,898 in Asia (663 in Tajikistan to 2,283 in Kyrgyz Republic).
Conclusion: Mathematical modeling of HIV prevalence rates in blood donations has provided evidence of the positive impact of 17 years of PEPFAR support. Universal HIV testing of donated blood has reduced the risk of HIV transmission through blood transfusions in sub‐Saharan Africa, Asia, and Caribbean. If these countries sustain universal laboratory testing of all donated blood for HIV, the number of averted new HIV infections through safe blood transfusions is expected to increase.
PHP5
Advancing the Use of the ISBT‐128 Coding System in Electronic Health Records to Monitor Blood Transfusion Prevalence in the United States
Joyce Obidi*1, Kinnera Chada1, Joann Gruber1, Graca Dores1, Emily Storch1, Alan Williams1, Juan Banda2, Saurabh Gombar2, Deepa Balraj2, Ross Hayden3, Daniel Hood3, Thomas Falconer4,5, Karthik Natarajan4,5, Eldar Allakhverdiiev5,6, Sara Dempster5,7, Christian Reich5,7, Nerissa Williams7 and Azadeh Shoaibi1
1Center for Biologics Evaluation and Research (CBER), Food and Drug Administration, 2Stanford University, 3Regenstrief Institute, 4Columbia University, 5Observational Health Data Sciences and Informatics, 6Odysseus Data Services Inc., 7IQVIA
Background/Case Studies: The most detailed information about transfusion of whole blood and blood components in electronic health records (EHR) is recorded with the Information Standard for Blood and Transplant (ISBT)‐128 coding system in the United States (U.S.). The ISBT‐128 coding system adds sensitivity and granularity to blood surveillance which other coding systems, such as billing and reimbursement codes, may lack. The U.S. Food and Drug Administration (FDA) Center for Biologics Effectiveness and Research (CBER) recently established the Biologics Effectiveness and Safety (BEST) Initiative, a part of the CBER Sentinel Program. The aim of this study is to characterize the prevalence of whole blood and blood components transfusion from 2012 to 2017 using ISBT‐128 codes from participating data partners in the BEST Initiative.
Study Design/Method: We explored approximately 24 million patient records from three EHR databases (Columbia University, Stanford University, and Regenstrief Institute) along with a library of 14,543 ISBT‐128 codes. We assessed transfusion of whole blood or a blood component (red blood cells, plasma, cryoprecipitate and platelets).
TABLE 1 (PHP5) Transfusion trends in three EHR databases in the BEST Initiative, 2012‐2017
| Year | 2012 | 2013 | 2014 | 2015 | 2016 | 2017 | Total |
|---|---|---|---|---|---|---|---|
| Whole Blood | 34 | 16 | 6 | 8 | 8 | ‐ | 72 |
| Red Blood Cells | 56,519 | 57,397 | 62,236 | 66,715 | 69,416 | 63,195 | 375,478 |
| Platelets | 32,713 | 22,534 | 25,919 | 27,081 | 26,824 | 24,911 | 159,982 |
| Plasma | 11,607 | 11,881 | 12,385 | 11,878 | 11,501 | 9,845 | 69,097 |
| Cryoprecipitate | 2,947 | 2,936 | 3,410 | 3,539 | 3,627 | 3,431 | 19,890 |
| All Transfusions | 103,820 | 94,764 | 103,956 | 109,221 | 111,376 | 101,382 | 624,519 |
Results/Finding: Transfusion trends of blood components varied between 2012 and 2017. Of the 624,519 total transfusion events, red blood cells (RBCs) accounted for more than half (51.1%) of events, with platelets (21.8%), plasma (9.4%), cryoprecipitate (2.7%), and whole blood (0.01%) comprising the remaining events. We observed increasing RBC transfusion events up through 2016, a suggestion of increasing administration of cryoprecipitate, and relatively consistent use of plasma. There is overall downward trend in administration of platelets. Whole blood usage was minimal and became obsolete over the study period.
Conclusion: We have demonstrated that using the ISBT‐128 coding system is feasible and well‐captured within the BEST EHR databases. Incorporation of ISBT‐128 codes into the CBER blood surveillance system can enhance hemovigilance activities and will afford FDA the ability to actively monitor blood component utilization and transfusion‐related adverse events.
PHP6
Comparing Two Methods for Estimating HIV and HCV Incidence in Repeat United States Blood Donors
Whitney Steele*1, Lauren A. Crowder1, James M. Haynes1, Ed P. Notari1, Roger Y. Dodd2 and Susan L. Stramer1
1American Red Cross, 2American Red Cross Holland Laboratory
Background/Case Studies: While the incidence rate (IR) is always the number of cases divided by the total person‐time (PT) at risk for the population in question, the incidence method (IM), or the way the cases are determined and PT calculated in repeat blood donors often varies by investigator. A recent paper modeling 8 different IM for HIV using simulated donation and infection data found that the IM used by our investigators since 2002 (ELM – Extended Lookback Method) resulted in biased estimates and that a different IM (CM – Conventional Method) was preferred for IR estimation (Brambilla, Transfusion 2016). To assess how these 2 IM performed with actual donor data, we calculated HIV and HCV IR for five 2‐year estimation intervals (EI) at our organization.
Study Design/Method: In CM, a repeat (RPT) donor is considered incident or contributes to PT if at least 2 donations exist within the EI. RPT donors lacking a prior donation within the EI are censored. With ELM, the history of each RPT donor within the EI is traced back the same length of time as the EI to look for prior negative donations. A donor's previous negative can be before the EI; as in the CM, such donors are censored. IR are calculated as cases divided by total time at risk for all repeat donors (expressed per 100,000 person‐years).
Results/Finding: The number of HIV and HCV positive RPT donors using CM and ELM IM and the corresponding IR for all 5 EI from 2007‐2016 are provided (See Table). For CM, the IR was usually double the IR of ELM, with corresponding PT of 1.2 million and 4.0 million for each method, respectively. The same pattern was generally seen for HCV except in years 2013‐2014 and 2015‐2016 where the CM and ELM IRs were closer.
Conclusion: In contrast to the 2016 analysis using simulated data, CM in our population of actual RPT donors produced consistently higher IR compared to ELM. The advantage to ELM is that more positive donors identified during the EI can be utilized, but the concern is that the corresponding increase in PT of the entire population does not compensate for this. While we did find that ELM identified more incident donors than CM, the ELM PT was usually more than 3x that of PT in CM, while the number of incident donors captured by ELM was no more than 2x greater. The larger denominator, without an equal increase in the numerator, resulted in lower ELM IR. Simulations can attempt to model different conditions such as changes in donation frequency and number of positive donations, but may not match the actual changes in the donor population, as observed here. Given rapid shifts in donor collections in recent years, differences in methods are difficult to model, and thus both incidence methods will likely continue to be used.
(PHP6)
| Years | HIV – Number of Positives and Incidence Rates per 100,000 person‐years by CM and ELM | HCV ‐ Number of Positives and Incidence Rates per 100,000 person‐years by CM and ELM | ||||||
|---|---|---|---|---|---|---|---|---|
| Pos ‐ CM | Rate ‐ CM | Pos – ELM | Rate ‐ ELM | Pos ‐ CM | Rate ‐ CM | Pos – ELM | Rate ‐ ELM | |
| 2007‐08 | 55 | 4.24 (3.19‐5.52) | 91 | 2.13 (1.77‐2.67) | 82 | 6.32 (5.03‐7.85) | 135 | 3.17 (2.83‐3.94) |
| 2009‐10 | 61 | 4.72 (3.61‐6.07) | 93 | 2.18 (1.75‐2.64) | 60 | 4.51 (3.44‐5.81) | 115 | 2.69 (2.30‐3.31) |
| 2011‐12 | 42 | 3.40 (2.45‐4.59) | 85 | 2.09 (1.62‐2.50) | 93 | 7.32 (5.91‐8.97) | 157 | 3.86 (3.51‐4.76) |
| 2013‐14 | 33 | 2.99 (2.06‐4.20) | 53 | 1.43 (1.07‐1.87) | 55 | 3.35 (2.36‐4.62) | 98 | 2.64 (2.14‐3.22) |
| 2015‐16 | 25 | 2.59 (1.68‐3.83) | 42 | 1.27 (0.91‐1.71) | 17 | 1.75 (1.02‐2.80) | 47 | 1.42 (1.06‐1.91) |
PHP7
Estimating the Global Need for Transfusion Services
Christina Fitzmaurice*
University of Washington/IHME
Background/Case Studies: Transfusion services are an essential component of every health‐care system by supporting life‐saving interventions. However, blood product availability is limited for many patients throughout the world. In order to improve access to blood products it is crucial to provide countries with enough detail about transfusion needs to enable targeted investments. To determine the need for transfusion services at the country level, disease prevalence information as well as disease specific transfusion rates are required. Disease prevalence estimates are available from the Global Burden of Disease (GBD) study for 195 countries, by sex, age, and over time. We propose to use administrative data to determine transfusion rates by GBD cause and to apply these rates to the GBD prevalence estimates in order to determine blood product needs by country, and over time.
Study Design/Method: As an initial step in our analysis, we used the Truven Analytics 2010 and 2012 Marketscan database and the HCUP Nationwide Inpatient Sample 2000 to 2012 to determine packed red blood (PRBC) and platelet transfusion proportions by disease category and inpatient encounter. Disease categories were defined based on the Global Burden of Disease 2016 cause list. For each inpatient encounter the principal diagnosis was used to determine the most likely indication for transfusion. A transfusion event was defined as at least one packed red blood cell or platelet transfusion procedure code (ICD‐9‐CM code, 99.04 and 99.05) per inpatient encounter.
Results/Finding: The most common inpatient encounters with at least one PRBC or platelet transfusion were cancer related anemia (66% of inpatient encounters), acute blood loss anemia (59%), hereditary, nutritional, hemolytic, and bone marrow failure anemias (52%), gastro‐intestinal bleeding events (38%), and chronic liver disease (37%). Among the cancer related anemias, leukemias and multiple myeloma had the highest proportion of admissions with at least one transfusion (23% to 35%).
Conclusion: Population level requirements for blood products depend on the location specific epidemiological and disease profile. By using administrative datasets, indications for transfusions can be determined. Next steps in our analysis will be to determine disease specific transfusion rates and to apply these transfusion rates to the disease prevalence estimates from the Global Burden of Disease study for 195 countries. These estimates of the number of needed blood transfusions will be contrasted with current transfusion availability as reported in the WHO Global Database on blood safety.
PHP8
Blood Donor Atrial Fibrillation Screening Using a Mobile Electrocardiogram Health Application Loaded onto a Tablet Device
Michael E. Stevenson*, Mshal Almaqbal, Brian D. Hess, Richard B. Pippin, Edward Armitage, Autumn Stewart, Shilpa Mathew, Julia L. Davis, Tuan N. Le and John B. Armitage
Oklahoma Blood Institute
Background/Case Studies: Atrial fibrillation (AF) is a common cardiac arrhythmia affecting 1.5% of individuals in the developed world and 5% of those over 65 years of age. AF is likely underdiagnosed, resulting in therapeutic delays and increasing complication risks. A pilot program screening for AF with a mobile electrocardiogram (ECG) application was instituted at a community blood center to benefit donors by alerting those with possible AF to seek further medical evaluation.
Study Design/Method: Following blood collection, donors aged 18 or older were invited by a volunteer to be screened for AF. After giving informed consent, they completed anonymous Demographics and Medical History forms. An AF screening ECG application loaded onto a tablet device was used to assess heart rhythms. Results (Normal, Unclassified, Unreadable, Possible AF) were recorded for each subject. Those with Possible AF results recieved a copy of their heart tracings and were advised to consult a health provider. Participants also completed an evaluation incorporating a five‐level Likert scale (1=most unfavorable; 5=most favorable).
Results/Finding: A total of 1000 donors (average age of 43.0) were screened. The majority were female (61.2%) and Caucasian (76.2%). Most were allogeneic donors (99%) and had a health provider (84.2%). A minority of subjects (39) reported a previous AF evaluation. Most interpretations were Normal. Of these, two (plus one unsure) had a previous AF diagnosis but denied current AF. Thirty (plus one unsure) reported an irregular pulse history. Possible AF results totaled seven, of whom none was previously evaluated for AF (though two reported an irregular pulse history). The average age of those with Possible AF (31.6) was less than those with a Normal screen (43.3). Refer to Table 1 for further cohort characterizations. Most users reported interest in this opportunity (4.3/5 on the Likert scale), found results useful/helpful (4.5), thought the device easy to use (4.9), and were likely to be re‐screened (4.7). A majority (97.9%) recommended continuing to offer the screening.
Conclusion: This pilot AF screening program at a community blood center was well received by donors, with 0.7% of participants generating a Possible AF result. Further study of an older donor population screened for AF prior to qualifying for blood collection is warranted. Also, correlation of diagnostic outcomes for those with Possible AF screening would be valuable.
TABLE 1 (PHP8) AF Screening Results and Self‐Reported Health Histories
| Screening Result | Normal | Possible AF | Unclassified | Unreadable | Total |
|---|---|---|---|---|---|
| Screenings (%) | 912 (91.2) | 7 (0.7) | 71 (7.1) | 10 (1.0) | 1000 |
| Age* | 43.3 + /‐15.8 (18‐81) | 31.6 + /‐20.4 (19‐81) | 41.1 + /‐17.3 (18‐78) | 28.9 + /‐11.6 (18‐51) | 43.0 + /‐16.0 (18‐81) |
| Male (%) | 356 (39.2) | 3 (42.9) | 23 (32.4) | 4 (40) | 386 (38.8) |
| Female (%) | 552 (60.8) | 4 (57.1) | 48 (67.6) | 6 (60) | 610 (61.2) |
| Body Mass Index (BMI)* | 30.1 + /‐6.5 (18.1‐60.0) | 23.3+/‐2.2 (20.3‐25.8) | 30.2 + /‐7.9 (16.8‐50.2) | 24.7 + /‐5.4 (19.6‐37.5) | 30 + /‐6.6 (16.8‐60.0) |
| Hypertension (%) | 205 (22.5) | 0 (0) | 23 (32.4) | 2 (20) | 230 (23) |
| High Cholesterol (%) | 164 (18.0) | 0 (0) | 12 (16.9) | 2 (20) | 178 (17.8) |
| Diabetes (%) | 62 (6.8) | 0 (0) | 10 (14.1) | 0 (0) | 72 (7.2) |
| Irregular Pulse History (%) | 28 (3.1) Unsure 1 (0.1) | 2 (28.6) | 0 (0) | 0 (0) | 30 (3.0) Unsure 1 (0.1) |
| Previous AF Evaluation (%) | 38 (4.2) | 0 (0) | 1 (1.4) | 0 (0) | 39 (4.0) |
| Previous AF Diagnosis (%) | 2 (5.3) Unsure 1 (2.63) | 0 (0) | 0 (0) | 0 (0) | 2 (5.1) Unsure 1 (2.56) |
Results Given as Mean +/‐ Standard Deviation (Range)
PHP9
Granulocyte Colony‐Stimulating Factor (G‐CSF) in Breastmilk of a Nursing Donor during Hematopoietic Progenitor Cells (HPC) Mobilization
Randin C. Nelson*
National Institutes of Health
Background/Case Studies: Peripheral blood hematopoietic progenitor cell (HPC) transplants are the most common product for HPC transplantation. Peripheral blood HPC donors receive recombinant human granulocyte colony‐stimulating factor (G‐CSF) to stimulate production and release of HPCs into the peripheral blood for apheresis collection. Among concerns for lactating G‐CSF‐mobilized peripheral blood HPC donors is the unknown potential for harm to their child via ingestion of this potent growth factor during nursing. Only two studies have previously described the excretion of G‐CSF in human milk, leaving the transplant community with limited information with which to make appropriate safety recommendations for nursing HPC donors. In this study, G‐CSF levels were measured in a lactating G‐CSF‐mobilized HPC donor.
Study Design/Method: Serial plasma and milk samples were collected from a volunteer peripheral blood HPC donor. The G‐CSF concentration of each sample was measured using an enzyme‐linked immunoassay (ELISA).
Results/Finding: Peak concentration of G‐CSF in donor milk was at 592pg/mL 48 hours after the first dose of G‐CSF was given. G‐CSF remained detectable in donor milk for 48 hours after the final dose of G‐CSF.
Conclusion: Compared to previous reports, a higher peak concentration of G‐CSF in donor breast milk during mobilization was identified. Additionally, G‐CSF was still detectable in breast milk 2 days after the last dose, the time at which even the most conservative guidelines would allow the donor to resume breastfeeding. This underscores the need to cautiously counsel lactating HPC donors regarding the presence of G‐CSF in breast milk and the unknown risk this poses to the nursing infant.
PHP10
Where Do the Red Blood Cells Go? A Nationwide Analysis of RBC Use in Taiwan 2015
Ling‐I Hsu*, Yun‐Yuan Chen and Jen‐Wei Chen
Department of Research, Head Office, Taiwan Blood Services Foundation
Background/Case Studies: Understanding of usage of red blood cell (RBC) componentscan facilitate demand planning and clinical supply. Periodically review and audit of blood utilization is the first step for patient blood management in the future.In this study, we aimed at a nationwide analysis of red cell transfusion and their clinical indications.
Study Design/Method: A National Health Insurance (NHI) program has been in place in Taiwan since 1995.Individualstransfused with RBC were identified and their disease diagnoses and surgical procedures were retrieved from NHI database, which comprised of information of more than 99% of blood transfused in the country.
Results/Finding: A total of 306,980 persons were transfused with 1,074,934 red cell units, adjusted to 500 ml whole blood‐derived RBC equivalent unit, in 19 medical centers, 76 metropolitan hospitals and 285 community hospitals and 187 clinics in 2015.Overall, 44.06% of RBC were transfused in medical centers, 55.85% were transfused in metropolitan and community hospitals and 0.88% transfused in clinics. A total of 45.6% of RBC units were transfused for medical indications, with 51.4% being transfused for surgical indications and 3.0% for obstetrics and gynecology. When compared to RBC transfusion in 2011, the transfused units for medical and obstetrics/gynecology remains steady over these years. The transfused units for surgical procedures was 4.5% decreased.
Breakdown data showed Hematologic and oncologic disorders accounted for 16% and 13% of RBC transfusion, respectively. Gastrointestinal (14%), vascular (11%) and cardiothoracic surgery(10%) were also common indications for RBC transfusion. RBC usage varies between hospitals. Approximately 19% of RBC units were transfused for cancer patients in medical centers, but less than 10% were for cancer patients in metropolitan and community hospitals. On the other hand, a significantly higher percentage of RBC usage for gastrointestinal surgery and respiratory diseases was observed in metropolitan and community hospitals as compared to that in medical centers. For most internal medical procedures, the number of RBC unit transfused per hospitalization was similar between hospitals. However, significant variations were observed for surgical procedures between hospitals.
Conclusion: This is the first comprehensive population‐based analysis of RBC usage in Taiwan. This study identifies the clinical areas where most of the red cell units were transfused in the country. These data are important for future planning and provide information in realizing patient blood management.
IGT12
When Hr‐ Units Are Not Available, What Are the Alternatives to Transfuse an Immunized Hr‐ Patient? The French National IRL Experience
Vincent L. Thonier*1, Jerome Babinet1, Emmanuelle Guinchard2, Sophie Anselme‐Martin2, Anne Schuhmacher3, Philippe Renaudier3, Sihem Kebaili4, Anne Cortey5 and Thierry Peyrard1,6,7
1Institut National de la Transfusion Sanguine, 2Etablissement Français du Sang Auvergne‐Rhône‐Alpes, 3Centre de Transfusion Sanguine ‐ Croix Rouge Luxembourgeoise, 4Centre Hospitalier Universitaire, 5UF clinique du CNRHP, 6Laboratoire d'Excellence GR‐Ex, 7INSERM UMR_S1134
Background/Case Studies: The Hr‐ rare blood group (RH:‐18) is encoded by 4 different alleles which also encode a partial e, called hrS‐ phenotype. They often segregate with alleles encoding partial D. Thus, Hr‐ subjects are likely to develop alloantibodies, which have been responsible for hemolytic transfusion reactions or hemolytic disease of the fetus and newborn. Hr‐ units are very scarce because most donor testing reagents and procedures do not accurately screen them, as no antigenic weakening is commonly seen. We report the cases of 4 Hr‐ pregnant women with different antibody profiles and how the least incompatible units were selected for them.
Study Design/Method: Standard hemagglutination and genomic techniques were used.
Results/Finding: Patient 1 was at 22 weeks of pregnancy when fetal distress was reported. She was RHD*DAR/RHCE*ceAR homozygous and immunized with anti‐Hr (only reactive in IAT‐papain) and anti‐hrS (titer 4). D‐‐ units were proposed for IUT but with a very high risk of anti‐D immunization. Ten days later, due to the severe renal failure of the patient, the fetus died. To cover a post‐partum hemorrhage, two options were possible: rr units, which would be incompatible in IAT, or R2R2 units, which would only be incompatible in IAT‐papain but without any prevention for anti‐D immunization. The best scenario would have been r”r” but such units were not available when she delivered.
Patient 2 was RHD*DAR/RHCE*ceAR homozygous and immunized with anti‐D, anti‐Hr, anti‐hrS. At delivery their respective titer was 8, 1 and 256. rr and R2R2 units were considered too reactive to be used. r”r” units were barely reactive. Passive antibodies found in the newborn were anti‐D and anti‐hrS. The baby did not harbor a partial D but was discovered to be HbS/S. R2R2 or CEVF‐ (RH:‐61) units were only reactive in IAT‐papain. Even though r”r” units were non‐reactive, in order to prevent an anti‐E immunization, CEVF‐ units were considered to be the best option and easier to collect than D‐‐ units.
Patient 3 had a normal D. At delivery of her 3rd pregnancy, anti‐hrS titrated 512 and anti‐Hr was weakly reactive on untreated RBCs. R2R2 units were selected for the mother and D‐‐ or the mother's blood were proposed for the newborn. Luckily no transfusion was needed. Two years later, she had a new pregnancy. At 8th month, an emergency delivery was performed because of fetal distress. The anti‐hrS titer was 512. At birth the hemoglobin was 7g/dL. An emergency transfusion was done with a fresh R2R2 unit, followed by an exchange transfusion using the same phenotype.
Patient 4 had a normal D. Her antibodies were anti‐E, anti‐c, anti‐hrS and anti‐Hr. Titers, performed on rr, R1R1 and R2R2 RBCs were 4096, 2048 and 8192 respectively. She had lost her 2 first newborns at 1 month and 1 week. She could not carry her last pregnancy to term. No other units than Hr‐, D‐‐ or Rhnull were suitable for transfusion.
Conclusion: To transfuse Hr‐ immunized individuals when Hr‐ units are not available, the following phenotypes should be tested: D‐‐, rr, R2R2, r”r”, CEVF‐ or Rhnull. Depending on the antibodies’ strength, the clinical history and the availability of the units, the best alternative can be decided. A close cooperation with the clinical team is essential and has to be set up at the earliest stage of pregnancy. These cases illustrate the urgent need to implement more efficient procedures in donor testing to pick up Hr‐ units, as well as donor recruitment campaigns to target Hr‐ individuals.
IGT19
Next Generation Sequencing Based ABO Subtyping for Organ Donors
Bharat Thyagarajan*1, Claudia S. Cohn1, Kayla Hansen2, Shelley Williams1 and Christine Henzler1
1University of Minnesota, 2Fairview Hospitals
Background/Case Studies: The Organ Procurement and Transplantation Network (OPTN) has recommended routine subtyping of group A kidney donors so that “non‐A1” donors who express lower amounts of A1 antigen can be used in recipients with blood types O or B. Despite this guidance, only 1.4% of all kidney transplants since December 2014 were subtyped with over a quarter of Organ Procurement Organizations (OPO) reporting issues with subtyping. Serology based ABO typing and subtyping of the A blood type may not be informative when the patients have received pre‐transplant transfusions. The advent of next generation sequencing (NGS) technologies have allowed the rapid, scalable methods for molecular determination of ABO blood types and A subtyping that may address limitations of serological methods and enable widespread adoption of subtyping in kidney transplantation.
Study Design/Method: We developed a NGS based method that specifically amplifies or enriches sequences in exons 6 and 7 of the ABO gene followed by short read sequencing using either HiSeq2500 or MiSeq platform (Illumina Inc.). The raw sequence data was processed using a custom bioinformatics pipeline that allowed inference of the ABO blood types and the A subtype by combining the sequence information with population based frequencies for various alleles. The concordance between observed ABO genotypes and serology was determined using data from 41 individuals with matched ABO genotype/serology information and the concordance of the A subtyping was determined using data from 85 individuals with matched A1 subtype genotype/serology information
Results/Finding: Both exons 6 and 7 were completely sequenced using the custom NGS based assay. We observed 100% concordance between ABO genotypes and corresponding serology in 41 individuals. Unambiguous genotypes for A subtyping was available in 89% of cases (76/85). In all these cases, the A1 allele could not be unambiguously distinguished from the A2 allele. Eight of these cases were serotype as “non‐A1” while one case was serotyped as A1. Combining sequencing data with information from public databases allowed us to successfully infer genotypes in all 85 cases. The concordance among patients with unambiguous A subtypes was 95% (45/49) with four discrepant cases. In two cases, patients with an A1 allele were identified as “non‐A1” by serology while in two cases serology indicated an A1 subtype when no A1 allele was identified by genotyping.
Conclusion: This study demonstrates the feasibility of using molecular techniques to routinely subtype donors and patients awaiting renal transplantation. Further understanding the reasons for the observed discrepancy between genotypes and serology and improvements in genotype determination may be needed before routine implementation of ABO genotyping in a clinical laboratory.
IGT20
A Novel X‐Chromosome Deletion Detected in Two Male Relatives with Mcleod's Syndrome and X‐Linked Chronic Granulomatous Disease
Jules G. Zinni*1, Phillip DeChristopher2, Kerry W. Lannert3, Jill M. Johnsen3, Marisa Saint‐Martin2, Razvan Lapadat2 and Bhakti Patel4
1Northwestern Memorial Hospital, 2Loyola University Health System, 3Bloodworks NW Research Institute, 4American Red Cross
Background/Case Studies: Deleterious variants affecting the CYBB gene of the Xp21.1 region have been associated with loss of nicotinamide adenine dinucleotide phosphate‐oxidase (NADPH) functionality and chronic granulomatous disease (CGD). Directly upstream from the CYBB gene is the XK gene, which encodes the Kx transmembrane protein on red blood cells. Loss of the Kx protein greatly reduces expression of the Kell system antigens and is referred to as the McLeod (MLD) phenotype. MLD neuroacanthocytosis syndrome includes chronic anemia and late onset neuromuscular complications. MLD syndrome with CGD is rare, but has been described to co‐occur in patients with Xp21.1 deletions affecting both CYBB and XK. Two black male half‐brothers, ages 9 and18, presented separately. Both brothers had been hospitalized with multifocal lung consolidations. The 18 year old received four granulocyte transfusions for CGD therapy in 2010 after being hospitalized for chronic right lung fungal pneumonia and produced anti‐Kx. The 9 year old brother had received three red blood cell units for anemia and not produced any antibodies. We performed serologic and DNA studies in these individuals to illustrate a fuller picture of the red cell phenotype and identify the causative genetic variant(s).
Study Design/Method: Anti‐k and anti‐Kpb were of pooled human sera. A regional tiled genomic PCR strategy was used to detect large regional X chromosome deletions. Published X‐chromosome primers (Gassner et al. 2017) were used to amplify 16 genomic PCR targets spanning a 2.8 mbp region of Xp21.1 containing the CYBB and XK genes, followed by fine‐mapping using a step‐wise custom primer strategy.
Results/Finding: Both brother's red blood cells were found to be weakly reactive with Cellano and Kpb antisera. Contiguous PCR amplicons failed to amplify consistent with a large deletion. Fine mapping stepwise PCR strategy identified an approximately 570kb X‐chromosome deletion affecting the genes PRRG1, LANCL3, XK, CYBB, DYNLT3, and SYTL5.
Conclusion: We studied 2 half‐brothers who have MLD phenotype and CGD. We identified a previously unreported X‐chromosome deletion affecting at least 6 functioning genes including XK and CYBB. Evaluation of patients with either CGD or MLD syndrome should consider evaluation for the other syndrome. When these syndromes are suspected, genetic studies should include a method capable of detecting all types of loss of function variations and identifying the extent of X‐chromosome deletions. Transfusion exposures should be minimized whenever possible in these cases due the risk of provoking anti‐Kx responses.
IGT21
RHD Variant Alleles in Selected Prenatal Patients with Serologic Weak D Phenotype and Its Implication in Anti‐D Immunization
Carolina Bonet Bub*1, Maria Giselda Aravechia1, Leandro Santos1, Eduardo Bastos1, Marilia Sirianni1, Thiago Costa1, Jose M. Kutner1 and Lilian Castilho2
1Hospital Israelita Albert Einstein, 2Hemocentro Unicamp
Background/Case Studies: Appropriate classification of RhD phenotypes is crucial for correct indication of anti‐D immunoglobulin (RhIG) in pregnant women. The serological distinction between weak D and partial D phenotypes is often doubtful and makes genetic analysis of the RHD gene highly recommended in pregnant women. In addition to properly define the RhD phenotype, one of the important aspects in maternal medicine is to predict whether the RhD variants can alloimmunize or not the pregnant woman in order to indicate the appropriate use of anti‐D RhIG. Based on this, we analyzed the RHD gene in a cohort of pregnant women from a multi‐ethnic population of Southeast Brazil with a serologic weak D phenotype and evaluated the implication of each D variant found with alloimmunization.
Study Design/Method: We selected a total of 40 prenatal patients samples from 3916 samples that showed a weak reactivity in D typing routine. The D antigen expression was evaluated by tube and gel hemagglutination with four monoclonal anti‐D reagents. Laboratory‐developed DNA tests (LDTs), RHD BeadChip (Bioarray Solutions, Immucor) and sequencing were used to identify the RHD alleles.
Results/Finding: There was no standard serologic reactivity identified, which could predict what type of D variant would be identified but agglutination varied from 1 + to 3+. Molecular analyses showed that 36 (90%) pregnant women were RHD*weak D type 4.0 and potentially at risk for anti‐D and 4 (10%) were RHD*weak D types 1, 2 or 3 and not at risk for anti‐D. Most of the patients had previously gestations with no anti‐D Ig prophylaxis and all patients showed a negative antibody screening in this follow up.
Conclusion: Our results show that weak D type 4.0 is by far the most frequent type (90%) of D variant in this selected prenatal patients of a multi‐ethnic population with serologic weak D phenotype. According to the literature, these obstetric patients are at risk for anti‐D and candidates for RhIG. According to our results, using RHD genotyping, we could prevent unnecessary injections of RhIG in only 10% of the pregnant women with a serologic weak D phenotype. However, no anti‐D immunization was observed in our cohort of pregnant women with weak D type 4.0, even in those who did not use RhIG in the previous gestation.
IGT22
Challenges in RH Genotype Matching in Brazilian Patients with Sickle Cell Disease (SCD)
Tamires Delfino dos Santos, Sheila de Fátima Perecin Menegati, Mayra Dorigan de Macedo, Simone Gilli and Lilian Castilho*
Hemocentro Unicamp
Background/Case Studies: Knowledge of the prevalence of RH variants supports development of strategies to match RH to avoid Rh alloimmunization and the risk of hemolytic transfusion reactions and/or poor transfusion outcomes. Molecular Rh typing has been performed to identify the RH altered alleles and is playing an important role in expanding matching of SCD patients and donors in the RH system. In this study, we examined the transfusion requests for RH‐matched donor units and compared the RHCE alleles in the SCD patients to the RH allele frequency in our donor population. In addition, the number of potentially compatible donors was assessed per request with an aim to identify the RH genotypes that are lacking or insufficient in our donor cohort.
Study Design/Method: Requests for RH genotype matched donors from January 2017 to January 2018 were evaluated. For each patient and donor, their RHD and RHCE alleles were determined. Laboratory developed tests (LDTs), RHD BeadChip™, RHCE BeadChip™ and sequencing were used to determine RHD‐CE genotypes among 29 patients and 1798 African Brazilian blood donors. We considered the total of red blood cell units requested for each patient and a number of 2 donations per year to evaluate the number of potentially compatible donors.
Results/Finding: We evaluated 61 transfusion requests from 29 patients, 17 had anti‐hrB, two anti‐hrS and 6 both anti‐hrB and anti‐HrB, also, 4 had other Rh alloantibodies. We found different combinations of RHCE variant alleles predicting partial antigens or lack of high prevalence antigens such as hrB– and hrS– in these patients but the most frequent alleles were RHCE*ce48C,733G, RHCE*(C)ce Sand RHCE*ceAR. Although these RH alleles were also found in our donors, the number of donors with homozygous RH genotypes were insufficient to fulfil all the transfusion requests.
Conclusion: Although the most common hrB‐ and the (C)ce S alleles associated with RH genotype match requests are not uncommon in our donors, the ability to identify units to fill the transfusion requests is challenging. Filling requests for hrS‐ units is specially challenging as this phenotype is much less frequent in our donors. The development of a strategy to screen more donors and to optimize the identification of donors with RH variant alleles is critical to support our SCD patients with RH genotype matched units.
IGT23
Novel Soluble CD38 for Efficient Neutralization of High Titer Anti‐CD38 Antibodies
Matteo Binda1, Vincenzo Favaloro2, Norbert Piel2, Jody D. Berry2 and Peter Schwind*1
1Medion Grifols Diagnostics, 2Grifols Diagnostic Solutions Inc.
Background/Case Studies: Novel anti‐CD38 drugs used in treatment of multiple myeloma, such as daratumumab (DARA), interfere with diagnostic screening and identification of unexpected antibodies. They cause pan‐reactivity of Reagent Red Blood Cells (RRBC), which complicates the detection of underlying allo‐antibodies of potential clinical relevance. At the moment there are few strategies to overcome this problem, however with several drawbacks. The aim of this study was to evaluate the diagnostic use of a novel recombinant CD38 with particular emphasis on dilution effects of this soluble CD38 (sCD38) on detection of unexpected antibodies.
Study Design/Method: A fusion protein containing the extracellular domain of CD38 was expressed in mammalian cells and purified as sCD38. For evaluation of diagnostic functionality, anti‐CD38 spiked donor plasma (containing allo‐antibodies or not) were mixed with varying volumes/concentrations of sCD38 (or PBS as control) and incubated for 15 minutes at 37°C. Antibody detection was then performed by Indirect Antiglobulin Test (IAT) in conventional tube technique or DG Gel technique.
Results/Finding: A ratio of 2 µl and 4 µl of recombinant sCD38 at nominal concentration of ∼30mg/ml per 25 µl of plasma, allowed for complete inhibition of anti‐CD38 (respectively 0.5mg/ml and 1mg/ml). After inhibition, spiked allo‐antibodies (anti‐D, ‐E, ‐c, ‐Cw, ‐K, ‐Fya, ‐Jka, ‐S, ‐s, ‐M, ‐Lua, ‐Cob) at barely detectable amounts into DARA‐spiked donor plasma could be readily detected in 16/16 samples. In contrast, as demonstrated in DG Gel technique, after incubation with 20 µl and 200 µl of diluted preparations of sCD38, respectively 15/16 and 3/16 of the same simulated DARA plasma spiked with antibodies could still be detected.
Conclusion: The presented results show the inhibition of therapeutic plasma concentrations of daratumumab using a novel sCD38 at small volumes without interference in alloantibody detection. Additionally, these data confirm that successful neutralization and subsequent antibody detection requires highly concentrated sCD38. After neutralization, the plasma can be screened with available routine techniques, such as tube and gel technique. Enabling complete anti‐CD38 inhibition, while minimally diluting the plasma with sCD38, the highly concentrated sCD38 presented in this work may provide, in combination with IAT, a rapid and accurate screening and identification method of even weakly reacting allo‐antibodies masked by anti‐CD38.
IGT24
A Novel GP(E‐B) Molecule with Protease Resistant M Antigen
Hatsue Tsuneyama*1, Kenichi Ogasawara2, Naoko Watanabe‐Okochi1, Kazumi Isa2, Yumi Suzuki1, Ryuichi Yabe1, Nelson‐Hirokazu Tsuno1, Kazunori Nakajima1 and Makoto Uchikawa1
1Kanto Koshinetsu Block Blood Center, Japanese Red Cross, 2Central Blood Institute, Japanese Red Cross
Background/Case Studies: MNS blood group antigens are present on the extracellular domain of glycophorin A (GPA) and glycophorin B (GPB). M/N antigens are expressed on GPA, and S/s antigens are expressed on GPB. On the other hand, Glycophorin E (GPE) is not expressed on erythrocyte membranes. The glycophorin family genes called GYPA, GYPB, and GYPE are located on chromosome 4 and have a high homology to each other. Normal M antigen is sensitive to protease, but some protease‐resistant M antigens (PRM) are identified such as Sta (GP.Zan) and En(a‐)UK. In 1991, Kikuchi and Uchikawa et al. reported a novel PRM with a low molecular weight. In this study, we performed immunochemical, serologic, and molecular genetic analysis of the novel PRM antigen, and confirmed that PRM was present on GP(E‐B) hybrid molecule.
Study Design/Method: PRM screening of 193,009 blood donors was performed at Japanese Red Cross Kanto Koshinetsu block blood center from June to November 2015. MNS blood type was determined by automated blood grouping machine (PK7300) with monoclonal anti‐M (CBC‐1 + CBC‐2) and the red blood cells (RBCs) suspended in a 0.02% bromelin solution. When positive reaction was observed, M, N, S and s antigens were examined by the standard tube method. RBC membrane proteins were analyzed by immunoblotting with anti‐M (CBC‐3). Flow cytometric analysis of S/s antigens on RBCs was performed with polyclonal anti‐S and anti‐s. To identify the molecular mechanism for the novel PRM antigen, reticulocyte mRNA and genomic DNA from a PRM‐positive donor were analyzed by PCR and cloning followed by sequencing. Genomic fragment spanning from M‐specific sequence in exon 2 to downstream of exon B5, and upstream of exon B1 to downstream of exon E3 were amplified from gDNA by PCR, and sequence it.
Results/Finding: RBCs of 146 among the investigated 193,009 individuals were agglutinated with anti‐M even after bromelin treatment. In the immunoblotting with anti‐M, 103 in 146 individuals showed a strong abnormal band with a molecular weight of approximately 20 kDa which is lower than GPB. This band did not react with an antibody recognizing extracellular and cytoplasmic domain of the GPA, and anti‐N, anti‐S and anti‐s. Among the 103 individuals, 54 were typed as M+N− and 49 were M+N+, while none of these individuals was S+s+. Five individuals were S+s− and other 98 individuals were S−s+, however, both of the S and s antigen densities of their RBCs were almost half as compared with the control S+s− RBCs and S−s + RBCs, respectively, by flow cytometric analysis. Among the 103 individuals, no expression of low incidence antigens such as Miltenberger and Sta was observed. Cloning and sequence analysis using cDNA revealed that an individual with PRM comprised exon A2 or E2 with M specific sequence fused to exon B5‐B6. Long‐range PCR amplified a large fragment of GYPB from gDNA showed that E2, E3 and E4 replace B2, B3 and B4 in the GYP(B‐E‐B) hybrid allele. E‐B junction occurred 795 to 1247 bp upstream of exon B5.
Conclusion: PRM is predicted to be encoded by a GYP(B‐E‐B) hybrid gene. The primary structure of the polypeptide encoded by this hybrid gene comprise amino acids residues 20‐45 (1‐26) of GPE fused to residues 46‐78 (27‐59) of GPB. This polypeptide expresses M antigen but not S/s antigens.
IGT25
Development of a Next Generation Sequencing Based ABO Blood Group Assay and Typing Software
Abigail Joseph*1, Helen H. Mah1, John Baronas1, Judith Aeschlimann2, Sunitha Vege2, Leslie E. Silberstein1,3, Richard M. Kaufman1,3, Connie M. Westhoff2 and William J. Lane1,3
1Department of Pathology, Brigham and Women's Hospital, 2Immunohematology and Genomics Laboratory, New York Blood Center, 3Harvard Medical School
Background/Case Studies: ABO typing of recipients and donors is important for optimal transfusion and transplant outcomes. Although, serologic ABO typing is highly reliable, it can be limited by discordant forward and reverse typing. In addition, living solid organ and stem cell donor evaluations often only involve a buccal swab, preventing upfront serologic ABO typing. A combination of DNA based genotyping solutions can be used to help resolve serologic ABO discordances as well as screen transplant donors for ABO, but these methods are labor‐intensive and require interpretation by subject matter experts. We sought to develop a targeted ABO next generation sequencing (NGS) assay, along with companion interpretive software, for automated data processing and ABO typing for known ABO alleles.
Study Design/Method: Targeted long range PCR based DNA enrichment of the ABO gene was achieved by evaluating a series of PCR primer combinations using both blood and buccal swab isolated DNA. The PCR products were run on agarose gel and Agilent bioanalyzer to determine product size and quality. Promising PCR products then underwent Illumina TruSight NGS library preparation and sequencing using an Illumina MiSeq. Investigators previously created a curated allele database (http://bloodantigens.com) and custom bloodTyper interpretive software to determine blood groups from whole genome sequencing data. These previous efforts were improved upon by further curating the ABO alleles and by adding NGS sequence read based cis/trans phasing to the bloodTyper software to determine full ABO allele haplotypes.
Results/Finding: PCR primer evaluation showed reproducible PCR products spanning ABO exons 2‐7 in blood samples and 6‐7 for buccal swabs, which yielded good quality NGS data. These exons encode the major ABO specificities including ABO subtypes (A2, Ax, B3, weak antigens (Aw, Ael), and hybrid alleles (cisAB, B(A)). To verify the ABO NGS assay, a combination of 100 blood and buccal swab samples were tested and found to be 100% concordant with serologic ABO typing and Sanger sequencing of weak, subtype, and hybrid allele samples. We found that in most cases that targeted ABO NGS results could be fully resolved to a cis/trans phased genotyping allowing for unambiguous allele determination by the interpretative software.
Conclusion: A targeted ABO NGS based assay was developed and optimized for blood and buccal swab isolated DNA. Companion interpretive software, which automates NGS ABO analysis, was developed and correctly determined the ABO type when compared with serology and Sanger sequencing. This assay and software interpretation represents a new and improved standard for DNA based ABO testing, allowing for ABO typing when no blood sample is available, and resolution of of weak, subtype, and hybrid ABO alleles.
IGT26
The Evaluation of Recombinant Blood Group Proteins in Pre‐Transfusion and Antenatal Testing
Aisling Costelloe*, Barry Doyle and Diarmaid O'Donghaile
Irish Blood Transfusion Service
Background/Case Studies: Recombinant blood group proteins (rBGPs) are soluble proteins derived from eukaryotic expression systems which mimic red cell blood group antigens. This study evaluates rBGPs for their potential use in a Red Cell Immunohaematology (RCI) laboratory, in the elucidation of complex antibodies in pre‐transfusion and antenatal testing. Current laboratory methods used to resolve complex cases such as; multiple antibodies, antibodies to high frequency antigens or antibodies that are high titre low avidity (HTLA) in nature can be cumbersome. These investigations require a great deal of operator expertise and may lead to delays in the provision of suitable red cell units for transfusion. Previous studies involving rBGPs have shown their significant potential in reducing turnaround times for antibody investigation and subsequent provision of red cell units for patients with complex antibodies. This study evaluates the usefulness of rBGP in a RCI laboratory.
Study Design/Method: 43 samples containing complex antibodies were tested using the appropriate rBGP (imusyn). The inhibition assay was used as per manufacturer's instructions. Plasma was incubated with rBGPs to inhibit specific antibodies to the cognate blood group antigen. This was followed by an indirect antiglobulin test by BIORAD gel card method.
Results/Finding: Out of 43 samples tested, 21 contained HTLA type antibodies and 11 of these were successfully inhibited (52.4%) using rBGP. Out of 11 samples containing antibodies to high frequency antigens, 8 were successfully inhibited (72.7%). Other lower frequency antibodies were also tested using rBGP and results are included in table 1.
Conclusion: Recombinant blood group proteins are a novel and effective way of managing samples in pre‐transfusion and antenatal testing. The inhibition assay is a quick and straightforward method facilitating fast antibody identification. This allows for rapid, effective provision of suitable units to patients requiring transfusion and also in the stratification of risk due to antibodies implicated in HDFN. Two notable cases were observed whereby rBGPs allowed for prompt identification of specificities including an anti‐Dob and a CR1‐related antibody, thus facilitating provision suitable units expediently. Of note a high percentage of HTLA type antibodies did not inhibit successfully, however, it should be noted that accurate assignment of specificity can be ambiguous with these types of antibodies.
TABLE 1 Inhibition of red cell antibodies using rBGP
| rBGP Used | No. tested [n=] | No. Inhibited [n=] | |
|---|---|---|---|
| High Titre Low Avidity (HTLA Antibodies) | sCR1 | 10 | 5 |
| sJMH | 5 | 0 | |
| sCh | 4 | 4 | |
| sRg | 1 | 1 | |
| sKna | 1 | 1 | |
| Antibodies to high Frequency Antigens | sLub | 2 | 1 |
| sYta | 4 | 3 | |
| sInb | 4 | 3 | |
| sk | 1 | 1 | |
| Other antibodies | sDob | 1 | 1 |
| sFya | 5 | 4 | |
| sFyb | 2 | 0 | |
| sK | 3 | 3 |
IGT27
Thalassemia Patient Classification: HBB and HFE DNA Profiles by LeanSequencing
Asim Qidwai1, Kristopher Fernandez2 and Ghazala Hashmi*2,3
1Afzal Memorial Thalassemia Foundation, 2BioMolecular Analytics, 3SKH Foundation
Background/Case Studies: Blood transfusion therapy is the standard of care for managing anemia in thalassemia patients which, in many recipients, leads to accumulation of excess iron. Hemochromatosis is an inherited iron storage disorder that increases the risk of developing iron overload as mutations in the HFE (“high‐Fe”) gene impair the molecular mechanism for removing excess iron. While thalassemia patients are routinely characterized for mutations in the HBB gene encoding beta‐globin, screening for HFE mutations currently is not part of the “work‐up”. To explore the prevalence of HFE mutations in chronically transfused pediatric and adolescent thalassemia patients in Pakistan, we evaluated DNA profiles for HBB and HFE gene mutations, with the objective of improving thalassemia patient management.
Study Design/Method: 155 pediatric and adolescent β‐thalassemia patients treated at the Afzal Memorial Thalassemia Foundation (AMTF) hospital were screened, in a single assay, using a novel LeanSequencing process developed at BioMolecular Analytics. Our panel included a set of thalassemia (‐619 bp deletion, cd 8/9 + G, IVS1‐1 G>T, IVS1‐1 G>A, IVS1‐5 G>C, 41/42 – TTCT, IVS1‐6 T>C, ‐88 C>T, ‐29 A>G, and IVS1‐110 G>A), sickle cell (Hb S, C and E) and hemochromatosis (HFE C282Y, H63D, S65C) mutations. Duplicate barcoded buccal swab samples were collected and crude extract was prepared without any DNA purification (Patel, et al., 2017). Crude extract was amplified in a multiplexed PCR reaction for both HBB and HFE genes and analyzed by LeanSequencing. We also analyzed the same group of patients for an extended set of red blood cell antigens, and present those data elsewhere in these proceedings.
Results/Finding: 5% of patients were homozygous, and 28% were heterozygous, for HFE mutation H63D; all were normal for C282Y and S65C. As to HBB, IVS1‐5 G>C was the most common mutation in this group (33% homozygous, 9.6% compound heterozygous with mostly codon 8/9 + G, IVSI 1 G>T and Hb E); also common was codon 8/9 + G (22.4% homozygous, 12% compound heterozygous with, IVS1‐5 G>C, IVS1‐1 G>T or 41/42 – TTCT); 3.2% patients identified with ‐619 bp deletion, and 6% homozygous and 1% heterozygous for 41/42 – TTCT; 2 % of the patients were “compound het” for the Hb E sickle cell mutation; all patients were normal for Hb S and Hb C mutations.
Conclusion: HFE gene mutations are not uncommon in Pakistani thalassemia patients. The routine screening for these mutations would provide additional input in designing individualized proactive transfusion therapies, especially for pediatric patients, namely by routinely providing cells selected in accordance with the patients’ extended rbc antigen profiles: to minimize the risk of alloimmunization, and by reducing the prevalence of this condition, which has been reported to increase the frequency of transfusion, to likewise reduce the risk of iron overload. The LeanSequencing mutation panel described here has the potential to facilitate the routine assessment of patients, and also may prove beneficial for large‐scale thalassemia carrier screening.
IGT28
Jk Discrepancies (DNA Versus Serology) Leading to Identification of Two Novel Alleles
Sunitha Vege*1, Judith Aeschlimann1, Kim Hue‐Roye1, Jamie Chai1, Randall W. Velliquette1, Christine Lomas‐Francis2 and Connie M. Westhoff1
1Immunohematology and Genomics Laboratory, New York Blood Center, 2New York Blood Center
Background/Case Studies: Discrepancies between test methods, whether automation versus tube or serology versus DNA, have led to the identification of novel JK alleles. More than thirty alleles coding altered or silenced expression of Jk in multiple ethnicities are known. We investigated JK in a donor with a Jkb serologic discordance between current and historical type and in a patient with Jk(a−) phenotype differed from Jk(a+) prediction by DNA.
Study Design/Method: RBC typing was performed by standard tube methods with monoclonal anti‐Jka (clone MS15) and ‐Jkb (clone MS8). Genomic DNA was isolated from WBCs. HEA PreciseType was performed for the patient. JK coding exons were amplified and sequenced.
Results/Finding: Sample 1 was from a South Asian male donor. RBCs on the current donation typed Jk(b+) but historical records indicated Jk(b−). By tube testing, his RBCs were weakly reactive with Immucor anti‐Jkb and non‐reactive with Bio‐Rad Seraclone anti‐Jkb. RBCs also were Jk(a+). From sequence results, the sample was heterozygous for c.838G>A (p.Asp280Asn), predicting Jk(a+b+). In addition, a novel change, c.998T>C that encodes p.Val333Ala was identified. The c.998C change by Exome Aggregation Consortium (ExAc) is rare with a frequency of 0.003% (rs774982134). Sample 2 was from a 76 year old Caucasian female patient. The RBCs typed Jk(a−) but HEA PreciseType predicted Jk(a+). Additional testing found the RBCs were non‐reactive with Immucor and Bio‐Rad Seraclone anti‐Jka. RBCs also typed Jk(b+). JK sequencing of exon 9 confirmed JK*A/*B, but also revealed a novel change, c.935C>A (p.Ala312Asp), which was not found in the dbSNP or ExAc databases. Sequencing with SNP‐specific primers linked the new change to JK*A.
Conclusion: We report two new JK alleles; JK*B with c.998T>C (p.Val333Ala), and JK*A with c.935C>A (p.Ala312Asp). While c.998T>C has not been previously reported, a similar change c.998T>A encoding a different amino acid change p.Val333Asp, in conjunction with c.1095T>C (silent) was reported in two Swiss donors with Jkb detected only by adsorption/elution [Henny et al, 2014 Vox Sang 107(S1)]. The Val333Ala change is predicted to be located close to membrane (T5b) of the protein [Ramsey et al, 2017 Transfusion 57(3)] but it is not known if it encodes a partial Jkb. JK*A with c.935C>A was identified in a patient whose RBCs typed Jk(a−) with multiple reagents. The Ala312Asp is predicted to be located in the transmembrane (T4b) [Ramsey et al, 2017 Transfusion 57(3)] and its impact on protein expression is difficult to predict. The sample was insufficient for adsorption/elution studies to determine if the allele encodes a Jka null phenotype or low level of Jka antigen. With the number of discordances identified between serology and DNA, these studies show the combined power of serologic and molecular typing when testing patients and donors.
IGT29
A Survey of the ABO Alleles Associated with Weak Anti‐A1 Lectin Reactive RBCs
Waseem Q. Anani*1,2, Kathleen M. Bensing2, Michael Schanen2, Cindy Piefer2, Madeline Knier2, Emily Roeger2 and Gregory A. Denomme2,3
1Department of Pathology, Medical College of Wisconsin, 2Immunohematology Reference Laboratory, Versiti/BloodCenter of Wisconsin, 3Blood Research Institute, Versiti/BloodCenter of Wisconsin
Background/Case Studies: The identification of Group A2 solid organs by evaluating red blood cells (RBCs) allows ABO incompatible (ABOi) transplants to Group O and B recipients. The A2 classification is determined using anti‐A1 lectin manufactured from an extract of Dolichos bifloris seeds, which is diluted to differentiate human Group A1 RBCs from non‐A1 subgroups. Weak reactivity can be observed with RBCs using either of two FDA‐licensed reagents. The manufacturers of these reagents state that weak reactions can occur with A2 or A2B RBCs. To understand the implications of weak anti‐A1 lectin RBC typing and an A2 subgroup classification, we evaluated the incidence of weak hemagglutination with two licensed anti‐A1 lectin reagents, and the associated ABO alleles using genomic DNA sequencing of exons 6 and 7.
Study Design/Method: Anti‐A1 lectin typing was performed using two licensed reagents in accordance with the manufacturers’ protocols and validated using known A1 and A2 reagent RBCs. Weak reactivity was defined as ≤1 + hemagglutination with either anti‐A1 lectin reagent. All samples were ABO grouped using standard licensed antisera and A1 and B RBCs. Genomic DNA was extracted and subjected to ABO exons 6 and 7 sequencing using intron flanking primers for exon 6 and two overlapping fragments for exon 7. Standard Sanger dideoxy sequencing was performed using the BigDye Terminator v3.1 Cycle Sequencing Kit. Sequence data was aligned to ABO_NG_006669.1
Results/Finding: The incidence of weak anti‐A1 lectin reactivity was approximately 33% among blood donors. Sixteen Group A blood donors were identified along with one Group A living kidney donor. The living donor had a history of being deemed A2 for the purposes of an ABOi transplant, and with the kidney acutely rejected on day 4 in a Group O recipient. The RBCs of the living kidney donor were 1 + reactive with anti‐A1 lectin. All donors were heterozygous ABO*c.(261G/delG) suggesting the inheritance of one ABO*O allele. Sixteen of 17 were heterozygous ABO*c.(1061C/delC), with the live kidney donor homozygous ABO*O.c(1061delC/delC). An ABO*A1.01 or A1.02 paired with an ABO*O22(c.261delG; 467T; 1061delC) could be ruled out given none of the samples were weakly reactive with a licensed anti‐A. Thus, three ABO*A2 alleles could be assigned from the sequence data: 15 ABO*A2.01, one ABO*A2.06, and one ABO*A2.09. The ABO*A2 alleles were paired with 10 ABO*O01, one ABO*02 or ABO*O13, one ABO*011, one ABO*026, one ABO*O44, and three unassigned ABO*O alleles. The controls consisted of three Group A donors with RBCs having 4 + hemagglutination, along with two Group A donors and one AB donor with RBCs that were nonreactive when tested using both anti‐A1 lectins. Sequencing the control samples revealed a three consensus ABO*A1.01, three ABO*A2.01, and one ABO*B1.01.
Conclusion: Weak equivocal results with anti‐A1 lectin are relatively common among donors. Analysis of ABO exons 6 and 7 sequencing data revealed that ABO*A2.01 is the most common allele, but did not reveal nucleotide changes associated with weak anti‐A1 lectin reactivity. Weak reactivity with anti‐A1 lectin is linked to other ABO*A2 alleles; namely ABO*A2.06 and ABO*A2.09 in this small survey. The expression of Group A carbohydrate chains among ABO*A2 alleles has not been systematically evaluated. Acute rejection of an ABO*O2.06 kidney in an ABOi recipient suggests that additional biochemical studies are warranted.
IGT30
1333G>A and 1813G>A Mutations of ITGB3 Have No Effect on HPA Antigenicity
Sudan Tao*1,2, Ji He1,2, Faming Zhu1,2, Wei Hu1,2, Xiaofan Zheng2, Huaping Zhou1,2 and Feng Chen2
1Zhejiang Provincial Key Laboratory of Blood Safety Research, 2Blood Center of Zhejiang Province
Background/Case Studies: Human platelet antigens (HPAs) are implicated in fetomaternal alloimmune thrombocytopenia (FMAIT), platelet (PLT) refractoriness, and post transfusion purpura. Untill now, 28 types of HPAs have been identified and approximately half of HPAs were reported caused by ITGB3 gene mutations. Three single‐site mutations in ITGB3 genes, 1333G>A, 1476G>A, and 1813G>A were identified in our lab, which caused Val419Met, Trp466‐stop, and Gly579Ser substitution, respectively. But all the mutations were heterozygous in three individuals unable to determine the effect of point mutation on HPA antigenicity, directly. In this study, recombinant expression plasmids of wild‐type GPIIIa and the three variants were constructed in vitro, the recombinant protein were extracted and coupled to Luminex beads to test platelet antibodies using Luminex xMAP technology to determine whether the three point mutations of ITGB3 have effect on HPA antigenicity.
Study Design/Method: Full‐length cDNA of wild‐type, 1333G>A, 1476G>A, and 1813G>A ITGB3 were amplified and ligated into pcDNA3.1 vector. The ligated ITGB3 plasmids were transfected into Chinese hamster ovary cells (CHO), respectively. Stably expression cells of CHO‐ITGB3W, CHO‐1333G>A, CHO‐1476G>A, and CHO‐1813G>A were selected by G418 screening. The proteins were extracted and confirmed by western blot using 6 × His Tag antibodies. Then, all the proteins were coupled to micro beads, respectively. The coupled beads were validated by anti human IgG. 36 serum samples were tested using the coupled beads. The beads reacted with serum samples respectively, and bead‐antigen‐antibody complexes were then subjected to flow cytometric analysis on a Luminex100. The HPA‐1a standard serum was used as positive control; three negative sera without HPA antibodies were prepared from AB type blood donors were used as negative control.
Results/Finding: Western blot analysis revealed that the established CHO‐1333G>A and CHO‐1813G>A cell lines expressed GPIIIa molecules having the same molecular weight as WT, while the similarly protein was not identified in CHO‐1476G>A cell because of its premature stop mutation. The Luminex MFIs showed that the three beads coupled with GPIIIa proteins (WT, 1333G>A and 1813G>A), respectively, exhibited similar results when reacting with same sarum, which implied that the new mutation of 1333G>A and 1813G>A did not affect the antigenicity of HPAs. Of the 36 serum samples, one was positive for HPA‐1a, which was consistent with the results measured by monoclonal antibody immobilization of platelet antigens (MAIPA) assay.
Conclusion: Here we reported the recombinant expression of four GPIIIa molecular, and found that 1476G>A mutation affected the expression of protein. Luminex beads were used to couple recombinant proteins to detect HPA antibody, showing that 1333G>A and 1813G>A mutations have no effect on antigenicity of HPA compared with wild type. The result was consistent with MAIPA assay. This work was sponsored by National Natural Science Foundation of China (81371905), and Science Research Foundation of Zhejiang Healthy Bureau (WKJ‐ZJ‐1509).
IGT31
Evaluation of a Workflow to Manage Inconclusive Solid Phase Reactivity
Heather Simmons*, Martha R. Combs, Nicholas Bandarenko and Jessica Poisson
Duke University Hospital
Background/Case Studies: Inconclusive reactivity in solid phase (SPRCA) antibody screens and identifications led to the development of the following workflow to efficiently manage pretransfusion samples in a large academic tertiary care center. When an automated 3‐cell SPRCA screen was panreactive or < 3 + with 1 or 2 of the screening cell samples, the antibody screen (ABSC) was repeated in polyethylene glycol (PEG) tube if the patient had no history of antibodies. If the PEG ABSC was negative, the ABSC was interpreted as negative; the patient may be eligible for computer crossmatch compatible blood. The risk of moving to PEG tube testing is the failure to identify an antibody reactive only in SPRCA. This study quantified how often this workflow was used and antibody detection failures and their consequences.
Study Design/Method: Retrospective review of ABSC results was performed from January 2016 through December 2017. SPRCA was performed with the Immucor Ready Screen (Norcross, Ga, USA). Results corrected to a negative PEG ABSC were identified and reviewed for antibody identification (AB ID) in subsequent antibody screens. Clinically insignificant allo‐ and autoantibodies were excluded. Details of further immunohematology workups were collected, including transfusion reactions. Direct antiglobulin tests (DAT) and acid eluates were tested by tube and PEG tube method, respectively.
Results/Finding: Out of 161971 ABSC performed, 857 negative PEG ABSC were identified. New antibodies were found in 130 samples (15.2% of PEG ABSC). Twenty seven patients with 31 new significant alloantibodies (3.2% of PEG ABSC) were identified. Anti‐ Jka was the most commonly detected antibody (Table 1). Twenty‐three (74%) of these antibodies were detected within 4 weeks of the initial corrected PEG ABSC. Eleven patients received RBC transfusion between corrected result and new AB ID. At the time of AB ID, 6 had DAT results, 3 of which were positive. Acid eluates were negative for all 3 positive DATs. One delayed transfusion reaction was identified out of the 27 patients; however the transfusion preceded a positive SPRCA screen.
Conclusion: The workflow to defer to PEG ABSC missed 3.2% of clinically significant alloantibodies. The serologic and clinical consequences were rare as transfusions were infrequent between initial corrected screen and the detection of alloantibody. The benefit of the workflow was labor and supply savings for the 826 positive SPCRA screens where no significant antibody was identified. To address concerns of missed antibodies, the threshold for moving to PEG ABSC was adjusted to results < 2 + with 1 or 2 cell samples in SPRCA screening.
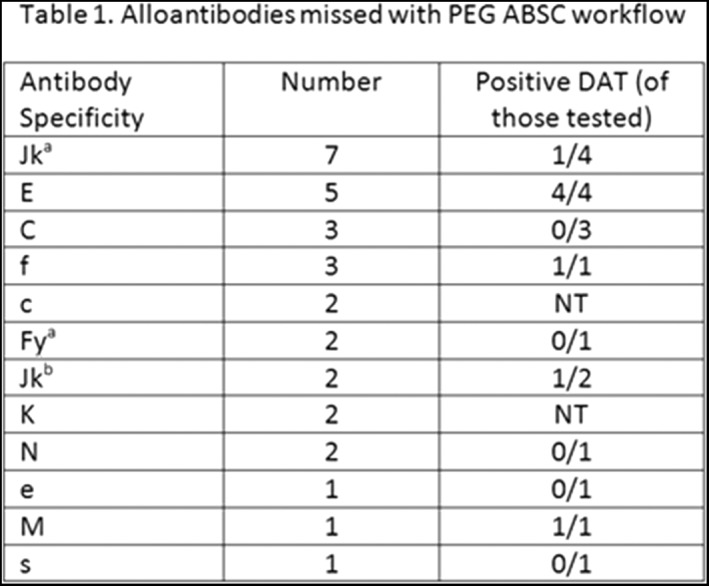
IGT32
Severe DHTR in a Highly RBC‐Alloimmunized Non‐Sickle Cell Patient: Management and Report of a Clinically Significant New HI Antibody Associated with an Uncommon Mutation in the Dombrock Antigen System
Marilyn C. Virgo*1, Lorraine Wyne1, Patricia A.R. Brunker2, Sandra J. Nance3, Hallie Lee‐Stroka2, Patricia Martineau2, Sakhone B. Learn4, Trina Horn5, Margaret A. Keller5 and Cathy Conry‐Cantilena6
1MedStar Washington Hospital Center, 2American Red Cross Biomedical Services ‐ Greater Chesapeake and Potomac Region, 3American Red Cross and American Rare Donor Program, 4American Red Cross, 5American Red Cross ‐ National Molecular Laboratory, 6National Institutes of Health
Background/Case Studies: Delayed hemolytic transfusion reactions (DHTR) are due to RBC alloantibody‐mediated RBC lysis. Descriptions of severe DHTR in non‐sickle cell disease (SCD) patients are scarce. A life‐threatening DHTR in a nearly untransfusable patient (pt) associated with a novel, clinically important high incidence (HI) antibody in the Dombrock (Do) system is described here.
Study Design/Method: A 68 y/o O positive African‐American G3P3 woman without SCD but prior surgeries had multiple RBC alloantibodies(anti‐C, E, Fya, Jkb, Lea, M, S, Jsa, possible anti‐K, Leb, Fyb) with negative DAT when admitted for a NSTEMI. After percutaneous coronary intervention, treatment with aspirin, enoxaparin, and ticagrelor, Hgb dropped from 8.4 to 6.4g/dL with hematemesis and hypotension. 2 O negative RBCs were emergently transfused (Day 0), despite a positive antibody screen. An upper GI bleed (GIB) was confirmed endoscopically but appeared resolved. Hgb rose to 8.2g/dl, EPO and IV iron were added, but GIB recurred (Day 10) requiring gastrectomy as Hgb dropped from 5.6 to 3.9g/dl. DAT was now positive: an unidentified HI antibody in the Do system became serologically apparent. Monocyte Monolayer Assay testing of the HI antibody revealed 8‐31% reactive monocytes (normal < 3%) suggesting accelerated clearance of HI + RBCs. An additional 4 saline compatible and 7 least incompatible RBCs units were transfused over 15 days due to hemolysis and surgical loss. Labs on icteric serum revealed total bilirubin 3.2mg/dL, LDH 3645 U/L, haptoglobin < 8mg/dL, creatinine 6.8mg/dL. Treatment with IVIG, eculizumab and rituximab began (Day 16). After 22 days without transfusion (Day 38), she was discharged with Hgb 7.6g/dL.
Results/Finding: The HI antibody was non‐reactive with Holley (Hy)‐negative RBCs; however, an anomalous Do antigen was suspected because the pt was heterozygous for c.323 (G108V), the variant responsible for Hy antigen expression. Genomic sequencing ART4 exon 3 revealed heterozygosity at a nonsynonymous SNP at c.898 (rs3088190; L300V). This variant has been reported on HY1 as well as in a DOMR‐proband. No other SNPs characteristic of DOMR were identified. Phasing of the c.323 and c.898 variants identified has not yet been determined. The L300V variant may alter the Hy antigen which could explain the serologic findings.
Conclusion: Severe DHTR in a non‐SCD pt is unusual. Recognition and treatment in a nearly untransfusable pt requires daily clinical communication. This is the first well‐described example of a highly clinically‐significant antibody in a pt with the poorly‐characterized L300V ART4 variant, likely modifying Hy strength and perhaps responsible for a novel HI antibody.
IGT33
Successful Lung Transplantation into Recipients with Anti‐A1 Antibodies
Gustaaf de Ridder*1, Brandi Bottiger2, Lorenzo Zaffiri3 and Jessica Poisson1
1Duke Health Pathology, 2Duke Health Anesthesiology, 3Duke Health Medicine‐Pulmonary
Background/Case Studies: Anti‐A1 ABO antibodies are detected in blood type A2 or A2B lung transplant patients occasionally. The frequency, timing of detection, persistence, and description of clinical outcomes in the presence of these antibodies has not been reported.
Study Design/Method: A single center, retrospective review of all lung transplant recipients with anti‐A1 antibodies from January 2015 to December 2017 was performed. All available, relevant clinical, pathologic, transfusion, and serologic data were collected from the electronic medical record.
Results/Finding: Four recipients with anti‐A1 were identified among 297 total lung transplants. A description of patient and procedural characteristics of the four recipients can be seen in Table 1. The lung allocation scores ranged from 27‐76 d. All recipients were ABO Type A2, RhD+, and one had an additional anti‐I cold agglutinin. Lung donor ABO types were A1 (2), A, and O. Anti‐A1 was present before transplant in 2/4 and after transplant in 2/4 recipients. The persistence and strength of the anti‐A1 in the recipients varied greatly (Table 1). Intraoperative transfusion support was minimal for three patients (3, 3, and 0 total products); the fourth required massive resuscitation with >100 products Two patients were treated for suspected humoral rejection; one for new donor‐specific HLA antibodies and one empirically based on radiologic and spirometric findings. The length of stay ranged from 21‐80 d. On transbronchial biopsies, two patients had acute cellular rejection (ACR) on a single biopsy (one A1B1R, one A1B0), one patient had two A1BX biopsies, and one patient had no ACR. With follow‐up ranging 6‐23 mo., all patients are living and all grafts are viable.
Conclusion: Lung transplant across the A1/A2 blood group mismatch occurs on occasion, and the appearance of an anti‐A1 antibody prior to or after transplant does not appear correlated with graft dysfunction, cellular, or antibody‐mediated rejection in this case series. The patient with the strongest, most persistent anti‐A1 antibody titers required massive transfusion, but also had a cold agglutinin and active infection. Longer follow‐up in larger, multicenter trials is needed to better understand outcomes and anti‐A1 titers for confirmation.
TABLE 1 (IGT33) Patient Characteristics
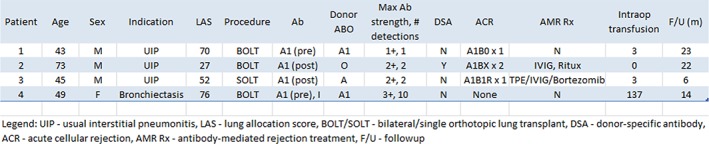
|
IGT34
En(IND), a Single‐Nucleotide‐Insertion GYPA Variant Causing Absence of Glycophorin A
Paul F. Lindholm1, Jessica S. Drouillard2, Karyn Hartman3, Sunitha Vege4, Christine Lomas‐Francis5, Connie M. Westhoff4, Alexander J. Carterson2 and Glenn Ramsey*1
1Northwestern University, 2Heartland Blood Centers, 3Northwestern Medicine, 4Immunohematology and Genomics Laboratory, New York Blood Center, 5New York Blood Center
Background/Case Studies: En(a−) RBCs have complete or nearly complete absence of glycophorin A (GPA). Two En(a‐) MNS blood group variants were described in the 1980's: the M‐N‐ Finnish type with deleted GYPA exons 2‐7 (En(FIN)), and the Mweak N‐ UK type, a GP(A‐B) hybrid with a very short N‐terminus exon‐2 GPA segment (En(UK)). En(a‐) RBCs have decreased sialic acid and loss of Wrb expression on GPA‐band 3. Anti‐Ena can cause hemolysis of allogeneic RBCs. En(a‐) donors are extremely rare worldwide and additional genetic information is highly desirable.
Study Design/Method: Serological tests were performed by routine methods. DNA‐based blood group phenotyping employed the PreciseType™ HEA (Immucor, Norcross, GA). GYPA was analyzed by long‐range amplification and sequencing of exons 2‐7.
Results/Finding: A 59‐yo woman was evaluated for a history of broad RBC incompatibility at age 14 at cholecystectomy and at age 36 with uterine hemorrhage after miscarriage of her only pregnancy. She was never transfused. She was born in Lahore, Pakistan, but her parents were remote cousins from Allahabad, India. She was group B, D + with plasma pan‐reactivity in solid‐phase (4+), polyethylene glycol (3 + anti‐IgG), low‐ionic saline solution (1 + 37C, 3 + anti‐IgG), and ficin‐RBC (2 + 37C, 3 + anti‐IgG) methods. Direct antiglobulin test was negative. Her RBCs phenotyped as M−N−S−s+, En(a−), Wr(a−b−) and were reactive with Glycine soja lectin indicating reduced sialic acid. Her plasma was nonreactive to En(a−) RBCs, consistent with anti‐EnaFR (ficin‐resistant). In the En(a‐) literature, a Pakistani‐born US patient was reported in 1995 (Immunohematol 11:51). Demographics, serology, extended RBC phenotypes, published history and patient discussion confirmed she was the subject of that report. RBC GPA was not detected by human or monoclonal antisera or by immunoblotting at that time, but genetics were not done. In our testing, HEA interrogation of GYPA exon 2 c.59 C>T predicted her phenotype was M+N‐. Genetic analysis confirmed a GYPA*M/M background with homozygosity for an insertion of nucleotide G at position c.314‐315 in exon 5. The insertion is predicted to cause a frameshift in the region coding for the transmembrane helical domain and a stop codon 19 amino acids downstream [c.314_315insG (p.Thr106Asnfs*19)] (GenBank MG874776). We propose the term En(IND) (for India) for this novel variant.
Conclusion: The En(IND) insertional GYPA variant is the first new genetic basis for the En(a‐) phenotype in 30 years and is undetected by the commonly used M/N‐locus probes. Ethnicity from northeast India is a previously unknown setting for this rare phenotype.
IGT35
A Novel Single‐Nucleotide Substitution in the ABO Promoter Gives Rise to the B3 Phenotype
Åsa Hellberg*1, Annika K. Hult1, Ines Moser2, Beatriz Tomaz3, Maria Rodrigues2 and Martin L. Olsson1,4
1Clinical Immunology and Transfusion Medicine, Division of Laboratory Medicine, Office of Medical Services, 2Immunohematology Reference Laboratory, 3Labeto, Centro de Análises Bioquímicas, 4Dept. of Laboratory Medicine, Lund University
Background/Case Studies: Most ABO subgroups express A or B antigens weakly on RBCs and are due to inherited alterations in the ABO gene, affecting either the efficacy, specificity or concentration of the A/B glycosyltransferase. Here, we report the investigation of ABO in a patient from Ukraine who showed a suspected mixed‐field appearance with dual populations of RBCs upon testing with anti‐B in routine serology.
Study Design/Method: Flow cytometric analysis and routine ABO genotyping including analysis of the upstream CBF/NF‐Y‐binding enhancer region (involved in determining transcription rate in certain tissues) was carried out. Further genetic analysis was performed by DNA sequencing of ABO exons 1‐7 (including 50 base pairs of the adjacent introns) and the proximal promoter.
Results/Finding: DNA analysis showed that the patient's genotype was ABO*B.01/O.01.10, which is normally consistent with group B. Sequence analysis of all ABO exons did not reveal any unexpected changes in the coding sequence to explain the weak phenotype and PCR analysis of the upstream CBF/NF‐Y‐binding enhancer region showed homozygosity for the expected four 43‐bp repeats consistent with the genotype. However, sequencing of the ABO promoter unravelled a substitution of G to A at position −72. Flow cytometric analysis showed no expression of A and normal H antigen levels but a biphasic, chimera‐like pattern was observed with anti‐B, although cells with an intermediate level of antigen expression were also present. This type of pattern has previously been reported for the A3 subgroup caused by mutations in the regulatory region located in intron 1. Investigation of the parents’ DNA showed that the mother was ABO*O.01.01/O.01.01 with no A/B expression on her RBCs while the father was ABO*A2.01/B.01 with c.−72 G>A in the promoter as well as displaying the same characteristic flow cytometric pattern with anti‐B. Taken together, the family investigation confirms c.−72G>A to occur on the B allele.
Conclusion: We found a previously unreported mutation, c.−72G>A, which is located in the same area of the ABO promoter as three previously described substitutions: c.−68G>T and c.−77C>G giving rise to the B3 phenotype as well as c.−76G>C resulting in the A3 phenotype. Both Takahashi et al. (Vox Sanguinis, 2014) and Isa et al. (Vox Sanguinis, 2015) have confirmed by luciferase assays that the c.−68G>T/c.−77C>G/c.−76G>C mutations reduce promoter activity in vitro. Thus, it is not unlikely that c.−72G>A acts via a similar mechanism to cause downregulation of B transcripts and thereby decreased expression of B antigen on RBCs. In fact, the −72G>A mutation is positioned close to a KLF7 site and in the absence of other deviations from the consensus B sequence, is proposed to explain the B3‐like phenotype in this family.
IGT36
Optimized Genotype‐Matched Red Cell Units in Sickle Cell Disease Patients
Sheila de Fátima Perecin Menegati, Tamires Delfino dos Santos, Mayra Dorigan de Macedo, Simone Gilli and Lilian Castilho*
Hemocentro Unicamp
Background/Case Studies: In order to provide more highly matched blood and to be cost‐effective for the treatment of chronically transfused patients with SCD we have implemented molecular matching in 3 levels: (1) RH and K matching; (2) extended matching (RH, KEL, FY, JK, MNS, DI) and (3) extended matching including RHD and RHCE variant alleles. Considering the total of red blood cell units requested for each patient and a number of 2 donations per year for the compatible donors, we are fulfilling the needs of patients in level 1 of matching and for most of patients in level 2 but when we considered RH variants it has been much more difficult to find compatible donors for patients with SCD. Besides of the challenges to fulfill all the requests with multiple negative antigens and RH matching units, the cost effectiveness of those practices to minimize the risk of alloimmunization remains controversial, partly because not all patients develop alloantibodies despite extensive exposure to donor RBC antigens. In order to optimize the use of genotype‐matched units to our patients we have genotyped the patients for genetic markers that could potentially help in the classification of responder and non‐responder SCD patients. In this study we evaluated the ability of this practice to avoid production of RBC antibodies and the negative consequences of alloimmunization in a follow up of 2 years.
Study Design/Method: A total of 27 non‐alloimmunized patients with SCD, homozygous for HbS, receiving a range of 15‐398 RBC units were enrolled in this study. Nine patients have the cytokine gene polymorphisms (TNFA–308A, IL1B–511T) previously associated with risk of alloimmunization and are being transfused with extended matching RBC units (level 2 of matching), 7 patients with RHAG 808A gene polymorphism previously associated with risk of RH aloimmunization and 8 patients with no genetic risk factors associated with RBC alloimmunization are being transfused with RH and K matching units (level 1 of matching), 3 patients with clinically relevant RHD‐CE genotypes and HLA‐DRB1‐15 and TNFA–308G gene polymorphisms associated with risk of RH alloimmunization are being transfused with extended matching RBC units including RH variant alleles (level 3 of matching).
Results/Finding: From the nine patients receiving transfusion in level 2 of matching, 2 patients developed anti‐Kpa and 1 patient developed anti‐Jsa. From the 15 patients receiving transfusion in level 1 of matching, no alloantibody was formed and from the 3 patients receiving transfusion in level 3 of matching, one patient genotyped as FY*B‐67C developed anti‐Fy3.
Conclusion: Although some patients developed antibodies against low prevalence antigens and one patient developed anti‐Fy‐3, this practice has improved the ability to find antigen‐matched components for transfusion support in non‐alloimmunized patients and has been of benefit to patients, as observed by the lack in the development of common alloantibodies. Transfusion follow up during two years showed that this transfusion strategy was efficient to keep the patient's Hb baseline levels.
IGT37
Fine Specificity of Kidd Antibodies Made by a Patient with a Novel JK*A Allele and Silenced JK*B Allele Suggests a Novel Antigen
Christine Lomas‐Francis*1, Andrew Rossin2, Judith Aeschlimann2, Kim Hue‐Roye2, Sunitha Vege2 and Connie M. Westhoff2
1New York Blood Center, 2Immunohematology and Genomics Laboratory, New York Blood Center
Background/Case Studies: A 74 year old E. Asian man, not recently transfused, presented with chronic anemia, dyspnea and an antibody that reacted with all panel cells but not with Jk(a–b–) RBCs or the autologous control. His RBCs typed Jk(a–b–) and his plasma contained an apparent anti‐Jk3. Testing was done to further investigate the plasma reactivity and to determine his JK genotype.
Study Design/Method: Antibody identification and antigen typing were performed by standard methods with licensed and in‐house reagents. Eluates were made with Gamma Elu‐Kit II (Immucor). Genomic DNA was isolated from WBCs. HEA PreciseType was performed and the JK coding exons were amplified and sequenced.
Results/Finding: The patient's RBCs were A, D+, with a negative DAT. They typed Jk(a–) and Jk(b–) with Immucor, Ortho and Bio‐Rad monoclonal anti‐Jka/Jkb and JK:–3 with polyclonal anti‐Jk3 but Jk(a+b+) was predicted by HEA PreciseType. His plasma reacted 2+S by PEG IAT, 3 + by papain IAT with Jk(a+) and/or Jk(b+) panel cells. JK sequencing confirmed the JK*01/02 genotype and revealed heterozygosity for a new JK*01 allele, c.130G>A (p.Glu44Lys) and c.557T>G (p.Met186Arg), in trans to the known silenced (null) JK*02N.01 (c.342‐1G>A, p.Arg114_Thr156del). The new JK*01 is similar to JK*01W.01 (c.130A) associated with weakened Jka expression. DNA results prompted further serological investigation. Patient RBCs were incubated with polyclonal anti‐Jka and –Jkb and eluates made. Anti‐Jka, weakly reactive by PEG IAT, but not anti‐Jkb was eluted indicating the patient's RBCs express some Jka and confirming lack of Jkb. The patient's plasma adsorbed with Jk(a–b+) RBCs contained anti‐Jka; plasma adsorbed with Jk(a+b–) RBCs contained anti‐Jkb. Eluates made from the first set of RBCs used for adsorption reacted with Jk(a+) and Jk(b+) RBCs and thus contained an apparent anti‐Jk3. Surprisingly, Jk(a+Wb–) RBCs from 2 donors, 1 homozygous for JK*01W.01 and 1 with JK*01W.01/02N.01, were weakly incompatible (1+) with patient's plasma by PEG IAT.
Conclusion: We describe a patient with a partial Jka, detectable only by adsorption/elution, encoded by a novel JK*01(130A,557G) in trans to silenced Jkb encoded by JK*02N.01. The initial plasma reactivity was consistent with anti‐Jk3 but by adsorption it was shown to contain separable anti‐Jka and –Jkb and, based on eluate results, a third antibody specificity non‐reactive with only Jk(a–b–) Jk3– RBCs. As the patient's RBCs express low levels of Jka, it suggests the antibody is not anti‐Jk3. The incompatibility of the patient's plasma with RBCs from donors that express Jka encoded by JK*01W.01, c.130A (p.44Lys), shows there is a recognizable difference between the protein encoded by that allele and the new JK*01(130A,577G) encoding both p.44Lys and p.186Arg. We show that the availability of JK genotyped RBCs enables more precise determination of antibody specificity to inform transfusion practice.
IGT38
LinkSēq™ for ABO, a Molecular Based Typing Solution for the ABO Blood Group
William J. Lane*1,2, Natash Novikov1, Helen H. Mah1, Joshua M. Rodriguez1, Thierry Viard3, Roland Russnak3, Vivian Yuen3, Rania Haddad3, Isaac Kim3, Raymond Li3 and Zachary Antovich3
1Department of Pathology, Brigham and Women's Hospital, 2Harvard Medical School, 3Thermo Fisher Scientific
Background/Case Studies: ABO is arguably the most important blood group system in transfusion medicine. Laboratories typically use serological methods to perform ABO typing. However, serology has significant limitations including (i) recently transfused patients may exhibit mixed field agglutination wherein both the patient's and recent donor's antigens are detected, and (ii) both forward and reverse typing must be performed, but may yield discordant results. These limitations are most problematic with phenotypes involving weakly expressed antigens. Laboratories can overcome these drawbacks with a combination of genotyping solutions (SSP, sequencing, etc), but these methods are time‐ and labor‐consuming, and require interpretation by subject matter experts. The aim of this study was to evaluate an alternative ABO real‐time PCR based genotyping solution recently introduced by Thermo Fisher Scientific.
Study Design/Method: The Thermo Fisher Scientific solution is based on its LinkSēq real‐time PCR technology, which was developed over 10 years ago for genotyping the complex Human Leukocyte Antigen (HLA) system. LinkSēq ABO analyzes 19 reactions that identify multiple relevant SNPs located within the ABO gene. We evaluated this solution by analyzing 96 archived DNA samples, including blood blank samples for which serotyping failed or produced discordant results, and samples from deceased solid organ donors.
Results/Finding: Genotyping results generated by LinkSēq were 100% concordant with typing obtained by traditional methodologies. In several cases, serology did provide conclusive results including: five discordant serologic and six inderminant A1 lectin reactions. In all of these cases LinkSēq was able to provide conclusive results, in agreement with Sanger sequencing results where available. LinkSēq overcomes the major challenges of molecular typing by providing a robust, automated approach that increases laboratory productivity and reduces turn‐around time. With less than 10 minutes of hands‐on set‐up, no further operator intervention with reagents, and SureTyper™ software fully automating all analysis, LinkSēq delivers genotyping and predicted phenotyping results in approximately 90 minutes.
Conclusion: We conclude that LinkSēq can provide a simple, effective and robust method for ABO typing including accurate A2 subgrouping.
IGT39
HU5F9‐G4 Monoclonal Anti‐CD47 Therapy: A First Experience with Interference in Antibody Identification
Christine Howard‐Menk*1, Jason E. Crane1, Laura Doshi2 and Mona Papari1
1ITxM/LifeSource, 2Advocate Lutheran General Hospital
Background/Case Studies: Hu5F9 is a human monoclonal IgG4 antibody targeting CD47 for the treatment of B‐cell lymphomas and some solid tumors. This marker has been identified as a broadly expressed cell surface protein which regulates phagocytosis.
Study Design/Method: Our patient is a 58 year old female with a history of B‐cell lymphoma, status post allogeneic peripheral blood stem cell transplant in October 2017, admitted to the hospital with a 7.0 g/dL hemoglobin. Patient had a previous history of cold and warm autoantibodies. A panagglutinin using gel technology was detected at the hospital and the sample was sent to the immunohematology reference laboratory for a complete workup. Transfusion history and medications were not initially available.
Initial testing with gel showed a reverse ABO discrepancy, panagglutinin, and negative DAT. Tube testing using PeG, LISS, and enzymes was selected to continue the identification. Strong agglutination (3‐4+) strength was seen at IS and AGT using all reagents.
Patient plasma was tested against cells treated with Ficin, DTT, glycine acid‐EDTA, cord cells, aged cells, and a battery of rare cells based on patient race and antibody reactivity. All reactions were 3‐4 + against all cells tested. Though the DAT was negative, an eluate was performed to identify autoantibody. It demonstrated a panagglutinin. Titration of the plasma versus a phenotypically matched cell showed reactivity greater than 4096. An alloabsorption using human stroma (ficin‐treated) was performed and the panagglutinin was removed, resolving the ABO discrepancy. Four cold/alloabsorptions removed all reactivity at IS. Reactivity remained when tested at 37C/AGT. Additional alloabsorptions performed at 37C (x4) removed the remaining reactivity when tested with IgG Coombs.
Results/Finding: The above results suggest a potent antibody to a high frequency antigen. With this in mind, several tests were performed using cells with rare phenotypes. When a complete history was obtained, it was found the patient had been in a clinical trial for a monoclonal antibody therapy targeting CD47. A literature review of the antibody identified a specific IgG Coombs sera clone is required to resolve the reactivity. If a clone lacking anti‐IgG4 is used (Gamma clone, monoclonal), the cells which previously reacted 3‐4 + with a clone containing IgG4 no longer react. Antibody testing was successfully completed using Gamma clone anti‐IgG sera at AGT, omitting the IS and 37C phase. ABO testing was completed with x4 cold alloabsorbed stroma.
Conclusion: Additional monoclonal therapies will continue to emerge. This case highlights the need for extensive communication between the Blood Bank and the clinical service regarding the use of these treatments.
IGT40
RBC Antigen Determination for Thalassemia Patients from Pakistan Using LeanSequencing Process
Ghazala Hashmi*1,2, Asim Qidwai3, Anwari Syeda3, Neelam Mansoor3, Kristopher Fernandez1 and Michael Seul1
1BioMolecular Analytics, 2SKH Foundation, 3Afzal Memorial Thalassemia Foundation
Background/Case Studies: Thalassemia is the most common inherited disorder in Pakistan, with an overall carrier frequency of ∼ 7%; approximately 4,000 children are diagnosed each year with the disorder. Most patients receive transfusion support to manage their symptoms of anemia, and 8.6% develop antibodies to red blood cell (“rbc”) antigens, leading to an increase in transfusion frequency (Zaidi 2015). The design of a program to manage the transfusion therapy for these patients with the objective of reducing the risk of alloimmunization, and thereby ultimate to lower the utilization of transfusion, will benefit from the routine use of rbc genotyping to determine extended antigen profiles for patients as well as donors.
Study Design/Method: 165 thalassemia patients supported at the AMTF hospital, of all major ethnicities (Pathan, Sindhi, Punjabi, Baluchi and Urdu), were screened to determine 40 + RBC antigens in MNS,RHCE, LU,KEL,FY,JK, DI,YT,DO and CO, along with 32 RHCE alleles as described (Hashmi et al., 2017). Duplicate barcoded buccal swab samples were collected and crude extract was prepared (Patel, et al., 2017). Samples were analyzed by a novel LeanSequencing process (BioMolecular Analytics) that achieves scalability by simultaneously determining multiple variants for multiple samples, using only PCR and capillary electrophoresis; genotypes were determined, and phenotypes predicted using proprietary software.
Results/Finding: 98% of the patients were negative for K; 81% for Ytb; 66% for E; 39% for N; 39% for S; 37% for Fyb (including 2 instances of a GATA silencing mutation); 23% for Jkb; 21% for Doa; 19% for Dob; 12% for Fya; 12% for C; 9% for M; 6% for s; 4 for Jka; < 1% for c, e, k and Yta; None of the patients had variant RHCE alleles encoding partial phenotypes. We also characterized all patients for a set of 12 thalassemia and 3 hemochromatosis mutations and report mutation frequencies in a separate abstracts.
Conclusion: This first comprehensive genotype analysis of transfusion‐dependent Pakistani thalassemia patients shows that allelic diversity, in this group, is limited to a small number of genes encoding the principal rbc antigens. “Antigen‐negative” phenotype frequencies for E, C, K, Jkb, and s were similar to those reported for Asians, while those for Fyb, Jka and c were closer to frequencies reported for Africans (Reid2004); frequencies for other antigens including M, N, S, Fyb appear to differ from those reported in other major ethnic groups. The relatively limited allelic diversity (compared to, say, individuals of African heritage) bodes well for a program of proactively providing transfusion support designed to minimize sensitization risk. LeanSequencing, with its streamlined protocol, using only crude extracts from buccal swab samples, will facilitate the rapid characterization of transfusion recipients as well as donors needed to support our objective.
IGT41
Examining the Correlation between Hepatitis C Infection, Interferon Therapy, and Red Blood Cell Alloimmunization in Humans
David Gibb1, Kevin Pelland2, Jeanne Hendrickson1 and Christopher A. Tormey*1
1Yale University, 2Yale School of Medicine
Background/Case Studies: Studies of red blood cell (RBC) alloimmunization have revealed an increased risk for alloantibody production in patients with chronic inflammation. There remains, however, little understanding of which inflammatory pathways promote production of alloantibodies in these patients. Recent studies have demonstrated that a specific group of inflammatory cytokines, type 1 interferons (IFNs), promote transfusion‐induced B‐cell differentiation and RBC alloantibody development in mice. Given that hepatitis C virus (HCV) infection is a disease managed with IFN therapy, we hypothesized that IFN‐treated patients with HCV may have an elevated rate of RBC alloimmunization. Thus, we undertook a retrospective examination of alloimmunization amongst patients with HCV.
Study Design/Method: Alloimmunized subjects (n=214) were extracted from a pre‐existing database; each subject was queried in the electronic medical record for a history of HCV infection and, if such a history was reported, then the following was subsequently collected: evidence of IFN therapy, RBC antibody specificities, and sex. In parallel, randomly‐selected non‐alloimmunized RBC transfused patients (n=144) were extracted from a general database to establish rates of HCV infection as well as IFN therapy amongst a non‐overlapping control group. The chi‐square test with Yates’ correction for continuity and the Fisher exact test were used for statistical comparisons; P‐values < 0.05 were considered significant.
Results/Finding: Of total alloimmunized subjects, 12.1% (26/214) had a history of HCV infection. The majority of these individuals were male (96.2%; 25/26) and most (92.3%, 24/26) formed a single alloantibody with anti‐E (n=9) and ‐K/‐C/‐Jka (all n=3) being the most common specificities. By comparison, 7.6% (11/144) of randomly‐selected, non‐alloimmunized patients transfused with RBCs had a history of HCV. The proportion of alloimmunized subjects with a history of HCV was not significantly higher than the proportion of control, non‐immunized transfused patients with HCV (0.12 vs 0.8; p=0.23). In addition, the proportion of alloimmunized subjects who received IFN therapy (0.31; 8/26) was not significantly different than that of transfused controls with HCV (0.27; 3/11; P=1.00).
Conclusion: While a substantial portion of alloimmunized and non‐alloimmunized patients in this cohort had a history of HCV, neither HCV infection itself nor receipt of type 1 IFN therapy was associated with an increased rate of RBC alloimmunization. Larger scale or multi‐site studies may be helpful to more rigorously investigate whether type 1 IFN therapy for HCV infection, or other disease(s), may impact the likelihood of alloimmunization following RBC transfusion.
IGT42
Estimation of the Risk of HPA‐1a‐Immunization in HPA‐1a Negative Women after Giving Birth to an HPA‐1a Positive Child
Jens Kjeldsen‐Kragh*1 and Klaus J. Olsen2
1University and Regional Laboratories Region Skåne, 2Larix A/S
Background/Case Studies: Fetal and neonatal alloimmune thrombocytopenia (FNAIT) is the platelet counterpart of hemolytic disease for the fetus and newborn. The most common, and usually the most severe cases of FNAIT are caused by anti‐HPA‐1a. HPA‐1a negative women who give birth to an HPA‐1a positive child are at risk of becoming HPA‐1a‐immunized. Women who are HLA‐DRB3*01:01 positive have a higher risk of HPA‐1a‐immunization as compared to women lacking this HLA allele. The aim of the study was to estimate the risk of HPA‐1a‐immunization in both HPA‐1a negative/HLA‐DRB3*01:01 positive and HPA‐1a negative/HLA‐DRB3*01:01 negative women after giving birth to an HPA‐1a positive child.
Study Design/Method: A literature search was conducted which identified 10 prospective FNAIT studies. The risk of becoming HPA‐1a‐immunised postpartum was calculated by using Bayes’ Theorem as no single trial contained all the needed information. Data were also used from the PREVFNAIT study – a recently completed large prospective FNAIT study in Poland. The results of HLA‐DRB3/4/5 typing of 212,472 European Caucasians from the National Marrow Donor Program were used as estimate of the frequency of the HLA‐DRB3*01:01 allele in the general population.
Results/Finding: In women who are HPA‐1a‐negative and HLA‐DRB3*01:01 positive the risk of HPA‐1a‐immunisation after delivery of an HPA‐1a positive child was estimated to 12.4% (95% confidence interval (CI): 8.4% – 16.5%). In contrast, the estimated immunization risk was only 0.6% (95% CI: 0.2% – 1.1%) in women who are HPA‐1a negative and HLA‐DRB3*01:01 negative.
Conclusion: In women who are HPA‐1a negative and HLA‐DRB3*01:01 positive, the risk of HPA‐1a‐immunization is 12.4% (95% CI: 8.4% – 16.5%) after delivery of an HPA‐1a positive child, which is 20 times higher than in women who are both HPA‐1a and HLA‐DRB3*01:01 negative. Thus, the risk of HPA‐1a‐immunization in HPA‐1a negative/HLA‐DRB3*01:01 positive women is in the same range as the risk of RhD‐immunization in RhD negative women after delivery of an RhD positive child if the mother does not receive RhD prophylaxis.
IGT43
Clinical and Cost Efficacy of Molecular RhD Genotyping
Linda Mamone*, Ian L. James, Edward J. Yoon and Mohamed Alsammak
Temple University Hospital
Background/Case Studies: Serologic weak D testing for patients is optional. However, in 2014 a work group between the College of American Pathologists and the AABB recommended that RHD genotyping (RHD‐g) be performed when discordant serologic RhD typing results are encountered and/or when a serologic weak D is identified. The goal is identification of true candidates for RhIG injections and/or RhD negative RBCs. In 2015 our institution adopted a testing process by which RhD testing is performed by two methods (gel and tube) to identify serologic discrepancy and hence, candidates for RHD‐g. It had been previously concluded that this process had a positive predictive value of 98% in detecting D variants. However, the cost‐efficacy of RHD‐g is not yet established. We sought to evaluate the cost efficacy of molecular RHD‐g at our institution.
Study Design/Method: Results of RHD‐g performed between 07/2015 – 12/2017 were retrospectively reviewed. Patients’ age, gender, race, clinical presentation, use of RhIG injection and transfusion were also reviewed. Cost analysis was performed.
Results/Finding: During the analyzed period 33,784 types and screens were performed at our blood bank. Only 130 (0.4%) samples, of which 102 were included in our study, were sent for RHD‐g due to serologic discrepancy and were initially resulted as RhD negative. The majority of patients (79.4%) typed as partial D and their type was kept as RhD negative. The remaining (20.6%) typed as weak D or no D variant and were changed to RhD positive, of which 4 patients were transfused subsequently. Twenty out of 102 patients were pregnant, of which 13 received RhIG (cost $80/vial). See Table for demographics. Of the 13 patients who received RhIG, 4 were unnecessary (2 weak D, 2 D+), which would have saved approximately $640 assuming at least 2 vials/patient. The cost of molecular sendouts was approximately $450/test, for a total cost of $45,900 for patients included in our study. The cost of RhD negative and positive pRBC units from our supplier was the same ($201/unit).
TABLE
| Total Patients=102 | Total |
|---|---|
| Female | 53 (38 childbearing age) |
| Patients who received RhIG | 13 |
| Age Range | 0 (newborn) ‐ 85 yrs |
| Average Age | 41.4 yrs |
| Race* (% of Total) | AA = 66 (64.7%), H = 22 (21.6%), C = 11 (10.8%), U = 3 (.03%) |
AA=African American, H=Hispanic, C=Caucasian, U=Unknown
Conclusion: Phasing in RHD‐g into daily transfusion medicine practice remains an advancing but challenging topic. In our patient population, the majority of serologic D typing discrepancies identified by our method were attributable to partial D variants, and such patients were treated as RhD negative. Thus, the cost effectiveness of molecular RHD‐g is questionable and should probably be reserved for specific clinical situations or patient populations.
IGT44
Identification of Four Novel XK Mutations Associated with Mcleod Phenotype
Sunitha Vege*1, Gregory A. Denomme2, Richard Gammon3, Christine Lomas‐Francis4, Judith Aeschlimann1, Kim Hue‐Roye1, Zong Hu5 and Connie M. Westhoff1
1Immunohematology and Genomics Laboratory, New York Blood Center, 2Immunohematology Reference Laboratory, Versiti/BloodCenter of Wisconsin, 3OneBlood, Inc, 4New York Blood Center, 5Immunohematology and Genomics Laboratory
Background/Case Studies: The McLeod syndrome is an X‐linked genetic disorder in males associated with late onset clinical or subclinical myopathy, neurodegeneration, neuroacanthocytosis, and other central nervous system (CNS) manifestations. It is associated with elevated CPK levels and weak or undetectable Kell system antigens and absence of Kx antigen on RBCs. Approximately 40 different XK gene mutations have been reported, and there appears to be growing awareness of the syndrome. We investigated XK in four male patients, three diagnosed with acanthocythosis and one with fever, infection and presenting with anti‐Kx.
Study Design/Method: RBC typing was performed by standard tube methods with licensed and unlicensed in‐house reagents. Genomic DNA was isolated from WBCs. The XK gene was amplified and sequenced
Results/Finding: The probands (P1 to P4) are summarized in Table 1. The RBCs from all four showed depression of Kell system antigens: K–k+w, Kp(a–b+w or b−). RBCs from P1, P2, and P3 typed Kx−. P2 RBCs also typed Km− and anti‐Kx was identified in the patient's plasma in albumin, papain, and PEG IAT. P4 was being evaluated for involuntary jerking movements with a blood film showing acanthocytes. P4's red cells were negative when tested with anti‐KL. XK gene sequencing revealed novel alleles in each proband: P1 has nucleotide deletion of an A at position c.475 that resulted in frameshift and premature stop codon. The sample from P2 had an intron 2 −2a>g splice site mutation predicted to be associated with alternative splicing; P3 had a nonsense mutation at position c.1015 that resulted in a premature stop codon; and P4, a missense mutation at position c.452 that resulted in an amino acid change.
TABLE 1 (IGT44) Summary of the serology and XK results for the 4 probands.
| Proband | Age/Ethnicity | Serology | XK Mutation |
|---|---|---|---|
| P1 | 68yo Caucasian male | K−k+w Kp(a−b+w), Kx− | c.475delA (p.Ser159ValfsTer15) |
| P2 | 62yo male | K−k+w Kp(a−b+w), Kx−, Km− Anti‐Kx | c.509‐2A>G (alternative splicing) |
| P3 | 64yo Caucasian male | K−k+w Kp(a−b+w), Kx− | c.1015A>T (p.Lys339Ter) |
| P4 | 56yo Asian male | K−k+w Kp(b−), Js(b−), KL− | c.452A>C (p.Gln151Pro) |
Conclusion: We report the molecular genetic basis of McLeod phenotype in four probands resulting from a nucleotide deletion causing a premature stop, a splice site mutation, a nonsense mutation, and a missense mutation. Three of the probands, including the patient with the missense mutation, were all diagnosed with acanthocytosis. P3 also had neurological symptoms consistent with McLeod syndrome. However, proband 2 with the splice site mutation had no indication of McLeod syndrome, emphasizing that different XK gene mutations may have different clinical effects and may account for the variability in the McLeod phenotype. Proband P2 had been previously transfused with anti‐Kx identified in the plasma. Autologous donation is recommended for individuals with McLeod phenotype.
IGT45
Sickle Cell Patient Transfusion Management: Extended Antigen Profiling By LeanSequencing
Sunitha Vege*1, Judith Aeschlimann1, Kristopher Fernandez2, Ghazala Hashmi2, Michael Seul2 and Connie M. Westhoff1
1Immunohematology and Genomics Laboratory, New York Blood Center, 2BioMolecular Analytics
Background/Case Studies: Transfusion support is a major part of therapy for patients with sickle cell anemia (SCA) and other hemoglobinopathies. The allelic diversity within the predominantly black SCA population, especially at the RHCE locus, makes it desirable to routinely query RHCE alleles when predicting the extended antigen phenotype. In an effort to reduce labor and turnaround time while identifying RHCE alleles of interest, we tested a novel LeanSequencing™ platform.
Study Design/Method: LeanSequencing for RBC genotyping (Hashmi et al., 2017 AABB abstract), permits the analysis of sample pools for >40 RBC antigens in 10 blood groups (MNS, RH, LU, KEL, FY, JK, DI, YT, DO and CO), including 18 RHCE antigens (CcEe, V, VS, hrB, hrS, Cw, Cx, Crawford, JAL, STEM, MAR, CEST, CEAG, CEVF, CELO) encoded by 32 alleles. The protocol has 3 analytical steps: single multiplex PCR with barcoding of amplicons; allele‐specific amplification and labeling of pooled(x4) amplicons; and read‐out by capillary sequencing. This protocol was used to analyze genomic DNA from 95 blinded samples previously genotyped for an extended RBC antigen set by a licensed method. Data was analyzed and phenotypes predicted using a novel algorithm for RHCE allele determination.
Results/Finding: Thirty‐one of the 95 samples were found to express partial c (=c*), partial e (=e*) or both, namely: c* (n=23; 12 with a single c*‐encoding allele paired with a Ce allele) and e* (n=19; 8 with a single e*‐ encoding allele paired with a cE allele); further, 4 with predicted weak phenotypes: U (n=3) and V (n=1); 67 with GATA silenced FYB; and uncommon antigen negatives: U (n=1), e (n=1), Yta (n=1), Jsb (n=2), CEAG (n=1) and hrB (n=11; 5 paired with a cE allele); 14 of the RHCE allele pairings had not been previously determined, namely: RHCE*ceAG homozygous (n=1) and RHCE*ceAG paired with: ce (n=5), Ce (n=2), cE (n=3), ceMO (n=1), ceTI (n=1), and RHCE*ceS/ceTI (n=1). Five discrepancies were noted. One predicted V+VS + by comparison assay but V+wVS‐ by LeanSequencing which detected RHCE*ceAR that is not detected by a reference assay. Four discrepancies (Lua, C, M/N, and N) were due to threshold settings in the LeanSequencing software that have been adjusted.
Conclusion: LeanSequencing results were highly concordant for markers tested by both methods to predict RBC phenotypes for 95 challenging samples. The lean workflow, including a parallel format and comprehensive imputation of RHCE alleles by a novel algorithm offers rapid determination of extended patient and donor RBC antigen profiles to facilitate managing chronically transfused patients.
IGT46
A Novel Use of Human Platelet Concentrate to Resolve Interference of Anti‐CD47 in Serologic Testing
Marla C. Troughton*1, Linda W. Simmons1, Connie Langley2, Mariam Youssef2 and Marisa B. Marques3
1American Red Cross, 2University of Alabama at Birmingham, 3Department of Pathology, University of Alabama at Birmingham
Background/Case Studies: Human monoclonal antibody to CD47 (Hu5F9‐G4) is known to interfere with serologic blood bank testing. Previously reported success with Gamma‐clone anti‐human globulin (AHG) and adsorption by allogeneic papain‐treated rr RBCs is not always reproducible. With increased enrollment of patients in clinical trials of Hu5F9‐G4 for solid tumors and lymphoma, a reliable and efficient solution is needed. As human platelet concentrates (HPC) are used to adsorb HLA antibody, and CD47 is present on platelets, we report a novel use of HPC to adsorb anti‐CD47.
Study Design/Method: Samples were received in November 2017 (Post‐drug day 1), March 2018 (Post‐drug day 3), and April 2018 (Post‐drug day 15) from a 54 year‐old female with relapsed non‐Hodgkin's lymphoma enrolled in Phase Ib clinical trial of Hu5F9‐G4 and rituximab. Historic blood type was A positive with negative antibody screens, 2 pregnancies and transfusions in 2009 and 2010. Samples were screened with commercial reagent cells, at Immediate Spin (IS), 37C, and AHG with LISS, at AHG with PEG and at AHG saline with 60‐minute 37C incubation. Except for IS reactions, all components were prewarmed for 30 minutes at 37C before mixing. Following the HPC direction insert procedure, but using the available plasma samples, we performed sequential adsorptions, and evaluated for reactivity at prewarmed PEG AHG. Patient sample spiked with Jka antiserum was HPC adsorbed to verify expected alloantibody reactivity.
Results/Finding: The first sample was forward type A positive consistent with historical data, but reversed as type O (4 + with both A1 and B cells). Autocontrol (AC) and direct anti‐globulin test (DAT) were negative. Antibody screen was reactive at IS (2+), negative at AHG using Gamma‐clone anti‐IgG, and her serologic phenotype was obtained. The second sample showed similar ABO, DAT and AC results, but screening was reactive at IS (4+), LISS 37C (w+), and PEG AHG (m + to 1+) despite use of Gamma‐clone AHG. Three HPC adsorptions successfully removed reactivity at AHG, but not at IS. The third sample had the same ABO, DAT, and AC results, but AHG‐phase testing was diminished (m+) and reactivity was removed after 2 HPC adsorptions. The patient specimen spiked with anti‐Jka showed the expected reactivity.
Conclusion: Adsorptions with HPC were more efficient to remove reactivity at AHG than previously reported with RBCs. Reduced reactivity was noted and fewer adsorptions required when blood was drawn further from drug dosing. Use of HPC adsorptions and knowledge of drug‐dose timing may offer improved efficiency of testing at AHG phase. Blood type and phenotype prior to initial drug dose, as well as phenotypically‐matched blood remain critical as we optimize testing of patients on Hu5F9‐G4.
IGT47
Extended Blood Group and Platelet Phenotype Prediction from Whole Genome Sequencing and Its Impact on Alloimmunization in the State of Qatar
Celina Montemayor*1, Nagarajan Kathiresan2, Harvey G. Klein3, Zohreh Tatari Calderone2 and Ena Wang2
1CC‐DTM, NIH, 2Sidra Medicine, 3NIH
Background/Case Studies: One manifestation of worldwide genetic variation is a diverse ethnic distribution of blood group antigens, leading to unique challenges in transfusion support for each population. Although the 1000 Genomes project yielded important insights about the global red blood cell (RBC) antigen distribution, the Middle East population remains underrepresented in current worldwide large‐scale sequencing databases. The genetic structure of the Qatari population, which has been profoundly impacted by the ancestral population (with a high level of consanguinity) and migratory flow, presents a fantastic example of genetic diversity of the Middle East and North Africa (MENA) region. Here we describe for the first time the predicted extended RBC and platelet phenotype from whole genome next generation sequencing (WGS) in 1,000 Qatari individuals.
Study Design/Method: Paired‐end WGS was performed on 1,000 Qatari nationals participating in the larger “Qatar‐Genome‐Project” study. Aligned data was analyzed using RyLAN (Red Cell and Leukocyte Antigen prediction from NGS) to query 398 known single nucleotide and indel variants in 36 red blood cell (RBC) and platelet antigen genes.
Results/Finding: The highest variant nucleotide frequency was observed for the Fya/Fyb and Doa/Dob loci (69% and 43%, respectively), followed by the ACKR1 promoter silencing variant (35%). Fifteen participants were carrying Hbbs, 82 were predicted as K1+k + and 4 as K1+k‐. Kpa and Jsa antigens were also present (0.05% and 0.9%). Among others, our analysis also revealed: one LU:‐8,14, 10 Yt(a‐b+), 4 Co(a+b+) and 9 Jr(a‐); 4 instances of Lu6/Lu9 heterozygosity; and 3 null Kidd alleles. A total of 281 participants carried 4 different weak Kidd antigen variants, including 12 in homozygous state. Select regions of the BCAM, FUT7, CR1 and KLF1 genes failed quality filters in less than 1% of the samples. For platelet‐specific antigens, the frequency of HPA‐3b allele (34%) was comparable to European countries, while the relatively‐high frequency of the HPA‐5b variant (19%) was comparable to Africa's. HPA‐4b was not identified. The only detected platelet bw antigen was HPA‐17bw.
Conclusion: WGS data analysis reveals a unique combination of blood group and platelet antigens in the Qatari population, distinct from the continental blood group distributions extracted from the 1000 Genomes Project. The Qatari population possesses the highest frequency of the FY*02N.01 variant outside of Africa, suggestive of natural selection for resistance to malaria. Clinically, the high prevalence of alloimmunization observed in Qatar might be related to the high frequency of K1 polymorphism (4.5%) and weak Kidd antigens (28%), with the latter possibly leading to discordant serologic results. The Qatar population is composed of over 1.5M expatriate and about 300,000 Qatari nationals. Under such circumstances, RBC antigen discrepancy between donors and recipients with different genetic background can lead to alloimmunization against rare blood groups, frequently found in Qatar. Further study of genomic data by stratifying the Qatari population to its ancestry populations: Bedouin, Persian and Arab will help refine the knowledge of blood group diversity in the MENA region in general and in Qatar in particular, and will be an important step toward optimizing precision transfusion strategies in this region.
IGT48
FYX and GATA Variants Found in Cis
Jessica Keller1, Trina Horn2, Shannon C. Jenkins1, Jan R. Hamilton3 and Margaret A. Keller*2
1American Red Cross, 2American Red Cross ‐ National Molecular Laboratory, 3American Red Cross Blood Services
Background/Case Studies: Genetic variation in ACKR1, also known as DARC, is associated with the FY blood group system. It is well appreciated that a promoter variant (c.‐67) destroys a binding site for erythroid transcription factor GATA‐1. Though it has been reported on the FY*01 allele, it is typically inherited on a FY*02 allele where it silences expression of Fyb. There are two single nucleotide polymorphisms (SNPs) located on exon 2 that are associated with weakened antigen expression. The FY c.265 and c.298 are typically found on FY*02 and weaken Fyb in what is termed FYX. The GATA variant is common in individuals of African descent and the FYX variants are most often found in individuals of Caucasian descent. Though they have been found on both the FY*01 and FY*02 alleles, they have not been found in cis. Here we report a blood donor with the GATA and FYX variants inherited in cis.
Study Design/Method: Peripheral blood from a 37‐year old African American male blood donor was tested for a panel of blood group antigen variants using PreciseType HEA Molecular BeadChip (Immucor) as part of routine testing. The panel found the donor was homozygous for c.‐67C and c.125A and heterozygous for c.265C/T. The BASIS4G software resulted the donor as a possible variant (PV) for Fya and Fyb. The donor had a history of serologically typing Fy(a‐b‐). Genomic DNA was reextracted from the peripheral blood mononuclear cells. Sanger sequencing of ACKR1 exons 1 and 2 were performed and the resulting sequence was aligned to consensus and variants compared to the Allele table of the ISBT Working Party for Red Cell Immunogenetics and Blood Group Terminology.
Results/Finding: Sanger sequencing confirmed the genotypes at ACKR1 c.‐67, c.125 and c.265 and identified heterozygosity for a synonymous SNP at c.36C/G.
Conclusion: RBC genotyping panels use algorithms that integrate genotype results at multiple SNPs and population frequencies to predict an antigen phenotype. Since the SNP associated with FYX has not been co‐inherited with the promoter SNP that destroys the GATA binding site, the BASIS4G (Immucor) software resulted this donor phenotype as PV for Fya and Fyb. Sanger sequencing confirmed that the donor carries one FY*02N.01 allele along with a novel allele encoding FYX but is silenced by the GATA variant. This case illustrates how high‐throughput screening of blood donors followed by serologic confirmation can uncover new blood group alleles of serologic importance.
IGT49
Optimizing Recognition and Management of Weak D and Partial D in Prenatal Patients Using RHD Genotyping: A Community Hospital Experience
Cristine F. Clemente Dos Santos* and Zeenath Asma
Elmhurst Memorial Hospital
Background/Case Studies: Partial and Weak D antigens can have weak and discrepant reactions on serologic testing despite using FDA approved reagents and technology. Additionally, these tests do not distinguish between Partial and Weak D. Follow up and clinical management practices are currently variable. Generally, prenatal patients with discrepant reactions are categorized and managed as Rh negative. Additionally, those patients who test as Rh positive but are actually a Partial D phenotype are not recognized as possibly being at risk for D allo‐immunization and needing RhIG prophylaxis. At Elmhurst Memorial Hospital Blood Bank, all discrepant D typing samples were further evaluated by molecular testing. This has helped the Blood Bank identify patients who, despite typing as Rh positive were eligible for RhIG immunoprophylaxis.
Study Design/Method: Over a period of fourteen months, from January 2017 to April, 2018, seven prenatal patient samples with reaction strength discrepancy between the automated gel methodology and manual tube method for D antigen were additionally subjected to RHD genotyping and screened for Weak/Partial D. Automated gel methodology (Erytra analyzer; Grifols Diagnostics) was used for primary typing. Tube testing including immediate spin and AHG phase was performed with commercially available panel of monoclonal anti‐D (Seraclone monoclonal anti‐D (RH1) blend; BioRad Medical Diagnostics) was used for re‐typing. Only forward type was performed during retyping. Genomic DNA was evaluated by Grifols Immunohematology, TX.
Results/Finding: Seven prenatal patients were identified with D reaction strength discrepancies between the automated gel testing and manual tube testing. They were subjected to RHD genotyping. Of these 7 patients, 5 (71.4%) were found to have weak D, type 1 or 2. The other 2 patients (28.6%) were found to have Partial D. One patient demonstrated Partial D, type CS. She was previously typed as Rh negative at a different laboratory. The second patient was identified as Partial D type VIII. She was previously typed as Rh positive at different facilities. All these patients delivered Rh positive infants. The patient with partial D, type CS received RhIG at 28 weeks of gestation and post‐partum. The patient with partial D, type VIII did not receive RhIG at 28 weeks or post‐partum and had negative antibody screen at the time of delivery. Physician was advised of genetic testing findings and recommendation was made for RhIG prophylaxis. No RhIg prophylaxis was indicated for the other Weak D subtypes.
| Patient | Erytra – Gel method D strength | D tube testing IS/AHG | D phenotype | Post‐partum RhIG recommended? |
|---|---|---|---|---|
| 1 | 2+ | 0/2+ | Weak D type 1 | No |
| 2 | 4+ | 1+/NT | Partial D type VIII | Yes |
| 3 | 3+ | 0/4+ | Partial D type CS | Yes |
| 4 | 2+ | 0/2+ | Weak D type 1 | No |
| 5 | 2+ | 0/2+ | Weak D type 2 | No |
| 6 | 3+ | W+/NT | Weak D type 1 | No |
| 7 | 3+ | W+/NT | Weak D type 1 | No |
Conclusion: RHD has complex serologic profile depending on expression of D antigen on red cell surface and technical conditions during testing. This can result in typing discrepancies between automated technology and manual monoclonal anti‐D reagent. The use of serology for D typing in combination with Genotyping resulted in optimal RhIG prophylaxis for this patient population that might otherwise not have received prophylaxis to prevent allo‐mmunnization.
IGT50
Suppressed Kidd Antigen Expression: Using Molecular Red Cell Genotyping to Resolve Discrepant Serological Testing
Debra L. Moore*1, Sandy Wortman1 and Laurie Sutor1,2
1Carter BloodCare, 2UT Southwestern Medical Center
Background/Case Studies: A serological phenotype tests for expression of surface RBC antigens, whereas a molecular genotype tests for inherited DNA alleles. A laboratory may utilize both techniques to help resolve discrepancies and indicate the need for further testing. The Jk(a‐b‐) phenotype is extremely rare and most common among Polynesians.
Study Design/Method: A complex antibody identification workup was performed using patient plasma and RBCs in standard tube (PeG/LISS) and gel methodologies. Further information was obtained by a 2M urea lysis test and comparing serological phenotyping with molecular genotyping results.
Results/Finding: A sample of plasma and red cells was received from a 56 year old female diagnosed with ovarian cancer and no reported transfusion history. Direct antiglobulin test (DAT) showed 4 + with polyspecific anti‐human globulin (AHG), anti‐IgG, and anti‐C3b‐C3d; including a negative albumin control. The gel antibody screen/panel and eluate were reactive with all cells tested. Tube testing of screening cells, potentiated by PeG and LISS, was also panreactive. Patient RBCs were treated with EDTA/glycine acid (EGA) and IgG‐blocked to obtain DAT negative cells. These cells were subsequently tested with the patient's serum and reacted 2 + at PeG IAT, indicating an autoantibody. The serological phenotype Jk(a‐b‐) was confirmed using multiple manufacturers’ antisera. Phenotypically similar Jk null RBCs were nonreactive in both tube (PeG) and eluate, initially suggesting a probable anti‐Jk3. Rare frozen unlicensed Jk3 antisera unexpectedly tested 2 + with patient RBCs, which contradicted the Jk null serological phenotype. The serologic phenotype was also contradicted by lysis of patient RBCs in 2M urea, as Jk null RBCs should be resistant to 2M urea lysis. Due to discrepant serology results, molecular genotype testing was performed. The molecular results were JK*A, JK*B with a predicted phenotype of Jk(a+b+). Kidd gene DNA sequencing was performed on JK exons 4 to 11, revealing no known polymorphisms to explain the serologic phenotype or the production of auto‐anti‐Jk3. The patient was transfused with three units of Jk(a+b‐) RBCs without reported incident.
Conclusion: This case illustrates how molecular genotyping can benefit patients with discrepant serological testing results. The predicted molecular phenotype alludes to the possibility of suppressed antigen expression. By comparing the molecular genotype results with serological phenotype results, a rare clinical presentation of an auto‐anti‐JK3 was revealed. Blood utilization was optimized by not wasting rare Jk3 negative blood products.
IGT51
Two Distinct Jk Weak Allele Variants Are Found in Cis Using Next Generation Sequencing and Physical Phase Annotation
Marsha M. Wheeler*1, Gregory A. Denomme2, Kerry W. Lannert3, Emilia A. Sippert4, Evgeniya Volkova5, Maria Rios4, Deborah A. Nickerson6 and Jill M. Johnsen3,7
1University of Washington, Department of Genome Sciences, 2Immunohematology Reference Laboratory, Versiti / BloodCenter of Wisconsin, 3Bloodworks NW Research Institute, 4Office of Blood Research and Review, FDA, 5FDA/CBER, 6University of Washington, Genome Sciences, 7University of Washington, Department of Medicine
Background/Case Studies: Organization of blood group genetic variants into alleles enables interpretation of red blood cell (RBC) genotypes and accurate prediction of RBC antigen phenotypes. Blood group alleles are defined by one or multiple genetic variants, most commonly single nucleotide variants (SNVs, formerly SNPs). If multiple heterozygous variants are identified, establishment of variant phase (cis/trans position) is required for allele interpretation. Phase information can be limited by the genotyping technology and/or the physical distance between variants. We used next generation sequencing (NGS) coupled with physical phase annotation to resolve SNVs in the SLC14A1 gene and defined a new JK allele previously designated as two JK*01W alleles.
Study Design/Method: Eighteen DNA samples obtained from the FDA genotyping repository (AABB 2016, SP311) were sequenced using BloodSeq, a custom blood group gene targeted NGS panel (paired‐end 150 reads, Illumina MiSeq). Raw sequence data was aligned to the human reference genome (GRCh37). SNVs and indels were assessed using a multi‐sample VCF (GATK HaplotypeCaller) annotated with physical phasing information (GATK ReadBackedPhasing). SLC14A1 alleles were determined by cross‐referencing SLC14A1 variants with the ISBT JK table and literature designating JK alleles. cDNA positions are relative to the NM_015865.6 transcript.
Results/Finding: Using ISBT nomenclature, we found four SLC14A1 SNVs indicative of five published JK alleles: JK*02 (reference allele), JK*01 (c.838A>G), JK*01W.01(c.130G>A), JK*01W.03 (c.28G>A), and JK*01W.04 (c.226G>A). Two samples contained variants currently defining JK*01W.03 and JK*01W.04 in a cis configuration. One sample was homozygous for both variants; a deletion was ruled out by copy number analyses. One sample was heterozygous for both variants; phase annotation indicated c.28G>A and c.226G>A were also present in cis. Thus, in this dataset, three JK*01W c.[28G>A;226G>A] alleles were observed. Population‐based allele frequencies (gnomAD) show both variants are prevalent in individuals with African ancestry, with frequencies of 5.9% and 7.3% for c.28G>A (18:43310313) and c.226G>A (18:43311054), respectively.
Conclusion: Through NGS analyses on 18 samples, we unexpectedly found two SNVs present in cis that were previously defined as distinct JK*01W alleles. These variants are similarly common in individuals of African ancestry. This NGS approach provided additional genomic information that confirmed phasing of SNVs. We propose determination of phase should be performed when possible to more accurately annotate alleles.
IGT52
Lower Risk of Platelet Antibody Production in Hematologic Patients after Platelet Transfusions Than Non‐Hematologic Patients
Jeong‐Shi Lin*1,2, Li‐Hsuan Lee1, Hsueng‐Mei Liu1, Ying‐Ju Chen1 and Tzeon‐Jye Chiou1,2
1Division of Transfusion Medicine, Department of Medicine, Taipei Veterans General Hospital, 2School of Medicine, National Yang‐Ming University
Background/Case Studies: IL‐6 promotes antibody production by promoting the B cell helper capabilities of CD4+ T cells and inhibiting the generation of regulatory T cells. The risk of D alloimmunization is low in patients with hematologic disease after D‐incompatible platelet transfusions. The aim of this study was to investigate factors influencing platelet antibody production in platelet transfusion recipients.
Study Design/Method: Thirty platelet recipients with platelet antibodies (responders) and 20 platelet recipients without platelet antibodies (non‐responders) were randomly selected. The ‐572 C>G single nucleotide polymorphisms (SNPs) in the promoter region of IL‐6 gene were genotyped by polymerase chain reaction (PCR)‐restriction fragment length polymorphism (RFLP) method. Antiplatelet antibody tests were performed using a solid phase red cell adherence assay technique with the MASPAT kit (Sanquin, Amsterdam, The Netherlands). The data including age, sex, diseases (benign vs. malignant, hematologic vs. non‐hematologic), amount of platelet transfusion, G/C polymorphism of the IL‐6 gene at position ‐572 and platelet antibody production were analyzed.
Results/Finding: Age, sex, percentage patients with benign diseases, and percentage of patients with homozygotes for the C allele at position ‐572 of the IL‐6 gene were similar between responders and non‐responders; and they were also similar between patients with hematologic diseases and patients with non‐hematologic diseases. Percentage of patients with hematologic diseases in responders was lower than that in non‐responders (36.7% vs. 75%, P = 0.01). Although the amounts of platelets pheresis transfused to patients with hematologic diseases were higher than those of non‐hematologic diseases (47.2 ± 54.2 vs. 17.4 ± 13.8, P = 0.019), detection rate of platelet antibodies was lower in patients with hematologic diseases than that in patients with non‐hematologic diseases (42.3% vs. 79.2%, P = 0.01). Compared to patients with hematologic diseases, patients with non‐hematologic diseases had 1.871 (95% C.I.: 1.142 ‐ 3.065) fold relative risk of platelet antibody production.
Conclusion: In our study, we found that there was no association between IL‐6 C‐572G gene polymorphism and platelet antibody production. Patients with hematologic diseases had lower risk of platelet antibody production than patients with non‐hematologic diseases.
IGT53
The ACKR1 Alleles at 5,178 Nucleotides Each in 60 Individuals from Gambela, Ethiopia
Qinan Yin*1, Kshitij Srivastava1, Amha Gebremedhin2, Addisalem T. Makuria1,3 and Willy A. Flegel1
1DTM/CC/NIH, 2Addis Ababa University Medical Faculty, 3FDA
Background/Case Studies: The human ACKR1 gene encodes a glycoprotein expressing the Duffy blood group antigens (Fy). The Duffy protein acts as a receptor for distinct pro‐inflammatory cytokines and malaria parasites P. vivax and P. knowlesi. We aimed to identify long range alleles of the ACKR1 gene, possibly including regulatory elements, without ambiguity in an autochthonous population in a malaria endemic area.
Study Design/Method: We collected blood samples from 60 healthy volunteers in Ethiopia's southwestern low altitude tropical region. An assay was devised to amplify the ACKR1 gene as a single amplicon and determine its genomic sequence. All haplotypes were resolved at 5,178 nucleotides each, covering the coding sequence (CDS) of the ACKR1 gene including the 5' and 3' untranslated region (UTR), intron 1 and the 5' and 3' flanking region. For computational phasing, genotype data from the 60 Ethiopian individuals and the 2,504 individuals from the 1000 Genomes Project was used as input in the Markov chain‐based haplotyper, MaCH.
Results/Finding: In the 60 Ethiopians analyzed, 18 single nucleotide polymorphisms (SNPs) and 20 distinct genotype patterns were observed. Except for the GATA box mutation, no other SNP encoding a non‐sense mutation was found. Physical evidence by allele‐specific amplification, sequencing and fragment analysis allowed us to discern 18 ACKR1 alleles in the 120 chromosomes analyzed. All 18 alleles detected carried the SNP found in the common Fy(b+) phenotype. The clinically relevant FY*02N.01 allele in Africans was consistent with 16 of the 18 alleles. The other 2 alleles represented a FY*02 allele of the Fy(b+) and a FY*02W.01 allele of the Fy(b+w) phenotypes, respectively. Only 4 non‐synonymous SNPs were found, and computational modeling indicated, that all 4 changes were neutral. Out of the 18 physically confirmed ACKR1 alleles, only 13 alleles were correctly predicted by the MaCH software while 5 alleles were missed. Another 4 haplotypes (23.5%), which did actually not occur among our Ethiopian cohort, were predicted by MaCH as single occurrences. In the 1000GP dataset with only 13 SNPs listed for the ACKR1 gene, MaCH predicted 20 haplotypes out of which only 2 were present in the Ethiopian cohort.
Conclusion: We described 18 distinct ACKR1 alleles in an autochthonous East‐African population. The high frequency of FY*02N.01 allele (95%) in this study is similar to other studies conducted in African regions (95% ‐ 100%). As an adjunct to the human reference genome assembly, which is the gold standard reference, our comprehensive population specific data and alleles are useful as template sequences for allele calling in high‐throughput next‐generation sequencing and precision medicine approaches.
IGT54
Null Phenotype Associated with RHCE*ce486 + 1a
Trina Horn1, Jessica Keller2, Shannon C. Jenkins2, Karen B. Little2, Charissa R. Bonner2, Anne Wade2 and Margaret A. Keller*1
1American Red Cross ‐ National Molecular Laboratory, 2American Red Cross
Background/Case Studies: Many large blood donor centers use genotyping of red blood cell (RBC) donors to predict multiple blood group antigens which are subsequently confirmed serologically. With an increase in RBC genotyping comes the identification of samples in which the genotype‐predicted phenotype is found to be discordant with the serologic type. Here we report a case of little c typing discrepancy that identified a novel null RHCE*ce allele. The blood donor was predicted to type little c antigen positive by RBC genotyping, while the donor history listed the donor RBCs as little c antigen negative. Investigation using higher resolution RHCE genotyping identified a nucleotide variant previously associated with a null RHCE*Ce allele.
Study Design/Method: Peripheral blood from a 39 year‐old male blood donor was tested for a panel of blood group antigen variants using HemoID DQS (Agena Biosciences) as part of routine testing. The RHCE c. 48, c.203, c.307 and in2 109 results predicted the donor to type C + and c‐. The current donation was typed serologically using multiple sources of anti‐c. Genomic DNA was reextracted from the peripheral blood mononuclear cells. RHCE BeadChip (Immucor) was tested. Sanger sequencing of RHCE exons 1‐7 were performed and the resulting sequence was aligned to consensus and variants compared to the Allele table of the ISBT Working Party for Blood Group Allele Nomenclature and Immunogenetics.
Results/Finding: The RHCE BeadChip predicted the donor to type C + E‐ e + c+, consistent with initial testing using HemoID DQS. Higher resolution testing employed Sanger sequencing of RHCE exons 1‐7. No variants were detected in exons 1, 2, 4, 5, 6 or 7. Exon 3 revealed heterozygosity for RHCE c.486 + 1g/a.
Conclusion: The donor carried one RHCE*Ce and one RHCE*ce allele with only one variant detected in the third intervening sequence (IVS3). This g>a variant at c.486 + 1 has been reported before in the context of an RHCE*Ce null allele. In the donor reported here, based on the serology, it is reasonable to conclude that the variant is associated with the RHCE*ce allele. The variant is in the dbSNP database (rs753832633) and the Exome Aggregation Consortium (ExAC) found the variant to be quite rare, at a frequency of 0.0016%. This case illustrates how high throughput screening of blood donors followed by serologic confirmation can uncover new blood group alleles of serologic importance.
IGT55
Amino‐Acid Substitution in the Catalytic Active Region of B‐Glycosyltransferase Enzyme Responsible for Weak B Phenotype
Yanling Ying1,2, Xiaozhen Hong1,2, Xianguo Xu1,2, Ji He1,2, Faming Zhu1,2, Wei Hu1,2, Xiaofan Zheng1, Feng Chen*1 and Huaping Zhou1,2
1Blood Center of Zhejiang Province, 2Zhejiang Provincial Key Laboratory of Blood Safety Research
Background/Case Studies: ABO typing is the most important component of pretransfusion testing. The amino acid substitutions caused by ABO gene mutations are usually predicted to impact the glycosyltransferase function, which may cause ABO blood grouping discrepancy. Here, we have identified two novel mutations in exon 7 of the B glycosyltransferase gene which are responsible for the weak B variants. However, the influences of these two mutations are unclear. In this study, the effects of the amino‐acid substitution in the catalytic active region of the B glycosyltransferase caused by the novel mutations on GTB expression were explored in vitro system,which is important for further recognizing the ABO subtypes by molecular methods.
Study Design/Method: The ABO antigen and serum antibody of probands were detected by the serology method. The exon5‐7 sequences of the ABO gene were amplified by PCR and sequenced bidirectionally. The full‐length cDNA of wild‐type ABO*B.01 or the mutant B alleles were obtained by gene synthesis, and then cloned into vector pcDNA3.4 TOPO TA eukaryotic expression to construct the recombinant plasmids. The recombinant plasmids were transfected into Hela cells by Lipofectamine 3000 and the stable expression cells were harvested using G418 selection. The stable expression cells were stimulated with sodium butyrate to induce erythroid differentiation. Flow cytometry was performed using the phycoerythrin (PE)‐conjugated murine IgG1 anti‐B antibody on these HeLa cells after transfection, and the agglutination tests of stable expression cells were also examined.
Results/Finding: One of the proband was identified as Bw phenotype, and the other proband was identified as B(A) phenotype. The heterozygous sites in exon5‐7 of the coding region of the ABO gene were identified by directly sequencing analysis. Further haplotype analysis showed that the proband with B(A) phenotype was carried a novel B allele with c.701 C>T (p. P234L). And the other proband with Bw phenotype was carried an another novel B allele c.737A>G (p.Y246C). Both the Amino‐acid substitution positions of these two novel mutations were located in the catalytic active region of blood group B‐glycosyltransferase enzyme. The eukaryotic expression vector of wild‐type ABO*B.01 and the two mutations were successful constructed and confirmed by cloning and sequencing. The stable expression Hela cells were also obtained after recombination plasmid transfection and selection by G418. Compared to the Hela‐B*01 cells, the average fluorescence intensity of Hela‐B(701C>T) is about3.14%, and the Hela‐B(737A>G) is 6.6%. The Flow fluorescence results revealed that large amounts of B antigen was expressd on the surface of Hela‐B*01 cells but only a small amount of B antigen on the Hela‐B(701 C>T) and Hela‐B(737 A>G) cells. The agglutination test showed that the Hela‐B*01 cells had a strong agglutination(4+) with anti‐B, while the Hela‐B(701) cells only had a weak agglutination (+) with anti‐B.
Conclusion: This study demonstrated that the mutation of c.701 C>T and c.737A>G on the exon7 caused to the Amino‐acid substitution in the catalytic active region of blood group B‐glycosyltransferase enzyme, which is contributed to the B antigen expression.
This work was supported by the Science Research Foundation of Zhejiang Province ( LY17H080003) and the Medical Science Research Foundation of Zhejiang Province (2016RCB006, 2017KY315).
IGT56
JK*01 722C>G Associated with Loss of Jka Antigen Expression
Jessica Keller1, Trina Horn2, Shannon C. Jenkins1, Rebecca Robison1, Leslie Thomas1 and Margaret A. Keller*2
1American Red Cross, 2American Red Cross ‐ National Molecular Laboratory
Background/Case Studies: SLC14A1 encodes a multipass transmembrane protein that expresses the Kidd blood group antigens. There is significant genetic variation in SLC14A1, also known as JK, including multiple variant JK*01 and JK*02 alleles that result in weak or null Jka and Jkb antigen expression, respectively. We report here a JK*01 allele that includes a SNP in exon 8 that appears to silence expression of Jka.
Study Design/Method: Peripheral blood from a 31‐year old African American female blood donor was tested for a panel of blood group antigen variants using Agena HemoID DQS (Agena Bioscience) as part of routine testing. The panel found the donor was heterozygous for c.838G/A and thus predicted the donor to type Jk(a+b+). The donor has a history of serologically typing Jk(a‐b+). Genomic DNA was reextracted from the peripheral blood mononuclear cells and total RNA was extracted from RBCs. Sequence‐specific primer (SSP)‐PCR for c.130G>A was performed. SLC14A1 exons 4, 6 and 8 were sequenced based on known null mutations in those gene regions. SLC14A1 exon and cDNA PCR products were subjected to Sanger sequence analysis and the resulting sequences were aligned to the consensus sequence. Variants were compared to the Allele table of the ISBT Working Party for Red Cell Immunogenetics and Blood Group Terminology.
Results/Finding: SSP‐PCR for c.130G>A ruled out the JK*01W.01 allele associated with weakened antigen expression. No changes from consensus were found in exons 4 and 6. The donor was found to be heterozygous for c.722C/G in exon 8. The cDNA PCR product confirmed heterozygosity for c.722C/G and c.838G/A as well as for the synonymous SNP c.588A/G.
Conclusion: A SNP in exon 8 of SLC14A1 was identified in a JK*A allele in a donor whose RBCs typed Jk(a‐). This SNP (rs141539101) is not listed on the JK allele table of the ISBT Working Party for Red Cell Immunogenetics and Blood Group Terminology. The SNP has a reported allele frequency of 0.022% in the ESP Cohort (http://esp.gs.washington.edu). There are two null alleles that have been reported that involve single nucleotide deletions (delA) at the neighboring c.723 (JK*01N.07 and JK*02N.05). The c.722C>G variant reported here results in a threonine to arginine change at amino acid residue 241. This SNP results in the non‐conservative substitution of threonine, with a neutral polar side change, to arginine, with a positively‐charged polar side chain. Given the serologic phenotype of the donor, this allele is likely to be associated with very weak or null expression. This donor is heterozygous, carrying a JK*02 allele expressing Jkb. It would be interesting to determine if RBCs homozygous for the JK*01 variant identified in this donor would be resistant to urea lysis as is reported for RBCs associated with a JK null phenotype.
IGT57
Complex Antibody Mixture in a Pregnant Woman Harboring the RHD*DIIIb Variant Allele
Vincent L. Thonier*1, Cristina Iobagiu2, Sebastien Duboeuf2, Pierre Boutou2, Alexandre Raneri1, Cédric Vrignaud1,3,4, Maxime Thouvenot1, Guy Laiguillon1 and Thierry Peyrard1,3,4
1Institut National de la Transfusion Sanguine, 2Etablissement Français du Sang Auvergne‐Rhône‐Alpes, 3Laboratoire d'Excellence GR‐Ex, 4INSERM UMR_S1134
Background/Case Studies: The RH locus is composed of two highly homologous genes, RHD and RHCE, each of which are composed of 10 exons. They are distributed in an opposite orientation, which facilitates macro or micro gene conversions that can lead to the absence of high frequency antigens, create hybrid proteins encoding low frequency antigens, and create partial antigens. Currently, the Rh blood group system comprises 55 antigens. Gene conversions encode variant proteins, some of which are the so‐called partial D phenotypes. Numerous partial D phenotypes, which are usually identified when a D positive person makes an alloanti‐D, have been described. Partial D are more common in people of African descent. We report here the case of a Caucasian pregnant woman harboring the RHD*DIIIb variant allele with a complex antibody mixture.
Study Design/Method: Standard hemagglutination techniques (including allogeneic and autologous adsorptions) and RHD/RHCE genomic DNA sequencing of the 10 exons with “in house” techniques were performed. Antibody titration was done in LISS‐IAT‐IgG column‐agglutination technique. RhD typing was performed with the DiaClon ABO/Rh (Biorad™), using the IH1000 instrument.
Results/Finding: The patient was from Chechnya. She was admitted in hospital to deliver her third child. No proper follow‐up was done during her pregnancy, and no information was available about her previous pregnancies. She was typed as group AB, D+C‐E+c+e‐, K‐, Fy(a+b+), Jk(a+b+), S‐s+. No RhD weakening was noticed (reaction 4+). The antibody screen showed a complex mixture of alloantibodies: anti‐D, anti‐C, anti‐e, anti‐S, and anti‐K. Their titers were 64, 128, 128, 32, and 4 respectively. An autoantibody against a high frequency antigen on papain‐treated RBCs was also identified. Molecular work was undertaken to confirm the suspicion of a partial D. Genomic testing found this patient to harbor a variant allele RHD*DIIIb (RHD*03.02) in the homozygous or more likely hemizygous state. The sequencing of the RHCE gene showed no alteration and confirmed this patient to be RHCE*cE in the homozygous state. She was typed as G (RH12) negative. Then anti‐G was individualized from anti‐D and anti‐C. Group O, r”r”, K‐, S‐ units were cross‐matched and found to be compatible. An urgent call was made to collect fresh units.
The newborn was typed as group AB, D+C+E+C+e+, K+. At birth his DAT was 3+. Elution showed a panagglutination, which was not investigated due to the small amount of the sample received. His level of hemoglobin was 17.4 g/dL, and the total bilirubin was 45 µmol/L. At day 2 the hemoglobin dropped to 14.4 g/dL and bilirubin was 124 µmol/L. He was treated with phototherapy. At day 5, he was discharged from the hospital. The outpatient follow up was stopped after 2 months when the baby's hemoglobin was 10.4 g/dL.
Conclusion: We report the case of a pregnant woman harboring the RHD*DIIIb variant allele. She had developed an anti‐D in a complex mixture. Luckily, despite the numerous feto‐maternal incompatibilities, the clinical picture of the newborn was mild. The mother is among the few examples of individuals harboring the rare RHD*DIIIb variant allele, which is defined by the conversion of exon 2 of the RHCE gene in the RHD gene. Further serological investigations are needed to better characterize this variant, as it was claimed to have been confused with the original serologically‐defined DIIIb, which was associated with the DIII type 7 variant.
IGT58
Rapid Parallel Genotyping of Various RBC Loci: A Validation Study
Susanne Helmig*1, Sabrina König1, Christoph Gassner2, Beat Frey2 and Sabine Scholz1
1inno‐train Diagnostik GmbH, 2Swiss Red Cross
Background/Case Studies: Blood group compatibility between patient and donor is the key to a safe transfusion. Standard red blood cell (RBC) typing is performed by serological means but the method comes to its limits in cases of pre‐transfusion, the existence of alloantibodies or inaccurate results due to certain antigen variants. Molecular RBC typing can circumvent these problems due to analysis of the DNA sequences coding for the antigens. In this study we analyzed serologically pre‐typed samples with two rapid molecular methods.
Study Design/Method: DNA samples of 26 individuals with pre‐existent blood group serotypes (serotyping for ABO, RhD, RhCE, K/k, JK, Fy, MN and Ss done by standard techniques) were genotyped for RHD, RHCE, KEL, JK, FY, GYPA/B, DO, LU, YT, DI, VEL, CO and KN with a combined PCR‐SSP based TaqMan Probe 96 well assay (RBC‐FluoGene vERYfy eXtend, inno‐train Diagnostik GmbH). The kit detects more than 100 blood group specificities, including RHD DELs, D weak, D neg, categories and partial Ds. 23 of these 26 samples were also typed for ABO (RBC‐FluoGene ABO Basic, inno‐train Diagnostik GmbH). The samples were analyzed by two methods: end point fluorescence and real‐time PCR. The results were automatically evaluated by software.
Results/Finding: With respect to the antigen pairs encoded by the blood group systems JK, Fy, MN and Ss, all zygosities were tested. Above mentioned 26 samples further included samples with rare antigens, such as 1 Kk, 1 Kp(a+b+), 5 Yt(a+b+), 1 Vel+/Vel‐, 1 Kn(a+b+) and 1 Co(a+b+). All of the analyzed samples revealed 100 % concordance between serological and molecular typing, done in this study. Both molecular methods, end point PCR and real‐time PCR, agreed to 100 %.
Conclusion: The study shows that molecular RBC typing methods represent a suitable addition to serology in terms of hands‐on and assay time as well as resolution. In this case, only two assays are required for parallel molecular testing of ABO, RhD, RhCE, Kell, Kidd, Duffy, MNS, Dombrock, Lutheran, Cartwright, Diego, Vel, Colton and Knops. Low manual hands‐on‐time and fully automated result evaluation with assay time of 90 minutes for end point PCR and 70 minutes for real‐time PCR provide a beneficial opportunity for molecular blood group testing.
IGT59
Reevaluating the Incidence of the Goa Antigen in African American Blood Donors
Paula Wennersten*1, Ami Richards1 and Laurie Sutor1,2
1Carter BloodCare, 2UT Southwestern Medical Center
Background/Case Studies: The Goa antigen [RH30] is a low frequency antigen in the Rh system, associated with the partial D antigen category DIVa. It is reported to be found in approximately 2% of black individuals. Our Immunohematology Reference Lab has encountered a number of patients with an alloantibody directed against this antigen and an unexpected number of donors either confirmed or suspected of being Goa positive. It was decided to screen donors of the Ro phenotype (positive for the D antigen; negative for C and E) to determine if this group has a higher prevalence of the Goa antigen.
Study Design/Method: Over a period of 9 weeks segments were removed from 785 D + red blood cell (RBC) units previously found to be negative for the C and E antigens. Initially, all Ro donors were tested without considering ethnicity; later it was decided to check each donor's record to identify those who self‐reported as having African American (AA) ethnicity. Each group O + donor was tested by a gel technique using unlicensed antisera shown to be reactive with 3 different reagent cells positive for Goa and nonreactive with cells positive for the Jsa, He, V, VS, RH32 and STEM antigens. Group A + and B + donors were tested by a gel technique with an eluate prepared from cells used to adsorb plasma containing anti‐Goa. This eluate was also shown to be reactive with 3 cells positive for Goa and nonreactive with the same cells as the antisera as well as cells positive for A1 and B antigens. Goa positive donors were confirmed to have a negative direct antiglobulin test (DAT) in gel.
Results/Finding: Please refer to the following table.
| Total | # Goa + | % Goa + | |
|---|---|---|---|
| Total Ro | 785 | 30 | 3.8 |
| AA Ro | 614 | 30 | 4.9 |
| Caucasian Ro | 136 | 0 | 0 |
| Other Ro | 35 | 0 | 0 |
Conclusion: These results show that AA donors of the Ro phenotype have a higher than expected prevalence of the Goa antigen and statistical analysis indicates that there is sufficient evidence to support this hypothesis (with a significance level of α = 0.05). As expected, the Goa antigen was only found in AA donors. An unexpected finding was the large number of Caucasian Ro donors. While 2‐3% of Caucasians are expected to have the Ro phenotype, 17.3% of the Ro donors we tested were Caucasian. This likely reflects the predominance of Caucasian blood donors and the continued underrepresentation of minorities in our donor base. As efforts to recruit more black Ro donors for transfusion to patients with sickle cell disease become more successful we may see an increase in patients developing antibodies to low frequency antigens found only in the black population. Further study may be warranted to establish the prevalence of such low frequency antigens in Ro RBCs, as they are preferentially transfused to this patient population.
IGT60
The Risk of Unexpected ABO Antibodies Formation in Variant ABO Alleles
Xianguo Xu1,2, Xiaozhen Hong1,2, Yanling Ying1,2, Kairong Ma1,2, Ji He1,2, Faming Zhu1,2, Wei Hu1,2, Xiaofan Zheng1, Feng Chen*1 and Huaping Zhou1
1Blood Center of Zhejiang Province, 2Zhejiang Provincial Key Laboratory of Blood Safety Research
Background/Case Studies: There are over 140 ABO subgroup alleles named by ISBT Working Party. Serological studies have distinguished four main ABO subgroups: A subgroup, B subgroup, cisAB and B(A). Even though some but not all of these subgroups may produce unexpected ABO antibodies, the risk of natural‐ or allo‐immunization in different ABO alleles has not been reported. This study summarized the data collected over a span of ten years on the correlation between ABO alleles and antibodies formation from a Chinese blood center.
Study Design/Method: Samples with discrepancy between red cells and serum grouping were categorized as specific subgroups by standard serological methods. Unexpected anti‐A1 or anti‐B in propositas¡¯ serum was identified using A1 or B red cells. ABO genotyping was performed by polymerase chain reaction sequence‐based typing. The analysis regions include all 7 exons and their flanking sequence, and expression regulatory element in intron 1 of ABO gene.
Results/Finding: A total of 301 samples were confirmed to have the following ABO subgroups: 144 of A subgroups, 97 of B subgroups, 16 of cisAB and 44 of B(A). Sixty‐three variant alleles including 33 ISBT named and 30 unnamed alleles were identified in all samples. Twenty‐eight alleles were found in 144 A subgroup samples where 18 alleles have the unexpected anti‐A1 antibody in propositas¡¯ serum, while 10 alleles had not formed anti‐A1. Similarly, 18 of 27 B variant alleles were found to have unexpected anti‐B antibody in propositas¡¯ serum, and the remaining 9 alleles had not made anti‐B. In cisAB variant, both anti‐A1 and anti‐B were found in all 4 alleles. In B(A) variant, only anti‐A1 were found in all 4 B(A) alleles, but anti‐B were not found in propositas¡¯ serum (See table).
(IGT60)
| Categories | Antibody in serum | N (alleles) | Named alleles | Unnamed alleles (mutations*) |
|---|---|---|---|---|
| A subgroup | Present anti‐A1 | 18 | A2.01, A2.05, A2.08, A2.11, A2.13, A3.07, AEL.01, AEL.02, AEL.08, | 103‐106delG+467T, 280T, 389C, 426C+467T, 467T+565G, 467T+626A, 467T+830C, 467T+838T, 1055insA |
| Absent anti‐A1 | 10 | A2.09, A2.17, A2.18, A2.19, A2.20, AW.09, AW.11 | IVS1 + 5890G, 1G+467T, 467T+731C, | |
| B subgroup | Present anti‐B | 18 | B3.01, BW.03, BW.07, BW.11, BW.12, BW.19, BW.27, BW.28, BW.34, BEL.03 | IVS1 + 5890G, 398C, 484delG, 518C, 586C, 734T, 910G, 928G |
| Absent anti‐B | 9 | B3.05, BW.32 | IVS1 + 5904T, 3‐4delG, 28A, 98C, 125insT, 256A, 737G, | |
| cisAB | Present anti‐A1 and anti‐B | 4 | cisAB.01, cisAB.03 | 467T+803C+1009G, 796C |
| Absent anti‐A1 and/or anti‐B | 0 | N/A | N/A | |
| B(A) | Present anti‐A1 | 4 | BA.02, BA.04, BA.06 | 701T |
| Present anti‐B | 0 | N/A | N/A |
Differences compared to ABO*B.01 are given in B subgroup, B(A) and cisAB.796C alleles.
Conclusion: There are alleles that do not produce unexpected ABO antibodies, such as ABO*A.1G+467T, B3.05, B.3‐4delG and B.28A alleles. Therefore, understanding the different risk of unexpected ABO antibodies formation in variant ABO alleles is essential to safe transfusion.
The work was supported by two Science Foundations of China (81570170, WKJ‐ZJ‐1510) and Zhejiang High‐Level Innovative Health Talents.
IGT61
Could Avoiding Activated Platelets Improve the Success Rate of HLA Matched Transfusions?
Elisabeth Maurer‐Spurej*1 and Kate Chipperfield2
1University of British Columbia, 2BC Children's Hospital
Background/Case Studies: Up to 35% of patients who depend on platelet (PLT) transfusion support become refractory to platelets. Of this refractoriness, 3‐5% can be attributed to alloimmunization (primarily HLA antibody mediated) with consecutive 1‐hr corrected count increments (CCIs) below 7.5x10⁹/L. According to current clinical practice HLA‐positive refractory patients may receive HLA‐matched PLTs, however only about 26% of these transfusions result in adequate count increments. This retrospective analysis investigated the possibility that platelet activation status affects the success of HLA matched PLTs.
Study Design/Method: A clinical study conducted at the Vancouver General Hospital, Canada from 2011 to 2014 enrolled 200 hematology/oncology patients. Patient baseline data including human leukocyte antibody (HLA) status and pre‐ and post‐transfusion PLT counts as well as PLT transfusion characteristics including PLT activation status were prospectively collected. Platelet activation status was measured as microparticle (MP) content (ThromboLUX, LightIntegra Technology Inc., Canada). The optimal threshold to predict PLT activation in single donor platelets (SDP) suspended in plasma was previously determined as 15% (specificity = 89% and sensitivity = 55%). The clinical response to activated and non‐activated SDP was compared for all HLA‐positive and HLA‐negative study patients.
Results/Finding: Twenty one of 200 patients (10.5%) tested positive for anti‐HLA antibodies (HLA‐positive), 8 became refractory with insufficient 1‐hr and 24‐hr CCIs following two consecutive random PLT transfusions and 5 patients showed only insufficient 24‐hr CCIs. Baseline data for HLA‐positive and HLA‐negative patients were comparable. HLA‐positive patients were 33% male, 51.5 ± 13 years of age, diagnosed with AML (81%), CML (14%) and MDS (5%), baseline platelet counts were 81 ± 71 × 109/L and WHO bleeding >1 was rare. However, the average length of stay was 30 ± 7 for HLA‐positive patients compared to 19 ± 9 days for HLA‐negative patients. HLA‐positive patients responded to non‐activated PLT transfusions with significantly lower platelet recovery (1‐hr CCI) than HLA‐negative patients: 8.3 ± 8.8 vs. 14.3 ± 8.1 (p=0.002 at 95% significance level). Only one patient, a 65 yr old male with AML, received HLA‐matched PLTs that were characterized for PLT activation status. On the first 9 treatment days the patient received 12 PLT transfusions with increasingly insufficient CCIs. Two HLA matched transfusions were unsuccessful but 3 non‐activated PLTs successfully increased the CCIs (see Table).
Conclusion: Selecting non‐activated random PLTs for transfusion to HLA‐positive patients did not achieve sufficiently high 1‐hr CCIs in HLA‐positive patients. However, only non‐activated HLA matched PLTs restored both 1‐hr and 24‐hr CCIs in one alloimmunized patient. Additional studies are needed to determine whether non‐activated platelets could improve the success rate of HLA‐matched transfusions.
| PLT Transfusion | |||||
|---|---|---|---|---|---|
| Treatment day | HLA status | PLT activated | MP% | 1hr CCI | 24hr CCI |
| 10 | random | yes | 37.3% | −0.59 | −3.11 |
| 10 | matched | yes | 29.0% | 3.82 | 8.92 |
| 11 | matched | yes | 29.0% | 2.00 | 2.00 |
| 12 | matched | no | 13.0% | 8.81 | 4.95 |
| 18 | matched | no | 14.0% | 16.26 | 9.53 |
| 21 | matched | no | 1.0% | 15.25 | 10.89 |
| 25 | random | no | 10.0% | 16.93 | 11.07 |
IGT62
Discrepant Donor ABO Blood Group between ID‐MTS Gel Card and Test Tube Methods Identified as Rare Aw29 / O013
Jules G. Zinni*1, Jason Kang2, Kerry W. Lannert3, Jill M. Johnsen3, Catherine Saporito2 and Gregory Wright2
1Northwestern Memorial Hospital, 2NorthShore University HealthSystem, 3Bloodworks NW Research Institute
Background/Case Studies: ABO is one of the most genetically diverse blood group systems, with over 200 ABO alleles described. The ABO reference allele encodes an ABO glycosyltranferase that produces the common A1 phenotype. DNA variation in the ABO gene can vary ABO enzyme specificity (i.e. A vs. B) and/or impact ABO expression or activity. The majority of ABO alleles are weak or null, and weak phenotypes can sometimes confound serology. In cases with ABO unexpected or discrepant results, ABO gene sequencing can be informative. Here we report a case of a donor who tested group O with gel phase automation, but in tube tested as group A. ABO sequencing implicated an ABO*AW.29 allele as the cause of the discrepancy.
Study Design/Method: A sample from a healthy volunteer blood donor was submitted for routine testing. ABO testing was performed by automated ID‐MTS Gel Test. Anti‐A1 lectin (Ortho‐Clinical Diagnostics, NJ) and Lewis blood group (ALBAclone, UK) testing was performed by tube test. ABO genotype was performed using a custom long range ABO PCR spanning exon 2‐7, followed by cloning (NEB PCR Cloning Kit) and Sanger DNA sequencing. For annotation, we referenced ISBT table and ABO transcript NM_020469.2.1.
Results/Finding: In gel, the sample displayed negative forward reactions with anti‐A and anti‐B, and in reverse showed agglutination against A1 and B cells. In tube, the donor cells exhibited 1 + mixed field with anti‐A,B and anti‐A and did not react with anti‐B. These tests were repeated on multiple sample collections with the same result. The donor was also negative with anti‐A1 (DBA) lectin, positive with anti‐Lea, and negative with anti‐Leb. Cloning and sequencing of ABO exons 2‐7 permit simultaneous sequence data and physical phasing to accurately annotate ABO alleles. This donor was predicted to have an A weak phenotype due to heterozygosity for ABO*AW.29 (ABO c.[311 T>A]) and ABO*O.01.02 (ABO c.[106 G>T; 188 G>A; 189 C>T; 220 C>T; 261 delG; 297 A>G; 646 T>A; 681 G>A; 771 C>T; 829 G>A]).
Conclusion: We here describe discordant ABO gel and tube forward testing results in a donor hemizygous for an A weak allele (ABO*AW.29 allele). Determination of phase informed assignment of heterozygous DNA variants to specific alleles to inform an accurate red blood cell genotype. We conclude that ABO*AW.29 can be associated false negative A results using gel card methods. Whenever possible, ABO blood group typing should include two different forward methods and consider the reverse type to detect unusual ABO subtypes; discrepancies can be resolved by DNA sequencing.
IGT63
International Validation of FDA DNA Reference Panel for Blood Group Genotyping
Evgeniya Volkova*1, Emilia Sippert1, Meihong Liu2, Teresita Mercado2, Gregory A. Denomme3, Orieji Illoh2, Zhugong Liu2 and Maria Rios1
1FDA/CBER, 2OBRR, CBER, FDA, 3Immunohematology Reference Laboratory, Versiti / BloodCenter of Wisconsin
Background/Case Studies: Multiply transfused patients are at risk of alloimmunization and consequent hemolytic transfusion reactions. Extended blood group typing of RBCs is an effective tool to reduce the occurrence of such reactions. However, molecular genotyping is a valuable option when phenotyping reagents are unavailable or a recent transfusion obfuscates the true phenotype. Moreover, genotyping makes possible the creation of large‐scale extensively characterized donor repositories, which would be impractical using traditional serological methods. The paucity of well‐validated reference panels has been a barrier to development, standardization, and quality control of genotyping technologies, since manufacturers and users of genotyping kits have to rely on clinical materials for reference. Our aim was to develop and validate a well‐characterized, renewable DNA reference panel for standardization of blood group genotyping.
Study Design/Method: More than 30,000 blood donors were screened by a collaborating blood establishment, and 53 donors were selected based on the results of RBC phenotyping and/or genotyping. Their samples were analyzed by Sanger sequencing, TaqMan assays, PCR‐SSP, and PCR‐RFLP to characterize blood group polymorphisms. Their peripheral blood mononuclear cells were isolated and subjected to EBV transformation to generate immortalized B‐lymphoblastoid cell lines. Bulk genomic DNA extracted from these cell lines was lyophilized to produce an 18‐member reference panel that encompasses genetic variants of 41 polymorphisms of interest. An international collaborative study involving 28 different laboratories was coordinated to validate the panel. Stability and accelerated degradation studies were performed up to the 1 year time point.
Results/Finding: Participants of the collaborative study used a wide variety of methodologies and collectively performed 743 genotyping tests producing 13,374 results. Analysis of genotyping results showed an overall agreement of 98.5% with the expected outcomes. Highest levels of discordance were observed for RHD/D─deleted, KN c.4681G>A, CROM c.679G>C and OK c.274G>A polymorphisms limiting the value of the panel for these antigens. Results of stability and accelerated degradation studies showed a stable concentration of DNA and no degradation of the material at any of the tested time points.
Conclusion: We have developed and validated an 18‐member renewable DNA reference panel for blood group genotyping by means of an international collaborative study. This panel will aid development of new genotyping technologies and assays, improve quality control of currently available kits, and promote better clinical outcomes for transfused patients. The panel is available upon requests made by device developers and users.
IGT64
Identification of a Rare RHD*DAU Variant in a Blood Donor with Current and Historical D Typing Discrepancy
Grace B. Sese*1, Ghislain Noumsi2, Srilatha Jayavarapu3, Nicholas Lilly3 and Terri Craddock3
1Inova Fairfax Medical Campus, 2Grifols Diagnostic Solutions Inc., 3Inova Blood Donor Services
Background/Case Studies: The Rh system is the most polymorphic blood group system in humans. It is the second most immunogenic next to the ABO system. RHD polymorphism shows substantial ethnic variability. The partial D alleles are diverse which includes the DAU alleles evident at the molecular level. The RHD*DAU2 allele is a rare partial D variant. We report a D typing discrepancy in a female blood donor who initially typed as Rh negative on a previous donation 10 years ago.
Study Design/Method: D typing was performed using three different FDA licensed reagents and FDA 510(k) cleared devices from three different manufacturers. Methods include microplate hemagglutination, column agglutination technique (gel) and test tube. DNA‐sequencing of RHD exon 1 to 10 was performed using Sanger bi‐directional DNA sequence analysis.
Results/Finding: Previous D typing using microplate hemagglutination and weak D testing using tube method were both negative. On subsequent donation, microplate hemagglutination gave a positive result and weak D testing was 1+. Additional testing using column agglutination method was negative. DNA‐sequencing results revealed the presence of a c.1136C>T (Thr379Met) in RHD exon 8, characteristic of the DAU cluster. Two other modifications c.209G>A (Arg70Gln) and c.998G>A (Ser333Asn) were found respectively in RHD exon 2 and exon 7. The presence of these mutations were characteristic of the presence of RHD*DAU2, with a predicted partial weak D phenotype.
| Serology (04/11/2006) | ||
|---|---|---|
| Test Method | Anti‐D Test Result | Interpretation |
| Microplate Hemagglutination | 0 | Negative |
| Tube method | IS: Negative Weak D : 0 | Negative |
| Serology (10/18/2017) | ||
|---|---|---|
| Test Method | Anti‐D Test Result | Interpretation |
| Microplate Hemagglutination | + | Positive |
| Column agglutination (Gel) | ‐ | Negative |
| Tube method | IS: Negative Weak D : 1+ | Positive |
| DNA‐Sequencing (Results on 10/20/2017) | ||||
|---|---|---|---|---|
| Segments | Nucleotide changes | Amino acid changes | Genotype | Predicted phenotype |
| Exon 2, 7, 8 | c.209G>A, c.998G>A, c.1136C>T | p.70Arg>Gln, p.333Ser>Asn, p.379Thr>Met | RHD*DAU2 | Partial weak D |
Conclusion: The 70Gln and 333Asn amino acid changes are located in the inner boundary of the red blood cell (RBC) membrane. These changes affect D antigen integration and proper expression, with drastic decrease of D antigen density. Such individuals react differently when tested with various anti‐D monoclonal antibodies. The accessibility to a referral laboratory for genomic testing is important for timely identification of these variants.
References
- Bonet Bub, C. , Aravechia, M. G. , Kondo, A. , de Souza, A. , Sakashita, A. , Yokoyama, A. P. , et al. (2017). Molecular Characterization of two novel Weak D type Alleles in Brazilians. Transfusion, 151A.29030954 [Google Scholar]
- Reid, M. , Lomas‐Francis, C. , & Olsson, M. (2012). The Blood Group Antigen Facts Book. Cambridge: Academic Press. [Google Scholar]
- Srivastava, K. , Polin, H. , Sheldon, S. , Wagner, F. F. , Grabmer, C. , Gabriel, C. , et al. (2016). The DAU cluster: a comparative analysis of 18 RHD alleles, some forming partial D antigens. Transfusion, 2520‐2525. [DOI] [PMC free article] [PubMed] [Google Scholar]
- Wagner, F. F. , Ladewig, B. , Angert, K. S. , Heymann, G. A. , Eicher, N. I. , & Flegel, W. A. (2002). The DAU allele cluster of the RHD gene. Blood, 306‐311. [DOI] [PubMed] [Google Scholar]
IGT65
Antigen Screening by Serology in a Molecular World: Microplate (MCP) Proves Itself as a Stalwart Method
Alexander Delk1, Richard Gammon*2, Nancy Benitez2 and Maria Bravo2
1OneBlood, Immunohematology Reference Laboratory, 2OneBlood, Inc
Background/Case Studies: Demand for red blood cell (RBC) antigen negative products continues to rise. This has been triggered by studies suggesting that RBC more closely matched to the patient may decrease the likelihood of alloimmunization. This creates the need for blood centers to employ high‐volume screening methods. In addition, the demand for high‐incidence antigen negative RBCs must match the need. There are several methods that can be applied such as standard tube, automated serology, microplate (MCP), and molecular HEA BeadChip (HBC). HBC strength is its ability to test many antigens simultaneously. Its shortcomings include cost and its limitation to detect many null phenotypes, especially in RH, K, and JK systems (detectable by serology). Our immunohematology reference lab relies on screening by serology and MCP was initially chosen for its high‐volume capability with the focus on screening common antigens: CEce, K, FyaFyb; JkaJkb; Ss. The algorithm was expanded to include directed testing based on ethnicity and broad testing for high‐ and or low‐incidence antigens based on antisera availability. Newly encountered high‐incidence antigen negative donors were sent for testing with HBC.
Study Design/Method: RBC units were sorted based on three ethnicities: African American, Hispanic, and Caucasian. Units were tested for CEce, K, and Kpb to detect any K0 donors. Units that were negative for two of four Rh and K antigens were further tested for FyaFyb; JkaJkb; Ss. Units that were K+, regardless of RhCE types were tested for k by MCP. Units that did not meet the above criteria were not tested further. For the African American and Hispanic ethnicities Jsa and Dia were also tested. Units that typed Js (a+) or Di (a+) were tested for Jsb or Dib respectively. Those found to be Js (b‐) or Di (b‐) had HBC requested. In addition units that typed S‐s‐ were submitted for HBC.
Results/Finding: In 2017 27,671 RBC units were screened, of these, 13,132 were either R1R1, R0R0, rr, or R2R2. These units were further tested for FyaFyb; JkaJkb; Ss. Additional antigen testing found the following: Dia 334, Dib 277, Kpa 174, k 826, Kpb 1700, M and/or N 1823, Yta 333, Lub 1780, and Jsb 266. In total 222,212 antigens were tested by MCP screening method. Several units negative for high‐incidence antigen (k, Jsb, and U) were discovered. We did not find any units with null phenotpyes from the RH, K, or JK systems.
Conclusion: The use of combined serology (MCP) and molecular HBC algorithm allowed us to nimbly adapt to specific needs based on changing patient population. The MCP method was instrumental to support of the ever‐increasing antigen negative unit requirements. While low resolution molecular screening methods have their strength and are increasingly commonplace, serologic screening permitted for detection of rare donors that could be missed by molecular methods and provided for inexpensive screening of a large number of donor units. Numbers like these proved that MCP is a true stalwart method.
IGT66
Relationship of Antibody Reactivity Strength to Reactivity in the Monocyte Monolayer Assay (MMA)
Joan L. Maurer*1, Sandra J. Nance2 and Pamela Nickle3
1ARDP, 2American Red Cross and American Rare Donor Program, 3American Red Cross
Background/Case Studies: The MMA is used to predict the clinical significance of alloantibodies. Antibody binding of sensitized RBCs is determined by the performance of an Indirect Antiglobulin Test. It might be expected that a strong antibody would more likely to result in a positive MMA and a weakly reactive antibody would be more likely to result in a negative MMA.
Study Design/Method: The MMA is performed by using antigen positive and antigen negative red blood cells in cases of a known antibody specificity. The selected RBCs are incubated with the patient's serum, with and without a source of fresh complement present. Each red blood cell tested is also incubated with saline (saline controls) to control for any increased reactivity that might be present with the RBCs alone. The RBC sensitization is performed by incubating tubes in a water bath at 37C for one hour, with intermittent mixing. Antiglobulin tests are performed on all red cell samples using anti‐IgG and anti‐C3, including the saline controls. This study is focused on comparing the reactivity of the antibody coated RBCs and the MMA results. A positive MMA is defined as >3% reactive monocytes, and negative ≤3% reactive monocytes. A negative MMA results in a recommendation that the patient can receive antigen positive units with no clinical reaction expected. MMA results from_81 referrals were reviewed.
Results/Finding: Most samples (73%) with 2‐4 + indirect antiglobulin tests are positive (above the 3% cutoff), however, 27% demonstrate reactivity below the cut‐off. This 27% include examples of anti‐Jra, ‐Yta and ‐Lan. It is also noteworthy that 32% of the samples with indirect antiglobulin results of 1 + or less demonstrated significant reactivity, including one Anti‐Vel with a negative antiglobulin test.
Conclusion: Clinical significance of antibodies has been assumed based on antibody specificity or strength of reactivity. The MMA results show that these two characteristics do not necessarily correlate with clinical significance as might be expected. It is important to evaluate each patient's results on a case‐by‐case basis; the use of MMA is of value in the assessment of clinical relevance of a specific patient's antibody.
IGT67
Novel JKA Silencing Polymorphism
Katarzyna Bielen*1, Dolores Figueroa2 and Tyler Hutchinson3
1Indiana Blood Center, part of Versiti, 2Blood Systems Laboratories, 3Immucor
Background/Case Studies: SLC14A1 gene on chromosome 18 encodes for the KIDD(JK) glycoprotein which carries the blood group system antigens: Jka(Jk1), Jkb(Jk2) and Jk3. The protein encoded by this gene is a membrane transporter that mediates urea transport in erythrocytes. The JK glycoprotein consists of 10 intramembrane domains and 5 extracellular loops. Jka and Jkb antigens expression results from a single nucleotide polymorphism 838G>A in exon 9, Asn280Asp. The antigens are located on the 4th extracellular loop. Several mutations identified in exon 7 and intron 9 are responsible for weakened expression of the JK antigens. We are reporting a novel silencing mutation discovered due to discordance between the serological and predicted molecular Jka phenotype of a red cell donor who self‐identified as White, not Hispanic.
Study Design/Method: Genomic DNA was extracted from EDTA whole blood samples using automated magnetic particle nucleic acid purification method. The DNA was tested by multiplex PreciseType™ HEA Molecular BeadChip Test (Immucor, BioArray Solutions, NJ, USA). Both nucleotides associated with JKA and JKB polymorphisms were present, which predicted the Jk(a+b+) phenotype. Historical serological phenotypes on two separate donations showed the phenotype as Jk(a‐b+). A third serological typing on a new sample using monoclonal Anti‐Jka (Bio‐Rad) confirmed the previous Jk(a‐b+) phenotype. Subsequently, a bi‐directional sequencing study was performed with Applied Biosystems 3730xl DNA analyzer using BigDye® Terminator v.3.1 sequencing kit (Life Technologies Co., CA, USA) and DNA was analyzed using Geneious Pro 5.1.7 (Biomatters, Auckland, NZ) bioinformatics software platform. The obtained nucleotide base sequence was compared against NCBI Reference Sequence NG_011775.3.
Results/Finding: The sequencing analysis revealed a 15‐nucleotide deletion at c.522_536del (p.VAL_Pro179del) in exon 7 that does not impact the downstream nucleotide sequence. Mutations in JK exon 7 at the 511 or 548 nb locations have been implicated with the presence of an aberrant weak Jka antigen which may or may not be detected by serological methods. This novel in‐frame mutation can produce abnormalities in the JK 3rd extracellular loop that results in the lack of expression of the Jka antigen on the final protein.
Conclusion: A novel mutation ensuing from 15‐nucleotide deletion was discovered when investigating a Jka antigen typing discrepancy between the predicted molecular phenotype and the serological expressed phenotype. This mutation has been shown to silence the Jka antigen expression. More testing is needed to better understand the mechanism underlying the aberrant effect of this in‐frame mutation on the antigen expression and its significance.
IGT68
Fatal Hemolytic Disease of the Fetus and Newborn Associated with Anti‐Jra Alloimmunization
Marwa H. Aly*, Mozah S. AlKhrousi, Abeer M. AlSheikh, Hanan M. Juhail, Nithin Varghese and Reem A. Al‐Radwan
Kuwait Central Blood Bank
Background/Case Studies: 39 years pregnant Kuwaiti patient G3P1, with no prior history of transfusion. Her second baby died 48 hours post‐delivery from severe hemolysis and hyperbilirubinemia. Her current antenatal screening revealed anti‐Jra antibody in her plasma. Close fetal monitoring was recommended and family study was initiated, where one of her brothers was Jra negative. However at 28 weeks gestational age, ultrasound revealed cardiomyopathy, ascites, intrauterine growth retardation with signs of fetal anemia, thus urgent intrauterine transfusion (IUT) was requested and fetal hemoglobin was 5 gm/dl. However only 70ml Jra negative RBC were transfused intrauterine due to fetal tachycardia, and immediate caesarian section was performed. Baby was born premature, 1.250 Kg, with hydrops fetalis, ascites, pleural effusion. His laboratory investigations showed reticulocytosis, high indirect bilirubin, normoblastemia and spherocytosis in blood film, hemoglobin level was 8 gm/dl. Baby was ventilated, received 2 doses of intravenous immunoglobulin. He did not require exchange transfusion. Baby improved by day 14 and his hemoglobin level was maintained at 15 gm/dl after receiving Jra negative RBC 4 times.
Study Design/Method: Antibody identification was performed on mother's serum during pregnancy using LISS indirect antiglobulin test, in addition to allogeneic adsorption using donor red cells with same extended phenotype of patient.
Results/Finding: Patient has an antibody against high prevalence antigen which could not be identified, thus samples were referred to reference laboratory which indicates patient typing as Jra negative with anti‐Jra antibody reacting moderate strength by LISS indirect antiglobulin test with untreated and papain treated cells. Upon delivery baby's direct antigobulin test and eluate were negative and his plasma reacted positive by indirect antiglobulin test showing anti‐Jra antibody.
Conclusion: Since the phenotype Jra negative is very rare, the clinical significance of anti‐Jra antibodies is not well‐established either in cases of Jra incompatible transfusions of RBCs or in the ability to cause hemolytic disease of fetus and newborn (HDFN). In most of the described cases in the literature, HDFN did not occur and when occurred, its intensity was mild to moderate and often required no treatment beyond phototherapy. However two fatal cases have been reported. Thus this case highlights the need for preventive management and close fetal monitoring, especially if the mother has a high antibody titer.
Since Jra negative RBC units are very difficult to obtain, measures must be taken to ensure the availability of appropriate blood types. Autologous donations should always be considered; in addition, siblings are also potential donors of Jra negative RBCs.
IGT69
Risk of RBC Alloimmunization in Multiple Myeloma Patients Treated by Daratumumab
Zhan Ye*, Laurie Wolf and Fred Plapp
Kansas University Medical Center
Background/Case Studies: Daratumumab (DARA) is a human monoclonal antibody for the treatment of multiple myeloma (MM). DARA binds to CD38 on RBCs and interferes with detection of RBC alloantibodies. The goal of this study was to evaluate the risk of RBC alloimmunization in MM patients treated with DARA.
Study Design/Method: A retrospective study of the serological profile and transfusion history of 78 MM patients treated with DARA from July 2015 to March 2018 was undertaken. All cases with positive Ab screens were treated with DTT to identify RBC alloantibodies. Patients were divided into two groups: 26 patients who had been transfused and 52 patients who had not. RBC transfusion history was monitored between the first DARA dose to the last in those patients who had negative Ab screens or extending to the first negative Ab screen after the last DARA dose if the Ab screen was ever positive. The number of RBC units transfused and the degree of RBC Ag match [ABO‐Rh compatible or phenotypically matched (P‐RBC)] were also recorded.
Results/Finding: In the transfused group, none of 26 patients had a positive Ab screen prior to the first DARA treatment. 24 of these patients developed positive Ab screens during treatment and 2 patients' Ab screens remained negative. The duration of Ab screening positivity varied markedly, ranging from 26 days to 5 months after the last dose. Totally 140 Ab screens were done on those patients and none of them showed detectable alloantibodies after DTT treatment. Among these 26 patients, 10 were transfused with both ABO‐Rh compatible RBCs (average 3.4) and phenotypically matched (average 5.4) units. 15 patients only received ABO‐Rh compatible (average 4) units and 1 patient only received P‐RBC (3 units).
In the non‐transfused group, only 11 of 52 patients had 1 or 2 Ab screens performed with 10 patients having a positive screen. After DTT treatment, only 1 patient was found to have a cold autoantibody 3 months after the last dose of DARA. It was undetectable 1 month later. This patient had a serologic history of anti‐D and anti‐C 9 years before the first DARA dose. These alloantibodies never reoccurred during treatment.
Conclusion: To our knowledge, this is the first study of the incidence of RBC alloimmunization in patients treated with DARA. Our results indicate that the risk of forming new RBC alloantibodies during treatment is very low, probably due to DARA mediated immunosuppression. There was no difference in the risk of RBC alloimmunization following transfusion of either ABO‐Rh compatible or phenotypically matched RBC units.
IGT70
Prevalence and Specificity of Irregular Red Blood Cell Antibodies in a Pediatric Population
Rosaura S. Diez*, Blas G. Magaldi, Julieta M. Boo, Marcela A. Rimoldi, Silvina A. Lopez, Facundo M. Garcia, Nerina Y. Picca and Ana M. Pugliese
Hospital Garrahan
Background/Case Studies: Prevalence and specificity of red blood cell antibodies (RBCa) vary widely among different areas, races, diseases and methods of study. Few data are available in pediatric population. RBCa are directed against antigens expressed on RBC membrane and it can be responsible for hemolytic transfusion reactions and other complications. Appropriate screening for RBCa is essential for ensuring transfusion compatibility. When clinically significant antibodies are detected in patients requiring transfusions, transfusion services must find and administered RBCs lacking the corresponding antigens. Much time and effort are spent in detecting and identifying RBCa. The omission of pretransfusion tests (PT) or their inability to recognize it can be dangerous. We evaluate prevalence of RBCa in a pediatric hospital.
Study Design/Method: Retrospective transversal study. Records of all patients (n: 25976) performed PT from 2009 to 2016 were analyzed. Those who presented positive RBCa detection were selected. Blood samples were typed for ABO/D in gel method (Diamed, Grifols) and screened for RBCa using a selected 3/4 cell set of reagent RBCs also in gel. Antibody identification was accomplished with commercial panels of 11 cell set by similar methods or additional techniques (e.g., PEG and enzyme) whenever needed.
Results/Finding: Irregular RBCa were detected in 461 of 25976 pediatric patients screened (1.77%), 238 females and 223 males. 52% of patients had at least one RBC transfusion, 23% in our hospital and 29% in another center. Of the antibodies detected: 35 were autoantibodies, 62 a panaglutinin (61.3% female) and 364 (79%) alloantibodies. We identify the alloantibody in 76%: 240 (88%) had one RBCa, 27 (10%) had two and 6 (2%) had three. The frequency of identified alloantibodies: antiM 109 (40%), antiE 39 (14.3%), antiK 19 (7%), antiD 16 (5.9%), antiLea 13 (4.8%), antiJka 11 (4%), antiLua 10 (3.7%), antiLeb 6 (2.2%), antiP1 4 (1.5%), antie 4 (1.5%), antiKpa 3 (1.1%), antic, antiS and antiJkb 2 (0.7%) each.
Conclusion: We showed that the overall prevalence of antibodies in our pediatric population was 1.77%, with 1.4% alloantibodies. The clinically important irregular antibodies identified were against Rh, Kell, Duffy, Kidd and Ss systems. The high frequency of anti‐M can be correlated with the age of presentation of this antibody mainly in children and mostly natural. Extensive RBC antigen matching including the Rh and Kell systems should be considered in politransfused patients regardless their basal disease, in order to avoid alloimmunization and hemolytic transfusion reactions.
IGT71
New Human Monoclonal IgM Anti‐Fyb Reagent Shows Stronger Reactivity for the Detection of Weak Fyb Antigen
Ghislain Noumsi*1, John D. Roback2, Marijane Blunk1 and Maria Huber1
1Grifols Diagnostic Solutions Inc., 2Emory University School of Medicine
Background/Case Studies: Weak Fyb antigen can be missed by some commercial antisera. Individuals with FY*X allele show a pronounced reduction of Fyb antigen. However, the amount of Fyb antigens present on the red cells of these individuals is sufficient for inducing anti‐Fyb production and potential hemolytic transfusion reaction. Here, we report the results of a new monoclonal anti‐Fyb (Human IgM anti‐Fyb clone SpA264LBg1) for detecting Fyb antigen, and weak Fyb antigen expressed by FY*X individuals.
Study Design/Method: Random de‐identified samples from blood donors and patients were tested in duplicate using the new anti‐Fyb reagent, at five major clinical sites across the U.S.A. following IRB approval (4 blood centers with immunohematology reference laboratories, 1 hospital with a transfusion service laboratory). Fyb testing was performed using tube method/immediate spin. Results were compared to results using predicate methods that were FDA licensed reagents and FDA 510(k) cleared device(s). In addition, 6 samples previously characterized as FY*X by molecular method were tested for Fyb antigen. For each sample, a Wilcoxon signed‐rank test was performed to evaluate the difference in the strength of reactivity using the new anti‐Fyb reagent and the predicate method.
Results/Finding: A total of 1,275 samples were tested for Fyb antigen expression. Serology was used as predicate for 713 samples, and their strength of reactivity was compared.
Table: Strength of reactivity
| Human anti‐IgM monoclonal anti‐Fyb (clone SpA264LBg1) | ||||||||
|---|---|---|---|---|---|---|---|---|
| Predicate (Serology) | 0 | W+ | 1+ | 2+ | 3+ | 4+ | Total | |
| 0 | 242 | 0 | 0 | 1 | 0 | 0 | 243 | |
| W+ | 0 | 0 | 1 | 0 | 0 | 0 | 1 | |
| 1+ | 0 | 1 | 0 | 0 | 2 | 1 | 4 | |
| 2+ | 0 | 0 | 0 | 87 | 193 | 33 | 313 | |
| 3+ | 0 | 0 | 0 | 15 | 60 | 76 | 151 | |
| 4+ | 0 | 0 | 0 | 0 | 1 | 0 | 1 | |
| Total | 242 | 1 | 1 | 103 | 256 | 110 | 713 | |
The new anti‐Fyb reagent showed a strength of reactivity that was at least 1 grade stronger for 306 samples (42.9%) as compared to typing results using predicate. Moreover, 37 samples (5.2%) showed a reaction strength that was at least 2 grades stronger with the new antisera as compared to the predicate (0 vs 2+; 1 + vs 3+/4 + or 2 + vs 4+). Overall, the stronger reactivity of the new anti‐Fyb was statistically significant when comparing the results for each sample (p<0.0001). For all 6 FY*X samples, Fyb typing was negative using the predicate. When tested with the new anti‐Fyb, 5 of these samples showed a W + reaction and one sample reacted 1+. For 1 sample typed Fy(b‐) with predicate and 2 + with the new anti‐Fyb, investigation by the referee showed that this discrepancy was due to a clerical error.
Conclusion: The Human IgM monoclonal anti‐Fyb (clone SpA264LBg1) shows stronger reactivity with Fyb antigen, when compared to other FDA approved reagents. This monoclonal reagent is effective for routine Fyb antigen typing, and can detect weak Fyb antigens, as those expressed by FY*X individuals.
IGT72
Incorporation of Red Cell Genotyping to Improve Chronic Transfusion Therapy at a Children's Hospital
Nancy L. Van Buren*1,2, Jed B. Gorlin1,2, Sandra K. Cassidy2, Susan M. Corby1, Stephen C. Nelson2 and Stephanie A. FritchLilla2
1Innovative Blood Resources, 2Children's Hospitals and Clinics of Minnesota
Background/Case Studies: Children with transfusion dependent anemia, such as sickle cell disease (SCD) and thalassemia, are at an increased risk for developing red blood cell (RBC) alloantibodies due to their lifelong need for transfusion therapy. With the advent of genotyping, an extended RBC antigen panel can successfully be incorporated into chronic transfusion therapy programs (CTTP) to more precisely match blood for this population of patients.
Study Design/Method: Key members of the transfusion service (TS), immunohematology reference laboratory (IRL), and hematology clinic (HC) caring for children with sickle cell disease, thalassemia, and other hemoglobinopathies met to develop a chronic transfusion therapy program to benefit these patients to help minimize the risk of red cell alloimmunization. The children enrolled had baseline genotyping performed, including 37 RBC antigens, as well as detection of the FY*B_GATA mutation and other possible significant mutations in the Rh system. Forms were developed to assist with communication between the HC, TS, and IRL. Transfusion intervals and volumes for each patient were estimated to obtain the freshest (less than 2 weeks) blood available and matched in the Rh and Kell systems for those with negative antibody screens. Double RBC units were collected when possible for patients requiring more than 1 unit in a single transfusion episode. Patients who developed RBC alloantibodies were switched to phenotypically matched RBCs to prevent the development of additional antibodies based on their profile.
Results/Finding: Since the inception of the program in June 2016, 29 patients with the following disorders were enrolled: 10 with SCD, 17 with thalassemia, and 2 with other disorders. At enrollment, 6 (21%) had RBC alloantibodies, including 2 SCD patients with anti‐e, who previously received C‐E‐K‐ phenotypically matched blood, but were found to have variant e antigen by genotyping. Of those children without alloantibodies at enrollment, 1 (4%) developed antibody (anti‐S) following the provision of RBCs matched for the Rh and Kell systems. Of those with antibodies who received extended‐match units, none developed additional alloantibodies.
Conclusion: Genotyping was successfully incorporated into this CTTP to provide more precisely matched blood, reducing the risk of RBC alloantibody development. Much more information is provided with a genotype compared to traditional serologic phenotyping and without the expense of cell separation techniques in recently transfused patients. Prevention of RBC antigen sensitization helps to avoid costly serologic work‐ups, prevent delayed hemolytic transfusion reactions, and improves blood management. An additional benefit includes improved availability of blood for patients with otherwise rare blood types, particularly when the GATA mutation is present.
IGT73
Frequency of the Blood Group Allele Encoding INRA (023.005) Among 5,261 Blood Donors in Surat, Gujarat, India
Kshitij Srivastava*1, Sanmukh R. Joshi2 and Willy A. Flegel1
1DTM/CC/NIH, 2Lok Samarpan Regional Blood Bank and Research Center
Background/Case Studies: The Indian blood group system (ISBT 023) comprises 1 low‐prevalence antigen Ina (IN1; p.46Arg) and the 4 high‐prevalence antigens Inb (IN2; p.46Pro), INFI (IN3; p.85His), INJA (IN4; p.163Thr) and INRA (IN5; p.150Arg). The antigens are located on the single‐pass trans‐membrane glycoprotein encoded by the CD44 gene on the short arm of chromosome 11. The CD44 glycoprotein functions as a leukocyte homing receptor and cellular adhesion molecule. The present study was designed to identify the frequency of the allele (IN*02.–05; p.150His) encoding the INRA negative phenotype (IN:‐5), first observed in a 40 year old female Muslim in Gujarat, to inform us of the probability of finding antigen‐negative donors, and to assess the risk of antibody formation in transfusion recipients.
Study Design/Method: Buffy coats were extracted from EDTA‐anticoagulated whole blood samples, collected with consent from 5,261 random blood donors at the Lok Samarpan Raktadan Kendra in Surat, Gujarat, India. The Buffy coats were pooled in batches of 20 and shipped to the Dept. Transfusion Medicine at the NIH Clinical Center for DNA extraction and molecular analysis. A real‐time PCR based assay was devised using primers, 5’‐ GCGGGCCTCTCTCCCAGCTATTGTTAACCA ‐3’ and 5’‐ ATTCTCCTTTCTGGACATAGCGGG ‐3’, to genotype c.449G>A (p.Arg150His; rs771323886) single nucleotide polymorphism (SNP) in exon 5 of the CD44 gene. The assay was applied to genomic DNA. Positive controls (p.150His; heterozygous and homozygous), as well as negative (p.150Arg; homozygous) and no template controls (molecular grade water) were included in each test plate.
Results/Finding: We tested 5,261 random blood donors in 264 pools. The p.150Arg (IN*02.05) allele frequency was 100%. No pool was observed positive for the p.150His (IN*02.–05) allele. The allele frequency estimate ranged from less than 1 in 10,522 (0.01%) to 1 in 3,203 alleles (0.03%) in the population (95% confidence interval, Poisson distribution), where the vast majority of donors (99.9%) came from the Hindu community.
Conclusion: The Genome Aggregation Database (gnomAD) lists the c.449A allele frequency as <0.01% among 122,365 individuals, with c.449A (p.150His) positive individuals found in East Asian, South Asian and Finnish populations. However, this SNP was not detected among 5,261 random blood donors in the state of Gujarat, western India. Because the INRA negative phenotype was first observed in a Muslim patient, the p.150His mutation may be either restricted to the index case family or only common in the Muslim community. Further studies in the local sub‐populations may provide more information on the frequency of the p.150His mutation and its immunogenicity in transfusion recipients if occurring among blood donors.
IGT74
Molecular Testing: Changing the Scope of Transfusion Medicine
Mollie Bell*, Gregory Halverson, David Oh, Matthew Montgomery and Jeffrey Papiernik
Hoxworth Blood Center
Background/Case Studies: The gold standard for compatibility testing has historically been based upon serologic testing by tube, gel and solid phase methodologies to detect red cell agglutination. There are several conditions, however, when serology cannot be relied upon for determining the safest blood for transfusion. Molecular testing for human blood group antigens has provided a reliable method to accurately predict the phenotype of a transfusion recipient without extensive serologic testing. In addition to adding insight to variant blood group antigens, this has created a new arena for matching blood donors for patient transfusion. This abstract describes how molecular testing has been incorporated into the blood collection facility, and how this has influenced changes in our Immunohematology Laboratory Practices.
Study Design/Method: Sixty donors with a record of multiple donations but without a full phenotype or molecular genotype are selected each week for testing by an outside contracted laboratory. The molecular results are electronically transferred to the Blood Establishment Computer System (BECS). Staff in the immunohematology reference laboratory (IRL) validate the results transmitted. Rare units with unique antigens are then added to the frozen blood inventory and reported to the American Rare Donor Program (ARDP).
Results/Finding: By the end of 3 years, our fully phenotyped donor database has expanded to include 9000 fully tested donors. In addition, we have identified 123 rare donors that we are recruiting to add to our rare frozen units and to report to the ARDP. (See Table 1)
| Rare Donors | Number Identified | Rare Donors | Number Identified |
|---|---|---|---|
| hrB‐ | 8 | Yt(a‐) | 15 |
| hrS‐ | 1 | Jo(a‐) | 4 |
| U‐ | 4 | Jo(a‐)Hy‐ | 2 |
| U var | 3 | Vel‐ | 4 |
| k‐ | 15 | Di(b‐) | 1 |
| Js(b‐) | 4 | 733/733 | 9 |
| Lu(b‐) | 11 | 48C & 733G | 1 |
| Co(a‐) | 14 | 43C/43C CELO‐ | 1 |
| SUB‐TOTAL | 97 | ||
| RHD/RHCE Variants | 26 | GRAND TOTAL | 123 |
Discussion: In addition to donors, we have performed molecular testing on patients to improve medical care. The majority of the patients with Sickle Cell Disease (SCD) in our area have had molecular genotyping performed. This enables the IRL to provide phenotypically similar RBC units in efforts to prevent alloimmunization. The IRL also selects patients for molecular genotyping who have autoimmune hemolytic anemia, drug interferences (i.e. daratumumab), and multiple transfusions to phenotype match, not only to prevent alloimmunization, but to simplify the process of providing the best matched blood available for those patients. The IRL has also provided blood collected from rare donors identified by molecular genotyping to other blood centers that have a patient with a need for rare blood.
Conclusion: It is unlikely that genotyping will fully replace serologic testing, but it is proving to be a complementary adjunct for our immunohematology service. Hemovigilence is the focus of many associations that manage the care of patients who are being transfused. Molecular genotyping aids in providing blood for SCD patients, for those with significant autoimmune disease, and for other medical conditions. Molecular genotyping has enormous potential to revolutionize practice in blood centers to establish large donor pools of fully typed donors as well as identify many donors with rare blood groups.
IGT75
Validation of Gel Microcolumn Assay for Red Cell Alloantibody Titration by Correlating with Conventional Tube Testing and Clinical Outcome in Rh Negative Antenatal Cases
Rounak Dubey*, Rajeev S. Mallhi and Bhushan Asthana
Armed Forces Medical College, Pune
Background/Case Studies: The incidence of HDFN caused by Rh‘D’ antigen has reduced to markedly low levels in developed countries but it still poses a challenge to the health care system in the developing countries. At Present, the Conventional Test Tube (CTT) method is recommended for performing the titration of antibodies in antenatal cases but CTT is increasingly being replaced by Gel Microcolumn Agglutination (GMA) systems as it offers many advantages to the transfusion laboratory. There have been few studies on this topic but no clear guidelines have been established about the precise method of titration in antenatal cases by GMA.
Study Design/Method: Samples from 510 Rh negative antenatal females were evaluated over a period of 2 years.These were initially subjected to Indirect Agglutination Test(IAT) by CTT (using polyspecific AHG) well as GMA (3 Cell Antibody Screening Panel). Positive samples were subjected to identification of antibodies by using 11 cell antibody identification panel.Presence of anti‐G antibody was ruled out using double adsorption method.They were further subjected to titration by CTT and GMA(IgG only, Rabbit).In‐house prepared R1r1 RBCs from a single donor were used for titration.Titration by CTT was carried out using LISS( Incubation time 15 mins) as well as Normal Saline(Incubation time 60 mins) for making RBC suspension. Similarly, titration by GMA was carried out using LISS( Incubation time 15 mins) as well as Normal Saline( Incubation time 60 mins, as recommended in earlier studies) for a better correlation of these two methods. The titers were further correlated in the clinical context and recent history of Anti‐D administration, intervention like IUT if performed and outcome of pregnancy.
Results/Finding: Out of the 510 antenatal cases tested, 56 were positive for ICT by GMA. Out of these, 20 cases also tested positive by tube method. 36 tested positive only by GMA( 33 had history of Anti‐D).The antibody identified was Anti‐D in 54 cases and a combination of Anti‐C+Anti‐D in 2 cases.
Titration by tube method using LISS gave very few positive results and titration by GMA using Normal Saline(NS) resulted in mixed field reactions, so these two methods were not included for further analysis. Only the titers obtained by CTT using NS and GMA using LISS were included for further analysis. Titration was performed on a total of 61 different samples obtained from 20 antenatal cases and the values were further evaluated for Karl Pearson Coefficient of correlation. It was evaluated to be 0.756 with p‐ value = .001 when all these samples were included, which suggested moderate correlation but for cases involving single antibody(Anti‐D), it was evaluated to be 0.893 with p value=.001, which suggested a strong correlation. 12 out of the 20 cases had undergone IUT and 4 cases were reported to have IUFD. The titer values for these patients were noted to be at least 16 by CTT and 512 by GMA.
Conclusion: GMA is a highly sensitive and precise method for titration in antenatal cases and the prospect of reporting titer by GMA along with CTT should be evaluated so that the treating clinician can be made aware about the results of these two methods. CTT and GMA had a better correlation when a single antibody was present. A titer of 512 by GMA (IgG only) mostly corresponded to the values of 16 by CTT and had a good correlation with the clinical outcome. More data and further studies are required to establish a critical titer by GMA.
IGT76
A New ABO Allele Encoding a Cis‐AB‐like Phenotype
Lauro E. Guerra, Jr.*1, Maria Antonietta Villa2, Nicoletta Revelli2, Donatella Londero3, Monica Barcobello4, Laura Terranova5 and Gorka Ochoa‐Garay1
1Grifols Diagnostic Solutions Labs, 2Immunohematology Reference Laboratory, Department of Transfusion Medicine and Hematology, Fondazione IRCCS Cà Granda Ospedale Maggiore Policlinico, 3Department of Transfusion Medicine, ASUI‐Udine, 4Department of Transfusion Medicine, ASUI‐Trieste, 5Immunohematology and Transfusion Medicine Service Fondazione IRCCS Istituto Nazionale dei Tumori
Background/Case Studies: ABO typing of two Caucasian patient samples yielded discrepant results. For sample 1, the forward type was O and the reverse type A. For sample 2, the forward type was O and the reverse type AB. Genotyping of sample 2 by PCR‐SSP (BaGene) yielded inconclusive results.
Study Design/Method: Serology was performed by routine tube testing methods at the following phases of reactivity: immediate spin (IS), 10‐min room‐temperature incubation (RT) and 10‐min 4°C incubation (4°C). Reagents for forward typing were ALBAclone monoclonal anti‐A, anti‐B and anti‐A,B (Quotient), BioClone monoclonal anti‐A and anti‐B (Ortho‐Clinical Diagnostics), and an in‐house group O polyclonal anti‐A,B. Reverse typing was performed with type A1, A2, B, and O reagent RBCs (Quotient). Extended testing was done with papain‐treated RBCs (Quotient). For genotyping, genomic DNA (gDNA) was extracted from EDTA‐whole blood with QIAamp affinity columns (QIAGEN), and ABO intron 1 enhancer region and exons 1 to 7 were sequenced by the Sanger dideoxy method. PCR products including ABO exons 6‐7 were cloned with Zyppy Plasmid Miniprep Kit (Zymo Research) and sequenced.
Results/Finding: Sample 1: Forward A typing with Quotient reagents was negative at all phases, but W + at RT with enzyme‐treated RBCs. Forward A typing with Ortho reagents was W + at IS, W + at RT, and 1 + at 4°C. Forward B typing was negative at all phases, with all reagents and under all conditions. Forward typing with monoclonal and polyclonal anti‐A,B was W + at IS, 1 + at RT and 2 + at 4°C. Reverse typing with A1 RBCs was negative at IS, W + at RT, and W + at 4°C, negative at all phases with A2 RBCs, and W + at IS, 1 + at RT, and 1 + at 4°C with B RBCs. Sequencing of gDNA and cloned ABO exons 6‐7 products detected alleles ABO*O.01.56 (c.261delG, c.496delA) and ABO*467T,803C,1061delC. Sample 2: Sequencing of gDNA and cloned ABO exons 6‐7 products showed the presence of alleles ABO*O.01.02 (c.106T, c.188A, c.189T, c.220T, c.261delG, c.297G, c.646A, c.681A, c.771T, c.829A) and ABO*467T,803C,1061delC.
Conclusion: To the best of our knowledge, variant allele ABO*467T,803C,1061delC has not been previously reported. Variants c.467T and c.1061delC are commonly found in alleles encoding an A2 phenotype, and variants c.467T and c.803C in some alleles encoding a cisAB phenotype (e.g. ABO*cisAB.01). On the basis of the serology and molecular results combined we conclude that allele ABO*467T,803C,1061delC encodes a Weak cisAB‐like phenotype.
IGT77
Performance Evaluation of New Monoclonal Blood Grouping and Anti‐Human Globulin Reagents for Serological Testing
Ghislain Noumsi*1, John D. Roback2, Marijane Blunk1 and Maria Huber1
1Grifols Diagnostic Solutions Inc., 2Emory University School of Medicine
Background/Case Studies: Monoclonal antibodies (mAbs) are highly specific reagents produced by hybridoma cells, and known to show variable reactivity. This can potentially impact red blood cell (RBC) antigens typing, identification of antibodies and crossmatch. Before implementation into routine testing, it is important to evaluate the performance and accuracy of each mAb. This study describes the results of the performance evaluation of 24 new monoclonal blood grouping reagents (BGR) and anti‐human globulin (AHG) for serological testing.
Study Design/Method: Random de‐identified samples from blood donors and patients were tested in duplicate at five major clinical sites across the U.S.A. following IRB approval (4 blood centers with immunohematology reference laboratories, 1 hospital with a transfusion service laboratory). Specificities for the new mAb reagents include: anti‐A, ‐B, ‐AB; anti‐D(IgM), ‐D(IgM/IgG), ‐D(IgG), ‐C, ‐E, ‐c, a‐e; anti‐K; anti‐Fya, ‐Fyb; anti‐Jka, ‐Jkb; anti‐M, ‐S, ‐s; anti‐Lea, ‐Leb; anti‐P1; anti‐IgG, ‐IgG/C3d, ‐C3d. Results using the mAb reagents under evaluation were compared to results using predicate that were FDA licensed reagents and FDA 510(k) cleared device(s). Predicate methods included test tube, microplate, solid‐phase and molecular genotyping, from 5 different manufacturers. Positive and negative percentages of agreement (PPA, NPA) were calculated. Lower confidence bound estimate was set at 95% confidence interval (CI) with at least 99% concordance level for all tests performed.
Results/Finding: A total of 45,695 data points were generated from 11,604 samples. For all ABO/Rh antisera, the 99% percent agreements for PPA and NPA were met, except for anti‐c and anti‐e where NPA values were respectively 98.88% CI and 95.44% CI. Results for anti‐c were 100% concordant with predicate. For the anti‐e, three discrepancies were found with two due to clerical errors and one resolved in favor of the new mAb. For other blood group systems, antigen typing met the desired NPA and PPA for Fya, Jkb, S and Leb. K typing was 100% concordant with predicate. Also, a 100% concordance with predicate for both PPA and NPA was found for antibody screening, identification and crossmatch using anti‐IgG. A total of 34 discrepancies were initially reported, representing 0.074%. Investigation and repeats by the referee showed that only 2 (one with each anti‐A and anti‐B) were true discrepancies, found in one patient with recent history of bone marrow transplant.
Conclusion: The new BGR and AHG mAb reagents yielded results substantially equivalent to current FDA licensed reagents and FDA 510(k) cleared device(s). These new reagents were accurate and effective for RBC antigens typing, antibody screening, antibody identification and crossmatch testing.
IGT78
Piperacillin Induced Hemolytic Anemia: Severe Hemolysis in the Absence of C3 Positivity on DAT
Tanmay Sahai*, Kelsey Donohoe and Randy Levine
Lenox Hill Hospital/Northwell Health
Background/Case Studies: Drug‐induced immune hemolytic anemia (DIIHA) has a reported incidence of approximately 1 in 1 million. Piperacillin is the third most commonly implicated drug in DIIHA behind cefotetan and ceftriaxone. Serologic results in DIIHA caused by piperacillin usually include a positive direct antiglobulin test (DAT) with both anti‐IgG and anti‐C3 and an eluate that reacts to RBCs only in the presence of soluble piperacillin. We present a patient who developed piperacillin induced severe hemolytic anemia due to IgG alone.
Study Design/Method: Retrospective electronic medical record review utilized for case presentation. Primary consultation services involved in this case were general surgery, hematology, critical care, and nephrology. Piperacillin antibody testing was sent to New York Blood Center.
Results/Finding: A 66 year old man with extensive cardiac past medical history presented with acute appendicitis. He refused surgery and was treated with antibiotics (3 days of piperacillin/tazobactam followed by ten days of ampicillin/clavulanic acid). He returned to the ER 3 days after discharge with a ruptured appendix and underwent urgent surgery. He was treated empirically with piperacillin/tazobactam on admission. After 48 hours, his Hb fell from 10.7 g/dL to 4 g/dl, accompanied by markers for acute hemolysis (LDH: 1379 U/L; haptoglobin: < 10 g/dl; indirect bilirubin: 5 mg/dl). His indirect coombs test revealed a panagglutinin. His DAT was positive for IgG but not C3. The eluate was negative. There was strong suspicion for DIIHA and the piperacillin/tazobactam was held. A sample of his blood was sent to New York Blood Center which revealed antibody to piperacillin detected by the “immune complex” method. In addition, anti‐e‐like specificity was observed that was very weakly reactive by PEG IAT and IgG gel test with papain‐treated panel RBC's. Interestingly, patient was positive for e antigen by phenotype. The patient developed acute renal failure and oliguria requiring dialysis. He subsequently went into acute respiratory failure requiring mechanical ventilation. Repeat DAT was negative 7 days after initial DAT checked. His clinical condition improved over 10 days. His hematocrit improved back to his baseline, however the patient was dialysis dependent for 3 months prior to improvement in renal function.
Conclusion: Unlike other penicillins and cephalosporins, piperacillin induced hemolytic anemia is typically complement mediated and induces a brisk and severe hemolysis. DAT tests are usually positive due to RBC‐bound complement and IgG. This case demonstrates that piperacillin can induce a brisk and severe hemolytic anemia in the absence of detectable complement. Rapid withdrawal of piperacillin is essential for recovery, but end organ damage may have a delayed recovery.
IGT79
Historical Test Results: Process Considerations for Labeling Red Cells with Non‐ABO/D Antigens
Helene DePalma*1, Mahdokht Parsi1, Elizabeth A. Godbey1 and Connie M. Westhoff2
1New York Blood Center, 2Immunohematology and Genomics Laboratory, New York Blood Center
Background/Case Studies: Positive donor identification and the accurate linkage of current donations with previous donor records is crucial for labeling RBCs with antigen types based on historical testing. In this study, investigations were conducted upon detection of antigen typing discrepancies between current and previous donations. Process improvements were implemented over time and the impact on the frequency of typing discrepancies was evaluated.
Study Design/Method: The Blood Establishment Computer System (BECS) provides correlation between current testing results and previous results. A retrospective review of donor antigen typing discrepancies flagged by BECS was completed. Discrepancies flagged in house prior to labeling were classified as internal discrepancies; antigen typing repeated by the hospital customer and reported to be discrepant were classified as external discrepancies. Each discrepancy was investigated to determine the cause. Identified discrepancies post‐implementation of process changes were evaluated.
Results/Finding: During a 9‐year period, 396 discrepancies were detected. More than 80% of these involved genetic Rh variation or FYX associated with weak blood group antigen typing not detected by some commercial FDA licensed reagents. Investigations revealed process failures in multiple departments can also contribute to donor antigen typing discrepancies, including: collections, data entry, technical procedures, and information systems. Key process improvements include the implementation of a self‐administered donor health history with 7 electronically‐captured identification points and development of a job aid for the investigation of duplicate donors. Testing procedure revisions included process for obtaining segments from units for testing, incubation for the maximum time recommended by manufacturer, and requirement of confirmation by a second manufacturer's reagent for e negative antigen typing. Genotyping performed on samples with typing discrepancies was key to identify genetic variation in levels of antigen expression. As a result of process changes, non‐ABO/D antigen typing discrepancies decreased from approximately 1 in 5,300 collections to 1 in 10,000 collections over a 9 year period.
Conclusion: Donor typing discrepancies frequencies were reduced through the implementation of process improvements across multiple departments and systems. An information system with the functionality to compare current and previous testing is a critical feature for labeling with historical non‐ABO/D antigens. Genetic variants are a frequent cause of testing discrepancies and warrant investigation. Investigating all discrepancies, recognizing sources of error, and responding with process improvements are crucial to implement a robust system for labeling with historical non‐ABO/D blood group antigens.
IGT80
Erythrocyte Anti‐PrM in a Monoclonal Gammopathy Patient without Obvious Evidence of Hemolysis
Thandar Aye*1, Lay S. Er1, Bertilda Lopez‐Correa1 and YanYun Wu2
1Immunohematology & RBC Genomics Reference Laboratory, BloodworksNW, 2BloodworksNW
Background/Case Studies: Antigens in Pr series are associated with sialic acid residues on glycophorins that are protease/sialidase‐sentive. Anti‐PrM was also reported to have specificity to determinants reside in side chains attached to MN sialoglycoproteins. Majority of the Pr specific antibodies are generally cold agglutinins that react optimally at lower temperature but can rarely be IgG, IgA or have biphasic property. Cases of autoanti‐Pr that can cause severe hemolytic anemia has been reported. In this case, we report a patient with gammaglobulinemia and a high titer/thermal amplitude anti‐PrM who did not show obvious evidence of hemolysis.
Study Design/Method: All tests were performed by routine tube method using PEG, LISS, saline, untreated, ficin and neuraminidase‐treated cells. Acid eluate was prepared and tested with reagent red cells by IAT method. A heat eluate was prepared from cold adsorbed plasma using M‐adsorbing cells. Heat eluate was tested against neuraminidase‐treated red cells and also tested with M + and M‐ untreated cells. Autologous cells tested with the patient's plasma by 2 hour saline settled method at 37C,30C,20C and 4C to obtain the thermal capacity. Plasma treated with 0.01M DTT was also tested with reagent red cells to differentiate between IgM and IgG.
Results/Finding: The patient had a hemoglobin of 11.0 g/dL and hematocrit of 31.9%, and total bilirubin of 0.4 mg/dL (within normal range). Other laboratory tests such as LDH, haptoglobin and retic counts were not performed; as hemolysis was not suspected clinically. No transfusion was needed during the admission. IgM was detected by serum protein electrophoresis (SPEP). Please see table below for the reaction of plasma and eluates with different cells. DAT was weakly positive (1+) with anti‐IgG. Autocontrol was strongly positive (3‐4+) at room temperature (RT) and 37C but non‐reactive at IAT. The antibody titers were as follows: at RT, 1:1024 with M + indicator cells and 1:4 with M‐ indicator cells. At 4C, plasma was still strongly reactive (4+) with M + cells at 1:4096 and titer with M‐ indicator cells is 1:4. The antibody reacted up to 30C by 2 hour saline settled method. Plasma treated with 0.01M DTT was non‐reactive.
Conclusion: Reactivity of 0.01M DTT treated plasma and SPEP result were consistant with IgMκ. The eluate, autologous control and patient's antigen typing indicate that anti‐PrM was an autoantibody. High titer and high thermal amplitude indicate that the antibody had a potential to cause hemolysis, but there was no obvious sign of hemolysis. It is possible that the patient had a low‐grade hemolysis that did not trigger transfusion need. Although severe hemolytic anemia due to high titer anti‐PrM is well‐recognize, it is interesting to note that there was no obvious clinical hemolysis and the need for transfusion in this patient with high titer/ thermal amplitude auto anti‐PrM.
TABLE: (IGT80) Reaction Grades When Plasma Or Eluate Was Tested With Different Reagent Cells
| Indicator cells used | Untreated | Ficin Treated | Neuraminidase‐Treated | En(a‐) | |||
|---|---|---|---|---|---|---|---|
| M+ | M‐ | M+ | M‐ | M+ | M‐ | ||
| Neat Plasma (RT) | 4+ | 2‐3+ | Neg | Neg | NT | NT | Neg |
| Neat Plasma (37C) | 4+ | 1‐2+ | NT | NT | NT | NT | Neg |
| Neat Plasma (IAT) | 1‐4+* | Neg | Neg | Neg | NT | NT | Neg |
| Cold Adsorption/Heat Elution (plasma) | 4+ | 1+ | NT | NT | Neg | Neg | Neg |
| Acid Elution (autologous red cells) | 1‐2+ | Neg | NT | NT | NT | NT | |
NT = Not tested, * reactivity varies by dosage of M antigen
IGT81
Molecular Testing and Resolution of Kidd Antibodies – Kidd You Not!
NurJehan Quraishy* and Suneeti Sapatnekar
Cleveland Clinic
Background/Case Studies: Kidd blood group antibodies can cause serious hemolytic reactions. If the patient types antigen‐negative, the alloreactive nature of the antibody is established. But if the patient types antigen‐positive, an alloantibody cannot be excluded, as antibodies associated with variant Jk antigens, although uncommon, are known to occur. Definitive identification of a variant Jk antigen requires molecular testing.
For over 4 years, we have referred cases of anti‐Jka or anti‐Jkb associated with antigen‐positive status for molecular testing. The purpose of this study was to determine the presence of clinically significant JK variants in our referred cases, and to formulate a transfusion management strategy when variant testing is absent or pending.
Study Design/Method: Cases referred for variant JK testing were identified from the laboratory's Send‐out Log, and the serological and molecular results for each case were reviewed.
Results/Finding: From August 2013 to March 2018, 13 cases were referred for variant JK testing. Based on serological and/or predicted molecular typing, 2 patients were Jkb + with anti‐Jkb, and 11 patients Jka + with anti‐Jka. The patients’ self‐identified race was: White 10, Black 2, Multiracial 1.
The results of JK sequencing were:
Clinically significant variant in 3 patients, all Jk(a+b+) with anti‐Jka: JKA exon 4 130G/A, associated with weak or variant expression of Jka.
Potentially significant variant in 1 patient, Jk(a+b+) with anti‐Jkb: JKB exon 8 810G/A, silent but could be associated with aberrant splicing of JK*B.
No clinically significant variant in 9 patients, 7 Jk(a+b+), 2 Jk(a+b‐): includes JKA exon 4 130G/A in a Jka‐homozygous patient, without risk of Jka alloantibody because of the accompanying conventional JKA allele.
Conclusion: In keeping with the rarity of JK variants, the yield of clinically significant variants in our series of highly selected cases was relatively low (4 of 13, 30%). All 4 patients were Jk(a+b+). In patients who have antibodies associated with suspected variant JK, the Jk phenotype can guide the selection of units for RBC transfusion. For a patient with heterozygous phenotype, antigen‐negative units matched for the antibody may be given, as there is no concern for alloimmunization against the antithetical Jk antigen. For a patient with homozygous phenotype [Jk(a+b‐) or Jk(a‐b+)], antigen‐negative transfusions should be deferred because of the likely presence of at least one conventional allele, and the risk of exposure to the antithetical foreign antigen.
We conclude that the real value of molecular testing lies in identifying patients without clinically significant variants, as unnecessary restrictions on RBC unit selection can be lifted, especially in patients with multiple alloantibodies.
IGT82
Validation of Quotient's IgG Sensitized RBCs
Teresa Gorey*1 and Elizabeth Hart2
1Brigham and Women's Faulkner Hospital, 2University of Massachusetts‐Dartmouth
Background/Case Studies: Reagent red blood cells (RBCs), known as IgG Sensitized RBCs or Coombs Control Cells, are prepared from pooled group O Rho (D) positive RBCs that have been sensitized with an IgG antibody. In tube testing, hemagglutination of these RBC reagents are used to confirm the validity of negative anti‐human globulin (AHG) test results in the indirect antiglobulin test (IAT) or direct antiglobulin test (DAT). For quality control purposes, these reagent RBCs verify; (1) that the AHG was added to the tubes and (2) adequate washing ensures that AHG hasn't been inactivated with unbound protein.
Manufacturers such as Quotient and Bio‐Rad Laboratories indicate in their interpretation section of their package inserts that agglutination of the reagent RBCs indicates a positive reaction but no strength of reactivity is indicated. The AABB Technical Manual provides criteria for reading and grading tube agglutination which provides uniformity and reproducibility and the College of American Pathologists require a written policy defining the criteria for agglutination (e.g., CAP TRM .40050).
Study Design/Method: A validation of the ALBAcyte® IgG‐sensitized RBCs by Quotient was performed in parallel with Bio‐Rad's Coombscell®‐E RBCs. Data collected was for a 2‐month period in which two different lot numbers for each manufacturer's reagents were tested with patient antibody screens using the IAT method and IgG extended crossmatches. Quality control results were recorded for each day of use and each time a new vial of reagent was opened. The AABB's grading criteria was used for standardization purposes.
Results/Finding: A total of 294 patient samples were tested and 30 IgG crossmatches were performed. Both manufacturers had a 2 + reaction in 28 specimens, a strong 3 + Bio‐Rad reaction with a 2 + Quotient reaction was seen in 247 samples, and 19 specimens had a 2‐3 + using Bio‐Rad's reagent with a 1+w Quotient reaction requiring the use of an optical aid.
For the 30 crossmatches; thirteen (43%) were in agreement with a 2 or 3 + reaction, fourteen units (47%) had a one‐grade decrease in reactivity strength by Quotient, and three (10%) of the units had a two‐grade decrease in reaction strength.
Quality control was tested 67 times with anti‐IgG. A 4 + reaction by both manufacturers' occurred 21 times (31%), forty one times (61%) Quotient's reagent had a one‐grade weaker reaction (3+), and five times (8%) Quotient's reagent had a two‐grade decrease (2+) in reactivity as compared to Bio‐Rad's.
Conclusion: Transfusion services and laboratories are challenged with providing high quality results while at the same time being cost efficient. Due to the findings in this validation study, our laboratory decided to switch back to Bio‐Rad's Coombscell®‐E reagent as they were dependable with stronger agglutination reactions.
IGT83
A Novel Mutation in the RHCE Gene Resulting in the Exceptional D‐ ‐ Phenotype
Cinzia Paccapelo*1, Thierry Peyrard2, Cédric Vrignaud2, Aurélien Beigenger3, Francesca Truglio1, Gabriella Spaltro1, Nicoletta Revelli1, Maria Antonietta Villa1 and Daniele Prati1
1Immunohematology Reference Laboratory, Department of Transfusion Medicine and Hematology, Fondazione IRCCS Cà Granda Ospedale Maggiore Policlinico, 2Institut National de la Transfusion Sanguine, 3Institut National de la Transfusion Sanguine, Département Centre National de Référence pour les Groupes Sanguins
Background/Case Studies: Rh is the most complex and polymorphic of the human blood group systems. The Rh antigens are encoded by the RH locus, composed of two highly homologous genes, RHD and RHCE. A number of RHCE alleles associated with silencing of Rh antigen expression have been identified. The aim of this study was to describe a novel molecular defect corresponding to silent RHCE allele identified in a 36‐year‐old Peruvian woman with a D – phenotype who was in her second pregnancy.
Study Design/Method: Phenotyping was carried out with microcolumn (BioVue System, Ortho Clinical Diagnostics, USA) and tube agglutination methods using commercial monoclonal (BioRad, Germany) and polyclonal reagents. Genomic DNA was extracted from whole blood using the QIAamp DNA Blood Kit (QIAGEN, Germany) and red cell genotyping was performed with HEA and RHCE BeadChip™ kits (Immucor‐BioArray Solution, Warren NJ, USA). Since the phenotype and genotype results were discordant, the sample was further characterized by sequencing all ten RHCE exons and flanking intron regions using Sanger sequencing.
Results/Finding: The patient had a D– – phenotype and was referred for suspicion of an anti‐Hro (anti‐RH17) alloantibody. The HEA kit predicted a C‐e‐ phenotype and the RHCE kit did not identify any altered alleles. In addition, the patient's RBCs were non‐reactive with multiple commercial anti‐C (MS24), anti‐E (including C2, MS258 and MS906), anti‐c (including MS33 and MS42), and anti‐e (including MS16, MS21, MS6, MS62, MS69 and BS260) monoclonal reagents. Sequence analysis of the RHCE gene indicated that the individual was C‐E+c+e‐. However, the patient was also apparently homozygous for a mutation at position c.659G>A in exon 5, predicted to encode a premature stop codon p.Trp220Ter. This molecular mechanism is consistent with an aberrant RHCE*cE sequence abolishing the c and E expression. The RHCE*cE659A allele is not reported in the ISBT and other genomic databases.
Conclusion: This case describes a novel polymorphism in exon 5 of the RHCE gene causing the silencing of c and E expression in a woman with a D– – phenotype. Although DNA genotyping for the prediction of blood groups has great value, the genotype is not always consistent with the phenotype. Many genetic events may cause apparent discrepant results between hemagglutination and DNA genotyping. Sequencing remains the “gold standard” for the study of complex RH molecular variants.
IGT84
Pembrolizumab Induced Autoimmune Hemolytic Anemia with Possible Auto‐Anti‐En(a)FS Specificity
John P. Sherbeck*, Sheri Hugan, Brian Novak, Asra Ahmed and Laura Cooling
University of Michigan
Background/Case Studies: Pembrolizumab is a humanized mouse monoclonal antibody to lymphocyte PD‐1, used as an immunotherapeutic agent against an ever‐expanding group of malignancies. Like other immune checkpoint inhibitors, pembrolizumab is associated with a wide variety of immune‐mediated side‐effects, including pneumonitis, colitis, hepatitis, & endocrinopathies, among others. Rarely, it has been associated with hemolytic anemia. We present a case of autoimmune hemolytic anemia, with unusual antibody reactivity, that presented approximately 1.5 weeks after the 3rd cycle of pembrolizumab.
Study Design/Method: Type & screen, DAT, elutions, adsorptions, & serologic studies were performed using standard reference laboratory techniques. Chart review was performed on the EMR.
Results/Finding: The patient is a 78‐year‐old male with a history of recurrent metastatic melanoma, WT BRAF, diagnosed 6.5 years prior, previously treated with surgical resection & 4 cycles of ipiliumab. He was started on pembrolizumab & tolerated the first two cycles with only fatigue & mild nausea. He presented to clinic 11 days after the third cycle complaining of fatigue, dyspnea, jaundice, & 4 days of dark urine. Labs at that time showed a hemoglobin of 5.2 g/dL (14.4 g/dL prior to cycle 3) with reticulocytosis (6.9%, 126.2 B/L), total bilirubin 18.6 mg/dL, direct bilirubin 1.7 g/dL, haptoglobin undetectable, & LDH 672 IU/L, consistent with hemolysis. Type & screen was A pos with a new positive antibody screen. Initial gel antibody ID panel showed pan‐reactivity (2 + to 2+s) with a positive 3+w autocontrol; reactivity was destroyed by ficin. A polyspecific DAT was 3+, monospecific was IgG 3 + & C3 1+. An acid eluate was strongly reactive 3+s with untreated cells but weak/absent with ficin‐treated cells. A cold panel was negative. Plasma was adsorbed with two different untreated, antigen selected RBCs, and the resulting adsorbed plasma showed no reactivity. Serum was reactive with sialidase‐treated RBC excluding an anti‐Pr. He was admitted & treated with oral prednisone (1 mg/kg) & 8 least‐reactive pRBC units over a 6‐day admission. His course was complicated by NSTEMI requiring stenting. He was discharged with a hemoglobin of 8.8 g/dL & discontinuation of pembrolizumab. One week after discharge, he was again profoundly anemic (hemoglobin 6.9 g/dL, total bilirubin 5.6 mg/dL, haptoglobin undetectable), & received 2 pRBC units. Given his continued anemia, he was slowly tapered from steroids & given weekly rituxan (375 mg/m^2) for 4 weeks. Since that time he has required no additional transfusions, & his hemoglobin has remained stable (11.1 to 12.6 g/dL).
Conclusion: This patient developed autoimmune hemolytic anemia after the third cycle of pembrolizumab. Workup revealed a ficin sensitive, neuraminidase resistant autoantibody, suggestive of an auto‐anti‐En(a)FS.
IGT85
Human Leucocyte Antigens As Protective and/or Risk Factors in Lebanese Patients with Immune Thrombotic Thrombocytopenic Purpura
Christian Al Haddad*1,2,3, Peter Finianos1,2, Eliane Zgheib1,2, Lamisse Charbel1, Myriam Dagher2, Myrna Germanos2, Fadi Nasr2, Edouard Elias2 and Paul Coppo4
1Laboratory Department, Centre Hospitalier Universitaire ‐ Notre Dame Des Secours (CHU‐NDS), 2Faculty of Medicine and Medical Sciences, University of the Holy Spirit Kaslik (USEK), 3Centre Superieur de Recherche, University of the Holy Spirit Kaslik (USEK), 4Service d’Hématologie, Hôpital Saint‐Antoine, AP‐HP, Sorbonne Universités
Background/Case Studies: Acquired immune thrombotic thrombocytopenic purpura (iTTP) is a rare and devastating autoimmune disorder characterized by generalized microvascular thrombotic lesions and organ failure of variable severity. Studies have shown that the production of anti‐ADAMTS13 antibodies in iTTP is linked to specific HLA class II susceptibility (DRB1*11, DQB1*02, DQB1*03) and protective (DRB1*04, DR53) alleles. The current study aims to identify if iTTP patients from Lebanon display similar risk and/or protective alleles as those described in the literature.
Study Design/Method: HLA‐DRB and HLA‐DQB loci were studied at the genetic level in two representative samples consisting of 18 Lebanese patients with iTTP on the one hand and 30 Lebanese healthy controls on the other hand. After extraction, DNA was amplified using HLA‐DRB and HLA‐DQB PCR‐Sequence Specific Primers and visualized by agarose gel electrophoresis. Fischer's test was used for the statistical comparison between the iTTP patients and the group of healthy Lebanese controls.
Results/Finding: All patients had typical clinical features of iTTP with a severe (<10%) ADAMTS13 activity in association with anti‐ADAMTS13 antibodies. Three significant results were obtained: HLA‐DRB1*14 was more common in the patients (N = 6) than in the controls (N = 0) with a p‐value of 0.002. HLA‐DR53 was more common in the controls (N = 16) than in the patients (N = 4) with a p‐value of 0.04. HLA‐DQB1*02 was more common in the patients (N = 6) than in the controls (N = 2) with a p‐value of 0.006. For all the other alleles (most notably HLA‐DRB1*11, HLA‐DRB1*04, HLA‐DQB1*03) no significant difference was found when comparing the patient group to the control group. HLA‐DRB1*11 was found in 12 patients vs. 25 controls with a p‐value of 0.288. HLA‐DRB1*04 was detected in 6 patients vs. 16 controls with a p‐value of 0.237. HLA‐DQB1*03 was found in 12 patients vs. 26 controls with a p‐value of 1.000.
Conclusion: In the Lebanese population, HLA‐DR53 appears to be a protective factor against the development of iTTP and HLA‐DQB1*02 appears to be a risk factor for developing the disease. This result is consistent with previous studies reported in the literature and that were conducted on other populations. On the other hand, HLA‐DRB1*14 appears to be a risk factor for iTTP that is specific to the Lebanese population. The HLA‐DRB1*11, HLA‐DRB1*04, HLA‐DQB1*03 alleles that have been previously described as significant predisposing and/or protective factors in the literature, were common in both the Lebanese iTTP patients and the healthy controls. These alleles have been shown to be frequent in HLA studies done on the healthy Lebanese population and this may explain this discrepancy.
IGT86
Adsorption‐Elution in a Weak B Subgroup Due to a Polymorphism in the Enhancer Region of Intron 1 of the B Allele
Kimberly Ouellette*1, Stephanie Krohto2 and Joseph D. Sweeney3
1Rhode Island Hospital, 2The Miriam Hospital, 3Lifespan Academic Medical Center
Background/Case Studies: Weak subgroups of B are less common than A subgroups and have been less clarified at the genetic level. We report the result of an adsorption‐elution in a very rare weak B subgroup due to a mutation in the enhancer region of the gene. The patient is a 59‐year‐old African American male that was admitted to a community hospital in Rhode Island. ABO Typing from this patient showed forward type as O and reverse type as B. Enhancement of the front and backtype did not resolve the discrepancy. The specimen was sent for genotyping and revealed a B subgroup with an unusual genetic variant in the intron region of the ABO gene, the enhancer of the gene expression. Further serological testing included enhanced forward tube typing showing weak reactions with anti‐B (various manufacturers) but no other serological testing, including adsorption‐elution, was performed. This subgroup, ABO*B.01(IVS1 + 5959A) identified, showed the variant in the enhancer region of the gene expression, Intron 1. There are very few of this subgroup described. Typically, the variant is found in the expressor region of the gene.
Study Design/Method: An ABO adsorption‐elution study has not been described on this particular genotype, ABO*B.01(IVS1 + 5959A). The adsorption‐elution study was performed and expected that it would adsorb and elute anti‐B similar to other subgroups of B. The adsorption‐elution was performed using a pool of O plasma as a source of anti‐B. Traditional techniques and incubations, as described in the AABB technical manual, were used for the assay.
Results/Finding: As seen above, anti‐B was eluted from the patient cells. All quality control performed including: testing of O cells, B cells and last wash of all cells tested showed expected results. This ABO*B.01(IVS1 + 5959A) type has only been described one time without adsorption‐elution studies. This is the second case of the ABO*B.01(IVS1 + 5959A) type described.
Eluate of patient sample
| Immediate Spin | 30’ Room Temp | 15’ 37°C | AHG/ Check Cells | |
|---|---|---|---|---|
| 1. Group O Cell | 0 | 0 | 0 | 0P |
| 2. Group O Cell | 0 | 0 | 0 | 0P |
| 3. Group B Cell | W+ | 3+ | 3+ | 3+ |
| 4. Group B Cell | 0 | 2+ | 3+ | 2+ |
Conclusion: Although this B subgroup was found to have the variant in the enhancer region of the gene, the antigen expressed were successfully adsorbed and eluted off of the patient cells similar to other B subgroups. Based on this serological reactivity, this subgroup is most probably a Bm.
IGT87
New Mutations Induce Bm Subtype: Correction of UDP‐Galactose
Rong Gui*, Fengxia Liu, Yanwei Luo, Hao Tang and Rong Huang
The Third Hospital of Central South University
Background/Case Studies: The biochemical nature of blood group antigens are polysaccharides, and AB blood group antigens are indirect products of genes. First, related genes encode the glycosyltransferases, then these transferases synthesize antigen polysaccharide chains and epitope sugar molecules in sequence. The B glycosyltransferase is expressed in type B individual erythrocytes, which catalyzes the transfer of the galactose group in the UDP‐galactose molecule to the H precursor sugar chain to form the B antigen. Weak B (Bm) erythrocytes do not agglutinate with anti‐B and anti‐A,B reagents. Bm erythrocytes are easily detected by anti‐B through absorption and elution test. The presence of B glycosyltransferases in the serum of Bm individuals is less active.
Study Design/Method: To study the corrective effect of UDP‐galactose on the abnormal blood group of Bm subtype caused by a new mutation. One case of abnormal type B blood group was identified through using the microcolumn gel card and test tube methods to determine blood group respectively, and detecting blood group substance in saliva, using the anticoagulant whole blood to extract DNA (QIAamp Blood Kit) and sequence (Invitrogen Corporation). Two generations of pedigrees were investigated, and activity of glycosyltransferase in erythrocyte membranes and serum was measured in blood donor samples. Blood samples were transformed in vitro using UDP‐galactose and the serum of normal type B.
Results/Finding: Bm subtype was confirmed by blood group serology test, genotyping and sequencing results. The new mutational sites were 43G/T and 45C/G mutations in exon 1. Family survey results showed that both father and sister were normal type O blood group, while the mother was type Bm‐mutant, which similarly weakly expressing B antigen and including 43G/T and 45C/G mutations in exon 1(GAC>TAG), suggesting that the mutation was heritable. This mutation led to premature termination of protein coding in exon 1 and a significant decrease of activity of glycosyltransferase in the serum. Treatment with UDP‐galactose could convert the Bm subtype blood group into the normal type B blood group in vitro.
Conclusion: Bm subtype blood group resulted by a new heritable mutation site (exon1, 43G/T and 45C/G) is found during the blood group examination. UDP‐galactose combined with normal type B serum has a corrective effect on the Bm subtype blood group, suggesting that abnormal blood group can be corrected by changing the activity of glycosyltransferase to improve the safety of blood transfusion.
IGT88
Clinically Significant Naturally Occurring Anti‐N and Anti‐S Alloantibodies in a Blood Donor
Sheetal Malhotra*1, Gita Negi1 and Aseem Tiwari2
1Department of Transfusion Medicine, All India Institute of Medical Sciences, 2Department of Transfusion Medicine Medanta‐The Medicity
Background/Case Studies: Alloimmunization is triggered when an individual lacking a particular antigen is exposed to these antigens through transfusion or pregnancy, causing the formation of immune antibodies. In addition to these exogenous exposures, underlying inflammatory or auto immune conditions may lead to formation of unexpected antibodies.
Study Design/Method: Herein, a case of naturally occurring anti‐N and anti‐S alloantibodies in a healthy blood donor with Rh positive blood group is reported. This case signifies the importance of incorporating indirect antiglobulin testing (IAT) for all blood units as a routine protocol.
Results/Finding: A 19‐year old male, blood group O RhD Positive, a first time and voluntary (family) donor without any significant transfusion, medical or drug history donated blood in the department of Transfusion Medicine and Blood Bank. The case was reported in the immunohematology (I.H.) laboratory as IAT positive. Autocontrol of the donor was negative at all phases. Antibody identification with eleven cell panel demonstrated the presence of anti‐N and anti‐S antibodies in the plasma, reactive at wide thermal amplitude of 22‐37°C. Direct antiglobulin test with polyspecific AHG (antihuman globulin‐ IgG+C3d) of the donor was negative. Alloadsorptions were performed with select cells, which confirmed the presence of the alloantibodies. DTT (dithiothretiol) testing demonstrated IgM and IgG nature of the antibodies. Antibodies showed dosage phenomena and the reactivity decreased after enzyme (papain) treatment. Donor red cell phenotyping for MNS system was M+N‐S‐s+. IgM and IgG antibody titers of anti‐N were 16 and 8; for anti‐S antibodies were 4 respectively by gel card technique. Post DTT treatment, IgG antibody titers for both anti‐N and anti‐S were 2.
Conclusion: In the present case, clinically significant, naturally occurring anti‐N and anti‐S antibodies, reacting at wide thermal amplitude, were detected in the donor's serum. There are a few published reports of naturally occurring anti‐N and anti‐S antibodies in healthy donor population. In MNS system, anti‐M is known to be the commonest naturally occurring antibody, IgM in nature reacting at saline phase, below 37°C. Anti‐N is relatively less common; anti‐S is mostly immune in nature, IgG type reactive at 37°C. In many small centers especially in developing countries, IAT is done only for Rh negative blood group donors in order to rule out the presence of anti‐D alloantibodies, primarily due to financial constraints. Through this case, the authors want to emphasize that the protocol of IAT testing for blood donors, irrespective of the Rh status, should be incorporated in all the blood banks as it will improve the safety of blood transfusion services for patients. Alternatively, IAT testing with pooled O cells can be done for all the donors as an initial screening procedure. Antibody screening with the three cell panel can be put only for IAT positive cases, thus paving the way for better transfusion practices and reducing the risk of adverse reactions.
IGT89
The Application of Rh Antigen Detection in Precision Blood Transfusion
Yong Dong*, Zifan Meng, Ping Li, Lifeng Qin, Jiao Liu, Zhen Zhao, Licun Wang and Haiyan Wang
The Affiliated Hospital of Qingdao University
Background/Case Studies: To explore the feasibility of Rh blood group 5 antigen detection in precision transfusion by the application of Rh antigen detection technology, and the computer information identification technologies such as laboratory blood group autoanalysis software system and blood transfusion information management software system.
Study Design/Method: Red blood cells (RBCs) from patients and donors were detected for ABO and Rh antigens (D, C, c, E and e) by using a laboratory blood type automatic analysis system. The results were uploaded to transfusion information management system (TIMS). The computer recognition technology automatically chose the appropriate blood compatible with ABO and Rh antigens. The blood cross‐matching was done with Polybrene and Microcylinder Gel Card Antiglobulin method (MGC‐AGH) to reduce the incidence of anti‐E, anti‐c and other anti‐Rh antibodies, avoid repeated cross‐matching incompatibility due to unknown Rh system antigens in clinical practice and realize the precise blood transfusion.
Results/Finding: After the blood transfusion precision program was implemented, more than 90% of the recipients could achieve complete or compatible transfusion of ABO and 5 types of Rh antigens. No transfusion reactions occurred within the first 15 minutes during infusion and 24 hours after infusion. Blood routine examination and blood biochemistry were measured before and 24 hours after infusion. Hb was increased 5g/L on average and serum bilirubin was no significant change than before in patients receiving 1 unit of red cell suspension. After repeated (>5) infusions, the ineffective rate of red blood cell transfusion was 0, and the rate of delayed hemolytic reaction was 0. No adverse reactions to transfusion occurred. The occurrence rate of blood group irregularity antibodies was significantly reduced in patients with multiple blood transfusions, compared with patients before the implementation of the precision blood transfusion program, from 0.85% to 0.19%. In the case of irregular antibody positive, the proportion of antibodies in the Rh system decreased significantly from the previous period, from 85.19% prior to the implementation of the precision blood transfusion protocol to 33.33%.
Conclusion: The implementation of Rh blood group antigen detection technology to achieve clinically precision blood transfusion can not only avoid the production of Rh system antibody, but also reduce the occurrence of adverse reactions of blood transfusion, improve the ability to solve difficult blood cross‐matching and the safety of blood transfusion therapy.
IGT90
Performance Evaluation of a Hybridization‐Based RBC Genotyping System within a Hospital Environment
Chelsea Hayes*1, Jina Seo1, Ghislain Noumsi2 and Ellen B. Klapper1
1Cedars‐Sinai Medical Center, 2Grifols Diagnostic Solutions Inc.
Background/Case Studies: RBC genotyping is used to supplement serology to provide extended matched blood, resolve typing discrepancies, and predict phenotype in recently transfused patients or patients with a positive direct antiglobulin test. Our hospital transfusion service uses a US FDA approved high‐throughput DNA genotyping system to predict RBC phenotypes of donors and patients. The aim of this study was to evaluate the performance of another genotyping platform currently classified for research use only.
Study Design/Method: DNA was extracted from EDTA whole blood samples collected from blood donors and patients. Each sample was tested using the system under evaluation (IDCORE XT, Grifols Diagnostic Solutions Inc., CA) and our current system. The predicted RBC phenotypes for the following antigens were compared: C/c, E/e, V, VS; K/k, Kpa/Kpb, Jsa/Jsb; Jka/Jkb; Fya/Fyb; M/N, S/s, U; Dia/Dib; Doa/Dob, Hy, Joa; Coa/Cob; and Lua/Lub. Discordant samples were referred for DNA sequencing.
Results/Finding: A total of 378 blood donors and 60 patients were included in this evaluation, resulting in 13,578 data points for comparison. Predicted RBC phenotype was fully concordant for 13,513 antigens (99.5%). Differences in the description of predicted phenotype were found in 64 instances, related to categorization of weak or partial Rh blood group antigens or reporting the presence of the FYB GATA allele. A true discrepancy was found for one M antigen typing (0.007%) that was predicted to be M(‐) by IDCORE XT and M(+) by the current system. DNA sequencing of an amplicon including GYPA exon 2 identified two SNPs in the intron region that prevented binding of the IDCORE XT forward primer to its target site (Table 1).
TABLE 1
| Antigen | Sample type: patient (n=60), donor (n=378) | N | Current system result | IDCORE XT result |
|---|---|---|---|---|
| Discordant result | ||||
| M * | Patient | 1 | + | 0 |
| Differences in the predicted phenotype description | ||||
| C | Donor | 1 | + | +† |
| c | Patient | 3 | + | +† |
| Donor | 6 | + | +† | |
| e | Patient | 2 | + | +† |
| Donor | 4 | + | +† | |
| V | Patient | 1 | + | +† |
| Fyb | Patient | 8 | (0)** | 0 |
| Donor | 39 | (0)** | 0 | |
M positive on DNA sequencing.
(0) Fyb variant (GATA).
Weak or partial antigen expression as detected by some antibodies
Conclusion: Predicted RBC antigen expression obtained from IDCORE XT and the genotyping system currently in use showed a high degree of concordance, with a single false negative M antigen reported by IDCORE XT; this is unlikely to be clinically important. The weak or partial antigen expression specified in the predicted phenotype report for some Rh blood group antigens in IDCORE XT may have clinical applications for selected patient populations. While the GATA mutation in the promoter region of the FYB allele is identified in the genotype report of both systems, its presence is not reported in the predicted phenotype of IDCORE XT, which may lead to unnecessary transfusion of Fyb‐negative RBCs for patients with this mutation if only using the predicted phenotype report.
IGT91
Red Cell Alloimmunization of Pregnant Women and Impact of Systematic Injection of RhIg: 10‐Year Study
Laurine Laget*1, Caroline Izard1, Elisabeth Durieux‐Roussel1, Isabelle Dettori1, Julia Gouvitsos1, Jacques Chiaroni2 and Virginie Ferrera‐Tourenc1
1EFS PACC, 2Etablissement français du sang PACA Corse, Biologie des Groupes Sanguins
Background/Case Studies: Red blood cell (RBC) alloimmunization during pregnancy is rare but is still a major problem. Depending on the specificity, antibodies can be implicated in hemolytic disease of the fetus and newborn mild to severe. These alloimmunizations may require a need for phototherapy or transfusion in the neonate, in the rarest cases a need for in utero transfusion.
Study Design/Method: The objective of this study is to present the results of the global red blood cell alloimmunization in pregnant women over a period of 10 years (2006‐2016) in a french region (Provence Alpes Cote d’Azur Corse). This number of allo‐immunizations is related to the number of births in this same region to determine the prevalence of alloimmunization during pregnancy. We also evaluate the impact of the recommendation of the National College of Obstetricians implemented since 2005, about the systematic injection of RhIg at the 28 week of amennorhea, by studying the incidence of anti‐D alloimmunization in this cohort.
Results/Finding: For these 10 years we analysed 6688 pregnancies with allo‐immunization (ie 1.05% of pregnant women). 19.5% had antibodies that can be implicated in hemolytic disease of the fetus (anti‐D, anti‐c, anti‐Kell). 54.1% had antibodies that can be implicated in hemolytic disease of the newborn (anti‐C, anti‐E, anti‐e, anti‐Fya ..) and 39.1% had antibodies with no incidence during pregnancy (anti‐Le, anti‐P1..).
We also evaluated the effectiveness of the systematic injection of RhIg to the D‐ pregnant women at the 28 week of amennorhea. We have studied the incidence (number of new cases) of allo‐immunizations anti‐D during this 10 years period. We observer a significative decrease in incidence (p<0.005) over the years: (2006: 0.12%; 2007: 0.08%; 2008: 0.06%; 2009:0.06%; 2010:0.06%; 2011:0.04%: 2012:0.05%; 2013:0.04%; 2014:0.04%; 2015: 0.05%).
Since 2012 and the integration of these recommendations in the follow‐up practices, the incidence of anti‐D allo‐immunization has stabilized at 0.05%. These results are comparable to those of other countries that also practice routine injection at the beginning of the 3rd quarter.
Conclusion: All these results over a broad period of 10 years show differences in the prevalence of antibodies in pregnant women compared to other countries. Indeed, in France, the respect of the RHK phenotype for any transfusion in a young woman decreases the number of allo‐immunized women in these systems. In addition, since 2005 and the recommendations of the National College of Obstetricians (routine injection of RhIg at 28 weeks of amenorrhea), the incidence of anti‐D alloimmunization has significantly decreased to stabilize at 0.05%.
IGT92
Testing Samples from Patients Receiving Anti‐CD38 Therapy with Commercial Papain Treated Reagent Red Cells
Randall W. Velliquette*, Gayane Shakarian, Christine Lomas‐Francis and Connie M. Westhoff
Immunohematology and Genomics Laboratory, New York Blood Center
Background/Case Studies: Anti‐CD38 therapy (e.g. Daratumumab, Isatuximab) is used to treat multiple myeloma and other hematological and non‐hematological disorders. Circulating drug in patient plasma binds to CD38 on reagent RBCs causing interference in pre‐transfusion testing. Strategies to eliminate interference aim to remove or denature CD38 on RBCs by pretreatment with trypsin or 0.2M DTT. Previous studies have shown that papain or ficin treatment did not avoid anti‐CD38 interference. However, recent reports (primarily from Europe) indicate that papain treated RBCs may be effective in avoiding anti‐CD38 interference. Martinez‐Lopez et al. (Trans Med, 2018) report that anti‐CD38 is not detected in the IAT using a commercial papain panel and suggest the method is an effective mitigation strategy. Mann (ISBT 2017 abstract) advocated the use of papain treated panels with neutral gel cards to test for underlying antibodies that agglutinate at 37C. The aim of our study was to reassess the ability of papain treated RBCs to overcome anti‐CD38 interference and to evaluate the papain panel used in the reports above with a battery of anti‐CD38 patient plasma samples.
Study Design/Method: 26 previously evaluated samples from patients receiving anti‐CD38 therapy (daratumumab n=25, isatuximab n=1) were tested against untreated and papain treated commercial RBC panels (Quotient and Bio‐Rad). Testing was performed by standard tube by LISS IAT (Quotient) or by IgG gel (Bio‐Rad). The number of patient samples selected aimed to randomly represent various circulating anti‐CD38 plasma concentrations and dosing regiments.
Results/Finding: Plasma reacted weakly (micro to 1+) with all cells in tube LISS IAT with both untreated and papain treated Quotient panel cells; reactivity strength was unchanged between untreated or papain treated RBCs. Plasma reacted + /‐ to 2 + in the IgG gel test with all untreated cells and 1 + to 3 + with papain treated cells in the Bio‐Rad panel. Enhancement of anti‐CD38 reactivity was noted in 90% of tests using the Bio‐Rad papain panel. No weakening of anti‐CD38 reactivity was observed in any sample using Bio‐Rad or Quotient papain panels. Notably, isatuximab anti‐CD38 plasma reactivity was markedly enhanced with papain treated panel RBCs; + /‐ untreated vs. 2 + papain treated.
Conclusion: Anti‐CD38 is approved to treat multiple myeloma, but CD38‐targetting antibodies may have therapeutic potential beyond hematological malignancies and the use is only predicted to increase. DTT and trypsin treatment of RBCs can mitigate anti‐CD38 interference, but the lack of commercially available treated RBCs is a major limitation. Availability of a commercial solution would be attractive. We previously found that our in‐house papain protocol for treatment of RBCs did not overcome interference. Here we tested the possibility that commercial papain treated RBCs, including those used in Europe, might differ. In both LISS tube and gel testing, anti‐CD38 reactivity in IAT was not eliminated and reactivity was enhanced with Bio‐Rad papain treated RBCs in IgG gel. Although use of papain treated RBCs would be expected to enhance underlying 37C reactive Rh antibodies, we show that anti‐CD38 reactivity remains in the IAT indicating that CD38 on RBCs is unaffected and will interfere with clinically significant antibody detection at IAT.
IGT93
Survey for Most Common Red Blood Cell Antibodies: Héma‐Québec's Experience
Nadia Baillargeon*1, Carole Ethier1, Maryse St‐Louis2, Marie‐Claire Chevrier3, Julie Pedneault1 and Information Technologies Services1
1Héma‐Québec, 2Institut national d'excellence en santé et en services sociaux, 3Héma‐Québec
Background/Case Studies: Hema‐Quebec provides blood products to the Province of Quebec and serves a population of 8.4 millions. It also plays the role of the Immunohematology Reference Laboratory (IRL) to resolve complex antibody identification cases for referring hospitals. Annually, it receives roughly 1500 requests from hospitals’ blood banks to investigate antibody identification cases, pregnancy follow‐ups, transfusion reactions and various discrepancies. Among the services provided within the IRL, antibody identification investigation excluding pregnancy follow‐ups represents two third of the activities. In 2014, EdgeLab™ software (Haemonetics) was implemented to manage all clinical cases from receiving samples to report results and to serve as an electronic database.
The present study was to survey for red blood cells (RBCs) antibodies and to provide valuable information on antibody combinations and work up frequency.
Study Design/Method: The data was extracted from the database using the aggregate serological investigation specific code from June 2, 2014 (implementation) until March 12, 2018. The resulting Excel file was manually analysed.
Results/Finding: During the 3.75 year‐period, data excluding pregnancy follow ups were compiled. 3263 cases were received, with an average of 1.2 requests/case. Up to 42% (1374/3263) were considered uneventful regarding blood unit selection: 417 cases lack antibody, 519 cases were considered as having non‐specific reactions (cold agglutinin, antibodies to RBC media, non‐specific antibody without clinically significant underlying antibodies, antibody against Daratumumab) and 438 cases showed antibodies against blood group antigen specificity without clinical significance such as RhIg and Knops. Data regarding the two types of unexpected RBCs antibodies (alloantibodies and autoantibodies) was calculated from a sample so that inferences could be make to the evaluated cases. In addition, solely antibody with Rh specificity against D and e specificity were evaluated and were classified in the uneventful category whenever they were autoantibodies or considered clinically significant if they were alloantibodies. In total, 1889 cases showed blood group antigen specificity with clinical significance. Among the 1889 cases, 762 showed a unique antibody of which 381 were against an Rh specificity (50%), 2 antibodies were found in 621 cases (541 cases with at least one anti‐Rh; 87.1%) and 506 cases had more than 2 antibodies (491 cases with at least one anti‐Rh; 97%). Overall 1413/1889 presented with an anti‐Rh (74.8%). Anti‐E was the most frequent (756 cases) followed by anti‐C (484 cases) and anti‐K (330 cases). Anti‐C combined to anti‐e was observed in 99 cases and represent the more frequent Rh antibody combination.
Conclusion: This study summarized the last 3.75 years in antibody identification work‐up in the IRL excluding pregnancy work ups. It clearly showed that anti‐Rh remain the major burdens in patient management. Rare cases were also unrevealed through this work. For example, 5 cases of anti‐U, 3 cases of anti‐PEL and 1 anti‐Ge3 were identified. It was intended to produce a comprehensive portrait of the investigated cases, the whole picture being lost through the workload and the urgency behind some requests. It also serves to demonstrate the relevance of antibody work ups in order to prevent transfusion reaction and favor patient outcome.
IGT94
Maternal Circulant Free Fetal DNA for Non‐Invasive Antenatal RHD Genotyping
Gabriella Spaltro*1, Mara Nicoletta Pizzi1, Norma Nadia Fantini2, Francesca Truglio1, Cinzia Paccapelo1, Irene Zanoni1, Maria Antonietta Villa1, Nicoletta Revelli1 and Daniele Prati1
1Immunohematology Reference Laboratory, Department of Transfusion Medicine and Hematology, Fondazione IRCCS Cà Granda Ospedale Maggiore Policlinico, 2Hematology and Prenatal Diagnosis Clinic, Fondazione IRCCS Cà Granda Ospedale Maggiore Policlinico
Background/Case Studies: The introduction of immunoprophylaxis for RhD negative pregnant women has drastically reduced the incidence of hemolytic disease of the fetus and newborn. However, immunoglobin administration is not risk free, and has high costs. The discovery of circulant free fetal DNA (cffDNA) prompted the introduction of non‐invasive fetal RHD genotyping in maternal plasma. This approach is increasingly being adopted in several countries, since it avoids treatment in the substantial proportion of RhD negative woman who will give birth to a RhD negative child (about 40%). The purpose of this study was to validate a method for the antenatal, non‐invasive determination of fetal RHD status using cffDNA from maternal plasma. We present preliminary data about our ongoing validation.
Study Design/Method: We consequently analyzed the samples from 33 RhD negative pregnant women between 19 and 29 weeks of gestation, with an unknown or positive RhD partner. The genomic DNA was extracted from maternal plasma, separated by QIAamp Circulating Nucleic Acid Kit (Qiagen, Valencia, CA, US) or using automatic extraction with QIASymphony. In order to determine the fetal RHD genotype, we used Taqman primers and probes to detect exons 5, 7, and 10 of RHD gene by Real‐Time PCR (Free DNA Fetal Kit RhD, Institut de Biotechnologies Jacques Boy, Bio‐Rad, Foster City, CA). As internal controls, we added Maize DNA (Bio‐Rad) before extraction and used primers/probes sets specific to Maize DNA. The results of antenatal fetal genotyping were compared to those obtained on postnatal cord blood Rh phenotyping.
Results/Finding: Out of 33 samples, 21 were RHD positive and 12 RHD negative. Out of 33 samples processed, 30 were available for the genotype‐phenotype comparison, and the agreement was 100%. Three samples were inconclusive due to missing data at birth.
Conclusion: Fetal RHD genotyping from maternal plasma is a promising tool for the management of RhD negative pregnant women. If these data will be confirmed on a larger series, the non invasive approach will reduce the risk for mothers and their babies and reduce unnecessary anti‐RhDIg immunoprophylaxis.
IGT95
The Design and Establishment of the Platelet Donor Database with Known HLA, HPA Genotype in Nanning Area of China
Lilan Li*1, Mei Yu2, HengCong Li1, Xianggeng Su2, Fang Lu1 and Guo‐guang Wu1
1Nanning Institute of Transfusion Medicine, 2Nanning Blood Center
Background/Case Studies: For the platelet transfusion therapy of the patients with immune platelet transfusion refractoiness (PTR) and immune thrombocytopenia, transfusion with antigen‐negative matched‐platelets are the key to obtain effective treatment for the patients. The establishment of known antigen platelet donor database could provide a fast and convenient way to find antigen‐negative matched‐platelet donors for the relative immune patients. HLA and HPA were the important antigens that cause platelet alloimmunization diseases, populations at different areas have their own polymorphic characters of HLA and HPA. Nanning is an important comprehensive transportation hub city located in southwestern China with more than 7 million people. The aim of this study was to design and establish the platelet donor database with known HLA, HPA genotype that could be suitable for the population in Nanning area of China, and to provide a guarantee for the treatment of the patients with immune PTR and immune thrombocytopenia as well.
Study Design/Method: Total of 4243 unrelated and random healthy individuals were used to the population study of HPA ‐1 to‐17w polymorphism in Nanning area of China. and 7001 individuals from the China Marrow Donor Program were used to the population study of HLA‐A, ‐B polymorphism at Nanning area. Based on the data of population studied above, the optimal size of platelet donor database was predicted, and which was to be set as the goal to design and establish the Platelet Donor Database with Known HLA, HPA Genotype in Nanning Area (Named with Nanning Area Platelet Donor Database with Known HLA, HPA Genotype). The HPA‐1∼17w and HLA‐A,‐B genotype of the donors in the database were detected by PCR‐SSP, PCR‐SSO respectively.
Results/Finding: According to the population study of HPA ‐1 to ‐17w polymorphism (n=4243) and HLA‐A,‐B polymorphism (n=7001) in Nanning area, the following was calculated and derived: When the platelet donor database size was 283 donors, it was approximated 95% patients could find a HPA‐1∼17w genotype matched donor in the database; When the database size was 819 donors, it was approximated 80% patients could find a HLA‐A,‐B CREG matched donor in the database; When the database size was 1781 donors, it was approximated 90% patients could find a HLA‐A,‐B CREG matched donor in the database. The current Nanning Area Platelet Donor Database with Known HLA, HPA Genotype is established and included 1072 donors, that approximately 98.58% patients could find a HPA‐1∼17w genotype matched donor in the database, approximately 83.49% patients could find a HLA‐A,‐B CREG matched donor in the database.
Conclusion: The study had provided a design method for the establishment of platelet donor database with known platelet antigen and/or antigen genotype that was suitable for population in Nanning of China. Currently, Nanning Area Platelet Donor Database with Known HLA, HPA Genotype that included 1072 donors had been established, and it could provide a guarantee for the safely treatment of platelet transfusion.
IGT96
The Establishment of B‐LCLs Carrying Rare HPA Genes
Hai‐yan Li*, Lilan Li, Xue‐jun Liu, Fang Lu, Li‐hong Jiang and Guo‐guang Wu
Nanning Institute of Transfusion Medicine
Background/Case Studies: human platelet antigen(HPA) is one kind of specific alloantigen on the surface of platelet glycoprotein, which has regional and ethnic differences. HPA can be immunologically stimulated to produce antibodies through blood transfusion, pregnancy or transplantation, and generated alloimmunity can lead to clinical complications such as neonate alloimmune thrombocytopenia, post‐transfusion purpura, platelet transfusion refractoriness. To establish reliable HPA genotyping analysis, it is crucial for the laboratories have their own available reference DNA of genomic DNA or DNA panels. Establish immortal B‐lymphoblastoid cell lines(B‐LCLs) are the good way to keep reference DNA of genomic DNA permanently, especially when can not maintain the donors of those specific HPA in general.
Study Design/Method: After screening in large donors and patients, 15 rare HPA phenotyped individuals in Guangxi province were selected after informed consent, included 1 1bb, 2 1ab, 3 2ab, 4 2bb, 1 4ab, 3 5ab,1 6bb, their HPA phenotyping were performed by assays of flow cytometry, monoclonal antibody‐specific immobilization of platelet antigens test(MAIPA), and have been confirmed by DNA sequencing genotyping previously. Epstein‐Barr virus was used to transform the peripheral blood lymphocytes of carrying rare HPA phenotyped individuals into B‐LCLs. HPA‐1∼21bw genetic analysis was conducted by multi‐PCR to test whether the B‐LCLs had gene mutation comparing before transformation. PCR and broth cultivation were applied as quality control methods to detect whether the cell lines contaminate by Mycoplasma.
Results/Finding: The B‐LCLs of 15 rare HPA genes individuals were successfully established. After passaged 30, the DNA of B‐LCLs have no gene mutation tested by multi‐PCR. PCR and broth cultivation did not detect the B‐LCLs contaminate by Mycoplasma, while the positive controls showed positive results. In 14th ISBT Platelet Immunology Workshop, the DNA extracted from the B‐LCLs we established successfully used as reference DNA.
Conclusion: The DNA of B‐LCLs can be used as reference DNA in HPA genotyping, and as permanent research materials can be preserved for long‐term studies.
IGT97
Two Populations of Red Blood Cell (RBC)‐Bound IgG Detected via Flow Cytometry (FC) on a Recently Transfused Sickle Cell Disease (SCD) Patient
Wendy Beres1, Sandra J. Nance*2, David Moolten3 and P. Dayand Borge4
1American Red Cross, Assay Development, 2American Red Cross and American Rare Donor Program, 3American Red Cross, Medical Office, 4American Red Cross
Background/Case Studies: Elevated levels of RBC‐bound IgG have been reported in patients with SCD (Blood 1984; 64: 301‐4). In an IRB approved linked study, residual samples submitted to an IRL were analyzed for RBC‐bound immunoglobulins (Ig) via FC. Of considerable interest was a sample from a 74 yr old patient transfused 19 days prior with 2 units presenting with deep‐vein thrombosis, history of SCD with transfusion requested. A weakly positive (+W) tube direct antiglobulin test (DAT) with anti‐IgG was reported, no mixed field reactivity was noted. Anti‐C, ‐Fya were detected in the patient's serum and anti‐C in the eluate. FC testing of the patient's RBCs showed two RBC populations with different levels of IgG sensitization (visualized by presence of 2 peaks in the histogram with anti‐IgG).
Study Design/Method: The sample was tested by FC with fluorescein isothiocyanate (FITC)‐labeled anti‐human IgG, ‐ IgA, ‐ IgM (Life Technologies, Carlsbad, CA) at optimal dilutions in Dulbecco's PBS containing 0.6% BSA. 50,000 RBCs acquired from each sample by the Becton Dickinson FACSCalibur™ (San Jose, CA) FC were analyzed at optimized settings. Naive uncoated EDTA‐anticoagulated RBCs and Ig coated cells were tested to adjust FC settings, and control for validity and cross‐reactivity. Normal ranges for RBC‐bound IgG were determined by testing allogeneic RBCs and calculating the mean %M2 ± 3 standard deviations (see table). Only the single sample was available, a subsequent sample was not obtained and patient follow‐up could not be performed due to the nature of the IRB.
Results/Finding: The FC method detects RBC‐bound Ig and reports the percent of RBC‐bound Ig in a sample. The patient's sample was analyzed via FC on day 2, cross‐reactivity was noted in the control samples between anti‐IgG and the IgM coated control cells. Due to the control cross‐reactivity on the first test, the sample was retested on day 5. It was of interest to repeat the sample on day 16 since the 5‐day old retest was atypical. Two cell populations were visible in the histograms from three FC runs which increased with the sample age from day 2 to day 5. Pre‐ and post‐transfusion hematocrit data were not available for review.
| Sample Age (days) | Anti‐IgG | Anti‐IgA | Anti‐IgM |
|---|---|---|---|
| 2 | 20.70 | 1.89 | 13.91 |
| 5 | 38.38 | 4.49 | 11.72 |
| 16 | 34.56 | 2.51 | 7.01 |
| Normal Range | 0 – 4.99 | 0 – 4.02 | 0 – 4.32 |
Conclusion: The patient had IgG, IgM and low levels of IgA (in day 5 testing) bound to the RBCs detected via FC. The presence of two peaks in the flow cytometric testing of patient's RBCs using anti‐IgG is most likely due to surviving (but IgG coated) transfused RBCs. The observed change in the IgG cell coating over time may be caused by spherocytes, RBCs losing charge, or the cell membrane hardening.
IGT98
Pregnant Woman with a Para‐Bombay Phenotype Associated with Two Rare Mutations
Suresh Manapuram1, Barry Siegfried*2, Pamela Wilkerson2, Jeremy Bigge3 and Claire Meena‐Leist2
1University of Louisville Hospital, 2American Red Cross, 3Deaconess Hospital
Background/Case Studies: The para‐Bombay phenotype is a rare genetic trait characterized by reduced expression of A, B, and H antigens on red blood cells. Two fucosyltransferases, encoded by the H (FUT1) and secretor (FUT2) genes, regulate this expression. The phenotype results from nonfunctional FUT1 genes and at least partly functional FUT2 genes, or from weakly functional FUT1 genes and nonfunctional FUT2 genes.
Study Design/Method: Case report format.
Results/Finding: A 25‐year‐old gravida 1 para 0 woman presented for prenatal care for the first time at approximately 9 weeks of gestation. She had no prior history of transfusion. Forward typing showed group A, but reverse typing indicated group O. An antibody screen and an identification panel showed reactivity with all cells. An autocontrol and a direct antiglobulin test were negative. Plasma was strongly reactive with all panel cells over a wide thermal range, even after treatment with 0.2 M DTT and ficin. The reactivity was removed by allogeneic adsorptions but not by autologous adsorptions. The patient's plasma reacted with a panel of cells negative for high‐incidence antigens including I, Ge3, Lan, Coa, Sda, Dib, Ata, Kpb, Jsb, Lub, Vel and PP1Pk. The patient's red cells were H‐negative and reacted with monoclonal anti‐A and anti‐A,B but were nonreactive with a human source of anti‐A, indicating group A+w (Ah). The antibody was identified as anti‐H. Genetic testing revealed a compound heterozygous FUT1 genotype with two rare mutations, c.349C>T and c.422G>A, and an FUT2 genotype predictive of a nonsecretor status. An allele with the former mutation encodes weak H antigen expression. An allele with the latter mutation encodes no H antigen expression. Thus, genetic testing results were consistent with the para‐Bombay phenotype of RBC H‐partially deficient, nonsecretor. Treatment of the patient's plasma with 0.01 M DTT, which destroys IgM, eliminated anti‐H. The absence of residual reactivity, which would have been due to IgG, suggested low fetal risk. Sources of blood for possible transfusion to the patient were considered. RBCs from the patient's only sibling were group A and incompatible with the patient's plasma. Through autologous collection and the American Rare Donor Program, the patient's blood needs were met and a healthy newborn was delivered.
Conclusion: We report a case of a pregnant woman with the para‐Bombay phenotype associated with two rare mutations. Provision of RBCs for patients with this phenotype is an ongoing challenge. Early communication between the obstetrician, transfusion service and reference laboratory is essential to optimal transfusion management.
IGT99
Comparison of Two Methods for 2‐Mercaptoethanol Removal from Plasma Specimens Used in Red Cell Antibody Identification Studies
Sheri Hugan* and Laura Cooling
University of Michigan
Background/Case Studies: 2‐mercaptoethanol (2ME) is a reducing reagent that can be used to treat plasma in order to distinguish IgM from IgG antibodies. To remove 2ME from treated plasma prior to antibody testing, it is common to dialyze plasma overnight (Method A). Ultrafiltration devices used for drug analysis can also be used for 2ME removal and same day testing (Method B). This study evaluates the two methods for statistical differences.
Study Design/Method: Eleven blood samples with alloantibodies were selected for 2 methods of 2ME removal. Method A used 12kDA NMWL cellulose dialysis tubing and Method B used 30 kDA NMWL ultrafiltration devices (Centrifree Ultrafiltration Device with Ultracel YM‐T, MilliporeSigma, Burlington, MA) for 2ME removal. Specimens from both methods were titrated and tested for IgM and IgG ABO isohemaglutinin levels by manual tube testing. Confirmation of a previously identified alloantibody after treatment was also performed to ensure clinically significant antibodies were still detectable. Method A, 2mL treated plasma was dialyzed overnight in 1L phosphate buffered saline and then recovered from the tubing. Method B, 2ml treated plasma was added to 2 device sample chambers then spun in a fixed angle centrifuge for 30 minutes at 1,000g. In the ultrafiltration device, free plasma solutes were filtered across a cellulose membrane and filtered plasma was recovered from the sample chamber above the filter. Doubling dilutions were performed for each analyte and tested in parallel by tube method. Determination of IgM ABO isohemagglutinin levels was achieved after a 15‐minute room temperature incubation, and IgG levels after a 15‐minute 37‐degree C incubation, four times automated wash, and anti‐human globulin. The endpoint for titration was determined by the last tube with a 1 + reaction. For statistical analysis, the titration concentrations were normalized to the last tube dilution with a 1 + reaction. The differences between dialyzed and filtered plasma endpoints were used in a paired t‐test for determination of significant difference.
| Method | IgM mean ± SD | IgG mean ± SD |
|---|---|---|
| A | 2.27 ± 2.37 | 4.27 ± 3.58 |
| B | 2.45 ± 2.38 | 4.36 ± 3.91 |
Results/Finding: There was no significant difference between methods for IgM (p=0.51) or IgG (p=0.78) ABO isohemaglutinin titers. The hypothesized mean difference = 0 has not been rejected at p=0.05. Previously identified alloantibodies were still detectable after 2ME treatment.
Conclusion: Plasma samples treated with 2ME did not show a statistical difference between dialyzed or filtered plasma. The use of ultrafiltration devices allows same day testing with acceptable 2ME removal while maintaining immunoglobulins.
IGT100
Serological and Molecular Characterization of Weak D Type 18 in Four Brazilian Families
Cristiane da Silva Rodrigues de Araújo*1, Antônio Alexandre Clemente de Araújo1, Bruna Accorsi Machado1, Luciana Bertelli Dagostini1, Tamires Delfino dos Santos2, Mayra Dorigan de Macedo2, Sheila de Fátima Perecin Menegati2 and Lilian Castilho3
1Hospital São Vicente de Paulo, 2Universidade Estadual de Campinas (UNICAMP), 3Hemocentro UNICAMP
Background/Case Studies: Currently more than 400 types of weak D antigens have been identified molecularly. The most common types in Europe and North America are types 1, 2 and 3. In Brazil, although these weak D types are less frequent, they are still considered the most common, followed by weak D type 4.0. Other types of weak Ds are rare and found in distinct populations. To date, only three examples of weak type D type 18 have been reported as part of the Eurasian cluster. Recently we found four unrelated blood donors with weak type D type 18 in Southern Brazil. As very little is known of this RhD variant, we performed a serological and molecular study on the samples of these individuals and their relatives to better characterize this rare phenotype.
Study Design/Method: Donor samples showed atypical agglutination reactions in the D typing routine by tube and gel test. Additional serological tests were performed in gel with 12 anti‐D clones using the “Extended Partial RhD Typing Set” (Bio‐Rad). RhCE phenotyping was also performed in the gel. Molecular tests included conventional PCR techniques, RHD BeadChip (Immucor) and genomic DNA sequencing. All donor relatives were requested for the same serological and molecular studies.
Results/Finding: DNA sequencing showed the presence of the 19C > T mutation in exon 1 of the RHD gene that leads to the substitution of the amino acid Arginine to a Tryptophan at codon 7 (R7W) of RhD protein, associated with weak D type 18 in the DNA samples of the donors and some of their relatives. Serological tests showed weak expression of D antigen (reactivity < 2+) in tube and mixed‐field reaction for RhD phenotype in the gel in all red blood cell (RBC) samples molecularly characterized as RHD*weak D type 18. Positive agglutination results were obtained with the 12 anti‐D clones used and the RH haplotype associated with this weak D type was DCe/ce.
Conclusion: This is the first serological characterization of the RHD*D weak type 18 showing a mixed field reactivity. All individuals studied shared the RHD*weak D type 18‐RHCE*Ce haplotype, confirming previously found in one example of weak D type 18. The presence of this rare variant in four unrelated families suggests a founder effect in this population of Southern Brazil.
IGT101
Resolving Blocked Antigen Phenomenon in Hemolytic Disease of the Fetus and Newborn Due to Anti‐K
Mitchell Moosavi*, Yao Ma, Alyssa Ziman, Dawn C. Ward, Janet Baez, Rebecca Jeffrey and Andrea M. McGonigle
Wing‐Kwai and Alice Lee‐Tsing Chung Transfusion Service, Department of Pathology and Laboratory Medicine, David Geffen School of Medicine at UCLA
Background/Case Studies: High titer antibodies coating cognate antigen are a rare cause of false‐negatives in red blood cell (RBC) antigen phenotyping; an event referred to as “blocking phenomenon” or “blocked antigen phenomenon (BAP).”In hemolytic disease of the fetus and newborn (HDFN), BAP can complicate the laboratory work‐up as fetal phenotype helps confirm the cause of hemolysis. Treating cord RBCs with ethylene glycine arginine (EGA) will remove BAP and maintain expression of most antigens, except K. Only 2 cases of HDFN with BAP by K antibody have been published, despite 10% of reported HDFN involving anti‐K. In both cases, chloroquine diphosphate (CDP) was used to resolve BAP, but was effective in only one. In a published comparison of elution methods, CDP failed to remove RBC coating antibodies 6 times more frequently than heat elution. Further, given the efficacy and greater applicability of EGA, our laboratory no longer maintains an inventory of CDP. We report a case of severe HDFN with BAP due to anti‐K where we used modified gentle heat elution to remove BAP.
Case Report: A 36‐year‐old multiparous female presented at 33 weeks with a pregnancy complicated by high‐titer K antibodies and ultrasound evidence of fetal anemia. A cesarean section was performed with emergent post‐delivery neonatal exchange transfusion for severe HDFN. Test results on the pre‐exchange neonatal blood specimens were typical of those found in HDFN. However, initial neonatal RBC phenotyping for K antigen was negative.
Study Design/Method: Serologic tests were done using standard procedures. A modified gentle heat elution method with equal parts packed RBCs and 6% albumin heated at 45°C for 30 minutes was used to dissociate suspected blocking K antibodies from RBCs. Repeat K phenotyping was performed after 5‐minute room temperature incubation. Confirmatory genotyping was performed by a reference laboratory using the BioArray platform (Immucor Inc., Norcross GA).
Results/Finding: The modified gentle heat elution procedure resulted in successful removal of BAP by anti‐K while preserving RBC K antigen for typing (Table 1). Genotyping confirmed neonatal RBCs to be K antigen positive.
Conclusion: Although infrequently considered, heat elution is useful for BAP in rare situations. It is simple, more frequently effective than CDP at removing RBC coating antibodies and involves readily available supplies. Our modified gentle heat elution mitigated decrease of antigen expression and effectively removed BAP to allow for accurate K phenotyping.
TABLE 1 Neonate pre‐exchange transfusion test results
| Blood type | O, RhD negative |
|---|---|
| Antibody Screen | Anti‐K |
| DAT IgG | 2+ |
| DAT C3 | 3+ |
| Eluate | Anti‐K |
| Kell Phenotype Following Heat Elution | K+ |
IGT102
Providing Personalized Red Cell Units Using Next‐Generation Sequencing: A Case Study
Hongzhi Xu*1, Antonia Moore2 and Menchu Ong1
1LSU Health Sciences Center, 2University Hospital System
Background/Case Studies: Molecular technologies are being increasingly used in transfusion medicine to predict phenotypes based on blood group genetics, especially when traditional serology assays have failed to accurately identify rare or complex antigens. In this report, we present a case with identification of antigen in Dombrock system using Next‐generation sequencing (NGS).
Study Design/Method: The patient's clinical symptoms and laboratory findings including blood bank laboratory workup were studied.
Results/Finding: The patient was a 44 years old male with past medical history of sickle cell anemia (Hemoglobin SC disease) complicated by bilateral hip avascular necrosis and acute chest syndrome requiring full red blood cell (RBC) exchange transfusion. He has history of multiple transfusions. Besides several historical anti‐E, anti‐Fya antibodies, the patient was found to have an antibody to a high prevalence antigen in the Dombrock system, resembling anti‐Holley antibody. However, samples submitted for red cell genotyping using microarray‐based ID Core XT(Grifols) indicated that the patient had genotype of Holley antigen. Since anti‐Holley antibodies may be induced by partial Holley antigen on RBC surface, NGS was performed to further characterize this particular antigen. No mutations were detected in the NGS study, which suggested that the antibody initially identified was less likely an anti‐Holley antibody. The clinical significance of this unknown antibody was later assessed using a monocyte monolayer assay (MMA). The result indicated the antibody was clinically insignificant. RBC units were then issued accordingly.
Conclusion: In the present study, a possible anti‐Holley antibody suggested by traditional antibody panel study could not be confirmed or rule out by traditional microarray‐based RBC genotyping methods. By using NGS technology, the molecular profile of the antigen‐in‐question was determined and a clinical decision was able to make based on the result. This case highlights the value of NGS in transfusion service by offering a more comprehensive evaluation of genetic variations, thus providing “personalized” RBC units for the recipient.
IGT103
Research on Correlation between the Irregular Antibody Screening Positive and the Ineffective Transfusion
Yanhua Jin*, Huili Chai, Ying Yu, Xin Tong and Zhao Liu
The First Hospital of Harbin
Background/Case Studies: Repeated blood transfusion, due to the differences in allogeneic antigen system, can stimulate the body to produce the same type of immune response, and antibodies to exogenous erythrocytes, resulting in ineffective red blood cell transfusion. It is an important reason for the inefficacy of red blood cell transfusion that some irregular antibodies cannot be detected in the application of routine pretransfusion detection methods. The detection rate of irregular antibodies in the normal population was 0.3% ∼ 2%, and the positive rate was 38% when the method was sensitive.
Study Design/Method: 1500 cases of blood transfusion were collected. There were 816 males and 684 females, aged 0‐82 years. There were ABO and Rh(D) homologous blood transfusions, in accordance with blood transfusion indications, and cross matching with blood in all medical records. Compared with the value of the hemoglobin before blood transfusion, it didn't rise to the expected value, which was re‐examined within 24 hours after infusion of red blood cell preparations, and eliminating blood loss, blood dilution and other reasons, and no clinical signs of hemolytic transfusion reaction, namely as the ineffective blood transfusion. Using enhanced detection methods to carry out irregular antibody identification for patients with the ineffective blood transfusion: 1. Increase antibody screening cell concentration. 2. Increase the ratio of test serum and antibody screening cells. 3. Use the enhancer LISS. 4. Increase the incubation time of anti‐human globulin method. 5. Adopt the absorption/dispersion method.
Results/Finding: Of the 1500 patients, 147 patients had ineffective blood transfusions, accounting for 9.80%. A follow‐up study of the causes of inefficacy in patients with blood transfusion showed that there were 37 cases of irregular antibodies with low‐titer and low‐affinity, accounting for 2.47% of the total transfusion cases. Retrospectively analysis of samples from blood donors given to the 37 patients with irregular antibodies found that all 37 patients had infused red blood cells with incongruent antigens, resulting in ineffective transfusions. Of the 37 patients, 17 were re‐transfused, and these patients were given infused red blood cells that did not contain the corresponding antigen. No ineffective blood transfusion occurred.
Conclusion: The presence of irregular antibodies that cannot be detected in the blood by conventional detection methods is an important cause of ineffective transfusion. Irregular antibodies are mainly produced by immune stimulation such as blood transfusion or pregnancy, and antibody screening should be performed for patients who have a history of blood transfusions, pregnancy history, and repeated blood transfusion therapy. Some irregular antibodies cannot be detected by routine methods, and the enhancement method of irregular antibody identification should be applied.
IGT104
ABO and Rh Phenotype Discrepancies Due to Chimerism in Twin Hematopoiesis
Carolina Bonet Bub*1, Maria Giselda Aravechia1, Leandro Santos1, Eduardo Bastos1, Marilia Sirianni1, Margareth Torres1, Jose M. Kutner1 and Lilian Castilho2
1Hospital Israelita Albert Einstein, 2Hemocentro Unicamp
Background/Case Studies: Blood group chimerism is a rare phenomenon occurring either congenital or acquired, and few cases are described by literature. Since these cases do not present major clinical manifestations and are usually recognized at the time of blood group typing by mixed‐field agglutination or discrepancies of cell typing /serum typing, it requires further evaluation to differentiate between ABO subgroups, cis‐AB and blood group chimerism.
Study Design/Method: We describe a case of female twins with ABO and Rh antigens chimerism detected during routine donor ABO typing and resolved through serologic and molecular studies.
Results/Finding: Red blood cells (RBCs) mixed‐field reaction was detected in a 21‐year‐old female donor typing routine. Double populations in gel column with anti‐A and anti‐B antibodies, while serum typing did not identify antibodies. She was asked for a new blood collection, together with her relatives. Father, mother and twins had new blood, serum and salive samples collected. Father typed B positive and mother A positive and none discrepancies detected. The twins blood typing reproduced the same results initially detected, salive studies showed presence of A and B substances secretion. Cis‐AB and ABO subgroups hypothesis were excluded. Mother and father Rh fenotyping showed R1r typing. Twins fenotyping also demonstrated R1r, however double population for c antigen was detected. Twenty one short tandem repeat (STR) loci were evaluated on extracted DNA from twins' peripheral blood to confirm the blood group chimerism using PowerPlex Fusion PCR Amplification Kit (Promega Corporation, USA) and ChimerMarker software (SoftGenetics). Of them, at least six loci (D16S539, D18S51, D2S1338, vWA, TPOX, D8S1179) showed one or two additional peaks besides, the main tall STR peaks, which were consistent with presence of chimerism.
Conclusion: This is a rare case of permanent chimerism involving two blood systems with the presence of separate group O, AB, c + and c – RBCs. Further characterization of the discrepancy RBCs typing was achieved by STR molecular testing. Despite being a rare phenomenon, diagnostic suspicion is necessary in order to resolve typing discrepancies and to provide compatible blood for transfusion.
IGT105
Severe Intravenous Immunoglobulin‐Induced Hemolysis: A Case Report
Cristiane da Silva Rodrigues de Araújo*1, Antônio Alexandre Clemente de Araújo1, Bruna Accorsi Machado1, Luciana Bertelli Dagostini1, Ana P. Vartha2, Bruna Schmitt Puhl2 and Lilian Castilho3
1Hospital São Vicente de Paulo, 2Universidade de Passo Fundo, 3Hemocentro Unicamp
Background/Case Studies: Hemolytic anemia is defined as a reduced survival of circulating red blood cells due to premature destruction. The use of intravenous immunoglobulins (IVIG) is among the less frequent causes of severe hemolysis, which is mainly caused by the presence of antibodies directed against erythrocyte antigens, especially the ABO system in the immunoglobulin preparations or by passive transfer of alloantibodies present in the blood product. We report a rare case of severe IVIG‐induced hemolysis during a treatment of Miller‐Fisher variant of Guillain‐Barré syndrome.
Study Design/Method: Female patient, 24 years old, previously healthy, sought the emergency because of paresthesia and symmetrical paresis in the hands and lower limbs with progressive worsening, accompanied by pain of moderate intensity for 5 days. Still, she presented difficulty in walking, facial folding, and horizontal nystagmus when looking to the right, strength 4 in the right hemisphere, proportional hyperreflexia and Glasgow Coma Scale (ECG) of 15 points. Computed tomography (CT) of the skull and magnetic resonance imaging (MRI) were performed, both with the absence of acute lesions. The diagnosis of Guillain Barré Syndrome, Miller Fisher subtype, was confirmed. The patient, had no history of transfusion, had no previous history of pregnancy or abortion, had no history of viral infections or recent immunizations. She only reported a biological accident three years ago.
Results/Finding: Five therapeutic plasmapheresis sessions were performed with 5% albumin replacement, with improvement of the picture and hospital discharge. After 3 months, the patient had paresthesia in the lower limbs and additional treatment with 6 doses of IVIG was indicated. After the first dose of the blood product, the patient presented severe intravascular hemolysis, with marked anemia and reticulocytosis. In total, she received three doses of IVIG, however, in the following two doses the patient had mild anemia. Immunohematological studies showed that the patient was C‐E‐ K‐ and had an anti‐C in her serum. After the second and third doses of IVIG an anti‐C, anti‐E and auto anti‐e were identified by gel test in LISS and Enzyme. Before administering the fourth dose of the immunoglobulin serological tests in the immunoglobulin were performed and showed the presence of an anti‐E and an auto‐IgG. Titre of IgG was 1:10 with IgG1 and IgG3 subclasses At this point; the treatment with immunoglobulin was suspended.
Conclusion: This is a case of severe hemolysis after the use of IVIG for the treatment of Miller Fisher variant of Guillain Barré Syndrome with passive transfer of anti‐E in a young patient with no history of viral infections who was probably alloimmunized to C antigen after a biological accident. From the diagnosis of hereditary micro‐spherocytosis, it is suggested that the association of this pathology with the use of immunoglobulin may have justified the hemolysis in this patient.
IGT106
Antibody Detection Using Solid Phase Technology: A Three Year Retrospective Analysis of Reference Laboratory Samples That Were Non‐Reactive in Tube and Gel Testing and Reactive in Solid Phase Testing
Marianne F. Leininger*1, Mollie Bell2, David Oh2, Matthew Montgomery2, Jeffrey Papiernik2 and Gregory Halverson2
1Mercy Health ‐ West Hospital, 2Hoxworth Blood Center
Background/Case Studies: There is no standard of care method for performing antibody screening on patient and donor samples in the United States. Clearly, it is more economical to employ an automated method of testing because the vast majority of samples will be negative. However, the method used can result in the increased detection of weak, unidentified (UID) antibody reactivity that does not react by the more established methods of antibody identification. (LISS, PEG, Enzymes, IgG Gel Card) Recent publications have shown the Solid Phase (SP) assay is the most sensitive in detecting prophylactic anti‐D both immediately after injection and over several months post injection. Others have demonstrated that SP shows an increased sensitivity for UID reactivity, especially in females and those with a diagnosis of cancer or autoimmune disease. Many other factors affect the reactivity of an antibody such as isotype, concentration, antigen density, Fc receptor binding and C1q affinity. The question remains, what is the best method for antibody screening in your laboratory? This abstract presents Reference Laboratory cases where the only method that detected antibody reactivity was SP.
Study Design/Method: All methods used in this retrospective study are the published procedures for Solid Phase (SP), IgG Gel (G) card and tube hemagglutination (T) using LISS or PEG and converting to anti‐Human IgG (AHG)
Results/Finding: Table 1. Shows 16 cases where reactivity was detected only with SP. In 8 cases the patient was pre‐natal with identified antibody specificities of anti‐C, ‐E, ‐Jk(a) or passive anti‐D. In the remaining cases, the diagnosis was Warm Auto Immune Hemolytic Anemia (WAIHA) with Warm Auto Antibodies (WAA) that were reactive only by SP.
Conclusion: So does this mean we should adopt the SP assay in all clinical laboratories? It is the decision of the laboratory director to determine which method of antibody detection fits best into their clinical laboratory setting. Some may choose to be more conservative and employ the most sensitive methods such as SP and accept the problem that they are more subject to detect UID reactivity. Immunohematology Reference Laboratories use many different methods to detect and analyze samples submitted from hospitals to determine if clinically significant antibodies are present. Historically there are many reports of antibodies detected only by enzymes, gel or SP. This is a small number of cases that, over 3 years, does not indicate the need for us to implement SP testing in order to confirm the results obtained by the hospital blood bank.
TABLE 1 Comparison of reactivity between tube, gel and solid phase
| Serology/Dx | T | G | SP | DAT |
|---|---|---|---|---|
| WAA | 0 | 0 | 4+ | 3+ |
| prenatal | 0 | 0 | 1+ | NT |
| WAA | 0 | 0 | 3+ | w+ |
| WAA | 0 | 0 | 1+ | 1+ |
| prenatal | 0 | 0 | 1+ | NT |
| WAA | 0 | 0 | 1+ | 3+ |
| Anti‐E, prenatal | 0 | 0 | 1+ | NT |
| WAA | 0 | 0 | 3+ | 0 |
| WAA | 0 | 0 | 2+ | m+ |
| WAA | 0 | 0 | 1+ | w+ |
| Anti‐E, prenatal | 0 | 0 | 2+ | NT |
| prenatal, RhIg | 0 | 0 | 1+ | NT |
| WAA | 0 | 0 | 1+ | 3+ |
| Anti‐E, prenatal | 0 | 0 | 3+ | 0 |
| Anti‐C, prenatal | 0 | 0 | 3+ | NT |
| Anti‐JkA, prenatal | 0 | 0 | 3+ | NT |
IGT107
Comparison of Flow Cytometry and MASPAT for Use in Platelet Cross‐Matching
Huijun Zhu* and Ping Lu
Shanghai Blood Center
Background/Case Studies: The MASPAT is a solid‐phase based assay for platelet cross‐matching to find the compatible donor platelets for transfusion, where patient serum is tested against several donor platelets. It's a rapid and simple way for this purpose and has been widely used in hospitals as well as in some blood service institutions. Flow cytometry has been used for screening of platelet antibodies in patient serum for a long time. Each of these two methods has respective advantages.We compare cross‐matching results from flow cytometry assay and MASPAT to elucidate the pattern of difference between the two.
Study Design/Method: 20 patients for compatible platelet transfusion are chosen randomly. Serum from each patient is tested against platelets from 6 ABO‐compatible donors respectively (i.e., 120 patient‐donor pairs in total) using flow cytometry assay, and the results are compared with those from MASPAT which is routinely used for cross‐matching in Shanghai Blood Center. In flow cytometry assay, washed platelets are incubated with serum at room temperature and washed 3 times, following by incubation with FITC‐labeled anti‐human antibody. Platelets are washed again and subjected to flow cytometry, where samples with FITC median fluorescence intensity (MFI) in platelet gate greater than twice of that for negative control (healthy AB donor serum) are determined as positive. The MASPAT as well as the result elucidation is performed according to manufacturer's manual.
Results/Finding: Among the 20 patient samples, only 7 have identical results for all 6 donors from both methods. In terms of patient‐donor pairs, 30 out of 120 are inconsistent between the two methods (i.e., coincidence rate is 75%), where 20 is negative in flow cytometry but positive in MASPAT (Situation 1), while the rest 10 is just the contrary, that is, positive in flow cytometry but negative in MASPAT (Situation 2). In the 30 results with discrepancy, there are 8 with minor difference and 22 with significant difference, where 80% of Situation 2 have very remarkable difference. Despite the high inconsistency between the two methods, the final choice of compatible units is inconsistent for only 2 patients (10% of total).
Conclusion: The comparison of two methods for platelet cross‐matching demonstrates that MASPAT results in more positive predictions, some of which are probably due to non‐specific adheresion. In fact, one patient treated with drugs in Situation 1 is proved to have no platelet antibodies using other tests. However, as sensitivity is more demanded than specificity in choosing compatible units, MASPAT is popular due to it's simplicity and rapidity. For all the discrepancies, further investigation should be carried out to elucidate which method is more accurate and useful both theoretically and clinically.
BBC30
Qualification of Amustaline‐GSH Red Blood Cell Pathogen Reduction System for a Phase 3 Clinical Trial
Alicia B. Prichard*1, Melissa Kuhn1, Pedro Linares1, Jonathan McCoun1, Rita A. Reik1, Richard Gammon1, Yenny Wang2, Anna Erickson2, Travis Berry2 and Katharina Waldhaus2
1OneBlood, Inc., 2Cerus Corporation
Background/Case Studies: A pathogen reduction (PR) system for red blood cells (RBC) uses amustaline and GSH to inactivate pathogens (viruses, protozoa, bacteria) and leukocytes by formation of nucleic acid adducts. A randomized controlled non‐inferiority design Phase 3 trial will compare the safety and efficacy of PR RBCs to conventional RBCs. The objective of this study was to qualify the Amustaline‐GSH PR process at a regional blood center (OneBlood Biologics Research Laboratory, Orlando, FL) to support the Phase 3 trial.
Study Design/Method: CPD leukocyte reduced AS‐5 RBCs were prepared on the day (D) of collection, D0, at OneBlood St. Petersburg, FL and transported to OneBlood Orlando Lab. Test (T) units (312 ± 22 ml) were treated with 20 mM GSH/0.2 mM amustaline within 24h of collection, Control (C) units (313 ± 21 ml) were untreated. T and C RBCs were stored at 1‐6°C for 35‐38 days. T were sampled on D0, 1, 2 and 35‐38 and C were sampled on D0‐3 and 35‐38 for analysis of in vitro parameters (Table 1); hemoglobin (Hb) and hematocrit (Hct) were evaluated at both OneBlood locations D0‐1. To mimic transport to the clinical transfusion sites, RBCs were shipped to Cerus at the end of storage and assessed for hemolysis upon receipt.
Results/Finding: Post PR, T had volumes of 265 ‐ 337ml, with 98 ± 1% Hb recovery and 60 ± 7 g of Hb. T had 9‐fold reduction in extracellular protein compared to C. At the end of storage T had higher ATP than C while pH, K + and lactate were lower. Hct, Na + and glucose were similar between T and C on D35‐38. T and C ATP was >2 mol/g Hb indicative of effective RBC viability, throughout storage. D35‐38 hemolysis was comparable between T and C and after shipment (D36‐42) the hemolysis was lower in T compared to C (Table 1).
Conclusion: Amustaline‐GSH PR for RBC was successfully qualified at a regional blood center to support a large Phase 3 trial. All PR RBC components met the US criterion for hemolysis at end of storage and after shipment. All measured in vitro parameters of Amustaline‐GSH RBCs indicated suitability for transfusion.
TABLE 1 In Vitro RBC Function Over Storage (mean ± SD, n=15)a
| Day 1‐3b | Day 35‐38 | |||
|---|---|---|---|---|
| Testc | Control | Testc | Control | |
| Hct (%) | 60±3 | 60±2 | 65±3 | 65±2 |
| 67±2d | 67±3d | |||
| Hb (g/unit) | 60±7 | 62±8 | Not measured | |
| Hemolysis (%) | 0.1±0.1* | 0.0±0.0 | 0.19±0.04 | 0.28±0.20 |
| 0.15±0.05*, d | 0.29±0.24d | |||
| pH (22°C) | 6.9±0.2* | 7.1±0.1 | 6.4±0.2* | 6.7±0.3 |
| Total ATP (µmol/g Hb) | 6.9±1.1* | 4.2±0.6 | 4.6±1.0* | 3.5±0.6 |
| K + (mM) | 2±1* | 8±3 | 54±4* | 58±5 |
| Na + (mM) | 144±1* | 138±3 | 98±6 | 96±6 |
| Glucose (mM) | 27±1* | 29±1 | 16±2 | 15±3 |
| Lactate (mM) | 7±1 | 7±1 | 23±2* | 31±3 |
p‐value < 0.05 by unpaired t‐test
This project has been funded in whole or in part with Federal funds from the DHHS; ASPR; BARDA; Contract No. HHSO100201600009C
D0 is day of collection, Test units sampled D2 (post‐INTERCEPT), Control units sampled D1‐3
The amustaline/GSH PR system for RBCs is not approved for commercial use.
Post shipment testing on D36‐42 post‐donation
BBC31
A Comparative Survey of Recent Anellovirus Loads in the Plasma of HIV Carriers from the Pittsburgh Site of the Multi‐Center AIDS Cohort Study
Lirong Qu*1, Holly Bilben2, Lawrence Kingsley2, Diana Metes3 and David T. Rowe2
1BSI, 2University of Pittsburgh, 3University of Pittsburgh Medical Center
Background/Case Studies: Human anelloviruses are the smallest in particle size, smallest in genome size, and least complex in genetic organization of all human pathogens. They establish a chronic persistent infection in infancy or early childhood and produce a constantly detectable load in plasma thereafter. Some studies suggest they are ubiquitous, present in >90% of the human population, and that immune surveillance is required to control the level of the virus load.
Study Design/Method: Using a quantitative DNA PCR assay we recently developed that targets the most conserved region of the Anellovirus genome we examined viral loads in the plasma of HIV‐negative blood donors and HIV carriers in Pittsburgh, Pennsylvania.
Results/Finding: For 53 blood donors, 51 were positive with an average load of 1.49 × 10² copies/mL of plasma, a median value of 80.5 copies/mL plasma, ranging from 0 to 1.87 × 10³ copies/mL. For 376 HIV carriers, all were positive with an average of 6.4 × 10⁴ copies/mL of plasma, a median value of 2.8 × 10³ copies/mL of plasma, ranging from 4 to 1.8 × 10⁷ copies/mL.
Conclusion: These results validate the PCR assay that was developed and confirm that detectable viral loads of around 100‐200 copies were present in >90% of blood donors surveyed. In addition, HIV infection appears to reset the Anellovirus load of the average carrier approximately 2 orders of magnitude higher. The broad range of loads (approx. 106 copies/mL) in HIV carriers is being investigated for correlates of immune and health status.
BBC32
Evaluating the Impact of Total Nucleated Cell Dose on the Hematopoietic Engraftment in Stem Cell Transplantation. A Single‐Center Experience
Marta Peña*1, Eva Alonso2, Mireia Morgades1, Christelle Ferrà1, Juan Manuel Sancho1, Susana Vives1, Miriam Moreno1, Montserrat Batlle1, Anna Torrent1, Blanca Xicoy1, Josep Maria Ribera1 and Joan Ramon Grifols2
1Institut Català d'Oncologia, Hospital Germans Trias i Pujol, 2Banc de Sang i Teixits, Hospital Germans Trias i Pujol
Background/Case Studies: CD34 + cell dose is an extended predictor of post‐transplant hematopoietic recovery. Delayed recoveries despite a sufficient number of CD34 + are common suggesting other factors play a role in the kinetics of this process. The effect of total nucleated cells (TNC) on the engraftment remains unclear and several studies have shown conflicting results. The objective of this study was to analyze the impact of TNC on the engraftment and on survival.
Study Design/Method: A single‐center analysis from January 2016 to December 2017 included 93 hematopoietic stem cell transplantation (HSCT) procedures (53 autologous and 40 allogeneic) in 91 patients (Pts) (56% male and 44% female). The main reasons for HSCT were acute leukemia for allogeneic HSCT (n=30) and multiple myeloma for autologous HSCT (n=31). Haploidentical and cord‐blood transplantation were excluded. The conditioning regimen prior to allogeneic HSCT was myeloablative (MA) in 19 Pts (48%) and non‐myeloablative (NMA) in 21 (52%). The main source of stem cells was peripheral blood (97%).
Results/Finding: The median TNC and CD34 + infused was 8.07 × 10⁸/Kg and 4.02 × 10⁶/Kg, respectively. In autologous HSCT, we found that higher TNC dose was correlated with faster neutrophil engraftment (p<0.001, Spearman correlation coefficient (ρ)=‐0.524) but higher CD34 + cell doses did not have such effect. In allogeneic HSCT group, higher TNC dose was correlated with faster platelet engraftment (p<0.001, ρ=‐0.754), either for MA (p=0.001, ρ=‐0.737) and NMA group (p=0.001, ρ=‐0.742), but CD34 + cell dose was not predictive of faster engraftment. In Pts receiving > 8x10⁸/Kg TNC we observed a shorter median time of neutrophil engraftment in the autologous group and a shorter time of platelet recovery in the allogeneic group (Table 1). No statistical differences in survival outcomes were observed in any group regarding TNC dose and number of CD34+.
Conclusion: In our series, a strong association between higher TNC cell dose and a shorter time of engraftment was observed. We could not demonstrate this effect with CD34 + cell dose. No impact on survival was observed with regards to the TNC and CD34 + cell dose.
TABLE 1 (BBC32) Autologous HSCT
| CN≤8 × 10⁸/Kg (n=22) | CN>8 × 10⁸/Kg (n=30) | p | |
|---|---|---|---|
| Days to achieve platelets >20,000/µL, median [range] | 13 [10 ; 21] | 13 [9 ; 144] | 0,717 |
| CN≤8 × 10⁸/Kg (n=23) | CN>8 × 10⁸/Kg (n=30) | p | |
| Days to achieve neutrophil count >500/µL, median [range] | 16 [11 ; 27] | 12 [10 ; 38] | <0,001 |
| Allogeneic HSCT | |||
| CN≤8 × 10⁸/Kg (n=19) | CN>8 × 10⁸/Kg (n=14) | p | |
| Days to achieve platelets >20,000/ µL, median [range] | 14 [11 ; 115] | 12 [10 ; 18] | 0,011 |
| CN≤8 × 10⁸/Kg (n=22) | CN>8 × 10⁸/Kg (n=15) | p | |
| Days to achieve neutrophil count >500/µL, median [range] | 17 [12 ; 30] | 17 [11 ; 25] | 0,531 |
BBC33
Modelling the Transfusion‐Transmission Risk of West Nile Virus in Australia Associated with Travelling Donors
Philip Kiely*1,2, Iain B. Gosbell1, Veronica C. Hoad1, Allen C. Cheng2, Erica M. Wood2 and Zoe K. McQuilten2
1Australian Red Cross Blood Service, 2Department of Epidemiology and Preventive Medicine, Monash University
Background/Case Studies: West Nile virus (WNV) is a transfusion‐transmissible virus. Northern hemisphere WNV lineages 1 and 2, primarily responsible for human disease, are not endemic in Australia although the less virulent WNV Kunjin strain is endemic in tropical northern regions. As Australia does not perform WNV donor screening there is a potential transfusion‐transmission (TT) risk associated with donors returning from endemic/outbreak countries. To estimate this risk we have developed a probabilistic model with Monte Carlo simulation and applied it to EU and neighbouring countries for the 2017 WNV transmission season.
Study Design/Method: The input parameters for each country were the probability of: 1) acquiring an asymptomatic WNV infection during the period of observation, derived from the number of reported WN fever (WNF) cases in that country and the ratio of symptomatic to asymptomatic infections (0.206, 95% CI:0.147‐0.265); 2) a donor visiting each outbreak country during the period of observation, derived from the proportion of the Australian donor population visiting that country during the period of observation; 3) a returning donor donating while viraemic, based on the number of returning donors who donated within 2 weeks of leaving the outbreak country (0.172, 95% CI:0.0.095‐0.249); 4) a donation being used for clinical products (0.5883, 95% CI:0.5871‐0.5895); and 5) transfusing an issued clinical product (0.9434, 95% CI:0.9430‐0.9439). The TT risk was expressed as the risk of transfusing a clinical product derived from an infectious donation given by a returning donor. Risk estimates were performed on a weekly basis. Input parameters were assumed to have a triangular distribution and the simulation was run with 105 iterations.
Results/Finding: For the 3 countries reporting the highest WNV TT risk during the 2017 transmission season, the peak weekly risk was 1:1,412,000,000 (95%CI:883,000,000‐3,529,000,000) for Greece, 1:6,163,000,000 (3,696,000,000‐9,345,000,000) for Hungary, and 1:3,720,000,000 (2,528,000,000‐7,039,000,000) for Italy.
Conclusion: These results demonstrate a very low risk to blood safety in Australia from the 2017 WNV transmission season in EU and neighbouring countries. The estimated risks were so low that no additional risk mitigation strategies, such as the deferral of donors returning from these countries, were required. The model allows for regular estimations of the TT risk in non‐endemic countries associated with returning donors and can be readily adapted to specific countries and other transfusion‐transmitted pathogens. However, with such low levels of risk it is feasible to monitor reported case numbers of WNF with set trigger points for implementing risk modelling for each country.
BBC34
Comparative Efficacy of BacT/ALERT and eBDS Methods for Primary Culture of Platelet Products for Prevention of Bacterial Contamination of Platelet Components
Swati Srivastava1,2, Michael R. Jacobs*1 and Robert W. Maitta3
1University Hospitals Cleveland Medical Center, 2Case Western Reserve University School of Medicine, 3University Hospitals Cleveland Medical Center, Department of Pathology
Background/Case Studies: Testing of platelet (PLT) units was mandated from March 2004 and was implemented by primary culture single donor platelet (SDP) collections at that time and later of pre‐storage pooled platelets (PSPP). Two FDA‐approved methods for primary culture are available ‐ BacT/ALERT and eBDS. As our PLT suppliers used either BacT/ALERT with an 8‐10 mL test volume or eBDS with a 3‐4 mL test volume since 2007, we were able to compare bacterial contamination and septic transfusion reaction rates between PLT units tested with these two methods.
Study Design/Method: PLT units transfused at our institution between Jan 2007 and Dec 2017 were studied. SDP and PSPP units were tested by primary culture by suppliers using BacT/ALERT or eBDS systems. BacT/ALERT testing (bioMerieux, St Louis, MO) was performed by inoculating 8‐10 mL of SDP collections or PSPP units into BacT/ALERT BPA culture bottles at 24‐48 h after collection. eBDS (Haemonetics Corporation, Braintree, MA) was performed by inoculating 3‐4 mL aliquots of SDP collections or PSPP units into eBDS culture pouches at 24‐48 h after collection; pouches were incubated at 35oC for 24 h and oxygen levels in head space then measured using eBDS Oxygen Analyzer. Units released for use if negative by these methods after testing for 24 hours. At‐issue culture was performed by obtaining aliquots from all units at time of release for transfusion, with 0.1 mL volumes plated onto blood agar plates. Plates were incubated for up to 48 hours, and specimens yielding bacterial growth were cultured quantitatively. Records of patients receiving contaminated units were reviewed. Contamination and septic transfusion rates were calculated for each method and unit type.
Results/Finding: A total of 90,243 PLT units were transfused during the 11 year study period; 40,144 tested by BacT/ALERT (35,188 SDP and 4,957 PSPP) and 50,098 by eBDS (34,898 SDP and 15,200 PSPP). Twenty‐six units were found to be bacterially contaminated: 12 tested by BacT/ALERT (10 SDP, 2 PSPP) and 14 (12 SDP, 2 PSPP) by eBDS. Contamination rates (expressed as rates per million PLT units for units tested by BacT/ALERT vs. eBDS) were comparable overall and by PLT unit type: overall 299 vs. 279 (p=0.86); SDP 284 vs. 344 (p=0.65); PSPP 403 vs 132 (p=0.24). Twenty‐four contaminated products were transfused and resulted in five septic reactions, one from a unit tested with BacT/ALERT and 4 with eBDS (25 vs. 80 per million, respectively; p=0.27).
Conclusion: Despite the difference in volume of PLT tested by the two methods (3‐4 mL by eBDS and 8‐10 mL by BacT/ ALERT), rates of PLT bacterial contamination and septic reactions to transfusion of contaminated PLT were not significantly different between the PLT tested by the two primary testing methods used. Additional measures are needed to reduce rates of bacterial contamination and septic reactions to bacterially contaminated PLT products.
BBC35
Amotosalen/UVA Treatment Inactivates Multiple Anaerobes Present in a Single Platelet Concentrate Unit to Sterility after 7 Days of Storage
Nidhi Patel1, Melissa McCormack1 and Peter Bringmann*2
1Cerus Corporation, 2Microbiology Department, Cerus Corporation
Background/Case Studies: The INTERCEPT® Blood System for Platelets was developed for the inactivation of a broad range of pathogens and leukocytes in platelet concentrates (PC). The system utilizes amotosalen and UVA light and is approved in the US to treat apheresis platelets in 100% plasma or in 65% PAS with doses ranging from 2.9 to 8.0x10¹¹ platelets.
Despite the implementation of bacterial culture screening unrecognized bacterial contamination may still result in fulminant transfusion‐transmitted infections (TTI). In particular, anaerobic bacteria that exhibit a longer lag period or slowly grow under PC storage conditions can be missed by culture based bacterial screening and result in TTI. To evaluate the efficacy of amotosalen‐UVA to inactivate bacterial co‐contamination by two anaerobic bacteria, Clostridium perfringens (a fast growing anaerobe) and Propionibacterium acnes (a slow growing anaerobe), contaminated PCs were treated with amotosalen‐UVA, and stored under PC storage conditions at 22˚C for 7 days.
Study Design/Method: For each experiment, PCs prepared either in 35% plasma/65% PAS or 100% plasma with a final volume of ∼280 to 326 mL and a dose of 3.4 to 4.4 × 10¹¹ platelets were used. Platelet components were divided in half and each half was spiked with either C. perfringens or P. acnes. Prior to the Amotosalen‐UVA treatment, half units with one of each anaerobe were recombined and a sample was taken for plating assay. The co‐infected PC was treated with amotosalen and UVA. Samples were taken: pre and post‐illumination, post‐CAD and after 5 and 7 Days of storage.
A Control arm PC was also spiked to confirm the growth and survival of C. perfringens and P. acnes under similar processing (without S‐59 and UVA) and PC storage conditions as Test.
Results/Finding: C. perfringens (Cp) and P. acnes (Pa) inactivation is summarized below:
(BBC35)
| Platelet Matrix | Pre‐UVA (0J) Titer (Log10 CFU/mL) | Post‐UVA (3J) Titer | Day 5 | Day 7 | Log10 Reduction (CFU/mL) | ||||||
|---|---|---|---|---|---|---|---|---|---|---|---|
| Cp | Pa | Cp | Pa | Cp | Pa | Cp | Pa | Cp | Pa | ||
| Test (n=3) | 65% PAS‐35% Plasma | 6.4 | 6.8 | ND1 | ND | ND | >6.4 | >6.8 | |||
| 6.5 | 6.9 | ND | ND | ND | >6.5 | >6.9 | |||||
| 6.4 | 6.9 | ND | ND | ND | >6.4 | >6.9 | |||||
| 100% Plasma | 6.6 | 6.8 | ND | ND | ND | >6.6 | >6.8 | ||||
| 5.9 | 7.1 | ND | ND | ND | >5.9 | >7.1 | |||||
| 5.7 | 7.0 | ND | ND | ND | >5.7 | >7.0 | |||||
| Control (n=2) | 65% PAS‐35% Plasma | 3.4 | 3.8 | NA2 | 6.0 | 3.8 | 4.9 | 3.6 | NA | ||
| 6.3 | 6.9 | NA | 5.9 | 6.7 | 4.8 | 6.4 | NA | ||||
| 100% Plasma | 3.3 | 3.7 | NA | 7.8 | ND | 7.2 | 3.6 | NA | |||
| 6.8 | 6.9 | NA | 6.8 | 6.5 | 5.4 | 6.7 | NA | ||||
1. Not detected 2. Not applicable
Conclusion: Amotosalen‐UVA reproducibly inactivated multiple anaerobic bacteria in co‐contaminated PC to a high level of ∼6 log CFU/mL resulting in sterility as demonstrated by the absence of detectable bacteria after 7 Days of storage, while the Control arm demonstrated growth/survival of bacteria over the similar processing and storage period.
BBC36
Donor Characteristics Do Not Influence the Risk for Onset of Transfusion‐Related Acute Lung Injury in a Secondary Analysis of Two Case‐Control Studies
Emma van de Weerdt*1,2, Anna‐Linda Peters2,3, Femmeke Prinsze4, Dirk de Korte5, Nicole Juffermans6 and Alexander Vlaar1
1Department of Intensive Care Medicine, Academic Medical Center, 2Laboratory of Experimental Intensive Care and Anesthesia, Academic Medical Center, 3Department of Intensive Care, Medical Center, 4Department of Donor Studies, Sanquin Research, 5Department of Blood Cell Research, Sanquin Research and Landsteiner Laboratory, 6Laboratory for Experimental Intensive Care and Anesthesiology, Academic Medical Center
Background/Case Studies: Transfusion‐related acute lung injury (TRALI) is a potentially fatal complication of transfusion. In pre‐clinical studies and several clinical studies, TRALI has been related to loss of product quality during red blood cell storage, called the “storage lesion”. Donor characteristics, as for example age, genetics and sex influence this “storage lesion”. We investigated the relation between donor characteristics and onset of TRALI. We hypothesized that donor sex, age and blood type is related to TRALI incidence.
Study Design/Method: We performed a secondary analysis on the donor data from two cohort studies, which combine to one of the largest cohorts of TRALI patients to date. The first cohort consisted of a retrospective nested case control study in ICU patients, the second cohort consisted of a prospective case control study in cardiac surgery patients. Suspected TRALI was defined by using the consensus definition of ALI. We obtained donor sex, age and blood type from the national blood bank. We used kruskal‐wallis testing to compare the number of transfused products and chi‐square testing to compare proportions of TRALI patients and transfused control.
Results/Finding: The retrospective cohort consisted of 109 patients that fulfilled the diagnostic criteria for TRALI (64% male, median age 62 [IQR 47‐71], massive transfusion 37% ± 33). 109 patients that received transfusion, but did not develop TRALI, were randomly selected to serve as control patients (66% male, median age 57 [IQR 49‐72], massive transfusion 37% ± 33). TRALI patients received more products than controls (chi‐square test p < 0.0001). There was no relation between TRALI incidence and donor sex (chi square test p > 0.5). Both TRALI patients and transfused controls received mainly products from donors over 41 years old (chi square test p < 0.05), but donor age did not influence TRALI risk (chi square test p > 0.5). Both TRALI and control patients received more blood products from blood type 0 and A (p<0.0001). TRALI was not related to blood group matched or blood type compatible transfusion (fisher‐exact test p = 0.41). In the prospective case control study in cardiac surgery patients, 16 patients developed TRALI (75% male, median age 74, IQR 71‐79). 32 patients were randomly selected as controls (63% male, median age 69, IQR 62‐75). This cohort confirmed the results of retrospective study for donor blood type, donor sex and blood type‐compatible and blood type‐matched products. In this cohort, both groups received mainly products from males, and TRALI patients did not receive more transfusions.(chi square test p < 0.00001).
Conclusion: We conclude that in two cohorts of TRALI patients, donor blood type, donor age, donor sex and the transfusion of blood type‐compatible and blood type‐matched products were not associated with an increased risk for TRALI.
BBC37
Measuring Red Blood Cell Deformability Using a Microfluidic Device: Development of an External Standard Based Approach to Reduce Chip‐to‐Chip Variations
Jonathan Robidoux*, Eric Ducas, Audrey Laforce‐Lavoie and Danny Brouard
Héma‐Québec
Background/Case Studies: An impaired deformability of red blood cells (RBC) can be related to diseases or consequent to red cell concentrate (RCC) storage. A polydimethylsiloxane (PDMS) microfluidic device especially designed to reproduce RBC circulation in blood vessels was recently developed to assess RBC deformability. This single‐use device is made of two inlets, two arrays of channels and a unique outlet. Flow rate measurements near the channel outlets correlates with RBC rheological properties. The analytical approach uses an external standard to account for chip‐to‐chip variations. This study aims at validating microbeads as an external standard to monitor RBC deformability during storage.
Study Design/Method: A dye‐doped carboxyl polystyrene microsphere (d = 1 ± 0.05) solution was used as external standard in this study. The stock solution (DCCR004, BangLabs) was dispersed 1:20 in filtered phosphate buffered saline (PBS). Glycerol was added at 16% to match the average RBC flow rate previously recorded with the same microfluidic device on fresh RBC. Multiple hardware and software parameters were tested for their respective impacts on the performances of the analytical method (i.e. precision, accuracy), measured as the rate of occurrence of plugging events. To validate the external standard approach, three different external standard solutions were prepared (A, B and C) and tested using nine different chips in an experiment designed to evaluate the reproducibility of output results. The chip's left‐hand side inlets were filled with standard A, while right‐hand side inlets were filled with either standard A, B or C. The right/left flow rate ratios were used as the analytical output signal. RCC samples of different storage ages were analyzed using the external standard approach and compared with respect to their deformability.
Results/Finding: Flow rates recorded for the left and right inlets were compared for each chip. The between‐channels coefficient of variation (% C.V.) within the same chip was lower than 2 %, which demonstrates a high homogeneity in the channel mask used to fabricate PDMS chips. To evaluate the chip‐to‐chip manufacturing reproducibility, left inlets on each chip were filled standard A, and flow rates were compared. The % C.V. was < 5 %, and was deemed within the acceptable range. Finally, there were no significant differences in recorded flow rates for standards A, B or C, and the overall flow rate for the external standard solution was determined at 0.270 ± 0.011 nL/s (% C.V. = 4%), which was similar to flow rates observed for RCC samples in a previous study.
Conclusion: Microfluidic methods are believed to be suitable for precise and sensitive RBC deformability analysis. The development of an appropriate external standard approach can be used to address chip‐to‐chip variability, and the use of dye‐doped carboxyl polystyrene microspheres has been found to be a reproducible method.
BBC38
Granulocytapheresis in First Time Female Donors: Does BMI > 30 Lead to a Greater WBC Increase after Mobilization with G‐CSF Plus Dexamethasone Leading to a Better Yield?
Heidi Krause, Roland Bassett, Tiffany Williams‐Lara and Fleur M. Aung*
The University of Texas MD Anderson Cancer Center
Background/Case Studies: Granulocyte transfusions have been used to treat bacterial/fungal infections in severely neutropenic leukemic and stem cell transplant patients. Inadequate dosages limited the usage in the past. The use of mobilizing agents and fully automated devices has improved the yield of the granulocyte concentrate, leading to improved clinical outcomes. It has now been established that the dose of transfused granulocyte is one of the most important predictors for the success of granulocyte transfusions.
Study Design/Method: Clinical data from January 2017 to February 2018 of 96 first time consecutive female donors who were relatives and friends of patients was collected. BMI was calculated of the donors and the donors were categorized into three groups, normal BMI < 25, BMI 25 ‐<30 (overweight) and BMI > 30 (obese).The goal of the study was to see whether there was a correlation with increased BMI in the first time female donors with a greater increase in WBC after mobilization with G‐CSF (Filgrastim [Neupogen]) plus dexamethasone. All donors received a G‐CSF dose of 480 mcg as a single subcutaneous injection 12 hours prior to collection. Dexamethasone 8 mg (4 mg tablets x2) was also prescribed 12 hours prior to collection to donors without a history of eye disease. Complete blood counts were performed prior to mobilization, post‐mobilization, post apheresis and of the granulocyte concentrate. The allogeneic blood donor criteria was used to qualify granulocyte donors.
Statistical Analysis: Wilcoxson rank‐sum tests were used to compare the distribution of the following parameters (age, weight, pre G‐CSF wbc/granulocyte %/platelet count, post G‐CSF wbc/platelet count, post‐apheresis wbc/platelet count, donor TBV, TBV processed, run time, collection preference, granulocyte concentrate volume/total wbc/hematocrit/ANC, collection efficiency 2, % increase of wbc/ granulocyte post G‐CSF, and % decrease of wbc/platelet post ‐apheresis) between the BMI groups. All statistical analysis were performed using R version 3.4.3. All statistical tests used a significance of 5% and no adjustments were made for multiple testing.
Results/Finding: Of the 96 first time female donors, 37 (38.5%) had a normal BMI, 37(38.5%) were overweight and 22 (23%) were obese. There were only four parameters found to be of statistical significance: weight (p < 0.0001), donor's total blood volume (p<0.0001), granulocyte concentrate volume ( p<0.0001) and wbc content of the granulocyte concentrate (p=0.03). The hematocrit of the majority (95.8%) of the granulocytes concentrates collected from all three BMI groups were <5%. All of the other parameters listed above were not statistically significant.
Conclusion: It is concluded that increased BMI does not correlate with a greater increase in WBC after mobilization with G‐CSF + /‐ dexamethasone in first time female donors. The increased BMI does correlate with a larger volume of granulocyte concentrate collected with an increased total white cell content. We found that the fully automated apheresis machine allowed us to minimize red cell contamination while optimizing granulocyte collection. The data analyses is to be extended to male donors as well as repeat female/male donors to confirm our findings.
BBC39
HIV Molecular Surveillance in Chinese Blood Donors
Zhiyang Liu1,2, Peibin Zeng3, Zhan Gao1,2, Yu Liu1, Miao He*1,2, Jing Liu4, Dan Liao5, Jingxing Wang1,2, Paul M. Ness6 and Hua Shan7
1Institute of Blood Transfusion, Chinese Academy of Medical Sciences, 2Sichuan Blood Safety and Blood Substitute International Science and Technology Cooperation Base, 3West China School of Public Health, 4Johns Hopkins Hospital, 5RTI International, 6Johns Hopkins Medical Institutions, 7Stanford University
Background/Case Studies: The HIV‐1 pandemic is characterized by its rapidly increasing genetic divergence. Ongoing monitoring of HIV‐1 molecular diversity in blood donors is an important component of a comprehensive surveillance system. We studied HIV‐1 subtype distribution and drug resistance mutations (DRMs) in HIV‐1 infected blood donors from five Chinese regions.
Study Design/Method: HIV‐1 Western‐Blot (WB) confirmed blood samples were collected from five blood centers from Jan 2015 to Dec 2016. The HIV Pol regions were sequenced to reconstruct phylogeny. The subtypes and the DRMs of each sequence were analyzed using previous published methods.
Results/Finding: 119 sequences were successfully obtained from 217 HIV‐1 infected donors. Subtype distribution is as the following: circulating recombinant form (CRF) 07_BC (67.2%), CRF08_BC (7.6%), CRF01_AE (19.3%), B (2.5%), and CRF55_01B (2.5%). The predominant subtype in each blood center varied. 20 samples had DRMs, yielding a drug resistance prevalence of 16.8% (20/119). 24 DRMs were identified including 2 protease inhibitors (PIs) accessory DRMs (Q58E and V32E), 2 PIs major DRMs (M46L), 8 nucleoside RT inhibitors DRMs (F116Y, D67N, K70N and M184L), and 12 no nucleoside RT inhibitors DRMs (V179E, K103N, Y188D, E138A, L100F, L100P) (Table 1).
Conclusion: The subtype distribution of HIV‐1 in Chinese donors continues to show abundant diversity. Compared to previous results, the formerly predominant subtype B continues to decrease. This is the first report of subtype CRF_5501B in an infected donor. CRF_5501B is a newly identified subtype which has been associated with men who have sex with men (MSM). Our findings are consistent with the shift of predominant mode of HIV transmission from illegal drug injection to sexual transmission (including MSM transmission) observed in the general Chinese population. The DRMs prevalence increased from 13.2% (27/205, 2012‐2014 data from the same blood centers) to 16.8% (20/119). While a limitation of this study is the relatively low amplification rate (54.8%, 119/217), our results support the need for continued molecular surveillance in donors. Better understanding of HIV risk factors will be important to further improve blood safety.
TABLE 1 (BBC39) HIV‐1 subtype distribution and DRMs information
| HIV‐1 subtype distribution | Sequences had DRMs | ||||||||
|---|---|---|---|---|---|---|---|---|---|
| Region | B | CRF01_AE | CRF07_BC | CRF08_BC | CRF55_01B | PI accessory DRMs | PI major DRMS | NRTI DRMs | NNRTI DRMs |
| Southwest‐1 | 1 | 5 | 56 | 8 | 1 | 1 | 2 | 6 | 8 |
| South | 16 | 4 | 1 | 1 | |||||
| Central | 1 | 5 | |||||||
| Southwest‐2 | 1 | 2 | 5 | 1 | 2 | ||||
| Northwest | 10 | 1 | 1 | 1 | 1 | 1 | |||
| Total | 3 | 23 | 80 | 9 | 3 | 2 | 2 | 8 | 12 |
As determined by the Stanford HIVdb Program Genotypic Resistance Interpretation Algorithm (http://hivdb.stanford.edu). PI: Protease inhibitor; NRTI: Nucleotide reverse transcriptase inhibitor; NNRTI: Nonnucleoside reverse transcriptase inhibitors
BBC40
Iron.Scan ‐ Point‐of‐Donation Iron Deficiency Screening
Li Jiang* and Dakota O'Dell
VitaScan
Background/Case Studies: Iron depletion poses a significant health risk to blood donors, yet as much as 50% of the blood collected is from donors who are already iron deficient. Donor screening includes testing hemoglobin, which is the best available rapid test that serves as a proxy for iron status, but is in fact a poor predictor of actual iron stores. Many low iron donors are thus further depleted by their donations. This problem has been recognized by the FDA and the AABB, who have pushed for new protocols to reduce the risk to donors.
Serum ferritin is considered to be one of the best indicators of iron stores, but due to technology limitations can only be tested using laboratory machines, which are slow, expensive, and impractical for use as a screening test within the existing blood donation workflow.
VitaScan has developed Iron.Scan, a rapid diagnostic test for quantitative assessment of ferritin in minutes from a finger stick of blood. Here we demonstrate its accuracy compared to the IMMULITE 2000 FERRITIN assay.
Study Design/Method: A test for ferritin was developed as a lateral flow immunassay. Colorimetric lines develop on the assay as a function of ferritin protein concentration, which are analyzed by our optical reader to calculate a ferritin value. This was tested on 55 serum samples and 40 whole blood samples, and we compare linear correlation and agreement against the IMMULITE 2000 FERRITIN laboratory assay.
Results/Finding: Serum and blood samples demonstrated strong correlation (R2 = 0.95 and R2 = 0.91, respectively). Using the HEIRS study designated cut‐off of 26 ng/mL to define iron deficiency, we also demonstrate 93.5% sensitivity and 91.7% specificity for serum and 87.5% sensitivity and 90.9% specificity for blood.
Conclusion: The Iron.Scan assay demonstrates strong agreement with the laboratory standard when tested on blood. It is feasible to implement this test at the point‐of‐donation to screen donors for iron deficiency.
Figure (BBC40) Iron.Scan system. (A) Vitscan reader platform. (B) Test cartridge and packaging. (C) VitaScan employee using the device. (D) Serum data (N=55) and (E) blood data (N=40) with cutoff 26 ng/mL.
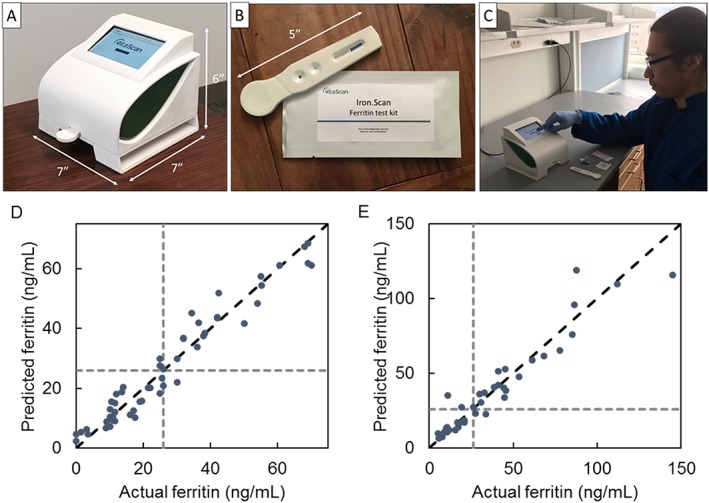
BBC41
Comparison of Bacterial Growth Kinetics in Platelets Suspended in Plasma and Platelet Additive Solution
Stephen Wagner*, Cheryl Hapip and Lenora A. Abel
American Red Cross Holland Lab
Background/Case Studies: Bacterial contamination of platelets may lead to septic events when organisms grow undetected by culture during platelet storage. An organism's growth might be influenced by the milieu in which platelets are suspended. This study evaluated the growth of 11 bacterial species that have been implicated in septic events in platelet additive solution (PAS) platelets or have been characterized as slower growers or exhibiting lag times in platelets.
Study Design/Method: A hyperconcentrated double unit of aphersis platelets with a targeted yield of 7.2 × 10¹¹ and concurrent plasma were collected on the Amicus from a normal, consenting donor. The hyperconcentrated unit was divided equally into two aliquots. To one aliquot, PAS‐3 was added to yield 35% plasma/65% PAS‐3. To the other aliquot, an equivalent volume plasma that was used for preparing PAS‐3 platelets was added. Following 1‐hour resting and 1‐hour agitation, aliquots were immediately split into 60 mL sub‐aliquots in CLX containers and inoculated with 10‐100 CFU/mL, for purposes of quantitative plate assay, with fresh overnight cultures of bacterial isolates including: S. aureus, S. epidermidis, E. coli, K. pneumoniae, A. baumannii, S. caprae, S. sanguinis, S. oralis, S. gallolyticus, S. warneri, and B. cereus. Platelet sub‐aliquots were stored at 20‐24˚C with agitation. Samples were obtained daily for quantitative plate culture (in duplicate) during 5‐day storage. Depending on the organism, experiments were repeated 4‐6 times.
Results/Finding: S. aureus, S. epidermidis, E. coli, K. pneumoniae, S. sanguinis, S. oralis, S. gallolyticus, S. warneri, and B. cereus had similar growth kinetics in PAS‐3 and plasma (p>0.05). On Day 4, S epidermidis and S. gallolyticus had a trend (0.05<p<0.10) towards slightly greater or lesser growth, respectively, in plasma compared to PAS. A baumannii (days 1‐3) and S caprae (days 4,5) had significantly greater growth in PAS compared to plasma (p<0.05).
Conclusion: Nine of 11 organisms exhibited similar growth kinetics in platelets suspended in PAS compared to plasma. Two organisms displayed significantly faster early or late growth in PAS.
(BBC41)
| Organism | Platelet unit | log10(CFU/mL) | |||||
|---|---|---|---|---|---|---|---|
| Day 0 | Day 1 | Day 2 | Day 3 | Day 4 | Day 5 | ||
| A. baumannii | plasma | 1.5 ± 0.2 | 1.9 ± 0.03 | 3.5 ± 2.5 | 5.6 ± 2.7 | 5.6 ± 2.7 | 6.5 ± 2.6 |
| PAS | 1.5 ± 0.2 | 6.0 ± 0.7* | 8.1 ± 0.3* | 8.4 ± 0.3* | 8.6 ± 0.2 | 8.6 ± 0.2 | |
| S. caprae | Plasma | 1.7 ± 0.03 | 1.8 ± 0.1 | 1.9 ± 0.2 | 1.9 ± 0.1 | 2.1 ± 0.3 | 2.5 ± 0.8 |
| PAS | 1.7 ± 0.1 | 1.8 ± 0.01 | 2.1 ± 0.4 | 3.6 ± 1.8 | 4.9 ± 1.4* | 6.5 ± 1.4* | |
p<0.05
BBC42
Red Cell Alloantibody Evanescence in Blood Donors
Jessica S. Drouillard*1 and LeeAnn Walker2
1Heartland Blood Centers, 2University of Texas Medical Branch
Background/Case Studies: Many blood centers elect to discard products from donors with positive antibody screens and may assign permanent deferrals to avoid wastage associated with future positive donations. This study sought to examine differences in antibody persistence in blood donors based on antibody specificity and donor age or gender, and recommend a donor management strategy.
Study Design/Method: This study was a retrospective cohort study of 1133 repeat adult volunteer allogeneic blood donors with electronic donation histories at a large community blood center. Donor birthdate, gender, donation dates, antibody screen result, and antibody specificities were obtained via electronic query of donations occurring between January 1, 2000 and June 30, 2017. Antibodies were categorized as persistent, recurrent, or evanescent based on antibody screen result history. Mean time to antibody evanescence was calculated and group means were compared using a t‐test or ANOVA. A p‐value of less than 0.05 was considered a significant difference.
Results/Finding: There was no significant difference between the mean time to antibody evanescence when comparing donor gender, age, or number of antibody specificities. Donors over age 45 were significantly less likely to have evanescent antibodies compared to younger donors (p=0.023). Mean time to antibody evanescence was significantly longer for antibodies specific for Kell blood group system antigens compared to those directed against Rh, Kidd, Duffy and MNS blood group system antigens (p<0.01). Among donors with antibody evanescence, the mean time to evanescence was 748 days with a mean persistence of 322 days, suggesting the average donor antibody in the evanescent group became undetectable between 11 and 25 months following the initial positive donation. However, twenty percent of donors with positive antibody screens did not have a repeat positive donation. Donors with at least two positive donations had a mean time to evanescence of 1393 days.
Conclusion: The results of this study suggest younger donors are more likely to result a negative antibody screen on a subsequent donation compared to donors over 45 years old. The data suggest a possible initial deferral of 3 years for donors with two consecutive positive antibody screens, with a more aggressive deferral period for older donors or those with antibodies directed against antigens in the Kell system.
TABLE 1
| Evanescent | Recurrent/Persistent | Total (N) | |
|---|---|---|---|
| All | 347 (31%) | 786 (69%) | 1133 |
| Age | |||
| Under 45 | 163 (42%) | 226 (58%) | 389 |
| 45+ | 184 (25%) | 560 (75%) | 744 |
| Gender | |||
| Male | 79 (36%) | 143 (64%) | 222 |
| Female | 268 (29%) | 643 (71%) | 911 |
| Antibody System | |||
| Rh | 144 (26%) | 420 (74%) | 564 |
| Kell | 54 (24%) | 167 (76%) | 221 |
| Kidd | 9 (24%) | 28 (76%) | 37 |
| Duffy | 9 (17%) | 43 (83%) | 52 |
| MNS | 76 (63%) | 44 (37%) | 120 |
| Multiple | 6 (8%) | 69 (92%) | 75 |
BBC43
Performance of the UltraQual® Multiplex PCR Assay When Screening Pooled Source Plasma Donations
Jeffrey Albrecht*1, Francoise Gala1, Claire House1, Jur Jang1, Monica Byrd2 and Alice Stewart2
1National Genetics Institute, LabCorp Specialty Testing Group, 2Octapharma Plasma, Inc.
Background/Case Studies: Nucleic acid testing of pooled source plasma donations is a critical quality control step for ensuring manufactured product safety. A new nucleic acid test, the UltraQual® Multiplex PCR Assay (multiplex assay), was recently developed for simultaneously screening pooled source plasma donations for Hepatitis B Virus (HBV), Hepatitis C Virus (HCV), HIV‐1, and HIV‐2. Currently this new test is under review for licensure by the Food and Drug Administration (FDA).
Study Design/Method: Over a six‐month period, a total of 1,534,648 individual donations from 161,037 different donors from 54 donor centers were tested in 3,000 master pools containing up to 512 donations each. An FDA‐approved pooling and testing algorithm was used for pooling aliquots of individual plasma donations and subsequently identifying any positive donations. Plasma pools were tested in parallel with the multiplex assay and the individual, FDA‐approved UltraQual® HCV, UltraQual® HIV‐1, and UltraQual® HBV Assays. Clinical specificities and sensitivities of the multiplex assay and the FDA‐licensed assays were compared using McNemar's Test for matched pairs (p value).
Results/Finding: There were 1,534,341 donations confirmed negative for HCV, HIV‐1, HIV‐2, and HBV and 307 donations confirmed positive for at least one target virus. Both assays demonstrated clinical specificities of 100% when testing each target virus. Both the number of donations confirmed positive for a viral type and the calculated clinical sensitivities for both assay types are listed in the following table.
(BBC43)
| Virus | Confirmed Positive Donations | Multiplex Assay | FDA‐Licensed Assays | p value | ||
|---|---|---|---|---|---|---|
| Determined Positive | Clinical Sensitivity (95% Confidence Intervals) | Determined Positive | Clinical Sensitivity (95% Confidence Intervals) | |||
| HCV | 254 | 254 | 100.0% (98.6%‐100.0%) | 238 | 93.7% (90.0%‐96.4%) | 0.0002 |
| HIV‐1 | 30 | 30 | 100.0% (88.4% ‐ 100.0%) | 29 | 96.7% (82.8% ‐ 99.9%) | 1.00 |
| HIV‐2 | 0 | 0 | N/A* | N/A* | N/A* | N/A* |
| HBV | 21 | 15 | 71.4% (47.8% ‐ 88.7%) | 16 | 76.2% (52.8% ‐ 91.8%) | 1.00 |
| HBV and HIV‐1 | 2 | 2 | 100.0% | 2 | 100.0% | N/A |
| Total | 307 | |||||
Not applicable
Conclusion: The multiplex assay and the FDA‐licensed assays showed similar clinical sensitivities (with p values > 0.05) when detecting HIV‐1 and HBV. However, the two assay results were statistically different for HCV detection, indicating that the multiplex assay is superior to the FDA‐licensed UltraQual® Assay at detecting HCV RNA. The difference in the HCV results can be explained, at least in part, by the dramatically improved analytical sensitivity (1.72 IU/mL versus 6.61 IU/mL) of the multiplex assay. Overall the UltraQual® Multiplex PCR Assay has demonstrated equivalence or superiority (in the case of HCV) when compared to the FDA‐approved, individual UltraQual® HCV, HBV, and HIV‐1 Assays.
BBC44
Prevalence and 9 Years‐Incidence of HEV Infection in Italian Blood Donors: An Estimate of Transfusion Risk
Marta Spreafico*1, Livia Raffaele1, Irene Guarnori1, Barbara Foglieni1, Alessandra Berzuini1 and Daniele Prati2
1Department of Transfusion Medicine and Hematology, Ospedale Alessandro Manzoni, 2Immunohematology Reference Laboratory, Department of Transfusion Medicine and Hematology, Fondazione IRCCS Cà Granda Ospedale Maggiore Policlinico
Background/Case Studies: Hepatitis E virus (HEV) is a major cause of acute hepatitis worldwide, and a possible threat to transfusion safety. Data from Europe showed a variable prevalence of HEV IgG. The aim of this study was to assess the prevalence of anti‐HEV reactivity and HEV viremia in blood donors from our geographic area (Lombardy) and to evaluate, in a subgroup of donors, the incidence of infection over a 10 years follow up period. In addition, we used these data to estimate risk of transfusion transmission.
Study Design/Method: The study was conducted within BOTIA, an EU‐financed repository of donor‐recipient pairs. For the viremia study, nearly 10,000 samples were collected from anonymized donations in 2016. Samples were tested by individual‐donation nucleic acid test (ID‐NAT) for HEV RNA using the Procleix HEV assay (95% limit of detection 7.9 IU/mL). For the serology study, a subset of 2000 donations was tested for HEV IgG using DiaPro HEV ELISA kit (Diagnostic Bioprobes Srl, Milano, Italy). HEV IgG and IgM were analyzed in ID‐NAT positive samples at the time of donation and one year after the index donation. Furthermore, for the incidence study, 320 repeat donors for whom serial samples were available in the BOTIA biorepository was analyzed over a period of 8 to 10 years. The risk of receiving an infectious blood unit was estimated according to two different methods: the HEV RNA yield and the serological incidence data, assuming a duration of viremia of 30 days in seroconverting donors.
Results/Finding: Nine out of 9,726 donor samples showed HEV RNA reactivity. Of them, one sample was confirmed to be reactive in repeated TMA tests and showed IgM and IgG seroconversion, indicating a primary HEV infection. Thus, the HEV RNA prevalence was 0.01% (95% CI: 0‐0.06%). In the seroprevalence study, the proportion of confirmed anti‐HEV IgG reactivity was 148/2000 (7.4%, 95% CI: 6.3‐8.6). The incidence study (2007‐2017, median 9 years) showed that 2 of 289 donors anti‐HEV‐IgG negative at baseline seroconverted (0.69%). The incidence was 7.6/10,000 person‐years (95% CI: 2.1‐27,5). The estimate of transfusion risk using HEV RNA yield was 1 per 10,000 blood donations (upper bound of the 95% CI: 1:1,666); using the incidence data was of 1 per 16,666 blood donations; (95% CI: 1:4350 – 1:57,000).
Conclusion: Our results does not suggest hyperendemicity of HEV among the blood donors of our geographic area as compared to other European countries. The estimate of the transfusion risks gave coincident results using two independent approaches (HEV RNA yield and sero‐incidence in donors); the average risk is between 1 in 10,000 and 1 in 20,000 blood donations. This also suggests that the risk of acquiring (and therefore transmitting) the infection remained substantially stable over the past decade.
BBC45
Exploring the Potential Harm of Short‐Term Blood Storage on Patients Undergoing Cardiovascular Surgery
Shuoyan Ning*1, Yang Liu2, Na Li2, Rebecca Barty2, Jason P. Acker3,4, Richard J. Cook2,5, Michelle P. Zeller1,2,6, Donald M. Arnold1,2,6 and Nancy M. Heddle2
1Department of Medicine, Michael G. DeGroote School of Medicine, McMaster University, 2McMaster Centre for Transfusion Research, 3Centre for Innovation, Canadian Blood Services, 4Department of Laboratory Medicine and Pathology, University of Alberta, 5University of Waterloo, 6Canadian Blood Services
Background/Case Studies: The safety of long‐term blood storage has recently been affirmed through multiple randomized trials. However, questions around potential harms of short‐term stored red blood cells (RBC) have been raised. Cardiac surgery patients may be especially vulnerable to harm due to high rates of transfusion and the inflammatory state occurring with bypass. This study examined the association between in‐hospital mortality and exposure to short‐term stored RBCs in the cardiac surgery patient population.
Study Design/Method: Adult (≥18 years) in‐patients who received at least 1 RBC transfusion in the context of cardiac surgery from 2002‐2017 were identified in an academic centre. To assess the effect of short‐term RBC storage on in‐hospital mortality, Cox proportional hazards models were fitted. Patient exposure was defined as transfusions with RBCs of shortest storage duration and was analysed as: a continuous variable; by quartiles; by weeks of storage; and a 3 category model (1‐7days, 8‐35days, 36‐42 days). Reference group was exclusive exposure to RBCs stored for the longest duration for all models. Time‐dependent (hemoglobin, creatinine, platelet/plasma/cryoprecipitate transfusion, ABO identical RBC transfusions) and time‐independent covariates (age, sex, ABO blood group, admission year, comorbidities) were adjusted for in the analyses. All models met the Cox proportional hazards assumption.
Results/Finding: From 2002‐2017, 12,421 patients received 53,815 RBC transfusions. Median patient age was 71 (IQR 63‐78) and 38.6% of patients were female. Median number of RBC units transfused was 3 (IQR 2‐5), and median unit age was 20 days. Overall in‐hospital mortality was 5.4%. Hazard Ratio (HR) for the continuous analysis was 1.004 (95% CI 0.998‐1.019, p = 0.645) for every 1‐day decrease in blood storage. The model using weeks of storage showed no significant differences when the reference group (exclusive exposure to RBCs stored 36‐42 days) was compared to exposure to RBCs stored for 1, 2, 3, or 4 weeks (Table 1). Similar findings were obtained for all other models (data not shown).
Conclusion: In patients undergoing cardiac surgery, an association between in‐hospital mortality and exposure to short‐term stored RBCs was not found regardless of whether exposure was analysed as a continuous variable or by categories of storage duration.
TABLE 1 HR from Cox regression model where exposure (RBC with the shortest storage duration) was categorized by weeks of storage
| Exposure: Minimum storage duration | HR | 95% CI | P value |
|---|---|---|---|
| 1‐7 days vs reference group | 0.958 | 0.387, 2.371 | 0.926 |
| 8‐14 days vs reference group | 1.254 | 0.552, 2.850 | 0.589 |
| 15‐21 days vs reference group | 0.987 | 0.435, 2.240 | 0.975 |
| 22‐28 days vs reference group | 1.009 | 0.438, 2.324 | 0.984 |
| 29‐35 days vs reference group | 0.944 | 0.400, 2.227 | 0.896 |
Reference group was exclusive exposure to RBCs stored for 36‐42 days
BBC46
In Vitro Function of Amotosalen/UVA Treated Platelets in PAS‐3 Using Triple Storage Processing Set
Danielle Badgley1, Cheryl Heber1, Jeanne Cunningham1, Lisa Minogue1, Amanda Timson1, Hermelinda Evans2, Anna Erickson2 and Fatbardha Varfaj*2
1Fresenius‐Kabi USA, LLC, 2Cerus Corporation
Background/Case Studies: The INTERCEPT Blood System for Platelets Triple Storage (TS) processing set is CE mark approved for pathogen reduction of platelets in platelet additive solution (PAS), and is not currently FDA approved. The system utilizes amotosalen, with UVA light to inactivate pathogens and leukocytes. This study evaluated in vitro function of INTERCEPT PCs prepared using the TS set and over 7 days of storage.
Study Design/Method: Amicus apheresis PCs were collected in PAS‐3 (65% PAS‐3/35% plasma). Inputs from 3 triple‐dose collections and 3 pools from two ABO‐matched collections containing doses of 9.1‐9.8x10¹¹ platelets with counts of 1.5‐1.6x10⁹/mL in 611‐ 628 mL, were treated using the INTERCEPT TS set (Test). Untreated Control triple dose collections had doses of 10.3‐10.5x10¹¹ with counts of 1.5‐1.6x10⁹/mL in 573‐625 mL. All PCs were stored at 22‐24°C up to 7 days and assessed for in vitro physical/metabolic characteristics on Days 5 and 7.
Results/Finding: Following treatment, the platelet dose recovery was ≥87% (91 ± 3%) and PCs contained doses of ≥4.1 (4.4 ± 0.2) × 1011 per component. All treated PCs met the FDA requirements of pH≥6.2 at Days 5 and 7. in vitro platelet quality at Days 5 and 7 post‐donation was comparable to unpaired untreated Control PCs (Table 1).
Conclusion: Triple‐dose and pooled Amicus PCs in PAS‐3 treated with the INTERCEPT TS set and stored up to 7 days retained in vitro metabolic and functional properties consistent with ranges for untreated Control PC and in vivo functionality.
TABLE 1 (BBC46) In Vitro Function of INTERCEPT treated PCs (Test) using TSa set and Untreated (Control) in PAS‐3 at Days 5 and 7 (Mean ± SD)
| Platelet Parameter | Day 5 | Day 7 | ||
|---|---|---|---|---|
| Test (n=6) | Control (n=3) | Test (n=6) | Control (n=3) | |
| Platelet Dose (×1011/component) |
4.2 ± 0.2c |
3.5 ± 0.1d |
4.1 ± 0.3c | 3.5 ± 0.1d |
| Platelet Count (×109/mL) | 1.5 ± 0.1c | 1.8 ± 0.2d | 1.5 ± 0.1c | 1.7 ± 0.1d |
| MPV (fL) | 8.2 ± 0.2c | 7.9 ± 0.2d | 8.3 ± 0.2c | 7.9 ± 0.3d |
| pH (22°C) | 7.1 ± 0.1c | 7.1 ± 0.0d | 7.1 ± 0.1c | 7.3 ± 0.0d |
| Supernatant Glucose (mmol/1012 platelets) | 1.1 ± 1.4 | 0.0 ± 0.0 | 0.4 ± 1.0 | 0.0 ± 0.0 |
| Supernatant Lactate (mmol/1012 platelets) | 9 ± 4 | 13 ± 5 | 11 ± 4 | 14 ± 5 |
| Total ATP (nmol/108 platelets) | 3.3 ± 0.4 | 2.6 ± 0.3 | 3.0 ± 1.4 | 2.6 ± 0.5 |
| Morphology Score | 276 ± 10 | 248 ± 35 | 252 ± 14 | 224 ± 21 |
| Extent of Shape Change (%) | 17 ± 1 | 15 ± 1 | 15 ± 1 | 11 ± 4 |
| Hypotonic Shock Response (%) | 59 ± 8 | 51 ± 7 | 53 ± 8 | 37 ± 11 |
| Supernatant LDH activity (IU/1012 platelets) | 114 ± 28 | 112 ± 12 | 122 ± 24 | 140 ± 28 |
| P‐selectin (CD62P, % expression) | 38 ± 4 | 33 ± 12 | 39 ± 3 | 33 ± 15 |
INTERCEPT TS processing set is not currently FDA approved
Platelet dose after treatment (Day 2)
n=12, measured per component
n=9, measured per component
BBC47
Seasonal Peak with the Hepatitis B Core Antibody Donor Screening Test
Nancy L. Van Buren*, Jed B. Gorlin, Vanessa Reynolds, Mark Janzen and Deborah Anderson
Innovative Blood Resources
Background/Case Studies: Our blood center has observed a seasonal increase in the hepatitis B core antibody (anti‐HBc) repeat reactive rates (RR) using the Ortho enzyme‐linked immunosorbant assay (ELISA) platform during fall and early winter months. During 2017, this increase was especially marked. The etiology of higher seasonal rates is unclear; however, interfering cross‐reactive antibodies following influenza vaccination have been previously implicated.
Study Design/Method: The RR for anti‐HBc and other blood donor screening ELISA assays were analyzed for the past three years (2015‐2017). We compared the RR for our blood center (BC), as well as all blood centers (ABCs) for whom we perform testing (10 total). We assessed the reactive rates for the other required hepatitis markers used for blood donor screening, including hepatitis B surface antigen (HBsAg) and the nucleic acid test for hepatitis B virus DNA (NAT‐HBV). We also reviewed donor records for reported vaccinations within the past 8 weeks for all blood donors, as well as those with reactive anti‐HBc results.
Results/Finding: Seasonal increases in the anti‐HBc RR were observed during the study period for ABCs. This increase was observed only with the anti‐HBc assay and not with the other blood donor screening tests. The seasonal increase in the reactive rate was only observed with the anti‐HBc assay and not the other ELISA tests. The RR of the other HBV donor screening tests (HBsAg and NAT‐HBV) did not increase compared to the annual average in 2017 for ABCs (0.042% and 0.004%), respectively. During 2017, the RR for anti‐HBc between the months of February and August averaged 0.14% for our BC and 0.21% for ABCs. During 2017, anti‐HBc RR peaked in October and November for our BC at 0.77 and 0.68%, respectively, compared to 0.70 and 0.80% for ABCs. In comparison, the peaks for anti‐HBc RR for ABCs were 0.46 and 0.61% in Oct and Nov 2016, and 0.34 and 0.40% in Oct and Nov 2015. The donor record review in 2017 during a selected period (Nov 20‐Dec 28) revealed 53% of donors with reactive anti‐HBc results reported a vaccination within the previous eight weeks, compared to 20% of all blood donors during the same time frame. Of those, the majority were influenza virus vaccinations.
Conclusion: We document a seasonal increase in the RR of the Ortho anti‐HBc assay used for blood donor screening during the fall and early winter months, which showed an exaggerated increase during 2017. While the cause of this phenomenon is unclear, the possibility that some donors develop antibodies after vaccination that cross‐react with this assay cannot be excluded. This has resulted in a significant loss of blood donors, most of whom are presumed to be non‐infectious for hepatitis B. Increased RR were not observed in the other hepatitis B markers used for donor screening. While the FDA allows a re‐entry process for donors that have had repeat reactive tests on two separate occasions, this assay‐specific problem has resulted in an excessive number of deferred blood donors. In the advent of NAT testing for hepatitis B, a larger question to address is whether this screening test increases the safety of our blood supply.
BBC48
Hepatitis A in Blood Donors before and during Hepatitis A Outbreaks, France 2015‐2017
Pierre Gallian1, Valerie Barlet2, Lina Mouna3, Sylvie Gross2, Elodie Pouchol2, Cecile Fabra2, Sophie Le Cam2, Celine Ricard2, Wind Françoise2, Catherine Visse4, Benoit Flan4, Rachid Djoudi2, Elisabeth Couturier5, Henriette De Valk5, Pierre Tiberghien*2 and Anne‐Marie Roque Afonso3
1EFS Alpes‐Méditerranée, UMR D190 Emergence des pathologies Virales, 2Etablissement Français du Sang, 3AP‐HP, Hôpital Paul Brousse, Virologie, CNR des Virus des hépatites à transmission entérique, INSERM U1993, 4LFB, 5Santé Publique France
Background/Case Studies: Since mid‐2016, hepatitis A virus (HAV) outbreaks, involving predominantly men having sex with men (MSM), have affected most European countries. In mainland France, the number of reported cases increased from 701 and 666 in 2015 and 2016, respectively, to over 2980 during the first 10 months of 2017 with a frequency peak in July 2017. A significant number of cases appeared associated with MSM activity as deduced from an 80% proportion of males among notified cases and the detection of MSM‐associated outbreak strains in > 90% of analyzed cases.
Study Design/Method: We report HAV incidence in blood donors, HAV risk factors, viral load and genotypes, involved blood products and recipient outcome before (2015 and 2016) and during the 2017 HAV outbreaks in France. Hepatitis A virus NAT screening is a requirement for donations contributing to plasma‐derived medicinal products. Performed by EFS on behalf of the LFB, HAV testing is carried out using the Procleix HAV/B19 assay (Tigris System automation‐Grifols) on all blood donations. Viral load in individual samples was assessed with the RealStar® HAV RT‐PCR Kit (Altona Diagnostics) with serial dilutions of the WHO International Standard for HAV RNA NAT assays as quantification curve. A 508 base‐pair fragment encompassing the VP1/2A junction was amplified and sequenced for strain characterization.
Results/Finding: Hepatitis A virus RNA prevalence of blood donations was ∼5 fold higher in 2017 than in 2015‐2016 period (4,4/10E6 vs 0,85/10E6, p=0.0005). Frequency peaked at 9.4 /10E6 donations in April‐July 2017, at a time when the number of cases in general population was still increasing. Thirteen HAV‐infected donors were detected in 2017 (vs 2 in 2015 and 3 in 2016). All 18 donors were confirmed asymptomatic at time of blood donation. Genotype IA MSM outbreak‐associated strains were identified in 12 of the 13 cases detected in 2017. Viral loads in HAV positive donors (2015 to 2017) ranged from 1.2 to 8.59 log10 IU/mL and did not differ significantly between 2015‐2016 and 2017. Despite a higher male to female ratio (5,5 vs 0,7 before 2017) and the identification of MSM‐associated outbreak strains, only 1/11 infected male donors in 2017 self‐reported as MSM. Other HAV risk factors (food or professional exposure mainly) were identified in 6 (5 males, 1 female) of the 12 evaluable donors in 2017 while no risk factors were identified for the remaining 5 donors (4 males, 1 female). Similar food or professional exposure risk factors were identified in 4 of the 5 blood donors identified in 2015 and 2016 (while none was found for the last case).
Involved red blood cell concentrates were destroyed (n=9) if not already transfused (n=3). Platelet concentrates (n=9) were transfused before results were made available. All collected plasma were destroyed (n=17).
Haemovigilance enquiry of HAV‐RNA positive blood transfusions (n=12) revealed one case of transfusion‐transmitted hepatitis A in 2017, confirmed by molecular comparison of donor and recipient viral strains.
Conclusion: To our knowledge, this study is the first to estimate the risk of collecting HAV‐infected blood donations during hepatitis A outbreaks. During the 2017 HAV outbreak in France, the risk of collecting asymptomatic blood donors was increased while remaining a rare event. Nevertheless, at least one transfusion‐transmitted hepatitis A occurred.
BBC49
An Example of Prozone Using Solid Phase Platelet Crossmatch Technique
Cami Melland*, Connie Hintz and Samantha Mack
Blood Systems Mountain Division
Background/Case Studies: Platelet crossmatch solid phase testing is utilized when a patient demonstrates platelet refractoriness. The methodology detects incompatibility between patient plasma and donor platelets due to the presence of platelet, human leukocyte antigen (HLA) and/or ABO antibodies. Platelet crossmatch technique should show compatibility with platelets lacking the antigen to which the patient has antibodies. This case demonstrates patient antibodies not detected by platelet crossmatch testing.
Study Design/Method: The regional Immunohematology Reference Lab (IRL) received the patient sample request for platelet crossmatch and obtained 100% compatibility. The patient sample was also sent out for panel reactive antibodies (PRA) to detect HLA antibodies. PRA results are reported using the mean fluorescence intensity (MFI) and while the result is not equal to a quantitative titer result, it is semi‐quantitative. The PRA results showed 97% reactivity and MFI results up to approximately 17,000 which should have caused incompatible platelet crossmatch test results.
Six of the platelets crossmatched had HLA types and were positive for an antigen to which the patient had an HLA antibody. Therefore, the platelets should have been incompatible. Given the high PRA MFI, the platelet crossmatch results were repeated using plasma diluted 1:2 and 1:3 to explore if prozone phenomena could be observed.
Results/Finding: Platelet crossmatch results using plasma diluted 1:2 yielded reactivity with 3 of 10 platelets. One of the incompatible platelets was positive for B58 and B62 and the patient MFI for those antigens was approximately 2,500 and 11,000 respectively. A second incompatible platelet was positive for B27 and B50 and the MFI was approximately 6,000 and 16,000 respectively.
Platelet crossmatch results using plasma diluted 1:3 yielded reactivity with one more platelet (4 of 10). The incompatible platelet resulting from the additional dilution was positive for the B49 antigen. The patient B49 antibody MFI was approximately 17,500.
Three of the compatible platelets using the plasma diluted 1:3 diluted were positive for the A2 antigen, two were positive for the B44 antigen and one was positive for the B60 antigen. The antibody MFI results to these antibodies were approximately 2000, 10,000 and 11,000 respectively showing that some antibodies were not detected with normal or diluted plasma regardless of the MFI.
Conclusion: In this example, platelet crossmatch using solid phase methodology showed both low sensitivity and prozone effect.
BBC50
Evaluating Strategies to Reduce Risk of an HIV‐Infected Blood Supply
Chana A. Sacks*1, Robert H. Goldstein2 and Rochelle P. Walensky2
1Division of General Internal Medicine, Department of Medicine, Massachusetts General Hospital, 2Division of Infectious Diseases, Department of Medicine, Massachusetts General Hospital
Background/Case Studies: Due to risk of HIV transmission, the Food and Drug Administration recommends a ban on blood donation from men who have sex with men (MSM). Revised in 2015, the current donation restriction is limited to men who have had sex with a man in the past year. In light of advances in HIV screening, this ban may not represent the optimal strategy for ensuring a safe blood supply.
Study Design/Method: Using a decision tree, we compared 3 strategies to screen the blood supply and its donors: 1) the current standard: a deferral for MSM followed by 4th generation HIV Ab/Ag and viral load (VL) testing of all donated units; 2) test‐only: no deferral, with 4th generation Ab/Ag and VL testing of all donated units; 3) risk‐based: deferral for all male donors who have had condomless anal intercourse in the past month, followed by 4th generation Ab/Ag and VL testing of all donated units. The primary outcome was the expected number of accepted HIV + donations per million units of donated blood. Key model input parameters include MSM prevalence (3.6%), HIV testing sensitivity for chronic (99.6%) and acute (75.0%) infection, and false negative rate of both the current MSM deferral question and the risk‐based screening question (2.6% for each). In sensitivity analyses, we assessed the impact of variation in these parameters.
Results/Finding: In the base case, the current strategy resulted in 4.90 HIV + accepted blood donations per million; the testing only strategy resulted in 6.28 HIV + accepted blood donations per million; and the risk‐based strategy resulted in the lowest risk, with 4.05 HIV + accepted blood donations per million. In sensitivity analyses, the risk‐based strategy was superior across plausible ranges of HIV test sensitivity, for both acute and chronic HIV infection. The risk‐based strategy remained superior as long as MSM prevalence is less than 6.7%; at higher MSM prevalence, the current strategy was superior. The effectiveness of the screening questions (i.e. the false negative rate for both the current MSM deferral question and the risk‐based screening question) contributed the most uncertainty to the model. Compared with the current standard, a risk‐based strategy could add 5 million low‐risk MSM to the potential donor supply.
Conclusion: A risk‐based screening question, combined with universal 4th generation HIV Ab/Ag and viral load testing, may be more effective than the current strategy that includes a 12‐month deferral on donations from MSM. The quality and ability of screening questions to accurately assess risk is key to any pre‐donation screening strategy.
BBC51
The Effect of Special Iron Information for Teenage Donors on Deferral Rates and Recruitment Success
Rebecca Haley*, Jessica Lantz, Kimberley Cotten, James AuBuchon and YanYun Wu
Bloodworks Northwest
Background/Case Studies: Blood donors are invited to begin their donation career during the last half of their teen years. The hoped for effect is that the young donors will absorb a sense of responsibility for the community blood supply. Recent donor studies have pointed out that the young donors may need additional information and encouragement to protect their iron stores. Teen donors tend to have less stored iron than older donors. Our blood center wished to supply information to these donors to help them become aware of this and maintain their iron stores. The questions raised in this sharing of information were: 1) Will the iron physiology information encourage or discourage donation, and 2) Will the percentage of donors with qualifying hematocrits be affected?
Study Design/Method: Age appropriate materials explaining the importance of maintaining a healthy stored iron balance in their bodies were developed for the teenagers for the school year of 2017‐18 (FY 18). Printed materials described the body's need for iron, the possible effects of blood donation on iron stores and suggested steps to maintain iron balance. Materials were sent to each high school where blood drives were planned, and also sent to the homes of potential donors addresses to the donor's parents along with information about the blood drive and a consent form to be signed where consent was required. A special letter was sent to the parents in this package explaining the importance of iron nutrition for teenagers and their nutritional needs. Iron supplements were offered at nearby collection centers if donors with consent wished to pick them up. The older teenagers did not require letters to their parents and only saw the iron information on the day of donation. The iron information was distributed again to all donors at the time of the blood drive. The numbers of donors presenting and the number qualifying by hematocrit from the first 6 months of the school year, September – February, FY 18 were compared with the same time in the previous year, FY 17.
Results/Finding:
| FY 17 | F | % Qualified | M | % Qualified | Total No | Total % 92.0 |
|---|---|---|---|---|---|---|
| 16‐17 YO | 4377 | 87.2 | 3141 | 99.8 | 7518 | 92.4 |
| 18‐19 YO | 2496 | 85.7 | 1803 | 99.2 | 4299 | 91.3 |
| FY 18 | Total % 93.6 | |||||
| 16‐17 YO | 5101 | 90.5 | 3258 | 99.7 | 8359 | 94.1 |
| 18‐19 YO | 2543 | 87.9 | 1695 | 99.5 | 4238 | 92.5 |
Conclusion: More female than male donors volunteer for blood donation in the young donors evaluated in these young donor groups. Provision of information on the importance of iron physiology and the need for adequate iron stores and other donor promotion encouragement gave a 6.6% increase in donors volunteering in this time period of fiscal year FY 18 over FY 17. The explanation of the possible deleterious effects of blood donation and suggestions on how to mitigate those effects appeared to increase, and not decrease younger donor participation. The older group's gains in qualification were more modest. The numbers of 16‐17 YO female donors increased 16.5%, while qualifying female donors in the group increased 3.3%over the previous year's same age group. Provision of iron nutritional information to teenagers and their parents was associated with increased numbers of young donors volunteering. More of the donors presenting also qualified for donation. This improvement was greatest in 16 – 17 YO female donors.
BBC52
Safety Analysis of Long‐Term Moderate Intensity Plasmapheresis Donation in Australia
James Thyer*, Barbara Bell and Stephen Wright
Australian Red Cross Blood Service
Background/Case Studies: Australia is facing an increasing demand for plasma‐derived intravenous immunoglobulin, necessitating not only the recruitment of whole blood donors to plasma donation, but also to increasing donation frequency within the regulated limit of 26 plasma donations per year. The Australian Red Cross Blood Service database contains comprehensive donor demographic, donation and testing results from 2007 to the present. All first‐time plasma donors require total protein (TP), albumin, IgG, IgM and IgA testing; all donors undergo subsequent annual measurement of TP, albumin, IgG and haematological markers. We used these data to evaluate the impact of plasmapheresis at different intensities on donor health using biochemical and haematological markers, and donor deferral information.
Study Design/Method: Records were extracted for all donors who had made a plasma donation between January 2007 and end December 2016. Records were retrieved for 328,896 donors, who had made at least one plasma donation over 10 years. The effect of prior mixed donation count and donor age on IgG, IgA and IgM at the first electronically captured donor review was examined. Approximately 6 million donation records were collected, with analysis of yearly measurement of IgG, TP, albumin and haemoglobin, platelet and differential white cell count. Reasons for permanent deferral in the plasma donation panel are discussed.
Results/Finding: Increasing donor age and increasing number of previous donations were associated with a small decrease in mean IgG and TP levels, however no effect was observed on IgA, IgM or albumin levels for first‐time plasma donors. Over the ten‐year period, donors showed a small decline in mean IgG levels of 5.7%. The highest donation frequency was associated with mean IgG levels 10.0% lower than for donors with the lowest donation frequency. These effects were greater in females than males. Changes in both albumin and TP were minimal and were not affected by higher donation frequency. Plasma donation had no effect on platelets, lymphocytes, neutrophils or eosinophils, regardless of donation frequency or donation mix. Haemoglobin levels increased slightly with time and plasma donation frequency. The most common reason for permanent deferral of plasma donors was for cardiovascular reasons (32%) at mean age 58.3 years, range 20‐80, followed by donor reactions (28%) at mean age 46.7 years, range 18‐80, and non‐malignant clonal disorders (13%) at mean age 54.3 years, range 20‐79.
Conclusion: Review of routine annual biochemical and haematological data from plasma donors, suggests that long‐term plasmapheresis up to 26 times per year is safe for donors.
BBC53
Enhanced Detection of Very Low Viral Loads Using Replicate Testing on a Fully Automated Nucleic Acid Amplification System
Sonia Bakkour*1, Mars Stone1, Xutao Deng1, Scott Hauenstein2, Andrew Worlock2, Kui Gao3, Jeffrey M. Linnen3 and Michael P. Busch1
1Blood Systems Research Institute, 2Hologic Incorporated, 3Grifols Diagnostic Solutions Inc.
Background/Case Studies: The Panther system is a fully automated platform for nucleic acid amplification testing, used in blood screening (Grifols) and diagnostics (Hologic). The assays (e.g. for HIV, HCV, HBV, ZIKV) are typically performed on plasma, with a 0.5 mL volume assayed, and 95% limit of detection (LOD) is as low as 4 IU/mL. In cases where viral load in plasma and blood compartments is expected to be very low and adequate sample volume is available, we sought to determine whether testing of multiple 0.5 mL replicates (reps), which the system can be programmed to perform automatically using 5 mL input samples, could further enhance sensitivity of detection.
Study Design/Method: As a proof of concept that replicate testing could detect very low viral loads, we used 1) the Aptima HIV‐1 Quant Assay to test plasma from elite controller (antibody‐positive, NAT‐negative) blood donors and ART‐suppressed HIV‐infected individuals, and 2) the Aptima or Procleix Zika Virus assay to test EDTA plasma and lysed whole blood (WB) from ZIKV‐infected blood donors followed longitudinally up to 1 year after index donation. HIV samples (10 or 25 mL each) were tested in 18 or 45 reps, and ZIKV plasma (5 mL each) or lysed WB (4 mL each) samples were tested in 8 or 2 reps, respectively.
Results/Finding: Based on statistical modelling of analytical dilution series testing of HIV NAT yield plasma samples, the LOD of replicate Panther testing can be reduced to 0.38 c/mL (95% CI 0.003 – 1.95) with 9 reps (5 mL), to 0.18 c/mL (95% CI 0.003 – 0.93) with 18 reps (10 mL) and to 0.07 c/mL (95% CI 0.003 – 0.35) with 45 reps (25 mL). Plasma from 26 HIV elite controllers (ECs) had detectable HIV in 24/26 (92%) individuals, with a median of 7.5/18 reps detected. Plasma collected from 50 ART‐suppressed HIV‐infected individuals with consistently negative standard VL assay results had detectable HIV in 45/50 (90%) individuals at study entry using the replicate testing approach, with a median of 7/45 reps detected. Plasma from 53 ZIKV‐infected blood donors had detectable ZIKV in 29/53 (55%) individuals at study entry (median of 9 days post‐index donation) using the replicate testing approach, with a median of 1/8 reps detected. Lysed WB was available from 47 of these blood donors at study entry, where ZIKV was detectable in 41/47 (87%) individuals, with a median of 2/2 reps detected.
Conclusion: Replicate testing is easily performed on the Panther platform and provides substantially lower LODs and enhanced detection of very low level viral RNA in samples from blood donors and clinical cases. These findings document HIV RNA in a high proportion of ECs and ART‐suppressed patients, and extended detection of ZIKV RNA in plasma and WB from ZIKV infected donors.
BBC54
GPIbα Shedding Is a Consequence of Damage to Cryopreserved Platelets, Not a Cause
Katrijn R. Six*1,2, Rosalie Devloo1 and Hendrik B. Feys1,2
1Belgian Red Cross‐Flanders, 2Ghent University
Background/Case Studies: Cryopreservation of platelet concentrates is under consideration as an alternative storage method to assure patient care in circumstances where liquid preservation is impossible. However, cryopreservation significantly damages platelets, including significant GPIbα ectodomain shedding. It is not clear if inhibition of GPIbα shedding is a cause or a consequence of the cryopreservation‐induced damage.
Study Design/Method: Non‐cryopreserved control platelets were compared to paired cryopreserved platelets (n=6) either with or without 10 µM of marimastat, a broad spectrum sheddase inhibitor. GPIbα shedding was monitored by flow cytometry and by western blotting of the GPIbα ectodomain (glycocalicin) in cell‐free supernatant. Platelet function was investigated by ristocetin agglutination (1.25 mg/mL) and by platelet adhesion to immobilized collagen in microfluidic flow chambers at a shear rate of 1000 s‐1.
Results/Finding: Cryopreservation without marimastat caused a significant decrease of GPIbα expression in flow cytometry (1.0 × 10⁵ MFI (median fluorescence intensity)) compared to 1.8 × 10⁵ for non‐cryopreserved controls (P = 0.02). As expected, marimastat efficiently conserved GPIbα expression after cryopreservation (MFI 1.8 × 10⁵). In comparison to controls, the glycocalicin signal was increased 2.3‐fold in cryopreserved platelets without marimastat, while remained stable at 1.1‐fold in the presence of marimastat. These data indicate that marimastat is an efficient inhibitor of GPIbα shedding during cryopreservation. However, marimastat could not improve platelet agglutination after cryopreservation since no significant difference in agglutination amplitude is found with (29%) or without (32%) including marimastat (P = 0.40). In addition, adhesion of cryopreserved platelets to collagen under flow was significantly lower compared to non‐cryopreserved controls (P = 0.05) irrespective of marimastat addition (P = 0.84).
Conclusion: We conclude that GPIbα shedding is a consequence of platelet cryopreservation and that inhibition of GPIbα shedding cannot improve cryoplatelet function in agglutination and adhesion experiments.
BBC55
Suspected Hypotensive Reactions to Salvaged Blood Reinfusion: The Potential Role of Papaverine
Chelsea Conn*, Pamela M. Johnson, Camille Van Buskirk and Paula Santrach
Mayo Clinic
Background/Case Studies: A sudden precipitous drop in patient blood pressure after infusion of a salvaged blood unit is a defining symptom of a suspected hypotensive reaction. In coronary artery bypass graft surgeries, papaverine is often used to prepare the internal mammary artery in which it acts as a vasodilator. When papaverine enters a cell salvage reservoir, it may not be completely washed off by the cell salvage device and be present in the final product. This type of occurrence is considered a contraindication and may cause problems for the patient if reinfused. In early 2016, the Autotransfusion (AT) team investigated a series of hypotensive reactions that occurred during the reinfusion of salvaged blood in all cases performed.
Study Design/Method: From January – April 2016, eight suspected salvaged blood reactions were investigated per established procedure due to a drop in patient blood pressure. Of the eight reactions, five were coronary artery bypass graft surgeries (CABG). For all of the suspected reaction workups in this study, the following testing was performed on the implicated salvaged blood units: hematocrit (hct), plasma/low hemoglobin (pl/hb), blood culture and residual papaverine (pap) testing. Four of the eight cases did not involve the use of papaverine (controls).
Results/Finding: In all but one case, the first reinfused unit was implicated in a suspected hypotensive reaction. All cases met acceptable workup criteria for hct (≥40.0%) and culture (negative). All cases but one met acceptable criteria for pl/hb (<400 mg/dL). Cases 1 – 5 were all CABG while the remaining three cases consisted of two other cardiac surgeries and one orthopedic surgery (See table 1).
TABLE 1 (BBC55)
| Case | Units tested | Hct % | Pl/Hb mg/dL | Culture | Papaverine used mg/mL | Residual Papaverine ng/mL (mg/mL) |
|---|---|---|---|---|---|---|
| 1 | 1st | 59.1 | 150 | Negative | 66 mg | 549.59 (0.00054959) |
| 2 | 1st | 57.9 | 80 | Negative | 243 mg | 523.66 (0.00052366) |
| 3 | 1st | 63.7 | 240 | Negative | 99 mg | 56.28 (0.00005628) |
| 4 | 1st | 58.6 | 180 | Negative | 318 mg | 134.28 (0.00013428) |
| 5 | 3rd | 60.3 | 370 | Negative | 0 mg | <25 |
| 6 | 1st | 61.1 | 720 | Negative | 0 mg | <25 |
| 7 | 1st | 52.5 | 360 | Negative | 0 mg | <25 |
| 8 | 1st | 57.6 | 130 | Negative | 0 mg | <25 |
Conclusion: In the cases where papaverine was used at the surgical field, there was residual papaverine detected in the final implicated salvaged RBC unit(s). Faulty cell salvage equipment was ruled out as a cause for all suspected reactions. As a result of this study, residual papaverine testing is performed on suspected salvaged unit(s) reactions when the drug is utilized during the surgical case.
BBC56
Checking Prior Antibody History Associated with Rare Blood Requests
Deborah R. Fludd*1, Ernest M. Ekema2, Joan L. Maurer3, Dexter Facey1, Margaret A. Keller4 and Sandra J. Nance5
1American Rare Donor Program and American Red Cross, 2American Red Cross, 3ARDP, 4American Red Cross ‐ National Molecular Laboratory, 5American Red Cross and American Rare Donor Program
Background/Case Studies: Requests for rare blood are made to the American Rare Donor Program (ARDP) on a continuous basis. Reports are checked for completeness and accuracy before being processed. Beginning in October 2017, the staff began checking the prior antibody histories of all returning patients whom rare units were being requested. There were 283 such requests that have been reviewed with previous request information.
Study Design/Method: The phenotype of the current rare unit request was compared to all prior requests made for that patient. Changes in phenotypes were noted and facilities were contacted to determine if a change was due to differences or changes in antibody status.
Results/Finding: Of the 283 record requests for rare blood reviewed, 21 involved different patients whose prior histories showed a change in the requested RBC phenotype from the previous request. The changes included 43 additional antigens being requested and 20 antigens being dropped from those that were previously requested. The requesting facilities that had requested units for the same patient more than once were contacted and asked for information about the variation of the requests. One facility had a total of 49 different requests for the same patient. The 3 most common reasons provided were: requests were based on present serologic testing (13), request adjusted based on molecular testing performed since prior request (2), and/or, the patient was previously seen at another hospital (2). The most common reasons provided for requesting units lacking one or more additional antigens were due to new antibodies being identified (13) and antibodies not demonstrating previously (6). Some reasons stated for missing antigens on subsequent requests were: low prevalence antigen(s) needed could be avoided with units from Caucasian donors (1), the antigen testing for the antigens would be performed at the requesting facility (3) or, the antibodies to the antigens were not detected in the current sample. (3).
Conclusion: Without a national antibody registry, with patients being seen at multiple health care facilities, and with the knowledge that antibodies to RBC antigens evanesce, it is important to evaluate if requests for rare blood for alloimmunized patients are optimally capturing complete antibody status. In 6 months, 283 requests for rare blood were reviewed against prior requests and 21 (7.4%) of those showed differences in the antigen phenotypes requested for the same patient. Of those, 8 were a specificity generally thought to be potentially clinically significant [K, Jka, E, Cw, V, Jsa, He, Fyb]. In 4 cases (19%) subsequent requests had additional antigen negative specificities suggesting that those patients could have been alloimmunized by subsequent transfusions. This work highlights the importance of an up‐to‐date antibody status of alloimmunized patients and of sharing this information between healthcare facilities and donor centers. The ARDP is in a unique position to evaluate changes in antigen negative RBC requests over time.
BBC57
Multicenter Clinical Evaluation of a Babesia Transcription‐Mediated Amplification Assay on a Fully Automated System
Vanessa Bres*1, Susan L. Stramer2, Phillip C. Williamson3, Carolyn Young4, Jill Alberigo4, Rita A. Reik5, Samara Diner1, William Schneider1, Laura Tonnetti2, Sonia Bakkour6, Michael P. Busch6 and Jeffrey M. Linnen1
1Grifols Diagnostic Solutions Inc., 2American Red Cross, 3Creative Testing Solutions, 4Rhode Island Blood Center, 5OneBlood, Inc., 6Blood Systems Research Institute
Background/Case Studies: The Procleix® Babesia assay on the Procleix Panther® system is a qualitative in vitro nucleic acid test currently used under an investigational new drug (IND) protocol. The assay, which is based on Transcription‐Mediated Amplification (TMA), is designed to detect four clinically relevant Babesia species (B. microti, B. divergens, B. duncani, and B. venatorum) in human whole blood specimens. The investigational test is intended to screen blood donations individually and in pools of up to 16 donations (16‐lysate pool). Whole blood samples are lysed and pooled on the automated Procleix Xpress® system (Investigational Use Only) before testing on the Procleix Panther system. We report here the results of a multicenter study that evaluated the clinical performance of the Procleix Babesia assay on the Procleix Panther system.
Study Design/Method: Reproducibility, sensitivity, and specificity of the assay were evaluated at 4 clinical sites using at least 3 reagent lots. Reproducibility was assayed by testing 1 negative and 4 positive panels members. Clinical sensitivity was determined by testing B. microti (n=80), B. duncani (n=10), B. divergens (n=10), and B. venatorum (n=10) known‐positive whole blood specimens and/or cultured erythrocytes lysed, tested neat and diluted 1:16. Clinical specificity was determined by screening 11,067 individual donations (concurrent screening of individual donor lysates [IDLs] and 16‐lysate pools) and 11,052 16‐lysate pools for a total of 176,832 screened donations between June 2017 and February 2018. Initially reactive donations were re‐tested by TMA, and confirmed with PCR, IgG immunofluorescence assay (IFA) and/or follow‐up testing.
Results/Finding: High reproducibility was demonstrated: within‐run coefficient of variation values ranged from 3.64 to 21.16% for the analyte signal to cut‐off (S/CO) values of the positive panels members and was 3.77% for the internal control S/CO values of the negative members. Clinical sensitivity was 100% in both neat and diluted (1:16) known‐positive samples. Specificity was 100% (95% CI: 99.998 – 100). Sixty‐one confirmed positive donations were identified by TMA, with 35 reactive by PCR and 59 by IFA. Two window period cases (i.e., NAT Positive / IFA Negative) were identified; one case from New York was confirmed by follow‐up testing and the other from Florida, a lower risk state, was confirmed at index by PCR. All repeat reactive IDLs were found reactive in 16‐lysate pools.
Conclusion: The Procleix Babesia assay on the Procleix Panther system demonstrated high clinical specificity, sensitivity, and reproducibility. The detection of all repeat reactive IDLs in 16‐lysate pools showed the effectiveness of pooled lysate to screen blood donations.
Note: funding was provided by Grifols to conduct clinical studies
BBC58
Platelet Crossmatching Using Pathogen Reduced vs. Non‐Pathogen Reduced Single Donor Platelets
Kim Greco*, Johnny Mercedes, Ellen Christenson and Sarai Paradiso
New York Blood Center
Background/Case Studies: Our laboratory uses a solid phase test system for platelet crossmatching. One of the stated limits of the test system is that chemical contamination of test material can produce erroneous test results. The units used for platelet crossmatching are pulled from the stock inventory. As the demand for pathogen reduced single donor platelets (SDP) increases, the percentage of pathogen reduced units in stock inventory will likely increase. Because the pathogen inactivation (PI) process we are using involves treatment of the SDP with a chemical agent, amotosalen, we wanted to determine if samples taken from pathogen reduced SDPs could be used for platelet crossmatching.
Study Design/Method: Samples from 14 different patients were crossmatched with 3‐8 SDP samples obtained both prior to and after PI treatment. A total of 64 platelet crossmatches were performed using an SDP sample taken prior to PI treatment, inclusive of all patient samples, and all crossmatches were repeated using a post‐PI treatment sample. Reaction strength at crossmatch (graded as “+” strong positive, “w+” weak positive and “0” negative) was compared between the original, non‐PI treated sample and a post PI treatment sample of the same donor unit. ABO of SDP was not a consideration as only reaction strength at crossmatch was being compared. Platelet antibody screen testing had previously been done on the 14 patient samples; 2 were positive for HLA antibody only, 8 were positive for both HLA and platelet antibody and 4 were negative. Both serum and plasma patient samples were included in the 14 used for testing.
Results/Finding: 6 of the 14 patient samples had a change in their crossmatch reactivity. Of the 6 samples showing a change, 3 had HLA/Platelet antibody, 2 had HLA antibody only and 1 sample was antibody negative. A decrease in reactivity strength was seen in 9 out of 64 (14.1%) of the pathogen reduced sample crossmatches, with 5 of the reactions becoming negative (7.8%). 1 crossmatch reaction (1.5%) increased in strength.
(BBC58)
| Patient | Antibody ID | Sample Type | No. XM'd | Discrepancy between Pre/Post PI sample XM results? |
|---|---|---|---|---|
| 1 | HLA/Plt | Serum | 3 | No |
| 2 | HLA/Plt | Plasma | 8 | Yes – 1 (w + to 0) and 1 ( + to w+) |
| 3 | HLA/Plt | Serum | 3 | No |
| 4 | HLA | Plasma | 4 | Yes – 1 ( + to w+) |
| 5 | HLA/Plt | Serum | 4 | No |
| 6 | HLA/Plt | Serum | 4 | Yes – 1 (w + to 0) |
| 7 | Negative | Serum | 4 | No |
| 8 | Negative | Serum | 4 | No |
| 9 | HLA/Plt | Serum | 5 | No |
| 10 | HLA/Plt | Plasma | 5 | No |
| 11 | HLA/Plt | Plasma | 5 | Yes – 1 (w + to 0), 1 ( + to w+) and 1 (w + to + ) |
| 12 | HLA | Serum | 5 | Yes – 1 ( + to w+) and 2 (w + to 0) |
| 13 | Negative | Plasma | 5 | No |
| 14 | Negative | Serum | 5 | Yes – 1 (w + to 0) |
Conclusion: The crossmatch reactivity strength of platelet samples can decrease as a result of pathogen inactivation treatment with amotosalen when using a solid phase test system.
Platelet crossmatching should be performed on SDP samples taken prior to PI treatment for the most accurate results.
BBC59
The Amustaline/GSH Pathogen Reduction System for Red Blood Cells as an Alternative to or Combined with Irradiation
B. Warbington, M. Schott, G. Villegas, Nina Mufti and Anna Erickson*
Cerus Corporation
Background/Case Studies: A pathogen reduction (PR) system using amustaline and glutathione (GSH) is being developed for the inactivation of pathogens and leukocytes in red blood cell (RBC) components. Amustaline forms adducts with nucleic acids and inhibits replication of contaminating pathogens and leukocytes. Although leukocytes are effectively inactivated in PR RBCs, during clinical trials institutional practices may require irradiation (IR) of PR at some sites. This study characterized the in vitro function of PR and Control RBCs with and without IR on Day (D) 7 or D21 post donation and throughout 28‐35 days of storage.
Study Design/Method: Leukocyte reduced AS‐5 RBCs were prepared from CPD whole blood collections within 24 hours of donation. For each replicate (n=6), ABO matched AS‐5 RBC were pooled and divided into 3 Test (T) input components and 3 Control (C) components. Test input RBCs were treated with 20 mM GSH/0.2 mM amustaline while C components were untreated and stored at 2‐6°C. On D7 and D21 post donation 1 T and 1 C component from each replicate were IR (IR‐T and IR‐C). Sampling for analysis of in vitro parameters was performed throughout storage.
Results/Finding: On D2, all components contained ≥40g hemoglobin and had 50‐70% hematocrit. On D35, T, compared to C, exhibited lower hemolysis, reduced extracellular K+, increased ATP levels and pH conserved pH and other physiologic functions. On D35, D21 IR‐T had reduced hemolysis, pH, post rejuvenation 2,3‐DPG, post rejuvenation oxygen dissociation and RBC deformability compared to D21 IR‐C; however, all parameters remained within functional physiologic ranges (Table 1).
Conclusion: Although IR is not expected to be required in routine use of amustaline‐GSH RBC after licensure, this study demonstrated the robustness of PR treatment when combined with IR. All measured in vitro parameters of INTERCEPT treated RBCs, including ATP and glucose levels, were conserved within physiologic functional ranges.
TABLE 1 (BBC59) Day 35 RBC in vitro Function Data (n=6)
| Treatment Arm | No IR‐T | No IR‐C | Day 21 IR‐T | Day 21 IR‐C |
|---|---|---|---|---|
| Hemolysis (%) | 0.2 ± 0.1a | 0.3 ± 0.1 | 0.3 ± 0.1a | 0.6 ± 0.1 |
| pH (37C) | 6.3 ± 0.0a | 6.4 ± 0.0 | 6.3 ± 0.0a | 6.4 ± 0.0 |
| K + (mM) | 48 ± 2a | 53 ± 2 | 69 ± 3 | 72 ± 2 |
| ATP (μmol/g Hb) | 6.4 ± 0.4 | 5.7 ± 1.3 | 5.7 ± 0.5 | 5.4 ± 1.1 |
| Extracellular Glucose (mM) | 17 ± 1 | 17 ± 0 | 17 ± 1 | 17 ± 1 |
| O2 Dissociation (p50, mmHg)b | 43 ± 2 | 41 ± 2 | 40 ± 2a | 41 ± 3 |
| 2,3‐DPG (μmol/g Hb) | 31.9 ± 2.4 | 30.9 ± 2.1 | 27.7 ± 5.5a | 30.6 ± 1.7 |
| MCHC (g/dL) | 31 ± 1 | 31 ± 1 | 31 ± 1 | 31 ± 0 |
| RBC deformability (EKTA, DI max) | 0.46 ± 0.03a | 0.49 ± 0.02 | 0.46 ± 0.03a | 0.49 ± 0.03 |
| Mean Corpuscular Fragility (mOsm) | 151 ± 2a | 156 ± 2 | 150 ± 1 | 158 ± 2 |
p<0.05, paired t‐test
D35 measurement following rejuvenation of RBCs
The amustaline/GSH PI system for RBCs is not approved for use.
This project has been funded in whole or in part with Federal funds from the DHHS; ASPR; BARDA; Contract No. HHSO100201600009C
BBC60
Winter Is Coming! Packaging Challenges Related to the Implementation of a New Thermoregulation Box System for Room Temperature Shipping of Blood Products
Lucie Boyer*, Marie‐Josée Fournier and Danny Brouard
Héma‐Québec
Background/Case Studies: To improve the logistics of blood collection and transport, while complying with temperature control requirements, Héma‐Quebec is evaluating a new thermoregulation box system (TBS) for blood product packaging and shipping over long distances. Vacuum‐insulated panels (VIP) and phase changing materials (PCM) were used in conditions of extreme external temperatures. This system successfully performed during internal tests for cooling whole blood (WB) units under 10°C in Δt<8h after collection, while maintaining an internal temperature between 1°C and 10°C for 24h under extreme summer (T=40°C) and winter (T=−35°C) temperatures (AABB, 2017). In the current study, the TBS was tested for room temperature shipping of WB donations, apheresis products and blood sample tubes.
Study Design/Method: To mimic freshly collected products, WB collection bags (Reveos LR, TerumoBCT) were filled with 523 ml 0.9% saline at T=30°C. Additionally, apheresis platelet concentrates (PC), plasma bags (TRIMA collection set, TerumoBCT), and blood sample tubes were filled with 170 ml, 250 ml and 3 ml of 0.9% saline at 20‐24°C, respectively. Monitoring probes were inserted inside the saline‐filled bags to record temperature profiles. Either one or eight Reveos WB units were packed in TBS with solid‐phase T=22°C PCM (Cryopak). For apheresis products, one single‐ (1 PC + 1 plasma) and four double‐platelet donations (8 PC + 4 plasmas) were used as minimal and maximal loads, and were both tested for maximal shipping delays. A single blood sample tube was packed in TBS to represent a limiting condition. All TBS configurations were exposed to extreme winter (T=‐35°C) and summer (T=40°C) conditions for up to 24h (n=3) in designed experiments.
Results/Finding: The TBS uses T=22°C PCM to allow rapid cooling of blood products (Δt = 30 to 48 min) and to maintain internal temperature of one to eight Reveos WB donations between 18‐24°C for 8.2h ± 0.5h and >24h under extreme external temperatures. The use of PCM allows both minimal and maximal apheresis donation products to stay within their acceptable holding temperature range (20‐24°C) for 3h and 19h when exposed to extreme winter and summer conditions, respectively. Finally, blood tubes exposed to the same external temperature conditions maintain internal temperatures between 18°C and 25°C for 6.5h and 18.5h, respectively.
Conclusion: The VIP box and PCM allow the thermoregulation box system to be used for extended shipping periods under extreme temperature conditions. Because of its increased internal volume, the box can accept more products, at the expense of additional PCM and an increased total weight. In conclusion, this thermoregulation box system was designed to use combinations of PCM to meet specific requirements regarding packaging and transport of blood products, especially in winter conditions.
BBC61
Determination of %SO2 in More Than 1300 Fresh Erythrocyte Concentrates by Resonance Raman Spectroscopy
Herbert G. Korsten1, Tatsuro Yoshida2 and Dirk de Korte*1,3
1Department of Product and Process Development, Sanquin Blood Bank, 2New Health Sciences Inc., 3Sanquin Research and Landsteiner Laboratory
Background/Case Studies: In support of research on improving erythrocyte storage under low oxygen tension (pO2), haemoglobin oxygen saturation (%SO2) in fresh erythrocyte concentrates (RCCs) was measured non‐invasively through the wall of RCC bag using Resonance Raman Spectroscopy (RRS). Surprisingly, a large variation in %SO2 of fresh (0‐2 days) RCC was found in a pilot study. For further analysis of this finding, a large number of freshly prepared RCCs at Sanquin Blood Bank were analysed with the RRS device. To determine relationships between observed variation in %SO2 and donor/donation variables we used external oxygen saturation measurement with RRS of > 1300 fresh RCCs immediately after component preparation.
Study Design/Method: For 1337 fresh RCCs, the %SO2 was analysed with RRS device (A3U11 Microvascular Oximeter, Pendar Medical). This device was validated by analysing the %SO2 of 12 RCCs in comparison with %SO2 measurements on a qualified blood gas analyser (Radiometer ABL90 FLEX). Additionally, to investigate whether low or high %SO2 values had an effect on the shelf life, RCCs were sampled on day 1 and 35 for blood gas and CBC (Sysmex XT2000) as well as for haemolysis and ATP content.
Results/Finding: The results of the %SO2 measurements with the RRS device corresponded to the %SO2 measurements on the blood gas analyser with a difference of 0.3% ± 1.5%. The %SO2 data from 1337 donors were compared with donor/donation data such as blood pressure, time of donation, donation duration, as well as individual donor characteristics (weight, height, calculated BMI, age, Hb and gender). The %SO2 data from the 1337 RCCs showed a binomial distribution, with two peaks, strongly influenced by gender of the donors; men (56% of subjects; %SO2 = 65.0 ± 16.0) and women (44% of subjects; %SO2 = 52.7 ± 18.6). The other donor parameters showed no clear effects on %SO2. Cell counts, haemolysis (day 1, 0.09% ± 0.02; and day 35, 0.36 % ± 0.22) and ATP (day 1, 5.69 µmol/gHb ± 0.43/; and day 35, 3.19 µmol/gHb ± 0.48) showed normal expected values, regardless of whether the %SO2 value was high or low.
Conclusion: The %SO2 measured by the RRS laser device correspond to %SO2 measured on a blood gas analyser. The use of the RRS device had no adverse effect on the in vitro quality of erythrocytes during storage in a small test group of 12 RCCs and there was no link between in vitro quality and %SO2 value immediately after collection. The mean %SO2 for female donors was lower than for male donors. This cannot be explained on the basis of other available donor/donation data. Further research is needed to explain this difference.
BBC62
Impact on Deferral Rates of a Ferritin‐Guided Donation Interval Strategy for High School Donors
Rita A. Reik*, Judith Smith and Michael Rogers
OneBlood, Inc.
Background/Case Studies: Concerns have been raised regarding potential adverse effects on blood donors of low ferritin levels that may exist in the absence of anemia. Young donors, and premenopausal females are two donor sub‐groups at increased risk and therefore of particular ethical and medical concern as neurodevelopment of the donor (or a donor's fetus) might be adversely affected by low ferritin levels in these groups. The objective of this study was to determine the effects on deferral rates in teenage donors when using one possible strategy employing ferritin‐guided donation intervals.
Study Design/Method: Between 11/16/17 and 12/24/17, 15,255 blood donors of all donation types, aged 16‐18 years old who met hemoglobin (Hb) acceptance criteria had a first‐time ferritin test which was drawn pre‐donation with results obtained post‐donation. Those with ferritin levels below 26 ng/mL were sent a low ferritin notification letter suggesting supplementation with an oral multivitamin containing 18 mg of iron in consultation with their physician, and deferral from donation for 112 days. Upon return of the donor, an Hb was drawn and those meeting Hb criteria donated and underwent a second ferritin test. Donors failing the second ferritin test were again notified by letter and deferred for 112 days.
Results/Finding: Between 11/16/17 and 12/24/17, 5663 (37%) of first‐time ferritin‐tested donors who met Hb acceptance criteria were deferred for 112 days due to a ferritin level <26 ng. /ml. Of these 5663 donors, 765 (13.5%) returned for a second donation between 04/08/2018 and 04/13/2018, passed the Hb criteria, were drawn for donation and underwent a second ferritin test. Of those donors who had a second ferritin test, 107 (13.9%) had acceptable ferritin levels. Of the remaining 658 (86.1%) donors that had unacceptable ferritin levels on the second test, 254 (38.6%) had an increase, 313 (47.6%) had a decrease and 91 (13.8%) had no change in ferritin level compared to the first ferritin test. The 16‐18 year old donor ferritin testing failure rate of 37% in Hb‐accepted blood donors drawn between 11/16/17 and 12/24/17 compares to a 7.4% Hgb testing failure rate in all 16‐18 yr. old donors drawn during the same time period.
Conclusion: A strikingly higher percent of teen donors was deferred based on initial ferritin testing as compared to Hb testing (37% vs. 7.4%) for an identical period of time. Notification of low ferritin, passive education on iron supplementation and an extended 112 day deferral period alone were not adequate for correction of the ferritin level in a large majority (86.1%) of first‐time low ferritin donors. Return rates for ferritin‐deferred donors could not be adequately assessed due to the short timeframe of the study. Further studies comparing return and acceptance rates of Hb vs. ferritin‐deferred teen donors, are needed to fully assess the long‐term impacts on the blood supply of this particular ferritin‐guided deferral strategy and iron supplementation intervention.
BBC63
Differences in Bacterial Species and Loads between Platelet Components Tested by BacT/ALERT and eBDS Methods
Swati Srivastava*1,2, Robert W. Maitta2,3 and Michael R. Jacobs1,2
1University Hospitals Cleveland Medical Center, 2Case Western Reserve University School of Medicine, 3University Hospitals Cleveland Medical Center, Department of Pathology
Background/Case Studies: Primary culture of platelets (PLT) was implemented for single donor PLT (SDP) collections in 2004 and later for pre‐storage pooled PLT (PSPP) using one of two FDA‐approved methods ‐ BacT/ALERT and eBDS. We compared bacterial species and loads between PLT products tested by these two methods.
Study Design/Method: PLT units transfused at our institution between January 2007 and December 2017 were studied. BacT/ALERT testing (bioMerieux, St Louis, MO) was performed by inoculating 8‐10 mL of SDP or PSPP units into BacT/ALERT BPA culture bottles at 24‐48 h post‐collection. eBDS (Haemonetics Corporation, Braintree, MA) was performed by inoculating 3‐4 mL aliquots of SDP or PSPP units into eBDS culture pouches at 24‐48 h post‐collection. Units were released if negative at 24 h. At‐issue culture was performed by obtaining aliquots from all units at time of release for transfusion, with 0.1 mL volumes plated onto blood agar plates. Plates were incubated for up to 48 hours, and specimens yielding bacterial growth were cultured quantitatively to determine bacterial loads. Transfusion reactions were monitored and patient records receiving contaminated units were reviewed.
Results/Finding: A total of 90,243 PLT units were transfused during the 11 year study period; 40,144 tested by BacT/ALERT (35,188 SDP and 4,957 PSPP) and 50,098 by eBDS (34,898 SDP and 15,200 PSPP). Twenty‐six units were found to be bacterially contaminated: 12 tested by BacT/ALERT (10 SDP, 2 PSPP) and 14 (12 SDP, 2 PSPP) by eBDS; contamination and septic reaction rates were comparable overall and by PLT type (p values for comparisons 0.27 to 0.86). However, bacterial species differed: the 12 bacterial species in units tested by BacT/ALERT included one Staphylococcus aureus, 9 coagulase‐negative staphylococci, one Gram negative bacillus (Acinetobacter baumannii), and one Bacillus species, while the 14 bacterial species in units tested by eBDS included 9 coagulase‐negative staphylococci and 5 viridans group streptococci. Bacterial loads in units tested by BacT/ALERT ranged from 7x101 to 1x10⁷ CFU/mL (mean 1.7 × 10⁴), while loads in units tested by eBDS ranged from 1 × 10² to 6 × 10⁷ (mean 2.2 × 10⁵ CFU/mL). Transfusion of 24 of the 26 contaminated units resulted in five septic reactions: one in a unit pretested by BacT/ALERT (S. aureus at 1.4 × 10⁵ CFU/mL) and 4 in units pretested by eBDS (2 coagulase‐negative staphylococci and 2 viridans group streptococci at 1 × 10⁶ to 7 × 10⁶ CFU/mL).
Conclusion: Differences in volume of PLT tested by the two methods (3‐4 mL by eBDS and 8‐10 mL by BacT/ ALERT) were not associated with differences in bacterial contamination rates or septic reactions. There were, however, differences in the range of bacterial species found, with no streptococci but proportionately more staphylococci present in products tested by BacT/ALERT, as well as lower bacterial loads in products tested by this method.
BBC64
Limitation of Donation Frequency as Iron Mitigation Strategy: Potential Donation and Unit Loss
Marjorie D. Bravo*, Hany Kamel and Ralph R. Vassallo
Blood Systems, Inc.
Background/Case Studies: Teen donors and pre‐menopausal women are donor populations susceptible to iron depletion. Different iron mitigation strategies such as increased interdonation intervals, iron replacement and ferritin‐based counseling may be implemented to prevent iron‐deficiency but all are complex to enact. In addition to donor age and sex, increased frequency of red blood cell (RBC) donation has been shown to increase the risk of iron deficiency. A calculation of potential RBC donation and unit loss, based on limiting annual donations for known at‐risk donor populations, was performed.
Study Design/Method: Using a de‐identified dataset, donors from 16 blood center locations who gave RBCs in 2016 were identified. For each donor, all associated successful allogeneic RBC‐containing donations within the prior 12‐month period were included in the analysis. RBC units were counted by collection type (1 for WB, 2 for 2‐unit RBCs, 1 for RBC‐containing apheresis collections). Data were stratified by age/sex: 16‐17 y/o males (M) & females (F), 18 y/o (M & F), 19‐25 (M & F), 19‐50 y/o (F), and by center. Loss calculations were based on each group's number of RBC donations (D) or units (U) compared to the total number obtained in the 12‐month period.
Results/Finding: There were a total of 902,317 red‐cell containing donations in the 12‐month period (1,033,961 RBC units) from 226,705 F and 230,577 M donors. When restricting donations to 1x per year (yr) for 16‐17 y/o F, losses were 1.5% (D) and 1.3% (U); for M, losses were 1.3% (D) and 1.5% (U). For a donation frequency of 1x/yr for 16‐18 y/o M & F, the RBC loses were 4.4% (D) and 4.6% (U). If 16‐18 y/o F were allowed 1x/yr and M allowed 2x/yr, the RBC losses were 2.8% (D) and 2.6% (U). Restriction of 19‐25 F to only 1 annual donation resulted in RBC losses of 1.9% (D) and 1.8% (U); among M, 2.2% (D) and 2.4% (U). Limiting 19‐50 y/o females to only 1x/yr resulted in the loss of 9.7% (D) and 9% (U); if allowed up to 2x/yr, the loss was reduced to 3.9% (D) and 3.6% (U). When stratified by center, limiting RBC donation to 1x/yr for both 16‐18 y/o M & F showed high variability across centers, ranging from 2.2% loss (11.6% teen donors) to 7.4% loss (26.9% teen donors).
Conclusion: Limiting donations from the youngest donors has a small impact on RBC losses, is operationally feasible, and involves the least regulatory and legal complexities. Impact on donation or unit availability is variable across centers based upon its proportion of teen donors.
BBC65
Bacterial Contamination and Septic Transfusion Reaction Rates Associated with Platelet Components before and after Introduction of Primary Culture
Sirisha Kundrapu*1,2, Robert W. Maitta3 and Michael R. Jacobs1
1University Hospitals Cleveland Medical Center, 2Case Western Reserve University School of Medicine, 3University Hospitals Cleveland Medical Center, Department of Pathology
Background/Case Studies: Septic transfusion reactions (STRs) resulting from transfusion of bacterially contaminated platelets (PLT) are a major hazard of platelet transfusions. To address this problem, testing for bacterial contamination was mandated from March 2004 and was implemented by culture of single donor platelet (SDP) units and pre‐storage pooled platelets (PSPP).
Study Design/Method: Blood suppliers performed primary testing by culturing PLT 24 hours after collection and releasing units that were culture negative after 24 hour incubation. Bacterial contamination and STR rates were evaluated before and after introduction of primary testing by culturing PLT aliquots at the time of issue. STRs were assessed by evaluating patients who received contaminated PLT. The pre‐culture period was Jun 1991‐Feb 2000 for SDP and Jun 1991‐Dec 2006 for PSPP. The post‐culture period was Mar 2004‐Dec 2017 for SDP and Jan 2007‐Dec 2017 for PSPP. Bacterial contamination and STR rates were compared between the two periods.
Results/Finding: A total of 28,457 PLT were cultured during the pre‐culture period (44.7% SDP and 55.3% PSPP) and 97,595 during the post‐culture period (79.3% SDP and 20.7% PSPP). Forty‐three contaminated units were identified in the pre‐ and 33 in the post‐culture period. Overall contamination rate was significantly higher in the pre‐ compared to the post‐culture period (1,511versus 338 per million, p<0.0001). Analysis by PLT unit type showed that contamination rates were significantly lower in SDP compared to PSPP in the pre‐culture period (393 vs. 2,415 per million, p<0.0001) but not in the post‐culture period (374 vs. 198 per million, p=0.9). Contamination rates of SDP were unchanged (393 pre‐ vs 374 post‐culture per million, p=0.9), while those of PSPP decreased considerably (2,415 pre‐ vs. 198 post‐culture, p<0.0001). Sixty‐six of the 76 contaminated products were transfused (36 pre, 30 post), resulting in 21 STRs (14 pre and 7 post). The STR rate was significantly higher in the pre‐ vs. post‐culture period (492 vs. 72 per million, p<0.0001). STR rates were significantly lower in SDP compared to PSPP in the pre‐culture period (79 vs. 826 per million, p=0.01) but not in the post‐culture period (77 vs. 50 per million, p=0.7). A significant difference in contamination rate (558 vs. 105 per million, p=0.0002) but not the STR rate (120 vs. 21 per million, p=0.15) was noted with stratification of the post‐culture period into 2004‐2011 and 2012‐2017.
Conclusion: Introduction of primary culture of SDP and PSPP did not significantly reduce bacterial contamination or STRs in SDP PLT but did in PSPP. These findings highlight the continued need to further reduce these rates by performing secondary testing near time of use or application of pathogen reduction technologies.
BBC66
One Hospital Donor Center's Experience with the Relocation of the Pregnancy Question
Kimberly J. Duffy*, Sandra C. Bryant, Audrey E. Traun, Mary M. Benike, James R. Stubbs and Justin D. Kreuter
Mayo Clinic
Background/Case Studies: The Full‐Length Donor Questionnaire (DHQ) was developed to streamline the donor process, with questions grouped by timeframe to optimize donor recall. Donor pregnancy status has continued to be included in the DHQ through numerous revisions. The recent DHQ modification changed the focus of the question from pregnancy within the last 6 weeks to lifetime pregnancy, thus changing its placement within the DHQ. This evaluation assessed whether the placement of the question impacted the response from donors.
Study Design/Method: Every blood donor that presents completes the DHQ electronically. On 7/12/2014, the 7th question of the DHQ determined if the donor was currently pregnant or had been pregnant within the last 6 weeks. Female donors answering no to this question were then asked if she had ever been pregnant as a follow‐up question. On 5/22/2016, the pregnancy question was relocated to the 32nd question and was modified to ask if the donor had ever been pregnant. Responses were gathered for each timeframe and the first date the donor indicated pregnancy was determined. This date was compared with each DHQ to determine if there were any inconsistencies in responses. Generalized estimating equations with dependent variable of pregnancy question answered correctly (0=no, 1=yes) and independent variable of DHQ group as the independent variable assesses the rate at which the question is answered incorrectly, after adjusting for multiple responses per donor ( < 36% of unique donors provided only 1 response). Statistical significance was defined as p‐value < 0.05.
Results/Finding: The data showed that from 7/12/2014 to 5/21/2016, 1.6% of females that had indicated pregnancy on a previous DHQ did not correctly answer the pregnancy question on subsequent DHQs. From 5/22/2016 to 3/15/2018, following the relocation of the pregnancy question, 3.2% of females that had indicated pregnancy on a previous DHQ did not recognize pregnancy history on subsequent DHQs.
| Question 7 | Question 32 | p‐value | |
|---|---|---|---|
| Total female visits | 31591 | 13578 | < 0.0001 |
| Unique female donors | 10182 | 7057 | |
| Unique pregnant females | 6726 | 4746 | |
| Females indicating past or current pregnancy on today visit | 21446 | 8886 | |
| Females correctly answering pregnancy question based on historical data | 31093 | 13150 | |
| Female donor that marked question incorrectly based on historical data | 498 | 428 |
Conclusion: The position of a question on the DHQ could be a factor in the accuracy of donor responses, with the data showing a greater likelihood of an inaccurate response when the question was moved from the beginning to a later position on the DHQ. A potential solution is to order the questions on the DHQ by seriousness of risk to donor/recipient rather than by timeframe, thereby improving the likelihood of accurate responses to the most critical questions. Enhancing computer support to highlight donor responses that are answered inconsistently between visits would also aid in identifying discrepancies that could then be reconciled with the donor.
BBC67
Prevalence of Non‐ABO RBC Alloantibodies in Blood Donors
Monika Paroder*1,2, Anna Birbraer2, Shiraz Rehmani2, Bruce S. Sachais2 and Connie M. Westhoff3
1Columbia University Medical Center, 2New York Blood Center, 3Immunohematology and Genomics Laboratory, New York Blood Center
Background/Case Studies: The prevalence of RBC alloimmunization has been reported in blood recipients but little data exists on the prevalence of alloimmunization to RBC antigens in healthy donors. Positive antibody (Ab) screens in blood donors often lead to donor deferrals, because although the plasma volume remaining on RBC units is minimal, the unit must be labeled with the Ab specificity which causes operational challenges for the blood center and hospitals. The aim of the current study was to determine the prevalence and specificities of non‐ABO alloantibodies in our blood donors over an 18 year period and quantify antibodies by gender, age and race.
Study Design/Method: Dates of blood donation and corresponding Ab screen/ID results, gender, ethnicity, and age, were obtained from collection center records between 1999 and 2017. To determine the overall prevalence of alloimmunization to RBC antigens in our donor pool, we searched donor records to identify those with at least one positive Ab screen.
Results/Finding: During the 18 year period, Ab screens were performed on 1,500,756 donors; 734,723 (49%) females and 766,031 (51%) males. A total of 4,963 donors (0.33%) had ≥ 1 positive Ab screen with Ab ID on record constituting 0.512% of all female and 0.16% of all male donors tested. The most frequent Ab ID was “non‐specific,” accounting for 31.2% of female and 44.9% of male positive Ab screens. The most common specificity identified was anti‐D, detected in 1196 (0.08%) of all donors screened and in 24.1% of the donors with identifiable specificities, with 3 female donors being Rh positive. Anti‐E (n=803), K (n=727), C (n=308), M (n=242), c (n=213), Fya (n=164) and Jka (n=151) were identified in 16.2, 14.6, 6.2, 4.9, 4.3, 3.3, and 3.0% respectively, of donors with positive Ab screens and ID on record. Anti‐D was the most common Ab in females with positive screens (28.8% vs 9.26% of males with positive screens). Anti‐D (n=1085) accounted for 10.9% of Asian, 23.6% of African American, 21.7% of Hispanic, 18.3% of Multiracial, and 31.4% of White female donors with positive screens. The most common Ab specificity in males was anti‐K, representing 18% of specific Abs identified in males. The frequency of both anti‐D and anti‐K increased with age, with 0.017% and 0.003% positive donors, respectively, in the 18‐24 age group, compared to 0.63% and 0.22% in the > 74 age group.
Conclusion: The prevalence of positive RBC Ab screen in blood donors at our blood center is ∼0.33%, and as expected, is 3 times more likely in female donors, and 4 more likely female donors >74 years. Anti‐D was identified in both males and females, implicating pregnancy and transfusion‐related exposures. The presence of anti‐D in 1,085 healthy female donors post introduction of RhIg in the 1960's indicates anti‐D in pregnancy has not been eliminated.
BBC68
Sensitivity Evaluation of the Verax PGDprime® Test for Bacteria in Platelets
David LaVerda*, Lisa Shinefeld, Erica Boudreau, Nancy Best, Miranda Williams, Adam Lousararian, Brandi Salls, Nancy Staecker, Nicholas McKenzie and Remo Vallejo
Verax Biomedical Inc.
Background/Case Studies: The PGDprime rapid test for bacteria in platelets was developed as an improvement of the Platelet PGD® test currently used as a Safety Measure for platelet transfusion. It was designed to provide a simpler test procedure compared to the current product. The analytical sensitivity of the new PGDprime test was evaluated by demonstrating substantial equivalence to the PGD assay in detection of the PGD assay's claim strains.
Study Design/Method: A blinded frozen 32‐member bacterial test panel was prepared. The panel comprised three levels of each bacterial species so that, after reconstitution in platelet samples, one member was below the limit of detection (LOD) of the PGD assay (“low”), one member was at or slightly above the LOD of the assay (“mid”), and one was above the LOD of the PGD assay (“high”). Two negative samples were included in each panel. Panel members were thawed and added 1:21 to fresh platelet samples. The reconstituted panel members were tested on one lot of the current PGD assay and on six lots of PGDprime devices. Bacteria tested included B. cereus, C. perfringens, S. aureus, S. epidermidis, S. agalactiae, E. aerogenes, E. coli, K. pneumoniae, P. aeruginosa, and S. marcescens.
Results/Finding: As shown in the Table, all samples at or above the LOD of the PGD assay were detected by the PGD assay control and by all six lots of PGDprime devices. For some test antigens, the PGDprime assay detected all samples at the lowest antigen concentration.
TABLE Results of Testing Platelets Spiked with Bacterial Panels
| Bacterial species | Level | (CFU/mL) | PGD Samples detected/samples tested | PGDprime Samples detected/samples tested |
|---|---|---|---|---|
| B. cereus | high | 7.8E+04 | 8/8 | 48/48 |
| mid | 2.7E+04 | 8/8 | 48/48 | |
| low | 3.4E+03 | 0/8 | 13/48 | |
| S. aureus | high | 7.7E+04 | 8/8 | 48/48 |
| mid | 1.8E+04 | 8/8 | 48/48 | |
| low | 2.1E+03 | 0/8 | 19/48 | |
| S. epidermidis | high | 4.9E+04 | 8/8 | 48/48 |
| mid | 2.7E+04 | 8/8 | 48/48 | |
| low | 1.9E+03 | 0/8 | 48/48 | |
| S. agalactiae | high | 5.1E+05 | 8/8 | 48/48 |
| mid | 1.6E+05 | 8/8 | 48/48 | |
| low | 1.8E+04 | 0/8 | 48/48 | |
| C. perfringens | high | 7.8E+05 | 8/8 | 48/48 |
| mid | 2.4E+05 | 8/8 | 48/48 | |
| low | 3.6E+04 | 4/8 | 32/48 | |
| E. aerogenes | high | 5.6E+04 | 8/8 | 48/48 |
| mid | 3.3E+04 | 8/8 | 48/48 | |
| low | 1.1E+03 | 0/8 | 0/48 | |
| P. aeruginosa | high | 3.0E+04 | 8/8 | 48/48 |
| mid | 1.7E+04 | 8/8 | 48/48 | |
| low | 2.6E+03 | 0/8 | 0/48 | |
| E. coli | high | 1.2E+05 | 8/8 | 48/48 |
| mid | 5.6E+04 | 8/8 | 48/48 | |
| low | 4.2E+03 | 0/8 | 1/48 | |
| S. marcescens | high | 7.6E+06 | 8/8 | 48/48 |
| mid | 2.5E+06 | 8/8 | 48/48 | |
| low | 1.7E+05 | 0/8 | 48/48 | |
| K. pneumoniae | high | 1.8E+05 | 8/8 | 48/48 |
| mid | 6.1E+04 | 8/8 | 48/48 | |
| low | 2.4E+03 | 0/8 | 0/48 | |
| Negative | N/A | 0/16 | 0/128 |
Conclusion: PGDprime delivers substantially equivalent sensitivity to the Verax Platelet PGD Test while greatly improving ease of use, eliminating the centrifugation step, and simplifying user work flow.
BBC69
25‐Day Old Thawed Cryoprecipitate Is a Viable Source of Fibrinogen in Emergencies
Michael Losos*1,2, Karen Bruzdoski1, Vadim Kostousov1,2, Jun Teruya1,2 and Shiu‐Ki Hui1,2
1Texas Children's Hospital, 2Baylor College of Medicine
Background/Case Studies: The need for a readily available source of fibrinogen (Fb) in the setting of acute hemorrhage such as post‐partum hemorrhage (PPH) at the moment is unfulfilled. Neither fibrinogen concentrate nor cryoprecipitate (CP) is available for immediate use. Both need to be either reconstituted or thawed, respectively. Turn‐around‐time (TAT) for either product is approximately 30 minutes which can be critical especially in PPH where Fb is correlated with degree of bleeding and outcome. Previous studies on extended storage of thawed cryoprecipitate (TCP) have been performed for only up to 5 days.
Study Design/Method: The aim of our study was to determine the stability of fibrinogen (Fb) and feasibility of prolonged (>5 days) storage of TCP at room temperature (RT) and refrigerated (Rf) at 1‐6°C up to 25 days.
A total of 10 single units of type O CP were thawed in at 37°C. 3 TCP were then stored undisturbed at either room temp (n=3) or refrigerated (n=7) for up to 25 days respectively. Fb of TCP was measured at a 5 to 7 day‐intervals.
TABLE: (BBC69) Fibrinogen Recovery
| Storage Condition | Percentage Recovery (Range) | ||||||
|---|---|---|---|---|---|---|---|
| Day 0 | Day 1 | Day 5 | Day 10 | Day 15 | Day 20 | Day 25 | |
| Room Temperature | 100 | 92 (85‐99) | 91 (87‐91) | 93 (86‐91) | 86 (80‐93) | 69 (61‐78) | 70 (65‐69) |
| Refrigerated | 100 | 79 (27‐97)* | D/C | D/C | D/C | D/C | |
Measured on Day 7
D/C: Discontinued due to precipitation
Results/Finding: Prolonged storage of TCP at RT showed that Fb was acceptable for up to 25 days. The average calculated amount of Fb after 25 days of RT storage remained stable at 227 mg per unit (178‐277 mg), which is ≥ 150 mg per AABB standards. Of note, average labile Factor VIII activity was 32 IU (16‐44 IU) below FDA requirement of ≥80 IU. In contrast, Rf storage showed that up to 73% of Fb could be lost by Day 7 due to precipitation which was not observed with the RT units. The precipitate did not disappear by warming the CP.
Conclusion: Our study demonstrates that prolonged Rf storage of TCP is not practical as precipitation not only led to poor recovery of Fb but also made safe transfusion of the product difficult. On the other hand, RT storage of TCP proved to be an effective method to maintain adequate Fb for up to 25 days. RT TCP can be a novel and enhanced means of providing Fb replacement with a superior turnaround time while limiting wastage.
BBC70
Effect of Air Presence during Compound Adsorption on the Quality of Pathogen Reduced Platelet Concentrates Treated By Amotosalen and Ultraviolet Light A
Herve Isola*, Arnaud Dupuis, Beatrice Belcour and Christian Gachet
EFS Grand EST
Background/Case Studies: Since 2006, EFS Grand Est produces and delivers pathogen reduced Platelet Concentrates (PR‐PC) using a photochemical treatment (PCT) combining amotosalen and ultraviolet light A (UVA) (INTERCEPT™, Cerus). After UVA treatment, amotosalen is adsorbed by a compound adsorption device (CAD) during incubation time of 6h to 16h under agitation (Large Volume sets) to be ≤ 2 µM which is the limit specified by the French regulatory authority. Aims of study is to evaluate the quality of PR‐PC processed with or without presence of residual air during the CAD step (the air can be removed with a manual operation).
Study Design/Method: Two buffy coat PC (BCPC) from 5 donors were pooled and split to obtain two identical BCPCs: BCPC1 was treated for PR with a 16h CAD time after removing the air in the bag (Control), BCPC2 was treated for PR with a 16h CAD time in presence of residual air in the bag (Test). Biological parameters (swirling, platelet content, residual leukocytes, pH, pO2, pCO2, lactate, Glucose, LDH, soluble p‐selectin) and residual amotosalen concentration were assessed.
Results/Finding: the mean platelet contents were 4.2 ± 0.3.1011 for Control and Test before PCT and respectively 3.5 ± 0.2 × 10¹¹ and 3.6 ± 0.3 × 10¹¹ after PCT. All the units presented maximum swirling and compliant pH. Residual amotosalen concentration was < 2 µM for each unit of PC. Evolution of biological parameters during storage period was similar for Control and Test (Table 1) except for pO2 at day 2, due to air presence in Test PCs.
Conclusion: The quality control of PR‐BCPCs showed no difference when the CAD operation was performed with or without the presence of residual air in the bag. The quality of PR‐PCs was preserved. This study allows to simplifying the PRT process of PCT by eliminating the manual operation of air removal before CAD operation. Thus, it contributes to reduce time process, variability and loss of platelet content.
TABLE 1 (BBC70) biological parameters of PCs in Control and Test group (Mean ± SD)
| N=6 | Control (C) Test (T) | Day 1 before PCT | Day 2 after PCT | Day 5 | Day 7 |
|---|---|---|---|---|---|
| pH (22°C) | C | 7.26 ± 0.02 | 7.10 ± 0.06 | 6.98 ± 0.04 | 6.97 ± 0.01 |
| T | 7.28 ± 0.02 ns | 7.15 ± 0.02 ns | 6.95 ± 0.03 ns | 6.96 ± 0.03 ns | |
| Glucose (mM) | C | ND | 5.6 ± 0.6 | 1.3 ± 0.6 | < DL |
| T | 5.8 ± 0.3ns | 1.2 ± 0.5ns | < DL | ||
| pO2 (mmHg) | C | 112.5 ± 4.3 | 123.5 ± 7.1 | 134.3 ± 6.7 | 139.3 ± 9.7 |
| T | 108.8 ± 2.0 ns | 141.5 ± 9.2s | 136.3 ± 6.5 ns | 142.6 ± 10.0 s | |
| pCO2 (mmHg) | C | 31.1 ± 1.5 | 37.3 ± 2.2 | 27.9 ± 2.0 | 21.4 ± 1.6 |
| T | 31.1 ± 1.7 ns | 35.5 ± 2.1 ns | 28.1 ± 2.4 ns | 20.6 ± 2.2 ns | |
| LDH (U/L) | C | ND | 74 ± 5 | 106 ± 10 | 130 ± 16 |
| T | 78 ± 6 ns | 111 ± 12 ns | 140 ± 17 ns | ||
| p‐selectin (ng/mL) | C | 14.5 ± 1.8 | 33.3 ± 5.7 | 104.8 ± 9.8 | 148.0 ± 10.7 |
| T | 14.2 ± 2.1 ns | 37.8 ± 4.8 ns | 111.8 ± 8.8 ns | 161.7 ± 15.2 ns |
DL: Detection limit
s = significant difference; ns = no significant difference; paired t‐Test p<0.05
ND: Not Done
BBC71
Additive Solution Diverted Plasma Does Not Cause More Transfusion Reactions
Jason Kang*, Jessica Mallek, Catherine Saporito, Gregory Wright and James T. Perkins
NorthShore University HealthSystem
Background/Case Studies: Platelet apheresis using Platelet‐Additive Solution (PAS) allows for collection of platelets with reduced plasma content and diversion of the plasma to create a plasma component for transfusion. In addition to the benefit of collecting a “free” plasma component, the reduced incidence of plasma‐associated reactions has been reported in the literature. However, the incidence of transfusion reactions from the diverted plasma has not been widely reported. Plasma and platelet transfusion reaction data from a multi‐hospital, tertiary referral health system are presented here.
Study Design/Method: Transfusion reaction rates for diverted‐ versus conventional plasma as well as for PAS‐ versus conventional platelets were calculated for a two year period (1/1/2016 to 12/31/2017). Statistical analysis was performed. Reported transfusion reactions deemed by the blood bank director to be unrelated to transfusion were excluded.
Results/Finding: Between 1/1/2016 and 12/31/2017 the overall difference between transfusion reaction rates in diverted plasma (0.5%, 1/202) and conventional plasma (0.7%, 15/1967) was insignificant (p 0.67, 95% CI ‐0.008 to 0.013). Allergic transfusion reactions accounted for 88% (14/16) of the reported plasma transfusion reactions; there were also two cases of circulatory overload. There was a trend to a lower transfusion reaction rate with PAS platelets (0.2%, 1/498) versus conventional platelets (0.5%, 15/2851), but it did not reach statistical significance (p 0.33, 95% CI ‐0.002 to 0.008). Allergic transfusion reactions accounted for 81% (13/16) of the reported platelet transfusion reactions; there were also two cases of circulatory overload and one febrile nonhemolytic reaction. The diverted plasma from the single implicated PAS platelet unit did not cause a transfusion reaction.
Conclusion: Use of plasma diverted in the production of PAS platelets did not appear to increase (or decrease) the rate of reactions to plasma transfusion. Use of PAS platelets versus conventional platelets tended to reduce the recipients' transfusion reaction rate. The observed risk reduction associated with PAS platelets was consistent with literature reflecting the benefit of decreased recipient exposure to donor plasma proteins. More broadly, the demonstrated noninferiority of diverted plasma represents an additional benefit to blood collection and transfusion services that utilize cell separators with plasma diversion capability during PAS platelet collection.
BBC72
The Effect of Race on Anti‐A/B IgM Antibody Prevalence in South Texas O Rh(D) Positive Male Donors
Samantha Ngamsuntikul*1, Rachel Beddard1, Lorena Aranda2 and Tiffany Wafford2
1BioBridge Global, 2QualTex Laboratories
Background/Case Studies: Anti‐A and anti‐B antibodies pose a risk of acute hemolytic transfusion reactions in recipients with the corresponding antigen. Debate continues on the titer of anti‐A and B and which antibody class, IgM or IgG, to test to ensure optimal safety. The US military uses a single titer cutoff of <1:256 of IgM anti‐A and B as safe in non‐group O recipients. With the resurgence of whole blood use in civilian traumas, elucidating the prevalence of these antibodies in different donor populations is important to enhance donor recruitment.
Study Design/Method: O Rh(D) positive male fixed site donors with a history of 2 or more donations were tested. This mitigated for transfusion related acute lung injury while maintaining a robust, committed donor pool. IgM Anti‐A and Anti‐B (IgM anti‐A/B) antibodies were determined using a single titer of 1:256. Plasma from ethylenediaminetetraacetic acid (EDTA) samples was tested using saline (0.9%) diluent. Diluted plasma (50uL) was mixed with 50uL of commercially available A1 and B cells, incubated at room temperature for 5 minutes, centrifuged for 15 seconds at 3600 rpm, and read for agglutination. Reactivity for either anti‐A or anti‐B at 1:256 constituted a positive. Donor race, self‐declared by the donor, was retrieved from the blood establishment computer system for all tested donors.
Results/Finding: The table below shows the results of 1,052 male O Rh(D) positive donors tested, stratified by race. Hispanic is an ethnicity but these donors often self‐identify as a separate race; therefore, Hispanic is a race choice on the donor history questionnaire. The results show the prevalence of antibody varies with race with the lowest prevalence in American Indian donors followed by Caucasian/White, Asian/Pacific Islanders, Black/African American, Multi‐Race/Other, Hispanic, and Undeclared. Using Fisher Exact, the prevalence of IgM anti‐A/B antibodies were statistically higher in Hispanic donors as compared to Caucasian/White donors. Other race groups had too few numbers to reach statistical significance.
| Donor Race/Ethnicity | Number of Donors | Number positive for anti‐A, B or both (%) |
|---|---|---|
| Caucasian/White | 414 | 51 (12.3) |
| Hispanic | 335 | 74 (22.1)* |
| Black/African American | 20 | 4 (20.0) |
| Asian/Pacific Islander | 7 | 1 (14.3) |
| American Indian | 4 | 0 (0) |
| Multi‐Race/Other | 24 | 5 (20.8) |
| Undeclared | 248 | 57 (23.0) |
p < 0.05
Conclusion: In this population of male O Rh(D) positive donors in South Texas, the prevalence of IgM anti‐A/B antibody varies with race with the lowest prevalence in Caucasian/White donors. This data can help target whole blood collections to maximize the availability of units low in IgM anti‐A/B antibodies.
BBC73
Prevalence of Hepatitis B and C Viral Markers in Blood Donors Deferred from Donating Blood on the Basis of a History of Hepatitis Related Risk Factors
Ushasree Ravula1, Suchet Sachdev*1, Neelam Marwaha1, Ajay K. Duseja2 and Arnab Pal3
1Department of Transfusion Medicine, PGIMER, 2Department of Hepatology, PGIMER, 3Department of Biochemistry, PGIMER
Background/Case Studies: The present study was conducted to find out the prevalence of viral hepatitis markers among blood donors deferred on the basis of a history of hepatitis related risk factors, compare it with the prevalence in accepted blood donors and assess the impact of such a deferral on blood safety. Knowing the natural history of HBV and HCV asymptomatic window period, chronic carrier stage, genetic diversity, mutants and cryptic/occult infection and that during this the potential of transmission through blood transfusion remains. Therefore need to garner data as evidence to support for deferral for elicitable history of presence risk factors related to development of hepatitis in the interest of blood safety was realized.
Study Design/Method: Observational study recruiting 1000 deferred blood donors deferred on the basis of a history of hepatitis related risk factors and carried out serology and ID‐NAT for hepatitis B and hepatitis C after obtaining written informed consent. History of jaundice, tattooing/body piercings, surgery/dental extraction, contact with persons having hepatitis, high risk behavior, blood transfusions/transplantations or immunoglobulin administration. The study participation was voluntary non‐random. The study protocol was approved by the ethics committee of the institute.
Results/Finding: 18 (1.8%) out of 100 deferred blood donors were reactive on ELISA, 8 were reactive for HBsAg; whereas 10 for anti‐HCV antibodies. 17 (1.7%) were initial reactive on ID‐NAT, 15 discriminated on further testing; 8 for HBV, 7 for HCV. 9 were reactive for hepatitis B, out of which 7 were concordant positive for HBsAg ELISA and NAT, whereas one was NAT yield and one was sero‐yield. Out of 9 hepatitis B reactive, 7 (77.8%) had history of jaundice, one (11.1%) had history of tattooing and one (11.1%) had history of high risk behavior. 12 were hepatitis C reactive, out of which 5 were concordant anti‐HCV ELISA and NAT reactive, while 5 were sero yield and two were NAT yield. Out of the 12 deferred donors reactive for hepatitis C majority had history of jaundice (83.3%) followed by high risk behavior (16.3%). Total 23 donors had viral markers for either hepatitis B or hepatitis C in the present study. Therefore the potential of deferral on a history of hepatitis related risk factors could interdict about 2‐3 HBV and/or HCV reactive blood donors from entering the quarantine blood supply per 100 donors.
The odds of testing reactive on ELISA was 1.92 (95% CI; 0.95 – 3.90) at P=0.06, and odds of testing reactive ID NAT was 2.76 (1.80 – 4.21) and as ID‐NAT yield was 3.2 (95% CI; 1.17 – 8.77) at P=0.000 and 0.02 respectively in donors deferred on a history of hepatitis related risk factors, when compared to selected donors without such a history. Risk of testing reactive for hepatitis B and C was significantly higher on a deferral on high risk behavior when compared to the other risk factors deferral (P=0.00013). The authors acknowledge that a selection bias may be possible as they could not recruit all donors deferred on the basis of a history of hepatitis related risk factors.
Conclusion: The findings of the present study support a deferral for a history of hepatitis related risk factors as the first step towards the pursuit of a safe blood supply.
BBC74
Metabolic Effect of Alkaline Additives and Guanosine/Gluconate in Storage Solutions for Red Blood Cells
Angelo D'Alessandro1, Robin van Bruggen2, Julie A. Reisz1, Rachel Culp‐Hill1, Herbert G. Korsten3 and Dirk de Korte*3,4
1University of Colorado Denver, 2Department of Blood Cell Research, Sanquin Research and Landsteiner Laboratory, 3Department of Product and Process Development, Sanquin Blood Bank, 4Sanquin Research and Landsteiner Laboratory
Background/Case Studies: After introduction of component therapy in the 1950's, SAGM (Europe) and AS‐1 (North America) were the main additive solutions (AS) used for red blood cell concentrates (RBCs). Main improvements in quality of RBCs in the last part of 20th century came from introduction of leukodepletion and PAGGSM and AS‐3/5 as generation two AS. Still, storage in the blood bank results in progressive accumulation of a so‐called storage lesion, characterized by a large number of in vitro changes in parameters like hemolysis, morphology, 2,3‐diphosphoglycerate (2,3‐DPG) and adenosine triphosphate (ATP) content, membrane stability etc. The storage lesion can be, at leas partial, mitigated by storage in novel storage additives, such as alkaline additive solutions. While several novel alkaline additive formulations have been proposed, no metabolomics characterization has been performed to date.
Study Design/Method: We performed UHPLC‐MS metabolomics analyses of red blood cells stored in SAGM (standard additive in Europe), PAGGSM or alkaline additives SOLX, ESOL‐5 and PAG3M for either 1, 21, 35 (end of shelf‐life in The Netherlands) and 56 days.
Results/Finding: Metabolic linkage analysis provides at a glance an overview of metabolic rewiring across additives, indicating a strong effect on redox homeostasis, carboxylic acid, fatty acid and purine metabolism in alkaline additives when compared to SAGM. Results indicate that alkaline additives (especially PAG3M) better preserve 2,3‐DPG and ATP. Correlations between ATP and DPG were poor for all additives except for PAG3M, suggesting a rewiring of the Rapoport‐Luebering shunt specific to this additive. In addition, deaminated purines such as hypoxanthine were predictive of hemolysis and morphological alterations. Guanosine supplementation in PAGGSM and PAG3M fueled ATP generation by feeding into non‐oxidative pentose phosphate pathway via phosphoribolysis. Decreased urate to hypoxanthine ratios were observed in alkaline additives, suggetive of decreased generation of urate from purine degradation, and as a consequence less formation of hydrogen peroxide by xanthine oxidase activity. Despite the many benefits observed in purine and redox metabolism, alkaline additives did not prevent accumulation of free fatty acids and oxidized byproducts, opening a window for future alkaline formulations including (lipophilic) antioxidants.
Conclusion: Alkalinization via different strategies (replacement of chloride anions with either high bicarbonate, high citrate/phosphate or membrane impermeant gluconate) results in different metabolic outcomes, in all cases superior to current canonical additives. The results from our metabolic analyses indicate superior preserving of RBC in PAG3M over the other alkaline additives and, in general, of alkaline additives over non‐alkaline SAGM and PAGGSM. In particular, DPG and ATP generation and maintenance, as well as purine metabolism and redox homeostasis (especially the PPP and its non‐oxidative phase byproducts) were favorable in PAG3M and other alkaline additives in comparison to SAGM and PAGGSM. However, the observed metabolic benefits do not extend to the prevention of storage‐induced fatty acid release and lipid oxidation. Results from the present study provide additional insights in the metabolic benefits of alkaline storage additives and will likely guide the formulation of novel additives in the near future.
BBC75
In Vitro Function Evaluation of Amicus Amotosalen/UVA Treated Platelets in 100% Plasma
F.B. West1, Pamela H. Whitley*1, Shalene Hanley1, Sherrie L. Sawyer1, Michael S. Wellington1, Hermelinda Evans2, Fatbardha Varfaj2 and Anna Erickson2
1American Red Cross, 2Cerus Corporation
Background/Case Studies: The INTERCEPT Blood System for Platelets is FDA approved for the ex vivo preparation of pathogen‐reduced apheresis platelet components (PCs) in 100% plasma and PAS (Platelet Additive Solution) collected on Trima and Amicus devices, respectively. The system utilizes amotosalen, with UVA light to inactivate pathogens and leukocytes. This study evaluated in vitro function of Amicus PCs in 100% plasma after amotosalen‐UVA treatment and storage up to 7 days.
Study Design/Method: Four single and 4 double dose apheresis PCs were collected on the Amicus platform in 100% plasma. Input PCs had doses of 3.8‐7.8 x10¹¹ platelets with counts of 1.2‐2.0 x10⁹/mL in 296‐413 mL. PCs were INTERCEPT treated using dual storage (DS) set, stored at 20‐24°C and evaluated for in vitro physical/metabolic characteristics on Days 5 and 7.
Results/Finding: The post‐treatment platelet dose recovery was ≥82% and transfusable product dose was ≥3.2 x10¹¹ platelets. All treated PCs had pH22°C ≥ 7.1 on Day 5 and ≥6.8 on Day 7. in vitro platelet quality at Days 5 and 7 post‐donation was consistent with the published ranges for INTERCEPT PCs in 100% plasma collected on the Trima device (Table 1).
Conclusion: These data indicate that INTERCEPT Blood System for Platelets is compatible with Amicus PC in 100% plasma. PC treated using the DS set and stored up to 7 days retained in vitro metabolic and functional properties consistent with in vivo functionality and were comparable to the published amotosalen‐UVA treated Trima PC in 100% plasma at Days 5 (FDA licensed) and 7. INTERCEPT PCs met the FDA requirements for transfusable dose and pH.
TABLE 1 In Vitro Function of INTERCEPT Amicus PC in 100% Plasma at Days 5 and 7 and Comparison to Published INTERCEPT Trima PC (Mean ± SD)
| Day 5 | Day 7 | |||
|---|---|---|---|---|
| Platelet Parameter | INTERCEPT Amicusa (n=8) | Published INTERCEPT Trimac (n=67) | INTERCEPT Amicusa (n=8) | Published INTERCEPT Trimad (n=67) |
| Platelet Count (×109/mL) | 1.4 ± 0.3 | 1.3 ± 0.3b | 1.3 ± 0.2 | 1.3 ± 0.2 |
| MPV (fL) | 6.5 ± 0.6 | 7.3 ± 1.0 | 6.6 ± 0.7 | 7.5 ± 1.1 |
| pH (22°C) | 7.4 ± 0.1 | 7.2 ± 0.3b | 7.1 ± 0.2 | 7.1 ± 0.3 |
| Supernatant Glucose (mmol/1012 platelets) | 8 ± 2 | 13 ± 3b | 7 ± 2 | 9 ± 4 |
| Supernatant Lactate (mmol/1012 platelets) | 7 ± 1 | 11 ± 4b | 10 ± 1 | 11 ± 4 |
| Total ATP (nmol/108 platelets) | 3.4 ± 0.7 | 4.6 ± 1.4b | 3.0 ± 0.7 | 4.4 ± 1.6 |
| Morphology Score | 321 ± 14 | 307 ± 39b | 310 ± 14 | 283 ± 46 |
| Extent of Shape Change (%) | 20 ± 4 | 23 ± 5b | 14 ± 3 | 21 ± 6 |
| Hypotonic Shock Response (%) | 51 ± 9 | 59 ± 9b | 47 ± 10 | 51 ± 12 |
| Supernatant LDH activity (IU/1012 platelets) | 191 ± 85 | 130 ± 4b | 212 ± 109 | 141 ± 48 |
| P‐selectin (CD62P % expression) | 38 ± 5 | 21 ± 9b | 48 ± 5 | 30 ± 16 |
INTERCEPT processing of Amicus PC in 100% plasma is not currently FDA approved
n=66
FDA approved for 5 Days. Complete data at https://intercept-usa.com
Not currently FDA approved for Day 7
BBC76
The Effects of Pathogen Reduction on Platelet Quality and Metabolism
Amanda Miller Ghio, Amy Copeland, Lori Sweat, Dennis Jay, Terrence Geiger and Yan Zheng*
St. Jude Children's Research Hospital
Background/Case Studies: Pathogen reduction is important for platelets as platelets are stored at room temperature for up to five days before transfusion, a condition optimal for microorganism growth. The Intercept system is one of pathogen inactivation methods that combines amotosalen and UVA light to inactivate most contaminated viruses, bacteria and protozoa. During the implementation of the Intercept system at our institution, we evaluated the impact of pathogen reduction on platelet quality and metabolic parameters.
Study Design/Method: Platelets collected by apheresis were suspended in autologous plasma and processed following the Intercept pathology reduction system treatment or conventional manufacture protocol. For pathogen reduction, platelets were mixed with amotosalen, exposed to UVA light, followed by overnight incubation with a compound adsorption device (CAD) to remove residual amotosalen. Platelet concentration, unit volume, pH, glucose and lactate were measured at collection (day 0), post CAD incubation (day 1), and on day 5 respectively. Platelet yield per unit was calculated by platelet concentration × unit volume. Data were presented as mean ± standard deviation followed by numbers of specimen. Statistical comparisons were done using the Student's t‐test with P‐values < 0.05 considered significant.
Results/Finding: Pathogen reduction led to a small but significant loss of platelets (Day 0 = 4.12 ± 0.31 × 10¹¹, n = 34, day 1 = 3.85 ± 0.31 × 10¹¹, n = 23, P<0.0001) with average platelet retention of 87.37 ± 3.32% per unit. The decreased yield was only partially caused by volume loss (Day 0 = 302.70 ± 10.96 mL, day 1 = 1, 227.8 ± 12.74 mL, P < 0.0001) during the processing as platelet concentration dropped as well (Day 0 = 1361.03 ± 108.80 × 10⁹/L, day 1 = 1293 ± 122.90 × 10⁹/L, P < 0.0001). In addition, the pH of pathogen‐reduced (PR) platelets was significantly lower after five days of storage than that of conventional platelets (conventional platelets = 7.33 ± 0.11, n = 16, PR platelets = 7.10 ± 0.13, n = 13, P<0.0001) although the pH of ≥ 95% PR platelet units were above 6.2. Pathogen reduction also resulted in decreased Glucose (conventional platelets = 264.00 ± 23.94 mg/dL, PR platelets = 225.1 ± 42.89 mg/dL, P = 0.0095), and increased Lactate (conventional platelets = 7.90 ± 2.63 mmol/L, PR platelets = 11.61 ± 2.33 mmol/L, P = 0.0011) as measured on day five, which could contribute to the lower pH seen in PR platelets than in conventional platelets.
Conclusion: Pathogen reduction affected the quality and metabolism of platelets. However, the quality parameters of PR platelets were within the ranges defined by AABB standards.
BBC77
Use of Dual‐Test (DT) Algorithm for Human T‐Lymphotropic Virus in Discordant Results between Screening and Western Blot. Is It Suitable to be Implemented in Blood Donors from Endemic Regions?
Silvano Wendel*, Roberta Fachini, Patricia Araujo Carminato and Carlos Vinicius Velasquez
Hospital Sirio Libanes Blood Bank
Background/Case Studies: HTLV‐1/2 infection is endemic in our country and testing blood donors for these viruses is mandatory since 1993. From the initial detection and isolation of HTLV‐1, HTLV research has been expanded and led to the development of more sensitive and specific methods of anti‐HTLV‐1/2 antibody detection. Our legislation requires HTLV antibody detection and recommends supplemental assays (like Western blot – WB) in reactive cases. In our experience, there is one HTLV‐1/2 indeterminate (ind) WB out of six HTLV reactive screened donations. Unfortunately, the reasons for these indeterminate patterns remain unclear. A recent study proposes the use of dual‐test in HTLV algorithm in US blood donors to reduce the amount of testing and the number of deferred donors (Transfusion. 2018;58:638‐40). We were concerned that this algorithm might not be applicable in endemic countries.
Study Design/Method: From Jan 12 to Nov 16 a total of 308,527 blood donations were initially screened for anti‐HTLV‐1/2 by chemiluminescent immunoassay (CMIA), where 593 (0.19%) samples were repeatedly reactive for HTLV‐1/2 for CMIA. A total of 456 (76.9%) samples were also tested by WB (INNO‐LIA, Innogenetics). In order to evaluate dual‐test (DT) for HTLV‐1/2, samples were randomly selected and retested with another test (electrochemiluminescent immunoassay ‐ ECLIA).
Results/Finding: Among the HTLV reactive samples, 67/456 (14.7%) samples were CMIA+/WB+, 311/456 (68.2%) CMIA+/WB‐ and 78/456 (17.1%) CMIA+/WB ind. We randomly selected 50/67 CMIA+/WB+, 50/311 CMIA+/WB‐ and all 78 CMIA+/WB ind samples, which were tested by ECLIA: all CMIA+/WB + (n=50) and CMIA+/WB‐ (n=50) samples were reactive and non‐reactive, respectively, for ECLIA. However, only 6/78 CMIA+/WB ind (7.7%) samples were reactive for ECLIA. Subsequent WB analysis in the 6 CMIA+/ECLIA+/WB ind samples showed reactivity only for gp21 in 5 samples and the other only for gp46. For the remaining 72 samples ECLIA‐, one was reactive for both p19 and p24; one only for p24; 54 only for gp21 and 16 samples for gp46 only.
Conclusion: The discordant results observed in DT HTLV CMIA/ECLIA, associated with WB‐/ind pattern in the presence of env and/or gag proteins might be related to the seroconversion period as described in some cases with the presence of HTLV RNA (J.Clin.Microbiol.2001;39:1247–53), rendering at the moment some concern in using the proposed DT HTLV CMIA/ECLIA algorithm, especially in endemic countries. Unfortunately these samples were not tested by PCR yet or subsequent samples were not tested/available, in order to confirm/rule out a window period. It is possible that epidemiologic differences can explain the WB ind donors in our country, when compared with US, which needs further evaluation. However, in HTLV endemic countries, we consider still premature to adopt DT HTLV algorithm without an in‐depth population study to solve unclear questions at this moment.
BBC78
Determination of Band Patterns in Donations for Hepatitis C Virus from Different Geographical Areas of a South American Country
Claudia Ramirez*1, Celia Alvarado2, Iris Coronell3, Claudia Santa4, Carolina Ojeda5, Ayda Rodriguez6, Karen Granados5, Diana Rodriguez7 and Michel Garcia8
1National Blood Bank, Colombian Red Cross, 2Cruz Roja Colombiana seccional Antioquia, 3Banco de Sangre, Cruz Roja Colombiana seccional Bolívar, 4Hemocentro del Café y Tolima Grande, Cruz Roja Colombiana seccional Caldas, 5Hemocentro, Cruz Roja Colombiana seccional Valle, 6Banco de Sangre, Cruz Roja Colombiana, Bogotá, 7Banco de Sangre, Cruz Roja Colombiana seccional Quindío, 8Universidad Del Rosario
Background/Case Studies: Previously an unusually high number of blood donors reactive for HCV test by chemiluminescence and confirmed indetermined by immunoblot was described in the capital city of a South American country. The objective of this work was to expand the identification of the most frequent patterns of bands detected by immunoblot, both in indeterminate and positive donors in different regions of that country.
Study Design/Method: Between 2015 and 2017, 1,206 blood donors had chemiluminescence readings greater than 1.0 S/CO = signal‐to‐cutoff. (ARCHITECT i1000/i2000SR). All samples were analyzed by HCV Blot 3.0 test (MP Diagnostics REF: 11130‐036) to confirm infection. The results of confirmatory tests were consolidated into three categories: negative, indeterminate and positive according to the manufacturer's instructions. Chi square test or unpaired t was performed for comparison between groups.
Results/Finding: In the study period 375,400 units of whole blood were collected corresponding to 16% of the national collection in the country. The seroreactivity obtained was 0.32% ± 0.09, with the southern Andean zone being the one with the highest prevalence (0.41%) and the Caribbean area with the lowest (0.16%). Although all banks are located in different regions, it was found that in those confirmed indetermined reactive donors (n = 295), the NS3‐2 band was the most prevalent. However, a statistically significant difference was found in the prevalence of this band in the Caribbean (91.7%) and pacific (84.6%) regions, compared to other areas of the country (72.3%) p < 0.05. It is important to note that donations from the Caribbean region were absent for NS3‐1, NS3‐2 and NS5 bands, table. On the other hand, 172 donations were confirmed positive, and in all the regions of the country analyzed, core band was the most prevalent (53.9%). Finally, it was found that the least frequent band in the group of positive donations was NS5; in the North and Pacific Andean regions two band patterns were presented which were NS3‐1 and NS5. It is noteworthy that the Caribbean region presented a specific pattern with four bands (NS3‐1, NS3‐2, NS4 and NS5).
(BBC78)
| Core | NS3‐1 | NS3‐2 | NS4 | NS5 | ||||||
|---|---|---|---|---|---|---|---|---|---|---|
| Region | ID* | Positive | ID | Positive | ID | Positive | ID | Positive | ID | Positive |
| Andean‐north | 5 | 22 | 9 | 8 | 45 | 8 | 6 | 10 | 1 | 2 |
| Andean‐orient | 10 | 46 | 11 | 10 | 53 | 13 | 3 | 10 | 1 | 5 |
| Caribbean | 1 | 5 | 0 | 2 | 11 | 2 | 0 | 2 | 0 | 2 |
| Andean‐north | 7 | 32 | 4 | 4 | 48 | 5 | 4 | 6 | 0 | 4 |
| Pacific | 2 | 35 | 6 | 5 | 55 | 9 | 0 | 6 | 2 | 5 |
| Andean‐south | 0 | 11 | 1 | 3 | 10 | 4 | 1 | 3 | 1 | 1 |
| National | 25 | 151 | 31 | 32 | 222 | 41 | 14 | 37 | 5 | 19 |
ID = indeterminated
Conclusion: The Caribbean region has a different HCV reactivity and positivity in comparison with the rest of the country. The foregoing suggests having this information present to implement antigenic variants according to the geographic location for the screening tests used. Although all banks are located in different regions, it was found that in those confirmed indetermined reactive donors, the NS3‐2 band was the most prevalent.
BBC79
Does Donor Gender Affect Red Cell Quality Following Rejuvenation?
Alan D. Gray*1 and Matt Landrigan2
1Citra Labs, LLC, a Zimmer Biomet Company, 2Zimmer Biomet
Background/Case Studies: Concerns persist whether Red Blood Cell (RBC) “storage lesion”, donor age/gender, processing methods, and frequency of donation may impact the in vitro quality of the RBC and negatively affect transfusion quality and safety.[1],[2] RBC rejuvenation was shown to reverse many physical and biochemical changes.[3] This retrospective analysis was to determine whether gender impacts the in vitro quality measures of RBC stored for 42 days, rejuvenated, and washed (intended for immediate transfusion).
Study Design/Method: Leukocyte‐reduced CPD/AS‐1 (AS‐1, n=67) or CP2D/AS‐3 (AS‐3, n=68) components were prepared from 530‐550 mL of whole blood donated by healthy adults (age 18‐64, n=80 males and n=55 females) at 2 US sites between 2014‐15. After 42 days storage at 1 to 6°C, units were treated with rejuvesol ® Solution (Citra Labs, LLC, 50 mL), incubated at 37°C × 60 minutes, washed with 2 L of 0.9% sodium chloride, 0.2% dextrose solution using the COBE 2991 Cell Processor (Terumo) and stored at 1‐6°C for 24 hours. Funds and materials for this study provided by Zimmer Biomet.
Results/Finding: In vitro quality measures for female donors (F) and male donors (M) are reported on the day of collection (D‐0), after 42 days of storage (D‐42), after rejuvenation and washing (PW), and after storage for 24 hours (24Hr) (Table 1). In vitro % recovery was > 97.5% for all units. No significant difference (p>0.05) was observed in ATP and 2,3‐DPG on D‐0, D‐42, PW, and 24hr. Hemolysis was maintained < 1% through 24hr; however, M collected in AS‐1 (D‐0) or stored in AS‐3 (D‐42, PW, and 24hr) exhibited significantly higher % hemolysis.
Conclusion: RBC rejuvenation provides a beneficial blood component whether RBCs were obtained from F or M as indicated by the in vitro quality measures evaluated. Although maintained below < 1%, RBC obtained from M exhibited slightly higher % hemolysis levels when stored in AS‐3 when compared to RBC from F. Further analysis relative to the age of the donor is needed.
TABLE 1 (BBC79) In Vitro Quality Measures (Average ± SD)
| Measure | Sample | AS‐1 | AS‐3 | ||||
|---|---|---|---|---|---|---|---|
| F | M | p | F | M | p | ||
| n= | 31 | 36 | 24 | 44 | |||
| Recovery (%) | PW | 98.6 ± .5 | 98.8 ± .4 | .053 | 99.8 ± .2 | 99.7 ± .2 | .02 |
| Hemolysis (%) | D‐0 | .06 ± .02 | .08 ± .03 | .01 | .03 ± .01 | .04 ± .04 | .08 |
| D‐42 | .34 ± .15 | .37 ± .13 | .37 | .14 ± .05 | .19 ± .1 | .02 | |
| PW | .16 ± .05 | .18 ± .05 | .15 | .07 ± .03 | .09 ± .04 | .02 | |
| 24hr | .44 ± .18 | .47 ± .16 | .40 | .28 ± .11 | .4 ± .18 | .003 | |
| 24hr Spun* | .11 ± .05 | .11 ± .05 | .81 | .06 ± .03 | .08 ± .04 | .01 | |
| ATP (µmol/g Hb) | D‐0 | 4.2 ± .6 | 4.4 ± .8 | .29 | 4.1 ± .7 | 4.1 ± .6 | .95 |
| D‐42 | 2.8 ± .5 | 3.0 ± .8 | .19 | 3.0 ± .5 | 3.0 ± .5 | .07 | |
| PW | 8.0 ± .8 | 7.8 ± .8 | .16 | 8.9 ± 1.1 | 8.4 ± 1.1 | .09 | |
| 24hr | 7.5 ± .8 | 7.4 ± .8 | .07 | 8.4 ± 1.1 | 7.9 ± 1.0 | .06 | |
| 2,3‐DPG (µmol/g Hb) | D‐0 | 14 ± 1.8 | 13.1 ± 2.4 | .11 | 13 ± 1.3 | 12.4 ± 1.9 | .17 |
| D‐42 | .5 ± .3 | .6 ± .4 | .8 | .2 ± .4 | .2 ± .3 | .8 | |
| PW | 12.3 ± 2.7 | 12.8 ± 2.9 | .4 | 12.3 ± 2.7 | 11.7 ± 2.3 | .4 | |
| 24hr | 12.8 ± 2.6 | 13.3 ± 2.8 | .4 | 12.7 ± 3.1 | 12 ± 2.4 | .3 | |
Conc. by centrifugation
[1] Klein H, et al ; NEJM (editorial) 373;3 p 283, July 16, 2015
[2] Kanis T, et al; TRANSFUSION 56;2571–2583, 2016
[3] D'Alessandro A, et al; TRANSFUSION 57;1019–1030, 2017
BBC80
Evaluating Red Cell Concentrate Hemolysis for Large‐Scale Production Using Statistical Modeling and Predictive Analytics
Eric Ducas*, Patricia Landry, Marie‐Joëlle De Grandmont, Antoine Lewin and Danny Brouard
Héma‐Québec
Background/Case Studies: The Reveos automated system (TerumoBCT) can process whole blood (WB) units into two or three components, namely plasma, red cell concentrate (RCC) and interim platelet unit (IPU). The initial Reveos process validation was done using the 3C blood collection set, and there were concerns related to RCC hemolysis at the end of storage and the requirement to comply with the CSA standard (<0.8% in 95% of tested units1). As the new LR blood collection set was made available, an experiment was specifically designed to evaluate RCC hemolysis as a quality criterion for a large‐scale production forecast that is based on a smaller sample size, using predictive analytics and statistical modeling. in vitro quality criteria for all generated products were also monitored.
Study Design/Method: Reveos LR blood collection sets were used to collect WB (V=450 mL). Within 8‐12h (fresh, 3C‐1 protocol, n=73) or 16‐24 h (overnight, 3C‐2 protocol, n=73) of collection time, WB units were processed. RCC hemolysis was measured at d1, d35 and d42, following standardized quality control (QC) procedures. Data were analyzed, log‐transformed and modeled to fit normal distributions, and they were further processed using Monte Carlo simulations to calculate expected conformity rates for RCC hemolysis at the end of storage, considering a 25 000 RCC/year production target. The same approach was applied to RCC hemolysis rates obtained from the previous Reveos 3C validation (Reveos 3C; n=75 for each of 3C‐1 and 3C‐2 protocols), and results were compared. Moreover, in vitro quality parameters for plasma and platelet concentrates (PC) (i.e. platelet yield, pH, residual leukocytes, FVIII, etc.) were tested and compared.
Results/Finding: The average hemolysis for Reveos LR RCC on d42 were 0.3 ± 0.2% and 0.3 ± 0.1% for the 3C‐1 and 3C‐2 protocols, respectively. After Monte Carlo simulations were applied to the data, compliance rates of 98.8% (3C‐1) and 98.1% (3C‐2) were expected based on a yearly production of 25 000 RCC. The same statistical approach was applied to the Reveos 3C validation study results (0.4 ± 0.2% hemolysis for each protocol), and expected compliance rates for RCC hemolysis were calculated at 95.9% (3C‐1) and 95.7% (3C‐2). As for Reveos LR plasma and PC, results were all within the CSA acceptable ranges1.
Conclusion: Designed experiments with small sample sizes, combined with statistical modeling and predictive analytics, can be a strategic tool for blood centers to foresee performance outcomes following process changes or new technology implementations.
1 Canadian Standards Association CAN/CSA‐Z902‐15. A National Standard of Canada. Blood and Blood Components.: CSA 2015.
BBC81
Development of a Rapid Recombinase‐Aided Amplification Assay for Testing Disinfection Efficacy of Pathogenic Bacteria in Blood Establishment
Liwei Zhu1,2, Yongjun Wang1,2, Xiaofan Zheng*1,2, Feng Chen1, Huaping Zhou1,2, Faming Zhu1,2 and Wei Hu1,2
1Blood Center of Zhejiang Province, 2Zhejiang Provincial Key Laboratory of Blood Safety Research
Background/Case Studies: Transmission of bacteria by transfusion remains a significant problem in transfusion medicine. Disinfection and cleaning of venipuncture site, hand, and surface were the key components to successful control the hygiene of blood bank, including cord blood bank. Besides bacterial enumeration, monitoring of bacterial pathogens should be performed to reduce the risk of transfusion‐associated septic, referring to Hygienic Standard for Disinfection in Hospitals of China (GB15982‐2012). Conventional methods, such as culture and biochemical methods were inconvenient because of the time and experience they require to identify the presence of pathogenic bacteria.The aim of this study was to develop an isothermal real‐time Recombinase‐Aided Amplification (RT‐RAA) assay to improving the efficiency of bacterial pathogen identification.
Study Design/Method: In this study, we designed specific primers and fluorescence probes in conserved region of four pathogenic bacteria (Staphylococcus aureus, Salmonella spp., hemolytic streptococcus, Pseudomonas aeruginosa) for RT‐RAA assay. DNA of the four baceria was isolated from aliquots of culture mediums with an efficient extraction method. The RAA reaction was conducted at a constant temperature of 37–39°C by simulating in vivo DNA recombination for 15 min. To evaluate the sensitivity of this method, each of the four pathogenic bacteria cultures of various concentrations from 1 × 10⁶ to 10 CFU/mL in inoculated surface samples was amplified and detected by RT‐RAA. Assay specificity was validated by using other 10 bacteria and 5 fungi. The performance of the RT‐RAA assay was further evaluated with skin and surface samples taken by sterile swabs during blood collection and production to obtain a microbiological profile of the manufacturing condition. All results were compared with culture and biochemical method as standard.
Results/Finding: Combined with fluorescent probes for real‐time detection, the RAA assay could reliably detect as few as 100 CFU/mL in pure culture of the four pathogenic bacteria at a constant temperature (37–39°C) within 15 min, up to 10‐fold more sensitive than that of conventional method. The assay was successfully used to amplify and detect DNA of samples taken from skin and surface, and was no cross‐reaction with other tested bacteria and fungi. Sixty samples (thirty skin samples and 30 surface samples) were respectively analyzed with conventional culture method and RT‐RAA assay. In 30 skin samples, two samples taken from hands of staff were detected for Staphylococcus aureus with RT‐ RAA assay, which were consistent with the conventional method.
Conclusion: The data presented in our study indicated that RT‐RAA can provide rapid, sensitive and specific detection of pathogen in skin and surface samples without prior isolation and characterization of the bacteria by conventional methods. The RT‐RAA assay can serve as an alternative tool to culture and biochemical method for the screening of pathogenic bacteria. The results obtained by the RT‐RAA and plate counts based on culture method showed that environment and skin surface in areas of blood collection and production is potentially contaminated with pathogen and could be a potential risk for the blood products.
Acknowledgment: This research was supported by Public Welfare Technology Application Research Project of Zhejiang Province (2017C33086)
BBC82
Syphilis and Sexual Transmitted Virus Coinfection in Colombian Blood Donors
Paula A. Gardeazabal*1, Maria I. Bermudez Forero1 and Michel Garcia1,2
1National Institute of Health, 2Universidad Del Rosario
Background/Case Studies: Syphilis is a bacterial infection caused by Treponema pallidum which could be transmitted by sexual contact, blood transfusion or during pregnancy from a mother to her fetus. Since 1985 in Colombia is mandatory the screening for T. pallidum in all blood donations. Several studies demonstrated that active syphilis infections potentiate transmission of HIV and is related to a higher probability of coinfection with other pathogens potentially transmitted by blood. The aim of this study was to identify syphilis coinfection with virus associated to sexual transmission in Colombian blood donations
Study Design/Method: A retrospective analysis of blood donations reactive for syphilis, HIV, HCV, HBV and HTLV collected from January 2015 to December 2016 by the 82 certified blood banks at the national level was made. The confirmatory test for HIV, HCV, and HTLV was immunoblot. The complementary test for HBV infection was HBsAg and anti‐HBc, or anti HBc IgM; syphilis infection was established by Venereal Disease Research Laboratory (VDRL) or Rapid Plasma Reagin (RPR) tests
Results/Finding: In the study period, 1.149.117 blood donations were screened, 71% of them were cataloged as first time events. 22,092 units were reactive to treponemal tests. However, only 5,568 of these donations had active infection (25.2%). The frequency of coinfection for other viral markers was 2.0% (table). According to this, it was calculated a T. pallidum seroprovelance of 345 per 100.000 donations. Syphilis constituted 66% of all registered coinfection cases, or one in 13.329 blood donations. 84% of syphilis coinfection donations came from male donors, in other words, prevalence ratio (PR) for men versus women was 3.47 (CI 95%: 1.97‐6.10), male prevalence was 7.15 × 100,000 donations vs. female prevalence 2.6 × 100,000 donations. On the other hand, 90% of syphilis reactive donations came from voluntary first‐time donations. This means that the PR was 59.4 (CI 9%: 7.8‐495) for first‐time (7.72 × 100,000) versus repetitive (0.13 × 100,000) donors.
| syphilis coinfection | Total positive (n) | % |
|---|---|---|
| HIV | 46 | 0.83 |
| HBV | 45 | 0.81 |
| HTLV | 18 | 0.32 |
| HCV | 4 | 0.07 |
Conclusion: Syphilis remains a public health problem due to high prevalence particularly in asymptomatic persons such as blood donors. Despite penicillin is an effective cure to syphilis, antibiotic‐resistant strains decrease effectiveness of treatment. Coinfections imply a challenge for health systems because it is complicated to detect in presence of other sexual transmitted infections (STI). Because in the country of study about three of four blood donations, come from “first time” donors, and in them the prevalence of infection with syphilis, is 59.4 times higher than in donations from repetitive donors, the permanence of screening for this infection is justified as a complementary strategy to reduce the risk of transfusion‐transmitted infections.
BBC83
Prevalence of Red Blood Cell Antibodies in Donors at 4 US Blood Centers
Matthew S. Karafin*1, Sylvia Tan2, Christopher A. Tormey3, Bryan R. Spencer4, Ronald G. Hauser3,5, Philip J. Norris6, Nareg Roubinian6, YanYun Wu3,7, Darrell Triulzi8, Steve Kleinman9, Jerome Gottschall10 and Jeanne Hendrickson3
1Blood Research Institute, BloodCenter of Wisconsin, 2RTI International, 3Yale University, 4American Red Cross, 5VA CT, 6Blood Systems Research Institute, 7BloodworksNW, 8The Institute for Transfusion Medicine, 9University of British Columbia, 10BloodCenter of Wisconsin
Background/Case Studies: There is a paucity of data regarding red blood cell (RBC) alloimmunization prevalence in healthy blood donors, despite the potential significance of these antibodies for the blood donors themselves, transfusion recipients, and the collection center.
Study Design/Method: Donor/donation data were sourced from 4 US blood centers from 2012‐2016. RBC antibody screen results (using tube, gel, or solid phase), blood type, donor demographics, transfusion history, and pregnancy history were evaluated. Bi‐ and multivariable logistic regression were used to assess if rates of positive antibody screen differed among subgroups.
Results/Finding: There were 632,378 unique blood donors who donated 2,030,855 units. A total of 10,450 donations (0.51%) were antibody screen positive during the study period. Of donors, 0.77% had a positive antibody screen at least once, including 3,154/317,566 (0.99%) females and 1,707/314,806 (0.54%) males. A positive RBC antibody screen was more common in older (60 + year old prevalence 1.43%) than in younger (20‐29 year old prevalence 0.41%) donors (p<0.0001), and in RhD negative (1.26%) than in RhD positive (0.67%) donors (p<0.0001). Prior transfusion history was strongly associated with having a positive RBC antibody screen (3.5% vs. 0.61% if no transfusion history; odds ratio 6.1 (95% confidence interval C.I. 5.6‐6.6), p<0.0001), as was prior pregnancy history among females (1.44% vs. 0.47% if no pregnancy history; odds ratio 3.1 (C.I. 2.8‐3.3), p<0.0001); similar amounts of missing data (11%) were observed for the prior transfusion and prior pregnancy questions. Following multivariable logistic regression analysis, age, sex, RhD status, prior transfusion history, and prior pregnancy history retained their significance of being independently associated with having a positive antibody screen (p<0.0001 for each), with missing data omitted for this analysis. Of clinically significant antibodies, the most common specificities included D (26.4%), E (23.8%), K (21.6%), C (7.1%), Fya (5.5%), c (4.7%), and Jka (4.1%). In females, 46.9% of clinically significant antibodies were detected in previously pregnant but never transfused donors, and 3.4% were detected in previously transfused but never pregnant donors.
Conclusion: Findings from this multi‐center database provide the largest donor cohort evaluated for RBC antibodies, and confirm that both transfusion and previous pregnancy are key risk factors. These data may have implications for the donors themselves regarding future RBC transfusions and pregnancies. Since RBCs and/or components made from donations of these antibody positive donors may not be suitable for transfusion, these data also have implications for blood centers at the operational level.
BBC84
Magnitude of Subsequent Blood Collections from Teenaged First Time Donors
Richard B. Pippin*, John B. Armitage, Tuan N. Le, Michael E. Stevenson, Kwang Lee and Pam Kelly
Oklahoma Blood Institute
Background/Case Studies: Collections from teenage donors comprise a large fraction (∼20%) of the US blood supply, so any regulatory, operational or administrative impact on this cohort deserves careful assessment. Less appreciated are the subsequent contributions of this group as it ages. Understanding the size of this “residual” draw is also important for any policy or practice change that might deflect the incoming stream of young donors. Quantifying this residual draw has amplified operational and financial significance because it is more difficult and expensive to initially recruit older individuals to replace high school, first time donors (FTDs).
Study Design/Method: Donor data was collected from a central US regional blood center's computer records. Data included ID, sex, dates, locations, products, and deferral codes. Allogeneic donors from 2007‐2017 who gave units for the first time when aged 16‐19 years were included. High school sourced collections for 2017 were deemed to include all units given by current 16‐19 YOs. This includes 16 YO FTDs from 2014‐2017 cohorts, 17 YO FTDs from 2015‐17, etc. Due to substantial growth of total collections over the last decade (from 238,589 to 275,544), average annual draw over the period (248,847) provided an adjustment for smaller FTD recruitment cohorts in earlier years.
Results/Finding: In 2017, a total of 63,790 successful donation events were recorded from donors who gave for the first time as 16‐19 YOs from 2007‐2017. Donations from those of high school age in that year totaled 46,590. Donors who were 20 YO and above who had persisted in their giving behavior to provide 17,200 collections. The unadjusted “residual” donations from ≥ 20 YOs represented 6% (17,200/275,544) of the blood center's 2017 total. Adjusted for collection growth, residual donations comprised 7% (17,200/248,847). Except in 2012, each assessable FTD cohort year that was comprised wholly ≥ 20 YOs (2008‐2013) showed increasing residual draws, year‐over‐year. This is an expected effect of the rising impacts over time of lapsing behavior, disqualifying deferrals, and geographic out‐migration.
Conclusion: High school aged FTDs continue to supply a significant fraction of the blood supply as they age into their twenties. Our analysis of 7% is clearly an underestimate because a full decade of follow‐up is only shown for 2007's 19 YO FTDs. Likewise, because 16 YO donation only began in 2010, their residual contributions are truncated. Better modeling of these residual collections to include product type is needed to understand latent inventory impacts from regulatory and other disruptions to the intake and retention of new, teenage donors.
Donations in 2017 by Prior Annual Cohorts of Teenaged First Time Donors
| Initial Donation Year | 16 YO | 17 YO | 18 YO | 19 YO | 16‐19 YO Totals |
|---|---|---|---|---|---|
| 2007 | N/A | 846 | 380 | 163 | 1389 |
| 2008 | N/A | 946 | 321 | 141 | 1408 |
| 2009 | N/A | 994 | 361 | 125 | 1480 |
| 2010 | 171 | 1074 | 414 | 214 | 1873 |
| 2011 | 872 | 856 | 433 | 254 | 2415 |
| 2012 | 869 | 683 | 422 | 251 | 2225 |
| 2013 | 1174 | 595 | 459 | 270 | 2498 |
| 2014 | 1997* | 771 | 690 | 347 | 3805 |
| 2015 | 3847a | 1235a | 812 | 456 | 6350 |
| 2016 | 7044a | 3158a | 1798a | 836 | 12836 |
| 2017 | 9580a | 7923a | 6363a | 3645a | 27511 |
| Totals by FTD Age | 25554 | 19081 | 12453 | 6702 | 63790 |
Presumed high school donations in 2017 (Total = 46590)
BBC85
Technical Approaches for Measuring Red Cell Concentrate Hemolysis Rate: A Comparative Study
Marie‐Joëlle De Grandmont*, Marie‐Josée Fournier and Danny Brouard
Héma‐Québec
Background/Case Studies: The hemolysis rate at the end of storage represents an important quality marker for red cell concentrates (RCC). Most regulatory agencies have established clear standards for RCC hemolysis at the end of storage; however, there is no recommendation for a specific methodology regarding supernatant hemoglobin (Hb) measurements.1 In a recent study, significant differences were observed for RCC hemolysis rates depending on the analytical approach that was used. The aim of this study was to compare RCC hemolysis results obtained with different methods.
Study Design/Method: In the first part of the study, SAGM‐RCC (n=42) were stored for 42 days before proceeding to supernatant Hb measurement under three conditions. For Series 1, a CBC was performed with a hematology analyzer (Beckman Coulter Ac‐T™5diff) on RCC samples prior to centrifugation (1430xg, 25 min). Sample tubes from Series 2 were centrifuged as for Series 1, but CBC measurements were omitted. For Series 3, samples were subjected to hard spin conditions for a shorter time (5000xg, 7 min). For each Series, supernatants were filtered (0.22 µm) and Hb was measured using the HemoCue Plasma/Low Hb system, following the manufacturer's recommendations. In the second part of the study, supernatants were obtained from RCC (n=16) and blood samples (n=5), as mentioned for Series 2. Then, the Harboe method (UV‐vis wavelengths were 415, 380 and 450 nm, 1‐cm optical path length) and the HemoCue system were both used to measure free Hb and calculate hemolysis rates.
Results/Finding: The average Hb value calculated for Series 1 (0.24 ± 0.16 g/dL) was slightly higher than Series 2 (0.18 ± 0.12 g/dL) and Series 3 (0.18 ± 0.13 g/dL). As a result, average hemolysis for Series 1 was 0.58 ± 0.39%, compared to 0.43 ± 0.29% and 0.45 ± 0.31% for Series 2 and 3, respectively. More importantly, only 81% of Series 1 RCC would have met Canadian standards for end‐storage hemolysis ( < 0.8%), compared to 93% for Series 2 and Series 3. For the Harboe vs. HemoCue study, Hb average values were 0.17 ± 0.15 g/dL and 0.22 ± 0.18 g/dL, respectively. From these measurements, the average hemolysis with HemoCue was 27% higher than Harboe for the same samples.
Conclusion: The results suggest that the use of two separate tubes would be recommended to avoid an unfavorable bias in hemolysis calculations. The Harboe ‐ Hemocue PLHb comparative study suggests that there is no significant evidence that the user‐friendly Hemocue system, calibrated using the International Council for the Standardization in Hematology reference method, would not be an appropriate measurement method for free hemoglobin.
BBC86
Distribution of Hepatitis A Antibodies in United States Blood Donors
Alexandra Tejada‐Strop1, Mohammad Zafrullah1, Saleem Kamili1, Susan L. Stramer2 and Michael Purdy*1
1CDC, 2American Red Cross
Background/Case Studies: Recently, there has been an increase in the number of hepatitis A outbreaks in the United States. Although the presence of HAV RNA in blood donors is known to be very low, HAV antibody prevalence in this population is unknown.
Study Design/Method: Samples from 5001 US blood donors collected primarily in the Midwestern US in 2015 were tested for the presence of HAV IgG and IgM antibodies using chemiluminescent microparticles immunoassays on the Architect platform (Abbott Laboratories).
Results/Finding: The overall prevalence of anti‐HAV IgG was 60%. Previous studies using samples collected as part of the National Health and Nutrition Examination Survey (NHANES) showed a decrease in prevalence from 33% to 24% (1988 to 2012); however, NHANES includes individuals ≥5 years of age and older. Only one specimen was anti‐HAV IgM positive (and confirmed) for a prevalence of 0.02%. This specimen was HAV RNA negative. Anti‐HAV IgG prevalence among donors 16 to 19 years was 67%, dropped to 54% among donors aged 40 to 49 years and increased to 70% among donors aged 80 to 93 years. The high prevalence among 16 to 19 year olds is likely due to infant vaccination recommendations initiated in 1999. No difference was seen by sex with overall anti‐HAV IgG prevalence of 61% and 60% for males and females, respectively. Among the five states with the highest number of donors only anti‐HAV IgG prevalence in Missouri (65%) was significantly higher than the prevalence in Illinois (52%) and Kentucky (59%) (P < 0.01). No difference was seen in anti‐HAV IgG prevalence among individuals who previously tested positive for either anti‐HEV IgM or IgG, indicating no correlation between anti‐HAV IgG status and anti‐HEV antibody status.
Conclusion: This study demonstrates the overall high rates of anti‐HAV IgG in US blood donors and the low risk of HAV transfusion transmission. The low risk is further supported by the HAV vaccination policies developed since 1999.
BBC87
Defining the Rarest of the Rare Blood Requests to the American Rare Donor Program: Unfilled Requests from 2017
Deborah R. Fludd*1, Joan L. Maurer2, Margaret A. Keller3, Dexter Facey1 and Sandra J. Nance4
1American Rare Donor Program and American Red Cross, 2ARDP, 3American Red Cross ‐ National Molecular Laboratory, 4American Red Cross and American Rare Donor Program
Background/Case Studies: It is a goal for the staff of the American Rare Donor Program (ARDP) to ensure that all requests for rare blood from the 90 ARDP members are filled. It is important to know about requests for rare blood that were not filled. Each unfilled request for rare blood may delay a patient's treatment or may result in continued low hemoglobin which may put the patient at risk. The process is that the ARDP members request rare units. ARDP staff sends two faxes to ARDP members with registered rare donors of the type requested. If not completely successful in finding units, an email requesting recruitment is sent to domestic ARDP members with registered donors. If the request is still unfilled, the next step would be a consultation with the facility and the ARDP's Medical Directors. Finally, after meeting the FDA IND requirements for an international request (patient and physician permissions, autologous donation not possible, no or insufficient eligible siblings, and MMA results), a request is made to the WHO International Rare Donor Panel.
Study Design/Method: A review of the unfilled requests from 2017 was performed. Evaluation criteria included phenotype, ABO/Rh, number of units requested and the patient's diagnosis.
Results/Finding: In researching both the requests and responses, there were 24 unfilled requests of 787 total requests 2017 (3%). The diagnosis in 11 of the patients was sickle cell disease (SCD), 14 were for phenotypes more prevalent in donors of African descent. The number of units requested ranged from 1‐6 units with an average of 2 per order. Of the 24 unfilled requests, 2 were cancelled within an average of 2 days. Fourteen of 24 requests (57%) were for O positive units. Five of the requests were for RH allele‐matched units and 2 were for IgA‐deficient plasma. Five (20.8%) of the 24 unfilled orders were for units negative for multiple antigens and thirteen (54%) for antigens of very high prevalence.
Conclusion: The ARDP members collaborate very effectively in filling request for rare blood with a 97% fill rate, but 3% (24 requests) were not filled in 2017. Monitoring unfilled requests is important to determine the reasons these requests remained unfilled and the patient population that is impacted. The data collected indicated that 41.7 % of unfilled requests were for patients with SCD. The majority (87.5 %) of these requests were associated with cancelled orders or patients being discharged without transfusion. The impact of the lack of transfusion to the patients' lives are unknown. These findings prompted the ARDP to take action to develop and implement an outcome form to collect information regarding the impact of unfilled orders.
BBC88
Should Blood Banks Return to Nontreponemal Testing (NT)?
David Binks1 and Louis M. Katz*2
1Arlington Scientific, Inc., 2Americas Blood Centers
Background/Case Studies: Treponemal tests (T) remain positive for life after treatment of syphilis (S) and during late S that is not transfusion transmissible. NT revert to negative with successful treatment and in many late infections. With the need for approximately 32,000 units of blood each day in the USA and less than 10% of the population donating, unnecessary deferral of donors due to persisting reactivity from remote S who are noninfectious, identified by T followed by NT (the “reverse algorithm”) needs to be reassessed. This reverse algorithm replaced the traditional diagnostic algorithm (NT testing confirmed by T) in transfusion medicine after automation of only T. With the introduction of an automated NT method, the use of the traditional algorithm can be evaluated as the preferred method of screening blood donors to reduce deferrals from individuals that have had S in the past but are no longer infectious.
Study Design/Method: 3757 serum and plasma specimens with concordant T and NT results were tested with the ASI Evolution Automated RPR Analyzer using ASI RPR Carbon Antigen. Samples were sourced from blood banks and plasma centers. Samples also included 250 nonreactive S specimens and 30 reactive S specimens from pregnant women, and 143 clinically diagnosed reactive specimens, both treated and untreated, from public health departments and tested by RPR and T to establish expected results. The reactive samples ranged in reactivity from minimal 1:1 titers to 1:64 titers by RPR. The ages of the patients ranged in age from 15 to 72 years old and included both male and female.
Results/Finding: Of the 3757 specimens, 1629 were reactive and 2128 specimens were nonreactive by RPR. The ASI Evolution identified 1629 of the 1629 reactive specimens as reactive and 2128 of the 2128 nonreactive specimens as nonreactive. There was a 100% positive agreement with a 95%CI of 98.77 – 100% and 100% negative agreement with a 95% CI of 99.83 – 100%.
Conclusion: For years NT was the standard for screening blood donors. NT was displaced by automated T. With the availability of an automated NT analyzer and the data presented, NT testing should be reevaluated as the primary donor screening test to decrease deferral rates due to noninfectious S with persistently reactive T.
BBC89
Use of CD34 + Cell Count in a Reference Blood Bank as External Quality Assessment of a Regional Flow Cytometry Unit
Marc Sorigué*1, Cristian Morales‐Indiano2, Eva Alonso3, Marta Peña4, Sara Vergara5, Minerva Raya5, Rosa Linio3, Laura Medina6, Carme Azqueta6, Jordi Juncà1, Sergi Querol6 and Joan Ramon Grifols3
1Hematology Laboratory, ICO‐Badalona, Hospital Germans Trias i Pujol, Institut de Recerca Josep Carreras, Universitat Autònoma de Barcelona, 2Clinical Laboratory ICS‐Metropolitana Nord, Core‐Hematology Department, Hospital Germans Trias i Pujol, 3Banc de Sang i Teixits, Hospital Germans Trias i Pujol, 4Institut Català d'Oncologia, Hospital Germans Trias i Pujol, 5Hematology Laboratory ICS, Hospital Germans Trias i Pujol, 6Banc de Sang i Teixits, Cellular Processing Area, Barcelona
Background/Case Studies: Our flow cytometry unit determines peripheral blood CD34 + cell count before hematopoietic progenitor cell‐apheresis (HPC‐A). When pre‐apheresis CD34 + cell count is > 5 cells/µL the procedure is started. This same pre‐apheresis sample is analyzed afterwards in the stem cell processing laboratory. Although we have used the UKNEQAS CD34 + stem cell enumeration programme as external quality assessment in the past, we set out to assess the correlation between the CD34 + cell count obtained in our flow cytometry unit and that obtained in the processing laboratory in order to replace the current external quality assessment as a cost‐saving measure, particularly given that the processing laboratory also subscribes to the UKNEQAS CD34 + stem cell enumeration programme.
Study Design/Method: We retrospectively analyzed the correlation between the CD34 + cell count obtained in our unit and the stem cell processing laboratory from January 2017 until April 2018. The flow cytometer, antibodies and erythrocyte lysis solution used in our unit are: FC500 with CXP software, anti‐CD45‐FITC (clone J33) / anti‐CD34 PE (clone 581), all from Beckman Coulter, and PharmLyse (Becton‐Dickinson). The flow cytometer, antibodies and erythrocyte lysis solution used in the stem cell processing laboratory are: FACSCalibur with Cellquest software (Becton‐Dickinson), anti‐CD45‐FITC (clone J33) / anti‐CD34 PE (clone 8G12), from Beckman‐Coulter / 7‐AADD (Becton‐Dikinson) and QuicklysisTM. For absolute cell count, out unit uses Flow Count Fluorospheres (Beckman‐Coulter) and the processing laboratory Perfect Count Microspheres (Cytognos). The passing‐bablok regression was used to compare the two laboratories and a Bland‐Altman plot was used to assess the agreement between them. Finally, Spearman's rank correlation coefficient was used to determine the correlation between the results obtained in our flow cytometry unit and in the stem cell processing laboratory.
Results/Finding: The Passing‐Bablok regression did not show a deviation from linearity between the two laboratories (y=‐1,05 + 0,86x; p=0,44) and the Bland‐Altman analysis did not show a bias in CD34 + cell count. Spearman's correlation coefficient was 0.951 (95% confidence interval: 0.916 – 0.972, p<0.001). There was only one patient with a CD34 + cell count < 5 cells/µL and this result was obtained in both laboratories.
Conclusion: The correlation between the two laboratories in determining CD34 + cell count was very good. We plan on carrying out this 0‐cost correlation yearly as external quality assessment.
BBC90
Reported Donor Vigilance of Taiwan in 2016‐2017
Hui‐Chen Chen*, Kuo‐Wei Ho, Dong‐Tsamn Lin and Sheng‐Mou Hou
Head Office, Taiwan Blood Services Foundation
Background/Case Studies: Donor vigilance is the systematic monitoring of adverse events (AEs) in blood donor care with a view to improving quality and safety for blood donors. To understand the donor AEs in Taiwan and provide basis to improve blood donation process and donor care procedures, this report was generated with comprehensive analysis of 2016‐2017 blood donation data based on the “Standard for surveillance of complications related to blood donation” issued by ISBT, IHN and AABB working groups in December 2014.
Study Design/Method: Donor AEs were analyzed and compared in 2016 and 2017, including donation patterns, age, gender, estimated blood volume (EBV) and relative blood volume (RBV). Reaction rates were calculated as reactions per 10,000 donations unless stated. Citrate reaction, hemolysis, air embolism and infiltration were calculated for platelet apheresis collections only.
Results/Finding: There were 1,763,008 and 1,752,524 donations in 2016 and 2017, respectively. The overall reaction rates were 11.24 in 2016 and 11.82 in 2017. Four most common AEs were vasovagal reaction (VVR) (8.74/9.55), citrate reaction (2.90/0.97), infiltration (2.71/0.91) and hematoma (1.42/1.47). For whole blood donation, the first‐time donors contributed for 8.97% and 8.36% of the total donations in 2016 and 2017, but accounted for 24.48% and 26.56% of AEs as reaction rates of 26.19 and 34.15 (reaction rates were 7.96 and 8.61 for repeated donors). Donors aged 17‐20 years accounted for 9.84% and 9.53% of total donations in 2016 and 2017 with reaction rates of 21.84 and 27.48, while donors aged 21 and older accounted for 90.16% and 90.47% of total donations in 2016 and 2017 with reaction rates of 9.12 and 9.37. The downtrend of overall reaction rates with donor age was apparent. Interestingly, reaction rates of AEs in donors aged 17‐20 and/or 21‐30 years were at least about 2‐3 times higher than 31‐40 years and/or older in both years. The reaction rate for the older age group (aged 21 and older) was comparatively stable over the observation period, while it varied widely for the youngest donors (17‐20 years). AEs in males were less than females, 9.78 vs. 11.28 in 2016 (p<0.05), 10.01 vs. 12.95 in 2017 (p<0.05). The reaction rate of VVR decreased with age for both males and females. VVR in females were higher than males, 10.00 vs. 8.05 (p<0.05) in 2016, 11.60 vs. 8.34 (p<0.05) in 2017. In 2016 and 2017, 9.65% and 5.92% of VVR were associated with loss of consciousness≧60 seconds and/or complications. Further analysis showed that VVR in females increased as RBV increased (RBV analysis was limited to whole blood donors).
Conclusion: This is the first comprehensive report of donor AEs in Taiwan. According to the findings, VVR is the most common adverse event. Young donors and/or first‐time donors were more likely to have AEs compared to older donors and/or repeated donors. Females had more AEs than males, especially in VVR. In 2017, prophylactic calcium tablets were provided to platelet apheresis donors unless they refused. In the meantime, regular monitoring of the needle puncture technique at each blood collection site was taken places. These efforts successfully decrease the reaction rate of citrate reaction (2.90 vs. 0.97, p<0.05) and infiltration (2.71 vs 0.91, p<0.05) in 2017. Recent evaluation showed that AEs would deter donors from donating again, especially when VVR happened. Taking measures to reduce the occurrence of VVR would be our next priority.
BBC91
Donor Factors and Blood Processing Methods May Contribute to Red Cell Hemolysis
Jason P. Acker1, Carley N. Gemelli2 and Denese C. Marks*2
1Centre for Innovation, Canadian Blood Services, 2Research and Development, Australian Red Cross Blood Service
Background/Case Studies: Donor factors such as age and sex have been shown to influence donor pre‐donation hemoglobin (Hb) levels, and have also been associated with hemolysis in stored red cell concentrates (RCCs). Female blood donors have lower pre‐donation Hb levels, and lower RCC hemolysis levels than male blood donors. However, the relationship between donor pre‐donation Hb and RCC hemolysis has not been previously investigated. The aim of this study was to examine how pre‐donation Hb influences the hemolysis levels in stored RCC characteristics in different donor groups. Exploration of data from two large national blood services was used to evaluate if donor screening practices may be affecting the quality characteristics of RCCs.
Study Design/Method: Hemolysis data collected during routine quality control testing (June 2008 to December 2017) at two large national blood services was merged with associated donor information (age, sex, pre‐donation Hb, frequency of donation) for each RCC unit tested. Both blood services measure donor Hb using the Fresenius Compolab system, and use similar methods (automated analyzer / HemoCue Low Plasma) for measuring hemolysis at expiry in leukoreduced, SAGM RCCs. The inter‐donation intervals at the two blood services were different; the Australian Red Cross Blood Service (ARCBS) has an 84 d interval and a lower Hb limit of 120 g/L for females and 130 g/L for males, whereas the Canadian Blood Services (CBS) had a 56 d interval and a lower limit of 125 g/L for both males and female donors. Regression analysis and analysis of group means was performed.
Results/Finding: Analysis of the merged dataset (n=46,433 donors/56,634 RCC) showed that donor age and sex influenced pre‐donation Hb levels. Male donors showed a significant decrease in pre‐donation Hb with age at time of donation (R2=0.48; p<0.01), which was significantly higher than female donors in every age group (p<0.001). Pre‐donation Hb levels for both male and female donors were markedly different between the two blood services. RCC hemolysis increased with donor age, with a marked difference between male and female donors of all ages. A significant difference in RCC hemolysis from male donors was observed between the two blood services, particularly for 40 – 60 year old male donors (ARCBS: 0.37 ± 0.01 % n=1782; CBS: 0.30 ± 0.01 % n=13306). With the exception of male donors at the ARCBS (R2=0.40, p<0.05), there was no relationship between donor Hb and RCC hemolysis.
Conclusion: Our data highlights the influence of donor characteristics on product quality characteristics. Differences in donor selection criteria amongst blood services can influence the population of donors eligible to donate and therefore characteristics of the products that are available for transfusion.
BBC92
User Guardband Study to Determine the Robustness of the Verax Platelet PGDprime® Test for Bacteria in Platelets
Lisa Shinefeld*, Nancy Best, Miranda Williams, Erica Boudreau, Adam Lousararian and Remo Vallejo
Verax Biomedical Inc.
Background/Case Studies: The PGDprime rapid test for bacteria in platelets was developed as an improvement of the PGD® test currently used as a Safety Measure for platelet transfusion. It was designed to provide a simpler test procedure compared to the current product. The robustness of the new test was challenged by deviating from the nominal test procedure to simulate potential errors by a user, and by varying environmental conditions.
Study Design/Method: The susceptibility of the test to loss of accuracy and validity was examined by testing negative and positive samples (created by spiking a 10‐member bacteria panel individually into platelets), running the test using measured decreases and increases from nominal values for sample and reagent volumes, incubation times, timing of liquid additions, and laboratory environmental conditions. Stacked guardband studies combined varying the volume of sample added to the reaction ±25%, the ratios of sample processing reagents, and the volume of sample added to the device. An environmental chamber was used to vary humidity conditions, and incubators were used to control temperature conditions.
TABLE: (BBC92) Guardband Study Results
| Testing Element | Guardband | Detection of 10‐bacteria panel | Effect on Negative Samples |
|---|---|---|---|
| Open test pouch | Use immediately or after 30 min | 10/10 | None |
| Reagent equilibration at room temperature | Use immediately from refrigerator or after 2 hours | 10/10 | None |
| Testing temperature | 2‐8°C | 10/10 | None |
| Room temperature | 10/10 | None | |
| 35‐39°C | 10/10 | None | |
| Relative Humidity | 10%, 50%, 90 % | 10/10 | None |
| Lab Air Flow | ≥ 100 ft/min across test device | 10/10 | None |
| ≥ 100 ft/min down onto device | 10/10 | None | |
| Stability of results | 30 ± 10 min from test initiation (nominal) | 10/10 | None |
| 60 min from test initiation | 10/10 | None | |
| Stability of sample | Run platelet aliquot immediately | 10/10 | None |
| Run platelet after 30, 60, 120, 240 min | 10/10 | None | |
| Sample volume | 120, 160, 200 µL | 10/10 | None |
| Drop count Reagents 1A, 1B, 2 | 4 drops, 6 drops (nominal), 8 drops | 10/10 | None |
| Stacked Reagent 1A, 1B, and 2 volume variations | Combination of high and low extremes of the 3 reagents | 10/10 | None |
| Reaction time, Reagent 1A | 10 seconds, 2 min (nominal), 5, 15, and 30 min | 10/10 | None |
| Stability of treated sample (after addition of Reagent 1B) | 5, 15, 30, 45 min | 10/10 | None |
| Addition of Reagent 2 | Immediately after sample addition | 10/10 | None |
| Sample front at 25% of window (nominal) | 10/10 | None | |
| Sample front at 50% of window | 10/10 | None | |
| Sample front at 75% of window | 10/10 | None | |
| Sample front reaches end of window | 10/10 | None |
Results/Finding: The PGDprime test yielded accurate results for both negative and positive samples throughout the guardbands tested.
Conclusion: The PGDprime rapid test is a robust assay that can withstand high levels of potential errors by users. The test can be used under a wide range of environmental conditions.
BBC93
In Vitro Modeling of Extended Sampling Diversion Shows Continuous Reduction in Bacterial Load Beyond Current Measures
Adrienne Karpiel* and Kyungyoon Min
Fresenius Kabi
Background/Case Studies: Bacterial contaminants residing within the epidermal layers or those resistant to current disinfection practice can be a source of contamination in collected whole blood and other blood components. Diversion of the first 10–40 mL of whole blood post‐venipuncture is now an established practice and an effective strategy in mitigating the incidence of skin flora related blood product contamination. Previous data suggest that additional sample diversion beyond current measures would further reduce bacterial load to the blood collection/separation system but this has not been extensively studied. This study sought to evaluate the bacterial content of blood fractions collected from a contaminated source (injection site) up to an additional 100 mL beyond today's practice (diversion volume of ∼30 mL) through use of a simple in vitro model system.
Study Design/Method: Model System Preparation ‐ A model diversion line, similar to that of Wagner et al (Transfusion 2000), was constructed using the inlet line from a double needle apheresis platelet collection kit (4R2355, Fresenius Kabi). Luer locks were added in place of the sample diversion pouch and at approx.10 cm past the second Y‐site. Test Article Preparation and Evaluation ‐ The injection site of a sterile bag containing whole blood (ACD‐A anticoagulant) was inoculated with a minimum of 5E7 CFU from an overnight S. epidermis culture. Upon drying, the needle from the model diversion line was inserted through the inoculated area. Aliquots of blood were taken via syringes from the luer positioned in place of the diversion pouch (3, 10 mL aliquots). After the 3rd sample, the line was sealed at the first Y‐site and aliquots were then drawn through the second luer (20, 5 mL aliquots). Bacteria concentration in each fraction was determined using the pour plate method, and the total CFU in each fraction calculated.
Results/Finding: Overall results for total CFU in each fraction show continued reduction of bacterial load with increasing volume collected/diverted (n=5). Data for the first 30 mL collected from the diversion line are consistent with those published by Wagner et al, showing that most bacteria are removed in the first fractions collected. Subsequent fractions show continued reduction of bacterial load resulting in an additional 1–3 log decrease from the initial 30 mL diversion.
Conclusion: This study illustrates that bacterial load reduction continues to occur past the standard diversion volume of 30 mL in our in vitro model diversion system. Further studies are required to evaluate the potential benefits of an extended diversion model in an online collection system, and its practical application and impact.
(BBC93)
| Total CFU (Volumeb) | Run # | ||||
|---|---|---|---|---|---|
| 1 | 2 | 3 | 4 | 5 | |
| Initial Sample Diversion [Link] (30 mL) | 1.19E+06 | 3.24E+06 | 7.26E+06 | 1.50E+07 | 1.93E+06 |
| Extended Diversion [Link] (100 mL) | 4.22E+04 | 5.95E+05 | 1.87E+05 | 3.60E+05 | 2.85E+05 |
| Final Fraction Collected (5 mL) | 9.41E+01 | 7.16E+03 | 8.92E+02 | 3.52E+02 | 8.29E+02 |
Volumes are approximate;
Sum total of CFUs in all Fractions.
BBC94
Bacterial Growth in Leukoreduced Red Cells during and Following a 3 Hour Temperature Excursion Towards Room Temperature
Stephen Wagner*, Cheryl Hapip and Lenora A. Abel
American Red Cross Holland Lab
Background/Case Studies: It is not uncommon that power interruptions occur at blood centers and hospitals during extreme weather events. When backup generators fail, refrigerated blood warms beyond 6˚C. This study evaluates the levels of several bacteria in refrigerated leukodepleted RBCs during and following a 3‐ hour temperature excursion towards room temperature.
Study Design/Method: Two ABO, Rh identical leukoreduced RBCs were prepared from whole blood collected from consenting donors (Fenwal, Round Lake). The units were pooled, mixed and inoculated on Day 7 with 10‐100 CFU/mL (for quantitative plate assay) of P. fluorescens, Y. enterocolita, S. marcescens, S. liquefaciens, E. coli and S. aureus. The pool was divided equally into two units and stored at 1‐6˚C. On Day 14 one of the two units (TEST) was placed on the laboratory bench (20‐24˚C) for 3 hours, surface temperature recorded, and then returned to 1‐6˚C storage. The other unit was maintained in refrigerated storage (control). Samples were taken for quantitative plate assay on Day 7, Day 14 pre‐excursion (pre), Day 14 post‐excursion (post), Day 28 and Day 42. Experiments were repeated 3 times per organism.
Results/Finding: At the end of the 3‐hour temperature excursion, the surface temperature of units were 18.7 ± 0.8˚C. Bacterial results are expressed as (CFU/mLTEST)/(CFU/mLCONTROL) in the table below. No significant differences were observed between the growth of test and control units during storage for P. fluorescens, E. coli and S. aureus. On Day 14 post excursion, the bacterial count in test units containing Y. enterocolitca declined approximately 4‐fold relative to control units; no differences were observed in other timepoints. For S. marcescens, significantly greater levels of bacteria (3.2‐ and 5.4‐fold) were observed in test units relative to those of controls on Days 28 and 42, respectively. Bacteria counts of S. liquefaciens that were subjected to the temperature excursion were 4.4‐fold greater than those post‐excursion of control units on Day 14, but this difference did not attain statistical significance.
Conclusion: A 3‐hour room temperature excursion in RBCs did not affect bacterial counts in P. fluorescens, E. coli and S. aureus, temporarily decreased the levels of Y. enterocolitica immediately following temperature excursion but enhanced the growth of S. marcescens during later storage.
(BBC94)
| (CFU/mL)TEST/(CFU/mL)CONTROL | |||||
|---|---|---|---|---|---|
| Organism | Day 7 | Day 14 pre | Day 14 post | Day 28 | Day 42 |
| P. fluorescens | 1.0 | 0.79 ± 0.40 | 0.69 ± 0.13 | 1.10 ± 0.19 | 0.86 ± 0.14 |
| Y. enterocolitica | 1.0 | 0.79 ± 0.11 | 0.025 ± 0.033 | 0.83 ± 0.01 | 0.76 ± 0.11 |
| S. marcescens | 1.0 | 1.27 ± 0.29 | 1.03 ± 0.43 | 3.19 ± 0.15 | 5.37 ± 0.43 |
| S. liquefaciens | 1.0 | 1.42 ± 0.15 | 4.38 ± 2.58 | 1.32 ± 0.29 | 1.19 ± 0.12 |
| E. coli | 1.0 | 0.94 ± 0.46 | 1.43 ± 0.43 | Not defined | Not defined |
| S. aureus | 1.0 | 1.31 ± 0.60 | 1.00 ± 0.17 | 0.51 ± 0.11 | 1.76 ± 0.89 |
Not defined because no organisms recovered
BBC95
Performance of a New Automated Alinity s Assay for HIV
Darwin Smith*1, Rebecca Haley2, Scott Jones3, Toby Simon4, Susan L. Stramer5, Susan S. Ganz6, Lynn Martin7 and Shaoqing Du8
1Abbott Diagnostics, 2Bloodworks Northwest, 3QualTex Laboratories, 4CSL Plasma Laboratory, 5American Red Cross, 6Biotest Pharmaceuticals, 7Abbott Laboratories, 8Abbott
Background/Case Studies: The introduction of 4th generation HIV combination assays improved the detection of acute HIV infections. These assays detect the presence of anti‐HIV‐1 and anti‐HIV‐2 antibodies along with HIV‐1 p24 antigen, and in blood screening, this reduces the risk of transfusion related HIV infection. This increased sensitivity coupled with high specificity minimizes donor deferrals and provides the public with a safer blood supply. In addition, continued pressures on laboratory operations demand that assays perform on platforms capable of increased walk away time and enhanced automation in areas of reagent management, retest options, and commodity/waste management. To address the need for such screening assays, an improved automated assay for the detection of anti‐HIV‐1/2 antibodies and HIV‐1 p24 antigen has been developed.
Study Design/Method: The performance of an immunoassay for the detection of anti‐HIV‐1/2 antibodies and HIV‐1 p24 antigen was evaluated on a next generation automated platform, Abbott Alinity s. Reproducibility was assessed over 5 days using positive samples. Specificity was evaluated on samples obtained from random blood and plasmapheresis donors. Sensitivity was evaluated using presumed positive samples for HIV‐1, HIV‐2 and HIV‐1 p24 antigen and HIV‐1 viral isolates. Seroconversion sensitivity was evaluated with 20 commercial seroconversion panels. Analytical sensitivity was evaluated using the WHO 1st International Standard for HIV‐1 p24 Antigen, 90/636.
Results/Finding: Within‐Laboratory imprecision was less than 4.5% CV for positive samples over 5 days. The specificity was 99.92% (16,981/16,994). Sensitivity was 100% for anti‐HIV‐1 (1,016/1,016), 100% for anti‐HIV‐2 (232/232) and 100% for HIV‐1 antigen positive samples (35/35). Sensitivity was 100% for 53 antigen positive viral isolate samples. Seroconversion sensitivity was better than the licensed comparator assay with 42 reactive samples detected with the Alinity s assay and 24 reactive samples detected by the comparator assay. Analytical sensitivity ranged from 0.80 IU/ml to 0.83 IU/ml.
Conclusion: These results indicate that the new automated Alinity s HIV Ag/Ab Combo assay provided acceptable performance in specificity, sensitivity and precision. Also, the assay provided better seroconversion sensitivity than the licensed comparator assay.
BBC96
Development of a Standardized Visual Inspection Aid for Plasma
Lorraine C. Steele*, Kassandra Poffenberger, Katelyn Heaser, Erik Levorson, Jessie Miller, Manish Gandhi and James R. Stubbs
Mayo Clinic
Background/Case Studies: In order to provide plasma for component therapy, whole blood goes through a series of manufacturing steps and is visually inspected for acceptability. A standard guide for performing visual inspection would be beneficial to improve consistency. There is no regulatory standard for plasma color or red blood cell (RBC) concentration in plasma, so it was necessary to first determine an acceptable cut‐off which could then be used to develop a visual inspection aid.
Study Design/Method: To determine the best cut‐off between acceptable vs unacceptable plasma, a visual representation was created. Plasma units of similar size and color were injected with RBCs in incremental volumes ranging from 0.05mL – 0.50mL. The plasma units were laid out in increasing RBC concentration. Techs and management inspected the plasma units to determine a common visual cut‐off. The RBC concentration in the plasma was calculated based on whole blood with an average hematocrit of 45% (5 × 10⁹ RBCs/mL),then doubled for a unit of packed RBCs to determine the number of RBCs injected into the units. Once the cut‐off was determined, photos were taken of the plasma units and used to create a visual inspection aid.
Results/Finding: The visual cut‐off determined by techs and management fell between the 0.10mL and 0.15mL injected plasma units. Only one source was found that mentions a limitation of RBCs in plasma. It is a specification of <4 × 10⁶ RBCs/mL in the package insert for our pathogen reduction technology for platelets, so it was used as a guideline. The 0.1mL unit was determined to have a concentration of 3.3 × 10⁶ RBCs/mL. A visual inspection aid was produced and implemented in the component laboratory. During the initial use, 650 plasma units were inspected with 98% of plasma passing the visual inspection. The aid was then made available to the two hospital blood banks. Since the initial implementation, a flaw in our calculation was discovered and our visual cut‐off has now been determined to have a concentration of 2.2 × 10⁶ RBCs/mL. A survey indicated that 84% of respondents use the inspection aid, 87% believe that it is helpful in determining plasma acceptability and 92% expressed opinions on how the aid improved plasma inspection. It was found useful in training and gives new techs confidence to make inspection decisions.
Conclusion: Development and implementation of a plasma visual inspection aid provided consistency in visual inspection across multiple areas that handle plasma prior to transfusion. The aid is accepted as a simple and useful tool by techs and management.
BBC97
If Liquid Units Are Requested for Rare Requests, Will You Get Them? A Review of 2 Years of American Rare Donor Program Data
Deborah R. Fludd*1, Joan L. Maurer2, Dexter Facey1, Margaret A. Keller3 and Sandra J. Nance4
1American Rare Donor Program and American Red Cross, 2ARDP, 3American Red Cross ‐ National Molecular Laboratory, 4American Red Cross and American Rare Donor Program
Background/Case Studies: It is certainly true that liquid red blood cell (RBC) units are more convenient and practical than frozen units with longer shelf life, easier shipping, no risk of breakage, less resource intensive and less expensive. However, liquid units of rare phenotypes are not always available, and frozen units are relied on in those cases to provide life‐sparing and lifesaving treatment. Between 2016 and 2017, there were a total of 1,473 American rare Donor Program (ARDP) requests. Of those, 196 such requests to ARDP were for liquid units only. The outcome of these requests was investigated.
Study Design/Method: Requests from calendar years 2016 and 2017 were reviewed for the outcome of requests for liquid units only to determine the number of liquid units found. Units were tallied by ABO/Rh type and other antigen phenotypes.
Results/Finding: Facilities placed 196 requests for liquid RBC units of rare phenotypes. Of those requests only 15 (7.6%) requests for 29 units required frozen units to complete the request, all but one included an antigen of high prevalence. The rarity, the ABO/Rh and other antibodies played a factor in the units not being available in the liquid state. Ten of the 15 requests were for Group O RBCs, with 7 O + and 3 O‐. Four of the 15 requests involved RBC phenotypes lacking U, with 2 more for RBCs lacking S and s (UVAR) and accounted for 48% of the requested units not found in liquid state. Both requests for S‐s‐ units accepted UVAR units. Only one patient had molecular testing results. An additional 7 requests were for RBC units lacking other high prevalence antigens including Coa, Lub, Dib, Joa, Jra, PPIPK and Ko. Even a request for RBCs for an AB + recipient, universal recipient based on ABO/Rh, was unable to be filled due to the rarity of the type (e‐U‐). One request was for a C‐E‐K‐Fy(a‐) RHCE allele match (RHCE*ce733G/RHCE*ce733G).
Conclusion: Some requests for RBC units of rare type are submitted specifically for liquid units only. Of these, 92% were filled with liquid units. Of those unable to be filled with liquid units, 6 out of the 15 involved the U antigen and an additional 7 involved other high prevalence antigens. For these requests, frozen rare units were utilized to fill the gap when liquid units were not available. Without those frozen units, patients would not have received their transfusion in a timely manner. Because of potential delays associated with recruiting and collecting a rare donor, ARDP advises centers who request liquid units only to review the patients clinical course to determine if transfusion is eminently required and to reconsider if frozen units should be requested.
BBC98
Using Automation to Solve Challenges in a High‐Throughput Production Laboratory
Steve Beeler*1, Scott Jones1, Rachel Beddard2, Diane Hoover3 and K.S. Bailey4
1QualTex Laboratories, 2BioBridge Global, 3Abbott, 4Abbott Transfusion Medicine
Background/Case Studies: Blood screening laboratories face many challenges in today's changing healthcare environment including inefficient manual processes, shortening turn‐around time requirements, staffing shortages, and budget constraints. Advances in automation technology can help alleviate these challenges. The aim of this study was to implement an automated laboratory track system in our production laboratory for the testing of whole blood and source plasma donor samples. Metrics were collected to determine the effects of implementing an automated track laboratory system on the number of samples processed per shift, the time to perform pre‐analytical processing, turn‐around time for sample testing, quality related issues, and the number of employees required to perform testing.
Study Design/Method: Implementation of automation in the production laboratory occurred in two phases. Phase one was the integration of middleware across all primary testing platforms. Phase two involved fully automating the pre‐analytical part of our testing process by installing a Track Automation System. This system included automation of the input of samples into the system, centrifugation, decapping, resealing and storage of sample tubes. Some analytical work was also automated by placing chemistry and immunoassay analyzers directly on the track system.
Results/Finding: The table below shows data pre‐ and post‐implementation of the track automation system.
| Laboratory Metrics | Pre‐Track | Post‐Track |
|---|---|---|
| Average number of samples processed per shift | 5,000 | 8,800 |
| Average pre‐analytical processing time (min) | 154 | 82 |
| Average Turn‐Around‐Time (hours) | 13.8 | 11.8 |
| Number of Corrected reports | 24 | 20 |
| Number of full time employees performing pre‐analytical processing | 14 | 11 |
Comparing metrics collected both pre‐ and post‐implementation of the track automation system showed a 76% increase in the number of samples processed per shift post‐implementation. There was also a 40% decrease in the average time for the pre‐analytical processing of samples and the average turn‐around time (time from when samples were received to when results were sent to the client) decreased by two hours. The number of corrected reports generated decreased by 17% and the number of full‐time employees required to perform pre‐analytical processing of samples decreased by 22%.
Conclusion: Automation of donor testing in the production laboratory enabled us to test more samples (76% increase) with less people (22% decrease) and we were able to report the results in a shorter period of time (2 hours faster on average). Removal of manual error prone processes allowed for a 17% reduction in corrected reports. Now we can test more samples more efficiently and in a timelier manner without additional staff.
BBC99
Stability of Factor I and VIII in Pathogen Inactivated (PI) Plasma over Two Years in Comparison to Untreated Plasma
Marco Amato*1 and Walter Nussbaumer2
1University Hospital, 2Univ Hospital Innsbruck
Background/Case Studies: Due to the long possible storage time of frozen plasma (one to two years) additional safety steps have been implemented in the production process before release for transfusion is approved. Quarantine storage including retesting the donor for HIV, HBV and HCV after 4 month is one routinely used method with an at least 4 month delay in a possible release process. Opposite, pathogen inactivation (PI) techniques allow an immediate use of the treated units after two to three days. However, PI means additional manipulation of the plasma with possible loss of coagulation factors during production and subsequent storage. Therefore, we studied influence of PI (Methylene Blue and Intercept) on factor I and VIII, the most common used quality parameters for frozen plasma, and compared the results with untreated stored plasma in a paired system.
Study Design/Method: We produced 6 pools of 5 plasma units each and split each pool into three arms: Intercept treated plasma (IN), Methylene Blue (MB) treated plasma and untreated plasma (UP). Plasma was frozen immediately after inactivation and Fibrinogen and factor VIII was analyzed after 2 month, 1 year and 2 years. We report here our findings for factor loss, differences between both PI methods and between PI treated units and untreated control units as well as stability of both coagulation factors within all groups.
Results/Finding: Comparing UP with PI groups, fibrinogen content in mg/dl was significantly lower (mean and CI 95%) 305; 292‐319 vs 270; 257‐283 vs 259; 246‐273, UP vs IN vs MB, respectively, in both PI treated arms (p < 0.05), and Fibrinogen content of IN group was slightly higher compared to MB group but difference was not significant. The same can be reported for Factor VIII content in % between UP and PI treated groups after 2 years (81; 70‐91 vs 59; 49‐70 vs 67; 56‐77), UP vs IN vs MB, respectively, but comparing both PI treated groups MB showed higher factor VIII levels. However, difference was also not significant, but IN levels were significantly lower than UP (p < 0.05). Stability of both factors within the groups, defined as changes of values between 2 month and 2 years of freezing was given for Fibrinogen (p = 0.729) and factor VIII (p = 0.279) between the three arms.
Conclusion: Manipulation of plasma, as caused by pathogen inactivation technique, leads to significant loss of factor I and VIII compared with not manipulated plasma. However, additional loss during the frozen state over 2 years is similar in all three arms and therefore not increased by PI techniques. Taking into account, that mean volume of an MB treated plasma is 250 mL whereas IN treated plasma is about 200 mL, the total content of both factors in the transfused unit is significantly higher in the MB group which can influence the total number of transfused units per patient.
BBC100
A Method for Cryopreserving Reagent Red Blood Cells Using −80°C Storage Conditions
Tracey R. Turner*1 and Jason P. Acker1,2
1Centre for Innovation, Canadian Blood Services, 2Department of Laboratory Medicine and Pathology, University of Alberta
Background/Case Studies: Rare red cell concentrates (RCCs) are frequently cryopreserved and stored at ≤‐65°C using the high glycerol method with slow freezing rates. Prior to transfusion, thawed units must have the glycerol removed. This methodology can also be applied to reagent red blood cells (RBCs) to provide cells for testing purposes, avoiding liquid nitrogen storage. However, the deglycerolization process for RCCs requires extensive washing steps which when translated to a small 1 mL model are very labour intensive. The purpose of this study is to evaluate a simplified wash process to provide a more practical deglycerolization method for reagent or small volume RBC cryopreservation.
Study Design/Method: A RCC was glycerolized to a final concentration of 40% with supernatant reduction pre and post glycerolization. Glycerolized RBCs were aliquoted in 1 mL volumes into cryovials that were placed into a ‐80°C freezer for a minimum of 48 hours. Prior to deglycerolization the samples were thawed in a 37°C water bath. Two deglycerolization processes were performed (n=9/process). Process 1 involved four wash steps (12% and 1.6% Saline, 1.6% Saline, and two washes in 0.9% Saline/0.2% Dextrose). Process 2 involved three wash steps achieved by increasing the volume of the wash solutions, eliminating the fourth wash step. All RBC samples were suspended in AS‐3 post processing. Hemoglobin loss, hemoglobin recovery and glycerol concentration were determined. Additional samples were deglycerolized and tested for RBC hemolysis after 24, 48, and 72 hours of hypothermic storage (n=6/test point/process).
TABLE 1 (BBC100) Hemoglobin Loss Throughout the Deglycerolization Process
| Total Hemoglobin Content (mg) | Hemoglobin Loss (mg) | ||||
|---|---|---|---|---|---|
| Process | Pre‐Wash | Wash 1 | Wash 2 | Wash 3 | Wash 4 |
| 1 | 142 ± 3 | 2.88 ± 0.15 | 3.36 ± 0.32 | 1.98 ± 0.22 | 0.57 ± 0.21 |
| 2 | 142 ± 2 | 3.32 ± 0.45 | 4.06 ± 0.88 | 1.49 ± 0.62 | N/Ap |
Results/Finding: Both processes yielded approximately 1 mL of deglycerolized RBCs with hematocrits of 47 ± 2% with < 1% glycerol concentrations in all samples. Hemoglobin recovery for Process 2 was 96 ± 3% which was comparable to Process 1 at 97 ± 3% (p=0.5).
RBCs, post deglycerolization, stored at 1 to 6 ˚C for 24, 48 and 72 hours prepared using Process 1 had hemolysis of 0.47 ± 0.13%, 0.47 ± 0.04%, and 0.62 ± 0.18%, respectively. Process 2 RBCs had hemolysis of 0.32 ± 0.04%, 0.43 ± 0.06%, and 0.38 ± 0.05% at the same time points. When comparing Process 1 and 2 samples stored at corresponding time points there was a significant difference observed at 24 and 72 hours (p<0.05).
Conclusion: A simplified 3‐step deglycerolization method can successfully deglycerolize small volumes of RBCs. When RBCs are suspended in AS‐3 post processing these samples can be stored hypothermically for 3 days increasing their utility as reagent cells or for small volume transfusions.
BBC101
The Armed Services Blood Program Experience with Providing Whole Blood at the Point of Injury: Evaluation of Prescreened Donor Testing and Risk
Melanie Sloan*, James Burke, Jason Corley and Audra Taylor
U.S. Army
Background/Case Studies: “Walking Blood Banks (WBB)” using Low Titer Group O Fresh Whole Blood (FWB) is an effective strategy for resuscitation of hemorrhagic shock patients on the battlefield, significantly reducing battlefield morbidity and mortality. WBB's can be vital in prolonged field care settings when evacuation to a higher level of care may be delayed by hours or days. The screening of potential WBB donors before deployment to austere conditions assists in mitigating transfusion transmitted disease risk, identification of blood type, and determination of anti‐A and anti‐B titer status.
Study Design/Method: Donors are screened for transfusion transmitted diseases using the required panel for allogeneic tests in accordance with FDA guidelines. The WBB donor testing is performed by contracted testing laboratories. WBB Donor testing is entered into the DOD Operational Blood Banking System of Record and used to calculate disease prevalence using the number of positive screening tests divided by the total number of potential donors screened.
Results/Finding: During the 3 year time period of May 2015 to March 2018; 7,177 potential donors have been screened for infectious diseases as well as determinations of blood type, antibody screens, and isohemagglutinin titer status (type O donors only). Prevalence rates for identified FDA‐licensed screening tests is as follows: Positive Antibody screen = 0.001; Chagas=0.0008; HBcAb=0.004; HBsAg=0.001 (4 cases were confirmed by neutralization, one case was identified as non‐confirmable); HCV (EIA and NAT) = 0.001; HIV (EIA and NAT)=0.002 (one case was confirmed and two cases were identified as indeterminate); HTLV=0.0008; Serologic test for Syphilis=0.001 (two cases were confirmed as positive); and WNV=0.001. The U.S. Army Rangers account for 3,479 screening events, or roughly 46% of all U.S. Army prescreening events. The 75th Ranger Regiment has elected to screen only the blood type O donors for eligibility into this program. This program has identified a 97% accuracy in the self‐reported blood type O of the U.S. Army Rangers. 3% of U.S. Army Rangers presenting for this program as blood type O were non‐blood group O.
Conclusion: The screening of “Walking Blood Bank” donors before deployment can mitigate the risk of transfusion‐transmitted diseases, as well as provide identification of any non‐blood group O donors. Screening Walking blood bank donors informs Military medical leaders on the front lines and assists in decisions regarding donor eligibility for providing fresh whole blood (FWB) in far‐forward and austere environments. Use of FWB at the Point of Injury (POI) can decrease the mortality of “potentially survivable” casualties. The screening of potential donors extends the availability of whole blood on the battlefield.
BBC102
Automation of Biologics Manufacturing
Lavanh Phommasing*, Kadian McIntosh‐Rosales, Alicia B. Prichard and Jonathan McCoun
OneBlood, Inc
Background/Case Studies: Project focused on improvements to whole blood component manufacturing, including process standardization to increase plasma yield, reduce waste, and streamline workflow by introducing the CompoMat G5 into production.
Study Design/Method: A comprehensive G5 evaluation was conducted by the Biologics Manufacturing team. Process included completion of SOPs, training, qualifications, validations, implementation and optimization of equipment. Data was collected using OneBlood's proprietary BECS, RSA, and reviewed after evaluation and 4 months post implementation. Plasma volumes were compared between manual and G5 processing. Throughput was measured by timing operators to unload a completed unit and reload a new spun WB unit on the same G5. Multiple G5s were unloaded/reloaded for one hour. To allow for a realistic, full day labor load; throughput calculation was reduced to 75% of the measured data. Data evaluated 4 months post implementation was collected from two sites.
Results/Finding: G5 was customized to use select detectors and tested with 3 bag systems from two vendors and seven component processes (hard/soft spins, source leukocytes, pediatric RBCs, AS5 RBCs, secondary process for single Cryo, single RDPs/FSC). Plasma yields increased overall with G5 compared to manual process. Yields varied by process type, centrifugation speed, and site. Using HAE RCPL bag system, initial soft spin and secondary hard spin for RDPs, a 4.8% increase in plasma yield was achieved. Using HAE RC2D bag system, initial hard spin and secondary hard spin (after freeze/thaw) for Cryo, plasma initially increased by 1.6% during the evaluation and by 6% after 4 month post implementation at both sites.
Average throughput depended on average time an operator unloaded and reloaded a unit on a G5. Time variance observed depended on bag system complexity, practice, and number of G5s used. Two operators at 75% workload on 3 G5s produced highest throughput (81/hour) for secondary processes (single Cryo and single RDP). 69 units were produced per hour on hard spin process (RC2D bag type). Two operators and six G5s produced 54 units/hour for initial soft spin process (RCPL bag system with plasma filter).
Conclusion: Automating whole blood component manufacturing with G5 allowed for plasma yield standardization, high unit throughput, and increased efficiencies (plasma yield and throughput).
(BBC102)
| 1 Site ‐ Evaluation | 2 Sites ‐ Post Launch | ||||
|---|---|---|---|---|---|
| Process Type | Avg Time unload/reload | Avg units/hr | Avg Time unload/reload | Avg units/hr | |
| RDP 1st spin | 0:01:16 | 35 | 0:00:51 | 54 | |
| Cryo 1st spin | 0:02:10 | 21 | 0:00:30 | 69 | |
| Cryo or RDP | 0:00:37 | 73 | 0:00:40 | 81 | |
| N | Mean PLS | Mean PLS | Delta [%] | ||
| vol [mL] | vol [%] | ||||
| Random Donor Platelets (RDP) | Manual | 567 | 283 | 54.3 | 4.8 |
| G5 | 1074 | 311 | 59.1 | ||
| Cryo ‐ Evaluation | Manual | 2765 | 328 | 62.7 | 1.6 |
| G5 | 35 | 325 | 64.4 | ||
| Cryo ‐ Post Launch | Manual | 24 | 298 | 6 | |
| G5 | 48 | 317 | |||
BBC103
Evaluation of Delaying the Compound Adsorption Step during the Intercept Pathogen Reduction Process for Platelets
Catherine Vignoli*1, Herve Isola2, Francoise Donnadieu1, Arnaud Dupuis2, Beatrice Belcour2, Jacques Chiaroni3 and Christian Gachet4
1EFS PACA Corse, 2EFS Grand Est, 3Etablissement français du sang PACA Corse, Biologie des Groupes Sanguins, 4Université de Strasbourg, INSERM, EFS Grand Est, BPPS UMR‐S 1225, FMTS
Background/Case Studies: EFS generalized the use of the INTERCEPT Pathogen Reduction (PR) process for platelets since november 2017. The PR process includes a photochemical treatment (PCT) with amotosalen and ultraviolet light A (UVA) followed by an adsorption of residual amotosalen in a Compound Adsorption Device (CAD) for 6 to 16 hours. The objective was to evaluate the effect of an up to 40 hours delay between illumination and CAD steps on platelets quality. The implementation of this delay would increase the flexibility of the process and facilitate the organization of production.
Study Design/Method: Two EFS sites (PACC and GEST) prepared 16 PC each. Leukodepleted PCs were obtained with the Tacsi process (Terumo BCT) after pooling 5 buffy‐coats with InterSol (Fresenius). Two PC were pooled and split into a Control (C) and a Test (T) PC. C‐PC and T‐PC were treated for PR with large volume sets (Cerus). After illumination, the C‐PC was immediately transferred into the CAD bag for 6 hours. The T‐PC was stored under agitation during 40h before the transfer into the CAD bag for 6hours. In vitro parameters (platelet & WBC content, MPV, pH, pO2, pCO2, glucose, lactate, LDH, p‐selectin, swirling, residual amotosalen) were assessed before CAD step and during storage period at days 3, 5 and 7.
Results/Finding: For T‐PC and C‐PC, mean platelet content was 4.7.1011 at EFS GEST and 3.7.1011 at EFS PACC before CAD operation. All the units presents maximum swirling during storage period and a residual amotosalen concentration less than 2 µM. The mean pH at day 3 was different between T‐PC and C‐PC and it became similar between both groups during the storage period. There was no sign of platelet lysis or activation in the T‐PC compared to the C‐PC and presence of glucose was still observed at day 5 for each group (Table1).
Conclusion: A storage period of 40 hours in the illumination container before CAD treatment doesn't affect the quality of PC for up to 7 days. The “delayed CAD” brings flexibility in the daily and weekly organization of PR platelet production.
TABLE 1 (BBC103) In vitro storage parameters of PC
| N=8 | EFS GEST (1) EFS PACC (2) | Test (T) Control (C) | Day 3 | Day 5 | Day 7 |
|---|---|---|---|---|---|
| pH (22°C) | 1 | T | 6.88 ± 0.06s | 6.86 ± 0.04s | 6.94 ± 0.03ns |
| C | 7.10 ± 0.02 | 6.98 ± 0.04 | 6.95 ± 0.04 | ||
| 2 | T | 7.00 ± 0.09s | 7.02 ± 0.05ns | 6.97 ± 0.06ns | |
| C | 7.16 ± 0.03 | 7.03 ± 0.12 | 6.98 ± 0.03 | ||
| Glucose (mM) | 1 | T | 2.3 ± 0.8s | 0.4 ± 0.4s | <DL |
| C | 4.4 ± 0.6 | 1.5 ± 0.7 | <DL | ||
| 2 | T | 2.8 ± 0.6s | 1.6 ± 0.2s | <DL | |
| C | 3.3 ± 0.7 | 2.0 ± 0.7 | <DL | ||
| LDH (U/L) | 1 | T | 74 ± 6s | 87 ± 10s | 101 ± 19s |
| C | 92 ± 12 | 129 ± 20 | 168 ± 19 | ||
| 2 | T | 55 ± 14ns | 74 ± 20ns | 125 ± 62ns | |
| C | 60 ± 17 | 82 ± 22 | 111 ± 33 | ||
| p‐selectin (ng/ml) | 1 | T | 38 ± 5s | 72 ± 11s | 110 ± 16s |
| C | 49 ± 10 | 109 ± 15 | 177 ± 23 |
DL=detection limit
s = significant difference; ns = no significant difference; paired t‐Test p<0.05
BBC104
Complete Inactivation of Mers‐Coronavirus in Human Apheresis Platelets with Amotosalen and Ultraviolet A Light Treatment
Ahmed M. Hasan*1, Salwa Ibrahim Hindawi2, Marcus Picard‐Maureau3, Qossay Abunada3, Ghazi A. Damanhouri4, Anwar M. Hashem5 and Esam I. Azhar5
1King Abdulaziz University, 2King Abdulaziz University Hospital, 3Cerus Europe BV, 4Department of Medicine, Faculty of Medicine, King Abdulaziz University, 5Special Infectious Agents Unit, King Fahd Medical Research Center, King Abdulaziz University
Background/Case Studies: Since 2012, the Middle East Respiratory Syndrome‐Coronavirus (MERS‐CoV) caused > 2,103 cases of human infection and 733 deaths in 27 countries with Saudi Arabia being the most affected country with >80% of the cases and ∼41% local death rate. While the potential of transfusion‐related MERS‐CoV transmission is not clear, detection of infectious viral particles and genomic RNA in whole blood, serum, and plasma of acutely infected patients makes MERS‐CoV a pathogen of concern for the safety of the blood supply especially in endemic regions. Several lines of evidence and clinical data suggest that pathogen reduction with Amotosalen and ultraviolet A (UVA) light technology is effective and safe for the treatment of blood products. Here, we investigated the efficacy of Amotosalen/UVA light to inactivate MERS‐CoV in human platelet concentrates to safely exclude potential contamination with MERS‐CoV.
Study Design/Method: We inoculated four apheresis platelet units in 100% plasma with a clinical MERS‐CoV isolate at four different days. Spiked units were then used to evaluate the efficacy of Amotosalen/UVA (INTERCEPT Blood System, Cerus Corporation, Concord, U.S.A.) to inactivate MERS‐CoV in platelet concentrates. Infectious and genomic viral titers were assessed by plaque assay and real‐time RT‐qPCR, respectively, in spiked and treated samples in parallel with positive and negative (platelets only) controls. Collected samples were also inoculated on Vero E6 cells for three consecutive passages and tested by real‐time RT‐qPCR to exclude presence of replicative MERS‐CoV in inactivated platelets.
Results/Finding: Treatment of spiked platelet units with Amotosalen/UVA light resulted in complete inactivation of infectious viral titer with mean log reduction of >4.48 ± 0.3 log10 pfu/mL. While inoculation of pretreatment samples in cell culture resulted in obvious viral replication and complete cytopathic effect (CPE) within 3 days post‐inoculation similar to positive control, no viral replication nor CPE were observed in cells inoculated with inactivated samples even after 9 days of incubation and three successive passages. Evaluation of genomic titer in inactivated samples showed almost equivalent titers to those observed in pretreatment samples as expected.
Conclusion: Amotosalen and UVA light treatment of platelet concentrates spiked with MERS‐CoV efficiently and completely inactivated infectious MERS‐CoV with > 4 logs (no regulatory label claim yet), suggesting that treatment of platelets with Amotosalen and UVA light could minimize the risk of any possible transfusion‐related MERS‐CoV transmission in endemic areas.
BBC105
Evaluation of Delayed Bacterial Culture in Removing Contaminated Plateletpheresis Units from the Blood Supply
Rebecca Haley*1, Lisa Upshaw2, Don Eby2, Russ Juntunen2 and YanYun Wu3
1Bloodworks Northwest, 2Bloodworks, 3Immunohematology & RBC Genomics Reference Laboratory, BloodworksNW
Background/Case Studies: Plateletpheresis units must be stored 20‐24 C to maintain viability during storage making the units susceptible to bacterial growth that could be life‐threatening or fatal for a patient. Since 2003 all units collected at our center were cultured before release to identify a unit possibly dangerous for the transfusion recipient. This review of that process illustrates its effectiveness and gives insight into the risk of the culture and release process.
Study Design/Method: Product records were reviewed from June, 2003 when the culturing process was initiated, through March of 2018. Plateletpheresis units were held for 24 hours, then sampled and cultured using a rapid microbiological test system for aerobic culture. Cultures were held throughout the 5 day life of the products. Units were available to the inventory after culture. An immediate notification system by FAX was in place to every customer for notification of unit recalls as needed. A notice was sent immediately when a sample became positive. The culture bottles giving a positive report were sent to a nearby university microbiology laboratory for Gram stain, subculture and identification. Positives were evaluated as to probable source. If Gram stain and subculture were negative or no growth, the culture was classified as false positive. Notification of the culture outcome was then sent to customers if the shipped unit was reported as transfused.
Results/Finding:
| Cultured | Culture Neg. | False Pos. | True pos. | Waived | Not Tested |
|---|---|---|---|---|---|
| 210,102 | 209,815 | 227 | 24 | 30 | 6 |
False positives were 0.11% of the units cultured, while true positives were 0.011% of the total. Waived cultures were exceptional release units that were required for immediate transfusion for a designated patient. Not Tested units were a failure in the process and were discarded. All positive culture products triggered actions that included discard from blood center inventory and 14 of the true positive collections were discarded by this process, or notifications to the facilities receiving the positive culture products instructing them to return or discard the units. These facilities were notified again regarding the outcome of further testing on units that were reported as transfused. Of the 24 collections found to be true culture positive, 10 were already shipped. Five of the collections were returned and discarded. Five of the positive culture units were transfused. No notifications of transfusion reactions were received for any of the units.
Conclusion: Notifications to the 10 receiving facilities of true positives were successful and acknowledged. Of the 24 true positives, 19 were likely skin or environmental contaminants, and this group contained the transfused units. The more significant donor‐associated positive cultures (5 collections) were all intercepted prior to shipment and removed from inventory. Culturing of plateletpheresis units after a 24 hour hold in conjunction with a robust communication system connecting to facilities receiving shipped blood components was an effective deterrent to bacterial contamination adverse events for the last 15 years. Enhanced culture techniques may add additional assurance to prevention of adverse events from contaminated platelets.
BBC106
Water and Salt Intake before Blood Donation Reduces Vasovagal Reactions in Both Genders, All Age Groups for Whole Blood Donors
Pierre Robillard* and Yves Grégoire
Héma‐Québec
Background/Case Studies: A new donor hemovigilance system was implemented on October 2015 capturing all severities of vasovagal reactions (VVR). A program to have donors drink water and eat salted snacks before donating was implemented on June 11th 2017. The aim of this study is to measure the effect of the water/salted snack distribution on rates of VVR with and without loss of consciousness (LOC).
Study Design/Method: Pre‐implementation (PRE) was the 9‐month period prior to implementation (11 Sep 2016 ‐10 Jun 2017) and post‐implementation (POST) as the 9‐month period following implementation (11 Jun 2017‐10 Mar 2018). In PRE, donors were informed at registration to drink water before donating. Amount was not mentioned and supply varied from an empty glass the donor had to fill at a water tank, a 200‐ml juice box, a 500‐ml water bottle or nothing at all. Snacks were offered after donation and were mostly sugary. On June 11th 2017 a program was introduced at all collection sites with leaflets, posters and pictograms to inform donors on importance of drinking water and eating salted snacks. They were given a 500‐ml water bottle and a bag of salted pretzels at arrival, were told to drink the whole bottle before donating and to eat the pretzels. Check points monitored consumption at registration, interview and venipuncture. Reinforcement was made at all check points if the bottle was not empty. All severities of VVR were reported on a standardized form. Rates of all VVR and VVR‐LOC were calculated per 100 donations. PRE‐POST rates were compared using chi‐square tests.
Results/Finding: There was a significant reduction in the number (PRE:11,609; POST:9873) and rates of all VVRs (see table). Risk reduction was 13.8% (95%CI:11.5‐16.0) for VVR and 11.4% (95%CI:1.5‐20.3) for VVR‐LOC.
| VVR (%) | VVR‐LOC (%) | |||||
|---|---|---|---|---|---|---|
| PRE | POST | p | PRE | POST | p | |
| ALL | 4.98 | 4.30 | <0.001 | 0.32 | 0.28 | 0.024 |
| Sex | ||||||
| Female | 8.20 | 7.00 | <0.001 | 0.54 | 0.47 | 0.019 |
| Male | 2.87 | 2.44 | <0.001 | 0.17 | 0.15 | 0.322 |
| Status | ||||||
| 1st‐time | 19.08 | 17.34 | <0.001 | 1.24 | 1.19 | 0.143 |
| regular | 3.21 | 2.86 | <0.001 | 0.20 | 0.18 | 0.587 |
| Age | ||||||
| 18‐22 | 15.43 | 13.98 | <0.001 | 1.07 | 1.02 | 0.483 |
| 23‐29 | 7.48 | 6.79 | <0.001 | 0.47 | 0.42 | 0.376 |
| 30‐39 | 5.26 | 4.46 | <0.001 | 0.28 | 0.26 | 0.637 |
| 40‐49 | 3.38 | 2.94 | 0.001 | 0.21 | 0.15 | 0.073 |
| 50‐59 | 1.89 | 1.67 | 0.008 | 0.11 | 0.13 | 0.250 |
| 60‐70 | 1.37 | 1.22 | 0.037 | 0.09 | 0.06 | 0.124 |
| 71+ | 1.10 | 0.89 | 0.217 | 0.05 | 0.04 | 0.824 |
| Donation type | ||||||
| Whole blood | 5.96 | 5.02 | <0.001 | 0.40 | 0.36 | 0.035 |
| apheresis | 2.56 | 2.58 | 0.883 | 0.11 | 0.10 | 0.727 |
Conclusion: Capturing all severities of VVRs allows for quick evaluation of prevention program. For whole blood donors having a structured program for water and salted snacks delivery at blood collection sites significantly reduces the incidence of VVRs for both sexes and all age groups. It improves donor safety, making donation experience better and more likely for donors to return.
BBC107
Bringing Dithiothreitol (DTT) Testing Protocol in‐House Leads to Significant Cost Savings and Turn‐Around Time Improvement Compared to Reference Lab Testing
Mariam Youssef*1, Christine Arnesen2, Marisa B. Marques2, Tammy Gray1, Danielle Sylvester3 and Lance A. Williams1
1University of Alabama at Birmingham, 2Department of Pathology, University of Alabama at Birmingham, 3UAB Hospital
Background/Case Studies: Daratumumab (Darzalex) treatment is an increasingly used therapeutic option for patients with multiple myeloma refractory to other treatments. This treatment, combined with the patients primary disease can lead to the need for transfusion support. Daratumumab acts as a CD38 antibody. Unfortunately, this therapy interferes with blood bank testing in that it causes panreactivity due to its binding of CD38 markers on the RBC membrane. Therefore, much like a warm autoantibody, this reactivity may mask clinically significant underlying alloantibodies. DTT treatment is a well‐documented remedy for this interference; however, some blood banks have struggled to bring this protocol in‐house and instead, send the test out to a reference lab at a great expense in terms of cost and turn‐around time (TAT). The purpose of this study was to compare the in‐house DTT protocol versus the reference lab protocol in terms of cost and turn‐around time.
Study Design/Method: We retrospectively reviewed all blood bank patients on daratumumab therapy from February 2016 to April 2018. We included all patients on which a type and screen was performed during the study period. We collected the following data: age, sex, date daratumumab started, total number of type and screens, location of testing and TAT of testing. Patients that had no type and screens performed were excluded from the analysis. From February 2016 to December 2017, all type and screen samples were sent to our reference laboratory for testing, at a cost of approximately $325 per test. From January 2018 to current, we use our validated DTT in‐house protocol for testing, at a cost of approximately $28 dollars per test (including tech time and reagent cost).
Results/Finding: During the study‐period, we were notified about 72 daratumumab patients that might require transfusion. We excluded 17 patients from the analysis due to lack of a type and screen ordered, leaving 55 patients for analysis. Samples were sent to the reference lab 124 times and were tested in house 28 times. The average TAT for the reference lab was 19 hours and 25 minutes compared to our in‐house TAT of 5 hours and 9 minutes. This equates to a time savings of 14 hours and 16 minutes on average. In total, we spent approximately $38,350 for 117 samples tested at the reference lab versus $785 for in‐house testing of 27 samples.
Conclusion: After validating our in‐house DTT protocol, we significantly decreased our TAT for type and screens on our daratumumab patient population. Additionally, we experienced significant cost savings by bringing the DTT testing in‐house as compared to sending samples out to a reference laboratory. By bringing this testing in‐house, we also significantly reduced the time to blood availability for this patient population.
BBC108
Significant Injuries Associated with Vasovagal Reactions
Mary J. Townsend*, Hany Kamel and Marjorie D. Bravo
Blood Systems, Inc.
Background/Case Studies: While blood donation is relatively safe, adverse events occur due to the insertion of a large bore needle, the physiologic response to the loss of roughly 500 ml of blood and/or the underlying condition of the donor. The most common adverse event (AE), vasovagal reactions (VVR), usually resolves spontaneously or with minimal medical intervention. When loss of consciousness (LOC) accompanies VVR, the donor may fall risking injury. While most falls do not result in significant injury (SI), some injuries require further medical intervention.
Study Design/Method: We analyzed allogeneic apheresis and WB needle‐in collections between 6/1/2016 to 12/31/2017 (19 months). Vasovagal events were identified and any cases reported to have significant injuries based on classification by Medical Director consistent with AABB definitions were reported. Significant injury categories include closed head injuries/concussions, dental injuries, fractures, lacerations and motor vehicle accidents (MVA). Record review was performed on reported cases of closed head injury to include those diagnosed as having concussion. Rates of significant injuries were calculated per 10,000 needle‐in (NI) allogeneic donations overall and as a proportion of LOC events.
Results/Finding: There were 1,319,625 allogeneic needle‐in donations with 14,970 VVR (rate 113.4/10,000 NI), including 2834 LOC (rate 21.5/10,000 NI) reactions. There were 50 SI events from 45 donations with rate of 0.34/10,000 NI donations or 1.6/10,000 LOC reactions. The highest rates were for laceration (0.15/10,000 NI) and concussion (0.10/10,000 NI) and the lowest was MVA (0.02/10,000 NI). Females suffered more injuries than males (0.5/10,000 and 0.2,10,000 respectively, p=0.0093; young donors (<23 yo) had more injuries than older donors (>23 yo) (0.9/10,000 and 0.2/10,000, respectively, p<0.0001); and first time donors had more injuries than repeat donors (0.7/10,000 and 0.3/10,000 respectively, p<0.001). There were no significant differences in injuries between young male and young female donors or between older male and older female donors. Forty‐three of 45 donors sought further medical intervention for their injury; exceptions were a donor with a small laceration and a donor with a broken tooth who was lost to follow‐up.
Conclusion: Significant injuries are very rare events and were associated with LOC in the cases recorded. Significant injuries almost always require further medical intervention with resulting incurred costs. Continued donor vigilance and safety measures to prevent LOC will help mitigate these potentially avoidable events.
BBC109
A Specificity Study of the Verax PGDprime® Test for Bacteria in Platelets
Lisa Shinefeld*, Nancy Best, Miranda Williams, Erica Boudreau, Adam Lousararian, Mark Lamkin and Remo Vallejo
Verax Biomedical Inc.
Background/Case Studies: The PGDprime rapid test for bacteria in platelets was developed as an improvement of the PGD® test currently used as a Safety Measure for platelet transfusion. It was designed to provide a simpler test procedure compared to the current product. The current PGD test employs intact IgG capture and detector antibodies and as such is vulnerable to a very low rate of false positive results with samples containing high levels of heterophile antibodies and rheumatoid factor. The new PGDprime test incorporates intact IgG for capture and F(ab')2 fragments for detector antibodies for 5 out of 6 test lines, as well as a more stringent sample preparation regime, to further reduce the already low false positive (FP) rate.
Study Design/Method: The specificity of the new test was evaluated in a limited study testing 624 culture‐negative individual platelet units or pools of various types. Sample types included leukocyte‐reduced apheresis platelets in plasma, leukocyte‐reduced whole blood derived platelets (LR‐WBDP), leukocyte‐reduced whole blood derived platelet pools (LR Pools, pre‐storage or post‐storage), non‐leukocyte‐reduced whole blood derived platelets (NLR‐WBDP), post‐storage pools of non‐leukocyte‐reduced whole blood derived platelets (NLR Pools) and leukocyte‐reduced apheresis platelets in platelet additive solution (PAS). In addition, 51 frozen plasma samples accumulated over >6 years from platelet units that had been identified as false positive by users of the current PGD test were run on the new test to determine its susceptibility to such samples.
Results were classified as Nonreactive or Initially Reactive (IR). IR samples were retested on two additional devices for confirmation of the IR result. If both devices yielded Reactive results, they were classified as Repeat Reactive (RR). These RR samples were then considered as yielding confirmed FP results.
Results/Finding: Our specificity testing results on culture‐negative platelet units are summarized in the table below.
TABLE 195. (BBC109) Summary of Specificity Testing
| Apheresis | LR‐WBDP | LR Pools | NLR‐WBDP | NLR Pools | PAS | Total | |
|---|---|---|---|---|---|---|---|
| Number Tested | 410 | 59 | 38 | 58 | 12 | 47 | 624 |
| Initial Reactive/Rate | 3/0.73% | 0/0% | 0/0% | 0/0% | 0/0% | 0/0% | 3/0.48% |
| Repeat Reactive/Rate | 0/0% | 0/0% | 0/0% | 0/0% | 0/0% | 0/0% | 0/0% |
In addition, of 51 samples with previous FP results on the PGD test, 50 were correctly identified as negative when tested using the PGDprime test.
Conclusion: The limited study showed that PGDprime had a specificity of >99.5% when tested on culture‐negative platelet samples. Testing of archived PGD false positive samples indicated that PGDprime did not react with the vast majority of PGD false positive samples tested.
BBC110
Performance of a New Automated Alinity s Assay for Hepatitis B Surface Antigen and Hepatitis B Surface Antigen Confirmatory
Randal Makela1, Rebecca Haley2, Scott Jones3, Toby Simon4, Susan L. Stramer5, Susan S. Ganz6, Lynn Martin*1 and Tuan Bui1
1Abbott Laboratories, 2Bloodworks Northwest, 3QualTex Laboratories, 4CSL Plasma Laboratory, 5American Red Cross, 6Biotest Pharmaceuticals
Background/Case Studies: Blood transfusion in many parts of the world relies on serologic screening for hepatitis B surface antigen (HBsAg) to prevent transfusion transmitted HBV infection. Sensitive HBsAg assays must be capable of coping with a wide range of mutants without compromising specificity. In addition, continued pressures on laboratory operations demand that assays perform on platforms capable of increased walk away time and enhanced automation in areas of reagent management, retest options, and commodity/waste management. To address the need for such screening assays, an improved automated assay for the detection of HBsAg has been developed.
Study Design/Method: The performance of a new automated chemiluminescence immunoassay for the detection and confirmation of HBsAg was evaluated on a next generation automated platform, Abbott Alinity s. Reproducibility was assessed over 5 days. Sensitivity was evaluated using 432 known positive samples, 20 commercially available seroconversion panels, the 3rd WHO International HBsAg standard 12/226, 52 HBsAg mutants, and 16 HBsAg genotyped specimens (A through H). Specificity was evaluated on samples obtained from random blood and plasmapheresis donors.
Results/Finding: Within Laboratory imprecision was less than 5% CV for positive samples over 5 days of testing. The overall specificity was 99.96% (16,985/16,991). Sensitivity was 100% for presumed HBsAg positive samples (432/432) and all genotypes (16/16). 100% of the mutants were detected vs 79% for the licensed comparator assay. Seroconversion detection was comparable to the licensed comparator assay with 100 reactive samples detected with the Alinity s assay and 99 reactive samples detected by the comparator assay. Analytical sensitivity ranged from 0.07 to 0.08 ng/ml. The Alinity s HBsAg Confirmatory Assay confirmed all positive HBsAg specimens, including 3 HBsAg mutant samples that were not confirmed by the licensed comparator HBsAg Confirmatory Assay.
Conclusion: The new automated Alinity s HBsAg assay provided acceptable performance in precision, specificity, and sensitivity. The Alinity s assay demonstrated a gain in sensitivity over the licensed comparator assay by detection and confirmation of a wider range of mutants.
BBC111
Vasovagal Reaction to Blood Donation That Requires Medical Attention: Retrospective Study on the Possible Risk Factors
Noorhayati Rahamat*, Avelina Ho and Reuben Vamadevan
Health Sciences Authority
Background/Case Studies: Vasovagal severe reaction is classified as donors having severe symptoms, for example, prolonged recovery and fainting, convulsions and incontinence that require medical attention. Mild and moderate reactions accompanied by injuries are also included in this category. These donors are then referred to hospitals for further observation.
In recent years, the number of severe reactions have been noticed to be on the rise. This unpleasant and undesirable trend can be alarming, especially when the adverse reaction causes a blood donor to be injured during falls. Fish Bone Diagram was used to identify the factors with the number of severe reaction. Age, gender, donation history and ethnicity were highlighted.
This study aims to analyze the prevalence of severe reaction over the past 5 years and to find out the difference in severe reaction between the demographic variables‐ age (16‐25/>25), donation history (first‐time/repeat donors), gender (male/female) and ethnicity (Chinese/Malay/Indian/Others), with the number of severe reaction.
Study Design/Method: Retrospective data were gathered from hemovigilance reports for all Whole Blood donation from January 2013 to October 2017. Out of a total number of 545,323 donations performed during that period, there were 14,725 reactions, of which, 73 cases were severe reactions that required medical attention.
Descriptive analysis and inferential statistic using Chi square were used to find out the difference in the number of reaction in each demographic. The significance threshold was set at 0.05.
Results/Finding: Incidence of total reaction stood at 14,725 (2.7%), of which the number of severe reactions requiring medical attention was 73 (0.5%). From hemovilgilance reports, there had been an increase in the percentage of severe reaction in 2017 as compared to 2013 (0.79% vs 0.22% respectively).
The rate of severe reaction was higher among 16‐25 age group when compared to the >25 age group (0.032% vs 0.016%, P < 0.001). More females experienced severe reaction than males (0.04% vs 0.009%, P = 0.45), while repeat donors had lesser severe reaction than first‐time donors (0.016% vs 0.03%, P < 0.001). Indians had the highest number of severe reaction when compared against the Chinese, the Malays and other ethnic groups (0.051% vs 0.014% vs 0.027% vs 0.019% respectively, P=0.002).
Despite the rising trend, all demographic variables were not found to be statistically significant to the number of severe reaction. Even so, there is still a need for good communication on the importance of proper rest and hydration before and after blood donation. Reinforcement of proper donor care from staff to donor needs to be addressed as well.
Conclusion: Donors who had experienced severe reactions as a result of blood donation may have been on a rise. However, it showed no difference between the demographic variables and the number severe reaction. Nevertheless, donor safety is the quintessential factor of blood donation, and optimally targeted to minimize the rate of reaction.
By recognizing these vulnerable cohorts of donors, donation staff can take extra measures to communicate pre, during and post donation advice to these groups. Staff would also be able to anticipate a reaction, hence by monitoring them closely.
BBC112
Building Bridges: Examining the Development of a Partnership between University Donor Center and University LGBTQ Community
Precious Ann V. Fortes*, Andrea M. McGonigle, Dennis M. Miranda, Alyssa Ziman and Dawn C. Ward
Division of Transfusion Medicine, Department of Pathology and Laboratory Medicine, David Geffen School of Medicine at UCLA
Background/Case Studies: Forming partnerships is an important strategy to promote blood donations and support a donor center's entire community. Donor centers should strive to engage meaningfully with the lesbian, gay, bi‐sexual, transgender, and queer (LGBTQ) community while also complying with federal regulation deferring males whom have had sex with males (MSM) in the last 12 months. Our university LGBTQ group approached our campus‐based donor center with the idea of hosting a blood drive to highlight current MSM donor regulations and provide others the opportunity to voice their opinion to the FDA. We worked with the group to organize a blood drive while also maintaining federal regulations for blood donation. To our knowledge, there have been no published reports of a donor center supporting an LGBTQ sponsored blood drive. Herein, we describe the development of our partnership and evaluation of its merits.
Study Design/Method: The collaboration was initiated by the university LGBTQ group through email communication followed by in‐person meetings to plan a blood drive. Prior to drive recruitment, donor center medical staff and the LGBTQ group leadership reviewed criteria on donor eligibility and the importance of product safety. Also, diversity and sensitivity education on donor self‐identification guidelines were provided for donor collection staff. The LGBTQ group used fliers and social media to publicize the drive to its members. Members subsequently pledged to donate themselves (if eligible) or recruited others to donate (if personally ineligible). The group provided regulatory material on MSM donation to its members and recruitments prior to donation. On the day of the drive, the alliance set up their own table outside the donor center, where they provided information to interested participants about MSM regulations and the opportunity to sign a petition to the FDA.
Results/Finding: The partnership resulted in successful implementation of a collaborative blood drive with the LGBTQ group which was repeated for a second year. In the first LGBTQ blood drive, 31 donations were collected the first day of the drive and 30 donations the second day. The second year LGBTQ blood drive was held on one day and 23 donations were collected. These values were comparable to average daily collections for 24 donations per month.
Conclusion: Although overall donations numbers were similar, the blood drives were successful in building community with a university LGBTQ group, meeting both donor center and LGBTQ group goals, creating ongoing collaborations for future blood drives, and maintaining compliance with federal regulations. The 2018 blood drive is scheduled with hopes of drawing additional donors to the center and continuing to support our hospital values and initiatives to care for the LGBTQ community.
BBC113
Donor Feedback: How to Maximize the Donor Experience
Linda Ellerbe1 and Deylon Douglas*2
1Fort Bragg Blood Donor Center, 2Fort Bliss Blood Donor Center
Background/Case Studies: The Armed Services Blood Program (ASBP) was established in 1951 and became fully operational in 1962. As a tri‐ service organization, the ASBP collects, processes, stores and distributes blood and blood products to Soldiers, Sailors, Airmen, Marines and their families worldwide on a daily basis. Through the use of customer service cards we listen to the needs of our customers and stakeholders to measure their donating experience. The Cadet Summer Training blood drives consist of 17 different Regimental blood drives between July and August. Three participating ASBP Donor Centers (designated as Donor Center A, Donor Center B, and Donor Center C) coordinated to accomplish the drives, process and ship blood components. All blood must be shipped within 4 days of collection to overseas locations in support of US military operations. These blood drives are large in comparison to a “normal” blood drive as they will produce over 3,000 units of whole blood collectively
Study Design/Method: The comment card was used to measure cadet donor satisfaction with the length of time it took to donate blood. 1072 comment cards were distributed to 2908 cadet blood donors with a 57% response rate. “Strongly Agree” data was given a score of 5, “Agree” was a score of 4. The response percentage was multiplied by this score to determine a level of satisfaction with each donor center. This level of satisfaction was compared to the staffing model and mix of personnel that each of the three donor centers used at each drive. Staffing models differ in the number of phlebotomist, interviewers, and overall personnel.
Results/Finding: Of the three staffing variables, only the number of interviewers seemed to be correlated directly to the amount of satisfaction that cadet donors had with the amount of time spent donating blood. The overall satisfaction rate was 4.2%. The individual donor center rate ranging from 3.5 to 4.6 percent. The total staffing ranged from 21‐26 personnel and the number of phlebotomist ranged from 6‐8, with little fluctuation in overall satisfaction. Simply stated, when the number of staff members performing donor interviews was increased, the donor satisfaction increased.
Conclusion: This connection between interviewers and satisfaction will be used in the planning, budgeting and execution of future CST blood drives in the hope that ASBP might keep theses cadets as lifelong donors and advocates of the military program.
BBC114
Thrombocytopenia in Granulocyte Colony‐Stimulating Factor Mobilized Peripheral Blood Stem Cell Donors Associated with Increased Platelet Surface Antigens
Yifeng Wu*1,2, MingHui Gu2 and Tsofu Wang2
1Boston Children's Hospital, 2Buddhist Hualien Tzu Chi Hospital
Background/Case Studies: Granulocyte colony‐stimulating factor (G‐CSF) is widely used for prophylaxis and treatment of neutropenia in cancer patients and also or peripheral blood stem cell (PBSC) mobilization for collection. The aim of this study is to evaluate about the possible changes of platelet surface antigens after G‐CSF injection in PBSC donors.
Study Design/Method: Between January 1st and December 31st, 2014, 48 healthy voluntary donors with PBSC donation by Buddhist Tzu‐Chi Stem Cells Center were eligible for this prospective study. G‐CSF was given subcutaneously for 5 days, and then peripheral blood was collected for complete blood count and platelet surface antigens. Sixteen healthy controls were also included for comparison. Multiparameter flow cytometry immunophenotypic studies were performed.
Results/Finding: Decreased platelet count was found in PBSC donors compared to normal subjects (195,542/μL vs 252,000/μL, P<0.01). The platelet size measured by forward scattering (FSC) was also smaller in PBSC donors (39.3 vs 46.7 mean fluorescence intensity, P=0.02). CD31 were increased in PBSC donor (203.2 vs. 120.7, P<0.01), while other surface antigens were not different between PBSC donors and healthy controls. After adjusting by FSC data, the mean antigen density of CD31, CD41a, CD42a, CD42b and CD61 showed 5.45 vs 2.78 (P<0.01), 4.35 vs 3.47 (P<0.01), 3.87 vs 3.17 (P=0.02), 20.45 vs 16.94 (P=0.04), and 5.98 vs 4.88 (P=0.02) respectively.
Conclusion: In conclusion, we noted increased density of platelet surface antigens and mild decreased platelet count and size after G‐CSF injection. This association might explain that there were only few thrombotic or embolic events after G‐CSF injection.
BBC115
HLA Antibody Positive Donor Return Rate
Lefan Zhuang*, Matthew Hoffman, Andrea M. McGonigle, Alyssa Ziman and Dawn C. Ward
Division of Transfusion Medicine, Department of Pathology and Laboratory Medicine, David Geffen School of Medicine at UCLA
Background/Case Studies: Transfusion‐Related Acute Lung Injury (TRALI) is the most common cause of transfusion‐related fatality. The pathogenesis of TRALI is not completely understood. However, leukocyte antibodies directed against human leukocyte antigens (HLA) or human neutrophil‐specific antigens in donor plasma have been implicated in most cases. Studies have shown 11% to 33% of female donors with a prior pregnancy have HLA antibodies (HLA Abs). To reduce the risk of TRALI, current standards require that plasma (apheresis or from whole blood) and apheresis platelets (AP) for allogeneic transfusion from females with a history of pregnancy test negative for HLA Abs. To understand the impact of HLA Ab testing, we analyzed the return rate of donors with a history of pregnancy and a positive HLA Ab test.
Study Design/Method: Female donors with a positive HLA Ab test were notified by mail of their results and their ongoing eligibility for whole blood donation only. Donors negative for HLA Abs were recruited for AP donation. The return rate between September 2016 to December 2017 for donors tested for HLA Abs was comparatively analyzed.
Results/Finding: We tested 576 females with a history of pregnancy for HLA Abs; of those, 413 (71.7%) were community donors (CDs) and 163 (28.3%) were directed donors (DDs). Of all tested donors, 186 (32.3%) were HLA Ab positive. Of the 413 CDs, 133 (32.2%) were HLA Ab positive while 53 out of 163 (32.5%) DDs were HLA Ab positive. Of all donors tested, 390 (67.7%) tested negative for HLA Abs; 280 out of 413 (67.8%) CDs and 110 out of 163 (67.5%) DDs. Only 69 out of 186 (37.1%) of all donors who tested HLA Ab positive returned to donate whole blood; 67 out of 133 (50.4%) CDs and 2 out of 53 (3.8%) DDs. Overall, 228 out of 390 (58.5%) donors who tested negative for HLA Abs returned to donate AP and/or whole blood; 200 out of 280 (71.4%) CDs and 28 out of 110 (25.5%) DDs. HLA Ab positive AP CDs had a return rate of 43.3% whereas HLA Ab negative AP CDs had a return rate of 45.5% (Table 1).
Conclusion: Our results indicate that notification of a positive HLA Ab test deters most donors from donating in the future. However, for historical AP donors, the return rate was similar regardless of HLA Ab results suggesting they were not deterred.
TABLE 1 (BBC115) Return rate of donors tested for HLA Abs, % (number/total)
| HLA Ab Positive | HLA Ab Negative | All Tested Donors | |
|---|---|---|---|
| Community Donors | 50.4% (67/133) | 71.4% (200/280) | 64.6% (267/413) |
| Historical Apheresis Platelet Donors | 43.3% (29/67) | 45.5% (91/200) | 44.9% (120/267) |
| Directed Donors | 3.8% (2/53) | 25.5% (28/110) | 18.4% (30/163) |
| Total Donors | 37.1% (69/186) | 58.5% (228/390) | 51.6% (297/576) |
BBC116
Changes in Donor Deferral Rates and HCV Lookbacks Due to Implementation of New Testing Algorithm for HCV
Mona Papari*, Sandra Seraphin‐Daway and Jason E. Crane
ITxM/LifeSource
Background/Case Studies: The algorithm for testing of repeat reactive (RR) results for antibodies against Hepatitis C (anti‐HCV) has changed after production of the CHIRON RIBA HCV 3.0 SIA (RIBA) was discontinued by its manufacturer; the RIBA test was the only supplemental/confirmatory test for anti‐HCV licensed in the US for testing of blood donors. While the assay was still available, our blood center was testing all RR anti‐HCV where the HCV NAT was negative by RIBA. The current testing algorithm involves testing samples found to be RR for anti‐HCV (initial test for anti‐HCV is a chemiluminiscent assay anti‐HCV 3.0 ChLIA) by an alternate screening method for anti‐HCV (enzyme immunoassay Anti‐HCV 3.0 EIA). The samples which were RR for anti‐HCV and NAT HCV positive were not tested any further.
Study Design/Method: We analyzed the RR rates for anti‐HCV for five years prior to (2008 to 2012) and five years after discontinuation of RIBA (2013 to 2017) in order to see if there was any significant impact on donor deferrals due to RR anti‐HCV, NAT HCV negative. Our blood center defers all donors who test RR for anti‐HCV, regardless of results of supplemental or confirmatory testing, and we do not currently have reentry protocols in place, however reentry may be considered after six months. The indeterminate and positive RIBA results were associated with HCV lookbacks, and positive results by both anti‐HCV screening methods are also associated with lookbacks. The RR rates were calculated as a percentage out of the total number of donors per year, and the results of the supplemental/confirmatory results were calculated as a percentage out of the total number of donors per year as well as a percentage out of the RR results.
Results/Finding: The results are summarized in the table below.
RR and RIBA Rates per Year. Years in bold indicate RIBA availability
| RR Rates (%) | Positive Donors (%) | Negative Donors (%) | Indeterminate Donors (%) | |
|---|---|---|---|---|
| 2008 | 0.13 | 33.10 | 50.35 | 16.55 |
| 2009 | 0.10 | 39.04 | 45.18 | 15.79 |
| 2010 | 0.08 | 31.82 | 56.82 | 11.36 |
| 2011 | 0.07 | 20.25 | 60.13 | 19.62 |
| 2012 | 0.06 | 10.08 | 68.91 | 21.01 |
| 2013 | 0.05 | 29.35 | 70.65 | N/A |
| 2014 | 0.06 | 33.98 | 66.02 | N/A |
| 2015 | 0.04 | 37.70 | 62.30 | N/A |
| 2016 | 0.05 | 28.38 | 71.62 | N/A |
| 2017 | 0.07 | 30.00 | 70.00 | N/A |
Conclusion: The discontinuation of RIBA did not have a major impact on either donor deferral, and subsequent donor notification, or initiation of lookbacks for HCV, as the percentages of RR donors testing positive or indeterminate by RIBA are similar to the percentages testing positive by the current methods. From our analysis, it seems that those cases previously resulted as indeterminate, may have been in fact not indicative of anti‐HCV detection, as the negative rate on supplemental testing has increased after RIBA discontinuation, from 45% ‐ 69% to 62% ‐ 72%, but this cannot be concluded with certainty since samples were not tested by the current methods. From the point of view of those donors who were previously notified of indeterminate RIBA results, being categorized as either positive or negative on both anti‐HCV screening tests may lead to a better understanding of their HCV test results.
BBC117
Comparison Study between Terumo Automated Centrifuge and Separation Integration (TACSI) PL System and Conventional Pooling Kit for Preparation of Pooled Platelets
Siti Khadijah Abdul Razak*, Shu Pei Huey, Leong Tong Seng and Chia King Kiang
Health Sciences Authority Singapore
Background/Case Studies: Blood Services Group (BSG) implemented whole‐blood derived pooled platelet by buffy coat method in 2012. Back then, BSG prepared pooled platelets using conventional pooling kits by train‐pooling method of 4 buffy coat units and a unit of plasma with centrifuges and semi‐automated extractors. This method was tedious and time consuming with a significant amount of manual handling. In March 2017, BSG adopted the use of TACSI PL Kit by fan‐pooling method of 4 buffy coat units and a unit of plasma with the TACSI PL system for pooled platelets preparation with the aim to improve efficiency for the platelet preparation process.
Study Design/Method: This study is to compare the quality parameters, process efficiency and workflow after switching the pooled platelet preparation process to the TACSI PL system.
All quality control (QC) parameters data over a 1 year period for both conventional platelet pooling kit system and TACSI PL System were analysed. The QC measurements studied were (1) volume, (2) pH measurement, (3) residual leukocyte count, (4) platelet yield and (5) sterility testing. Descriptive statistical and graphical analysis were performed using Microsoft Excel. The total time and number of staff required for processing a typical batch of 24 units of pooled platelets of the two different method were studied. Workflow and space requirement for both processing system were also compared.
Results/Finding: All quality parameters for both methods were within the specified QC criteria with no significant difference. The total processing time for a batch of 24 units of pooled platelets had significantly reduced by 32% with the TACSI PL system. Staffing requirement also reduced from 3 to 2 headcounts with the new system. The workflow for TACSI PL system is also more streamline with fewer steps and shorter walking distance. Physical pooling of buffy coat is easier and faster with fan‐pooling method as compared to the train pooling method of the previous system. Balancing of buckets for centrifugation in TACSI PL system is no longer required as the equipment is able to self‐balance. Space requirement for pooled platelet processing for accommodating all equipment, workbenches and working space has also reduced by 28%.
Conclusion: Quality indicators of pooled platelet using TACSI PL System were equivalent to those prepared from the conventional pooling kit. The TACSI PL system has streamlined the work processes and improved significantly in operation efficiency.
BBC118
Perception on Blood Donation Among the Youth in Oman; A Cross‐Sectional Study
Arwa Z. Al‐Riyami*1,2, Munther Draz3, Fatma Al‐Haddadi3, Aisha Al‐Kaabi3, Abdullah Al‐Manthari3 and Sathiya M. Panchatcharam2
1Sultan Qaboos University Hospital, 2Oman Medical Specialty Board, 3College of Medicine and Health Sciences, Sultan Qaboos University
Background/Case Studies: Donor recruitment and retention pose an ongoing challenge to blood banks worldwide. Internationally, there is a continuous need for new blood donors to meet the increasing demands. One approach to improve the effectiveness of donor recruitment strategies is to target influencing factors. This study aims at identifying the perception of Omani youth toward blood donation in order to identify factors that explain the intention to donate blood.
Study Design/Method: A comprehensive anonymous voluntary survey was developed and used to assess perception of students aged 18‐25 attending the Sultan Qaboos University (SQU) and other universities (non‐SQU) over a two years' period (2016‐2017). Analysis was performed using IBM SPSS Statistics 22.0. Categorized variables were presented in number with percentages and associations between the groups were analyzed using Chi‐square test. A p‐value of < 0.05 was considered statistically significant.
Results/Finding: A total of 600 students were surveyed (males 43.5%, females 56.5%). Only 27% donated blood previously, with 48% of the donors donated only once. Half of the surveyed students thought they have enough knowledge on blood donation, with 93% and 85% reported social media and the university as the main sources for knowledge respectively. Education at school was reported by 60% of surveyed students, while influence of parents and peers was reported by 59% and 72% respectively. Personal morals such as altruism was reported by 80%. Awareness of blood bank location and blood drives was reported by 81% and 88% of SQU students and 36% and 49% of non‐SQU students. There was a statistically significant difference in the motivating and discouraging factors toward blood donation between SQU and non‐SQU students (table).
Conclusion: SQU students reported higher rates of motivating and lower rates of discouraging factors factors toward blood donation compared to non‐SQU students. This reflects the influence of the increasing efforts to improve the knowledge on blood donation and recruitment among the students at SQU, through running a yearly competition between the colleges in blood donation. There is a need to extend these efforts to the society to improve awareness of blood donation. Distinct promotion strategies should be adopted to increased first time and repeated blood donation among the youth.
TABLE (BBC118)
| Parameter | Variables | SQU (n=300) N(%) | Non‐SQU (n=300) N(%) | P value |
|---|---|---|---|---|
| Motivating factors | Peers influence | 252(84) | 182(60.7) | <0.001 |
| Personal knowledge | 247(82.3) | 224(74.7) | 0.029 | |
| Feeling of satisfaction | 268(89.3) | 213(71) | <0.001 | |
| Knowledge of need for donors | 283(94.3) | 251(83.7) | <0.001 | |
| Commitment to the society | 271(90.3) | 234(78) | <0.001 | |
| Discouraging factors | Fear from needles | 54(18) | 96(32) | <0.001 |
| Fear from blood | 47(15.7) | 88(29.3) | <0.001 |
BBC119
Alternatives to Time Deferral for Men Who Have Sex with Men: Frequency of Behaviors and Acceptability of Individual Risk Questions to Donors
Sheila O'Brien*1, Elise Roy2, Genevieve Myhal3, Mindy Goldman1, Lori Osmond1 and Pierre Robillard3
1Canadian Blood Services, 2Sherbrooke University, 3Héma‐Québec
Background/Case Studies: In Canada, men who have sex with men are deferred for 12 months since last sexual contact. Risk questions that do not identify donors as MSM could allow low risk sexually active MSM to donate. Individual risk assessment questions could be included on the Donor History Questionnaire (DHQ) either individually to identify donors for deferral or to be used in an algorithm to identify low‐risk individuals. It is unclear what impact such alternative risk questions would have on donors and collections. We surveyed whole blood donors to determine what proportion would answer yes to potential alternative risk questions, and to rate the acceptability of being asked the questions on the DHQ.
Study Design/Method: Two questionnaires were developed. Q1 asked potential individual risk questions in recent time periods. Q2 asked donors to rate their comfort with answering these questions on a 5 point scale. Over a 3 week period in January/February 2018, all whole blood donors attending a collection site in Canada were invited to self‐complete a paper questionnaire. The days of Q1 and Q2 were randomized.
Results/Finding: Of 36,241 donors attending, 31,904 (88%) completed Q1. Of 34,947 donors attending, 30,278 (87%) completed Q2. First time donors were more likely to answer yes to risk questions than repeat donors (Table 1, p<0.01) although more said they used condoms. Many donors said they were uncomfortable (defined as somewhat uncomfortable, very uncomfortable or would refuse to donate) being asked about anal sex (18%) on the DHQ, and 7 – 9% were uncomfortable with the other questions.
TABLE 1 (BBC119) Percentage of donors with potential risk factors in the last 12 months and percentage that are uncomfortable with these questions
| Questionnaire 1 (% Participated in activity in last 12 months) | Questionnaire 2 (% Uncomfortable being asked) | |||
|---|---|---|---|---|
| FIRST TIME (N=4,251) | REPEAT (N=27,653) | ALL (N=31,904) | ALL (N=30,278) | |
| Number of Sexual Partners | ||||
| 0 | 30 | 25 | 26 | 8 |
| 1 | 53 | 66 | 64 | |
| 2+ | 17 | 9 | 10 | |
| New Sexual Partner | 18 | 10 | 11 | 7 |
| Anal Sex | 7 | 5 | 5 | 18 |
| Used condoms every time | 20 | 12 | 13 | 9 |
Conclusion: Risk questions that are often proposed as alternatives to the MSM history questions identify significant proportions of donors, particularly new donors. Deferral based on any of these questions would have a substantial negative impact on blood collections in general, and particularly on recruitment of new donors. Questions about anal sex appear to be the most sensitive.
BBC120
Robustness of the Verax PGDprime® Test for Bacteria in Platelets to Interfering Substances in Samples
Lisa Shinefeld*, Nancy Best, Miranda Williams, Erica Boudreau and Remo Vallejo
Verax Biomedical Inc.
Background/Case Studies: The PGDprime test for bacteria in platelets is a lateral flow assay developed as an improvement of the PGD® test currently used as a Safety Measure for platelet transfusion. It simplifies the test procedure of the current product. Its robustness to sample matrix variations was challenged by testing negative and positive samples with various matrix conditions and components at levels higher and lower than the expected normal range for platelet samples.
Study Design/Method: Platelet samples were produced with potential interferents at levels listed in the table below. These were tested using a blinded 12‐member bacterial spiking panel, comprising 11 strains of bacteria and one negative panel member.
Results/Finding:
TABLE: (BBC120) Effect of Interferents on Assay Accuracy and Validity
| Platelet Parameter: | Interferent levels: | Samples Tested (N) | Results |
|---|---|---|---|
| pH | 5.5 ± 0.2, 8.5 ± 0.2 | 10 | All bacteria detected. No effect on negative samples. |
| Hemolysis | 0, 50, 200, 350 mg/dL added Hemoglobin | 9 | All bacteria detected. No effect on negative samples. |
| Red Blood Cells | 0, 0.35%, 0.7% added hematocrit | 11 | All bacteria detected. No effect on negative samples. |
| White blood cells | 0, 3‐5 × 10⁴ and 3‐5 × 10⁵ white cells added per mL to leukoreduced platelets | 4 | All bacteria detected. No effect on negative samples. |
| Platelet concentration | 0.5X supplied concentration, as supplied, and 2X supplied concentration | 10 | All bacteria detected. No effect on negative samples. |
| Platelet additive solution concentration | from 0% to 100% PAS‐C added to platelet pellet | 8 | All bacteria detected. No effect on negative samples. |
| Donor Condition: | Interferent levels: | ||
| ds‐DNA | Up to 740 U/mL | 7 | All bacteria detected. One sample tested positive before spiking. |
| ANA | Titer > 1:100 | 7 | All bacteria detected. No effect on negative samples. |
| Rheumatoid factor | Up to 48 IU/mL | 14 | All bacteria detected. No effect on negative samples. |
| HAMA | ∼10 ng/mL to > 250 ng/mL | 13 | All bacteria detected. No effect on negative samples. |
| High IgM | >275 mg/dL | 7 | All bacteria detected. No effect on negative samples. One sample did not flow (Invalid) |
| High IgG | >2000 mg/dL | 7 | All bacteria detected. No effect on negative samples. |
| High IgA | >500 mg/dL | 7 | All bacteria detected. No effect on negative samples. |
| Triglycerides | >300 mg/dL | 8 | All bacteria detected. No effect on negative samples. |
| Hypercholesterolemia | >350 mg/dL | 8 | All bacteria detected. No effect on negative samples. |
| Low Total Protein | <5.6 g/dL | 7 | All bacteria detected. No effect on negative samples. |
| High Total Protein | >9.0 g/dL | 10 | 2 samples did not flow. 2 samples showed false positive results. For 6 samples, all bacteria detected with no effect on negative samples. |
Conclusion: The sample conditions tested did not interfere with bacterial detection nor create false positive results except for some samples with high total protein or immunoglobulin levels which produced invalid or false positive results. Patients with these abnormal conditions would be infrequent platelet donors.
BBC121
SARS Coronavirus Is Efficiently Inactivated in Platelet Concentrates by UVC Light Using the Theraflex UV Platelets Technology
Ute Gravemann*1, Markus Eickmann2, Wiebke Handke1, Frank Tolksdorf3 and Axel Seltsam1
1German Red Cross Blood Service NSTOB, 2Institute of Virology, Philipps University Marburg, 3Maco Pharma International, GMBH
Background/Case Studies: Severe acute respiratory syndrome (SARS) caused by SARS‐coronavirus (SARS‐CoV) is a zoonotic disease that emerged in epidemic form in early 2003 in China and spread worldwide in a few months. SARS‐CoV caused over 8000 human infections with nearly 800 deaths between November 2002 and September 2003. Although there are currently no confirmed reports of the transmission of SARS‐CoV from asymptomatic individuals, recent research data indicate that transfusion‐transmitted SARS‐CoV is at least theoretically possible. This study aimed to investigate the efficacy of the THERAFLEX UV‐Platelets system to inactivate SARS‐CoV in platelet concentrates (PCs). The THERAFLEX UV‐Platelets system (Macopharma) uses UVC light only without the need of any additional photoactive compound.
Study Design/Method: Plasma reduced PCs from 5 BCs (35% plasma in additive solution SSP+(MacoPharma)) were spiked with virus suspension (10% v/v). PCs (n=2, 375 mL) were then UVC‐irradiated on the Macotronic UV machine (Macopharma) and samples were taken after spiking (load and hold sample) and after UVC treatment with different doses (0.05, 0.1, 0.15 and 0.2 (standard) J/cm2)). The titer of SARS‐CoV (strain Frankfurt 1) was determined as tissue culture infective dose (TCID50) by endpoint titration on Vero E6 cells (ATCC CCL‐22).
Results/Finding: The results of the infectivity assay demonstrated that UVC irradiation dose‐dependently inactivated SARS‐CoV. After spiking a SARS‐CoV titer of 5.80 (bag no.1) and 5.98 (bag no. 2) log10 TCID50/mL was received in the PCs. At a UVC dose of 0.1 J/cm2 and higher SARS‐CoV was inactivated down to the detection limit of the system (2.37 log10 TCID50/mL), resulting in log10 reduction factors of ≥ 3.4 (bag no. 1) and ≥3.6 (bag no. 2).
Conclusion: Our results demonstrate that the THERAFLEX UV‐Platelets procedure is an effective technology to inactivate SARS‐CoV in contaminated PCs.
BBC122
Segment Retesting of Donors with Red Cell Antibodies
Ashtyn Conway*, Mark Destree, Theresa Nester and Colleen Lammers
Bloodworks Northwest
Background/Case Studies: In 2015 a pilot study was performed internally using a 2 cell antibody screen to retest for red cell antibody reactivity in RBC units after leukofiltration and addition of AS3 (110 mL) using integral segments. Data suggested that 28.2% of RBC units centrifuged hard (4150 RPM for 9 min) retested negative, while 10.3% of RBC units centrifuged soft (3000 RPM for 4 min) retested negative. Based on these data our institution applied for and received an FDA variance to retest RBC units with donor antibodies from segments. If retesting is negative, these RBC units are released into general inventory without additional labeling or antibody identification. This is beneficial as local transfusion service practice dictates very limited ability to transfuse antibody‐positive RBCs.
Study Design/Method: Red Cell antibody testing is performed on a 6mL EDTA sample using the Immucor Capture‐R® Ready‐Screen® (Pooled Cells). Reactive samples are confirmed by 2‐cell antibody screen performed using Ortho MTS Anti‐IgG Gel Card™. Plasma products are discarded based upon the original antibody screen results.
Once processed using a hard spin, 4 segments are obtained from each RBC unit showing reactivity and retested using a pooled group O cell suspension in the Ortho MTS Anti‐IgG Gel Card™.
Samples that test positive are sent to our Transfusion Service for a routine antibody ID and the specificity is applied to a tie tag attached to the RBC unit. Samples retesting negative with the pooled cell screen are released into inventory. Antibody identification is performed if screen reactivity is new.
| Centrifugation Parameter | No. Tested | No. Retesting Neg | Percent Retesting Neg |
|---|---|---|---|
| Hard | 107 | 48 | 44.9% |
| Soft | 65 | 18 | 27.7% |
| Total (Hard + Soft) | 172 | 66 | 38.4% |
Results/Finding: The percentage of hard‐centrifuged donations retesting negative was 44.9% vs. 28.2% in the original study. The percentage of soft‐centrifuged donations retesting negative was 27.7% vs. 10.3% in the original study.
Conclusion: Although both hard and soft spins during processing of a red cell will remove red cell alloantibodies, the hard spin is more effective. Compared to the pilot project where a 2 cell antibody screen was used, use of a pooled cell antibody screen is standard current practice in donor testing laboratories, and leads to a lower percentage of antibody positive units.
As a practical application, instructions are inserted into the registration record of donors demonstrating RBC antibodies, so that their donation is collected in the bag set which ensures hard‐centrifugation. In theory, this will increase the composite rate of donors retesting negative on segments from 38.4% to 44.9%.
BBC123
“Is It Time to Retire Weak D Tube Testing for Rh Negative Babies of RhIG Candidate Mothers? Do We Have Enough Data That Gel Technology Picks Up the Most Common Types of Weak D during Routine Testing?”
Cristine F. Clemente Dos Santos*
Elmhurst Memorial Hospital
Background/Case Studies: Weak D testing is not currently required for prenatal or patients requiring blood transfusion, however it is still required to be performed on Rh negative babies of Rh negative mothers to assess the risk of D immunization and to determine if they are RhIG candidates. Because the reagents for D typing over the year have changed and Weak D testing is usually performed by the tube method, new technologies as the Gel methodology may be more sensitive by detecting Weak D phenotypes during routine testing without additional incubation at AHG phase. Therefore it is possible that if a laboratory performs routine testing using gel methodology, Weak D tube testing could be discontinued even for Rh negative babies of Rh negative mothers. But do we have enough data?
Study Design/Method: Over a period of six months, from January 2017 to June, 2017, 66 cord blood samples were tested by three different methodologies, 42 cord blood were found to be Rh positive and 14 Rh negative. The cord blood were tested using automated gel methodology, manual gel methodology the tube method Weak D by incubating for 15 min at 37°C. Automated and gel methodology was performed using the Erytra analyzer and gel cards manufactured by Grifols Diagnostics. The D tube typing was performed using Seraclone monoclonal anti‐D (RH1) blend by BioRad Medical Diagnostics.
Results/Finding: Of the 66 cord blood tested, 30.4% (14) cords were found to Rh negative and 69.6% (42) were found to be Rh pos. No discrepancy was found for all Rh negative cord blood tested by both gel and the tube methods however of the 46 Rh pos cord bloods, 2 were typed as Rh neg at Immediate spin tube method but yield a 4 + using the gel method, automated and manual. All Rh pos cord bloods were weak D positive at AHG phase using the tube method. No Rh negative cord blood in gel was found to be Rh positive by the tube method therefore proving the theory that no Weak D tube testing should be required if a cord blood is found to be Rh negative by the gel method.
Conclusion: The gel methodology was able to identify two babies as Rh positive without any further testing however if the tube testing is the primary methodology, anti‐D testing at AHG would still be required. At this point it is believed that the gel methodology would detects most of types of Weak D or Partial D phenotypes during routine testing, therefore if the primary method of testing by a transfusion medicine laboratory is gel, the Weak D tube testing should be discontinued for cord blood testing.
BBC124
Comparison of Four Plateletpheresis Devices in the Search for the Most Efficient and Flexible Tool
Lilach Bonstein*1,2, Poulina Abu Shkara1, Eran Goldshtain1, Zvi Malkis1, Eldad Dann1 and Lika Shapira1
1Blood Bank, Rambam Health Care Campus, 2Platelet Immunology Laboratory, Rambam Health Care Campus
Background/Case Studies: Single donor platelets (SDP), derived by apheresis, had been used only as a second option at our institution due to their higher cost, with pooled random donor platelet concentrates (PC) being the first choice. To reduce patient exposure to PC originating from multiple donors and associated adverse effects, a Plateletpheresis Donation Subdivision capable to meet an annual need of 500 SDP units has been established at our blood bank. While the reason for such sustainable in‐house production is mediated by clinical advantages of using SDP over PC, the economic efficiency of this approach is also a key factor in decision making regarding its implementation. Most of our donors are first‐time donors, some with borderline venous access, which entails a search for an economically efficient device adaptable to a wide range of donors.
Study Design/Method: Collection efficiency (CE) and rate, processing time, donor adaptability and exposure to anticoagulant (ACDA) were retrospectively compared using four apheresis devices: Amicus (Fresenius) and Cobe Spectra (Terumo BCT) using double‐needle collection sets as well as Spectra Optia and Trima Accel‐7 (both Terumo BCT) using single‐needle sets. To evaluate device applicability to a variety of donors, they were categorized to 4 groups based on their venous access, group 1 being the most difficult to manage (smallest venous diameter).
Results/Finding: This analysis included data from 800 procedures, 200 performed on each device. Males comprised 98% of donors, 93% were first‐time donors with an average age, TBV, hematocrit and platelet pre‐count of 34y, 5376ml, 43% and 232 × 109/L, respectively. CE was highest with Spectra Optia (65.4%) followed by Trima Accel‐7 (63.7%), Amicus (52.6%) and Cobe Spectra (49.5%). However, Trima Accel‐7 was significantly more economically efficient, with 72.6% of collections yielding double‐dose units compared with 61%, 54% and 50.4% by Cobe Spectra, Spectra Optia and Amicus, respectively. Collection rate (yield/duration) of Trima Accel‐7 was significantly higher (7.1 × 10⁹Plt/min) than that of other devices (6.3, 5.9 and 5.6 × 10⁹Plt/min for Spectra Optia, Cobe Spectra and Amicus, respectively). The ACDA volume used with Amicus was significantly greater than with other systems (p<0.0001). While Spectra Optia was suitable solely for donors in groups 3 and 4 (37% of donors), Cobe Spectra and Amicus (double‐needle) were adaptable to a wider range of donors from groups 2‐4 (88%). Only Trima Accel‐7, although using a single needle set, could be adapted to 100% of donors due to its ability to adjust to both low and high venous resistance.
Conclusion: Of the four evaluated devices, Trima Accel‐7 was found to be most efficient, yielding a maximal number of double‐dose SDP units, and most compatible with diverse donor population, providing the highest collection rate with minimum ACDA exposure.
BBC125
Blood Product Transfer Initiative to Decrease Cost and Wastage
Silvia Arango* and Mercy Kuriyan
Robert Wood Johnson University Hospital Somerset
Background/Case Studies: Hospital‐based blood donor centers can benefit patients by making blood products available routinely and during national blood shortages and disasters. In our hospital based blood donor center, collections comprises about 45% of apheresis platelets, 70% of red blood cells and 100% of fresh frozen plasma (FFP) transfusions. However, 45% of platelets expired every year due their short life span (5 days) and 67% of plasma collected was made into recovered plasma, a non‐transfusable product that is less useful/ less cost effective because production surpassed the transfusion needs of the hospital. A process was needed to improve and better utilize the staff and resources, avoid wastage and maximize blood component production.
Study Design/Method: This quality improvement began in October 2014. It started with the transfer of excess production of fresh frozen plasma (FFP) and unused platelets to the main hospital, a trauma center, prior to expiration. The project required obtaining large transport coolers and validation, revise the standard operating procedure (SOP), validate the shipping function of the blood bank computer system to create a packing slip and get statistical reports, revise the FDA registration, find an efficient and cost effective way to obtain wet ice for red cell transport, and dry ice for FFP transfer, establish an effective communication system between facilities and reliable and cost effective transportation of the product. Finally, a −80°C freezer was purchased to store the FFP collected by the blood donor center.
Results/Finding: Wastage of platelets and plasma was reduced from 4484 units in 2013 to 4242 in 2014, 3068 in 2015, 2581 in 2016 and 542 in 2017. Platelets and FFP production increased from 977 units in 2013 to 834 in 2014, 1,688 in 2015, 1,982 in 2016 and 1781 in 2017. Savings occurred immediately from zero (0) in 2013 to $32,910 in 2014, $101,380 in 2015, $146,340 in 2016 and $168,900 in 2017. Savings between 2014 and 2017 were $449,530.
Challenges included obtaining wet ice to transport red blood cells and dry ice for the FFP, reliable transportation and efficient communication with the receiving facility. Several innovative ideas were tried and discarded until a final solution worked.
The main hospital later on started sending irradiated blood products to our transfusion service in return, avoiding the need to order irradiated blood products from a blood center, savings added up to an extra $124,970.
(BBC125)
| 2013 | 2014 | 2015 | 2016 | 2017 | |
|---|---|---|---|---|---|
| Annual products wasted | 4,484 | 4,242 | 3,068 | 2,581 | 542 |
| Annual platelets and FFP production | 977 | 834 | 1,688 | 1,982 | 1781 |
| Annual products transferred | 0 | 69 | 703 | 1,452 | 1286 |
| Savings per year | 0 | $32,910 | $101,380 | $146,340 | $168,900 |
Conclusion: The blood product transfer initiative had improved the blood product management and cost savings to the organization as a whole. Joint initiatives between similar departments in sister institutions can lead to substantial quality improvements as shown. Areas for collaboration in Transfusion Medicine in the future are blood collections, therapeutic apheresis, stem cell collection, antibody identification and provision of compatible blood products for complex red cell and platelet antibodies among others.
BBC126
Prevalence of HLA‐Alloantibodies in a Cohort of Men Who Have Sex with Men
Harold Sullivan*1, Colleen F. Kelley2, Christina L. Dean1, Patrick S. Sullivan3, Shilpee Biswas4, John D. Roback1, Robert A. Bray4 and Howard M. Gebel4
1Emory University School of Medicine, 2Department of Medicine, Division of Infectious Diseases, Emory University School of Medicine, 3Department of Epidemiology, Rollins School of Public Health, Emory University, 4HLA Laboratory, Emory University Hospital
Background/Case Studies: In 2006, in an effort to mitigate the incidence of transfusion‐related acute lung injury (TRALI) the AABB recommended measures to reduce the incidence of transfusing high plasma volume products (HPVP) from donors who may possess HLA antibodies. Given that multiparous women have a higher prevalence of HLA antibodies, the majority of HPVP are now collected from male donors. Of note, the male donor pool expanded in December 2015 when the FDA changed its policy from indefinite deferral of men who have sex with men (MSM) to a one‐year deferral from last sexual encounter. As MSM are now eligible to donate, the presence of HLA antibodies could have implications in HPVP donation. Thus, the aim of this study was to determine the prevalence of HLA antibodies amongst a cohort of MSM.
Study Design/Method: Banked serum samples were obtained from MSM enrolled in the Emory Involvement study, an observational cohort study of sexually active MSM conducted from 2010‐2014. HLA antibodies were detected by flow cytometry screen (FlowPRA®, One Lambda, Canoga Park, CA). Results of Class I and Class II HLA antibodies were assessed in the entire cohort and compared between those with HIV‐positive and ‐negative controls.
Results/Finding: Serum samples from 81 subjects were tested. Overall, 6/81 (7%) individuals had positive FlowPRA screens. Three individuals had class I antibodies alone, 1 had class II antibodies alone, and 2 had class I and II antibodies. The average PRA was 10% (class I) and 12% (class II). Of the 81 MSM, 45 were HIV‐negative and 36 were HIV‐positive. The prevalence of HLA antibodies was similar in the HIV‐positive and ‐negative groups with 3/36 (8%) and 3/45 (7%), respectively. Among the HIV‐positive males, 2 had class I antibodies alone while the other had class I and II antibodies. In the HIV‐negative group, 1 had class I antibodies alone, 1 had class II antibodies alone, and 1 had class I and II antibodies.
Conclusion: To our knowledge, this is the first description of the prevalence of HLA antibodies among sexually active MSM. We found that approximately 7% of MSM in our cohort had HLA antibodies, which is higher than previous reports of the general male blood donor population (1‐2%). Also, we found no difference in the prevalence of HLA antibodies between HIV‐positive and –negative MSM, indicating HLA sensitization is not impacted by HIV status. The data provided herein may prove useful in collection and testing practices and policies for MSM donors. In particular, as of 2014 AABB Standard 5.4.1.2 stipulates that previously pregnant women can donate HPVP provided that screening for HLA antibodies is negative. The higher prevalence of HLA allosensitization in MSM compared to the total male population warrants consideration of screening MSM prior to HPVP donation.
BBC127
Sensitivity and Specificity Performance of a New Automated System for the Detection of HTLV I and HTLV II Antibodies in Blood and Plasma Donors
Melanie Anderson1, Rebecca Haley2, Scott Jones3, Toby Simon4, Susan L. Stramer5, Lynn Martin*1 and George Chen1
1Abbott Laboratories, 2Bloodworks Northwest, 3QualTex Laboratories, 4CSL Plasma Laboratory, 5American Red Cross
Background/Case Studies: Universal blood screening is necessary to prevent transfusion transmitted HTLV infections (anti‐HTLV I/HTLV II) in endemic countries. In non‐endemic countries, selective testing may avoid unnecessary deferrals for donors at high risk, such as returning travelers from or donors born in countries with a high HTLV prevalence. Blood centers require high throughput anti‐HTLV I/HTLV II assays with high specificity and sensitivity to prevent unnecessary donor deferrals while maintaining a safe blood supply. In addition, continued pressures on laboratory operations demand that assays perform on platforms capable of increased walk away time and enhanced automation in areas of reagent management, retest options, and commodity/waste management. To address the need for such screening assays, an improved automated assay for the detection of antibodies against HTLVI/II has been developed.
Study Design/Method: The performance of the new chemiluminescence immunoassay for the detection of antibodies to HTLV I and HTLV II was evaluated on a next generation automated platform, Abbott Alinity s. Reproducibility was assessed over 5 days using HTLV I and HTLV II positive samples. Specificity was evaluated on samples obtained from volunteer blood donors (n=15,877) obtained from the United States. Sensitivity was evaluated using 706 preselected anti‐HTLV I, anti‐HTLV II, and anti‐HTLVI/II undifferentiated positive specimens, and samples from individuals with HTLV I/II associated diseases. Sensitivity and specificity samples were split across 3 reagent lots during testing. Confirmation of repeatedly reactive specimens was done using the MP Diagnostic HTLV Blot 2.4.
Results/Finding: Within‐Laboratory imprecision was less than 4.0% for positive samples over 5 days of testing. Clinical sensitivity was 100.00% (706/706). The specificity was 99.99% (15,864/15,866) on a blood donor population.
Conclusion: The new automated Alinity s HTLV I/II assay provided specificity and sensitivity comparable to the licensed comparator assay. These results indicate that the new Alinity s automated HTLV I/II assay provided acceptable performance in specificity, sensitivity, and precision.
BBC128
Detection of Malaria DNA in a Malaria Antibody Non‐Reactive Blood Donor: A Case Report
Ramir Alcantara* and Hwee Huang Tan
Health Sciences Authority Blood Services Group
Background/Case Studies: Transfusion Transmitted Malaria remains a rare but serious complication associated with blood transfusion in non‐malaria endemic countries like Singapore. Recent evidence suggests that the main risk of introducing malaria into the blood supply in most non‐endemic countries are from donors who are previous residents of malaria endemic areas. These donors are considered “semi‐immune” with low level parasitemia but are asymptomatic. Malaria antibody testing has been used in several non‐endemic countries to identify these “semi‐immune” blood donors to prevent transfusion transmitted malaria. Reported here is the detection of Malaria DNA by PCR in a Malaria antibody non‐reactive donor who is a previous resident of a malaria endemic area.
Study Design/Method: The donor is a 35 year old male from India who donated for the 1st time in Singapore. He denied any history of malaria infection and informed the blood bank that his last visit to India was 9 months ago. The donor was allowed to donate and malaria antibody testing and PCR were performed in parallel to assess the malaria risk in the donor.
Results/Finding: Results showed the malaria antibody test to be non‐reactive but Plasmodium DNA using PCR was detected in the donor's sample. The sample was sent to the reference laboratory and Plasmodium vivax was identified. The donor's donation was discarded and was immediately contacted by a senior medical staff to inform him of the results. A new sample was collected one week after for repeat testing and showed the same results. Both donation and follow up samples were sent to another laboratory performing malaria antibody testing and showed the same non‐reactive result using a different test kit. Results of the investigation are summarized in Table 1. The donor was permanently deferred and referred to an infectious disease clinic for further evaluation and management.
TABLE 1 (BBC128) Malaria Testing Results
| Antibody test (in House) | Antibody test (External Lab) | PCR | Reference Lab (PCR) | |
|---|---|---|---|---|
| Donation sample | Non‐Reactive | Non‐Reactive | Plasmodium DNA detected | Plasmodium vivax identified – low parasite load |
| Follow Up sample | Non‐Reactive | Non‐Reactive | Plasmodium DNA detected | Plasmodium vivax identified – low parasite load |
Conclusion: The case presented demonstrates that transfusion transmitted malaria can still occur in countries which only perform antibody testing to screen blood donors. If malaria PCR was not performed in parallel to the antibody testing, the donation from the donor would have been issued for use and may have transmitted malaria to patients requiring blood transfusion. Further studies are required to determine the incidence and significance of antibody non‐reactive but PCR positive cases especially in non‐endemic countries wherein a significant number of donors are previous residents of a malaria endemic area.
BBC129
Optimizing the Deglycerolization of Manually Glycerolized Red Blood Cells Using an Automated Cell Processor
Audrey Laforce‐Lavoie, Jessica Costanzo‐Yanez, Marie‐Joëlle De Grandmont, Marie‐Claire Chevrier and Marc Cloutier*
Héma‐Québec
Background/Case Studies: Our inventory contains rare red blood cells (RBC) that were glycerolized using Meryman's manual method. Currently, these units are deglycerolized using the COBE 2991, which is outdated and will need to be replaced shortly. Although an automated cell processor was integrated into our activities for the glycerolization and deglycerolization of RBC, it has not yet been validated for the deglycerolization of manually glycerolized RBC units. This study aims at optimizing the deglycerolization of manually glycerolized units using an automated cell processor system. Since some units are still manually glycerolized in our current operations, the optimization also includes determination of the optimal age of the RBC units at the moment of freezing.
Study Design/Method: Twenty manually glycerolized RBC units from our inventory, which had been frozen for approximately ten years, were thawed in a 37˚C water bath and deglycerolized using an automated cell processor system (ACP 215, Haemonetics) and suspended in AS‐3. In a separate experiment, 30 additional RBC units were manually glycerolized 4, 7, 14, 21 or 28 days post‐collection (n=6 per group). Units were frozen at −80˚C for 14 days. Units were then thawed and deglycerolized with the ACP 215. Finally, to improve recovery, deglycerolization after a centrifugation step was tested and compared to a deglycerolization process without centrifugation in a pool and‐split experiment (n=10). For all tested conditions, RBC in vitro quality was assessed 24 hours after deglycerolization.
Results/Finding: All 20 deglycerolized units tested met the criteria for hematocrit and sterility after 24 hours of storage. While hemolysis was still lower than what is typically obtained when units are deglycerolized with the COBE 2991, only 85% of the units met the criteria for hemolysis (<0.8 %) and hemoglobin ( ≥ 35g / unit). However, with the addition of a centrifugation step recovery could be improved by 9.25 % ± 2.22 %, while lowering the average hemolysis from 0.55 % ± 0.12 % to 0.35 % ± 0.06 %. The age of the units at the time of glycerolization had an influence on hemolysis upon deglycerolization. Indeed, hemolysis was significantly higher for units that were frozen 25 days after collection when compared to those frozen before 25 days. These results justified the need to evaluate the optimal post‐collection timing for the units that are still being manually glycerolized at our institution. In this set of experiments, deglycerolized units complied with the standards for hematocrit, hemoglobin, hemolysis and sterility, as long as they were glycerolized and frozen no later than seven days post‐collection.
Conclusion: RBC units that were manually glycerolized, deglycerolized with the ACP 215 automated cell processor, suspended in AS‐3 and stored for 24 hours, met in vitro quality standards for sterility and hematocrit. While standards for hemolysis were not met for every unit, it was vastly improved when compared to what is routinely obtained with the COBE 2991. The difficulty in reaching the standards for hemoglobin might be related to centrifuge volume limitations. Indeed, a centrifugation step to remove an excess of supernatant prior to deglycerolization with the ACP 215 seems to improve blood quality and red blood cell yield. Thus, the ACP‐215 automated cell processor can be used to deglycerolize RBC units that were manually glycerolized.
BBC130
Sensitivity and Specificity Performance of a New Automated System for the Detection of HCV Antibodies in Blood and Plasma Donors
Melanie Anderson1, Rebecca Haley2, Scott Jones3, Toby Simon4, Susan L. Stramer5, Susan S. Ganz6, Lynn Martin*1 and George Chen1
1Abbott Laboratories, 2Bloodworks Northwest, 3QualTex Laboratories, 4CSL Plasma Laboratory, 5American Red Cross, 6Biotest Pharmaceuticals
Background/Case Studies: Serological screening for antibodies to Hepatitis C virus (HCV) often in conjunction with nucleic acid testing (NAT) is used worldwide to prevent transfusion transmitted HCV infections. While NAT provides improved sensitivity and detection of HCV in the pre‐seroconversion window, serological testing provides continued detection of HCV in infected individuals and individuals with resolved infections with no detectable HCV RNA. Blood and plasma centers require high throughput anti‐HCV assays with high specificity and sensitivity to prevent unnecessary donor deferrals while maintaining the safety of the blood and plasma supply. Continued pressures on laboratory operations demand that assays perform on platforms capable of increased walk away time and enhanced automation in areas of reagent management, retest options, and commodity/waste management. To address the need for such screening assays, an improved automated assay for the detection of antibodies against HCV has been developed.
Study Design/Method: The performance of an immunoassay for the detection of antibodies to HCV was evaluated on a next generation automated platform, Abbott Alinity s. Reproducibility was assessed over 5 days using anti‐HCV positive samples. Specificity was evaluated on samples obtained from volunteer blood donors and plasmapheresis donors from the United States. Sensitivity was evaluated using 402 preselected anti‐HCV positive and anti‐HCV positive chronic infection samples and 22 seroconversion panels. Confirmation of repeatedly reactive samples was done using a testing algorithm consisting of the INNO‐LIA™ HCV Score and a HCV Quantitative RNA assay.
Results/Finding: Within‐Laboratory imprecision was less than 5.0% CV for positive samples over 5 testing days. Clinical sensitivity was 100% (402/402) for the preselected specimens. Seroconversion sensitivity was better than the licensed comparator as evidenced by the new Anti‐HCV assay identifying 4 earlier bleeds in the seroconversion panels. The specificity was 99.92% (16,975/16,989) for blood donor and plasmapheresis samples.
Conclusion: These results indicate that the new automated Alinity s Anti‐HCV assay provided acceptable performance in precision, specificity and sensitivity. Seroconversion sensitivity was improved in relation to the licensed comparator assay.
BBC131
Sars Coronavirus Is Efficiently Inactivated in Human Plasma by MB/Light Using the Theraflex MB‐Plasma Technology
Wiebke Handke*1, Markus Eickmann2, Ute Gravemann1, Stefan Reichenberg3 and Axel Seltsam1
1German Red Cross Blood Service NSTOB, 2Institute of Virology, Philipps University Marburg, 3Maco Pharma International, GMBH
Background/Case Studies: Severe acute respiratory syndrome (SARS) caused by SARS‐coronavirus (SARS‐CoV) is a zoonotic disease that emerged in epidemic form in early 2003 in China and spread worldwide in a few months. SARS‐CoV caused over 8000 human infections with nearly 800 deaths between November 2002 and September 2003. Although there are currently no confirmed reports of the transmission of SARS‐CoV from asymptomatic individuals, recent research data indicate that transfusion‐transmitted SARS‐CoV is at least theoretically possible. This study aimed to investigate the efficacy of the THERAFLEX MB‐Plasma system to inactivate SARS‐CoV in human plasma. The THERAFLEX MB‐Plasma system (Macopharma) uses methylene blue (MB) in combination with visible light for reduction of pathogen infectivity in plasma.
Study Design/Method: Leukodepleted plasma was prepared from whole blood using standard blood banking technology. Plasma units (n=2) were spiked with virus suspension (10% v/v). MB/light treatment was done according to the manufacturer's instructions using the Macotronic B2 illumination device. Samples were taken after spiking (load and hold sample) and after illumination with different light doses (30, 60, 90 and 120 (standard) J/cm2)). The titer of SARS‐CoV (strain Frankfurt 1) was determined as tissue culture infective dose (TCID50) by endpoint titration on Vero E6 cells (ATCC CCL‐22).
Results/Finding: After spiking a SARS‐CoV titer of 5.43 (bag no.1) and 5.55 (bag no. 2) log10 TCID50/mL was received in the plasma units. Already with the lowest tested light dose of 30 J/cm2 MERS‐CoV was inactivated down to the detection limit of the system (2.37 log10 TCID50/mL), resulting in log10 reduction factors of ≥ 3.1 (bag no. 1) and ≥3.2 (bag no. 2).
Conclusion: Our results demonstrate that the THERAFLEX MB‐Plasma procedure is an effective technology to inactivate SARS‐CoV in contaminated plasma units.
BBC132
Haemovigilance in Taicang District of Jiangsu Province of China
Wenbiao Liang*1, Xiaofan Ye1, Jun Xu2, Weibin Tan2 and Zhichao Chen3
1Jiangsu Province Blood Center, 2Suzhou Blood Center, 3Pass Medical Technology Company Ltd. (Guangdong)
Background/Case Studies: Establishing a haemovigilance system that covers the entire transfusion chain is of importance to ensure the safety and supply of blood. In September 2017, such a pilot haemovigilance network based on cloud technics was built and operated in Jiangsu Province of China, this is the first wide area haemovigilance network(HWAN) of China.
Study Design/Method: The HWAN software and a standardized transfusion database were developed under the unified standards to collect, control, share, exchange and analyze the data of transfusion chain by means of the application of the Middleware Technology combined with manual way. A mechanism of reporting, analyzing and interventing transfusion adverse events was established and operated. The warning information and disposal advice was issued and an efficient emergency response system was built through the SaaS services portal which connected the relevant participants within the scope of HWAN.
Results/Finding: From September 1, 2017 and ends on March 31, 2018, Taicang Blood Transfusion Service issued 9486.5 units of blood components, in which were 5499.5 units of red cells, 235 units of platelets, 3248.5 units of total FFP and 503.5 units of cryoprecipitate; 3774 patients were transfused with 9162 units of blood components, thus 96.58% of blood components at pilot site have been traced from donor to recipient or vice versa. There were 11 donor complications among 6489 blood donations, 4 patients suffered allergic reactions and 138 adverse incidents of transfusion chain were reported or captured.
Conclusion: An exemplary HWAN that covers the entire transfusion chain have been explored and works perfectly in Taicang district. This HV cloud is China's first regional HV network, which can realize bidirectional vein‐to‐vein monitoring and intervention of all activities in the whole blood transfusion chain, it's meaningful to practice this HWAN in China.
BBC133
Can Survey Responses to Online Motivational Interview Questions Enhance Blood Donation Intention?
Christopher R. France* and Janis L. France
Ohio University
Background/Case Studies: Motivational interviewing can be effective in enhancing blood donor retention but implementation may be costly. To address this economic challenge, we conducted two studies to examine the impact of motivational interview content on donation intention when delivered as an online survey.
Study Design/Method: In study one, 3,883 respondents (52.2% female; mean age 35.69 years, SD 11.3 years) completed a donation commitment measure and were randomly assigned to one of seven motivational interview‐based questions or a no‐question control group. In study two, 2,246 respondents (58.4% female; mean age 35.5 years, SD 11.4 years) with a moderate level of donation commitment were randomly assigned to receive zero‐to‐four motivational interview‐based questions. In both studies, future donation intention was measured immediately following the intervention.
Results/Finding: The first study revealed a significant effect of interview question on donation intention among participants with moderate blood donation commitment, F (7,1299) = 3.699, p = 0.001, but not among those with low commitment, F (7,1233) = 1.411, p = 0.20, or high commitment, F (7,1327) = 0.964, p = 0.46. Study two replicated the significant effect of interview questions on donation intention, F(1, 2230) = 2.168, p = 0.006. Relative to the no‐question control condition, follow‐up analyses revealed significantly higher donation intentions with 14 of the 15 question combinations (p < 0.05).
Conclusion: These findings provide initial support that computer‐administered survey questions modelled on motivational interview content may elicit personal reflection that positively impacts donation intention, particularly among individuals with a moderate level of donation commitment.
BBC134
Reducing High Platelet Concentration Rejections in Apheresis Platelets
Jennifer Lider*
United Blood Services
Background/Case Studies: The blood center was seeing an increase in the amount of apheresis platelet products being rejected for high platelet concentration. The increase had been occurring steadily over a period of two years. During that two year timeframe, the blood center had discontinued running pre‐donation platelet counts (pre‐counts) prior to or during a platelet pheresis procedure. This process had been discontinued in order to streamline the process, eliminate paper, and reduce laboratory staff interruptions. The pre‐count was collected on the day of donation, was tested the following day, and an average of the previous three platelet counts was used to program the instrument for the current donation. The increase in platelet rejections caused a decrease in the amount of available products and a loss of revenue for the blood center.
Study Design/Method: A team led by quality staff was developed and implemented a plan to begin obtaining day of donation pre‐counts on donors. Pros and cons for both collection and lab staff were evaluated, as it significantly changed the process for both departments, and re‐introduced paper records into the process. It was determined that it would be implemented for a trial period of three months and then evaluated to determine product and cost savings.
Results/Finding: A significant reduction in high platelet concentration rejections was demonstrated. The blood center was rejecting approximately 4.9 products per month before this project. After implementation, the center realized a reduction to 0.8 products rejected per month. This resulted in saving the blood center approximately $2,889 per month or $34, 671 annualized.
Conclusion: Implementation of obtaining day of donation donor platelet counts resulted in decreased rejections of platelet pheresis products and significant cost savings.
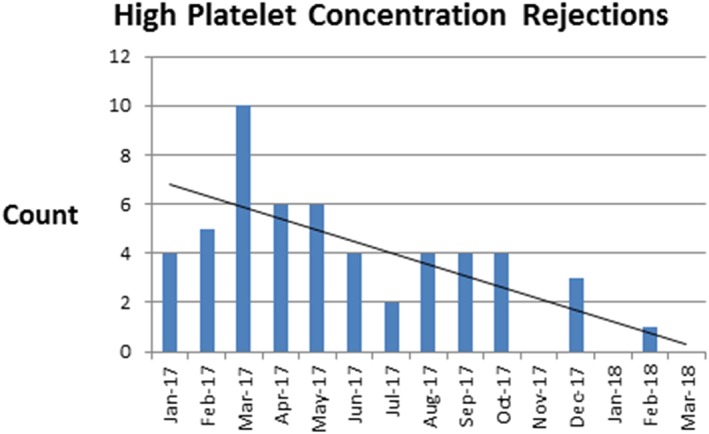
BBC135
Mobile Platelet Collections for a Hospital‐Based Donor Center
David Anthony, Amber Lazareff, Deborah Alter, Alyssa Ziman and Dawn C. Ward*
Division of Transfusion Medicine, Department of Pathology and Laboratory Medicine, David Geffen School of Medicine at UCLA
Background/Case Studies: Apheresis platelet (AP) collection for our hospital‐based donor center was limited to our two fixed collection sites and community blood drives were limited to whole blood (WB) donations. During the planning for a community WB drive our blood center evaluated the opportunity to hold a concurrent WB and AP mobile drive. Here we discuss our hospital based‐donor center's first combined WB and AP mobile drive and our steps to maximize efficiency and reduce cost in a mobile platelet drive setting.
Study Design/Method: Blood donor field recruiter requested a new WB mobile drive in a desirable region of the county where there is high interest in AP donations. On the day of the request, operational staff visited the desired mobile collection site to assess the space for donor registration, donor history, segregated WB and AP collections, donor recovery, and electrical outlet location and support for our apheresis machines. Donor center leadership set up weekly meetings to examine the feasibility of hosting a concurrent WB and AP blood drive where all aspects of platelet collection requirements and mobile blood drive prerequisites were evaluated. Standard Operating Procedures were reviewed and revised to include the allowance of AP collections at mobile drives. All AP supplies and equipment were reviewed for ease of transport. The field recruiter educated and recruited 12 adults from an area high school WB drive, of which 10 were prescreened for their ability to donate multiple products, HLA test results (multiparous female donors only) and donation history/red blood cell loss. Staffing for the mobile drive included WB collections staff, 3 apheresis operators, and 2 additional operational staff to mitigate unforeseeable issues.
Results/Finding: From the prescreened donors, 4 were scheduled to donate; each time slot had two back up donors. One backup donor ultimately donated. Of the 4 AP donors, 3 were first‐time AP donors. Total products collected includes seven platelet units (3 double products and 1 single product) and 57 WB donations over four and six hours, respectively. The 7 platelet units resulted in a $3,010 cost savings had the units been purchased from an outside blood supplier. The platelet collections bolstered our inventory on a normally low collection day. Post‐drive review with our leadership team identified the need for specialized mobile AP collection chairs.
Conclusion: Our hospital‐based donor center successfully held a combined WB and AP mobile drive for the first time. The time from initiation of the plan to implementation was 2 ½ weeks. Our approach to AP donor selection resulted in an increase of 7 AP products in a cost efficient manner.
BBC136
A Tale of Three Automated Grouping Instruments
Ranee M. Wannarka‐Farlinger*, Scott A. Hammel, Jennifer Vrieze, James R. Stubbs and Manish Gandhi
Mayo Clinic
Background/Case Studies: Obtaining fast and accurate test results are essential for a hospital based donor center to have blood products labeled and available for patient use. With several different automated methodologies available for testing our facility wanted to compare our current methodology of solid phase, to an automated gel system.
Study Design/Method: Compare the test results and run times of three instruments. Timings include: putting samples in racks, loading samples on instrument, ordering tests, run time of tests, review of results, and unloading of samples. ABO/Rh testing included both the front and back typing, including weak Du testing when applicable. Confirmation testing was forward typing only and weak Du testing when applicable. A side by side comparison between Immucor Neo (current methodology) and Ortho Vision was performed over several days. When the Ortho Vision Max became available for use, additional runs were performed to compare turnaround times.
Results/Finding:
| Testing Results | |||
|---|---|---|---|
| Test | Tests Performed | Match | Percent |
| ABO/Rh | 89 | 87* | 98% |
| Antibody Screens | 83 | 83 | 100% |
| Confirmations | 166 | 166 | 100% |
| Turn Around Times | |||
| Run Type | NEO | Vision | Vision Max |
| 8 ABO/Rh and ABSC | 1:05:00 | 43:20:00 | – |
| 12 ABO/Rh and ABSC | 42:12:00 | 46:33:00 | 43:21:00 |
| 12 ABO/Rh and ABSC | 53:49:00 | 53:42:00 | – |
| 21 ABO/Rh and ABSC | 1:02:27 | 57:53:00 | – |
| 24 ABO/Rh and ABSC | 1:07:20 | 1:06:33 | – |
| 55 confirmations w/ Rh | 29:07:00 | 1:33:30 | 1:07:57 |
| 1:00:40** | |||
| 17 confirmations w/ Rh | 15:17 | 35:47:00 | – |
| 21 confirmations w/ Rh | 26:22:00 | 38:06:00 | – |
| 21 confirmations w/ Rh | 25:39:00 | 37:54:00 | – |
| 21 confirmations w/ Rh | 28:10:00 | 39:34:00 | – |
1 sample: Fibrin in sample. Repeated x2 Vision no result, NEO resulted matching blood donor history.
1 sample: Vision called mixed field. Donor history doesn't support finding.
Samples manually placed in numeric order before run. Vision Max pipettes each run in numeric order.
Conclusion: Of the 338 samples run, there was 100% agreement between platforms for antibody screens and ABO confirmations. There was 98% agreement between platforms for ABO/Rh testing. Processing times for antibody screens with ABO/Rh were 1‐10% (1 to 5 minutes) faster on the Vision and Vision Maxx. The Neo performed confirmation testing in 22% to 71% of the time it took the Vision or Vision Maxx. Our institution performs more confirmation testing than any other testing so it is more beneficial for us to remain with the Neo.
BBC137
Impact of Deferral for Low Hemoglobin on Donor Return
Ashley Aiken1, Alexander Disciullo1, Cyrus Jalai1, Nektarios Konstantinopoulos1, Tyler Oe1, Jenny Lamping2, Jan K. Carney1 and Mark K. Fung*1
1University of Vermont Larner College of Medicine, 2American Red Cross Blood Services National Headquarters
Background/Case Studies: A consistent blood supply to support life‐saving transfusions relies on regular and repeat volunteer blood donations. In this study, we focused on donors previously deferred for low‐hemoglobin (Hb) levels to better understand the value of supplying post‐deferral educational information, and the actions donors took based on their deferral.
Study Design/Method: An anonymous national survey of active and inactive (no donation in past 12 months) donor groups who had been deferred for low hemoglobin levels (10,000 each) was conducted. The survey questions assessed post‐deferral donor actions, preferences regarding post deferral education, understanding of their deferral, and demographic information. Chi‐square analysis was performed to compare categorical survey results between donor groups with p < 0.05 denoting statistical significance.
Results/Finding: The survey resulted in 722 and 103 active and inactive donor responses, respectively. Active donors were more likely to recall receiving educational materials post‐deferral (52% vs. 35%, p=003), take iron and vitamin supplements (54% vs. 39%, p=0.009), lived within 30 min of a donor site (94% vs. 84%, p=0.006), and more likely to be older than 45 yr (62% vs. 42%, p=0.002) than their inactive donor counterparts. Active and inactive donors were similar (p>0.05) with anemia history frequency, female‐gender predominance, low‐prevalence of vegans, and mixed interest in receiving information about raising hemoglobin levels.
Conclusion: While active donors more frequently recalled receiving educational materials for their low hemoglobin deferral, and were more likely to take action to improve their hemoglobin, an alternative method of post‐deferral recruitment should be considered given the uncertain value of post‐deferral information when comparing active vs. inactive donors.
BBC138
Donor Pregnancy Question – It's All in the Wording
Laurie Sutor* and Jeff Centilli
Carter BloodCare
Background/Case Studies: Our large community blood center has asked allogeneic blood donors about a history of pregnancy to screen for a risk of transfusion‐related acute lung injury. We do our health history questionnaire almost exclusively by computer, only rarely resorting to a manual paper donor card. We made a change to the wording of the question about pregnancy when we adopted the most recent version of the Uniform Donor History Questionnaire in late 2016.
Study Design/Method: Answers to the donor pregnancy questions from January 2014 through Sept 2017 were reviewed. We compared the percent of women ages 25 or over answering yes to whether they have ever been pregnant before and after the question (Q) regarding pregnancy was reworded. Donors screened manually were excluded from this study. From 2014 to September 2016 the donors were asked two questions, “Have you ever been pregnant?” and “In the last six weeks, have you been pregnant, or are you pregnant now?” After September 23, 2016 female donors were asked one, combined question: “Have you ever been pregnant or are you pregnant now?”. We further looked at two subperiods after September 23, 2016 when we separated the single Q into two parts: “Have you ever been pregnant? Or Are you pregnant now?” which occurred on January 23, 2017.
Results/Finding: In the first study period 76.04% of female donors over 25 years of age said yes to having ever been pregnant. In the second study period, after the change in Q, the number dropped to 65.96%. A month by month analysis of donor responses showed approximately a 10% decrease in donors answering “yes” to the question for ever having been pregnant following the changing of the format of the question from two separate questions to one combined question with “are you pregnant now?” Even after emphasizing the two part nature of the new Q, minimal improvement was observed. In the last 100 days of the study period, 236 of females 25 years or older changed their answer for the Q from no to yes. On the other hand, 1,217 changed their answer from yes to no. As a precaution, the blood center has systems in place that prevent collection of apheresis platelet and plasma procedures, and that prevent the release of any transfusable plasma product, from returning female donors who have previously reported being pregnant, even if they now answer no.
Conclusion: We are concerned that some female donors are either confused by the new format of the question or not taking the time to read the new question. Further study could reveal more effective communication strategies related to the donor questionnaire.
BBC139
Blood Shortages in 2017: Holiday vs Non‐Holiday Time Periods
Virginia Hughes*
University of Delaware
Background/Case Studies: Blood shortages during the holidays are especially challenging for donor centers and transfusion services. Cogent efforts are made to minimize elective surgeries during the holidays due to decreased blood donations. This study was done to analyze the differences among four regions of the United States for the month of September and December in 2017 regarding blood supply levels of seventy‐four blood centers.
Study Design/Method: Data was accessed from Americas Blood Centers database for the months indicated. The number of blood centers in each region were as follows: West 23, Midwest 22, South 18, and East 11. Blood supply data was categorized as 0‐1 day, 1‐2 days, and 3 + days. The N number of days was 21. A repeated measures analysis of variance, Dunnett's t‐test, and Paired t‐test was conducted using SPSS to ascertain differences among the four regions studied. For the repeated measures analysis the independent variable was region and dependent variable was days of blood supply.
Results/Finding: For the month of September a Dunnett's t test (two‐sided) revealed significance among all four regions (P<.05) when analyzing days of blood supply. For the month of December the Dunnett's t‐test also revealed significance among the four regions (P<.05). The means for the 0‐1 day blood supply by region were 1.3% (East), 7.0% (Midwest), 1.2% (South), and 0.38% (West). The means for the 1‐2 day blood supply by region were 32.7% (East), 14.5% (Midwest), 7.2% (South), and 18.3% (West). The means for the 3 + day blood supply by region were 51.7% (East), 67.9% (Midwest), 55.8% (South), and 56.5% (West). The Blood Centers in the Midwest region were the most affected by short blood supply levels in December compared to the other three regions. Eighteen percent of their centers had a 0‐1 day blood supply on three occasions and 11% on five occasions. Blood Centers in the West region had the highest blood supply levels reporting only 2 days of a 0‐1 day supply. For Christmas day only the East region reported a 0‐1 day supply of blood in 2% of blood centers; the remaining three regions all reported a 3+day blood supply. A Paired t‐test (two‐tailed) was performed for each blood shortage category (0‐1 day, 1‐2 days, 3 + days) comparing the month of December to a non‐holiday month (September). Significance was found for the Midwest and South region for all three blood supply categories. The East region revealed significance for the 0‐1 day category only. The West region revealed no significant differences for any of the blood supply categories.
Conclusion: This study compared blood supply levels between a holiday month and non‐holiday month across four regions of the United States in 2017.The Dunnett's t‐test determined that the differences in region and days of blood supply were significant. The paired t‐tests revealed significant differences between September and December blood supply levels for the Midwest, South, and East but not the West region. The Midwest, on average, had more blood centers with a 0‐1 day of blood supply in the month of December and September than other regions studied. It is prudent to continue to track blood supply levels in Donation and transfusion services across the country and identify regions that are most vulnerable to blood shortages.
BBC140
Significant Number of Blood Donors Had an Abnormal Blood Pressure Based on the New Hypertension Guideline
Jeremy Housekeeper, Emily Chen, Ling Li and YanYun Wu*
Bloodworks
Background/Case Studies: In general, blood donors are considered as a healthy population, or healthier population. As part of blood donor screen, blood pressures are checked for most qualified donors and there are blood donation criterion for blood pressures.
In 2017, American College of Cardiology/American Heart Association Task Force has issued a new blood pressure guideline. In this new guideline, normal blood pressure is defined as below 120/80 mm Hg.
In this work, we are trying to assess the rate of blood donors with an abnormal blood pressure based on this new hypertension guideline.
Study Design/Method: Donor information was obtained from our blood center's donation database for the period of January 1 to March 30 of 2018. Only the first donation during this time was used for each donor.
Results/Finding: Please see table below for information on blood pressure for blood donors during the study period. More variations are observed for different age groups and ethnic background.
| Gender | ALL | ALL | Female | Female | Male | Male |
|---|---|---|---|---|---|---|
| No. | 44983 | 44983 | 23258 | 23258 | 21725 | 21725 |
| Max | 237 | 188 | 237 | 138 | 235 | 188 |
| Min | 78 | 38 | 78 | 42 | 86 | 38 |
| Average | 122 | 77 | 119 | 75 | 126 | 79 |
| Median | 120 | 78 | 118 | 74 | 124 | 80 |
| 97.5 Percentile | 158 | 98 | 152 | 96 | 160 | 100 |
| 2.5th Percentile | 98 | 60 | 94 | 58 | 100 | 60 |
| >120 mm Hg SBP | 41% | 47% | 70% | |||
| >80 mm Hg DBP | 45% | 37% | 54% |
Conclusion: Based on this snap shot study, there is significant number of blood donors with an abnormal blood pressure based on the new hypertension guideline. More studies and investigation are needed to confirm the finding and to assess the needed action.
BBC141
The Influence of Psychological Care on Anxiety of Blood Donors Among College Students
Ya Gao*
Wuhan Blood Center
Background/Case Studies: Nowadays, psychological care plays an important role in our society. College students are the most major blood donation population. But still many of them are easy to be anxious or have adverse reaction at the time of or after blood donation because of the deficiency of medical knowledge. According to the research before, mental stress is the main cause of the adverse reaction. How to alleviate the anxiety of the blood donors among college students has become an important problem. The research is aimed at investigating the influence of psychological care on anxiety of medical students and non‐medical students, exploring the most appropriate mode of promotion and education for voluntary blood donation, enhancing the proportion of fixed blood donors from college blood donors, and ensuring blood supply to meet clinical use demand.
Study Design/Method: 200 students from a comprehensive university in a regional city, aged between 18 and 22, who volunteer to donate blood were randomly divided into observation group and control group, 100 students each group. In observation group, there are 58 medical students and 42 non‐medical students. In control group, there are 52 medical major students and 48 non‐medical major students. Control group was given routine blood donation nursing and observation group was given psychological care. Before and after the treatments on control group and observation group, the scores of Self‐rating Anxiety Scale (SAS) were collected and the cases of adverse reaction were recorded respectively.
Results/Finding: In observation group, the SAS scores collected from medical students and non‐medical students were significantly decreased after donations (P<0.05), respectively. In control group, the SAS scores had no obvious change before and after donations (P>0.05), whether of medical students and non‐medical students. The incidence of adverse reaction of control group is higher than that of observation group (P<0.05). The incidence of adverse reaction of non‐medical major volunteers is higher than that of medical major volunteers in observation group and control group, respectively (P<0.05). The incidence of adverse reaction of medical students in control group is higher than that of medical students in observation group (P>0.05).
Conclusion: Psychological care can effectively alleviate the anxiety emotion of volunteers from universities, especially non‐medical major students, so that most of the adverse reactions can be preventable. During donations, different methods of nursing including conventional care and psychological care should be chosen according to the actual situation. Timely, effective and holistic psychological care deserved the promotion to alleviate the anxiety emotion and the incidence of reverse reaction of volunteers. It is necessary to establish a scientific and effective mode of promotion,education and psychological counseling for voluntary blood donation.
INV2
Delaying Laboratory Collection Determines Timing of Prophylactic Platelet Transfusions and Stabilizes Platelet Inventory
Christine Lee*1, Andrea M. McGonigle2, Dawn C. Ward3 and Alyssa Ziman3
1UCLA Department of Pathology and Laboratory Medicine, 2Wing‐Kwai and Alice Lee‐Tsing Chung Transfusion Service, Department of Pathology and Laboratory Medicine, David Geffen School of Medicine at UCLA, 3Division of Transfusion Medicine, Department of Pathology and Laboratory Medicine, David Geffen School of Medicine at UCLA
Background/Case Studies: Timing of platelet administration can drive blood bank inventory. A stable platelet inventory ensures timely delivery of life‐saving blood products but can be challenging to maintain at a tertiary care center, where there is a hospital‐wide demand for both emergent and prophylactic platelet transfusions (PPTs) in active surgical and oncologic units, respectively. A high volume of overnight PPTs can lead to early morning inventory shortages that last for hours, particularly when inventory shipments occur during regular business hours, which can delay transfusions for emergent situations. In addition, overnight PPTs increase patient sleep interruptions for non‐urgent reasons.
Study Design/Method: A single inpatient oncology unit was found to be the highest contributor to the number of overnight (12:00‐7:00 am) platelet transfusions with > 98% of these being prophylactic. Transfusion medicine and oncology physicians/nursing partnered with leaders of a patient wellness initiative to explore patient‐centric reasons for delaying overnight PPTs. Analysis demonstrated that daily labs were being drawn overnight which led to PPT orders for abnormal CBC results a few hours later. A solution, postponing lab draws from 2:00 am to 5:00 am, was implemented. Statistical analysis for significance, using the chi‐squared test, was performed on percentage values.
Results/Finding: Postponing lab draws on the inpatient oncology unit led to a significant reduction in the proportion of overnight platelet transfusions and PPTs. There was also a decrease in the frequency of platelet inventory shortages.
TABLE 1 Impact of Delayed Laboratory Collection
| Result | Pre (Average 30 day period) | Post (30 days) | P‐Value |
|---|---|---|---|
| Overnight platelet transfusions, No. (%) | 124 (65%) | 69 (37%) | <0.0001 |
| Overnight PPTs, No. (%) | 111 (98.2%) | 53 (77%) | <0.0001 |
| Frequency of platelet inventory shortage, % | 15% | 3% | 0.05 |
Conclusion: The partnership between laboratory and clinical staff identified a simple yet impactful solution to reduce overnight PPTs: postponing laboratory collection times. Changing the timing of lab draws shifted the timing of platelet administration and stabilized platelet inventory. Collaborating with clinical staff on the oncology unit as well as those leading a patient wellness initiative helped frame the project's goals in a greater patient‐centered context. The project utilized a clinical, multidisciplinary approach to blood bank quality improvement that can be applied to other hospital units and Transfusion Medicine services.
INV3
Collaboration with Multiple Hospital Units to Decrease Blood Wastage
Colleen A. Aronson*1, Andrea Pelock2 and Julie Meenan2
1ACL Laboratories/Advocate Hospitals, 2Advocate Christ Medical Center
Background/Case Studies: A large Level I trauma site set a goal for blood wastage of <1.8%. In April 2016 temperature indicators were implemented for Red Blood Cells (RBCs) and the year ended with wastage at 2.9%. A Corrective Action/ Preventative Action (CAPA) was requested by hospital quality to see what could be done to decrease the product wastage.
Study Design/Method: The Transfusion Service (TS) reached out to the Clinical staff to review processes for ordering, receiving, storage in the Operating Room (OR), transfusing and returning of blood products. Wastage data was evaluated by service line to determine where products were being wasted as well as the number products that were sent to the OR only to be returned.
Results/Finding: Three areas of focus were identified: 1) Massive Transfusion Protocols (MTPs), 2) Temperature indicators, and 3) OR Handling of blood products. MTP wastage is expected, but 50% of the cryoprecipitate (Cryo) was being discarded. The hospital system decided to update the MTP cycle to star Cryo on cycle 2 and subsequent even cycles rather than every cycle. Discussion with staff determined there was inconsistent notification to the TS when the MTP was being deactivated resulting in additional plasma and Cryo being thawed and wasted. On the nursing units, RBCs were being returned if the patient was not immediately able to be transfused. Communication was sent out to remind nursing staff to ensure that a consent was signed, vitals taken and a transfusion line established prior to requesting the blood. Also if a short delay was expected that it was better to keep the unit on the floor and start the transfusion as soon as possible as long as it was completed within the 4 hours post issue. All wastage was entered into the error management system including associated costs of the products. For the OR, data was collected by service line to show the biggest offenders for returning and wasting blood products. This was shared at the Transfusion Committee meeting to guilt the offenders into improving their ordering habits. In August 2017 over 50% of units sent for cardiac surgery were being returned (349 of 686). O negative blood is remotely stored in the OR. Review of the resupply process found that units were not being placed into storage in a timely manner. TS began tracking who was notified when replacement products were sent via the tube system to hold that individual responsible for timely storage. A decrease in wastage as well as number of returned units from the OR was seen over several months starting in September 2017.
Conclusion: Although the wastage was not caused by the TS, the corrective action was expected to be led by the TS. Data was able to show clinical staff specific patterns to help drive needed changes. Understanding both the clinical and the TS side of a transfusion was key to understanding where improvement was needed. Associating a dollar figure to the wastage was a way to get clinical staff to understand the impact of blood product wastage.
(INV3)
| Apr‐17 | May‐17 | Jun‐17 | Jul‐17 | Aug‐17 | Sep‐17 | Oct‐17 | Nov‐17 | Dec‐17 | Jan‐18 | Feb‐18 | Mar‐18 | |
|---|---|---|---|---|---|---|---|---|---|---|---|---|
| % Blood Wastage (vs # transfused) | 3.4 | 3.0 | 3.1 | 2.9 | 3.4 | 1.8 | 1.8 | 1.5 | 0.8 | 0.8 | 2.0* | 1.1 |
| % OR Returns | NA | NA | NA | 42 | 48 | 46 | 36 | 40 | NA | 34 | 31 | 32 |
Feb‐18 – 5 Directed RBC outdated. 15 plasma returned out of temp. due to exchange patient coding prior to infusion. 37% of total wastage for this month caused by these 2 events.
INV4
Cost‐Minimization Analysis before and after Implementation of Rapid Bacterial Testing at an Academic Medical Center
Adam L. Booth*, Karen Bingham, David Guerra, Barbara J. Bryant and Sean Yates
University of Texas Medical Branch
Background/Case Studies: The 5‐day shelf‐life of platelet products is intended to reduce the risk of bacterial proliferation and potential for transfusion‐transmitted bacterial infections. Consequently, platelets have high rates of wastage due to expiration, which is problematic as they are a valuable resource in terms of therapeutic benefit and cost. Recently the Food and Drug Administration (FDA) published its second draft guidance concerning bacterial risk control strategies, permitting the use of a rapid bacterial detection device to extend the shelf‐life of apheresis platelet products up to 7‐days. Given expectant finalization of these regulatory changes, the objective of our study was to evaluate the economic impact concerning acquisition cost and wastage of apheresis platelets before and after implementation of rapid bacterial testing at a large academic medical center.
Study Design/Method: We conducted a retrospective review of apheresis platelet acquisition cost and wastage due to expiration at two successive time points: 12‐months before and 6‐months after implementation of rapid bacterial testing (RBT). Bacterial testing was performed on 6 and 7‐day apheresis platelet units per FDA guidelines. Platelet units wasted due to expiration on day 5 owing to non‐FDA approved storage containers were excluded from the study.
Results/Finding: During the 12‐month period before implementation of RBT, 332 apheresis platelet units expired out of 1,371 purchased, translating into an expiration rate of 24%. Conversely, annualized data from the 6‐months following RBT implementation resulted in 117 apheresis platelet units expiring out of 1,168 platelet units purchased, translating into an expiration rate of 10% and corresponding with a 58% reduction in platelet units wasted. Annualized, the direct cost of RBT equals $22,515.06. Using the mean apheresis platelet unit cost of $516.96 reported in the 2013 AABB Blood Survey Report and accounting for the direct cost of RBT, implementation of RBT corresponded with a projected annual cost savings of $88,823.66 at our institution.
Conclusion: In a large academic medical center, the introduction of rapid bacterial testing led to a significant reduction in both apheresis platelet acquisition cost and wastage due to expiration. Our findings suggest that rapid bacterial testing can simultaneously enhance the safety of apheresis platelet transfusions and contribute to significant cost savings.
INV5
Adoption of the Canadian National Advisory Committee's (NAC) CMV Recommendations Would Yield Financial Savings without Jeopardizing Patient Safety
Jessica L. Jacobson*
Bellevue Hospital‐NYULMC
Background/Case Studies: On February 14, 2017, the NAC on Blood and Blood Products published a statement recommending that CMV safe (leukoreduced) and CMV IgG seronegative products be considered equivalent except for intrauterine transfusion. The NAC further recommend that the Canadian Blood Services stop providing CMV seronegative units to hospitals and develop a new process to maintain a small inventory of CMV seronegative components for the sole purpose of intrauterine transfusion. Given that our municipal public system exclusively uses leukoreduced products, does not support an organ or stem cell transplant program, and only infrequently preforms intrauterine transfusions at one facility, implementation of the NAC recommendations might be reasonable option to reduce laboratory costs without jeopardizing patient safety. We sought to evaluate the potential cost savings of adopting the NAC's CMV recommendations.
Study Design/Method: Annual blood product orders from our sole supplier from 2015 to 2017 were analyzed to determine the number of CVM seronegative RBCs and SDPs purchased and the associated additional costs for the CMV enhancement. The actual costs were compared and evaluated to determine the impact of no longer offering the ordering providers the option of requesting CMV seronegative in addition to the already CMV safe (leukoreduced) blood products that they were receiving.
Results/Finding: The system purchased 11,740 CMV‐negative RBCs and 5,794 CMV‐negative SDPs (total 17,534 CMV‐negative products). The CMV upcharge for RBCs was $31 in 2015, $30 in 2016, and $21 in 2017 and for SDPS was $41 in 2015, $40 in 2016, and $23 in 2017. The system spent $189,222 in 2015, $182,127 in 2016, and $148,150 in 2017 on CVM seronegative RBCs and SDPs (total $519,500). There was wide variation between purchases of CMV‐negative SDPs (system mean 28.7%, range < 5‐>95%). Variation was also observed with CMV‐negative RBC purchases (system mean 11.2%, range < 1‐>20%).
(INV5)
| Units Purchased in 2015 | Units Purchased in 2016 | Units Purchased in 2017 | Money Spent on CMV Enhancement in 2015 ($) | Money Spent on CMV Enhancement in 2016 ($) | Money Spent on CMV Enhancement in 2017 ($) | |
|---|---|---|---|---|---|---|
| CMV Negative RBCs | 3,524 | 3,645 | 4,571 | 110,317 | 110,051 | 99,351 |
| CMV Single Donor Platelets | 1,889 | 1,785 | 2,120 | 78,905 | 72,076 | 48,799 |
| Total per Year | 5,413 | 5,430 | 6,691 | 189,222 | 182,127 | 148,150 |
| Total Potential Savings | 519,500 | |||||
Conclusion: By adopting the recommendations of the NAC, our system could save approximately $150,000 a year at the current CMV seronegative upcharge rate of $21 per RBC and $23 per SDP without negatively impacting patient safety. The change would however only decrease the overall blood spend by 1.2%.
INV6
Antigen Frequencies and Rare Donors Identified by Molecular Analysis: A Three Year Retrospective Analysis
Gregory Halverson*, Steve Morales, Mollie Bell, Matthew Montgomery, David Oh and Jeffrey Papiernik
Hoxworth Blood Center
Background/Case Studies: Our blood center supports Sickle Cell Disease (SCD) programs for both children and adult patients. We have been phenotype‐matching donors to patients for the past several years. However, we needed to increase the number of donors in our system that have a complete phenotype to meet the needs of our customers. This study assessed nearly 3 years of molecular genotyping to predict the phenotype of nearly 9000 blood donors.
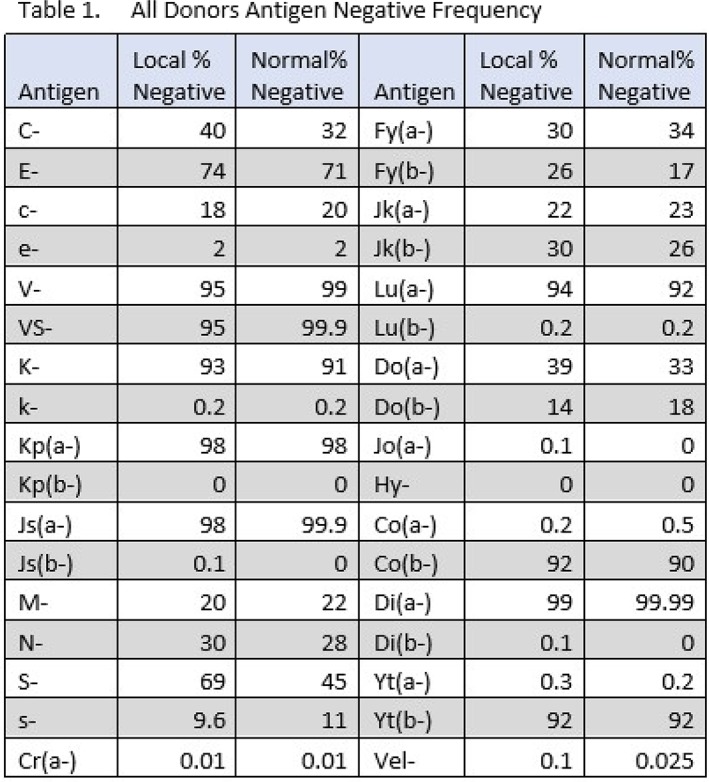
Study Design/Method: Donor samples were submitted for molecular genotyping of the following common blood group antigens: C, c, E, e, V, VS, K, k, Kp(a), Kp(b), Js(a), Js(b), Fy(a), Fy(b), Jk(a), Jk(b), M, N, S, s, U, Lu(a), Lu(b), Do(a), Do(b), Jo(a), Hy, Co(a), Co(b), Di(a), Di(b), Yt(a), Yt(b), Cr(a) and Vel. Molecular genotyping was performed by an outside vendor using a currently unlicensed laboratory developed test (LDT) that predicts the phenotype based upon single nucleotide polymorphism (SNP) analysis. We also tested for molecular changes in RHD (410) and RHCE (48C, 230T, 254G, 340T, 667T, 697G, 712G, 733G, 748A, 818T, 916G, 1006T and 1025T), GYPB (Intron 5) and FY*B (‐67C) which could identify variants or those with weakly expressed antigens. The results were electronically transferred into our Blood Establishment Computer System (BECS). Selected validation of the data was performed by the Immunohematology Reference Laboratory (IRL) staff.
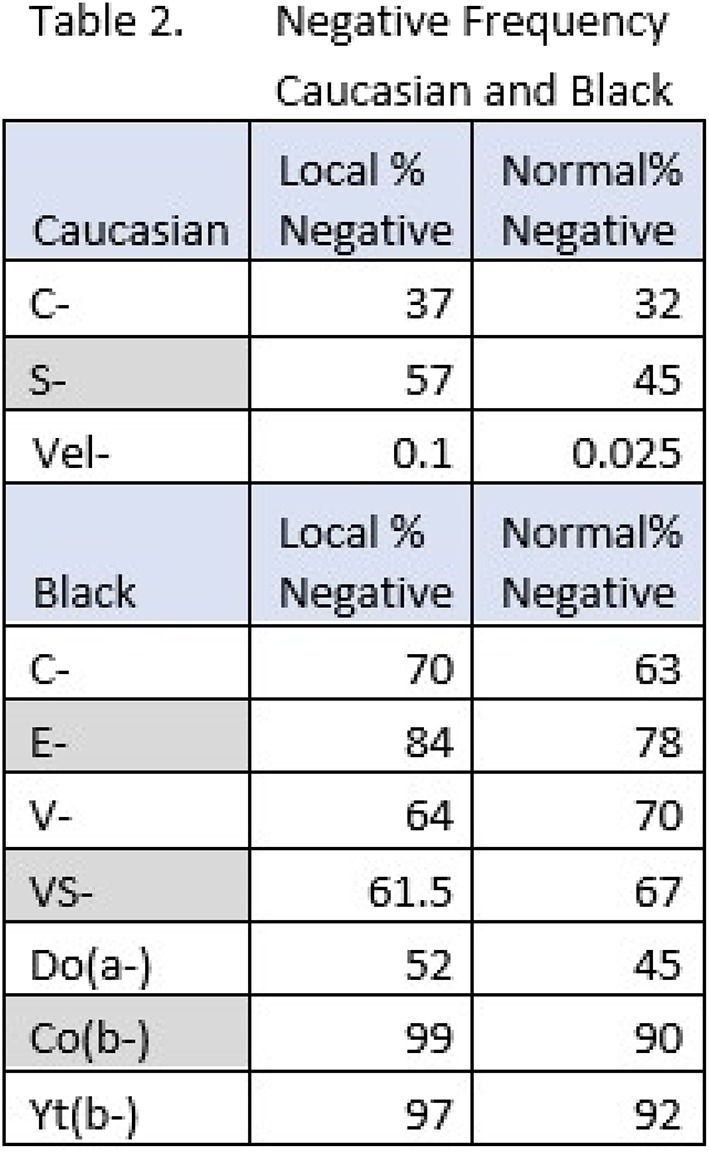
Results/Finding: Table 1 shows the negative antigen frequencies from our donor population, most of which are comparable to the published frequencies in the general population. The exceptions are: C‐ (40%), S‐(69%), Fy(b‐) (26%), Do(a‐) (39%) and Vel‐ (0.1%) which are higher than the published antigen frequencies. When we sort the donor population into Caucasian and African Americans, the following antigen negative frequencies were higher in the Caucasian population: C‐ (37%), S‐ (57%) and Vel‐ (0.1%). More importantly, our African American donors have several antigens with higher than published negative antigen frequencies including the following: C‐ (70%), E‐(84%), V‐ (64%), VS‐ (62%), Fy(a‐) (84%), Do(a‐) (52%), Co(b‐) (99%) and Yt(b‐) (97%). (See Table 2) We also identified 128 rare donors.
Conclusion: This donor‐screening program utilizing an automated molecular assay has enabled us to better identify phenotype‐matched donors for our SCD patient population, and the rare donors identified reported after serologic phenotype confirmation to the American Rare Donor Program (ARDP). We plan to continue this screening process for the next several years until the majority of our donor base has been molecularly genotyped.
INV7
Understanding the Platelet Activation Rates of Suppliers to Optimize Platelet Allocation to Hematology/Oncology Patients
Jessica Poisson*1 and Audrey Labrie2
1Duke University Hospital, 2LightIntegra Technology
Background/Case Studies: To maintain adequate platelet inventory, many centers have more than one blood product supplier. Different suppliers may have different manufacturing processes that may influence product characteristics. Great efforts are being put into understanding platelet characteristics to better inform clinical practices developed at the hospital level. Platelet activation status is used to characterize platelet component quality and function. Some studies suggest that high microparticle (MP) content in platelet components, indicating a high level of platelet activation, may limit the effectiveness of prophylactic platelet transfusions. In preparation for a quality improvement project to treat hematology/oncology patients with non‐activated, low MP platelet units, we investigated the variability in the platelet activation rates of the two different blood suppliers for a large academic tertiary care center.
Study Design/Method: Platelet activation status was determined by assessing microparticle content (MP) using dynamic light scattering (ThromboLUX, LightIntegra Technology Inc., Vancouver, Canada). The activation status of a platelet unit was reported based on a threshold of 15% MP with MP content equal to or greater than 15% is considered activated as platelet fragmentation has exceeded the predetermined threshold; below 15% MP was identified as non‐activated. Blood supplier information was captured from the donation identification number.
Results/Finding: We tested a total of 837 apheresis platelet products in plasma consisting of 738 (88.2%) from supplier A and 99 (11.8%) from supplier B. Supplier A is known to collect platelets with Amicus cell separators and Supplier B uses Trima Accel for platelet collection. 53.1% (392 out of 738) of platelets from supplier A and 24.2% (24 out of 99) from supplier B contained ≥ 15% MP and were identified as activated. During the first month of a quality improvement initiative allocating primarily non‐activated platelets for prophylactic transfusion, the average usage of platelets per patient was reduced to 4.2 from 5.1 average baseline usage for Feb – May 2017.
Conclusion: We found high variability in platelet activation rates based on MP content between our suppliers which may be explained by the different cell separation technologies used by our suppliers. In line with the literature, platelet activation status and thus residual MP may be higher in platelet products obtained with Amicus. The goals of our continuing quality improvement efforts are to determine the clinical impact of testing platelet activation status and allocating non‐activated platelets for the treatment of hematology/oncology patients.
INV8
Implementation of Platelet Pathogen Reduction in a Hospital Blood Bank – Inventory Lessons
Silvano Wendel*, Roberta Fachini, Ruth Achkar, Patricia Scuracchio, Sylvia Olyntho, Arlete Lazar, Rita Fontao‐Wendel and Mayra Altobelli Brito
Hospital Sirio Libanes Blood Bank
Background/Case Studies: Since the emergence of AIDS epidemic, many advances in the blood donation screening have contributed towards blood safety and prevention of transfusion infections. However, risks still exist. The development of pathogen reduction (PR) technology provided the inactivation of many agents not targeted in regular screening routines, (e.g. zika, other arboviruses), endemic in our country. Therefore, we decided to adopt a proactive strategy introducing PR technology for 100% of platelet components, reducing the safety gap of emerging pathogens. We analyzed the impact of this technology in our routine, mainly strengths and weaknesses in our inventory.
Study Design/Method: From Jan 17 to Mar 18, all available platelets (apheresis – APH ‐ and random donors ‐ RD) were treated by Intercept® (Cerus Corporation), and our production and transfusion demand were compared with the same immediate previous year.
Results/Finding: After PR implementation, a total of 2585 platelet doses (defined as 3.0 × 10E11) were available, where all but 4 were not treated by Intercept; a total of 2541 (98.3%) were transfused into 2649 transfusional episodes (TE), due to some pediatric patients (which required smaller doses), whilst 44 (1.7%) were discarded (5‐day expiring). The untreated transfused doses (n=4) were due to emergency cases with no available treated doses at the moment; in addition, there were 28 (1.1%) TE where partial doses (TPD) had to be transfused due to limited supply at the moment of prescription (all in agreement with the prescribing physician). All prescribed patients in the period were transfused (total, partial or untreated doses). In the same period before the implementation, a total of 2083 platelet doses was available, rendering 2059 TE, with 173 (8.3%) discarded; also, there were 3 TPD (0,1%) due to limited supply. All data are shown in Table 1.
(INV8)
| Before PR | After PR | |||||
|---|---|---|---|---|---|---|
| Components | APHERESIS | RDs | Total (%) | APHERESIS | RDs | Total (%) |
| Available Platelets | 1705 | 378 | 2083 | 2144 | 441 | 2585 |
| Transfused Doses | 1619 | 291 | 1910 (91,7) | 2114 | 427 | 2541 (98,3) |
| Discarded doses | 86 | 87 | 173 (8,3) | 30 | 14 | 44 (1,7) |
| TRANSFUSIONAL EPISODES (TE) | 1684 | 375 | 2059 | 2217 | 432 | 2649 |
| TRANSFUSIONAL PARTIAL DOSES (TPD) * | 3 | 0 | 3 (0,1) | 28 | 0 | 28 (1,1) |
| Not treated | NA | NA | NA | 2 | 2 | 4 (0,2) |
| Nº patients | ‐ | ‐ | 445 | ‐ | ‐ | 481 |
‐ Limited supply at the moment of prescription ‐ * (p<0.001)
Conclusion: Despite the increase in the number of transfused platelets after PR introduction, we were able to reduce the number of discarded units in the period (n=129 doses or ≈5% of the inventory) due to a more stringent inventory control (collection and transfusion), with reasonable savings in the final budget due to the high cost of PR. Our great challenge is the assurance of supply in situations with greater demand (disasters), since we are the only service in our country that has implemented this technology so far.
INV9
Survey: American Rare Donor Program (ARDP) Members and Their Practices Regarding Rare Units, Rare Donors, and Donor Recruitment
Joan L. Maurer*1 and Sandra J. Nance2
1ARDP, 2American Red Cross and American Rare Donor Program
Background/Case Studies: The American Rare Donor Program (ARDP) membership is 90 AABB accredited immunohematology reference laboratories (IRLs). Many, but not all ARDP members have frozen donor red cell products. It was of interest to the ARDP Advisory Committee to determine the practices for freezing rare red cells.
Study Design/Method: A survey was sent to all ARDP members to assess practices involving rare units and donors, including freezing practices, expiration date extension, and donor recruitment. The survey consisted of 8 questions, listed below:
| How do you determine which units to freeze? | Is the ACP215 in use? |
|---|---|
| Which rare products are frozen at your facility? | What tools are used for recruitment? |
| How long are units stored as liquid before freezing? | What Codabar units are in inventory? |
| Is there a concern about unlicensed frozen units? | Extended expiration dates? |
Results/Finding: Survey responses were received from 49 ARDP members. 100% of responding members freeze units negative for high prevalence antigens, with 83% of facilities using frequency to decide what units to freeze and ABO type playing a role in the decision. Of the respondents, 87% freeze multiple antigen negative rare units, 57% RHCE variants and 60% freeze autologous units. The members were split on storage time before freezing with 49% freezing within 5 days and 55% storing until expiration date then freezing the units. Some members consider either option depending on the rarity of the unit. There were concerns about frozen units being unlicensed in only 32% of members. The ACP215 instrument with closed system freezing and thawing is used in 9% of member facilities, and 11% have thought about implementing, but 80% have no plans to implement. Targeted recruitment is used in 80% of facilities with 35% responding that general rare donor recruitment is used. Older units with Codabar labeling are in inventory with 67% being negative for an antigen of high prevalence, 54% multiple antigen negative and 33% of facilities having frozen autologous units. 45% of member facilities extend expiration dates beyond 10 years for rare products.
Conclusion: Practices vary greatly throughout the membership, however, there appears to be a consensus that high prevalence antigen negative units are frozen when possible. Donor recruitment is specifically targeted by 80% of the members. Just under half of the members extend the expiration date of rare units to retain the very rare types in inventory beyond the generally used 10‐year storage time.
INV10
Implementation of Mobile Blood Storage Refrigerators Reduces Waste
Wesley Rubenstein*, Aaron J. Harding, Patricia Kopko and Elizabeth S. Allen
University of California San Diego
Background/Case Studies: During hemorrhagic events, clinicians often stockpile blood products at the bedside. Abrupt ending of the massive transfusion protocol (MTP) and return of those products can result in temperature‐related waste. RBCs are wasted if not maintained at refrigerated temperatures; plasma, because it is brought to 37 C for thawing, is inevitably wasted if not cooled to the required 1‐6 C. We implemented the Hemoroam 15XL mobile blood storage refrigerators (MBRs) (Roemer Industries, Santee, CA) for high‐volume transfusion events at our university health system, which includes 2 hospitals, a Level I trauma center, an obstetrics service and a liver transplant service (750 inpatient beds, transfusion volume: 23,000 RBC units annually). We evaluated the impact on blood product wastage.
Study Design/Method: Approval and funding were obtained from the hospital administration, and 10 MBRs were purchased and validated. A new standard operating procedure (SOP) for the MBR was implemented, and our blood issuing SOP was updated. The MBRs were piloted with the liver transplant program, and usage was subsequently expanded to the entire health system, including MTPs and other high‐volume transfusion events upon request. Stakeholders including the liver transplant team and operating room staff received training on using the MBRs. Usage trends and temperature‐related waste of RBC and plasma units for 8 months before (August 2016 through March 2017 ) and after (August 2017 through March 2018) MBR implementation were evaluated.
Results/Finding: The new MBR system has been used 207 times at our institution between August 2017 and March 2018. Of these, 28 were for liver transplants, 92 for apheresis (either plasma or RBC exchange), 33 for trauma with the remaining 54 cases being used by other teams including emergency medicine, obstetrics and critical care. Usage of the MBRs increased over time, with an overall average of 0.95 times/day (range 0.2/day in September to 1.36/day in February). Temperature‐related waste of RBCs and plasma, as a fraction of total RBCs and plasma issued, averaged 1.48% before implementation (range 0.8% to 3.0% per month) and 1.17% after implementation (range 0.7% to 1.7% per month). The rate decreased more for plasma (2.30% to 1.38%, 40% decrease) than RBCs (1.19% to 1.10%, 8% decrease). At a cost of $216 per red cell unit and $30 per plasma unit, the cost savings, based on the improvement in average wastage, is $938 per month, for a total of $7,506 over 8 months.
Conclusion: Implementation of MBRs for MTPs and other high‐volume transfusions decreases temperature‐related waste of blood products, largely by enabling thawed plasma to be returned to inventory. Benefits include saving technologist time to discard units and receive new units, and better stewardship of the donated products. The MBRs are being increasingly utilized by clinicians.
INV11
Sustainability of the Blood Supply: Impending Jeopardy for Apheresis Platelet Inventories
Merlyn H. Sayers* and Jeff Centilli
Carter BloodCare
Background/Case Studies: While publications have addressed sustainability of red blood cell supply, there are sufficient differences in the dynamics of red blood cell and apheresis platelet usage to consider separate review of experience with meeting inventory demands for these products.
Although there are challenges to meeting Group O red blood cell inventories, overall red blood cell demands have been reduced significantly by the effects of patient blood management. For apheresis platelets, however, demand has been more sustained, reflecting the fact that indications are more often prophylactic. Since the effects, over time, of an aging red blood cell donor base on collections have been demonstrated, we decided to see if similar considerations applied to the apheresis donor base. We also decided to find out the extent to which recent restrictions on donation by women with a history of pregnancy had an effect on their participation as apheresis platelet donors.
Study Design/Method: We reviewed apheresis platelet donor and apheresis platelet distribution records for 2001 through 2017. Donors were classified by age and gender. The numbers of donors in different age brackets were expressed as a percentage of the annual total number of donors for each year. We also expressed, as a percentage, the contributions that each age bracket made to the annual total apheresis platelet inventories.
Results/Finding: The age bracket that included most of the apheresis platelet donors increased progressively from the 41 to 45 years bracket in 2001, to 51 to 55 years in 2009, and to 56 to 60 years in 2017. In 2001, 14.3% of apheresis platelet donors were 56 years of age or older. In 2009 and 2017, these percentages rose to 26.4% and 33.6%, respectively.
While there was an increasing reliance (see Table) on older donors, percent contributions to annual inventories from 31 to 50 year old donors decreased by more than half between 2001 and 2017.
TABLE: Percent Contribution to Annual Inventory of Apheresis Platelets, by Donor Age For Years 2001, 2009, and 2017
| Age Bracket (Years) | ||||
|---|---|---|---|---|
| 31‐40 | 41‐50 | 51‐60 | 61+ | |
| 2001 | 21.4 | 35.7 | 23.7 | 12.1 |
| 2009 | 10.1 | 28.8 | 33.8 | 18.1 |
| 2017 | 10.4 | 15.8 | 31.4 | 26.1 |
When 2016 and 2017, the first full year of restrictions on female donors with a history of pregnancy were compared, male donor apheresis platelet contributions to annual inventory increased by 6.9% and female contributions decreased by 22%.
Conclusion: Significant aging of the apheresis donor base is such that reliance on older donors will be thwarted when, in the near future, they are more likely to be patients than they are likely to continue as apheresis donors. Restrictions on female donors have had significant effects on their participation as apheresis donors. To ensure sustainability in apheresis platelet inventories, programs will have to understand why donors aged between 31 and 50, who were dominant contributors previously, are now relatively inaccessible as donors.
INV12
Effect of Temperature Probe Placement on Blood Shipper Validation
Saravan Kumar*, Arif Rahman, Balaji Jayakumar and Tyler Rapp
MaxQ Research LLC
Background/Case Studies: Most industry standard insulated shippers that are designed to maintain Red Blood Cell (RBC) units between 1 to 10 C during transport uses wet ice as the cooling source. In such pack‐outs where RBC bags (“the payload”) are in direct contact with the wet ice – there is a detrimental effect on the integrity of the red blood cells. The maximum allowable transport duration for the RBC shippers vary based on the pack‐out (amount, type and location of cooling material) developed and validated by the blood center. In any case, shipper validation requires measuring the temperature of the payload over a required period of time while exposing the fully packed shipper to different ambient profiles. However, the placement of temperature probes is not standardized and therefore varies across blood centers. This study aims to understand and demonstrate the effects of payload volume, temperature probe placement, on shipper validation.
Study Design/Method: A series of experiments were performed, for a cardboard/Styrofoam shipper packed with 10 to 20 lbs. of wet ice. Representative volume and dimensions of water bags were used as substitute for RBC units. Number of payload units was varied to determine the effect of payload volume on measured payload temperature. Payload units were placed vertically inside a payload holder. A bag of wet ice was placed on top of the payload holder inside the shipper. NIST calibrated temperature‐measuring devices were used to record temperature every 2 minutes, at different locations inside the shipper. The shipper was placed inside a programmable environmental chamber, and exposed to transient temperature profiles representative of summer and winter conditions for 24 hours to simulate ambient temperatures during transit. Temperature of the payload at different locations of the shipper as a function of time was recorded for each of the configurations. Numerical thermal simulations using finite volume method (FVM) software were also performed to visualize temperature distributions, in key configurations. For comparison, an insulated shipper specifically designed with phase change materials was tested under similar ambient conditions.
Results/Finding: The temperature recorded for the cardboard/Styrofoam shipper tested with wet ice showed a variation of 5C and 3C between payloads at different locations inside the shipper during summer and winter ambient tests, respectively. The test results are presented in Table 1. This identifies the importance of temperature probe placement during shipper validation.
TABLE 1 (INV12) Temperature measured at different locations of shipper as a function of time
| Payload arrangement | Ambient temperature range | Payload temperature (C) | Time at temperature excursion | Maximum Temperature gradient inside the container | |
|---|---|---|---|---|---|
| Time = 0 hours | Time = 24 hours | ||||
| RBC simulant unit placed in the middle | Summer | 4.5 | 10.6 | 22 hours | 5C at 20 hours |
| Winter | 5.4 | 1.7 | Didn't fail | 3C at 5 hours | |
| RBC simulant unit placed close to the side wall | Summer | 5.8 | 17.9 | 5 hours | 5C at 20 hours |
| Winter | 5.7 | 0.7 | 22.5 hours | 3C at 5 hours | |
Conclusion: The placement of the temperature probe has a significant effect on the shipper validation duration. This data, corroborated with FVM simulations, demonstrates the importance of choosing the most appropriate point of temperature measurement, while also considering the payload volume and measurement methods.
INV13
Applying Internet of Things to Improve Blood Availability and Blood Supply Management Efficiency in Remote Areas
Xiuguo Jin1, Xiaofan Zheng*2, Haijun Fu1, Haoru Li1, Zhonghua Meng2, Ning Fang3 and Haihong Wang1
1Central Blood Station of Zhoushan, 2Blood Center of Zhejiang Province, 3College of Computer Science, Zhejiang University
Background/Case Studies: In developing nations and remote areas, the transportation of blood was often inconvenient owing to poor infrastructure and geographical barrier. Once issued, the blood units cannot be taken back by blood bank with the concern of short shelf life and cold chain. Thus, there is a dilemma of blood storage in hospitals in remote areas: if the blood storage is too little, there will be a blood supply shortage; if the blood storage is too much, there will be a much higher blood expiration and waste. As the result, it causes a bottleneck of blood supply and decreases blood availability. To promote blood supply management efficiency and ensure blood availability in remote areas, an Internet of Things (IoT) ‐based blood cold chain monitoring system was developed.
Study Design/Method: RFID cards were attached to red blood cells unit bags to monitor cold chain. Red blood cells units stored in remote hospitals that are due to expire in 15 days are taken back and redistributed to nearby hospitals after necessary tests. The study collected the data before and after using the new monitoring system in four island hospitals during 2009 to 2016, and analyzed the data of blood expiration with statistical methods.
Results/Finding: Since the new monitoring system was deployed in 2013 among four hospitals in remote islands (inhabitants more than 70,000), the red blood cells unit storage has increased. The incident of emergency blood collection and supply was decreased from eight (year 2009‐2012, prior to the use of new monitoring system) to one (year 2013‐2016, since the use of new monitoring system), thus blood availability was increased significantly. Also with the comparison of the same time span, the number of expired red blood cells units was decreased from 1819 to 430, and the expiry rate declined from 27% to 6%. The difference of expiry rates in each hospital between before and after the use of new monitoring system is significant (P<0.05). There has been no adverse report of the reuse of the take‐back blood units.
Conclusion: The application of Internet of Things can promote blood availability and blood supply management efficiency in remote areas.
INV14
Blood Inventory Management at King Hussein Cancer Center Blood Bank
Salah Bohisi*, Maher Sughayer, Tamara Dabbagh, Esraa Al‐Khateeb, Aya Ataallah and Mohammad Nour Ghanem
King Hussein Cancer Center
Background/Case Studies: Blood inventory management is a tricky and challenging process, considering the absence of real constraints to control blood issuing upon its need. Therefore, maintaining the balance between guaranteeing blood availability and minimizing wastage is a continuous demand to make sure that the product is used effectively and efficiently.
At King Hussein Cancer Center (KHCC) blood bank, over 12,000 blood units are donated each year to cover KHCC patient demands. Minimum stock limits for each blood type govern the amount of donations accepted on daily basis, in accordance with Jordanian ABO distribution figures. Daily total minimum stock limit is established based on the current patient need and is reviewed at least annually (189 blood unit in 2015, and was adjusted twice since: 210 in 2016 and 252 in 2017) based on increased demand.
The aim of this study, is to examine KHCC inventory management performance in order to consider appropriate guidelines for best practice and to improve efficiency of blood bank services.
Study Design/Method: Retrospective review of inventory monitoring records for 2015, 2016, 2017 and the first quarter of 2018 was done and figures were analyzed using two important measures: the Issuable Stock Index (ISI) – an approximation of the number of days of unreserved stock of all blood groups held in the inventory – and Wastage as a Percentage of Issue (WAPI) to present stock and wastage data.
ISI and WAPI were calculated based on the following formulas:
ISI=Number of unreserved red cell units of all groups/ (Number of red cell units issued in a Year/Number of days of the Year)
WAPI = (Number of units wasted/Number of units issued) × 100
ANOVA was used to test the difference between three means.
Results/Finding: The average ISI for 2015, 2016, 2017 and the first quarter of 2018 was 7.5, 8.6, 7.1 and 6.1 respectively. The WAPI percentages varied between 0.5% and 0.9%
(INV14)
| Year | JAN | FEB | MAR | APR | MAY | JUN | JUL | AUG | SEPT | OCT | NOV | DEC | AVG. | |
|---|---|---|---|---|---|---|---|---|---|---|---|---|---|---|
| 2015 | ISI | 7.3 | 5.4 | 6.7 | 7.7 | 8 | 8.8 | 6.5 | 7.7 | 10.1 | 7.3 | 8.1 | 5.9 | 7.5 |
| WAPI | 0.7% | 0.3% | 0.4% | 0.5% | 0.7% | 0.7% | 0.6% | 0.6% | 0.6% | 0.4% | 0.6% | 0.4% | 0.5% | |
| 2016 | ISI | 6.3 | 6.4 | 5.9 | 7.3 | 7.2 | 7.2 | 9.7 | 9.5 | 10 | 12.5 | 11.3 | 10.4 | 8.6 |
| WAPI | 0.4% | 0.3% | 0.4% | 0.5% | 0.3% | 0.7% | 1.2% | 0.5% | 2.9% | 1.4% | 1.7% | 1.6% | 0.9% | |
| 2017 | ISI | 6.9 | 6.9 | 6.3 | 8.1 | 6.5 | 6.3 | 6.3 | 6.4 | 8 | 8.9 | 9.3 | 5.7 | 7.1 |
| WAPI | 1.8% | 1.1% | 0.7% | 0.7% | 0.7% | 0.8% | 0.8% | 0.4% | 1.5% | 0.5% | 0.6% | 0.3% | 0.8% | |
| 2018 (Till March) | ISI | 6.2 | 5.9 | 6.4 | 6.1 | |||||||||
| WAPI | 0.2% | 0.9% | 1.0% | 0.7% | ||||||||||
Though the minimum daily stock limit was increased, average ISI for 2015, 2016 and 2017 remained comparable with no difference P‐value = 0.0675. Also comparing three years WAPI showed P‐value = 0.1264.
Conclusion: A vital responsibility of blood bank is to ensure that the donated blood is used (minimizing waste) while having sufficient stock available to deal with emergencies.
An effective inventory management procedure relays on simple daily monitoring of blood unit stock and waste. Patient demand varies within the same institution from time to time and this should also be taken in consideration to avoid either an increase or a decrease in ISI and WAPI values.
Finally, setting a daily unreserved stock limits is very important to assure scrutinized monitoring and remedial action, but the benefit would only be maximized if the limits were set upon ABO hospital demand and ABO distribution percentages in the population. It is also worth noting, that keeping a strong donor recruitment base is very important to manage the inventory in a flexible manner based on daily changes.
INV15
Advantage Predicted by an Electronic Packing List for Delivery of Blood Products
Curtis Dunn* and Jessica Poisson
Duke University Hospital
Background/Case Studies: Receiving blood products in to inventory shipped from a blood supplier is a non‐billable workflow in the transfusion service. Steps include unpacking the shipment box, comparing paper list of products to received units, scanning units into the Transfusion Service Information System (TSIS), set up for re‐typing if an RBC, and then finally placing product into inventory. Antigen testing on units is particularly vulnerable to increased time and error as each result will have to manually added to the product entry in the TSIS. Electronic packing lists are currently available to move specimens around without the need to manually re‐enter each item; this has not been available for blood products shipped from an outside supplier. We sought to quantify the time benefit an electronic packing list by measuring time spent receiving blood products into the TSIS.
Study Design/Method: The electronic delivery step of receiving blood was timed for random staff and shifts over a 2 week period at a large academic tertiary care hospital. All shifts and technologist experience levels were represented. Unpacking, segment management and re‐typing were excluded from the measured time. Data analysis was performed with Microsoft Excel (Redmond, WA, USA). Deliveries more than 3 SD from mean were excluded from results.
Results/Finding: The time study captured 1687 products during 129 separate delivery episodes for a mean of 13.1 units per episode. All product types were represented, with the majority being RBCs (54.5%). The average time of delivery across all products was 12.0 s/unit; component specific delivery times are presented in Table 1. RBCs labeled with antigen testing results took a mean of 28.9 s/unit. Using 2 years of inventory data, average monthly product volumes were compared against the time required to bring in each unit. This calculation predicts that the Transfusion Service spends 17.3 hours per month on computer entry of blood products.
Conclusion: Receiving inventory into the TSIS takes significant laboratory time. Scannable packing lists or electronic delivery of blood product lists could provide benefits including increased accuracy of antigen results and freeing up valuable technologist time for other laboratory activities. This becomes especially important during emergencies when re‐stocking can impede patient care.
TABLE 1 Average computer delivery time by product
| Time/unit (s) Mean | Total Units Surveyed | Units Received/Mo Mean | Monthly Time Receiving Units (Hours) | |
|---|---|---|---|---|
| RBC | 6.2 | 919 | 2,618.4 | 4.53 |
| RBC Ag. Neg | 28.9 | 188 | 415.6 | 3.34 |
| FFP | 15.6 | 277 | 920.2 | 4.00 |
| CRYO | 16.8 | 87 | 250.2 | 1.16 |
| PLT | 15.4 | 216 | 1,009.7 | 4.31 |
| Total | 12.0 | 1687 | 5214.1 | 17.34 |
INV16
An Itemized Review of Blood Product Discards at a Community Hospital: Three Years' Experience
James P. Kolton*, Cheryl A. Maloney and Kathleen M. Hurley
Norwood Hospital
Background/Case Studies: Discard of a unit of a perishable blood product is an unfortunate, infrequent, but widespread outcome of the unit(s) generously donated by volunteer donors. Several studies have reported on the frequency of such mishaps in individual Hospital or Health Care Systems, in surveys conducted by the College of American Pathologists, and on attempts to reduce discards.
At our community hospital for the past three years we have tabulated and itemized product discards for the three blood components: packed red blood cells (RBC), fresh frozen plasma (FFP), and Platelets.
Study Design/Method: For three years, 2015‐2017 we have used a standard itemized list of reasons for return of products to the Blood Bank; and for FFP and Platelets, the ordering physician is identified.
Results/Finding: PRBC wastage was significantly lower (p<.001) in 2017 compared to 2015 or 2016. The percent of wasted units of FFP or Platelets did not significantly differ between the three years (Table 1.)
TABLE 1 (INV16) Comparisons of Percentage (Fraction) of Units Wasted 2015‐2017
| Blood Product | 2015 | 2016 | 2017 | p‐value** |
|---|---|---|---|---|
| PRBC | 3.8% (63/1651) | 3.8% (57/1519) | 1.5% (21/1417)129 | <.001 |
| FFP | 8.8% (15/170) | 8.0% (16/199) | 6.7% (12/179) | 0.76 |
| Platelet | 19.7% (13/66) | 8.5% (4/47) | 9.8% (5/51) | 0.15 |
p‐value from chi‐square test comparing 3 years;
2017 PRBC significantly lower (p<.001) than 2015 and 2016
Reasons for discard of blood products are:
RBC Reasons (# units, for three years):
Outdated (62) and Blood Supplier Credit** (24), Return from OR>10°C (11), Return from Floor>10°C (14),
RN Punctured (5), Miscellaneous (6), Autologous (19); Total (141)
[141 discards/4587 units received = 3.07% discard rate for three years]
**Outdated AB units, returned for credit to Blood Supplier; total of 86 RBCs outdated for three years
(86 outdated units/4587 units received = 1.87% outdate rate for three years)
For unused FFP we identified 26 providers: 23 with one (1) unused unit, one with two (2) unused units, one with three (3) unused units, and one with seven (7) unused units. Five (5) patients expired before transfusion, and three (3) FFP bags broke.
For unused platelets there were sixteen providers, fourteen with one (1) unused unit each, one provider with two (2) unused units, and one provider with three (3) unused units. Blood Bank technologist(s) were involved with three (3) additional unused platelet units.
Conclusion: There was a significant reduction in RBC discards in 2017 compared to the two prior years, due to a new real time on‐line blood product ordering system real time on‐line blood product ordering system with the blood supplier; and a lesser, sustained reduction in Platelet wastage in 2016.
For FFP and platelets, the major reasons for discard were that the units were ordered and not used.
Reduction in blood discards requires cooperation between the Blood Bank and blood supplier; and awareness by the ordering providers to confirm the necessity of the order to transfuse.
INV17
Contemplating Rotation and Restocking Programs If the Shelf Life of Apheresis Platelets Is Prolonged
Veronica Moore*1, Geeta Paranjape1, Jeff Centilli1, Robert Cornell1, Doug Heath1 and Merlyn H. Sayers1,2
1Carter BloodCare, 2UT Southwestern Medical Center at Dallas
Background/Case Studies: Although blood programs have a number of different approaches to providing apheresis platelet inventories at hospitals, including prohibiting returns, our large blood center elects to rotate and restock apheresis platelets maintained on site at approximately 30 healthcare facilities. While there is no charge for this service, it relies on many hospitals, which typically experience a relatively high daily transfusion demand for apheresis platelets, accepting shorter dated units that have been returned to the blood center through the daily rotation schedule. Recently, however, there has been an increasing number of requests from facilities to keep onsite inventories of apheresis platelets. This is to comply with anticipated maternal levels of care designation requirements, massive transfusion protocols, and trauma level designations. Against the background of continuing challenges to maintaining adequate inventories at hospitals, made more acute by increasing demand for product and aging of the apheresis platelet donor base, we decided to investigate our rotate and restock policy more closely. We wanted to pay special attention to the proportion of our overall apheresis platelet supply under rotate and restock management and also the proportion of this inventory eventually lost to outdate when short dated product, returned from rotation and restocking hospitals, was not transfused at busier transfusion services.
Study Design/Method: We reviewed our annual apheresis platelet supply to rotation and non‐rotation hospitals for 2015 through 2017 and selected for special attention those rotation hospitals returning more than 50% of their apheresis platelet stocks. A daily average was determined for the number of hours before outdate remaining on apheresis platelets at issue and at return. Further evaluation was carried out on the returned platelets for their eventual percentage outdate.
Results/Finding: During 2015 through 2017, 131,882 apheresis platelets were distributed to all hospitals. Of this distribution 75,193 (57%) were provided to the rotation restock hospitals. Of the 30 hospitals on this platelet rotation restock program, 18 utilized less than 50% of the platelets shipped to them from 2015 to 2017. There was an average of 76 hours remaining on the platelets shipped and 44 hours remaining before outdate when these platelets were returned. The total number of platelets distributed to the 18 hospitals was 45,882, of which 18,332 (40%) were used. Of the remaining 27,550 returned, 4,794 (17.4%) were ultimately outdated.
Conclusion: There is opportunity to improve the efficiency of rotate and restock policies. This will depend on the approval of extended outdate for apheresis platelets beyond the currently permissible 7 days. In this regard, cold stored platelets with a much longer shelf life would significantly reduce transport and delivery costs associated with an inventory rotation schedule and also decrease the numbers of short dated products that risk outdate when they are redistributed, with only a few hours of shelf life remaining, to hospitals with busy transfusion services.