

Abstract
Thermogenesis in brown adipose tissue (BAT) declines with age; however, what regulates this process remains poorly understood. Here, we identify mitochondria lipoylation as a previously unappreciated molecular hallmark of aged BAT in mice. Using mitochondrial proteomics, we show that mitochondrial lipoylation is disproportionally reduced in aged BAT through a post-transcriptional decrease in the iron-sulfur (Fe-S) cluster formation pathway. A defect in the Fe-S cluster formation by the fat-specific deletion of Bola3 significantly reduces mitochondrial lipoylation and fuel oxidation in BAT, leading to glucose intolerance and obesity. In turn, enhanced mitochondrial lipoylation by α-lipoic acid supplementation effectively restores BAT function in old mice, thereby preventing age-associated obesity and glucose intolerance. The effect of α-lipoic acids requires mitochondrial lipoylation via the Bola3 pathway and does not depend on the anti-oxidant activity of α-lipoic acid. These results open up the possibility to alleviate the age-associated decline in energy expenditure by enhancing the mitochondrial lipoylation pathway.
Keywords: Brown adipose tissue, Mitochondria, Thermogenesis, Glucose metabolism
Reporting summary
Further information on research design is available in the Nature Research Reporting Summary linked to this article.
Introduction
Brown adipose tissue (BAT) plays a central role in the maintenance of whole-body temperature and energy homeostasis through non-shivering thermogenesis 1,2. Besides thermogenesis, image-based studies employing positron emission tomography-computed tomography (PET/CT) with glucose or fatty acid tracers demonstrate that BAT acts as a significant metabolic-sink for glucose and fatty acids 3–6. This metabolic-sink activity in BAT is closely linked to its functional roles of increasing whole-body energy expenditure and improving glucose homeostasis, lipid metabolism, and insulin sensitivity 7. For example, cold acclimation potently stimulates the uptake of glucose and triglyceride-rich lipoproteins to BAT, improving systemic glucose and lipid homeostasis 8–11. Since the glycemic improvement following thermogenic fat activation is observed prior to a body-weight loss, the glycemic benefit of thermogenic fat cells appears beyond its anti-obesity effect 12.
A notable observation made by the PET/CT imaging studies in humans is that glucose uptake by BAT is significantly reduced with increased age 3,13,14 and that the age-associated reduction is associated with impaired systemic glucose homeostasis 15. However, molecular mechanisms of the age-associated decline in BAT activity remain insufficiently understood. This is a significant topic worth exploration, because identifying a “molecular hallmark” of the age-associated BAT impairment may lead to auspicious measures of extending metabolic health by reversing or alleviating such processes. Previous studies in rodents have proposed several mechanisms that might contribute to the age-associated decline in BAT function. For instance, studies in rats reported that expression of a BAT-specific thermogenic protein, uncoupling protein 1 (UCP1), and the levels of GDP binding to the BAT mitochondria, i.e., UCP1-mediated proton uncoupling activity, were reduced with age 16–19. However, the reduced UCP1 expression and activity do not likely constitute the entire mechanism of the age-associated reduction in BAT glucose uptake because glucose uptake to brown and beige fat remains active even in the absence of UCP1 12,20. More recently, cellular senescence was demonstrated to negatively impact cold-induced beige adipocyte biogenesis in mice 21; however, it remains uncertain if the age-associated reduction in BAT activity is due to the disappearance of thermogenic fat cells or the dormancy of glucose uptake in the BAT.
Here, we employed mitochondrial proteomics to search for molecular hallmarks of aged BAT. We found that mitochondrial lipoylation was disproportionally reduced in aged BAT relative to young BAT. Mice with a defect in mitochondrial lipoylation exhibited impaired glucose catabolism and thermogenesis in the BAT, leading to the development of diet-induced obesity and glucose intolerance. Conversely, α-lipoic acid supplementation potently restored the age-associated decline in BAT thermogenesis and glucose uptake in old mice, and the effect required mitochondrial lipoylation in adipocytes. These results suggest the potential reversibility of age-associated BAT attenuation by enhancing mitochondrial lipoylation.
Results
Age-associated decline in BAT thermogenesis is coupled with a post-transcriptional impairment in the mitochondrial fuel oxidation pathway.
The age-associated decline in cold-induced thermogenesis stems from multiple mechanisms, including increased heat-loss, reduced responses to the sympathetic nervous system (SNS)-mediated stimuli, and impaired thermogenesis 22. To critically determine tissue-specific changes in BAT, we first monitored adipose tissue temperature of young mice (10 weeks old) and old mice (76 weeks old) in response to acute norepinephrine (NE) that mediates cold-induced thermogenesis through the β-adrenergic receptor (β-AR) signaling 23. To minimize the contribution of heat-loss and also distinguish the effect of β-AR activation from the cold-stimulated SNS stimuli, young and old mice were kept under a thermoneutral condition at 30˚C and treated with a selective β3-adrenergic receptor agonist (β3-AR agonist, CL316,243) for 5 consecutive days. Subsequently, we measured tissue temperature of the interscapular BAT (iBAT), subcutaneous inguinal WAT, and skeletal muscle using micro-thermal probes (Figure 1a). Following NE stimulation, tissue temperature recording detected increased thermogenesis in iBAT (Figure 1b). We found that NE-induced iBAT thermogenesis was significantly lower in old mice relative to young mice following β3-AR agonist treatment (Figure 1c). Similarly, NE-induced thermogenesis was significantly elevated in the inguinal WAT of young mice treated with β3-AR agonist, whereas no increase was observed in old mice (Figure 1d). The impaired thermogenesis in the aged inguinal WAT reflects impaired beige adipocyte biogenesis because we found, along with others 21,24, that beige adipocyte biogenesis in response to β3-AR agonist was significantly blunted in the inguinal WAT of aged mice (Supplementary Fig. 1a, b). No change in skeletal muscle thermogenesis was seen between young and old mice (Figure 1e). These data reinforce the notion that aging is associated with impaired non-shivering thermogenesis in brown and beige fat.
Figure 1. Age-associated decline in BAT thermogenesis is coupled with a post-transcriptional impairment in the mitochondrial fuel oxidation pathway.

a. Schematic illustration of the experiment. Young and old mice were treated with either β3-AR agonist (CL-316,243) or vehicle (saline) at 30˚C for 5 days. Tissue temperature in the interscapular BAT (iBAT), inguinal WAT (iWAT), and skeletal muscle was recorded. b. Real-time temperature changes in iBAT of young and old mice treated with CL-316,243 in response to norepinephrine (NE) treatment (arrow). Young mice, n=5; Old mice, n=4, biologically independent samples. c-e. Quantification of NE-stimulated thermogenesis in iBAT (c), iWAT (d), and skeletal muscle (e) of young and old mice. Young with saline or CL-316,243, n=5; Old with saline or CL-316,243, n=4, biologically independent samples. f. Venn diagram of the down-regulated proteins and genes in aged BAT relative to young BAT (left). Right panel: the heat map of protein and gene expression. The color scale shows log2 centered intensity representing the protein and mRNA levels in blue (low expression)-white-red (high expression) scheme. n=3, biologically independent samples. N.S., not significant. g. Repressed biological pathways in aged BAT relative to young BAT in (f) by Metascape. n=3, biologically independent samples. h-j. Valine oxidation (h), fatty acid oxidation (i), and glucose oxidation (j) in iBAT of young and old mice. Young with saline, n=4 for (h-j); Young with CL-316,243, n=4 for (h), n=3 for (i-j); Old with saline, n=3 for (h-i), n=4 for (j); Old with CL-316,243, n=4 for (h-i), n=3 for (j), biologically independent samples. k. PDH activity in iBAT and iWAT of young and old mice. Young with saline, n=7 for both tissues; Young with CL-316,243, n=8 for both tissues; Old with saline, n=5 for iBAT, n=6 for iWAT; Old with CL-316,243, n=7 for iBAT, n=5 for iWAT, biologically independent samples. Data in (b-e) and (h-k) are expressed as means ± s.e.m. Data were analyzed by two-way repeated measures ANOVA (b), one-way ANOVA by Tukey’s post hoc test (c-e and h-j), empirical Bayes statistics (f) or hypergeometric test (g).
The age-associated impairment of adipose tissue thermogenesis appears independent of transcriptional changes in thermogenic gene expression, because we found no significant difference in the expression of Ucp1, Elovl3, Cox7a, Cox8b, and Adrb3 between young and old BAT (Supplementary Fig. 1c). Accordingly, we aimed to determine the extent to which age-dependent attenuation of BAT thermogenesis is associated with changes in the mitochondrial protein composition. To this end, we performed mitochondrial proteomics of iBAT from young and old mice that were treated with β3-AR agonist at 30˚C. Of note, there was no difference in total mitochondrial proteins between young and aged BAT after β3-AR agonist treatment (Supplementary Fig. 1d). We also performed RNA-sequencing of the corresponding iBAT samples and examined their transcriptional profile. Mitochondrial proteomics identified 172 mitochondrial proteins whose expression was significantly (P<0.05) and disproportionally reduced in aged BAT, regardless of the normalization by the total mitochondrial protein level or without normalization (Supplementary Table 1). Unexpectedly, the age-dependent reduction in mitochondrial proteins largely occurred at the protein expression level (84.3%, 145 out of 172 proteins), whereas only 15.7% (27 out of 172 proteins) were reduced at both the transcriptional and protein levels (Figure 1f). Such proteins included mitochondrial enzymes in the pathways of branched amino acid (BCAA) oxidation, the tricarboxylic acid (TCA) cycle, fatty acid metabolism, and glucose oxidation (Figure 1g). By contrast, no significant change was seen in the protein expression of UCP1, COX7A, and COX8B between young BAT and old BAT (Supplementary Fig. 1e).
Consistent with the above observation, we found that BCAA oxidation in BAT was significantly lower in old mice relative to young mice following β3-AR stimulation at 30˚C (Figure 1h). Furthermore, β3-AR agonist-stimulated fatty acid oxidation and glucose oxidation were significantly lower in old mice than young mice (Figure 1i, j). Notably, the enzymatic activity of pyruvate dehydrogenase (PDH), the gatekeeper in the TCA cycle that converts pyruvate into acetyl-CoA in the mitochondria, was lower in aged BAT and inguinal WAT than young BAT following β3-AR treatment (Figure 1k). These results suggest that a post-transcriptional decline in the mitochondrial fuel oxidation pathways is tightly linked to the age-associated decline in adipose tissue thermogenesis.
Mitochondrial lipoylation and iron-sulfur cluster formation are reduced in aged BAT.
Next, we aimed to determine the post-transcriptional mechanisms by which PDH activity was reduced in aged BAT. Since phosphorylation of the E1 subunit of PDH complex by PDH kinases (e.g., PDK4) is a well-established negative regulator of PDH activity 25, we first examined phosphorylation of the PDH-E1 subunit in young and aged BAT. We found that the levels of PDH phosphorylation at S232, S293, and S300 of the E1 subunit were significantly reduced in response to β3-AR agonist; however, the degree of reduction was indistinguishable between young and old mice (Figure 2a). By contrast, the levels of mitochondrial lipoylation, including lipoylated DLAT (Dihydrolipoamide S-Acetyltransferase, the E2 subunit of PDH complex), dihydrolipoamide branched-chain transacylase (DBT), and dihydrolipoyl lysine-residue succinyltransferase (DLST), and pyruvate dehydrogenase E3-binding protein (PDH-E3BP), were disproportionally lower in aged BAT than that in young BAT following β3-AR agonist (Figure 2b, Supplementary Fig. 2a). A time-course analysis found that age-associated reduction in the PDH activity in BAT emerged at 48 weeks of age and older in conjunction with reduced mitochondrial protein lipoylation (Figure 2c, Supplementary Fig. 2b). Mitochondrial lipoylation in BAT was activated by cold exposure through β-AR signaling because the cold-induced mitochondrial lipoylation was not seen in β-less mouse that lacked all the three forms of β-ARs 26 (Supplementary Fig. 2c). Of note, mitochondrial lipoylation in the liver and skeletal muscle remained unchanged between young and old mice (Supplementary Fig. 2d), suggesting that the age-associated reduction in mitochondrial lipoylation occurred preferentially in BAT.
Figure 2. Reduced mitochondria lipoylation and iron-sulfur cluster formation in aged BAT.

a. Immunoblotting for PDH-E1α (pSer232), PDH-E1α (pSer293), PDH-E1α (pSer300), and PDH-E1α in the iBAT of young and old mice treated with CL-316,243 or saline at 30˚C. Young with saline and CL-316,243, n=9; Old with saline, n=7; Old with CL-316,243, n=9, biologically independent samples. b. Immunoblotting for lipoylated DLAT, lipoylated proteins and DLAT (PDH E2) in the isolated mitochondria from iBAT young and old mice treated with CL-316,243. n=5, biologically independent samples. c. Immunoblotting for indicated proteins in the iBAT of mice at 10-, 24-, 48- and 76 weeks old treated with CL-316,243. n=5, biologically independent samples. COX IV as a loading control. Molecular weight (MW) is shown on the right in (a-c). Quantifications of phosphorylated PDH-E1 level (a), lipoylated DLAT and lipoylated proteins (b-c) are normalized by total PDH-E1, DLAT, and COX IV levels, respectively. d. Experimental scheme of the immunoprecipitation and mass-spectrometry (left). Silver staining of lipoylated proteins immunopurified (IP) from BAT lysate using antibody against lipoic acid (right). A representative image from four experiments. IgG was used as a control. Lipoylated DLAT is indicated. e. The biological pathways of ipoylated mitochondrial protein complex in (d) by Metascape. f. Schematic illustration of the mitochondrial Fe-S cluster formation and mitochondrial lipoylation. g. Expression profiles of indicated mitochondrial proteins and the corresponding genes in iBAT of young and old mice treated with CL-316,243. n=3, biologically independent samples. The color scale shows log2 centered intensity representing the protein and mRNA levels in blue (low expression)-white-red (high expression) scheme. Data in (a-c) are expressed as means ± s.e.m. Data were analyzed by unpaired two-sided t-test (a-b), one-way ANOVA by Tukey’s post hoc test (c), hypergeometric test (e), or empirical Bayes statistics (g).
Lipoate is the conjugate base of lipoic acid that functions as an essential co-factor for the activity of several mitochondrial enzymes, including DLAT in the PDH complex, DBT in the branched-chain oxoacid dehydrogenase (BCDH) complex, and DLST in alpha-ketoglutarate dehydrogenase (KGDH) 27. Since lipoylated proteins and their protein complex in BAT remain uncharacterized, we next immunopurified endogenous lipoylated proteins from iBAT and identified them by liquid chromatography–mass spectrometry (LC-MS/MS) (Figure 2d). As expected, the proteomics analysis identified DLAT (~68 kDa), DLST, and DBT, that were known lipoylated proteins in the mitochondria. In addition, we identified 98 mitochondria-localized proteins that formed protein complexes with lipoylated proteins, many of which were in the fuel oxidation pathways, such as the TCA cycle, fatty acid oxidation, BCAA oxidation, and mitochondrial OXPHOS (Figure 2e, Supplementary Table 2).
A notable regulator of these pathways is the mitochondrial iron-sulfur (Fe-S) cluster formation: the maturation of lipoate-containing proteins requires Fe-S clusters because lipoate synthesis depends on radical S-adenosylmethionine reactions on the key lipoate synthesis enzyme, lipoic acid synthetase (LIAS) 28,29 (Figure 2f). We found that critical regulators of the Fe-S cluster formation (Nfs1, Isca1, and Bola3) and many 4Fe/4S target proteins, including Complex I components, were significantly reduced in aged BAT relative to young BAT, whereas the majority (88.9%) of their respective gene expression levels remained unchanged between young and aged BAT (Figure 2g). Consistent with the observation, mitochondrial complex activities were significantly reduced in old BAT relative to young BAT (Supplementary Fig. 2e). Since other mitochondrial proteins, such as outer membrane proteins (e.g., MTCH1), were not differentially expressed between young and old mice, the age-associated reduction in the mitochondrial Fe-S cluster pathway was not merely due to a general decrease in mitochondrial contents. These data suggest that the post-transcriptional reduction in mitochondrial lipoylation through the Fe-S cluster pathway is a molecular hallmark of aged BAT.
Mitochondrial lipoylation is required for fuel utilization and thermogenesis in BAT.
Among the regulators of the Fe-S cluster formation, Bola3 caught our attention because 1) Bola3 protein expression was reduced in aged BAT, 2) Bola3 expression was highly enriched in brown and beige fat relative to white fat, and 3) its expression in BAT was upregulated by cold exposure (Figure 3a, b, Supplementary Fig. 3a). Bola3 is crucial for lipoate synthesis by controlling the formation of mitochondrial Fe-S clusters 30,31. Accordingly, we hypothesized that a decline in mitochondrial lipoylation via the Bola3 pathway contributes to the age-associated decline in BAT activity. To test this hypothesis, we generated fat-specific Bola3 knockout mice (Adipo-Bola3 KO, Adiponectin-Cre; Bola3flox/flox) by crossing Bola3flox/flox mice with Adiponectin-Cre mice (Figure 3c). Consistent with the previous studies showing that genetic mutations in the BOLA3 gene cause an impairment in protein lipoylation in human fibroblasts 30,32,33, we found that lipoylation in the BAT, but not in the WAT and liver, was reduced in Adipo-Bola3 KO mice relative to littermate controls (Bola3flox/flox) (Figure 3d, Supplementary Fig. 3b). On the other hand, PDH-E1 phosphorylation at S232, S293, and S300 in the BAT was not altered by Bola3 deletion (Supplementary Fig. 3c). In addition, the expression of UCP1 and other BAT-selective genes was not different between control and Adipo-Bola3 KO mice (Figure 3d, Supplementary Fig. 3d).
Figure 3. A requirement of mitochondrial lipoylation for fuel utilization and thermogenesis in BAT.

a. Venn diagram of indicated Fe-S cluster regulators. Comparisons between young and old BAT (E-MTAB-7445), BAT and WAT (GSE51080), beige adipocytes and white adipocytes (E-MTAB-3978), and BAT from cold- and warm-acclimated mice (GSE110297). b. Immunoblotting of BOLA3 in indicated tissues. c. Immunoblotting of BOLA3 in iBAT and liver of control and Adipo-Bola3 KO mice. β-actin as a loading control. d. Immunoblotting of indicated proteins in iBAT of control and Adipo-Bola3 KO mice. COX IV as a loading control. (b-d) are representative images from three experiments. e. Expression of indicated mitochondrial proteins in iBAT of control and Adipo-Bola3 KO mice. Control, n=4; Adipo-Bola3 KO mice, n=3, biologically independent samples. The color scale shows log2 centered intensity. N.S., not significant. f. PDH activity in indicated tissues of control and Adipo-Bola3 KO mice under ambient temperature. iBAT, n=6; Inguinal WAT, n=4; Epididymal WAT, n=4, biologically independent samples. g. PDH activity in the inguinal WAT of control and Adipo-Bola3 KO mice treated with CL-316,243 for 5 days at 30˚C. n=7, biologically independent samples. h-i. Glucose oxidation (h) and valine oxidation (i) in iBAT of control and Adipo-Bola3 KO mice. Mice received CL-316,243 at ambient temperature an hour before harvesting the tissue. Control, n=4 for (h), n=5 for (i); Adipo-Bola3 KO mice, n=5 for (h-i), biologically independent samples. j. OCR in iBAT of controls and Adipo-Bola3 KO mice. Control with saline or CL-316,243, n=4; Adipo-Bola3 KO mice with saline or CL-316,243, n=5, biologically independent samples. k. Real-time changes in iBAT temperature of controls and Adipo-Bola3 KO mice in response to NE. n=4, biologically independent samples. (f-k) data are expressed as means ± s.e.m. Data were analyzed by empirical Bayes statistics (e), unpaired two-sided t-test (f-i), one-way ANOVA by Tukey’s post hoc test (j) or two-way repeated measures ANOVA (k).
To determine specific changes in the mitochondrial protein composition caused by the fat-specific Bola3 loss, we next employed mitochondrial proteomics in the BAT of Adipo-Bola3 KO and control mice. We found that the protein expression of many 4Fe-4S target proteins in the Complex I and some Complex II proteins was significantly reduced in the BAT mitochondria of Adipo-Bola3 KO mice (Figure 3e, Supplementary Table 3). On the other hand, we did not see changes in the Complex III proteins between the genotypes (Supplementary Fig. 3e). Consistent with the results, mitochondrial Complex I and II activities were significantly reduced in Adipo-Bola3 KO relative to controls, whereas Complex III activity was unchanged (Supplementary Fig. 3f). Hence, Adipo-Bola3 KO mouse is a unique animal model for understanding the metabolic consequence of reduced mitochondrial lipoylation and 4Fe-4S targeted proteins that are seen in old mice.
Under a basal condition without β3-AR agonist treatment, PDH activity in the iBAT, but not in the WAT, was significantly lower in Adipo-Bola3 KO mice than controls (Figure 3f). When mice were chronically treated with β3-AR agonist to stimulate beige fat biogenesis in the inguinal WAT, PDH activity in the inguinal WAT of Adipo-Bola3 KO mice was significantly lower than that of control mice (Figure 3g), suggesting that Bola3 is required for PDH activity both in brown fat and beige fat. Importantly, the reduced mitochondrial lipoylation and PDH activity in Adipo-Bola3 KO mice was accompanied by reduced glucose oxidation and valine oxidation in the BAT (Figure 3h, i). To determine the extent to which reduced mitochondrial lipoylation alters BAT thermogenesis, we next measured oxygen consumption rate (OCR) in the iBAT of Adipo-Bola3 KO mice and littermate controls. Assays using the Seahorse Extracellular Flux Bioanalyzer found that OCR in the iBAT of Adipo-Bola3 KO mice was lower than control mice following β3-AR activation (Figure 3j). Importantly, tissue temperature recording showed that NE-induced iBAT thermogenesis was significantly impaired in Adipo-Bola3 KO mice relative to control mice (Figure 3k). These data suggest that mitochondrial lipoylation via the Bola3 pathway is required for thermogenesis and fuel oxidation in brown fat and beige fat independent of UCP1 expression.
Mitochondrial lipoylation in BAT is required for whole-body energy homeostasis.
The above results motivated us to determine the extent to which impaired mitochondrial lipoylation in brown fat and beige fat, caused by fat-specific Bola3 deletion, impacts whole-body energy expenditure. We found that oxygen consumption rate (VO2) of mice maintained at thermoneutrality (30˚C) was potently increased in response to β3-AR agonist treatment in control mice, whereas such an increase was near completely blunted in Adipo-Bola3 KO mice (Figure 4a). Although we observed no difference in food intake or locomotor activity between the genotypes (Figure 4b, c), Adipo-Bola3 KO mice gained significantly more body-weight than littermate controls at 30˚C (Figure 4d). The increased body-weight of Adipo-Bola3 KO mice was due to increased tissue mass of epididymal WAT and liver (Figure 4e). When mice were kept under the ambient temperature condition at 22˚C, we observed no difference in body-weight and adiposity between the genotypes (Supplementary Fig. 4a, b).
Figure 4. Mitochondrial lipoylation in BAT is required for whole-body energy homeostasis and glucose metabolism.
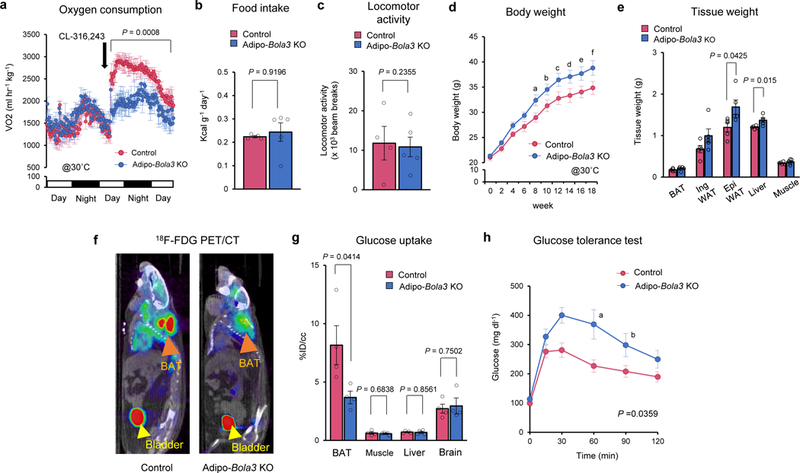
a. VO2 of Adipo-Bola3 KO mice and littermate controls at 30˚C in response to CL316,243 treatment (black arrow). Mice were on a HF/HS diet. Control, n=4: Adipo-Bola3 KO mice, n=5, biologically independent samples. b-c. Food intake (b) and locomotor activity (c) of Adipo-Bola3 KO mice and controls in (a). d. Body weight of Adipo-Bola3 KO mice and littermate controls. 6-week-old mice were on a regular chow diet for 18 weeks at 30 ˚C. n=5, biologically independent samples. P values indicates means that are significantly different from controls; aP = 0.026, bP = 0.033, cP = 0.045, dP = 0.046, eP = 0.043, fP = 0.045. e. Tissue-weight of Adipo-Bola3 KO mice and littermate control mice in (d). f. Representative images of 18F-FDG PET/CT in controls and Adipo-Bola3 KO mice. iBAT and bladder are indicated by orange arrowhead and yellow arrowhead, respectively. g. Quantification of 18F-FDG uptake in indicated organs of mice in (f). n=4, biologically independent samples. h. Glucose tolerance test in controls and Adipo-Bola3 KO mice at 40 weeks old on a regular chow diet. Control, n=4; Adipo-Bola3 KO mice, n=5, biologically independent samples. P values indicates means that are significantly different from controls; aP = 0.0149, bP = 0.0493. Data in (a-e) and (g-h) are expressed as means ± s.e.m. Data were analyzed by two-way repeated measures ANOVA with hoc test by unpaired two-sided t-test (a, d, and h) or unpaired two-sided t-test (b, c, e, and g).
Next, we asked if reduced mitochondrial lipoylation affects the metabolic-sink activity of BAT and systemic glucose homeostasis in vivo. PET/CT scan with 18F-fluorodeoxyglucose (18FDG) found that BAT glucose uptake of Adipo-Bola3 KO mice was significantly lower than that of control mice, while glucose uptake in other metabolic organs, including the skeletal muscle, liver, and brain was not different between the genotypes (Figure 4f, g). Importantly, glucose tolerance test (GTT) showed that Adipo-Bola3 KO mice exhibited glucose intolerance relative to body-weight-matched controls even at ambient temperature (Figure 4h). On the other hand, fat-specific Bola3-deficiency did not alter systemic insulin tolerance and glucose-stimulated insulin secretion (Supplementary Fig. 4c, d). These results suggest that mitochondrial lipoylation through the Bola3 pathway is required for whole-body energy expenditure, BAT glucose uptake, and systemic glucose homeostasis.
Age-dependent effects of α-lipoic acid supplementation in mice and humans.
The above data lead us to the hypothesis that enhanced mitochondrial lipoylation alleviates the age-associated decline in BAT activity. In this regard, α-lipoic acid (also known as 5-(1,2-dithiolane-3-yl)-pentanoic acid) is a promising candidate because it contains two sulfur atoms at C6 and C8 connected by a disulfide bond and serves as a conjugate base for protein lipoylation (Figure 5a). It has been previously shown that acute or chronic treatment with α-lipoic acids in obese Zucker (fa/fa) rat stimulated insulin-dependent glucose uptake in the skeletal muscle 34. Furthermore, α-lipoic acids at high doses (50 mg kg−1 body weight or higher) potently reduced food intake by reducing hypothalamic AMPK activity, leading to reduced body-weight in rats 35. In humans, previous studies reported anti-obesity effects of α-lipoic acid supplementation 36,37, although the efficacy was inconsistent among clinical trials 38. Accordingly, we performed meta-analysis on human clinical trials that reported the effect of α-lipoic acid supplementation on glucose homeostasis (Supplementary Table 4, 5). The meta-analysis found that α-lipoic acid supplementation was modestly but significantly effective in fasting glucose levels (Figure 5b) and HbA1c levels (Figure 5c). Notably, the meta-analysis indicates that the age of the subjects significantly influences the efficacy of α-lipoic acids on reducing fasting blood glucose and HbA1c levels, i.e., higher efficacy in aged subjects than young subjects (Figure 5d).
Figure 5. Age-dependent effects of α-lipoic acid supplementation in mice and humans.

a. Molecular structures of lipoic acid (left) and protein lipoylation (right). b-c. Forest plot of mean difference (MD) with 95% confidence intervals (CI) in fasting blood glucose levels (b) and HbA1c levels (c) between α-lipoic acid supplementation groups (n=470 for b, n=261 for c) and placebo/control groups (n=456 for b, n=240 for c). d. Scatterplot of the relationship between age and mean difference in fasting blood glucose and HbA1c between placebo/control (n=456 for fasting blood glucose, n=240 for HbA1c) and α-lipoic acid-treated groups (n=470 for fasting blood glucose, n=261 for HbA1c). Meta-regression showed statistically significant negative correlation between mean age and fasting blood glucose (slope coefficient (S.E) = −0.0448 (0.0164), P = 0.0062) and HbA1c (slope coefficient (S.E) = −0.0630 (0.0228), P = 0.0058). e. Food intake of young mice and old mice during α-lipoic acid treatment up to 25 days at 30˚C. Young with vehicle, n=8: Young with lipoic acid, n=7; Old with vehicle, n=8: Old with lipoic acid, n=7, biologically independent samples. f-h. Immunoblotting of indicated proteins in iBAT of young mice (f), old mice (g), and aged Adipo-Bola3 KO mice (h). Mice were treated with α-lipoic acid at 30 mg kg−1 or vehicle for 28 days at 30˚C. COX IV as a loading control. Molecular weight (MW) is shown on the right. BAT lysate from wild-type mice as a positive control (p.c). Representative images from two independent experiments in (f-h). Data in (e) are expressed as means ± s.e.m. Data were analyzed by meta regression analysis (d) or unpaired two-sided t-test (e).
Thus, we next examined if α-lipoic acid treatment enhances mitochondrial lipoylation in old mice. Of note, lipoyltransferase 1 (LIPT1) and LIAS, the critical enzymes for protein lipoylation, are expressed at the highest level in BAT among metabolic organs investigated (Supplementary Fig. 5a), suggest that BAT possesses high de novo protein lipoylation activity if the conjugate base (lipoic acids) is provided. Because α-lipoic acids at high doses of 50 mg kg−1 or higher potently repress food intake 35, we used a low dose at 30 mg kg−1 that did not affect food intake in mice even after chronic treatment up to 25 days (Figure 5e). Notably, mitochondrial lipoylation in iBAT was already high in young mice, such that α-lipoic acid supplementation did not increase the lipoylation levels further (Figure 5f). In contrast, α-lipoic acid supplementation potently increased lipoylation, including lipoylated DLAT levels, in the BAT of old mice (Figure 5g). This effect was Bola3-dependent because α-lipoic acids failed to increase lipoylation in the iBAT of age-matched old Adipo-Bola3 KO mice (Figure 5h). This is partly due to reduced LIPT and LIAS expression in Adipo-Bola3 KO mice (Supplementary Fig. 5b), and thus, lipoic acid supplementation cannot restore mitochondrial lipoylation via the de novo pathway in KO mice.
Enhanced mitochondrial lipoylation by α-lipoic acids restores BAT thermogenesis.
Based on the age-associated effect of α-lipoic acids on mitochondrial lipoylation in BAT, we examined the extent to which increased mitochondrial lipoylation impacts BAT activity and glucose metabolism in aged mice. We found that α-lipoic acid supplementation in old mice significantly enhanced PDH activity in aged BAT, whereas it failed to do so in age-matched Adipo-Bola3 KO mice (Figure 6a). In addition, the positive effect of α-lipoic acids on PDH activity in BAT was not seen in young mice (Supplementary Fig. 5c).
Figure 6. Enhanced mitochondrial lipoylation by α-lipoic acid supplementation restores BAT activity in aged mice via the Bola3 pathway.

a. PDH activity in iBAT of Adipo-Bola3 KO mice and age-matched WT mice treated with α−lipoic acid or vehicle. WT, n=5; Adipo-Bola3 KO mice, n=4, biologically independent samples. b. Glucose oxidation in iBAT and skeletal muscle of WT and Adipo-Bola3 KO mice. WT iBAT, n=5; WT skeletal muscle, n=4; Adipo-Bola3 KO iBAT and skeletal muscle, n=4, biologically independent samples. c. OCR in iBAT. WT, n=8; Adipo-Bola3 KO mice, n=5, biologically independent samples. Mice received a single injection of CL-316,243 in (b-c). d. Quantification of NE-induced iBAT temperature of WT and Adipo-Bola3 KO mice treated with α−lipoic acid or vehicle. n=4, biologically independent samples. e. Body weight of WT and Adipo-Bola3 KO mice on a high-fat/high-sucrose diet at 30˚C. WT, n=6.; Adipo-Bola3 KO mice, n=5, biologically independent samples. P values indicates means that are significantly different from vehicle; aP = 0.030, bP = 0.014. f. Tissue-weight of WT and Adipo-Bola3 KO mice in (e). g. Representative images of 18F-FDG PET/CT in WT and Adipo-Bola3 KO mice. h. Quantification of 18F-FDG uptake in indicated organs. WT with vehicle, n=6; WT with lipoic acid, n=5; Adipo-Bola3 KO mice with vehicle or lipoic acid, n=4, biologically independent samples. i. Glucose tolerance test in WT and Adipo-Bola3 KO mice. WT, n=6.; Adipo-Bola3 KO mice, n=5, biologically independent samples. P values indicates means that are significantly different from vehicle; aP = 0.0377, bP = 0.0116, cP = 0.0313, dP = 0.0196, eP = 0.0106. Data in (a-f) and (h-i) are expressed as means ± s.e.m. Data were analyzed by unpaired two-sided t-test (a-d, f, h) or two-way repeated measures ANOVA with hoc test by unpaired two-sided t-test (e, i).
Consistent with these results, enhanced PDH activity by α-lipoic acids lead to a significant increase in glucose oxidation in aged BAT, and this effect was blunted in Adipo-Bola3 KO mice (Figure 6b). The effect of α-lipoic acids on mitochondrial lipoylation appeared selective to BAT at the dose we used in this study (30 mg kg−1) because no change in lipoylation was seen in the skeletal muscle and liver of old mice (Supplementary Fig. 5d). Similarly, α-lipoic acids did not change glucose oxidation in the skeletal muscle (Figure 6b). Although a previous study reported that a high dose of α-lipoic acids increased Ucp1 expression in cultured human adipocytes 39, we observed no change in Ucp1 and other thermogenic gene expression following α-lipoic acid treatment in vivo (Supplementary Fig. 5e). However, α-lipoic acid supplementation in old mice significantly increased OCR in the BAT in a Bola3-dependent fashion (Figure 6c). Importantly, tissue temperature recording found that NE-stimulated BAT thermogenesis was potently restored in old mice following α-lipoic acid supplementation, whereas the effect was diminished in Adipo-Bola3 KO mice (Figure 6d).
Next, we tested if α-lipoic acid supplementation ameliorates age-associated obesity and glucose intolerance. Following the chronic treatment of α-lipoic acid at 30 mg kg−1 that enhanced mitochondrial lipoylation preferentially in the BAT without affecting food intake (Supplementary Fig. 5f), we found that aged mice gained significantly less body-weight and WAT mass (inguinal and epididymal WAT) than vehicle-treated mice, and that this effect required Bola3 (Figure 6e, f). Furthermore, 18FDG-PET/CT scan found that α-lipoic acid supplementation enhanced glucose uptake in the BAT without affecting glucose uptake in the muscle and liver of aged mice. α-lipoic acids failed to increase glucose uptake in the BAT of age-matched Adipo-Bola3 KO mice (Figure 6g, h). Also, α-lipoic acid supplementation was effective to improve systemic glucose tolerance of aged mice, but not in age-matched Adipo-Bola3 KO mice (Figure 6i).
Several groups reported that lipoic acid has anti-oxidation action, such as glutathione synthesis (GSH) in the liver 40,41. Accordingly, we examined the extent to which the anti-oxidant action of lipoic acid was associated with the metabolic improvement by α-lipoic acid supplementation in vivo. Consistent with the previous studies, we found that α-lipoic acids significantly increased GSH in the BAT and liver of control mice; however, α-lipoic acids also increased GSH in the BAT and liver of Adipo-Bola3 KO mice to a similar degree (Supplementary Fig. 5g, h). Hence, α-lipoic acid supplementation effectively restores BAT thermogenesis and alleviate the age-associated body-weight gain, fat-mass gain, and glucose intolerance through the Bola3-mediated pathway, whereas the anti-oxidant action of α-lipoic acids is not directly linked to the beneficial effect of α-lipoic acids, at least, on aged BAT.
Discussion
Here, we report that reduced mitochondrial lipoylation is a previously unappreciated post-transcriptional molecular signature of aged BAT whose dysregulation is tightly coupled with the age-associated decline in BAT’s fuel oxidation and thermogenesis. It has been considered that aging is associated with global mitochondrial dysfunction 42; however, we found in the BAT – one of the most mitochondria-enriched tissues in mammals – that mitochondrial lipoylation was disproportionally reduced with increased age through a post-transcriptional down-regulation of the Fe-S cluster pathway, and that such reduction was independent of UCP1 expression. The age-associated reduction in mitochondrial lipoylation, in conjunction with diminished PDH activity, was observed preferentially in the BAT of mice at the age of 48 weeks old and older, while no significant change in lipoylation was seen in the skeletal muscle or the liver. These results suggest that reduced mitochondrial lipoylation is a unique molecular hallmark of aged BAT. Of note, the age-associated impairment in mitochondrial lipoylation and thermogenesis was evident when BAT activity was stimulated by β3-adrenergic signaling. In addition, Adipo-Bola3 KO mice exhibited lower whole-body energy expenditure than controls following the activation of β-adrenergic receptor signaling. These data suggest that mitochondrial lipoylation plays a role in the regulation of BAT function in response to external stimuli, such as cold exposure.
A well-established regulator of the PDH enzymatic activity is phosphorylation of the E1 subunit of PDH complex 25. Unexpectedly, we found that the regulation of PDH phosphorylation was functional even in aged BAT, whereas mitochondrial lipoylation was dysregulated in aged BAT due to impaired Fe-S cluster formation. Notably, reduced mitochondrial lipoylation in brown and beige fat by Bola3 deletion was sufficient to cause impairment in BAT thermogenesis, fuel utilization, body-weight gain, and glucose intolerance, independent of PDH phosphorylation. These data highlight the importance of mitochondrial lipoylation in the regulation of BAT activity and whole-body energy homeostasis. It is worth mentioning that Sirt4 has been reported to be a mitochondria-localized lipoamidase that removes lipoylation from DLAT and negatively regulates PDH activity 43. As such, it would be interesting to test if fat-specific Sirt4 deletion recapitulates the beneficial effect of α-lipoic acid on BAT activity and whole-body metabolism.
A key observation in this study is that the age-associated reduction in BAT thermogenesis and glucose catabolism can be restored by enhancing mitochondrial lipoylation. While previous studies report that α-lipoic acids at higher doses broadly affect food intake and skeletal muscle function 34,35,44, we found that α-lipoic acid at a lower dosage used in the present study primarily acts on BAT without affecting food intake or muscle function, and that it potently alleviates the age-associated body-weight gain and glucose intolerance. The beneficial effect of α-lipoic acids on BAT activity was not seen in young mice likely due to the high levels of mitochondrial lipoylation. These observations support our meta-analysis of clinical studies suggesting that the age of the subject profoundly influences the efficacy of α-lipoic acids on fasting blood glucose levels and HbA1c levels. Thus, the present study provides new stratifications (i.e., age and mitochondrial lipoylation) and a therapeutic window wherein α-lipoic acid supplementation effectively and safely improve metabolic health in elderly subjects.
Methods
Animals
All animal experiments were performed according to procedures approved by the UCSF Institutional Animal Care and Use Committee. C57Bl6 male mice were obtained from Jackson Laboratory. For the generation of adipocyte-specific Bola3 KO mice, Bola3 floxed mice were obtained from the EuMMCR (European Mouse Mutant cell Repository) (Bola3tm1a(EUCOMM)Wtsi) and crossed to Adiponectin-Cre mice. Bola3flox/flox mice were used as littermate controls. The mice were on the Bl6 background. β-less mouse, a kind gift from Lowell’s lab at Harvard Medical School, is in a mixed background 26. All the mice had free access to food and water, 12 hr light-dark cycles and were caged under ambient temperature at 22°C or thermoneutrality at 30°C. For the β3 adrenergic receptor agonist treatment studies, young C57Bl6 mice (10 weeks old) and old C57Bl6 mice (76 weeks old) or Bola3flox/flox mice and adipocyte-specific Bola3 KO mice (12–16 weeks old) were used. All mice were acclimatized under thermoneutrality for 7 days and treated with β3 adrenergic receptor agonist (CL-316, 243) or saline control at 1 mg kg−1 for 5 days. For the lipoic acid treatment studies, young C57Bl6 mice (10 weeks old), old C57Bl6 mice (76 weeks old), aged adipocyte-specific Bola3 KO mice (60–64 weeks old) and age-matched wild-type control mice were used. For high-fat/high-sucrose feeding experiment, mice at 48–50 weeks old mice were used. All mice were injected intraperitoneally with α-lipoic acid (Sigma) at 30 mg kg−1 or vehicle (10% EtOH in PBS) up to 28 days under the thermoneutral condition.
Mitochondria proteomics
Mitochondria were isolated from BAT using the Mitochondria Isolation Kit for Tissue (Abcam) and applied for the following proteomics analysis. The following biological replicates were used for mitochondrial proteomics: n=3 for both young BAT and old BAT, n=4 for control BAT, and n=3 for Adipo-Bola3 BAT.
Preparation of proteomics samples
Proteins from purified mitochondria were solubilized in 8 M urea / 50 mM ammonium bicarbonate containing phosphatase and protease inhibitor cocktails (Sigma-Aldrich) and sonicated on ice for 10 min. Proteins were reduced with 5 mM tris-2(-carboxyethyl)-phosphine (TCEP, Sigma-Aldrich) / 50 mM ammonium bicarbonate at 37°C for 30 minutes, and alkylated with 40 mM chloroacetamide (CAA, Sigma-Aldrich) / 50 mM ammonium bicarbonate at 25°C in the dark for 30 minutes. Digestion of 50 μg of proteins was carried out with Lys-C (1:50 w/w; Wako) for 3 h, followed by trypsin (1:100 w/w; Promega) overnight at 37°C after 10-fold dilution in 50 mM ammonium bicarbonate. The reaction was terminated by the addition of trifluoroacetic acid (TFA) to a final concentration of 0.5%. The resultant peptides were purified with reversed-phase StageTips 45 prior to LC/MS/MS analysis.
LC/MS/MS analysis
A nanoLC/MS/MS system consisting of an UltiMate™ 3000 RSLCnano liquid chromatograph and an Orbitrap Fusion Lumos Tribrid mass spectrometer (Thermo Fisher Scientific, Bremen, Germany) was employed. The purified peptides (250 ng) were injected onto a self-pulled analytical column (150 mm length × 100 μm i.d.) packed with ReproSil-Pur C18-AQ materials (3 μm, Dr. Maisch GmbH, Ammerbuch-Entringen, Germany). A gradient condition with flow rate of 500 nL/min was employed, that is, 5–10% B in 1 min, 10–40% B in 64 min, 40–100% B in 5 min, 100% B for 10 min, and 5% B for 30 min (Solvent A was 0.5% acetic acid, and solvent B was 0.5% acetic acid in 80% acetonitrile). Peptides were ionized at 2400 V. The MS scan range was m/z 300–1500 at a resolution of 120,000 (at m/z 200) at orbitrap using an automatic gain control (AGC) set to 4 × 10⁵ ions and the maximum injection time (IT) set to 50 ms, followed by product ion scans of the 20 most intense precursors for 3 s with 1.6 m/z isolation at quadrupole, normalized HCD collision energy of 30%, and a resolution of 15,000 (at m/z 200), 5 × 10⁴ AGC and 100 ms maximum IT. Dynamic exclusion was applied for 20 s.
Peptide identification and quantification
MS raw files were processed by MaxQuant 46,47 version 1.6.1.0 with reviewed mouse proteome database downloaded from SwissProt version 2018/03. Default parameters were used unless indicated. Label-free quantification (LFQ) with match between runs was performed after retention time alignment. Identifications were stringently filtered for an FDR < 1% both at peptide and protein group level. Protein groups matched to the reverse database and identified as common contaminants were removed to obtain high-quality dataset for further analysis.
Mitochondrial proteome data analysis
Data analysis was performed in R (version 3.4). For each protein group, variance stabilizing normalization (vsn package) was performed on LFQ intensities across samples 48. Missing values were imputed by MinProb method (MSnbase package) which randomly draws values from a Gaussian distribution centered to a minimum value with a standard deviation as the median estimated from that of valid data 49. Differential expression in protein groups was analyzed by fitting the expression with the proteome-wide linear model combined with empirical Bayes statistics. Biological pathway analysis was performed using Metascape 50. P < 0.05 was considered significant and used as selection criteria for the Supplemental Table 1 and 3.
Immunoprecipitation and Mass Spectrometry
For immunoprecipitation, protein extracts (500 μg) from interscapular BAT depots of WT mice at 10 weeks old were mixed with 500 μl lysis buffer containing 50 mM Tris-HCl, pH 7.4, 150 mM NaCl, 1% NP-40, and 5 mM EDTA, and cOmplete protease inhibitors (Roche) and pre-incubated with Sepharose protein G (GE Healthcare). Anti-lipoic acid antibody was added to the lysate and rotated for 120 minutes at 4° C. Subsequently, protein G beads were added and the rotation was continued for an additional 60 minutes. After washing with lysis buffer, the beads were eluted with pH 2.5 glycine-HCl buffer. The eluted complexes were TCA-precipitated, separated in a 4–20% gradient gel, and subsequently visualized by silver stain or Coomassie blue dye. In-gel trypsin digestion was performed according to the standard protocol 51. Briefly, gel pieces were dehydrated with acetonitrile for 10 min, followed by removal of acetonitrile. Then, the gel pieces were with 50 mM ammonium bicarbonate solution containing 12.5 ng/μl trypsin (Promega) at 37ºC for overnight. A nanoLC/MS/MS system consisting of a Famos autosampler (LC Packings, San Francisco, CA) and an LTQ Orbitrap Velos Pro mass spectrometer (Thermo Fisher Scientific) was used with a capillary tip column (100 μm inner diameter x ~30 cm length) packed with 2.6 μm C18 silica beads 52. Peptides were eluted with increasing concentrations of solvent B (97.5% acetonitrile, 0.1% formic acid). Peptide/protein identification was done by Sequest (Thermo Fisher Scientific) 53. All databases include a reversed version of all the sequences and the data was filtered to between a one and two percent peptide false discovery rate. The mass spectrometry was performed by the Taplin Mass Spectrometry Facility of Harvard Medical School. Proteins were considered significantly identified with at least two unique valid peptides.
RNA sequencing and bioinformatics
RNA Sequencing libraries were constructed from total RNA using Universal Plus mRNA-Seq (NuGEN). High-throughput sequencing was performed using a HiSeq 3000 instrument (Illumina) at Technology Center for Genomics & Bioinformatics in UCLA. Quality of raw FASTQ sequences was assessed using FASTQC (www.bioinformatics.babraham.ac.uk/projects/fastqc/). To process RNA-Seq libraries, adaptor sequences were trimmed using Cutadapt version 1.14 requiring a length greater than 10 nt after trimming and quality-filtered by requiring all bases to have a minimum score of 20 (-m 10 -q 20,20). Only reads that passed the quality or length threshold on both strands were considered for mapping. Reads were aligned to the mouse genome (Grcm38) using STAR v2.5.2b. Ensembl reference annotation version 89 was used to define gene models for mapping quantification. Uniquely mapped reads for each gene model were produced using STAR parameter “--quantMode GeneCounts.” Differential expression analysis was performed in R using DESeq2 (v3.7) with the default parameters, including the Cook’s distance treatment to remove outliers.
Meta-analysis
Clinical studies were identified by searching for publications at PubMed. Additionally, a manual search was used among references cited in related review articles and meta-analyses. Strategy search in PubMed database was as follows: “alpha lipoic acid” OR “alpha lipoic” OR “α-Lipoic” AND “Clinical Trial.” Two researchers independently searched studies and screened possible related studies by title and abstract based on inclusion and exclusion criteria. Each reviewer evaluated the full-text articles of eligible studies independently and reached consensus by discussion. Studies which have an α-lipoic acid treatment group and placebo/control group were included. Primary outcomes were fasting blood glucose and HbA1c. The criteria also include that the studies reported fasting blood glucose and/or HbA1c before and after intervention regardless if the aim was an improvement of glucose tolerance or otherwise. The following background population was included: Non-obese or obese subjects, type 2 diabetes, and metabolic syndrome-related disease. The studies for other diseases were excluded. Studies on the effects of α-lipoic acid in combination with other supplements were also included. Correlation coefficients were used to calculate and impute the missing standard deviation of change from baseline applying the methods described in Cochran Handbook for Systematic reviews of Interventions Version 5.1.0 (Higgins JPT, Green S. Handbook for Systematic Reviews of Interventions Version 5.1.0. http://hanbook.cochrane.org.2011/). The following data were extracted: Study design, name of the first author, publication year, gender, age, sample size, duration of follow up, fasting blood glucose and HbA1c before and after an intervention. Statistical heterogeneity was assessed using the I square (I2) index. I2 ≥ 50% was considered to indicate heterogeneity. We evaluated the difference between α-lipoic acid treatment and placebo/control by calculating the mean difference using Review Manager version 5.3 (Cochrane Community). To examine the effect of age on outcomes, meta-regression was conducted using the Comprehensive Meta-Analysis Version 3.0 (Biostat).
Metabolic Studies
Adipocyte-specific Bola3 KO mice (Adipo-Cre; Bola3flox/flox mice) and littermate control mice (Bola3flox/flox) were fed a regular diet (RD) or a high-fat/high-sucrose diet (HF/HS) (D12451, Research Diet) under an ambient temperature (22°C) for 40 weeks. No difference in body weight was seen between control and Adipo-Bola3 KO mice at 22˚C. Whole-body energy expenditure, food intake and locomotor activity (beam break counts) were monitored by a comprehensive lab animal monitoring system (CLAMS) (Columbus Instruments). Metabolic data were collected at thermoneutrality (30° C). During the study, oxygen consumption was evaluated after administration with β3 adrenergic receptor agonist at 1 mg kg−1 (CL-316, 243 (Sigma)). Body-weight was monitored once a week. Fat mass and lean mass were measured by Body Composition Analyzer EchoMRI (Echo Medical Systems). For glucose tolerance test experiments, after more than 6 hours of fasting, the mice were injected intraperitoneally with glucose (1.5g kg−1). For insulin tolerance test experiments, after 3 hours of fasting, the mice were injected intraperitoneally with insulin (0.75U kg−1). Serum level of insulin (Millipore) was measured using commercially available kits. Blood samples were collected at the indicated time points, and glucose levels were measured using blood glucose test strips (Abbott).
18F-FDG-PET/CT scan
The micro-PET/CT imaging system was applied to scan the whole mouse at the UCSF PET/CT Imaging Core Facility. Mice were administered 100 μCi of 18F-FDG through the tail vein under 2% isoflurane anesthesia. 30 minutes after injection of 18F-FDG, mice were injected intraperitoneally with CL-316, 243 at 0.25 or 1 mg kg-1. PET scanning was started exactly at 55 minutes after FDG administration for 10 minutes, immediately followed by CT scanning. PET data were reconstructed and co-registered with CT images. FDG uptake in tissues was expressed as percentage injected dose per cubic centimeter (%ID/cc) using AMIDE software version 1.0.4. (http://www.amide.sourceforge.net). Fixed size ellipsoidal shaped region of interest (ROI) were manually drawn over the area of the tissues (BAT and muscle: 2×2×2 mm3, Liver:6×6×6 mm3, Brain: 4×4×4 mm3).
Oxygen consumption assays
Oxygen consumption rate (OCR) in iBAT was measured using the Seahorse XFe Extracellular Flux Analyzer (Agilent) in a 24-well plate. One mg for BAT was placed into XFe24 Islet Capture Microplates. OCR and Extra-Cellular Acidification Rate (ECAR) were measured 1 hour after incubation with assay medium supplemented with 1 mM sodium pyruvate, 2 mM GlutaMAX-I and 25 mM glucose.
Temperature recording
The rectal temperature of mice was monitored by a TH-5 thermometer (Physitemp). For the recording of the tissue, mice under anesthesia were implanted with type T thermocouple probes in the interscapular BAT, inguinal WAT, and skeletal muscle, according to the previous study 12. The temperature of each tissue was recorded by TC-2000 Meter (Sable Systems International). When the tissue temperature keeps stable, mice were treated with norepinephrine at a dose of 3 mg per kg body weight to induce non-shivering thermogenesis.
BCAA oxidation assay
Isolated tissues were placed in a polypropylene round-bottom tube and incubated in the 1.5 mL of Krebs-Ringer Modified Buffer (KRB)/HEPES buffer containing 5 mM glucose and 0.16 μCi/ml [1-14C] Val bound to 2% BSA at 37° C for 1 hour. After adding 350 μl 30% hydrogen peroxide in the tube, [14C] was trapped in the center well supplemented with 300 μl 1M benzethonium hydroxide solution. BCAA oxidation was quantified by counting radioactivity of trapped [14C] CO2 using scintillation counter.
Fatty acid and glucose oxidation assays
Mice were fasted for either 4 hours or 6 hours for fatty acid or glucose oxidation assays, respectively. Isolated tissues were incubated in the 1.5 mL of KRB/HEPES buffer. Fatty acid oxidation assays were performed in the buffer containing 5 mM glucose, 1 mM carnitine, and 0.5 μCi/ml [1-14C] palmitic acid bound to 2% BSA at 37° C for 1 hour. Glucose oxidation assay was performed in the buffer containing 5mM glucose and 1.0 μCi/ml [1-14C] glucose bound to 2% BSA at 37° C for 1 hour. [14C] CO2 trapped in the center well supplemented with 300 μl 1M benzethonium hydroxide solution was measured by scintillation counter.
Pyruvate dehydrogenase activity assay
Adipose tissue lysates were prepared by homogenizing tissues in ice-cold PBS buffer containing cOmplete Protease Inhibitor Cocktail (Roche) and 5 mM NaF. Two hundred micrograms of BAT lysate and four hundred microgram of inguinal WAT lysate were applied to measure PDH enzymatic activities using a commercially available (Abcam, ab109902). PDH enzymatic activity was measured at 450 nm.
Glutathione assay
GSH and GSSG levels in liver and brown adipose tissue were determined using a GSH/GSSG ratio detection assay kit (ab138881, Abcam) following the manufacturer’s protocol. The assay was performed using standards for reduced (GSH) and oxidized (GSSG) glutathione. Fluorescence intensity was measured at an excitation/emission wavelength of 490/520 nm and normalized per gram of tissue.
Mitochondrial electron transport (ETC) activity
ETC activity was measured by using the protocol published previously 54. In brief, mitochondria were isolated from the BAT of mice using the Mitochondria Isolation Kit for Tissue (Abcam) and were resuspended in 200 μl of isolation buffer provided by the kit. After protein quantification by the BCA method, the mitochondrial suspension was diluted with the isolation buffer at concentration 0.2 mg/ml, seeded into a 24-well plate (10 μg/50 μl/well), and adhered to the bottom of the plate by centrifugation 2,000 x g at 4°C for 20 min. Immediately prior to the measurement, hypotonic mitochondrial assay buffer supplemented with 50 mM KCl, 4 mM KH2PO4, 5 mM MgCl2, 5 mM HEPES, 1 mM EGTA, 10 mM Pyruvate, 5 mM Malate and 4% fatty-acid-free BSA was added to each well. For the measurement of complex activities of I and II, mitochondria were sequentially injected with 2 μM rotenone (complex I inhibitor) and 10 mM succinate (complex II substrate). For the measurement of complex III activity, hypotonic mitochondrial assay buffer with 10 mM Malonate (complex II inhibitor) was added to each well and mitochondria were sequentially treated with 2 μM rotenone, 10 mM succinate and 5 μM antimycin A.
Immunoblotting
Adipose tissues, liver, and gastrocnemius were lysed in RIPA buffer (Thermo Scientific) containing 25 mM Tris/HCl, pH 7.6, 150 mM NaCl, 1% NP-40, 1% sodium deoxycholate, 0.1% SDS, and cOmplete protease inhibitors (Roche). Total protein lysates were boiled with Laemmli sample buffer (Bio-rad) contains 355 mM 2-mercaptoethanol (Sigma), loaded on either a 4–15%, 4–20%, or 10% SDS-PAGE, and subsequently transferred onto PVDF membranes. The PVDF membranes were blocked in either 3% BSA or 5 % Skim milk in Tris-buffered saline with Tween 20 (TBS-T) for 1 hour at room temperature. They were incubated overnight with Lipoic acid antibody (437695, Millipore), DLAT antibody (sc-32925, Santa Cruz), PDH-E1α antibody (sc-377092, Santa Cruz), PDH-E1α (pSer232) antibody (AP1063, Millipore), PDH-E1α (pSer293) antibody (ab177461, Abcam), PDH-E1α (pSer300) antibody (AP1064, Millipore), DBT antibody (PA529727, Fisher scientific), DLST antibody (#12618, Cell Signaling), PDH-E3BP antibody (sc-393644, Santa Cruz), GAPDH antibody (sc-32233, Santa Cruz), Cox IV antibody (#4850, Cell Signaling), β-actin antibody (#A3854, Sigma) and UCP1 antibody (ab23841, Abcam). BOLA3 antibody was custom produced by GenScript. Anti-mouse IgG (715–035-150, Jackson ImmunoResearch) was used as a secondary antibody for PDH-E1α, PDH-E3BP, and GAPDH. Anti-rabbit IgG (711–035-152, Jackson ImmunoResearch) was applied to a second antibody for the other proteins. VeriBlot secondary HRP-labelled antibody was used for IP experiments (ab131366, Abcam).
RNA preparation and quantitative RT-PCR
Total RNA was extracted from adipose tissues using RiboZol reagents (AMRESCO) followed by the RNeasy mini-kit (Qiagen Inc., Valencia, CA) protocol. cDNA was synthesized by iScript cDNA Synthesis kit (BioRad) according to the provided protocol. Quantitative real-time PCR (qRT-PCR) was performed using an ABI ViiA™7 PCR cycler (Applied Biosystems). Each sample was run in duplicate, and the quantity of a particular gene in each sample was normalized to TATA-binding protein, 36B4 or 18srRNA. Relative mRNA levels were determined by the ΔΔ Ct method and expression normalized to an internal calibrator specific to each gene using the formula 2-ΔΔ CT. Primer sequences are provided in Supplementary Table 6.
Statistics
Statistical analyses were performed using GraphPad Prism 7.0 (GraphPad Software, Inc., La Jolla, CA). All data are expressed as the means with SEMs. Unpaired Student two-sided t-test was used for two-group comparisons. One-way ANOVA followed by Tukey’s test was used for multiple group comparisons. Two-way repeated measures ANOVA was used for the comparisons of repeated measurements. P values below 0.05 were considered significant throughout the study.
Supplementary Material
Acknowledgments.
We are grateful to T. Huynh and Dr. Y. Seo at UCSF Imaging Center for their support in 18F-FDG-PET/CT imaging, C. Paillart for his support in the CLAMS study, Zachary Brown for his editorial help, and R. Panda and Giacometti. S for their support in the analysis for RNA-sequencing. We also thank Dr. Tory Hagen at Linus Pauling Institute for his suggestions. This work was supported by NIH (DK97441 and DK108822), NIH Office of Dietary Supplements, and the Edward Mallinckrodt, Jr. Foundation to S.K., NIH (DK107583) to J.W., and JSPS Grants-in-Aid for Scientific Research (17H03605) to H-Y.C and Y.I. K.T., K.I. and Y.O are supported by the Manpei Suzuki Diabetes Foundation, and T.Y. is supported by the JSPS Overseas Research Fellowships.
Footnotes
Data availability. The proteomics data used in this study have been deposited into the ProteomeXchange Consortium with the accession number PXD013410 (Isolated BAT mitochondria in old mice), PXD014143 (Isolated BAT mitochondria in Adipo-Bola3 KO mice), and PXD014080 (Lipoylated protein complex). RNA-seq data has been deposited at ArrayExpress with the accession number E-MTAB-7445 (BAT in old mice). The data that support the findings of this study are available from the corresponding author upon request.
Competing interests. The authors declare no competing interests.
References
- 1.Sidossis L & Kajimura S Brown and beige fat in humans: thermogenic adipocytes that control energy and glucose homeostasis. The Journal of clinical investigation 125, 478–486 (2015). [DOI] [PMC free article] [PubMed] [Google Scholar]
- 2.Kajimura S, Spiegelman BM & Seale P Brown and Beige Fat: Physiological Roles beyond Heat Generation. Cell metabolism 22, 546–559 (2015). [DOI] [PMC free article] [PubMed] [Google Scholar]
- 3.Cypess AM, et al. Identification and importance of brown adipose tissue in adult humans. The New England journal of medicine 360, 1509–1517 (2009). [DOI] [PMC free article] [PubMed] [Google Scholar]
- 4.Ouellet V, et al. Brown adipose tissue oxidative metabolism contributes to energy expenditure during acute cold exposure in humans. The Journal of clinical investigation 122, 545–552 (2012). [DOI] [PMC free article] [PubMed] [Google Scholar]
- 5.Virtanen KA, et al. Functional brown adipose tissue in healthy adults. The New England journal of medicine 360, 1518–1525 (2009). [DOI] [PubMed] [Google Scholar]
- 6.Saito M, et al. High incidence of metabolically active brown adipose tissue in healthy adult humans: effects of cold exposure and adiposity. Diabetes 58, 1526–1531 (2009). [DOI] [PMC free article] [PubMed] [Google Scholar]
- 7.Chouchani ET & Kajimura S Metabolic adaptation and maladaptation in adipose tissue. Nat Metabolism 1, 189–200 (2019). [DOI] [PMC free article] [PubMed] [Google Scholar]
- 8.Lee P, et al. Temperature-acclimated brown adipose tissue modulates insulin sensitivity in humans. Diabetes 63, 3686–3698 (2014). [DOI] [PMC free article] [PubMed] [Google Scholar]
- 9.Hanssen MJ, et al. Short-term cold acclimation improves insulin sensitivity in patients with type 2 diabetes mellitus. Nature medicine 21, 863–865 (2015). [DOI] [PubMed] [Google Scholar]
- 10.Chondronikola M, et al. Brown adipose tissue improves whole-body glucose homeostasis and insulin sensitivity in humans. Diabetes 63, 4089–4099 (2014). [DOI] [PMC free article] [PubMed] [Google Scholar]
- 11.Bartelt A, et al. Brown adipose tissue activity controls triglyceride clearance. Nature medicine 17, 200–205 (2011). [DOI] [PubMed] [Google Scholar]
- 12.Ikeda K, et al. UCP1-independent signaling involving SERCA2b-mediated calcium cycling regulates beige fat thermogenesis and systemic glucose homeostasis. Nature medicine 23, 1454–1465 (2017). [DOI] [PMC free article] [PubMed] [Google Scholar]
- 13.Yoneshiro T, et al. Age-related decrease in cold-activated brown adipose tissue and accumulation of body fat in healthy humans. Obesity (Silver Spring, Md 19, 1755–1760 (2011). [DOI] [PubMed] [Google Scholar]
- 14.Pfannenberg C, et al. Impact of age on the relationships of brown adipose tissue with sex and adiposity in humans. Diabetes 59, 1789–1793 (2010). [DOI] [PMC free article] [PubMed] [Google Scholar]
- 15.Matsushita M, et al. Impact of brown adipose tissue on body fatness and glucose metabolism in healthy humans. International journal of obesity (2005) 38, 812–817 (2014). [DOI] [PubMed] [Google Scholar]
- 16.Horan MA, Little RA, Rothwell NJ & Stock MJ Changes in body composition, brown adipose tissue activity and thermogenic capacity in BN/BiRij rats undergoing senescence. Experimental gerontology 23, 455–461 (1988). [DOI] [PubMed] [Google Scholar]
- 17.McDonald RB, Horwitz BA, Hamilton JS & Stern JS Cold- and norepinephrine-induced thermogenesis in younger and older Fischer 344 rats. The American journal of physiology 254, R457–462 (1988). [DOI] [PubMed] [Google Scholar]
- 18.Scarpace PJ, Matheny M & Borst SE Thermogenesis and mitochondrial GDP binding with age in response to the novel agonist CGP-12177A. The American journal of physiology 262, E185–190 (1992). [DOI] [PubMed] [Google Scholar]
- 19.Florez-Duquet M, Horwitz BA & McDonald RB Cellular proliferation and UCP content in brown adipose tissue of cold-exposed aging Fischer 344 rats. The American journal of physiology 274, R196–203 (1998). [DOI] [PubMed] [Google Scholar]
- 20.Olsen JM, et al. beta3-Adrenergically induced glucose uptake in brown adipose tissue is independent of UCP1 presence or activity: Mediation through the mTOR pathway. Molecular metabolism 6, 611–619 (2017). [DOI] [PMC free article] [PubMed] [Google Scholar]
- 21.Berry DC, et al. Cellular Aging Contributes to Failure of Cold-Induced Beige Adipocyte Formation in Old Mice and Humans. Cell metabolism 25, 481 (2017). [DOI] [PubMed] [Google Scholar]
- 22.Florez-Duquet M & McDonald RB Cold-induced thermoregulation and biological aging. Physiological reviews 78, 339–358 (1998). [DOI] [PubMed] [Google Scholar]
- 23.Collins S beta-Adrenoceptor Signaling Networks in Adipocytes for Recruiting Stored Fat and Energy Expenditure. Frontiers in endocrinology 2, 102 (2011). [DOI] [PMC free article] [PubMed] [Google Scholar]
- 24.Rogers NH, Landa A, Park S & Smith RG Aging leads to a programmed loss of brown adipocytes in murine subcutaneous white adipose tissue. Aging cell 11, 1074–1083 (2012). [DOI] [PMC free article] [PubMed] [Google Scholar]
- 25.Patel MS, Nemeria NS, Furey W & Jordan F The pyruvate dehydrogenase complexes: structure-based function and regulation. The Journal of biological chemistry 289, 16615–16623 (2014). [DOI] [PMC free article] [PubMed] [Google Scholar]
- 26.Bachman ES, et al. betaAR signaling required for diet-induced thermogenesis and obesity resistance. Science (New York, N.Y 297, 843–845 (2002). [DOI] [PubMed] [Google Scholar]
- 27.Rowland EA, Snowden CK & Cristea IM Protein lipoylation: an evolutionarily conserved metabolic regulator of health and disease. Curr Opin Chem Biol 42, 76–85 (2018). [DOI] [PMC free article] [PubMed] [Google Scholar]
- 28.Schonauer MS, Kastaniotis AJ, Kursu VA, Hiltunen JK & Dieckmann CL Lipoic acid synthesis and attachment in yeast mitochondria. The Journal of biological chemistry 284, 23234–23242 (2009). [DOI] [PMC free article] [PubMed] [Google Scholar]
- 29.Cicchillo RM, et al. Lipoyl synthase requires two equivalents of S-adenosyl-L-methionine to synthesize one equivalent of lipoic acid. Biochemistry 43, 6378–6386 (2004). [DOI] [PubMed] [Google Scholar]
- 30.Cameron JM, et al. Mutations in iron-sulfur cluster scaffold genes NFU1 and BOLA3 cause a fatal deficiency of multiple respiratory chain and 2-oxoacid dehydrogenase enzymes. American journal of human genetics 89, 486–495 (2011). [DOI] [PMC free article] [PubMed] [Google Scholar]
- 31.Lebigot E, et al. Impact of mutations within the [Fe-S] cluster or the lipoic acid biosynthesis pathways on mitochondrial protein expression profiles in fibroblasts from patients. Mol Genet Metab 122, 85–94 (2017). [DOI] [PubMed] [Google Scholar]
- 32.Baker PR 2nd, , et al. Variant non ketotic hyperglycinemia is caused by mutations in LIAS, BOLA3 and the novel gene GLRX5. Brain : a journal of neurology 137, 366–379 (2014). [DOI] [PMC free article] [PubMed] [Google Scholar]
- 33.Haack TB, et al. Homozygous missense mutation in BOLA3 causes multiple mitochondrial dysfunctions syndrome in two siblings. Journal of inherited metabolic disease 36, 55–62 (2013). [DOI] [PubMed] [Google Scholar]
- 34.Jacob S, et al. The antioxidant alpha-lipoic acid enhances insulin-stimulated glucose metabolism in insulin-resistant rat skeletal muscle. Diabetes 45, 1024–1029 (1996). [DOI] [PubMed] [Google Scholar]
- 35.Kim MS, et al. Anti-obesity effects of alpha-lipoic acid mediated by suppression of hypothalamic AMP-activated protein kinase. Nature medicine 10, 727–733 (2004). [DOI] [PubMed] [Google Scholar]
- 36.Koh EH, et al. Effects of alpha-lipoic Acid on body weight in obese subjects. Am J Med 124, 85 e81–88 (2011). [DOI] [PubMed] [Google Scholar]
- 37.Huerta AE, Navas-Carretero S, Prieto-Hontoria PL, Martinez JA & Moreno-Aliaga MJ Effects of alpha-lipoic acid and eicosapentaenoic acid in overweight and obese women during weight loss. Obesity (Silver Spring, Md 23, 313–321 (2015). [DOI] [PubMed] [Google Scholar]
- 38.Namazi N, Larijani B & Azadbakht L Alpha-lipoic acid supplement in obesity treatment: A systematic review and meta-analysis of clinical trials. Clin Nutr 37, 419–428 (2018). [DOI] [PubMed] [Google Scholar]
- 39.Fernandez-Galilea M, et al. alpha-Lipoic acid treatment increases mitochondrial biogenesis and promotes beige adipose features in subcutaneous adipocytes from overweight/obese subjects. Biochimica et biophysica acta 1851, 273–281 (2015). [DOI] [PubMed] [Google Scholar]
- 40.Suh JH, et al. Decline in transcriptional activity of Nrf2 causes age-related loss of glutathione synthesis, which is reversible with lipoic acid. Proceedings of the National Academy of Sciences of the United States of America 101, 3381–3386 (2004). [DOI] [PMC free article] [PubMed] [Google Scholar]
- 41.Packer L, Witt EH & Tritschler HJ alpha-Lipoic acid as a biological antioxidant. Free Radic Biol Med 19, 227–250 (1995). [DOI] [PubMed] [Google Scholar]
- 42.Lopez-Otin C, Blasco MA, Partridge L, Serrano M & Kroemer G The hallmarks of aging. Cell 153, 1194–1217 (2013). [DOI] [PMC free article] [PubMed] [Google Scholar]
- 43.Mathias RA, et al. Sirtuin 4 is a lipoamidase regulating pyruvate dehydrogenase complex activity. Cell 159, 1615–1625 (2014). [DOI] [PMC free article] [PubMed] [Google Scholar]
- 44.Wang Y, Li X, Guo Y, Chan L & Guan X alpha-Lipoic acid increases energy expenditure by enhancing adenosine monophosphate-activated protein kinase-peroxisome proliferator-activated receptor-gamma coactivator-1alpha signaling in the skeletal muscle of aged mice. Metabolism: clinical and experimental 59, 967–976 (2010). [DOI] [PMC free article] [PubMed] [Google Scholar]
- 45.Rappsilber J, Mann M & Ishihama Y Protocol for micro-purification, enrichment, pre-fractionation and storage of peptides for proteomics using StageTips. Nature protocols 2, 1896–1906 (2007). [DOI] [PubMed] [Google Scholar]
- 46.Cox J & Mann M MaxQuant enables high peptide identification rates, individualized p.p.b.-range mass accuracies and proteome-wide protein quantification. Nature biotechnology 26, 1367–1372 (2008). [DOI] [PubMed] [Google Scholar]
- 47.Tyanova S, Temu T & Cox J The MaxQuant computational platform for mass spectrometry-based shotgun proteomics. Nature protocols 11, 2301–2319 (2016). [DOI] [PubMed] [Google Scholar]
- 48.Huber W, von Heydebreck A, Sultmann H, Poustka A & Vingron M Variance stabilization applied to microarray data calibration and to the quantification of differential expression. Bioinformatics (Oxford, England) 18 Suppl 1, S96–104 (2002). [DOI] [PubMed] [Google Scholar]
- 49.Gatto L & Lilley KS MSnbase-an R/Bioconductor package for isobaric tagged mass spectrometry data visualization, processing and quantitation. Bioinformatics (Oxford, England) 28, 288–289 (2012). [DOI] [PubMed] [Google Scholar]
- 50.Tripathi S, et al. Meta- and Orthogonal Integration of Influenza “OMICs” Data Defines a Role for UBR4 in Virus Budding. Cell host & microbe 18, 723–735 (2015). [DOI] [PMC free article] [PubMed] [Google Scholar]
- 51.Shevchenko A, Wilm M, Vorm O & Mann M Mass spectrometric sequencing of proteins silver-stained polyacrylamide gels. Analytical chemistry 68, 850–858 (1996). [DOI] [PubMed] [Google Scholar]
- 52.Peng J & Gygi SP Proteomics: the move to mixtures. J Mass Spectrom 36, 1083–1091 (2001). [DOI] [PubMed] [Google Scholar]
- 53.Eng JK, McCormack AL & Yates JR An approach to correlate tandem mass spectral data of peptides with amino acid sequences in a protein database. J Am Soc Mass Spectrom 5, 976–989 (1994). [DOI] [PubMed] [Google Scholar]
- 54.Rogers GW, et al. High throughput microplate respiratory measurements using minimal quantities of isolated mitochondria. PloS one 6, e21746 (2011). [DOI] [PMC free article] [PubMed] [Google Scholar]
Associated Data
This section collects any data citations, data availability statements, or supplementary materials included in this article.