Abstract
Currently FDG PET/CT is used as a tool for detection of active sites of sarcoidosis. Routine clinical practice relies on qualitative assessment with visual interpretation. When semi quantitatively expressed, e.g. for scientific purposes, this often leads to dichotomous “positive” or “negative” results. Metabolic activity in the lungs or mediastinum can also be expressed by SUVmax, but this measure is based only on the intensity of a single voxel. Likely for this reason these parameters show poor correlation with variables such as serum biomarkers and suboptimally predict clinical response to treatment. The current study focusses on new volumetric quantification methods for FDG PET/CT. Specifically the percentage of lung volume with increased metabolic activity, “%SUV-high”, and the average metabolic activity in the lung “SUVmean”, shows significantly better correlation with conventional biomarkers for disease activity than PET dichotomous and SUVmax. Our proposed quantification method needs subsequent and larger studies, however it may open new possibilities for future quantitative research in lung inflammation, and improve precision medicine in sarcoidosis. (Sarcoidosis Vasc Diffuse Lung Dis 2018; 35: 44-54)
Keywords: volumetric, quantitative, SUVmax, FDG PET, inflammation, sarcoidosis
Introduction
Fluorodeoxyglucose (FDG) PET is performed for detection of active lung inflammation in conditions such as sarcoidosis. It has been suggested that metabolic activity on FDG PET may hold prognostic information on development of pulmonary function (PF) and thus holds the potential as a biomarker of sarcoid disease activity and predictor for treatment response (1). Currently, clinical observations on FDG PET are visually classified as either “positive” or “negative”. However, areas of low FDG activity tend to be classified as “negative” even though uptake may be higher than normal. On the other hand, “positive” findings on FDG PET represent a heterogeneous group of inflammatory phenotypes in sarcoidosis. Therefore, it is important to quantify FDG PET findings. Quantification using SUVmax is insufficient to objectify global inflammation in the lungs, because it only represents the maximum uptake within one voxel. SUVpeak, another pixel averaging method, used for oncologic studies, does not substantially change the outcome in sarcoidosis because it uses only a small part of the lungs. Therefore, SUVpeak does not reflect total disease burden in the lungs. So far there has been no study using total lung quantification in sarcoidosis, which might overcome these limitations.
In this study new quantitative methods based on FDG PET imaging in sarcoidosis are explored. Sarcoidosis, a parenchymal lung disease, usually presents on CT as reticulonodular opacities, symmetrical mediastinal lymphadenopathy, traction bronchiectasis but also end-stage fibrosis. Typical measurement techniques which are currently utilized in quantitative FDG PET include SUVmax and total lesion glycolysis. These measures typically apply to localized lesions such as tumours, rather than large anatomical regions as the lungs, and are therefore insufficient for describing total lung inflammatory activity. Here, we introduce a method of volumetric quantitative analysis of the lungs on FDG PET/CT and assess the potential application of this method by testing for reproducibility and correlation with clinical variables. Our hypothesis is that the new method of global lung region analysis is more robust and show better correlation with conventional biomarkers for disease activity and other clinical variables than dichotomous PET/CT reports and SUVmax.
Materials and methods
Patient selection
All sarcoidosis patients visiting St. Antonius Interstitial Lung Diseases (ILD) Center of Excellence between 2010 and 2013 who underwent pulmonary function tests (PFT) and FDG PET/CT as part of their clinical evaluation were eligible for the study. A set of 53 subjects with suspicion of pulmonary sarcoidosis, were selected from our PET/CT database based on first visit at the Nuclear Medicine department. The diagnosis of sarcoidosis was based on clinical findings, supported by histological evidence and after the exclusion of other known causes of granulomatous disease in accordance with the joint statement on sarcoidosis of the ATS, ERS and WASOG (2). A second, non-pulmonary disease, control group was selected to analyze the variation of metabolic activity in normal lung parenchyma. The control group consisted of patients who underwent FDG PET/CT in 2010, with no history of lung disease or smoking and no evidence of disease other than an unexplained increased erythrocyte sedimentation rate (ESR). These patients did not have any history of malignancy or any other known condition, only unexplained ESR elevation, which was the indication of FDG PET/CT. In these patients the FDG PET/CT was concluded to be normal by two nuclear medicine physicians. During 5 years of follow up no lung condition did develop in these control subjects.
Pulmonary function tests and biomarkers
Pulmonary function tests (PFTs) were performed within 2 weeks of FDG PET/CT. Vital capacity (VC), DLCO and FEV1 was measured using a MS-PFT analyzer unit (Jaeger, Wurzburg, Germany) in accordance with the guidelines provided by the ERS (3). The percentage of predicted VC, FEV1 and DLCO were used for analysis. Biomarkers such as serum ACE and sIL-2R within 1 week of performing a FDG PET scan were analyzed and compared between the groups. ACE level was considered positive or negative in accordance with genotype corrected reference values. Genotype corrected ACE were expressed as Z-score continuous variables.
FDG PET/CT
Prior to the scan, patients used a low carbohydrates diet for 24 hours and fasted at least six hours. Scans were performed 60 minutes after injection of FDG (dose: 120-400 MBq FDG; Covidien, Petten, the Netherlands) on the Philips Gemini TF PET/CT (Philips Medical Systems, Best, the Netherlands). The department of Nuclear Medicine of the St Antonius Hospital is an EARL accredited PET/CT center. Blinded reporting of scans was performed by nuclear medicine physicians experienced in sarcoidosis. A positive PET scan is reported on basis of visual lung parenchyma activity above the background level (respectively blood pool and surrounding normal lung parenchyma) and/or lymph node activity above the blood pool activity. Minimal diffuse activity in the lungs, usually lower than the blood pool activity, was not classified as active sarcoidosis and reported as negative. The volume of the lungs was measured in resting state because of the longer duration of PET image acquisition.
Radiographic staging
All scans were blinded and independently scored by an experienced chest radiologist using Scadding stage on chest X-rays (CXR) (4). Since it has been described previously that high-resolution CT (HRCT) is much more sensitive than CXR for staging (5), we have also used a modified Scadding staging to score HRCT (6).
Workflow of image segmentation analysis
Image analysis was performed by an experienced nuclear medicine physician (reader A) and nuclear medicine technologist (reader B). For each included PET/CT study, the total lung volume (TLV) was semi-automatically segmented in the CT image using ITK-SNAP (7) and manually adjusted when required; this software is freely available. Subsequently, both the CT scan and the segmented volume were interpolated to fit the PET image matrix. Several regions, as subsets of the total lung segmentation, were defined by comparing SUV to predefined threshold values. This method divides the total lung volume into regions of high SUV and low SUV (i.e. above and below a chosen threshold SUV 1.0). The relative volumes, as compared to the total lung volume, of the individual regions were analyzed for each scan. The image scaling, thresholding and analysis was performed in a software tool supplied by the medical physics department of the St. Antonius Hospital, Nieuwegein and University Medical Center Utrecht. The workflow of segmenting and analyzing one patient took on average 6.5 minutes.
Definition of threshold values
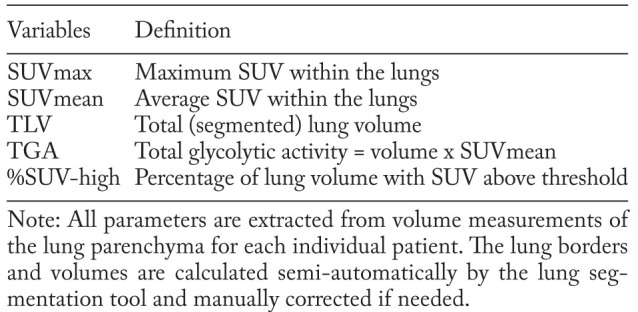
We defined 5 measurable volumetric PET parameters as shown in table 1, including SUVmax, SUVmean, total lung volume (TLV), percentage of lung volume with increased SUV (%SUV-high) and total glycolytic activity (TGA). SUVmax and SUVmean are, respectively, the maximum and average standardized uptake values within the segmented lung volume. Regardless of the amount of injected FDG or patient size, if all the injected FDG is distributed uniformly, the SUV will be 1 g/ml (8); this is also confirmed this in our control group (the mean lung SUV of 0.72 plus two times the standard deviation of 0.14 is 1.0 as shown in table 3). Above this absolute threshold, the SUV in the lungs is denoted as “increased” (see example figure 1). The parameter %SUV-high denotes the percentage of the segmented lung volume within the SUV is above 1. The TGA is defined as TLV x SUVmean and might provide additional information regarding the accumulative total lung activity in the total resting state lung volume. Parameters that differ significantly between FDG PET/CT positive patients and controls were analyzed for correlation with clinical parameters.
Fig. 1.
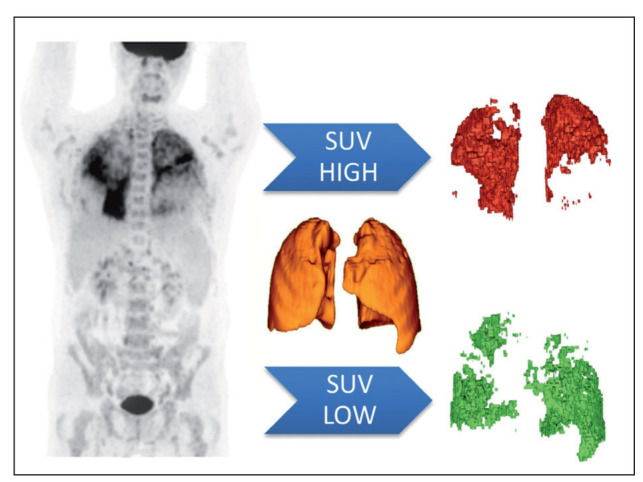
Image analysis using total lung volumes from combined PET and CT data. The lungs are segmented on low dose (LD) CT data, used for PET attenuation correction. PET volumes of SUV high and low are be based upon a specific SUV threshold (set to 1.0), so there are no overlapping areas. In this case, the patient demonstrates a high metabolic activity in the upper lobes, while the lower metabolic activity is seen in the lower areas. [Red: volume of SUV data above threshold; Green: volume of SUV data below threshold]
Table 1.
Definitions of PET/CT parameters from the lung analysis tool
Statistical analysis
Prior to statistical analysis, histograms were made to confirm normal distribution of lung segmentation data between patients and controls. To check for consistency of the semi-automatic segmentation output of TLV, interobserver agreement was established for two different readers (reader A: nuclear medicine physician and reader B: nuclear medicine technologist) using a 50% (n=18) random sample from the sarcoidosis group. Intraclass correlation was calculated using a two way mixed model. Categorical data or dichotomous data were analyzed by chi-square and continuous data by Pearson correlation and ANOVA where appropriate. We have controlled and adjusted for covariates (age and BMI). The statistical evaluation was performed using SPSS version 22 for Windows (IBM, Armonk, New York, USA).
Results
Clinical characteristics
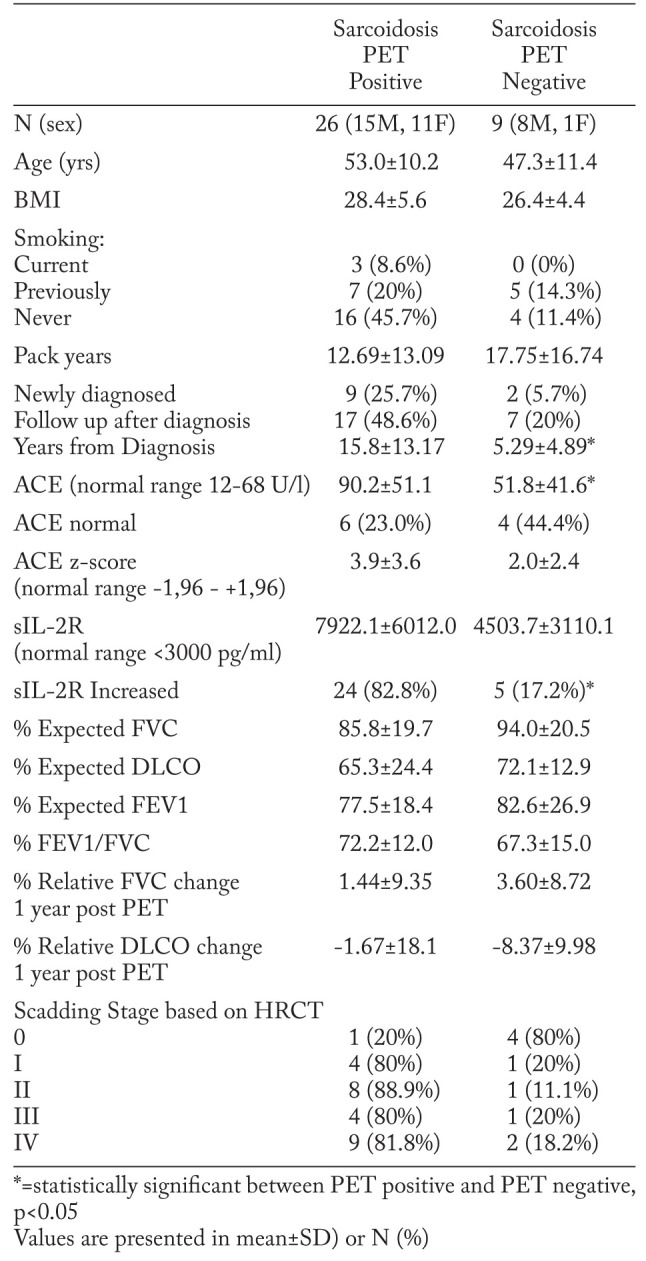
Of 53 patients that were selected from the database, 35 patients had a histopathologically confirmed diagnosis of sarcoidosis and baseline PFT within 2 weeks of FDG PET/CT scan. Eight patients had other interstitial lung diseases (ILDs) and the remaining ten patients were not included because PFTs were not available within the timeframe. Relevant patient clinical demographics and findings can be found in Table 2. Only 8.6% (n=3) of the sarcoidosis patients were current smokers, the majority had never smoked or stopped smoking previously. 31.4% of patients (n=11) were newly diagnosed with sarcoidosis. The PET positive sub-group had an average time from diagnosis of 12.7 years. At the time of PET scanning, 68% (n=23) of the sarcoidosis patients were receiving first and second line treatment, while 32% (n=11) received third line treatment, 1 patient did not receive therapy. Treatment at the time of PET scanning was not different between patients with positive PET findings compared with those who had negative PET findings. Controls (n=13; 4 male, 9 female) had a mean age of 44±16 SD (21-69 range) and mean BMI of 28.3±4.7 SD (20-35 range).
Table 2.
Clinical characteristics of FDG PET/CT sarcoidosis patients
Reader agreement
Interclass correlation coefficients (ICC) for TLV between two readers has an average measure of 0.998 (CI 0.995-0.999). It was concluded that the semi-automatic segmentation results are consistent.
Distinction between sarcoidosis and controls
Comparing FDG PET/CT in sarcoidosis patients, the SUVmax, SUVmean, TGA and %SUV-high was significantly higher in the PET positive group. We analysed 35 pulmonary sarcoidosis patients and 13 control subjects for 5 different parameters. The sarcoidosis group mainly demonstrated pulmonary manifestation of sarcoidosis on FDG PET. Sarcoidosis patients were divided into a group with 26 FDG PET positive cases and a group with 9 FDG PET negative cases (table 3). When FDG PET/CT’s of sarcoidosis patients were reported as negative, then only the parameter TGA was significantly different from controls. The total lung volumes vary considerably between patients (1.5 to 6 litres) and were not significantly different between FDG PET positive and FDG PET negative patients. In the FDG PET positive group, SUVmax, SUVmean, TGA and %SUV-high were significantly different from controls.
Table 3.
Statistics of multiple PET/CT segmentation parameters in sarcoidosis and controls
Correlation between clinical biomarkers and volumetric PET/CT parameters
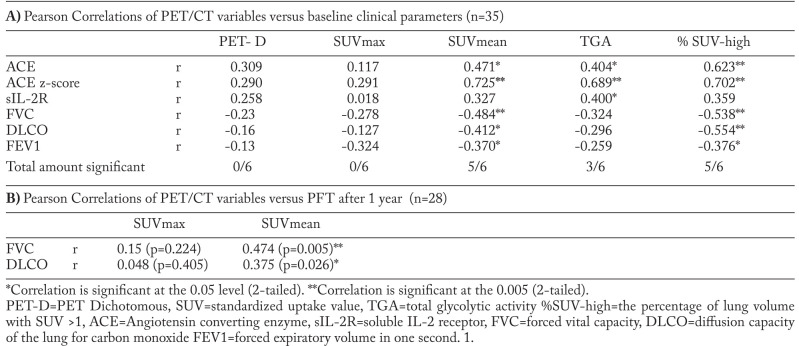
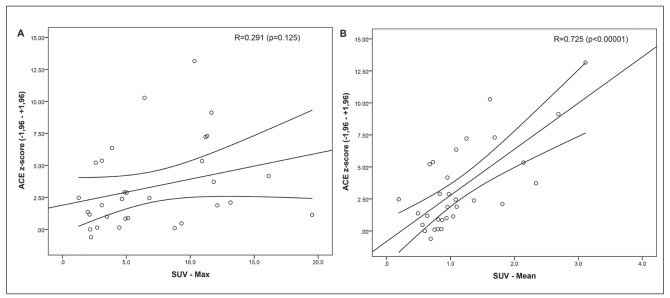
We demonstrated that total lung segmentation PET parameters and conventional PET parameters show a significant difference between sarcoidosis and controls. Assessment of the correlation between volumetric PET parameters (SUVmean, TGA and %SUVhigh) and clinical parameters (ACE, ACE z-score, sIL2-R, FVC, DLCO and FEV1) showed a good correlation in our study population of sarcoidosis patients (n=35) except for sIL-2R. Dichotomous PET reports and SUVmax in the lung parenchyma did not correlate with any clinical biomarker. Results of the analysis of commonly used baseline clinical biomarkers consisting of PFT-values (FVC, DLCO and FEV1) and serum biomarkers values (ACE, ACE z-score, sIL-2R) is presented in Table 4A. The strongest correlations between volumetric PET parameters and clinical biomarkers were found with SUVmean and %SUV-high. We found a strong positive correlation of SUVmean (r=0.725), TGA (r=0.689) and %SUV-high (r=0.702) with genotype corrected ACE z-scores (p<0.001). SUVmax did not show a significant correlation with ACE z-score (fig. 2 A), while SUVmean showed a strong correlation (fig. 2 B). TGA correlated weakly with sIL-2R but not with the other parameters. SUVmean and %SUV-high showed a statistically significant negative correlation with FVC, DLCO and FEV1. Table 4B demonstrates the correlation between FVC and DLCO after 1 year post PET scan. The results show a weak to moderate significant correlation of SUVmean and FVC and DLCO using SUVmean (r=0.474 and r=0.372 respectively), versus SUVmax in this retrospective random cohort. When looking at Stage IV and PFT after 1 year (N=10), we found an average FVC change of -0.58 (SD 7.92) and DLCO -6.60 (SD 26.0.7). Figure 4 depicts the FVC change and the SUVmean in the stage IV patients. We found no significant correlation between SUVmax (r=-0.186) nor SUVmean (r=-0.361) and PFT change, however we observed significant correlation with FVC change (r=-0.556; p=0.47; n=10) when looking at SUVmean in the less fibrotic areas. SUVmean in the dense fibrotic areas did not correlate with FVC change (NS r=-0.170).
Table 4.
Fig. 2.
(A, B): Scatter plots of SUVmax and SUVmean versus ACE z-scores. SUVmax and SUVmean scores were extracted from total lung volumes after segmentation (n=35). While SUVmax (A) shows no correlation measured in the same population, a strong correlation is demonstrated using SUVmean (B)
Fig. 4.
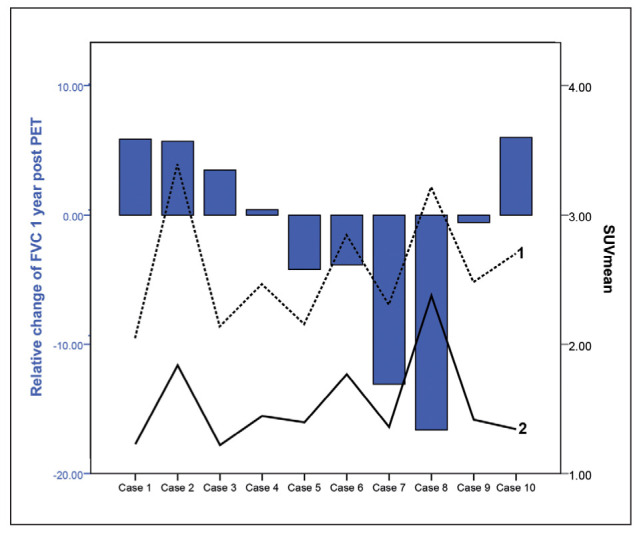
Scadding stage IV plots of relative FVC change 1 year after FDG PET versus SUVmean. Blue bars depict the FVC change. Black line (2) depicts SUVmean in areas with less fibrosis (less dense areas), which shows a significant correlation with FVC change (r=-0.556; p=0.47; n=10), while the SUVmean of the dotted line (1) depics SUVmean in the dense areas was not significant (NS r=-0.170). Case 8 shows FVC decline despite high SUVmean, while case 2 depicts FVC improvement after 1 year. FVC=forced vital capacity, SUV=standardized uptake value
Quantified volumetric PET/CT parameters in relation to Scadding staging
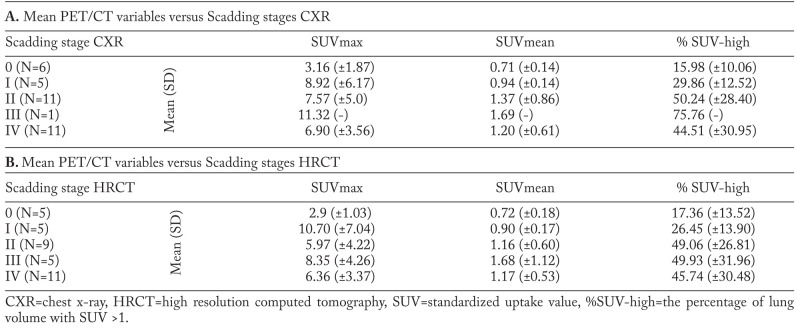
In the following we looked quantitatively if the volumetric parameters correlated with the different Scadding stages in all 35 patients, regardless if they were positive or negative. Calculation of the mean values of SUVmax, SUVmean and % SUV-high values for the different Scadding stage groups show different volumetric PET parameter distribution per stage, based on classical CXR (n=34) and HRCT (n=35), as shown in Table 5 A and B. The CXR group has one less patient, because this patient had only received a HRCT. In CXR staging we found less stage III and more stage 0 and II than in HRCT staging. The volumetric PET data suggests a gradual trend of increased FDG activity from Scadding stage 0 to III in SUVmean and %SUV-high values. In CXR, the smallest percentage of lung volume with increased activity (% SUV-high) is found in stage 0 (16%), followed by stage I (29.9%), II (50.2%), III (75.8%). In CXR stage IV an average % SUV-high of 44.5% is found. On HRCT we have the same findings with stage 0=17%, stage I=26% and stage II=49%. Figure 3B illustrates the outcome of the previous plot (Fig. 3A) if using Scadding category scoring based on the HRCT. Stage 0 still shows less than 20% of increased SUV in the lungs on FDG PET and there also seems to be no significant difference between the stages II to IV on FDG PET. Scadding stage I still seems to be intermediate between stage 0 and II-IV on FDG PET. Using % SUV-high, a significant difference between mean values of HRCT Scadding stage 0 (n=5) and stage II (n=9), was found (p<0.05). Stage 0 was significantly different from other stages (II to IV) for % SUV-high (p<0.05). There was no significant difference between stage 0 and I, nor between stages II up to IV. For CXR Scadding staging, similar findings were observed with a significant difference (p<0.05) between stage 0 (n=6) and stages II to IV for % SUV-high and SUVmax, but not for SUVmean.
Table 5.
FDG PET/CT variables versus Scadding stage based on CXR (A) and HRCT (B) , n=35
Fig. 3A.
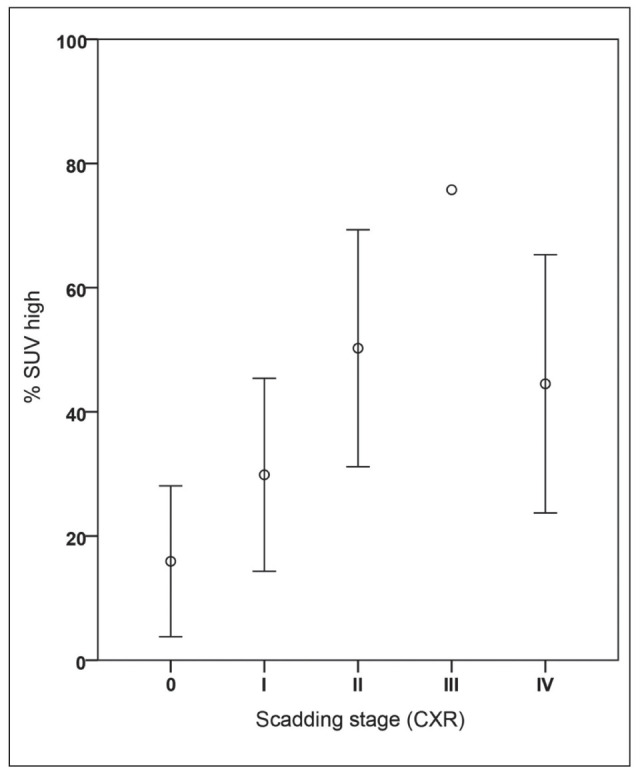
Plots of FDG PET/CT parameter (%SUV-high) per radiological Scadding category in patients with sarcoidosis (n=35). This figure illustrates the differences per Scadding category based on the chest x-ray. Note the difference between stage 0 and other stages. In stage 0 there is about 16% of increased SUV in the lung detected on FDG PET. Stage I seems to be an intermediate stage between 0 and II with almost 30% lung tissue showing increase in FDG uptake. There seems to be no difference between the stages II to IV on FDG PET (around 50%); see also table 5
Fig. 3B.
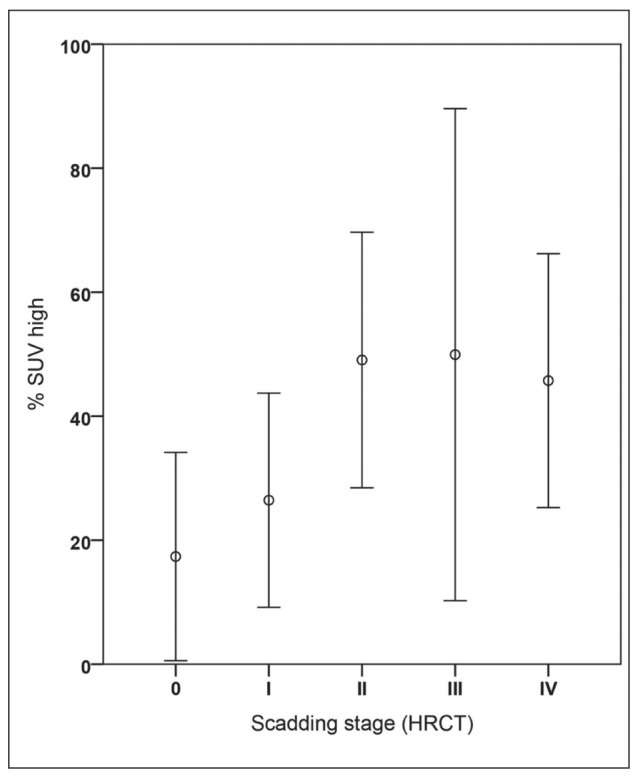
Plots of FDG PET/CT parameter (%SUV-high) per adjusted radiological Scadding category using HRCT in patients with sarcoidosis (n=35).
Discussion
To our knowledge, this is the first study to utilize detailed volumetric analysis in the lungs on FDG PET/CT in sarcoidosis patients. FDG PET/CT has been reported in the literature as a useful independent sensitive parameter of sarcoid inflammatory activity (9-12). However, current literature is mainly based on qualitative reporting of PET/CT scans in sarcoidosis. In this study we evaluated different volumetric quantitative PET measurements using a lung segmentation tool to represent metabolic activity. With this tool, the FDG activity in the lung parenchyma can be analyzed more precisely by differentiating between regions of relatively high and low uptake. We demonstrated that this lung segmentation tool can produce volumetric PET data consistently and relatively quickly, with an ICC of 0.998, and that acquired values (SUVmean, TGA and %SUV-high) were significantly higher in the sarcoidosis group compared to controls, and show improvement to currently used routine parameters as SUVmax.
In contrast to dichotomous qualitative assessment of FDG PET and SUVmax, volumetric PET parameters %SUV-high and SUVmean showed good correlation with the conventional serum biomarker ACE, in a group with mainly lung disease. Especially %SUV-high might be of interest as a marker for sarcoidosis activity, reflecting pulmonary inflammatory activity more precisely then previously possible on FDG PET. However a correlation with sIL-2R was not found. Consistent with previous reports, we showed an increased serum sIL-2R in 82.8% of patients (table 2) (13, 14). The discrepancy between the correlations of the quantitative pulmonary activity parameters with serum ACE and sIL-2R raises interesting considerations. Since we only analyzed the lungs, it might be suggested that serum sIL-2R measurement provides a more general, systemic signal for inflammation than a lung specific lung marker of granulomatous disease activity. This might be supported by the finding that %SUV-high and SUVmean correlate well with PFT results (FVC and DLCO) and not with sIL-2R. Another argument for this explanation might be that sIL-2R level, unlike serum ACE, is also often increased in other systemic diseases like connective tissue disorders (15-17). The cohort is heterogeneous regarding smoking and non-smoking patients and patients with newly diagnosed sarcoidosis (n=11) and patients under treatment (n=23). Potential influence of this heterogeneity on the reported results should be addressed in larger cohort studies. However the volumetric method in theory should be better and more robust marker than SUVmax, since it averages the total lungs and therefore less prone to local parenchymal changes such as fibrosis or emphysema than SUVmax. When looking at PFT values after 1 year we found that in this random mixed population of patients, SUVmax did not correlate significantly with PFT change after 1 year, however SUVmean did show a significant, yet moderate correlation. This might be because SUVmean is a more robust parameter in lung disease than SUVmax since it is a volumetric assessment. The correlation of FDG PET versus PFT was not as strong as in previous studies (1), but might be due to the fact this is a heterogeneous retrospective study population with different kinds of treatments for each individual patient.
To evaluate the value of volumetric PET analysis in regard to radiological findings, we used Scadding staging. From previous reports it is known that FDG PET reports can be classified as positive in any Scadding stage, even in Scadding 0 (11, 12). So far, there is no data on quantitative assessment of FDG PET activity in the lungs in relation to Scadding stages. In this study, we have demonstrated that there is a gradual difference between stage 0, I and II when using volumetric parameters such as % SUV-high. However, there are no quantifiable differences between stage II and IV in the amount of FDG PET activity. Fibrotic disease (stage IV) especially shows the same amount of inflammatory activity (measured by SUVmax or SUVmean) on FDG PET as stages II and III. When looking at the percentage lung volume that shows increased FDG PET activity (%SUV-high), we see on average 50% of pulmonary involvement consistently in stages II, III and IV. Although stage IV is often thought to represent extinguished, end stage disease in sarcoidosis with irreversible changes in the lung parenchyma, our results show similar inflammatory activity compared to stage II and III. These findings suggest that stage IV, at least in this study population, represents ongoing inflammation and fibrosis. This notion of ongoing inflammation in stage IV is supported by evidence from long term follow-up (1-20.7 years) of stage IV sarcoidosis patients as described by Nardi et al. where 36% of PFTs remained stable and 39% PFTs showed improvement (18). It is therefore possible that the amount of ongoing inflammation in combination with pulmonary fibrosis regardless of Scadding stage, determines the prognosis or long term effects of treatment when looking at individual patients. If this could be confirmed that smoldering inflammation drives fibrosis, volumetric quantification of lung activity in pulmonary sarcoidosis patients with features of fibrosis might serve as a new (imaging) biomarker enabling individualized treatment decisions aiming at optimally suppressing inflammation in order to halt future progression of fibrosis.
In case 8 (figure 5) there was decline in FVC 1 year after the initial FDG PET. The images demonstrate that in extensive stage IV there is persistent ongoing inflammation on FDG PET 1 year after the initial FDG PET, which might explain why there is still FVC decline since the patient did have a limited response to therapy. Interestingly the areas with less fibrosis and high FDG uptake correlated best with the FVC decline; this might be because inflammation occurs adjacent to the fibrotic areas and these areas are more important in treatment and effect on FVC change than fibrosis areas.
Fig. 5.
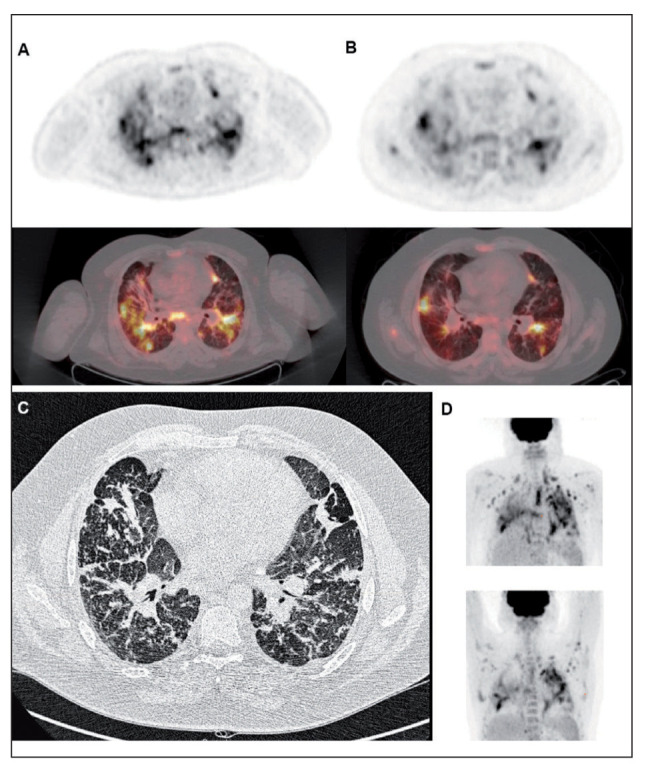
Figure of Case 8. Patient with stage IV sarcoidosis demonstrates high FDG uptake on the initial FDG PET/CT (A) and the second FDG PET 1 year later (B); top images are axial views of FDG PET and bottom are axial views of fused PET/CT. There is decrease of FDG uptake after therapy, however still persistent active areas are visible. (C) high resolution CT axial image, which demonstrate extensive fibrosis as well as some small consolidation areas. (D) the maximum intensity project (MIP) of initial FDG PET (top) vs 1 year follow-up FDG PET (bottom)
In the current study we primarily focus on lung involvement in sarcoidosis, in a study population with mainly thoracic sarcoidosis. We did not measure volumes of extrapulmonary disease nor mediastinal lymph nodes, since granulomas in lymph nodes are often nonspecific lesions as supported by pathology studies (19). However, it might be possible that adding these volumes will further improve the correlation with more systemic (or general) biomarkers such as ACE, ACE z-score and likely sIL-2R. Mediastinal assessment has been shown to be of use in a study with chronic sarcoidosis and infliximab, where a significant correlation between mediastinal high metabolic activity and levels of sIL-2R was found (20). Adding global volume assessments seems of benefit for scientific and pharmacological studies in interstitial lung disease that use FDG PET/CT similar to cancer research (21). In addition to expanding volumetric PET analysis beyond the lungs, global pattern recognition could be implemented to detect different types of conditions, which is already implemented in certain brain PET studies (22). Different patterns of disease distribution in the lungs are already known to exist and are detected by HRCT studies (23, 24). However these patterns of distribution are unknown in FDG PET, at least not reported in detail. In order to detect potential sarcoidosis phenotypes, pattern recognition of inflammatory distribution within lung volumes could be implemented in the future, next to extra pulmonary and mediastinal lymph node assessment. Certain pattern parameters might offer insight in sarcoidosis disease predictors or treatment effects.
In conclusion, we propose a novel method of volumetric analysis of the lungs in FDG PET/CT in patients with sarcoidosis. This method shows its diagnostic superiority over conventional PET parameters like SUVmax. The volumetric PET parameters “% SUV-high” and “SUVmean”, are consistent and quickly to obtain from individual FDG PET, and show better correlation with sarcoidosis activity markers than qualitative FDG PET reporting and SUVmax. Future studies might also include mediastinal lymph nodes and extra pulmonary disease sites in the analysis for purpose of improved systemic modeling of sarcoidosis and other systemic inflammatory disorders. We believe that volumetric analysis of FDG PET is an important step forward in scientific and pharmacological studies in lung inflammation and will open new possibilities in precision medicine in sarcoidosis.
References
- 1.Keijsers RG, Verzijlbergen EJ, van den Bosch JM, et al. 18F-FDG PET as a predictor of pulmonary function in sarcoidosis. Sarcoidosis Vasc Diffuse Lung Dis. 2011;28:123–9. [PubMed] [Google Scholar]
- 2.Anonymous Statement on sarcoidosis. Joint Statement of the American Thoracic Society (ATS), the European Respiratory Society (ERS) and the World Association of Sarcoidosis and Other Granulomatous Disorders (WASOG) adopted by the ATS Board of Directors and by the ERS Executive Committee, February 1999. Am J Respir Crit Care Med. 1999;160:736–55. doi: 10.1164/ajrccm.160.2.ats4-99. [DOI] [PubMed] [Google Scholar]
- 3.Quanjer PH, Tammeling GJ, Cotes JE, Pedersen OF, Peslin R, Yernault JC. Lung volumes and forced ventilatory flows. Report Working Party Standardization of Lung Function Tests, European Community for Steel and Coal. Official Statement of the European Respiratory Society. Eur Respir J Suppl. 1993;16:5–40. [PubMed] [Google Scholar]
- 4.Scadding JG. Prognosis of intrathoracic sarcoidosis in England. A review of 136 cases after five years’ observation. Br Med J. 1961;2:1165–72. doi: 10.1136/bmj.2.5261.1165. [DOI] [PMC free article] [PubMed] [Google Scholar]
- 5.Sharma R, Guleria R, Mohan A, Das C. Scadding criteria for diagnosis of sarcoidosis: Is there a need for change. Chest. 2004;126:754S. [Google Scholar]
- 6.Chew HK, Wun T, Harvey D, Zhou H, White RH. Incidence of venous thromboembolism and its effect on survival among patients with common cancers. Arch Intern Med. 2006;166:458–64. doi: 10.1001/archinte.166.4.458. [DOI] [PubMed] [Google Scholar]
- 7.Yushkevich PA, Piven J, Hazlett HC, et al. User-guided 3D active contour segmentation of anatomical structures: significantly improved efficiency and reliability. Neuroimage. 2006;31:1116–28. doi: 10.1016/j.neuroimage.2006.01.015. [DOI] [PubMed] [Google Scholar]
- 8.Zincirkeser S, Sahin E, Halac M, Sager S. Standardized uptake values of normal organs on 18F-fluorodeoxyglucose positron emission tomography and computed tomography imaging. J Int Med Res. 2007;35:231–6. doi: 10.1177/147323000703500207. [DOI] [PubMed] [Google Scholar]
- 9.Mostard RL, Verschakelen JA, van Kroonenburgh MJ, et al. Severity of pulmonary involvement and (18)F-FDG PET activity in sarcoidosis. Respir Med. 2013;107:439–47. doi: 10.1016/j.rmed.2012.11.011. [DOI] [PubMed] [Google Scholar]
- 10.Mostard RL, Van Kuijk SM, Verschakelen JA, et al. A predictive tool for an effective use of (18)F-FDG PET in assessing activity of sarcoidosis. BMC Pulm Med. 2012;12(57):2466-12-57. doi: 10.1186/1471-2466-12-57. [DOI] [PMC free article] [PubMed] [Google Scholar]
- 11.Mostard R, Vöö S, van Kroonenburgh M, et al. Inflammatory activity assessment by F18 FDG-PET/CT in persistent symptomatic sarcoidosis. Respir Med. 2011;105:1917–24. doi: 10.1016/j.rmed.2011.08.012. [DOI] [PubMed] [Google Scholar]
- 12.Adams H, Keijsers RG, Korenromp IH, Grutters JC. FDG PET for gauging of sarcoid disease activity. Semin Respir Crit Care Med. 2014;35:352–61. doi: 10.1055/s-0034-1376866. [DOI] [PubMed] [Google Scholar]
- 13.Keijsers RG, Verzijlbergen FJ, Oyen WJ, et al. 18F-FDG PET, genotype-corrected ACE and sIL-2R in newly diagnosed sarcoidosis. Eur J Nucl Med Mol Imaging. 2009;36:1131–7. doi: 10.1007/s00259-009-1097-x. [DOI] [PubMed] [Google Scholar]
- 14.Sobic-Saranovic D, Grozdic I, Videnovic-Ivanov J, et al. The utility of 18F-FDG PET/CT for diagnosis and adjustment of therapy in patients with active chronic sarcoidosis. J Nucl Med. 2012;53:1543–9. doi: 10.2967/jnumed.112.104380. [DOI] [PubMed] [Google Scholar]
- 15.Spronk PE, ter Borg EJ, Huitema MG, Limburg PC, Kallenberg CG. Changes in levels of soluble T-cell activation markers, sIL-2R, sCD4 and sCD8, in relation to disease exacerbations in patients with systemic lupus erythematosus: a prospective study. Ann Rheum Dis. 1994;53:235–9. doi: 10.1136/ard.53.4.235. [DOI] [PMC free article] [PubMed] [Google Scholar]
- 16.De Rie MA, Zonneveld IM, Witkamp L, Van Lier RA, Out TA, Bos JD. Soluble interleukin-2 receptor (sIL-2R) is a marker of disease activity in psoriasis: a comparison of sIL-2R, sCD27, sCD4, sCD8 and sICAM-1. Acta Derm Venereol. 1996;76:357–60. doi: 10.2340/0001555576357360. [DOI] [PubMed] [Google Scholar]
- 17.Yeo UC, Yang YS, Park KB, et al. Serum concentration of the soluble interleukin-2 receptor in vitiligo patients. J Dermatol Sci. 1999;19:182–8. doi: 10.1016/s0923-1811(98)00070-x. [DOI] [PubMed] [Google Scholar]
- 18.Nardi A, Brillet PY, Letoumelin P, et al. Stage IV sarcoidosis: comparison of survival with the general population and causes of death. Eur Respir J. 2011;38:1368–73. doi: 10.1183/09031936.00187410. [DOI] [PubMed] [Google Scholar]
- 19.Rosen Y. Pathology of sarcoidosis. Semin Respir Crit Care Med. 2007;28:36–52. doi: 10.1055/s-2007-970332. [DOI] [PubMed] [Google Scholar]
- 20.Vorselaars AD, Verwoerd A, van Moorsel CH, Keijsers RG, Rijkers GT, Grutters JC. Prediction of relapse after discontinuation of infliximab therapy in severe sarcoidosis. Eur Respir J. 2013 doi: 10.1183/09031936.00055213. [DOI] [PubMed] [Google Scholar]
- 21.Pak K, Cheon GJ, Nam HY, et al. Prognostic value of metabolic tumor volume and total lesion glycolysis in head and neck cancer: a systematic review and meta-analysis. J Nucl Med. 2014;55:884–90. doi: 10.2967/jnumed.113.133801. [DOI] [PubMed] [Google Scholar]
- 22.Lee DS, Kang H, Kim H, et al. Metabolic connectivity by interregional correlation analysis using statistical parametric mapping (SPM) and FDG brain PET; methodological development and patterns of metabolic connectivity in adults. Eur J Nucl Med Mol Imaging. 2008;35:1681–91. doi: 10.1007/s00259-008-0808-z. [DOI] [PubMed] [Google Scholar]
- 23.Nunes H, Brillet PY, Valeyre D, Brauner MW, Wells AU. Imaging in sarcoidosis. Semin Respir Crit Care Med. 2007;28:102–20. doi: 10.1055/s-2007-970336. [DOI] [PubMed] [Google Scholar]
- 24.Ziora D, Kornelia K, Jastrzebski D, Labus L, Zieleznik K, Kozielski J. High resolution computed tomography in 2-year follow-up of stage I sarcoidosis. Adv Exp Med Biol. 2013;788:369–74. doi: 10.1007/978-94-007-6627-3_50. [DOI] [PubMed] [Google Scholar]


