

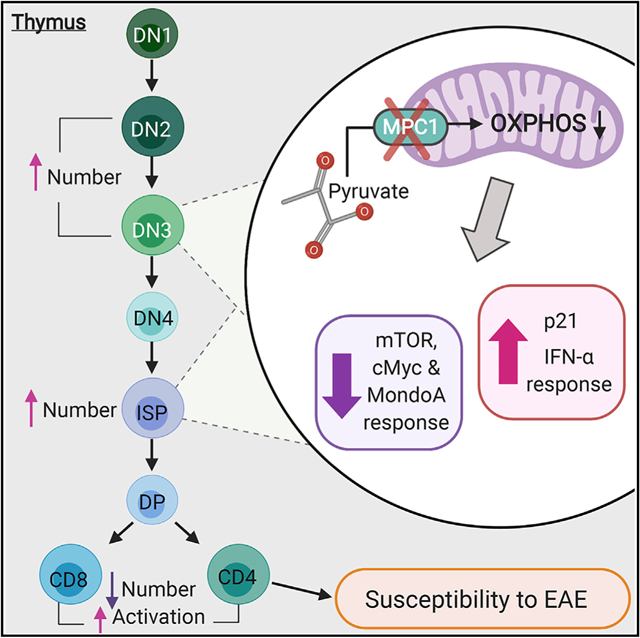
SUMMARY
Metabolic pathways regulate T cell development and function, but many remain understudied. Recently, the mitochondrial pyruvate carrier (MPC) was identified as the transporter that mediates pyruvate entry into mitochondria, promoting pyruvate oxidation. Here we find that deleting Mpc1, an obligate MPC subunit, in the hematopoietic system results in a specific reduction in peripheral αβ T cell numbers. MPC1-deficient T cells have defective thymic development at the β-selection, intermediate single positive (ISP)-to-double-positive (DP), and positive selection steps. We find that early thymocytes deficient in MPC1 display alterations to multiple pathways involved in T cell development. This results in preferred escape of more activated T cells. Finally, mice with hematopoietic deletion of Mpc1 are more susceptible to experimental autoimmune encephalomyelitis. Altogether, our study demonstrates that pyruvate oxidation by T cell precursors is necessary for optimal αβ T cell development and that its deficiency results in reduced but activated peripheral T cell populations.
Graphical Abstract
In Brief
Ramstead et al. show that mitochondrial pyruvate carrier 1, which mediates mitochondrial uptake of pyruvate, is necessary for proper development of αβ T cells. Consequently, deletion of MPC1 in early thymic development results in reduced numbers and abnormal activation of peripheral αβ T cells.
INTRODUCTION
Recent work in the metabolism field has revealed that metabolic pathways have the ability to control the development of T cells and their effector functions (Peng et al., 2016; Gerriets et al., 2015; Almeida et al., 2016; Buck et al., 2015; Chapman et al., 2018; Beier et al., 2015; Ciofani and Zúñiga-Pflucker, 2005; Yang et al., 2018; Juntilla et al., 2007; Swat et al., 2006). Therefore, a better understanding of metabolic pathways used by T cells has great potential as a means to modulate their behavior during health and disease. A key metabolic point of divergence is pyruvate translocation (Gray et al., 2014). Pyruvate can enter mitochondria and contribute to oxidative phosphorylation (OX-PHOS) or be converted into lactate in the cytosol during aerobic glycolysis (Almeida et al., 2016). In T cells, activation results in a rapid metabolic shift from OXPHOS to aerobic glycolysis, shunting pyruvate toward production of lactate (Menk et al., 2018). Manipulating the fate of pyruvate modifies T cell behavior because steering pyruvate toward OXPHOS inhibits Th1 and Th17 cell functions and promotes regulatory T cell (Treg) function (Gerriets et al., 2015; Peng et al., 2016). Therefore, it could be hypothesized that skewing pyruvate toward aerobic glycolysis would enhance effector T cell responses. However, other studies suggest that effector T cell responses also require OXPHOS, possibly from pyruvate (Sena et al., 2013; Yin et al., 2016; Tarasenko et al., 2017; Bantug et al., 2018). Therefore, the effects of blocking pyruvate oxidation in T cell biology are unclear.
The transporter responsible for moving pyruvate into mitochondria, called the mitochondrial pyruvate carrier (MPC), was only recently identified (Bricker et al., 2012; Herzig et al., 2012). The MPC is composed of two functionally dependent subunits, MPC1 and MPC2 (Bricker et al., 2012; Herzig et al., 2012). The recent development of mice with floxed alleles of one of the MPC subunits has allowed cell-specific inhibition of this transporter (Lam et al., 2016; Schell et al., 2017). Here we developed mice lacking MPC1 in hematopoietic cells and demonstrate that pyruvate oxidation plays a crucial cell-intrinsic role in T cell precursors. Single-cell RNA sequencing and immune profiling revealed a critical role of MPC1 in several steps of thymic development. These developmental defects result in reduced but activated T cell populations in the periphery and increased T cell-mediated inflammation.
RESULTS
Hematopoietic Deletion of MPC1 Results in a Specific and Cell-Intrinsic Defect in Peripheral T Cell Numbers and Thymic Development
Initially, we crossed MPC1 fl/fl mice with Vav-Cre mice to generate mice specifically lacking Mpc1 in hematopoietic cells and found that these mice had similar spleen and bone marrow cellularity (Figures S1A–S1D). However, they had reduced percentages of T cells in their spleens and mesenteric lymph nodes (Figures 1A–1C). This was due to a reduction in CD4+ and CD8+ αβ T cells but not in γδ T cells (Figures 1A–1C; Figures S1E and S1F). Surprisingly, we found few changes to the numbers of other hematopoietic lineages in the bone marrow and spleen (Figures 1D and 1E).
Figure 1. Loss of Hematopoietic MPC1 Expression Does Not Alter Baseline Hematopoiesis but Leads to a Cell-Intrinsic Decrease in Thymocytes and Peripheral αβ T Cell Populations.
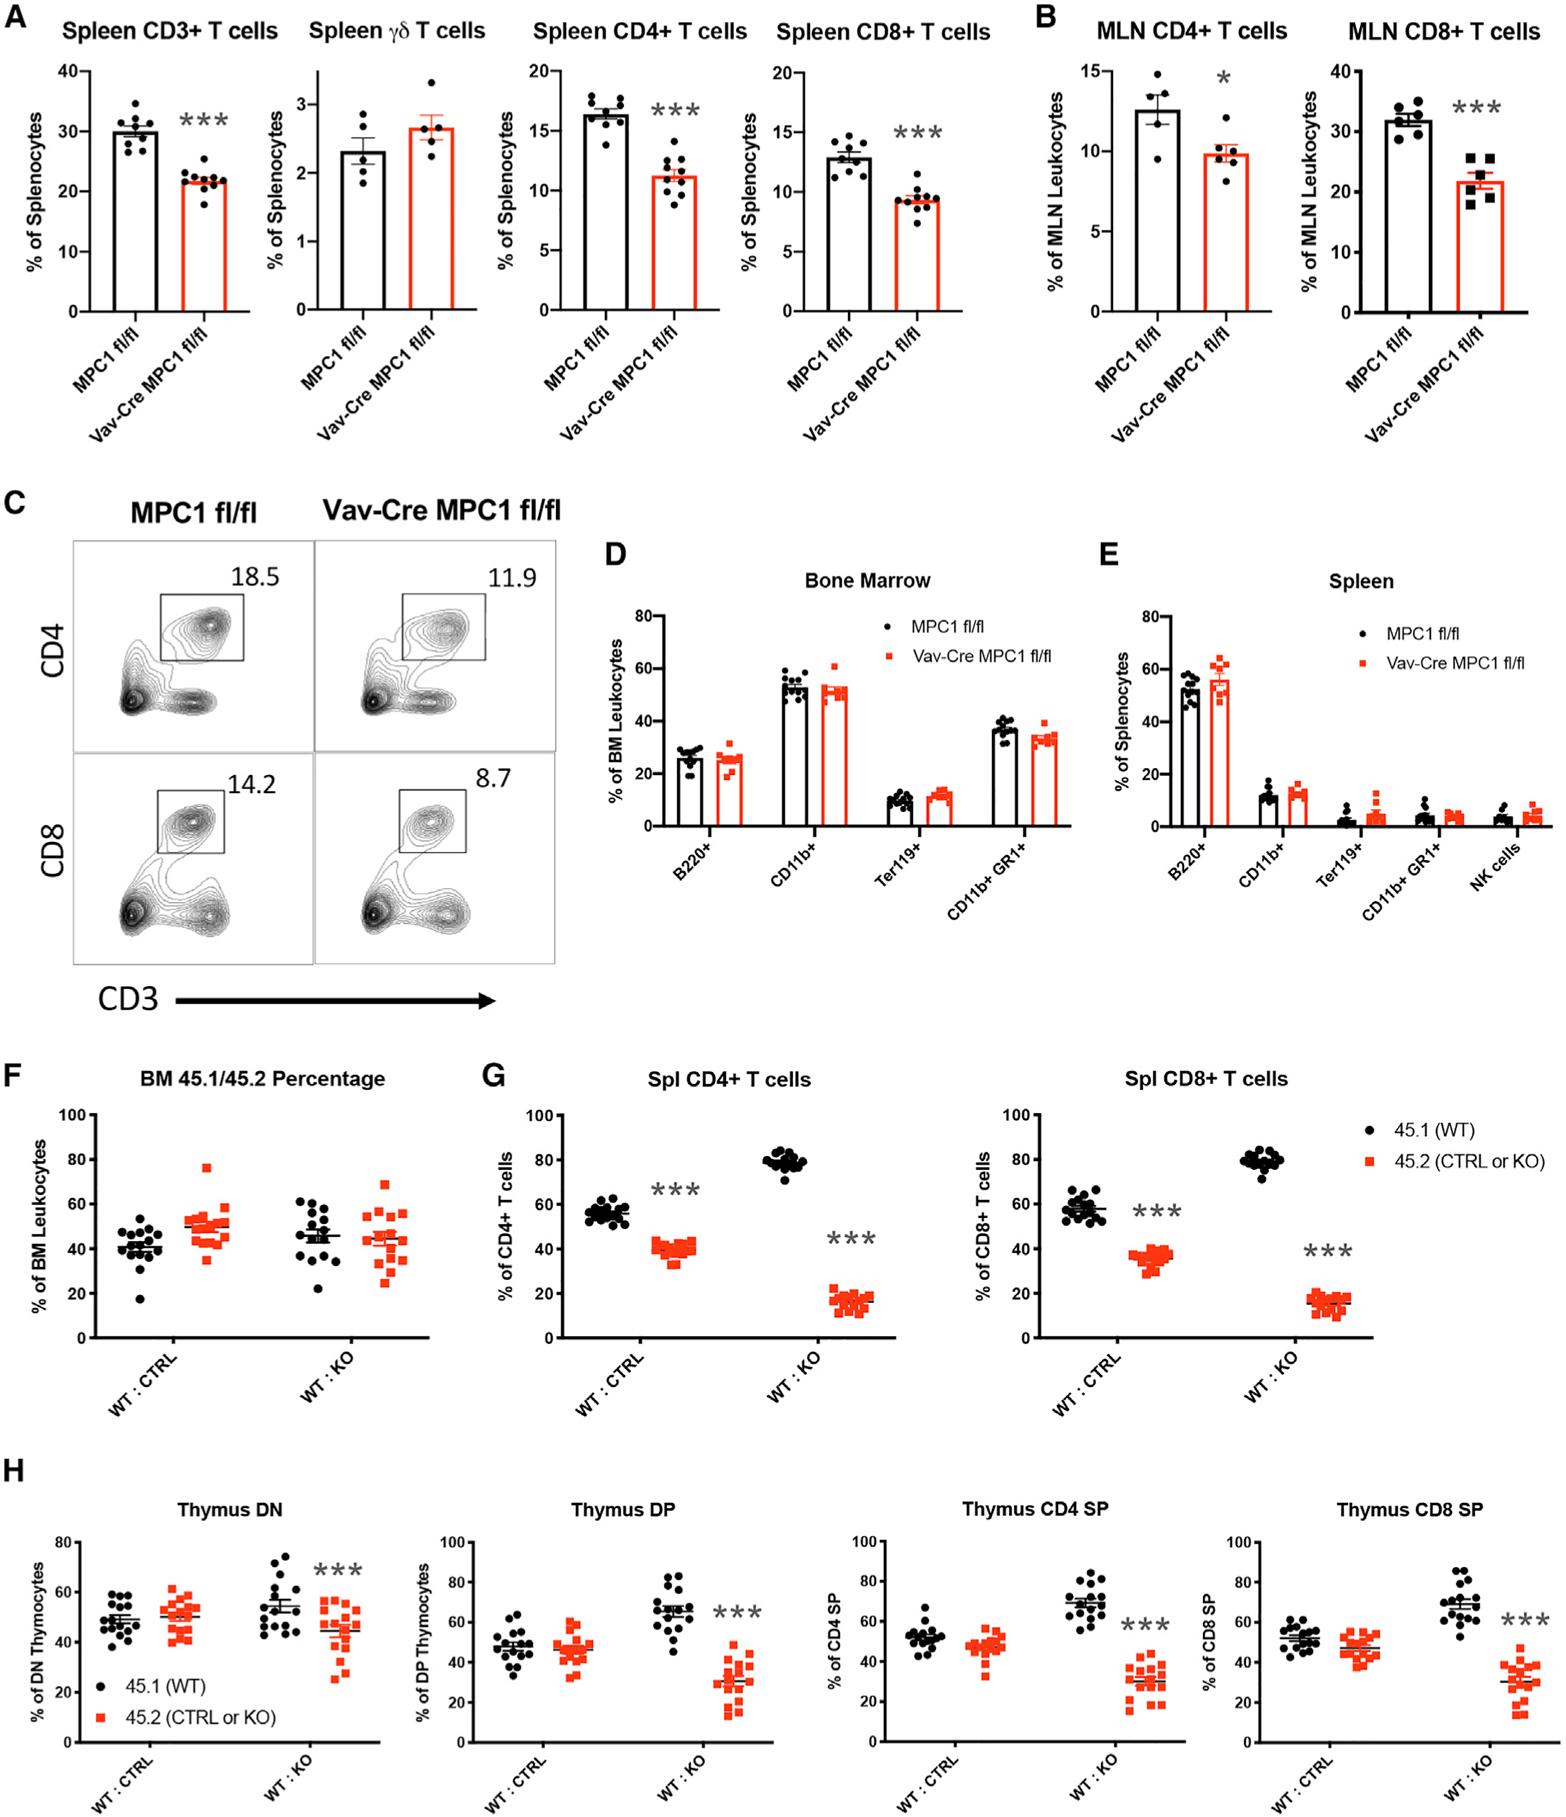
(A) Percentage of T cells in the spleen.
(B) Percentage of αβ T cells in mesenteric lymph nodes (MLNs).
(C) Representative flow plots of T cells in the spleen.
(D and E) Percentage of bone marrow cells (D) and splenocytes (E) expressing the indicated markers, measured by flow cytometry.
(F and G) Percent contributions by each donor to total bone marrow cells (F) and αβ T cells (G) after reconstitution.
(H) Percent contributions by each donor to thymocyte subsets.
All graphs represent mean ± SEM and contain data from multiple experiments. Statistical significance was measured by Student’s t test (A–E) or two-way ANOVA with Sidak post test (F–H). *p < 0.05, **p < 0.01, ***p < 0.001.
See also Figure S1.
Next we performed mixed bone marrow chimera experiments with CD45.1 wild-type (WT) bone marrow and CD45.2 Vav-Cre MPC1 fl/fl or MPC1 fl/fl bone marrow cells to determine whether our T cell phenotypes were cell intrinsic. Engrafted CD45+ hematopoietic cells in the bone marrow compartment were evenly split between WT CD45.1 and MPC1 knockout (KO) CD45.2 cells, indicating comparable repopulation capacity by both genotypes (Figure 1F). However, we observed dramatic reductions in MPC1-deficient CD4+ and CD8+ T cell percentages, with subtle reductions in MPC1-deficient B cells and macrophages (Figure 1G; Figures S1G and S1H).
In the thymus of these chimeras, MPC1-deficient thymocytes were far less prevalent. This reduction began in the CD4− CD8− double-negative (DN) population and became more pronounced in the CD4+ CD8+ double-positive (DP) population and CD4+ and CD8+ single positive (SP) populations (Figure 1H). Altogether, our data indicate that deletion of Mpc1 resulted in cell-intrinsic defects in thymic αβ T cell development.
MPC1-Deficient Thymocytes Accumulate during the Early Stages of Development
To identify the developmental steps affected by MPC1 deficiency, we first performed flow cytometry on bone marrow. Using established fluorescence-activated cell sorting (FACS) staining strategies (Wallace et al., 2017), we did not observe significant changes in hematopoietic stem or progenitor cells in the bone marrow (Figures S2A–S2C). Next we performed single-cell RNA sequencing (scRNA-seq) on Vav-Cre MPC1 fl/fl and MPC1 fl/fl thymocytes. Thymocytes were separated into 15 different clusters that were identified based on their gene expression compared with the Immgen database (Ekiz et al., 2019; Figure 2A). Deletion of Mpc1 but not Mpc2 gene expression was confirmed in all clusters (Figure 2B; Figure S2D). Increased frequencies of clusters 6, 8, and 11, which include primarily DN and intermediate SP (ISP) cells, were found in MPC1-deficient thymocytes (Figure 2C; Figure S2E). We also observed a reduced frequency of cluster 5 and trending reductions in clusters 7 and 10, which were identified as CD4 SP and CD8 SP cells (Figure 2C; Figure S2E).
Figure 2. scRNA-Seq Reveals Altered Thymic Development and Metabolism in the Absence of MPC1.
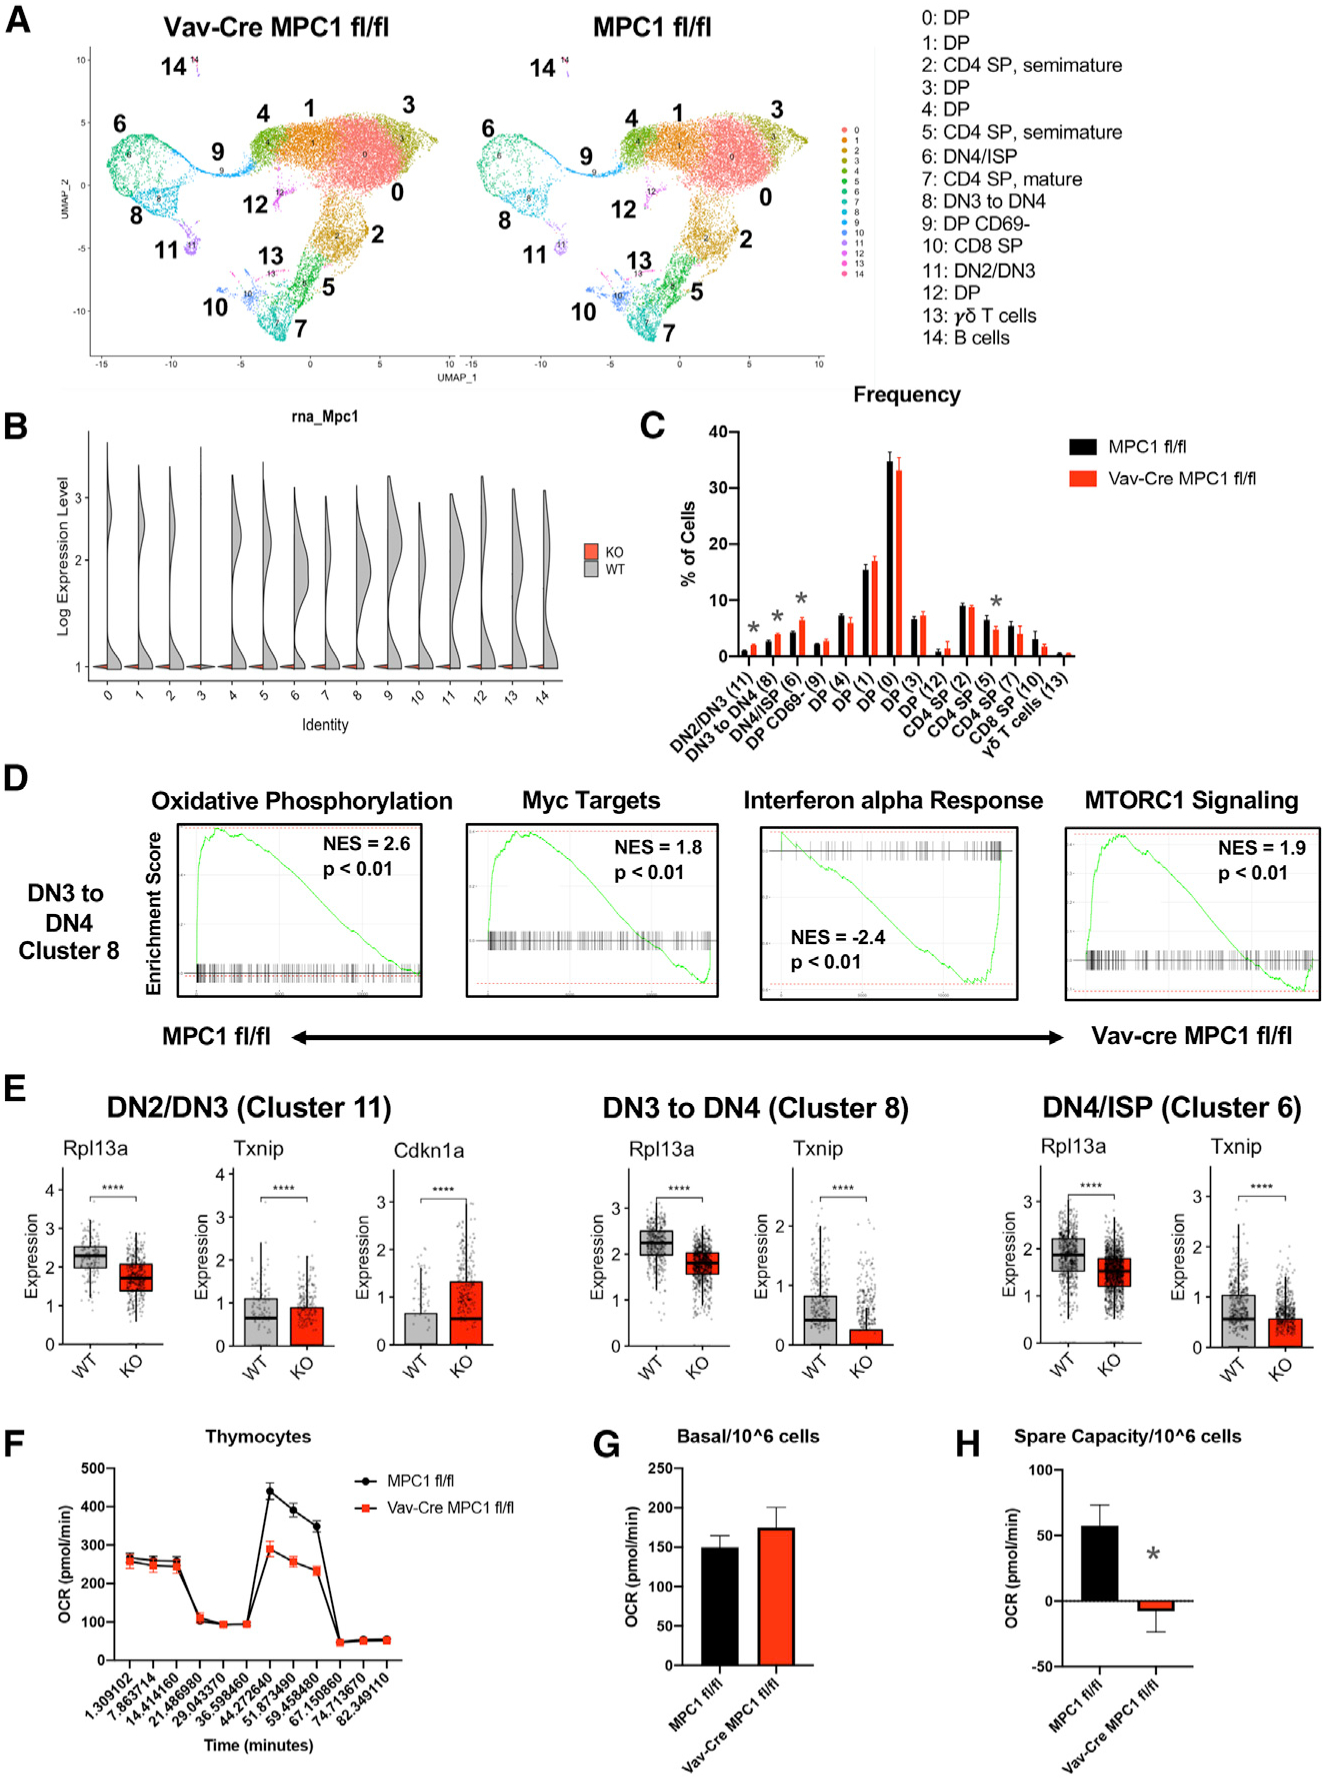
(A) Uniform Manifold Approximation and Projection (UMAP) clustering of Vav-Cre MPC1 fl/fl and MPC1 fl/fl thymocytes.
(B) Expression of Mpc1 in clusters.
(C) Percentage of total cells made up by each cluster.
(D) GSEA gene expression plots for cluster 8.
(E) Expression of select genes in clusters 11, 8, and 6. The graph represents box-and-whisker plots, and statistical significance was measured by Wilcoxon test with Holm correction for multiple testing.
(F) Representative Seahorse plot for thymocytes.
(G and H) Basal respiration (G) and spare respiratory capacity (H) per 106 cells with n = 5 for MPC1 fl/fl and n = 4 for Vav-Cre MPC1 fl/fl samples from two separate experiments.
Graphs represent mean ± SEM, and statistical significance was measured by Student’s t test unless otherwise noted. *p < 0.05, **p < 0.01, ***p < 0.001.
See also Figure S2.
Next we examined gene expression in clusters 6, 8, and 11. Based on gene set enrichment analysis (GSEA), OXPHOS gene expression was reduced in all three KO clusters, expression of Myc targets was decreased in KO clusters 6 and 8, and MTORC1 signaling was reduced in KO cluster 8 (Figure 2D; Figure S2F). In contrast, the interferon α (IFNα) pathway was upregulated in all three KO clusters (Figure 2D; Figure S2F). Interestingly, expression of multiple ribosomal genes as well as the known MondoA target Txnip (Stoltzman et al., 2008) was also reduced in all three KO clusters (Figure 2E; Figure S2G). Finally, p53 activity was likely increased in KO cluster 11, as determined by increased Cdkn1a expression (el-Deiry et al., 1993; Figure 2E).
To examine the effect of MPC1 deficiency on thymocyte metabolism, we performed metabolic analysis using the Seahorse Bioanalyzer on WT and KO thymocytes. Consistent with a reduction in OXPHOS genes, MPC1-deficient thymocytes had reduced spare respiratory capacity compared with control thymocytes (Figures 2F–2H). Altogether, these data suggest that MPC1-deficient thymocytes have a defect in DN-to-DP transition, likely mediated through the effect of MPC1 activity on multiple signaling and metabolic pathways.
β-Selection, Positive Selection, and ISP-to-DP Development Steps Require MPC1 Activity
We next verified our scRNA-seq results by flow cytometry. We did not observe changes in total thymocyte numbers (Figure S3A) but did observe an increase in DN cells and a decrease in mature CD4 SP (TCRβ+ CD4+ CD8−) and CD8 SP (TCRβ+ CD8+ CD4−) cells in MPC1-deficient thymocytes (Figures 3A and 3B). Within the MPC1-deficient DN population, we observed accumulation of the CD25+ CD44+ DN2 and CD25+ CD44− DN3 populations and increased CD25 expression within DN3 cells (Figures 3C–3F), indicating reduced T cell receptor (TCR) signaling and β-se-lection (Laurent et al., 2004; Rothenberg et al., 2008). In addition, a substantial accumulation of MPC1-deficient ISPs was also observed (Figures 3G–3I). These thymic changes were not mediated by expression of Vav-Cre or changes in the recruitment of CD44+ CD25− cKit+ early thymic progenitors (ETPs) to the thymus (Figures S3B and S3C).
Figure 3. Flow Cytometry Analysis of Thymic Populations.
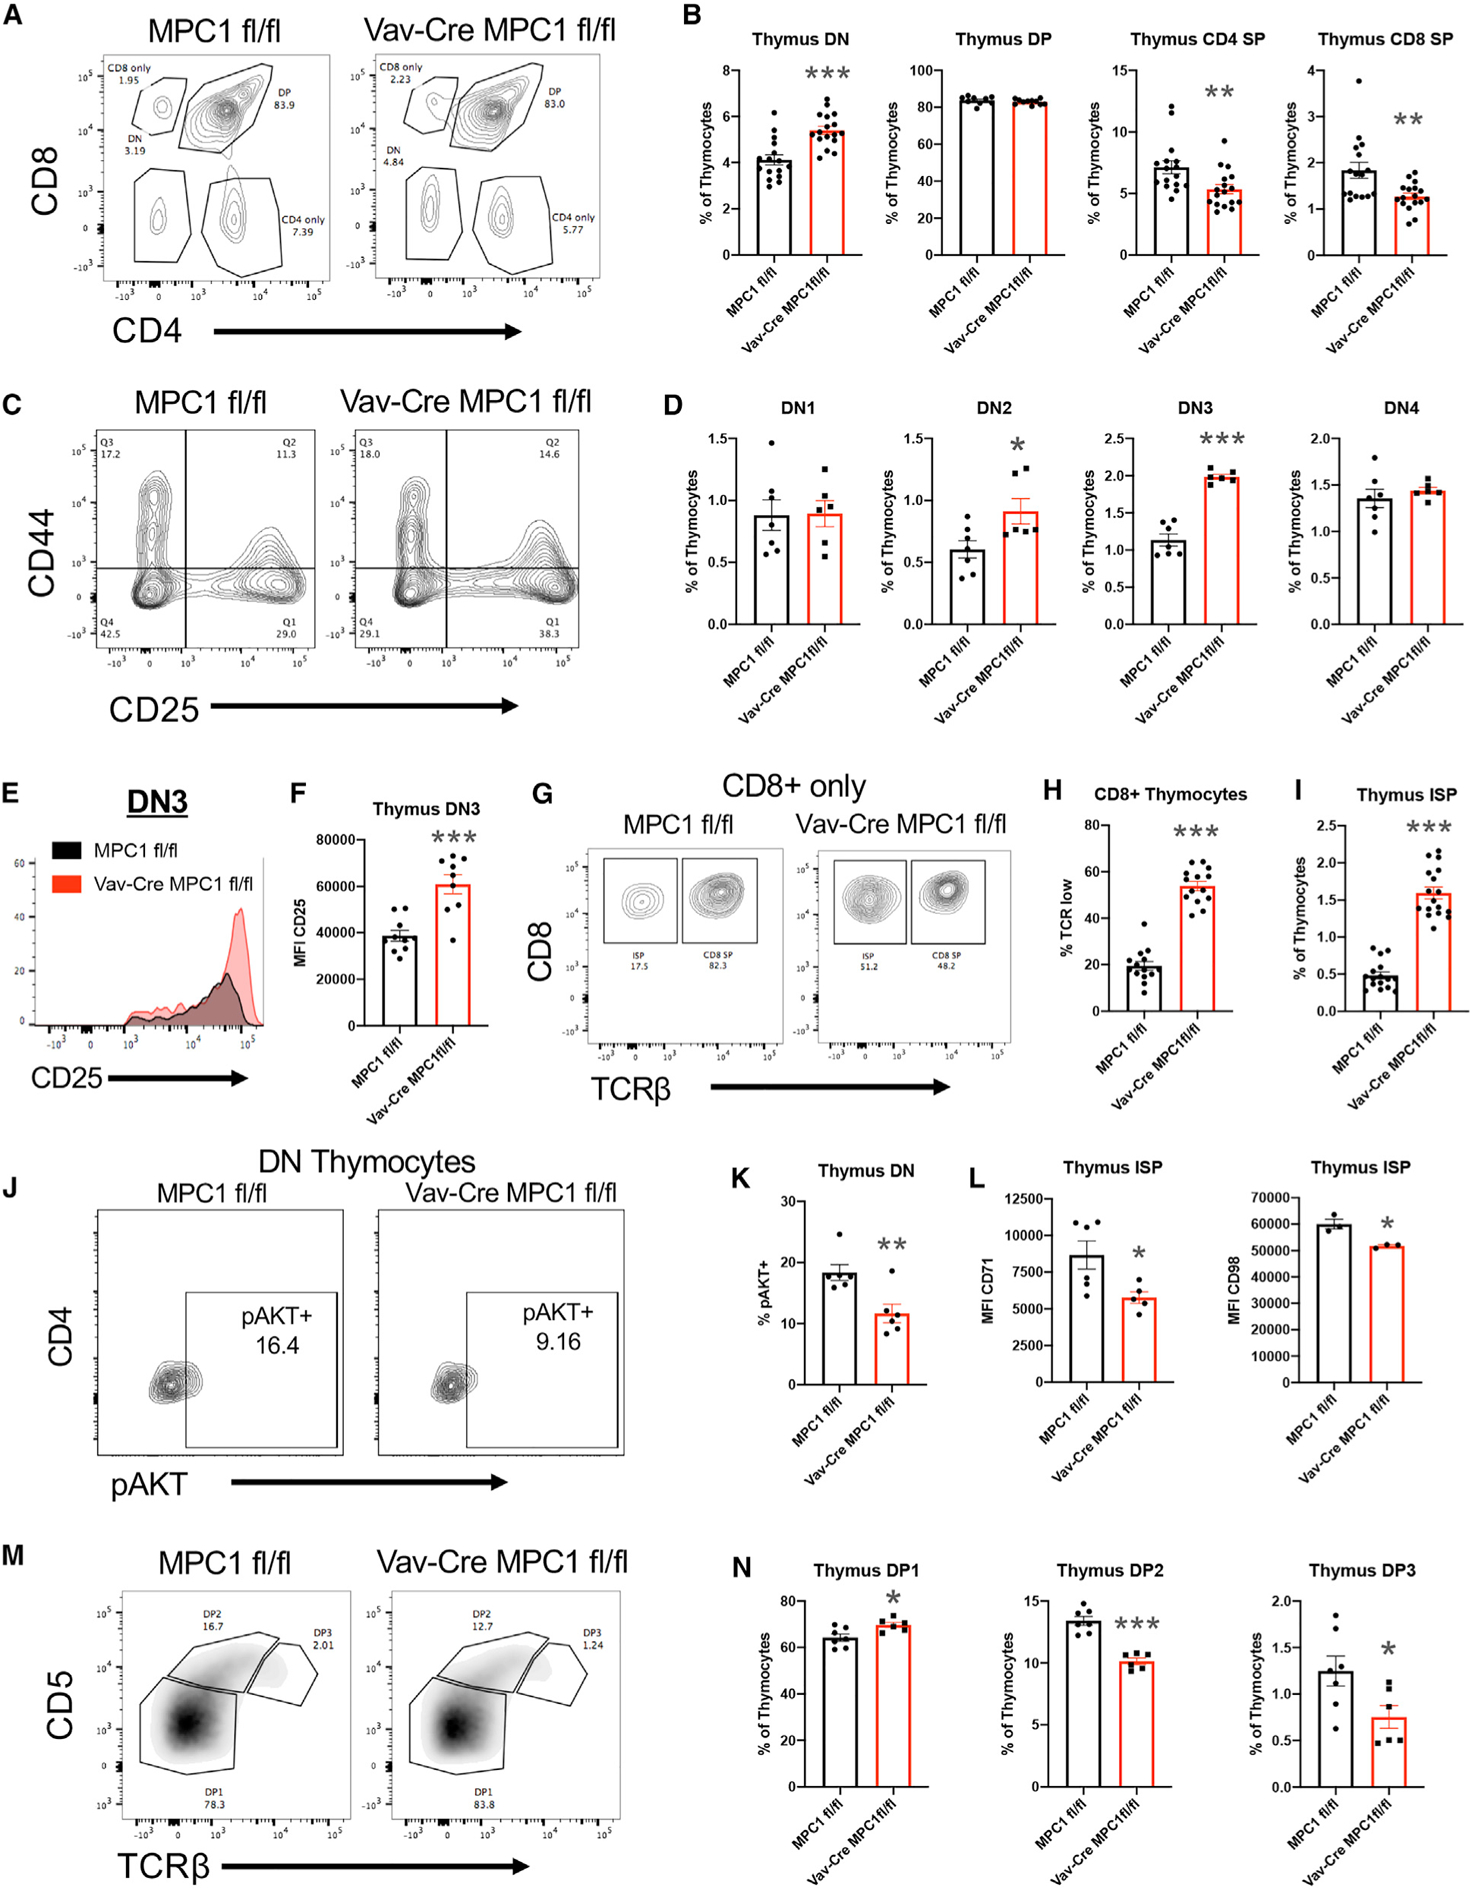
(A) Representative plot of CD4 and CD8 expression in the thymus.
(B) Percentage of total thymocytes for CD4− CD8− (DN), CD4+ CD8+ (DP), CD4+ CD8− TCRβ+ (CD4 SP), and CD4− CD8+ TCRβ+ (CD8 SP) populations.
(C) Representative plot of CD44 and CD25 expression in DN cells.
(D) Percentage of total thymocytes for CD44+ CD25− (DN1), CD44+ CD25+ (DN2), CD44− CD25+ (DN3), and CD44− CD25− (DN4) DN cells.
(E) Representative histogram of CD25 expression on DN3 cells.
(F) Mean fluorescence intensity for CD25 expression on DN3 cells.
(G) Representative plot for TCRβ expression on CD8+ CD4− thymocytes.
(H) Percentage of CD8+ CD4− thymocytes expressing low levels of TCRβ.
(I) Percentage of total thymocytes for the CD4− CD8+ TCRβ− CD3− (ISP) population.
(J) Representative plot of phospho-AKT expression in DN thymocytes.
(K) Percentage of DN thymocytes that express phospho-AKT.
(L) Mean fluorescence intensity for CD71 and CD98 expression on ISP cells.
(M) Representative plot of CD5 and TCRβ expression on DP cells.
(N) Percent of total thymocytes for CD5 low TCRβ low (DP1), CD5 high TCRβ intermediate (DP2), and CD5 intermediate TCRβ high (DP3) DP cells.
All graphs represent mean ± SEM and contain data from multiple experiments. Statistical significance was measured by Student’s t test. *p < 0.05, **p < 0.01, ***p < 0.001.
See also Figure S3.
Our scRNA-seq data suggested reduced mammalian target of rapamycin (mTOR) activity in MPC1-deficient DN cells and the phosphatidylinositol 3-kinase (PI3K)/AKT/mTOR pathway is critical for DN-to-DP transition (Yang et al., 2018; Juntilla et al., 2007; Swat et al., 2006). Therefore, we measured phosphorylation of AKT Threonine 308 (pAKT) by flow cytometry and found reduced pAKT expression in MPC1-deficient DN thymocytes (Figures 3J and 3K). Consistent with this, we also found reduced expression of the nutrient receptors CD71 and CD98 on MPC1-deficient ISP cells (Kelly et al., 2007; Figure 3L). These data suggest that MPC1 activity promotes AKT signaling to promote DN-to-DP transition.
We then more carefully examined DP thymocytes, which can be divided into three subsets based on TCRβ and CD5 expression (Saini et al., 2010). DP1 cells have not yet undergone selection and express low levels of TCRβ and CD5, whereas DP2 cells (TCRβ intermediate and CD5 high) and DP3 cells (TCRβ high and CD5 intermediate) have passed positive selection (Saini et al., 2010). Upon analysis, we observed an accumulation of the DP1 subset and reductions in the DP2 and DP3 subsets in MPC1-deficient thymocytes (Figures 3M and 3N). This would suggest that there is reduced TCR signaling and positive selection in the MPC1-deficient DP population. Consistent with this, reduced expression of the TCR activation marker CD69 was measured on MPC1-deficient DN and DP thymocytes, including DP1 cells (Yamashita et al., 1993; Swat et al., 1993; Figure S3D). This also correlated with a reduced population of TCRβ+ CD69+ DP cells, further suggesting a reduction in positive selection (Figure S3E; Swat et al., 1993).
Altogether, our data indicate that MPC1 deficiency affects the early stages of T cell development. To examine the importance of these early effects, we generated CD4-Cre MPC1 fl/fl mice (Figure S3F). CD4-Cre MPC1 fl/fl mice displayed little changes in thymocyte subsets or splenic T cell percentages compared with controls (Figures S3G and S3H), indicating that MPC1 has its greatest effect on T cell development during early thymopoiesis.
MPC1-Deficient T Cells Display Enhanced Activation and Inflammatory Potential
Reduced TCR signaling early in development could lead to preferred selection of clones with strong self-reactivity in the Vav-Cre MPC1 fl/fl thymus. To test this, we measured expression of the TCR affinity marker CD5 (Azzam et al., 1998; Biancone et al., 1996; Mandl et al., 2013; Persaud et al., 2014; Fulton et al., 2015). CD5 expression was reduced on MPC1-deficient DN and DP cells but enhanced on MPC1-deficient mature CD4 SP and CD8 SP cells, indeed suggesting preferred selection of highly self-reactive TCRs in the MPC1-deficient thymus (Figure 4A). Consistent with this, MPC1-deficient CD4 SP and CD8 SP cells in the thymus had a more activated phenotype (Figure 4B).
Figure 4. Loss of MPC1 Expression in Thymocytes Leads to Increased Homeostatic Activation of Peripheral T Cells.
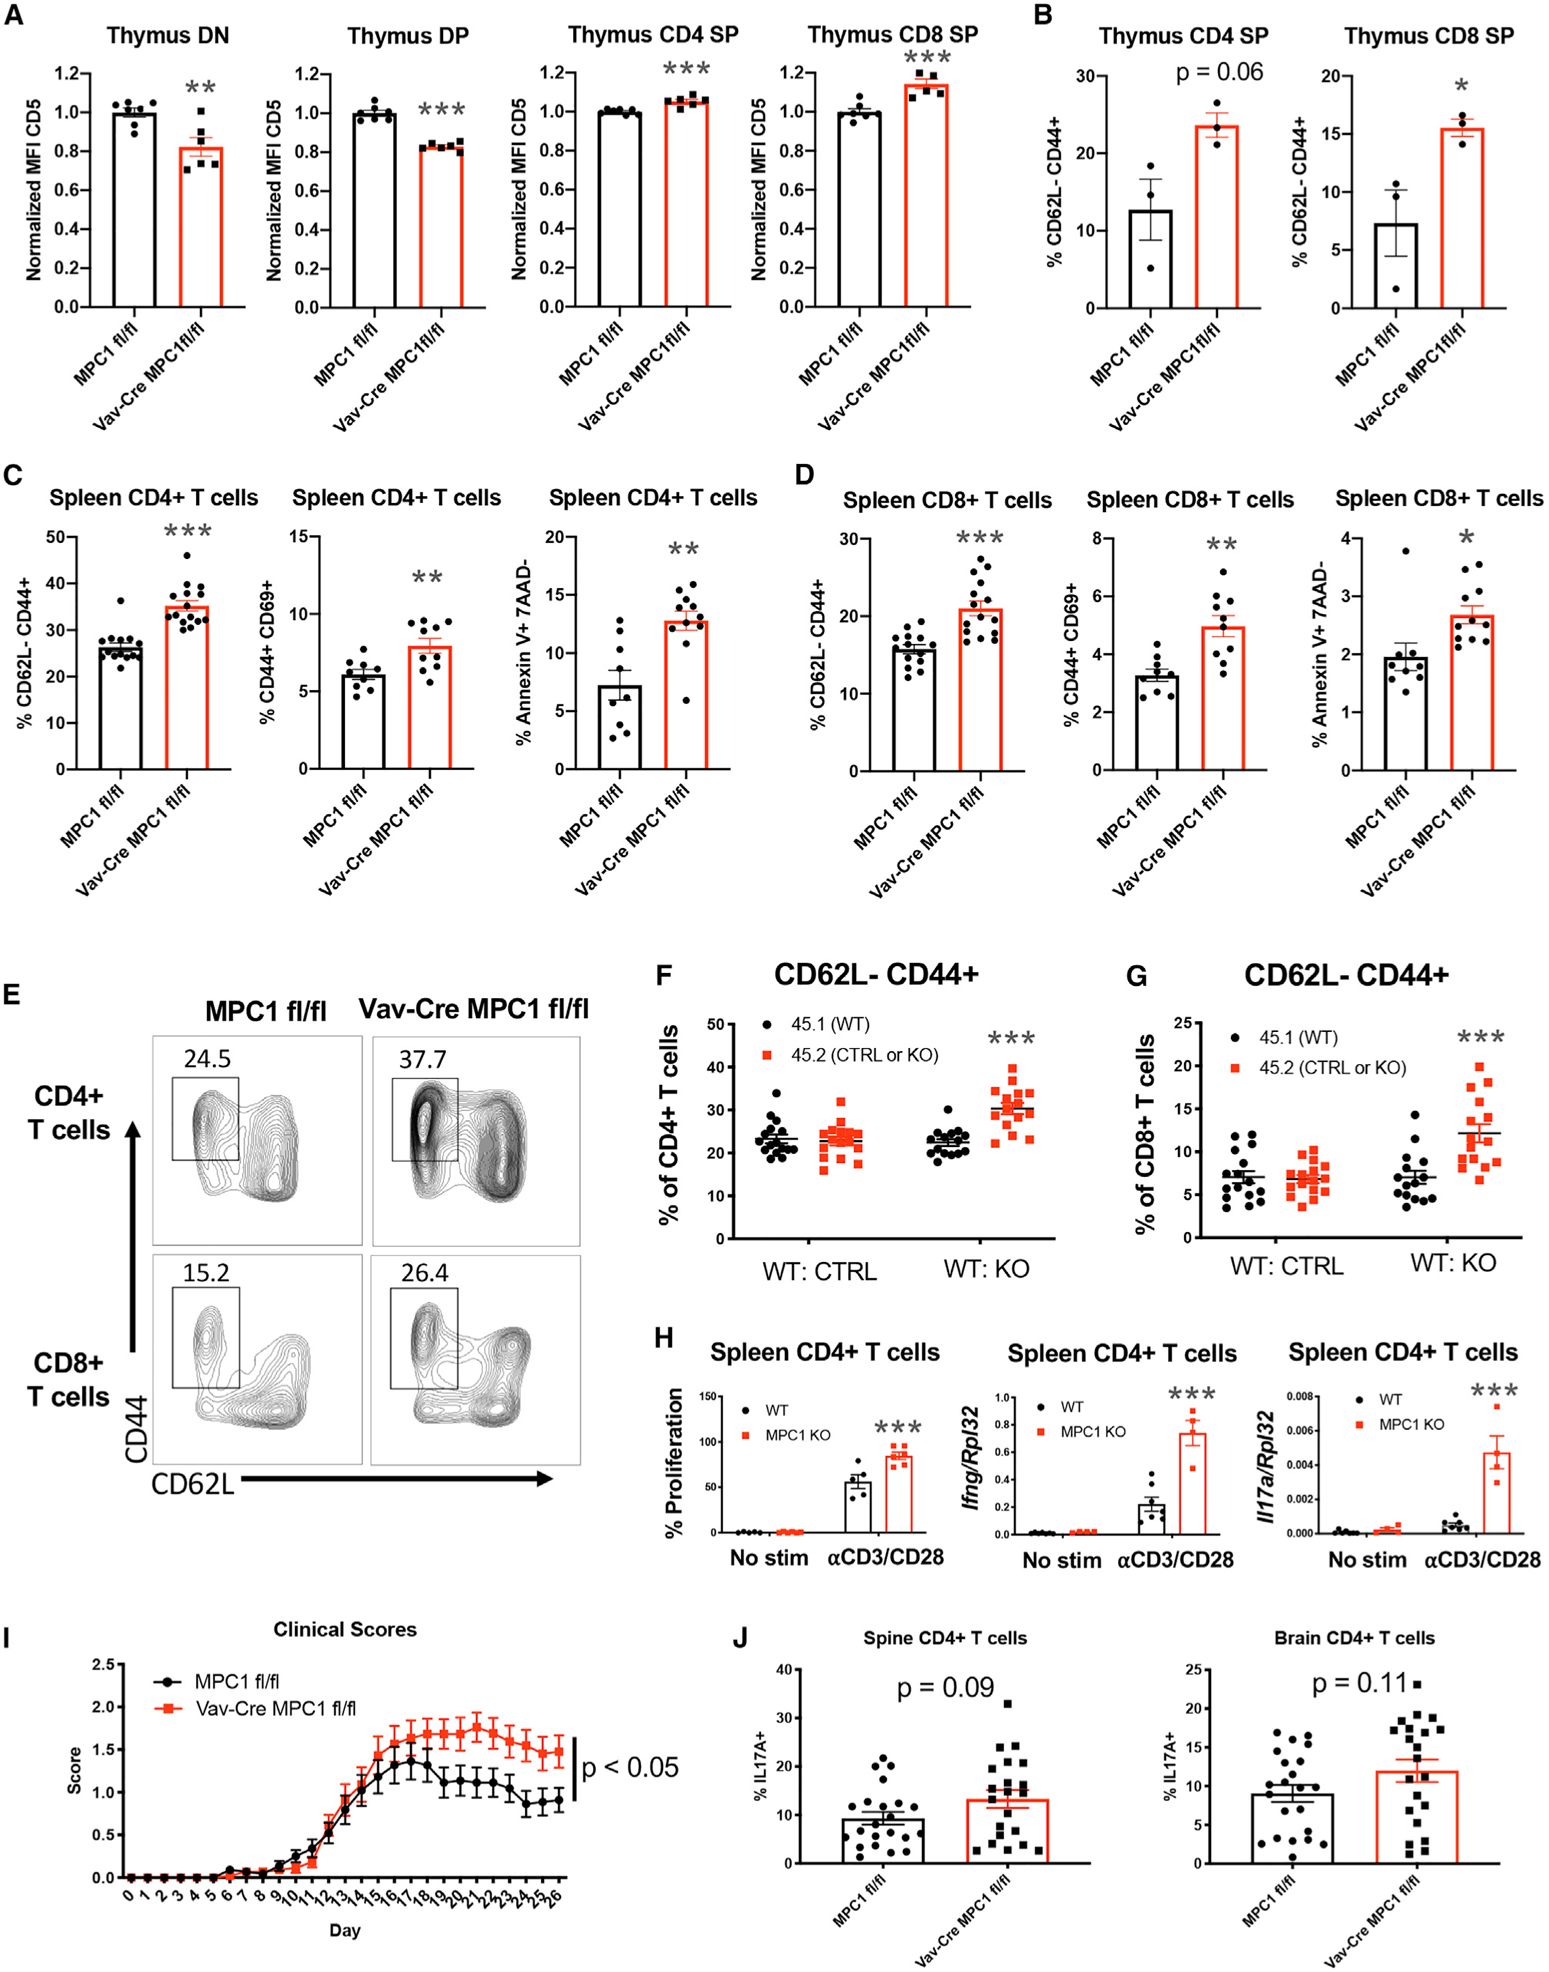
(A) Mean fluorescence intensity for CD5 expression on DN, DP, CD4 SP, and CD8 SP cells.
(B) Percentage of CD73− CD4 SP and CD73− CD8 SP cells that are CD62L− CD44+.
(C and D) Percentages of CD62L− CD44+, CD44+ CD69+, and Annexin V+ 7AAD− expression on splenic CD4+ T cells (C) and CD8+ T cells (D).
(E) Representative flow plot for CD44 and CD62L expression on splenic T cells.
(F and G) Percentage of CD4+ T cells (F) and CD8+ T cells (G) from each donor that are CD62L− CD44+ after two separate mixed bone marrow reconstitutions. Significance compares 45.2 to 45.1 cells.
(H) Percentage of proliferation measured by Cell Trace Violet and gene expression measured by qPCR after in vitro activation of CD4+ T cells with αCD3 and αCD28. Significance compares KO to WT cells within each treatment.
(I) Clinical scores during EAE. n = 22 mice per group from three separate experiments.
(J) Percentage of CD4+ T cells in the spines and brains of EAE mice expressing IL-17A, measured by flow cytometry.
All graphs represent mean ± SEM from multiple experiments. Statistical significance was measured by Student’s t test or two-way ANOVA with Sidak post test (F–I). *p < 0.05, **p < 0.01, ***p < 0.001.
See also Figure S4.
To determine whether these developmental changes affect the periphery, we examined peripheral T cells by RNA-seq. Global analyses showed that MPC1-deficient T cells clustered away from control cells (Figure S4A). GSEA of these data showed increased expression of activation and apoptosis pathways in MPC1-deficient T cells, which was confirmed by flow cytometry (Figures 4C–4E; Figures S4B and S4C). Decreased T cell numbers and increased activation led to a significant loss of MPC1-deficient naive T cells (Figure S4D). Further, increased annexin V staining was observed on CD62L low cells, suggesting increased activation-induced cell death in MPC1-deficient T cells (Figure S4E).
To confirm that this increase in peripheral T cell activation was cell intrinsic, we performed mixed bone marrow chimera experiments. Indeed, T cells derived from CD45.2 Vav-Cre MPC1 fl/fl bone marrow were more activated compared with control CD45.1 cells (Figures 4F and 4G), supporting cell-intrinsic activation of MPC1-deficient T cells. To determine whether this abnormal activation of T cells in Vav-Cre MPC1 fl/fl mice was due to developmental changes, we examined T cell activation in CD4-Cre MPC1 fl/fl mice. Interestingly, T cells from CD4-Cre MPC1 fl/fl mice were not significantly more activated than control T cells (Figure S4F).
Next, total CD4+ T cells were isolated from Vav-Cre MPC1 fl/fl spleens and stimulated with antibodies against CD3 and CD28. These CD4+ T cells proliferated more and had increased expression of Ifng and Il17a transcripts compared with control T cells (Figure 4H). In addition, Vav-Cre MPC1 fl/fl mice had increased clinical scores and disease severity during experimental autoimmune encephalomyelitis (EAE), a CD4+ T cell-mediated neuroin-flammatory model (Furtado et al., 2008; O’Connor et al., 2008; Langrish et al., 2005; Figure 4I). Consistent with disease scores, these Vav-Cre MPC1 fl/fl mice had a trending increase in interleukin-17A (IL-17A)-producing CD4+ T cells but not IFNγ-producing cells in their spinal cords and brains (Figure 4J; Figure S4G). In support of this, when we skewed MPC1-deficient and control CD4+ T cells into Th1, Th17, and Treg cells, we observed no changes in Th1 or Treg differentiation potential but a trending increase in Th17 differentiation in MPC1-deficient cells (Figure S4H). Finally, when we aged mice as we have done previously (Hu et al., 2014), we observed increased inflammation in middle-aged Vav-Cre MPC1 fl/fl mice versus controls, with increased expression of T cell activation markers and increased percentages of CD11b+ myeloid and Ter119+ erythroid cells in the spleen (Figures S4I and S4J). All of these data provide evidence that reduced MPC1 activity in early T cell precursors can result in favored selection of T cells with increased potential for causing abnormal inflammation and autoimmunity.
MPC1-Deficient T Cells Display Increased Glycolysis and Reduced OXPHOS
Next we sought to further determine the effect of MPC1 deletion on the metabolism of T cells. First, GSEA of our RNA-seq data from total splenic T cells found that MPC1-deficient T cells had increased expression of genes in the glycolysis pathway (Figure 5A). Next we performed mass spectrometry on primary splenic T cells and observed increased levels of pyruvic acid and lactic acid and decreased levels of the tricarboxylic acid (TCA) cycle intermediate citric acid in MPC1-deficient versus control T cells (Figure 5B). Further, we observed reduced mitochondrial membrane potential but not mitochondrial mass in MPC1-deficient T cells by flow cytometry (Figure 5C; Figure S5A).
Figure 5. Deletion of MPC1 Decreases Pyruvate Oxidation in CD4+ T Cells.
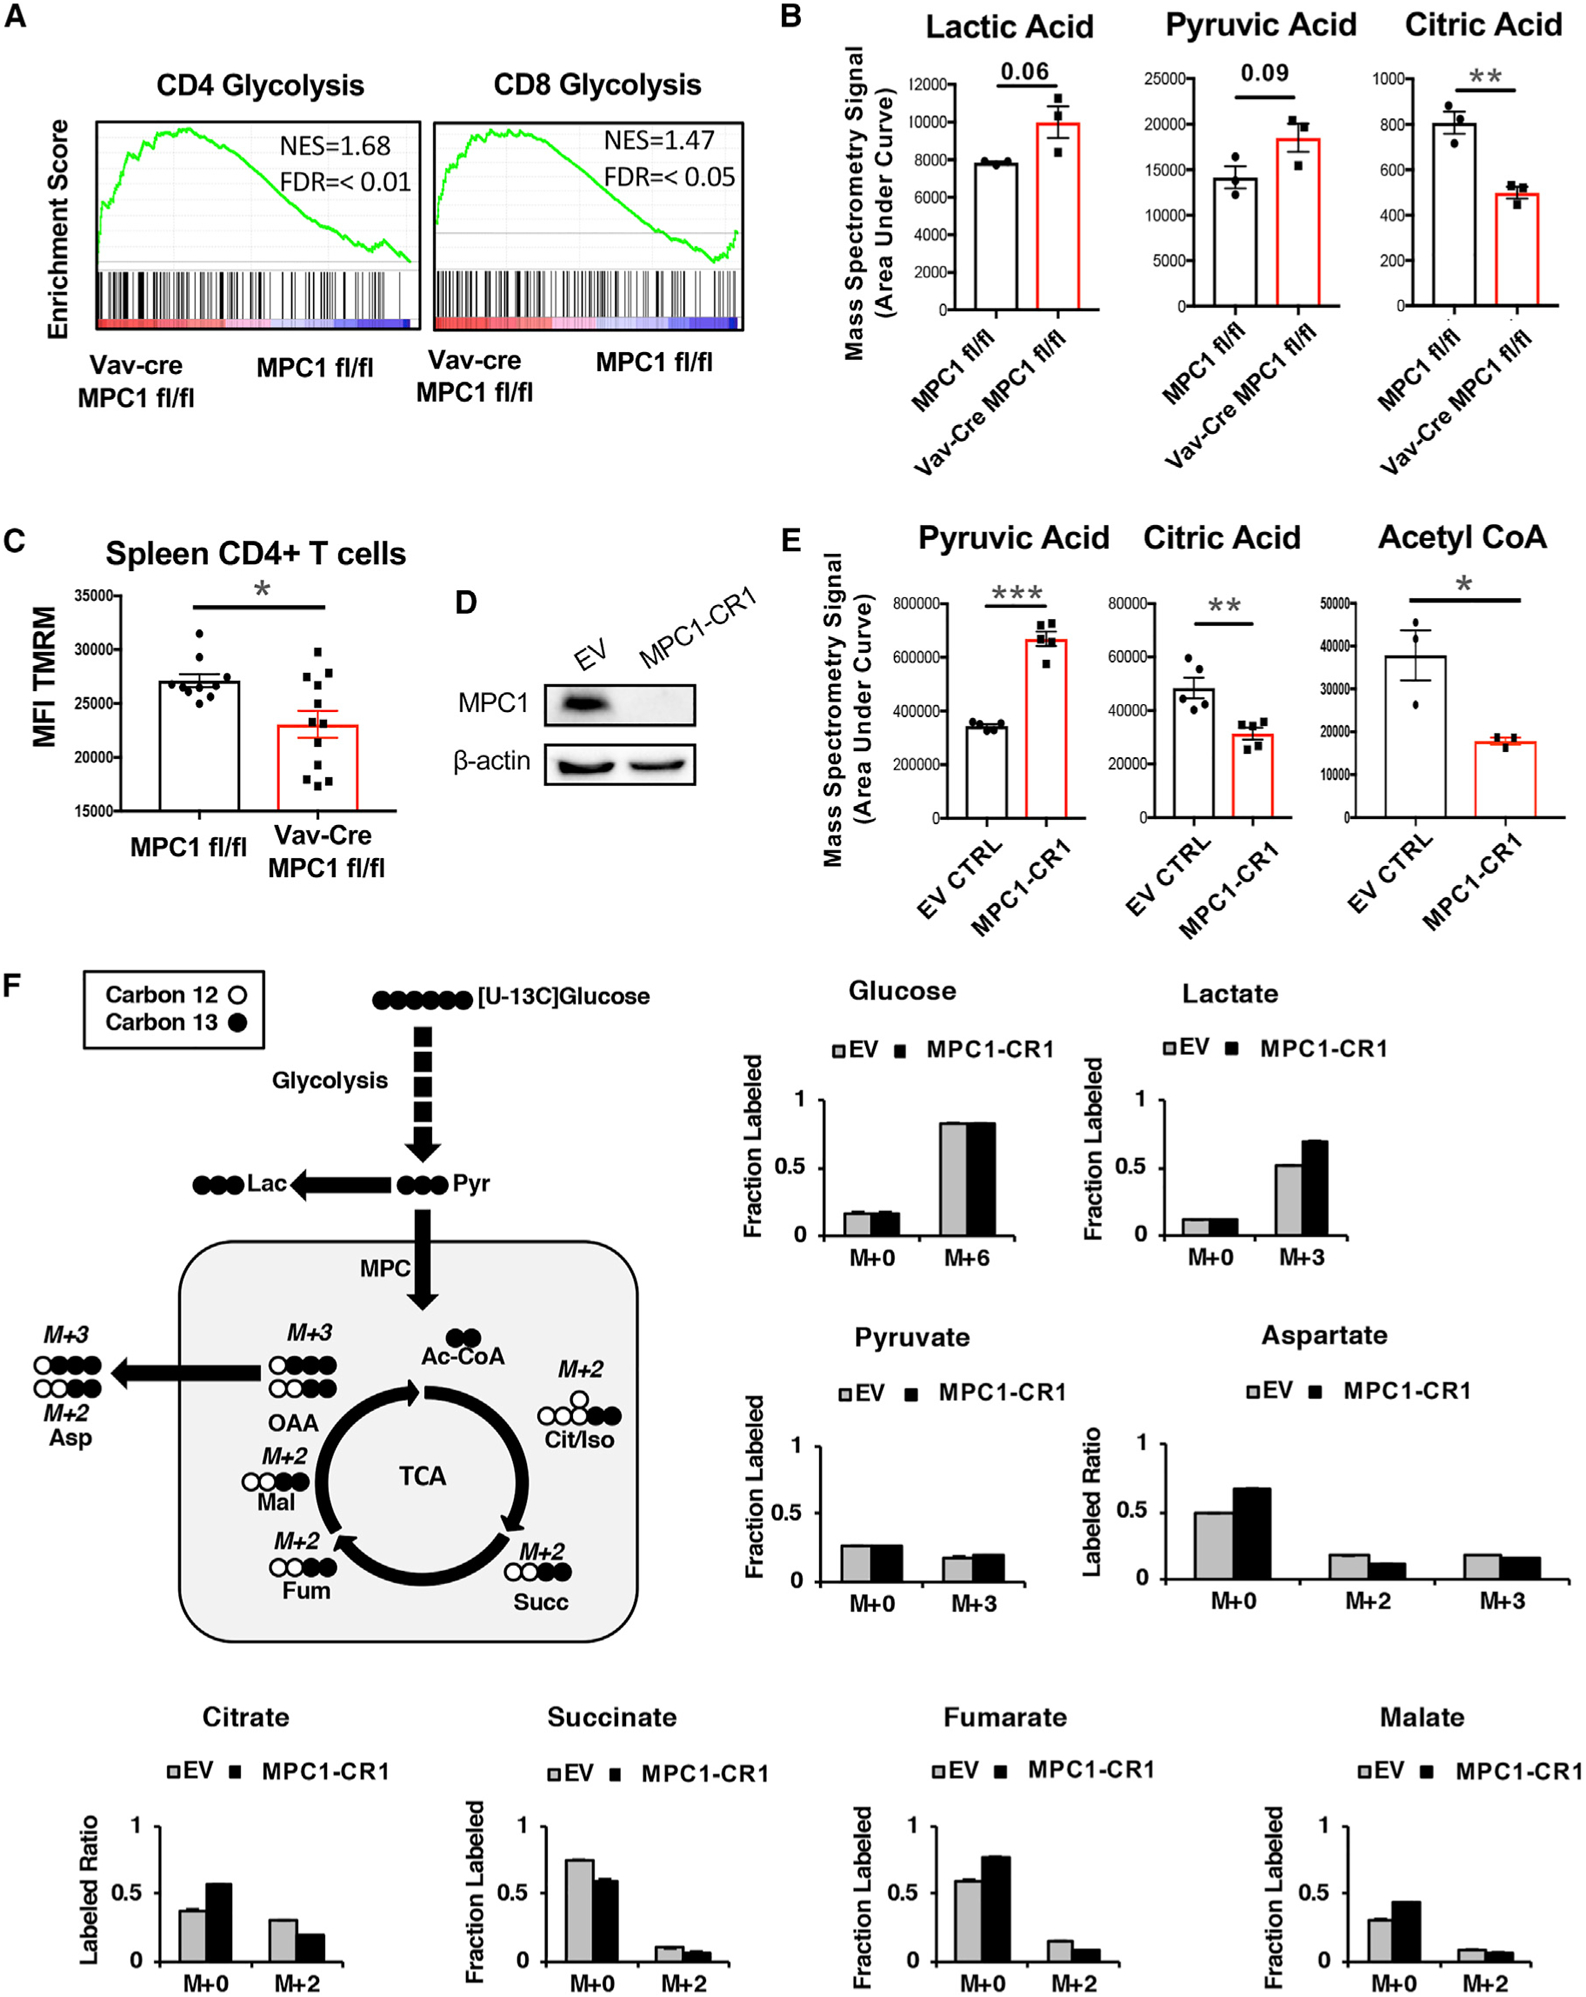
(A) GSEA of the glycolysis pathway in splenic T cells.
(B) Metabolites from primary spleen CD4+ T cells, measured by mass spectrometry.
(C) Mean fluorescence of Tetramethylrhodamine, Methyl Ester, Perchlorate (TMRM) staining on splenic CD4+ T cells, measured by flow cytometry.
(D) Human MPC1 protein expression in Jurkat T cells, measured by western blot.
(E) Metabolites from empty vector (EV) or MPC1-deficient (MPC1-CR1) Jurkat T cells, measured by mass spectrometry.
(F) 13C-glucose tracing after 4-h culture of EV or MPC1-CR1 Jurkat T cells, measured by mass spectrometry in triplicate.
All graphs represent mean ± SEM. Statistical significance was measured by Student’s t test. *p < 0.05, **p < 0.01, ***p < 0.001.
See also Figure S5.
As an additional model, we generated MPC1 KO Jurkat human T cells by using CRISPR-Cas9 technology (Figure 5D; Figure S5B). Consistent with primary mouse cells, we found increased pyruvic acid and decreased citric acid as well as decreased acetyl coenzyme A (CoA) in MPC1 KO Jurkat T cells by mass spectrometry (Figure 5E). We also found increased basal extracellular acidification rate (ECAR) and decreased basal oxygen consumption rate (OCR) in MPC1 KO Jurkat cells by Seahorse analysis (Figure S5C). Finally, we performed 13C-glucose and 13C-glutamine carbon tracing experiments and found increased contribution of glucose carbons to lactate and decreased contribution to TCA intermediates after 4 h in KO Jurkat T cells (Figure 5F). Glutaminolysis appeared to compensate for this lack of glucose oxidation because we found increased carbons from glutamine in these TCA intermediates in KO cells (Figures S5D). In support of this, high doses of the glutaminolysis inhibitor Bis-2-(5-phenylacetamido-1,3,4-thiadiazol-2-yl)ethyl sulfide (BPTES) inhibited proliferation of control and MPC1-deficient T cells stimulated by antibodies against CD3 and CD28 (Figure S5E). Altogether, these data indicate that deletion of MPC1 in T cells enhances homeostatic aerobic glycolysis and compensatory glutaminolysis and reduces homeostatic OXPHOS in mature T cells.
DISCUSSION
Our study examines the hematopoietic role of the MPC and the consequences of blocking pyruvate-specific oxidation in T cells in vivo using a tissue-specific genetic KO. Deletion of Mpc1 in the hematopoietic system led to cell-intrinsic reductions in the number of peripheral αβ T cells, which appeared to be dependent on impaired DN-to-DP transitions, β-selection, and positive selection in the thymus. This impaired thymic development appears to be mediated by alterations to numerous signaling pathways, including Myc, type 1 IFN, MTORC1, AKT, ribosomal gene expression, MondoA activity, and possibly p53. All of these pathways have been shown to regulate T cell development (Yang et al., 2018; Juntilla et al., 2007; Kelly et al., 2007; Dose et al., 2006; Lin et al., 1998; Schmidlin et al., 2006; Anderson et al., 2007; Chen et al., 2016; Saba et al., 2011; Lee et al., 2005). These results suggest that the effect of MPC1 on cell signaling in the thymus is complex, and future studies will be required to interrogate how these distinct pathways work to coordinate T cell development in response to MPC1 activity.
Thymic development of T cells, particularly the early stages, appears to be highly sensitive to metabolic perturbations. Mitochondria appear to play an important role in this process because thymocytes have higher copy numbers of mitochondria compared with peripheral T cells (Pua et al., 2009). Defects in thymic development, particularly the DN-to-DP transition, have been observed upon disruption of multiple pathways important for nutrient sensing and modulating cellular metabolism (Tamás et al., 2010; Ouyang et al., 2019; Zhao et al., 2018; Yang et al., 2018). These include deficiencies in zinc, iron, Raptor, Sin1, Peroxisome proliferator-activated receptor-δ, Glut1, and PKM2 (Dardenne et al., 1993; Wong et al., 2009; King et al., 2002; Brekelmans et al., 1994; Kuvibidila et al., 2001; Zhang et al., 2018; Yamaguchi et al., 1982; Walter et al., 2002; Oexle et al., 1999; Yang et al., 2018; Ouyang et al., 2019; Zhao et al., 2018; Macintyre et al., 2014). Our study adds to this by suggesting that pyruvate uptake into mitochondria is critical during the early steps of thymic αβ T cell development. In contrast, our data suggest that thymic γδ T cell development is not dependent on MPC1 activity. This selective effect on αβ T cell development is similar to what has been observed with genetic deletion of Rpl22, one of the ribosomal genes downregulated in MPC1-deficient thymocytes (Anderson et al., 2007). It will be interesting to identify how developing γδ T cells are able to compensate for lack of MPC1 activity. Finally, although our data suggest a metabolic role of MPC1, we cannot rule out that these phenotypes may be mediated by a non-metabolic role of MPC1, which could be identified in future work.
Beyond numbers, our data also show that the absence of MPC1 may promote development of excessively inflammatory T cells. This is intriguing and suggests that maintaining proper mitochondrial function in thymocytes could limit autoimmunity and abnormal inflammation. Future studies should examine whether MPC1 expression or function in the thymus is affected during aging or inflammatory disease.
In conclusion, we demonstrate that MPC1 activity in the thymus is critical for maintaining homeostatic T cell development while having little effect on other hematopoietic lineages. Therefore, therapeutic targeting of MPC1 activity during T cell development may have the potential to enhance the naive T cell repertoire and limit autoimmune disease, and this will be a focus of future investigations.
STAR★METHODS
LEAD CONTACT AND MATERIALS AVAILABILITY
Further information and requests for resources and reagents should be directed to Ryan O’Connell (ryan.oconnell@path.utah.edu). All unique/stable reagents generated in this study are available from the Lead Contact with a completed Materials Transfer Agreement.
EXPERIMENTAL MODEL AND SUBJECT DETAILS
Mice
Mice described in these studies are on the C57BL/6J genetic background and were housed in the animal facility at the University of Utah. MPC1 floxed mice were described previously (Schell et al., 2017) and crossed to CD4-Cre or Vav-Cre mouse strains obtained from Jackson laboratories. Mice were age- and sex-matched for all experiments and mice from both sexes were reported in data. Mice with an age range of 6–12 weeks were used for most experiments while 9-month-old mice were used for data in Figures S5I and S5J. All experiments were approved by the Institutional Animal Care and Use Committee at the University of Utah.
Cell Lines
To generate MPC1 KO Jurkat T cells, CRISPR/Cas9 lentivector infections were performed as described (Wallace et al., 2016, 2017) by utilizing Trans-IT 293 (Mirus) to transfect 293T cells (ATCC) with the packaging plasmids pVSVg (Stewart et al., 2003) and psPAX2 along with the CRISPR/Cas9 lentiCRISPRv2 construct (Sanjana et al., 2014) (Addgene plasmid #52961) containing a GFP selection marker and one specific short guide RNA sequence against human MPC1 (MPC1-CR1, 5′-GTCGTGAGGCGGGCCTTCG GGCTGGCTCGCCGTCGGCTGCCGGGGGGTTGGCCGGGGTGTCATTGGCTCTGGGAA GCGGCAGCAGAGGCAGGGACCACTC GGGGTCTGGTGTCGGCACAGCCATGGCGGGC GCGTTGGTGCGGAAAGCGGCGGACTATGTCCGAAGCAAGGATTTCCGGGAC TACCTCA TGAGGTGACGAGCGCCGCAGGCCGAACCC-3′) or an empty vector (EV). The 293T cells were then allowed to incubate at 37°C for 3 days.
The Human Jurkat T cell line (ATCC) was then infected for 3 days with the virus-containing supernatant at 37°C. Infected Jurkats were FACS sorted by GFP expression. Deletion of MPC1 in the sorted cells was confirmed by qPCR and western blot using a Rabbit mAb (D2L9I, Cell Signaling Technology).
Primary cell cultures
Spleens, thymi, and mesenteric lymph nodes were removed from mice, homogenized, and filtered through a 40 μM filter. Red blood cells were then lysed with RBC lysis buffer (Biolegend) and resuspended in cell culture media. CD4+ T cells were purified from splenocytes using a CD4+ T cell magnetic column purification kit (Miltenyi Biotec) according to the manufacturer’s recommended protocol or by FACS sorting as described (Hu et al., 2014).
METHODS DETAILS
Cell Culture
Purified CD4+ T cells were resuspended in RPMI media containing 10% FBS, L-glutamine, Pen/Strep antibiotics, HEPES, Sodium Pyruvate, and Non-essential amino acids. To activate CD4+ T cells, a 96 well plate was coated with 200 μl/well of 5 μg/ml LEAF αCD3 (Biolegend) in PBS for at least 4 h at 37°C. 1×10⁵ splenic CD4+ T cells were cultured in the presence of coated αCD3, 2 μg/ml of soluble LEAF αCD28 (Biolegend), and 20ng/mL IL-2 for 72 h in the presence or absence of various chemical inhibitors. Proliferation was measured by staining cells with CellTrace Violet (Thermo Fisher Scientific) following the manufacturer’s recommended protocol before activation and measuring reductions in Cell Trace Violet after activation by flow cytometry.
For Th skewing experiments, CD4+ T cells were cultured as described above with additional cytokines and antibodies added to promote Th1 (20ng/ml IL-12, 10 μg/ml αIL-4), Th17 (5ng/ml TGFβ, 20ng/ml IL-6, 10 μg/ml αIL-4, 10 μg/ml αIFNγ), and Treg (5ng/ml TGFβ, 10 μg/ml αIL-4, 10 μg/ml αIFNγ) skewing. After 72 h, cells were restimulated with PMA/ionomycin in the presence of Golgi-Plug (BD Biosciences) for 4 h. IFNγ, IL-17A, and FoxP3 expression was then measured by flow cytometry. qPCR
Cells were stored in Qiazol lysis reagent (QIAGEN). Total RNA was isolated using the miRNeasy kit (QIAGEN). For qPCR, cDNA was made using the qScript™ kit (QuantaBio). qPCR was performed on an Applied Biosystems QuantStudio 6 Flex or a Roche LightCycler480 using GoTaq (Promega) or PowerUp (Applied Biosystems) SYBR Green Master mixes. Primers for mIFNg and mIL-17A were acquired from the University of Utah DNA synthesis core and primers for mouse and human MPC1 were acquired from IDT. The sequences were: mIFNg F (5′-TCAAGTGGCATAGATGTGGAAGAA-3′), mIFNg R (5′-TGGCTCTGCAG GATTTTCATG-3′), mIL-17A F (5′-CTCCAGAAGGCCCTCAGACTAC-3′), mIL-17A R (5′-GGGTCTTCATTGCGGT GG-3′), mMPC1 F (5′-GCACGGCCATGGCTGGAGC-3′), mMPC1 R (5′-GCAACAGAGGGCG AAAGTCATCCG-3′), hMPC1 F (5′-ATTTGCCTACAAGGT ACAGCC −3′), and hMPC1 R (5′-AGTCATCTCGTGTTTGATAAGCC −3′).
Bone Marrow Chimera
To generate bone marrow chimeras, CD45.1 WT mice (Jackson Labs) were lethally irradiated (900 rad) using an X-ray source (Rad Source RS200 biological system). After irradiation, mice were injected with 3 million RBC-depleted bone marrow cells via retro-orbital injection. Bone marrow cells from CD45.1 WT mice were mixed 1:1 with either CD45.2 MPC1 fl/fl cells or CD45.2 Vav-Cre MPC1 fl/fl cells. Mice were aged 3–4 months after BM reconstitution before analysis.
RNA isolation and sequencing
For RNA-seq, RiboZero treatment/library preparation was performed by the University of Utah DNA Sequencing Core Facility, followed by RNA sequencing using Illumina Hi SEquation 2000 sequencing. Aligned reads were used in DESeq2 as described (Hu et al., 2014).
Single cell RNA sequencing
Thymocytes were collected and processed as described above. Cells were stained with DAPI and DAPI-negative cells were FACS sorted and used for single cell RNA sequencing via 10X platform (High-throughput Genomics Core, University of Utah). Analysis of scRNA-Seq data was done using Seurat R package (Stuart et al., 2019). Data were integrated and clusters were named as described previously (Ekiz et al., 2019) using an in-house developed algorithm that scores unknown cluster gene signatures against the known immune cells in the Immunological Genome Project (ImmGen) database.
Flow cytometry
Fluorophore-conjugated Abs against the indicated surface markers (eBioscience, Biolegend) were used to stain RBC-depleted splenocytes, thymocytes, or MLNs. For mitochondrial stains, cells were first stained for surface markers, then stained for 15–20 min at 37°C with Tetramethylrhodamine, methyl ester (Thermo Fisher Scientific) or MitoTracker Green (Thermo Fisher Scientific) diluted in cell culture media. Dilutions were made according to manufacturer’s recommendations. After staining, cells were washed with PBS, then resuspended in PBS for analysis. Stained cells were analyzed with a BD LSR Fortessa flow cytometer. Data were analyzed with FlowJo software.
Seahorse
Empty vector (EV) and MPC1-CR1 Jurkat T cells were grown in complete RPMI media. Thymocytes were freshly isolated as described. Equivalent numbers of WT and KO thymocytes (1.3–1.8 X10⁶ cells/well) or EV and MPC1-CR1 Jurkat T cells (360, 000 cells/well) were seeded into a 96-well Seahorse XF-96 plate. The Seahorse XF Mito Stress and Glycolysis Stress tests were performed using a Seahorse XF-96 analyzer by the Metabolic Phenotyping Core Facility at the University of Utah, USA. For the Mito Stress test, concentrations of the following were added into the injection ports: 10 μM oligomycin A (A), 20 μM FCCP (B), 10 μM antimycin A + 10 μM rotenone (C). For the Glycolysis Stress test, concentrations of the following were added into the injection ports: 100 mM glucose (A), 10 μM Oligomycin (B), 500 mM 2-deoxyglucose (C). Glucose and pyruvate-free assay media were used during the Glycolysis stress test, and cultured cells were washed with assay media before beginning Seahorse assays.
Experimental Autoimmune Encephalomyelitis
EAE was performed as we have done previously (O’Connell et al., 2010). Briefly, mice were injected s.c. with 100 ug MOG35–55 peptide (Tocris) emulsified in CFA. Mice were also injected i.p. with 200 ng pertussis toxin on days 0 and 2. Clinical scores and weights were recorded regularly. Clinical symptoms were scored on the following criteria: 0, no symptoms; 0.5, partially limp tail; 1, completely limp tail; 1.5, impaired righting reflex; 2, partial hind-limb paralysis; 2.5, complete hind-limb paralysis; 3, forelimb weakness; 4, complete paralysis; 5, death. At the endpoint of the experiment, brains and spines were isolated and homogenized. Leukocytes were isolated from spines and brains using Percoll gradients. Leukocytes were then restimulated with PMA/ionomycin for 6 h with Golgi Plug. IFNγ and IL-17A production was then analyzed by flow cytometry.
Liquid chromatography-mass spectrometry
FACS sorted CD4+ T cells from splenocytes were cultured overnight in cell culture media. Jurkat T cells were grown up in cell culture media. Media was then removed and cells were washed, then flash frozen with liquid N2 and kept on dry ice or at −80°C at all times. Samples were extracted using methanol chilled to −80°C solution of 0.08 ug d9-Carnitine standard per sample. Samples were vortexed for 30 s, then incubated for 1 h at −80°C. After incubation the samples were centrifuged for 10 min at 20,000 RCF at 4°C. 10 uL of supernatant from each sample was combined to make the QC. A process blank (Pb) containing 20 uL of distilled H2O was carried throughout the extraction process. The sample supernatant, Pb, and QC were run immediately.
Samples were analyzed in positive mode MRM using a Sciex Excion LC coupled to a Sciex 6500 Q-Trap (Sciex, Farmington, MA). Separation was achieved using a BEH amide 2.1 × 150 mm column. An initial starting concentration of 20% aqueous solution with 10 mM Ammonium Carbonate (Buffer A) and ACN (Buffer B) was maintained for 3 min, then increased linearly to 60% Buffer A at9.8 min. Buffer A was then further increased to the final concentration 70% at 12.8 min with a total run time of 15.86 min. The conditions were reset over 2 min, and the system was allowed to re-equilibrate for 10 min. Flow rate for the entire run was 0.3 mL/min with a 5 uL injection volume. Source settings were CUR = 25.0 L/min, CAD = High, IS = 3800 V, TEM = 500°C, GS 1 = 50 L/min, GS 2 = 40 L/min. Transitions used were NAD+ (664.1 - > 136.0, CE = 40 V), NADP+ (744.1 - > 135.8, CE = 40 V), NADPH (746.1 - > 302.0, CE = 40 V), NADH (666 - > 649.1, CE = 20 V), GSH (308.1 - > 179.0 CE = 15 V), GSSG (613.2 - > 231.0, CE = 40 V), ATP (508.0 - > 136.1, CE = 20 V), ADP (428 - > 136.1, CE = 20 V), AMP (348.1 - > 136.1, CE = 20 V), Acetyl-CoA (810.1 - > 303.1, CE = 20 V), CoASH (768.1 - > 261.0, CE = 32 V), IMP (371.0 - > 121.0, CE 20 V), Succinyl-CoA (868.1 - > 410.2, CE = 40 V), GMP (364.1 - > 152.1, CE = 10 V), Malonyl-CoA (854.123 - > 347.1, CE = 20 V), d9-carnitine (171.0 - > 103, CE = 20 V). Data were analyzed using Sciex Multiquant software.
Gas chromatography-mass spectrometry
Jurkat T cells were grown up in cell culture media. Media was then removed and cells were washed, then flash frozen with liquid N2 and extracted using chilled 90% methanol solution containing the internal standard d4-succinic acid to give a final concentration of 80% methanol to cell pellet. The samples were vortexed, sonicated for 5 min, and then incubated at −20°C for 1 hr. After incubation the samples were centrifuged at 20,000 × g for 10 min at 4°C. The supernatant was transferred from each sample tube into a labeled, fresh micro centrifuge tubes. Another internal standard, d27-myristic acid, was added to each sample. Pooled quality control samples were made by removing a fraction of collected supernatant from each sample. Process blanks were made using only extraction solvent and no cell culture and went through the same steps as each sample. The samples were then dried en vacuo.
GC-MS analysis was performed with an Agilent 7200 GC-MS QTOF and an Agilent 7693A automatic liquid sampler. Dried samples were suspended in 40 μL of a 40 mg/mL O-methoxylamine hydrochloride (MOX) in pyridine and incubated for one h at 37°C. 20 μL of this solution was added to auto sampler vials. 60 μL of N-methyl-N-trimethylsilyltrifluoracetamide (MSTFA) was added automatically via the auto sampler and incubated for 30 min at 37°C. After incubation, samples were vortexed and 1 μL of the prepared sample was injected into the gas chromatograph inlet in the split mode with the inlet temperature held at 250°C. A 10:1 split ratio was used for analysis. The gas chromatograph had an initial temperature of 60°C for one min followed by a 10°C/min ramp to 325°C and a hold time of 2 min. A 30-m Agilent Zorbax DB-5MS with 10 m Duraguard capillary column was employed for chromatographic separation. Helium was used as the carrier gas at a rate of 1 mL/min. Data were collected using MassHunter software (Agilent). Metabolites were identified and their peak area was recorded using MassHunter Quant. This data were transferred to an Excel spread sheet (Microsoft, Redmond WA). Metabolite identity was established using a combination of an in-house metabolite library developed using pure purchased standards, the NIST library and the Fiehn library.
[U-13]-Glucose and [U-13]-Glutamine Labeling
Jurkat T Cells were grown to 80% confluence in standard culture medium and washed with sterile PBS. Then, culture medium in which glucose or glutamine was replaced by [13C6]-L-glucose or [13C5]-L-glutamine (Cambridge Isotope Laboratories) respectively, supplemented with dialyzed Fetal Bovine Serum (GIBCO) was added to the cells. Cells were allowed to grow in labeled media for 4 h to reach steady-state. The procedures for metabolite extraction from cultured cells are described in previous studies (Cluntun et al., 2015; Lukey et al., 2019). Briefly, Jurkat suspension cells were collected into Eppendorf tubes and spun down at 300 rcf. for 5min at 4°C. Media was removed (13C-labeled media was collected), 1ml of 0.9% LC grade saline was added, and cells were washed twice. Then, 1mL of extraction solvent (80% methanol/water) cooled to −80°C was added to each tube, and transferred to a −80°C freezer for 15 min. Each sample was then vortexed a couple of times (30 s each). All metabolite extracts were centrifuged at 20,000 Relative Centrifugal Force (RCF) at 4C for 10 min. Each sample was then split into two new 1.5 mL tube. Finally, the solvent in each sample was evaporated in a Speed Vacuum, and stored at −80°C until they were run by GC-MS.
GC-MS analysis was performed with a Waters GCT Premier mass spectrometer fitted with an Agilent 6890 gas chromatograph and a Gerstel MPS2 autosampler. Dried samples were suspended in 40 μL of a 40 mg/mL O-methoxylamine hydrochloride (MOX) in pyridine and incubated for one h at 30°C. 10 μL of N-methyl-N-trimethylsilyltrifluoracetamide (MSTFA) was added automatically via the autosampler and incubated for 60 min at 37°C with shaking. After incubation 3 μL of a fatty acid methyl ester standard solution was added via the autosampler. Then 1 μL of the prepared sample was injected to the gas chromatograph inlet in the split mode with the inlet temperature held at 250°C. A 10:1 split ratio was used for analysis. The gas chromatograph had an initial temperature of 95°C for one minfollowed by a 40°C/min ramp to 110°C and a hold time of 2 min. This was followed by a second 5°C/min ramp to 250°C, a third ramp to 350°C, then a final hold time of 3 min. A 30 m Phenomex ZB5–5 MSi column with a 5 m long guard column was employed for chromatographic separation. Helium was used as the carrier gas at 1 mL/mi. Data were extracted from each chromatogram as area under the curve for individual metabolites. Each sample was first normalized to the added standard d4-succinate to account for extraction efficiency followed by normalization to cell number.
QUANTIFICATION AND STATISTICAL ANALYSIS
Statistics
Data were analyzed by Student’s t test or ANOVA as indicated using GraphPad Prism 7. In scRNA-seq experiments, gene expression differences among groups were calculated using Wilcoxon test with a Benjamini-Hochberg correction for multiple testing. The p values are represented by asterisks as follows: *p < 0.05, ** p < 0.01, ***p < 0.001. Statistical details of individual experiments can be found in figure legends.
Supplementary Material
KEY RESOURCES TABLE
| REAGENT or RESOURCE | SOURCE | IDENTIFIER |
|---|---|---|
| Antibodies | ||
| Rat anti-mouse CD3 Clone 17A2 | Biolegend | Cat#100222 |
| Rat anti-mouse CD4 Clone GK1.5 | Biolegend | Cat#100428 |
| Rat anti-mouse CD8 Clone 53-6.7 | Biolegend | Cat#100734 |
| Rat anti-mouse B220 Clone RA3-6B2 | Biolegend | Cat#103206 |
| Rat anti-mouse CD11b Clone M1/70 | Biolegend | Cat#101228 |
| Rat anti-mouse Gr-1 Clone RB6-8C5 | Biolegend | Cat#108408 |
| Mouse anti-mouse NK1.1 Clone PK136 | Biolegend | Cat#108728 |
| Mouse anti-mouse CD45.1 Clone A20 | Biolegend | Cat#110714 |
| Mouse anti-mouse CD45.2 Clone 104 | Biolegend | Cat#109830 |
| Armenian hamster anti-mouse TCRbeta Clone H57-597 | Biolegend | Cat#109220 |
| Rat anti-mouse/human CD44 Clone IM7 | Biolegend | Cat#103006 |
| Rat anti-mouse CD98 Clone RL388 | Biolegend | Cat#128208 |
| Rat anti-mouse CD5 Clone 53-7.3 | Biolegend | Cat#100606 |
| Armenian hamster anti-mouse CD69 Clone H1.2F3 | Biolegend | Cat#104508 |
| Rat anti-mouse CD62L Clone MEL-14 | Biolegend | Cat#104412 |
| Annexin V | Biolegend | Cat#640918 |
| 7-AAD Viability Staining Solution | Biolegend | Cat#420404 |
| Rat anti-mouse CD117 Clone ACK2 | Biolegend | Cat#135106 |
| Ultra-LEAF anti-mouse CD3e | Biolegend | Cat#100372 |
| Ultra-LEAF anti-mouse CD28 | Biolegend | Cat#102132 |
| Ultra-LEAF anti-mouse IFNγ | Biolegend | Cat#505847 |
| Ultra-LEAF anti-mouse IL-4 | Biolegend | Cat#504135 |
| Armenian hamster anti-mouse TCRγ/δ Clone GL3 | Biolegend | Cat#118106 |
| Rat anti-mouse FoxP3 Clone FJK-16 s | eBioscience | Cat#45-5773-82 |
| Rat anti-mouse IFNγ Clone XMG1.2 | eBioscience | Cat#12-7311-82 |
| Rat anti-mouse IL-17A Clone eBio17B7 | eBioscience | Cat#17-7177-81 |
| Rat anti-mouse CD71 Clone R17217 | eBioscience | Cat#12-0711-82 |
| Rat anti-mouse CD25 Clone PC61.5 | eBioscience | Cat#17-0251-82 |
| Rabbit anti-Phospho-AKT (Thr308) (D25E6) | Cell Signaling Technology | Cat#13842S |
| Rabbit anti-MPC1 (D2L9I) | Cell Signaling Technology | Cat#14462S |
| Bacterial and Virus Strains | ||
| pVSVG | Stewart et al., 2003 | Addgene plasmid #8454 |
| PsPAX2 | Didier Trono | Addgene plasmid #12260 |
| Chemicals, Peptides, and Recombinant Proteins | ||
| [U-13]-Glucose | Cambridge Isotope Lab | Cat#CLM139610 |
| [U-13]-Glutamine | Cambridge Isotope Lab | Cat#CLM1822-H-0.1 |
| Dialyzed FBS | GIBCO | Cat#A33820-01 |
| MOG (35-55) | TOCRIS | Cat#2568 |
| M. tuberculosis Des. H37 Ra | Fisher Scientific | Cat#DF3114-33-8 |
| Pertussis Toxin, Bordetella pertussis | Millipore Sigma | Cat#516560-50UG |
| BPTES | TOCRIS | Cat#5301 |
| (R)-(+)-Etomoxir sodium salt | TOCRIS | Cat#4539 |
| Rac Cycloserine | Santa Cruz Biotechnology | Cat#sc-212728 |
| 2-Deoxy-D-glucose | Sigma-Aldrich | Cat#D8375-1G |
| Recombinant human TGF-P1 (carrier-free) | Biolegend | Cat#580702 |
| Recombinant mouse IL-6 (carrier-free) | Biolegend | Cat#575704 |
| Recombinant mouse IL-12 (p70) (carrier-free) | Biolegend | Cat#577002 |
| Recombinant mouse IL-2 (carrier-free) | Biolegend | Cat#575402 |
| Critical Commercial Assays | ||
| Image-iT TMRM Reagent | Thermo Fisher Scientific | Cat#I34361 |
| MitoTracker Green FM | Thermo Fisher Scientific | Cat#M7514 |
| CellTrace Violet Cell Proliferation Kit | Thermo Fisher Scientific | Cat#34557 |
| Seahorse XF Cell Mito Stress Test Kit | Agilent | Cat#103708-100 |
| Seahorse XF Glycolysis Stress Test Kit | Agilent | Cat#103020-100 |
| Chromium Single Cell 5’ Library and Gel Bead Kit | 10X Genomics | PN-1000006 |
| Chromium Single Cell 5’ Library Construction Kit | 10X Genomics | PN-1000020 |
| Chromium Single Cell A Chip Kit | 10X Genomics | PN-120236 |
| Deposited Data | ||
| RNA-seq | This Paper |
GSE122711 (https://www.ncbi.nlm.nih.gov/geo/query/acc.cgi?acc=GSE122711) |
| Single cell RNA-seq | This Paper |
GSE138718 (https://www.ncbi.nlm.nih.gov/geo/query/acc.cgi?acc=GSE138718). |
| Experimental Models: Cell Lines | ||
| Jurkat, Clone E6-1 | ATCC | ATCC® TIB-152 |
| 293T | ATCC | ATCC® CRL-3216 |
| MPC1-CR1 Jurkat | This paper | N/A |
| MPC1-EV Jurkat | This paper | N/A |
| Experimental Models: Organisms/Strains | ||
| Mouse: MPC1fl/fl | Schell etal., 2017 | N/A |
| Mouse: CD4-Cre MPC1fl/fl | This paper | N/A |
| Mouse: Vav-Cre MPC1fl/fl | This paper | N/A |
| Mouse: C57BL/6J CD45.1 | The Jackson Laboratory | Cat#002014 |
| Oligonucleotides | ||
| MPC1-CR1 sgRNA, 5’-GTCGTGAGGCGGGCCT TCGGGCTGGCTCGCCGTCGGCTGCCGGGGG GTTGG CCGGGGTGTCATTGGCTCTGGGAAGC GGCAGCAGAGGCAGGGACCACTCGGGGTCT GGTGTCGGCACAGCCATGGCGGGCGCGTTGGT GCGGAAAGCGGCGGACTATGTCCGAAGCAAGG ATTTCCGGGACTACCTCATGAGGTGACGAGC G CCGCAGGCCGAACCC-3’ | This Paper | N/A |
| mIFNg F (5’-TCAAGTGGCATAGATGTGGAAGAA-3’) | This Paper | N/A |
| mIFNg R (5’-TGGCTC TGCAGGATTTTCATG-3’) | This Paper | N/A |
| mIL-17A F (5’-CTCCAGAAGGCCCTCAGACTAC-3’) | This Paper | N/A |
| mIL-17A R (5’-GGGTCTTCATTGCGGTGG-3’) | This Paper | N/A |
| mMPC1 F (5’-GCACGGCCATGGCTGGAGC-3’) | This Paper | N/A |
| mMPC1 R (5’-GCAACAGAGGGCGAAAGTCATC CG-3’) | This Paper | N/A |
| hMPC1 F (5’-ATTTGCCTACAAGGTACAGCC-3’) | This Paper | N/A |
| hMPC1 R (5’-AGTCATCTCGTGTTTGATAAGCC-3’) | This Paper | N/A |
| Recombinant DNA | ||
| CRISPR/Cas9 lentiCRISPRv2 construct | Sanjana et al., 2014 | Addgene plasmid #52961 |
| Software and Algorithms | ||
| GSEA | Broad Institute | https://www.gsea-msigdb.org/gsea/index.jsp |
| Seurat R package | Stuart et al., 2019 | https://satijalab.org/seurat/ |
| CIPR Shiny App | Ekiz etal., 2019 | https://github.com/atakanekiz/CIPR-Shiny |
| FlowJo | FlowJo, LLC | https://www.flowjo.com/solutions/flowjo/downloads |
Highlights.
Deletion of MPC1 by Vav-Cre results in a cell-intrinsic reduction of αβ T cells
This is caused by defects in several steps during thymic development
MPC1 deficiency results in alterations to multiple pathways in early thymocytes
Deletion of MPC1 by Vav-Cre also results in abnormal activation of αβ T cells
ACKNOWLEDGMENTS
We would like to thank Dr. James Cox and Tyler Van Ry for assistance with mass spectrometry and James Marvin for assistance with flow cytometry. Seahorse assays were performed by Dr. Anil Laxman at the University of Utah Metabolic Phenotyping Cores. CRISPR-Cas9 plasmids targeting MPC1 were developed by Dr. Timothy Dahlem at the University of Utah Mutation Generation and Detection Core. For RNA-seq, we thank Opal Allen, Brian Dalley, Chris Stubben, and Chris Conley at the High-Throughput Genomics and Bioinformatic Analysis Shared Resource at the Huntsman Cancer Institute, which was supported by the National Institutes of Health (NIH) National Cancer Institute under award P30CA042014. This work was also funded by an NIH National Institute on Aging grant (5R01AG047956-04); an NIH National Institute of Neurological Disorders and Stroke grant (NS041249); NIH National Institute of Allergy and Infectious Diseases T32 training grants (AI055434 and AI138945-01); a National Multiple Sclerosis Society Collaborative Research Center grant (CA-1607-25040); and the Howard Hughes Medical Institute.
Footnotes
DECLARATION OF INTERESTS
The authors declare no competing interests.
SUPPLEMENTAL INFORMATION
Supplemental Information can be found online at https://doi.org/10.1016/j.celrep.2020.02.042.
DATA AND CODE AVAILABILITY
RNA-seq data has been deposited in NCBI’s Gene Expression Omnibus (Edgar et al., 2002) and are accessible through GEO accession number GSE122711 (https://www.ncbi.nlm.nih.gov/geo/query/acc.cgi?acc=GSE122711). Single cell RNA-seq data has been deposited in NCBI’s Gene Expression Omnibus and are accessible through GEO Series accession number GSE138718 (https://www.ncbi.nlm.nih.gov/geo/query/acc.cgi?acc=GSE138718).
REFERENCES
- Almeida L, Lochner M, Berod L, and Sparwasser T (2016). Metabolic pathways in T cell activation and lineage differentiation. Semin. Immunol 28, 514–524. [DOI] [PubMed] [Google Scholar]
- Anderson SJ, Lauritsen JP, Hartman MG, Foushee AM, Lefebvre JM, Shinton SA, Gerhardt B, Hardy RR, Oravecz T, and Wiest DL (2007). Ablation of ribosomal protein L22 selectively impairs alphabeta T cell development by activation of a p53-dependent checkpoint. Immunity 26, 759–772. [DOI] [PubMed] [Google Scholar]
- Azzam HS, Grinberg A, Lui K, Shen H, Shores EW, and Love PE (1998). CD5 expression is developmentally regulated by T cell receptor (TCR) signals and TCR avidity. J. Exp. Med 188, 2301–2311. [DOI] [PMC free article] [PubMed] [Google Scholar]
- Bantug GR, Fischer M, Grahlert J, Balmer ML, Unterstab G, Develioglu L, Steiner R, Zhang L, Costa ASH, Gubser PM, et al. (2018). Mitochondria-Endoplasmic Reticulum Contact Sites Function as Immunometabolic Hubs that Orchestrate the Rapid Recall Response of Memory CD8+ T Cells. Immunity 48, 542–555.e6. [DOI] [PMC free article] [PubMed] [Google Scholar]
- Beier UH, Angelin A, Akimova T, Wang L, Liu Y, Xiao H, Koike MA, Hancock SA, Bhatti TR, Han R, et al. (2015). Essential role of mitochondrial energy metabolism in Foxp3+ T-regulatory cell function and allograft survival. FASEB J. 29, 2315–2326. [DOI] [PMC free article] [PubMed] [Google Scholar]
- Biancone L, Bowen MA, Lim A, Aruffo A, Andres G, and Stamenkovic I (1996). Identification of a novel inducible cell-surface ligand of CD5 on activated lymphocytes. J. Exp. Med 184, 811–819. [DOI] [PMC free article] [PubMed] [Google Scholar]
- Brekelmans P, van Soest P, Leenen PJ, and van Ewijk W (1994). Inhibition of proliferation and differentiation during early T cell development by anti-transferrin receptor antibody. Eur. J. Immunol 24, 2896–2902. [DOI] [PubMed] [Google Scholar]
- Bricker DK, Taylor EB, Schell JC, Orsak T, Boutron A, Chen YC, Cox JE, Cardon CM, Van Vranken JG, Dephoure N, et al. (2012). A mitochondrial pyruvate carrier required for pyruvate uptake in yeast, Drosophila, and humans. Science 337, 96–100. [DOI] [PMC free article] [PubMed] [Google Scholar]
- Buck MD, O’Sullivan D, and Pearce EL (2015). T cell metabolism drives immunity. J. Exp. Med 212, 1345–1360. [DOI] [PMC free article] [PubMed] [Google Scholar]
- Chapman NM, Zeng H, Nguyen TM, Wang Y, Vogel P, Dhungana Y, Liu X, Neale G, Locasale JW, and Chi H (2018). mTOR coordinates transcriptional programs and mitochondrial metabolism of activated Treg subsets to protect tissue homeostasis. Nat. Commun 9, 2095. [DOI] [PMC free article] [PubMed] [Google Scholar]
- Chen L, Foreman DP, Sant’Angelo DB, and Krangel MS (2016). Yin Yang 1 Promotes Thymocyte Survival by Downregulating p53. J. Immunol 196, 2572–2582. [DOI] [PMC free article] [PubMed] [Google Scholar]
- Ciofani M, and Zúñiga-Pflücker JC (2005). Notch promotes survival of pre-T cells at the beta-selection checkpoint by regulating cellular metabolism. Nat. Immunol 6, 881–888. [DOI] [PubMed] [Google Scholar]
- Cluntun AA, Huang H, Dai L, Liu X, Zhao Y, and Locasale JW (2015). The rate of glycolysis quantitatively mediates specific histone acetylation sites. Cancer Metab. 3, 10. [DOI] [PMC free article] [PubMed] [Google Scholar]
- Dardenne M, Boukaiba N, Gagnerault MC, Homo-Delarche F, Chappuis P, Lemonnier D, and Savino W (1993). Restoration of the thymus in aging mice by in vivo zinc supplementation. Clin. Immunol. Immunopathol 66, 127–135. [DOI] [PubMed] [Google Scholar]
- Dose M, Khan I, Guo Z, Kovalovsky D, Krueger A, von Boehmer H, Khazaie K, and Gounari F (2006). c-Myc mediates pre-TCR-induced proliferation but not developmental progression. Blood 108, 2669–2677. [DOI] [PMC free article] [PubMed] [Google Scholar]
- Edgar R, Domrachev M, and Lash AE (2002). Gene Expression Omnibus: NCBI gene expression and hybridization array data repository. Nucleic Acids Res. 30, 207–210. [DOI] [PMC free article] [PubMed] [Google Scholar]
- Ekiz HA, Huffaker TB, Grossmann AH, Stephens WZ, Williams MA, Round JL, and O’Connell RM (2019). MicroRNA-155 coordinates the immunological landscape within murine melanoma and correlates with immunity in human cancers. JCI Insight 4, 6. [DOI] [PMC free article] [PubMed] [Google Scholar]
- el-Deiry WS, Tokino T, Velculescu VE, Levy DB, Parsons R, Trent JM, Lin D, Mercer WE, Kinzler KW, and Vogelstein B (1993). WAF1, a potential mediator of p53 tumor suppression. Cell 75, 817–825. [DOI] [PubMed] [Google Scholar]
- Fulton RB, Hamilton SE, Xing Y, Best JA, Goldrath AW, Hogquist KA, and Jameson SC (2015). The TCR’s sensitivity to self peptide-MHC dictates the ability of naive CD8(+) T cells to respond to foreign antigens. Nat. Immunol 16, 107–117. [DOI] [PMC free article] [PubMed] [Google Scholar]
- Furtado GC, Marcondes MC, Latkowski JA, Tsai J, Wensky A, and La-faille JJ (2008). Swift entry of myelin-specific T lymphocytes into the central nervous system in spontaneous autoimmune encephalomyelitis. J. Immunol 181, 4648–4655. [DOI] [PMC free article] [PubMed] [Google Scholar]
- Gerriets VA, Kishton RJ, Nichols AG, Macintyre AN, Inoue M, Il-kayeva O, Winter PS, Liu X, Priyadharshini B, Slawinska ME, et al. (2015). Metabolic programming and PDHK1 control CD4+ T cell subsets and inflammation. J. Clin. Invest 125, 194–207. [DOI] [PMC free article] [PubMed] [Google Scholar]
- Gray LR, Tompkins SC, and Taylor EB (2014). Regulation of pyruvate metabolism and human disease. Cell. Mol. Life Sci 71, 2577–2604. [DOI] [PMC free article] [PubMed] [Google Scholar]
- Herzig S, Raemy E, Montessuit S, Veuthey JL, Zamboni N, Westermann B, Kunji ER, and Martinou JC (2012). Identification and functional expression of the mitochondrial pyruvate carrier. Science 337, 93–96. [DOI] [PubMed] [Google Scholar]
- Hu R, Kagele DA, Huffaker TB, Runtsch MC, Alexander M, Liu J, Bake E, Su W, Williams MA, Rao DS, et al. (2014). miR-155 promotes T follicular helper cell accumulation during chronic, low-grade inflammation. Immunity 41, 605–619. [DOI] [PMC free article] [PubMed] [Google Scholar]
- Juntilla MM, Wofford JA, Birnbaum MJ, Rathmell JC, and Koretzky GA (2007). Akt1 and Akt2 are required for alphabeta thymocyte survival and differentiation. Proc. Natl. Acad. Sci. USA 104, 12105–12110. [DOI] [PMC free article] [PubMed] [Google Scholar]
- Kelly AP, Finlay DK, Hinton HJ, Clarke RG, Fiorini E, Radtke F, and Cantrell DA (2007). Notch-induced T cell development requires phosphoinositide-dependent kinase 1. EMBO J. 26, 3441–3450. [DOI] [PMC free article] [PubMed] [Google Scholar]
- King LE, Osati-Ashtiani F, and Fraker PJ (2002). Apoptosis plays a distinct role in the loss of precursor lymphocytes during zinc deficiency in mice. J. Nutr 132, 974–979. [DOI] [PubMed] [Google Scholar]
- Kuvibidila SR, Porretta C, Surendra Baliga B, and Leiva LE (2001). Reduced thymocyte proliferation but not increased apoptosis as a possible cause of thymus atrophy in iron-deficient mice. Br. J. Nutr 86, 157–162. [DOI] [PubMed] [Google Scholar]
- Lam WY, Becker AM, Kennerly KM, Wong R, Curtis JD, Llufrio EM, McCommis KS, Fahrmann J, Pizzato HA, Nunley RM, et al. (2016). Mitochondrial Pyruvate Import Promotes Long-Term Survival of Antibody-Secreting Plasma Cells. Immunity 45, 60–73. [DOI] [PMC free article] [PubMed] [Google Scholar]
- Langrish CL, Chen Y, Blumenschein WM, Mattson J, Basham B, Sedgwick JD, McClanahan T, Kastelein RA, and Cua DJ (2005). IL-23 drives a pathogenic T cell population that induces autoimmune inflammation. J. Exp. Med 201, 233–240. [DOI] [PMC free article] [PubMed] [Google Scholar]
- Laurent J, Bosco N, Marche PN, and Ceredig R (2004). New insights into the proliferation and differentiation of early mouse thymocytes. Int. Immunol 16, 1069–1080. [DOI] [PubMed] [Google Scholar]
- Lee KN, Kang HS, Jeon JH, Kim EM, Yoon SR, Song H, Lyu CY, Piao ZH, Kim SU, Han YH, et al. (2005). VDUP1 is required for the development of natural killer cells. Immunity 22, 195–208. [DOI] [PubMed] [Google Scholar]
- Lin Q, Dong C, and Cooper MD (1998). Impairment of T and B cell development by treatment with a type I interferon. J. Exp. Med 187, 79–87. [DOI] [PMC free article] [PubMed] [Google Scholar]
- Lukey MJ, Cluntun AA, Katt WP, Lin MJ, Druso JE, Ramachandran S, Erickson JW, Le HH, Wang ZE, Blank B, et al. (2019). Liver-Type Glutaminase GLS2 Is a Druggable Metabolic Node in Luminal-Subtype Breast Cancer. Cell Rep. 29, 76–88.e7. [DOI] [PMC free article] [PubMed] [Google Scholar]
- Macintyre AN, Gerriets VA, Nichols AG, Michalek RD, Rudolph MC, Deoliveira D, Anderson SM, Abel ED, Chen BJ, Hale LP, and Rathmell JC (2014). The glucose transporter Glut1 is selectively essential for CD4 T cell activation and effector function. Cell Metab. 20, 61–72. [DOI] [PMC free article] [PubMed] [Google Scholar]
- Mandl JN, Monteiro JP, Vrisekoop N, and Germain RN (2013). T cell-positive selection uses self-ligand binding strength to optimize repertoire recognition of foreign antigens. Immunity 38, 263–274. [DOI] [PMC free article] [PubMed] [Google Scholar]
- Menk AV, Scharping NE, Moreci RS, Zeng X, Guy C, Salvatore S, Bae H, Xie J, Young HA, Wendell SG, and Delgoffe GM (2018). Early TCR Signaling Induces Rapid Aerobic Glycolysis Enabling Distinct Acute T Cell Effector Functions. Cell Rep. 22, 1509–1521. [DOI] [PMC free article] [PubMed] [Google Scholar]
- O’Connell RM, Kahn D, Gibson WS, Round JL, Scholz RL, Chaudhuri AA, Kahn ME, Rao DS, and Baltimore D (2010). MicroRNA-155 promotes autoimmune inflammation by enhancing inflammatory T cell development. Immunity 33, 607–619. [DOI] [PMC free article] [PubMed] [Google Scholar]
- O’Connor RA, Prendergast CT, Sabatos CA, Lau CW, Leech MD, Wraith DC, and Anderton SM (2008). Cutting edge: Th1 cells facilitate the entry of Th17 cells to the central nervous system during experimental autoimmune encephalomyelitis. J. Immunol 181, 3750–3754. [DOI] [PMC free article] [PubMed] [Google Scholar]
- Oexle H, Gnaiger E, and Weiss G (1999). Iron-dependent changes in cellular energy metabolism: influence on citric acid cycle and oxidative phosphorylation. Biochim. Biophys. Acta 1413, 99–107. [DOI] [PubMed] [Google Scholar]
- Ouyang X, Han Y, Qu G, Li M, Wu N, Liu H, Arojo O, Sun H, Liu X, Liu D, et al. (2019). Metabolic regulation of T cell development by Sin1-mTORC2 is mediated by pyruvate kinase M2. J. Mol. Cell Biol 11, 93–106. [DOI] [PMC free article] [PubMed] [Google Scholar]
- Peng M, Yin N, Chhangawala S, Xu K, Leslie CS, and Li MO (2016). Aerobic glycolysis promotes T helper 1 cell differentiation through an epigenetic mechanism. Science 354, 481–484. [DOI] [PMC free article] [PubMed] [Google Scholar]
- Persaud SP, Parker CR, Lo WL, Weber KS, and Allen PM (2014). Intrinsic CD4+ T cell sensitivity and response to a pathogen are set and sustained by avidity for thymic and peripheral complexes of self peptide and MHC. Nat. Immunol 15, 266–274. [DOI] [PMC free article] [PubMed] [Google Scholar]
- Pua HH, Guo J, Komatsu M, and He YW (2009). Autophagy is essential for mitochondrial clearance in mature T lymphocytes. J. Immunol 182, 4046–4055. [DOI] [PubMed] [Google Scholar]
- Rothenberg EV, Moore JE, and Yui MA (2008). Launching the T-cell-lineage developmental programme. Nat. Rev. Immunol 8, 9–21. [DOI] [PMC free article] [PubMed] [Google Scholar]
- Saba I, Kosan C, Vassen L, Klein-Hitpass L, and Möröy T (2011). Miz-1 is required to coordinate the expression of TCRbeta and p53 effector genes at the pre-TCR “beta-selection” checkpoint. J. Immunol 187, 2982–2992. [DOI] [PubMed] [Google Scholar]
- Saini M, Sinclair C, Marshall D, Tolaini M, Sakaguchi S, and Seddon B (2010). Regulation of Zap70 expression during thymocyte development enables temporal separation of CD4 and CD8 repertoire selection at different signaling thresholds. Sci. Signal 3, ra23. [DOI] [PubMed] [Google Scholar]
- Sanjana NE, Shalem O, and Zhang F (2014). Improved vectors and genome-wide libraries for CRISPR screening. Nat. Methods 11, 783–784. [DOI] [PMC free article] [PubMed] [Google Scholar]
- Schell JC, Wisidagama DR, Bensard C, Zhao H, Wei P, Tanner J, Flores A, Mohlman J, Sorensen LK, Earl CS, et al. (2017). Control of intestinal stem cell function and proliferation by mitochondrial pyruvate metabolism. Nat. Cell Biol 19, 1027–1036. [DOI] [PMC free article] [PubMed] [Google Scholar]
- Schmidlin H, Dontje W, Groot F, Ligthart SJ, Colantonio AD, Oud ME, Schilder-Tol EJ, Spaargaren M, Spits H, Uittenbogaart CH, and Blom B (2006). Stimulated plasmacytoid dendritic cells impair human T-cell development. Blood 108, 3792–3800. [DOI] [PMC free article] [PubMed] [Google Scholar]
- Sena LA, Li S, Jairaman A, Prakriya M, Ezponda T, Hildeman DA, Wang CR, Schumacker PT, Licht JD, Perlman H, et al. (2013). Mitochondria are required for antigen-specific T cell activation through reactive oxygen species signaling. Immunity 38, 225–236. [DOI] [PMC free article] [PubMed] [Google Scholar]
- Stewart SA, Dykxhoorn DM, Palliser D, Mizuno H, Yu EY, An DS, Sabatini DM, Chen IS, Hahn WC, Sharp PA, et al. (2003). Lentivirus-delivered stable gene silencing by RNAi in primary cells. RNA 9, 493–501. [DOI] [PMC free article] [PubMed] [Google Scholar]
- Stoltzman CA, Peterson CW, Breen KT, Muoio DM, Billin AN, and Ayer DE (2008). Glucose sensing by MondoA:Mlx complexes: a role for hexokinases and direct regulation of thioredoxin-interacting protein expression. Proc. Natl. Acad. Sci. USA 105, 6912–6917. [DOI] [PMC free article] [PubMed] [Google Scholar]
- Stuart T, Butler A, Hoffman P, Hafemeister C, Papalexi E, Mauck WM 3rd, Hao Y, Soeckius M, Smibert P, and Satija R (2019). Comprehensive Integration of Single-Cell Data. Cell 177, 1888–1902.e21. [DOI] [PMC free article] [PubMed] [Google Scholar]
- Swat W, Dessing M, von Boehmer H, and Kisielow P (1993). CD69 expression during selection and maturation of CD4+8+ thymocytes. Eur. J. Immunol 23, 739–746. [DOI] [PubMed] [Google Scholar]
- Swat W, Montgrain V, Doggett TA, Douangpanya J, Puri K, Vermi W, and Diacovo TG (2006). Essential role of PI3Kdelta and PI3Kgamma in thymocyte survival. Blood 107, 2415–2422. [DOI] [PMC free article] [PubMed] [Google Scholar]
- Tamás P, Macintyre A, Finlay D, Clarke R, Feijoo-Carnero C, Ashworth A, and Cantrell D (2010). LKB1 is essential for the proliferation of T-cell progenitors and mature peripheral T cells. Eur. J. Immunol 40, 242–253. [DOI] [PMC free article] [PubMed] [Google Scholar]
- Tarasenko TN, Pacheco SE, Koenig MK, Gomez-Rodriguez J, Kapnick SM, Diaz F, Zerfas PM, Barca E, Sudderth J, Deberardinis RJ, et al. (2017). Cytochrome c Oxidase Activity Is a Metabolic Checkpoint that Regulates Cell Fate Decisions During T Cell Activation and Differentiation. Cell Metab. 25, 1254–1268.e7. [DOI] [PMC free article] [PubMed] [Google Scholar]
- Wallace J, Hu R, Mosbruger TL, Dahlem TJ, Stephens WZ, Rao DS, Round JL, and O’Connell RM (2016). Genome-Wide CRISPR-Cas9 Screen Identifies MicroRNAs That Regulate Myeloid Leukemia Cell Growth. PLoS ONE 11, e0153689. [DOI] [PMC free article] [PubMed] [Google Scholar]
- Wallace JA, Kagele DA, Eiring AM, Kim CN, Hu R, Runtsch MC, Alexander M, Huffaker TB, Lee SH, Patel AB, et al. (2017). miR-155 promotes FLT3-ITD-induced myeloproliferative disease through inhibition of the interferon response. Blood 129, 3074–3086. [DOI] [PMC free article] [PubMed] [Google Scholar]
- Walter PB, Knutson MD, Paler-Martinez A, Lee S, Xu Y, Viteri FE, and Ames BN (2002). Iron deficiency and iron excess damage mitochondria and mitochondrial DNA in rats. Proc. Natl. Acad. Sci. USA 99, 2264–2269. [DOI] [PMC free article] [PubMed] [Google Scholar]
- Wong CP, Song Y, Elias VD, Magnusson KR, and Ho E (2009). Zinc supplementation increases zinc status and thymopoiesis in aged mice. J. Nutr 139, 1393–1397. [DOI] [PMC free article] [PubMed] [Google Scholar]
- Yamaguchi M, Kura M, and Okada S (1982). Role of zinc as an activator of mitochondrial function in rat liver. Biochem. Pharmacol 31, 1289–1293. [DOI] [PubMed] [Google Scholar]
- Yamashita I, Nagata T, Tada T, and Nakayama T (1993). CD69 cell surface expression identifies developing thymocytes which audition for T cell antigen receptor-mediated positive selection. Int. Immunol 5, 1139–1150. [DOI] [PubMed] [Google Scholar]
- Yang K, Blanco DB, Chen X, Dash P, Neale G, Rosencrance C, Easton J, Chen W, Cheng C, Dhungana Y, et al. (2018). Metabolic signaling directs the reciprocal lineage decisions of αβ and γδ T cells. Sci. Immunol 3, 25. [DOI] [PMC free article] [PubMed] [Google Scholar]
- Yin Y, Choi SC, Xu Z, Zeumer L, Kanda N, Croker BP, and Morel L (2016). Glucose Oxidation Is Critical for CD4+ T Cell Activation in a Mouse Model of Systemic Lupus Erythematosus. J. Immunol 196, 80–90. [DOI] [PMC free article] [PubMed] [Google Scholar]
- Zhang G, Sheng M, Wang J, Teng T, Sun Y, Yang Q, and Xu Z (2018). Zinc improves mitochondrial respiratory function and prevents mitochondrial ROS generation at reperfusion by phosphorylating STAT3 at Ser727. J. Mol. Cell. Cardiol 118, 169–182. [DOI] [PubMed] [Google Scholar]
- Zhao FL, Ahn JJ, Chen ELY, Yi TJ, Stickle NH, Spaner D, Zúñiga-Pflücker JC, and Dunn SE (2018). Peroxisome Proliferator-Activated Receptor-β Supports the Metabolic Requirements of Cell Growth in TCRδ-Selected Thymocytes and Peripheral CD4+ T Cells. J. Immunol 201, 2664–2682. [DOI] [PubMed] [Google Scholar]
Associated Data
This section collects any data citations, data availability statements, or supplementary materials included in this article.