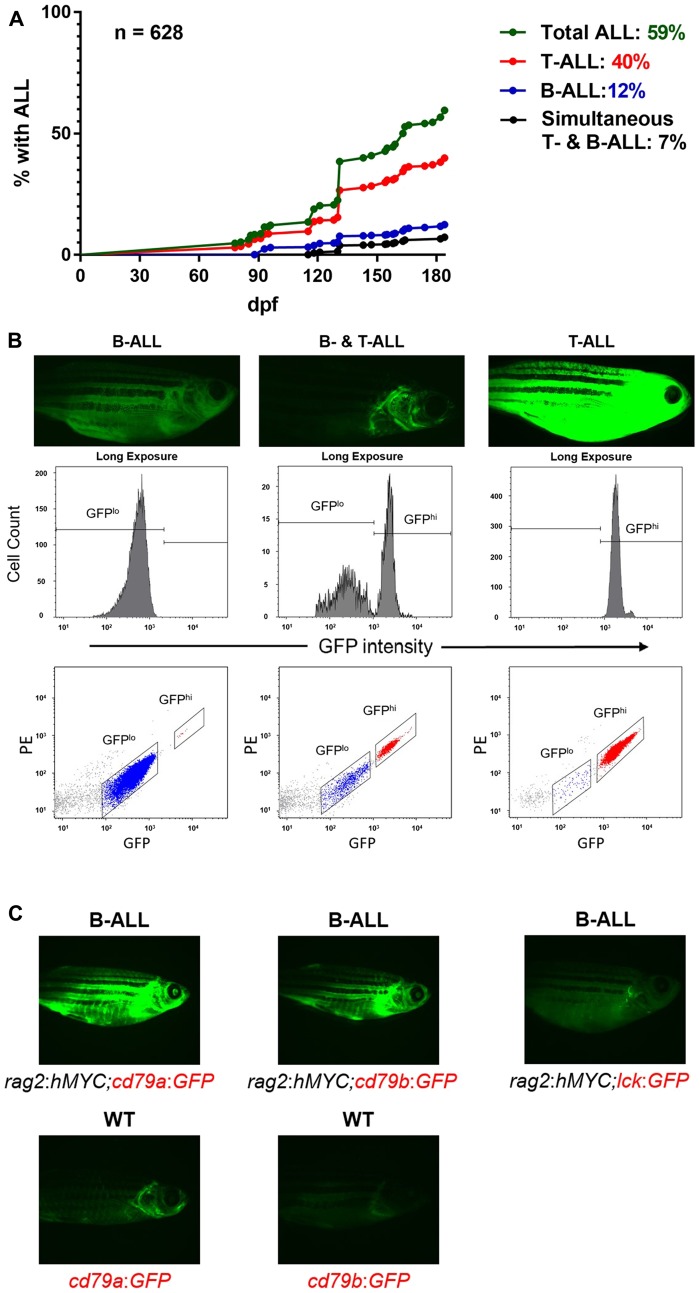
Figure 1. B-ALL in hMYC zebrafish.
(A) Curves displaying B- and T-ALL incidence by 184 dpf, as determined by fluorescence microscopy. (B) Fluorescence microscopy images of fish with B-ALL (left), both B- and T-ALL (center), or T-ALL (right). Flow cytometry plots of ALL samples from these fish are shown beneath them. (C) B-ALL appearance in fish with rag2:hMYC and different transgenic markers: cd79a:GFP (left), cd79b:GFP (center), or lck:GFP (right). WT cd79a:GFP or cd79b:GFP fish without B-ALL are shown beneath for comparison. Images are representative of > 50 animals examined for each genotype.

